Embed Size (px)
Citation preview

RD-AI62 726 NEAT ACCLIMATIZATION DEVELOPED DURING SUMMER RUNNING IN I/INORTHEASTERN UNITED STATES(U) ARMY RESEARCH INST OFENVIRONMENTAL MEDICINE NATICK MA L E ARMSTRONG ET AL.
UNCLASSIFIED DEC 85 F/G 616 N
EoiEEEEEEEoiE
I ffllfl.fflffllfllf

11.2
'I
1116. 1.0 L6,ai
o.
Ig
1.1 me 1 .8
111111L25 .4 16
MICROCOPY RESOLUTION TEST CHARTNATIONAL BURKAU OF STANDARDS -1963- A
*. .. ... ~~~V . -- - - - - - --Vq. * *

UNCLAS" SECURITY CLASSIFICATION OF THIS PAGE (W0On Data Entered)
REPORT DOCUMENTATION PAGE READ CMSTRUCInOSJ!. BEFORE COMPLETING FORM* I. REPORT NUMBER 2. GOVT ACCESSION NO. 3. RECIPIENT'S CATALOG NUMBER
4. TITLE (and Subtitle) S. TYPE OF REPORT & PERIOD COVERED
Heat Acclimatization Developed during SummerRunning in Northeastern United States.
6. PERFORMING ORG. REPORT NUMBER
7. AUTHOR(s) 8. CONTRACT OR GRANT NUMBER(&)
00 Lawrence E. Armstrong, Roger W. Hubbard,(%J Jane P. DeLuca and Elaine L. Christensen
9. PERFORMING ORGANIZATION NAME AND ADDRESS 10. PROGRAM ELEMENT, PROJECT, TASK
AREA & WORK UNIT NUMBERS
US Army Research Institute of Environmental 3EI62777A879
WMedicine 64383302122Heat Research Division, Natick, MA 01760-5007I I. CONTROLLING OFFICE NAME AND ADDRESS 12. REPORT DATE
3. NUROF PAGES
2614. MONITORING AGENCY NAME & ADDRESS(If different fron Controlling Office) 1S. SECURITY CLASS. (of thi rpor t)
ISa. DECL ASSI FICATION/DOWNGRADING- " SCHEDULE
16. DISTRIBUTION STATEMENT (of this Report)
DISTRIBUTION A: Approved for public release;distribution is unlimited
17. DISTRIBUTION STATEMENT (of the btract entered In Block 20. If different from Report) n i I
-:- O OEC 3 0 1985
* I1. SUPPLEMENTARY NOTES
19. KEY WORDS (Continue on reverse side If neceesay and Identify by block number)
. > Heat acclimatization, running, rectal temperature, oxygen uptake, sweat,
CD ) plasma vrolumre, sodium, potassim
C-,
LL" 20. AUSTRACTCamu .e-,e*r de ,ffna .4eeyM7 rd identify by block number)
_.- Five highly trained distance runners (DR) were observed during controlled'-" 90-min thermoregulation trials in spring ITI ) and late summer- )j, to
D document the extent of heat acclimatization AHA developed during summer._ arunning in Northeastern United States. These trials simulated environmentalI.~ (30.3 + 0.1 0 C DB, 34.9 + 0.5 % RH, 4.47 m/sec wind1speedY and exercise
(treadmill running at 80, 120, 160, and 200 m'min )/.stresses encountered by Dduring daily training. Between Tland T DR trained outdoors for 14,_-+-4*wk-but conseauentlv showed few ohsioloalcal adaptations classically associatj
DD Fl 47 EDIT1ON OfI NOV S5 ll OSSOLIETE .
SECUN*TY CLASM1FICATIOIV OF THIS PAGE (Wmn Dae Enteeod)

- - .-;-~. o
UNC"ASSECURITY CLASSIFICATION OF THIS PAGE(Whan Date Bnteas"
with HA. Statistical camparison e indicated no significantdifferences in mean heart rate, rectal temperature, sweat lla-amv-- , plasma
-Na+--anw-K*, or change in plasma, volume during exercise; mean weighted skintemperature ws unchanged (except at 50 min of exercise) and sweat rate wasalso nchnged (except during the initial 30 min segment, 73 + 6 vs 93 + 8l'm 'h -), indicating an earlier onset of sweating durig-T2 .>Significant
decreases-Ap -4 in subraximal oxygen uptake were observedk T1 vs T valueswere 13.97 = 0.27 vs 10.19 + 1.19,_11.38_j 1.15 y 2.9 .45, and44.97 + 0.5 vs 41.24 + 0.97 ml'kg 'min treadmill speeds of 80, 120, and200 mm.rin respectively. We conclude that J did not require sumner heatexposure to adequately thermregulate during t.spring trial which simu-
lated the hottest smuner days recorded during this, study.
UNCLASS C
b **.-.-.-.-..,
o ,*..°..o..-°°°.~~~..° ...... ° ... -..... . . .-.. . . ••.. ... o.-,-. . .m
-.. % -.-

-7 77
2
HEAT ACCLIMATIZATION DEVELOPED DURING SUMMER RUNNING
IN NORTHEASTERN UNITED STATES
i~TAB E- -wunced 13ification
* Availability Codes
Avail and/or* Special
5 tables, 3 figures
85 1 % 0 0990

*1~ 3
Abstract
Five highly trained distance runners (DR) were observed
during controlled 90-min thermoregulation trials in spring (T )
and late summer (T ) to document the extent of heat2
acclimatization (HA) developed during summer running in
Northeastern United States. These trials simulated
environmental (30.3 + 0.1°C DB, 34.9 + 0.5 % RH, 4.47 m/sec
wind speed) and exercise (treadmill running at 80, 120, 160,-1
and 200 m'min ) stresses encountered by DR during daily
training. Between T1 and T2, DR trained outdoors for 14.5 +
0.4 wk but consequently showed few physiological adaptations
classically associated with HA. Statistical comparison of T
and T2 indicated no significant differences in mean heart rate,
rectal temperature, sweat Na+ and K+, plasma Na+ and K+, or
change in plasma volume during exercise; mean weighted skin
temperature was unchanged (except at 50 min of exercise) and
sweat rate was also unchanged (except during the initial 30 min
segment: 73 + 6 vs 93 + 8 ml'm- 2h- ), indicating an earlier
onset of sweating during T2. Significant decreases (p<.05) in
submaximal oxygen uptake were observed: Ti vs T2 values were
13.97 + 0.27 vs 10.19 + 1.19, 31.38 + 1.15 vs 27.91 + 1.45, and
. 0.85 vs 41.24 0.97 mlkg min at treadmill speeds
of 80, 120 and 200 m'min respectively. We conclude that DR
did not iequire summer heat exposure to adequately
thermoregulate curing the spring tria. (T1 ), which simulated
the hottest summer dAys recorded during this study.
KEY WORDS: heat acclimatization, running, rectal temperature,
oxygen uptake, sweat, plasma volume, sodium, potassium
.........................................

i ° > .*
.". '*- .-.. ..?.. --' ° - . ' . o -. " .- --. . • - . -
4
Introduction
Untrained, unacclimatized individuals entering a hot
environment require 7-12 days of heat exposure for successful
heat acclimatization (11). In contrast, highly trained
distance runners exhibit physiological characteristics which
enable them to perform well in the heat during any season. Two
investigations (10,15) independently observed the effects of
high-intensity cool weather interval training (70-90% VO2 max )
and reported that collegiate distance runners responded to
winter heat tolerance tests as though they were heat
acclimatized, although they had not been exposed to heat since
the preceeding summer. Two unique factors interact during heat
acclimatization in distance runners: physical training and heat
exposure. Gisolfi (8) experimentally isolated physical
training and heat exposure in an attempt to measure the
contribution of each to heat acclimation. He reported that
eight weeks of intense intermittent treadmill running in cool
conditions (21°C) produced approximately 50 % of the total heat
tolerance resulting from heat acclimation trials. Yet, Gisolfi
and Cohen (9) cautioned that heat acclimation responses are
highly dependent upon the conditions of standard heat tolerance
tests as well as the duration and intensity of training
programs. Therefore, data involving physical training and heat
exposure must be applied to highly trained athletes with
caution.
No research to date has focused on the natural heat
acclimatization of athletes involved in daily outdoor training
I.
5
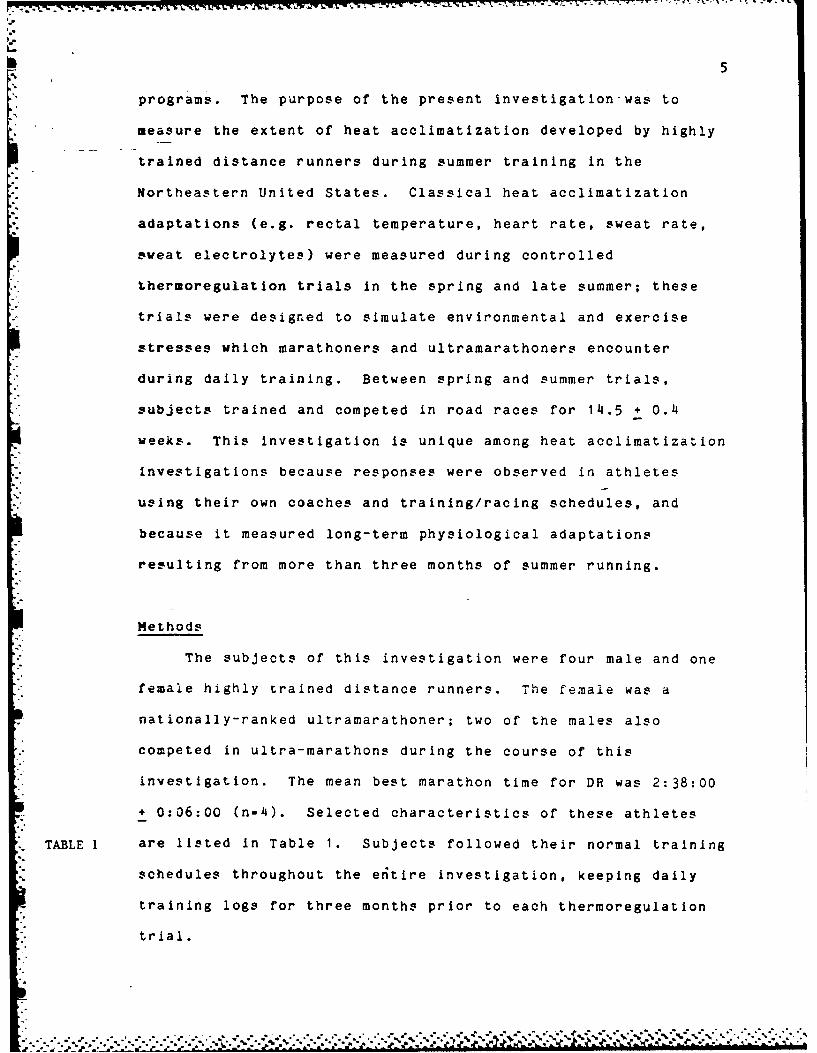
programs. The purpose of the present investigation-was to
measure the extent of heat acclimatization developed by highly
trained distance runners during summer training in the
Northeastern United States. Classical heat acclimatization
. adaptations (e.g. rectal temperature, heart rate, sweat rate,
sweat electrolytes) were measured during controlled
thermoregulation trials in the spring and late summer; these
trials were designed to simulate environmental and exercise
stresses which marathoners and ultramarathoners encounter
during daily training. Between spring and summer trials,
subjects trained and competed in road races for 14.5 + 0.4
weeks. This investigation is unique among heat acclimatization
investigations because responses were observed in athletes
using their own coaches and training/racing schedules, and
because it measured long-term physiological adaptations
resulting from more than three months of summer running.
Methods
The subjects of this investigation were four male and one
female highly trained distance runners. The female was a
nationally-ranked ultramarathoner; two of the males also
competed in ultra-marathons during the course of this
investigation. The mean best marathon time for DR was 2:38:00
, 0:06:00 (n=). Selected characteristics of these athletes
TABLE I are listed in Table 1. Subjects followed their normal training
schedules throughout the entire investigation, keeping daily
training logs for three months prior to each thermoregulation
trial.
%7
.. ...-- ,- " ' .. . .. '.-'. ,- " - '-% " " **- % '.*,.* .* " . ." "-" ".."". "..'..-,-.'-: .,. -,-.,.- ,.- r.3 ,- ,?- -', ' ,, ._ ' - ~w ~ ~ m * -%--%. '.*%.*

6
Thermoregulation trials were conducted in the Spring (T
and summer (T2 ). The mean number of weeks between trials was
14.5 + 0.3. Ambient temperature data for March through August
(National Climatic Data Center, Asheville, N.C.) is presented
FIG. 1 in Figure 1. Between T and T2, the maximum daily temperature
of only three days (3 % of the total days) exceeded the 30.3 C
FIG. 2 chamber conditions (Fig. 2).
Three-day dietary records were completed prior to T1 and
T2. Subjects were instructed to drink large quantities of water
on the day before the trial to ensure adequate hydration. A
pre-trial urine sample was analyzed for specific gravity. If
any subject had urine specific gravity over 1.030, that subject
consumed more water until specific gravity was below 1.030.
Heights were recorded, skin thermistors were placed on the
forearm, calf and chest, and EKG electrodes were applied.
Immediately before testing, subjects showered without soap,
inserted a rectal probe 8 cm beyond the anal sphincter, and
dressed in electrolyte-free running gear.
Trials (Fig. 2) were conducted in an environmental chamber
at 30.3 + 0.1 C, 34.9 + 0.5% RH with a 4.47 m sec wind speed.
Subjects stood in the chamber for a 20 minute body fluid
equilibration period, after which an antecubital blood sample
and a body weight were taken. Subjects completed 30 minutes of
continuous treadmill exercise at belt speeds of 80, 120 and 160
-1m min . The final 60 minutes were run at 200 mmin . Subjects
stepped off the treadmill briefly for a body weight (Sauter
Balance, accuracy + 10 g) after 30, 50, and 70 min of exercise.
%>'
* .2 A
7
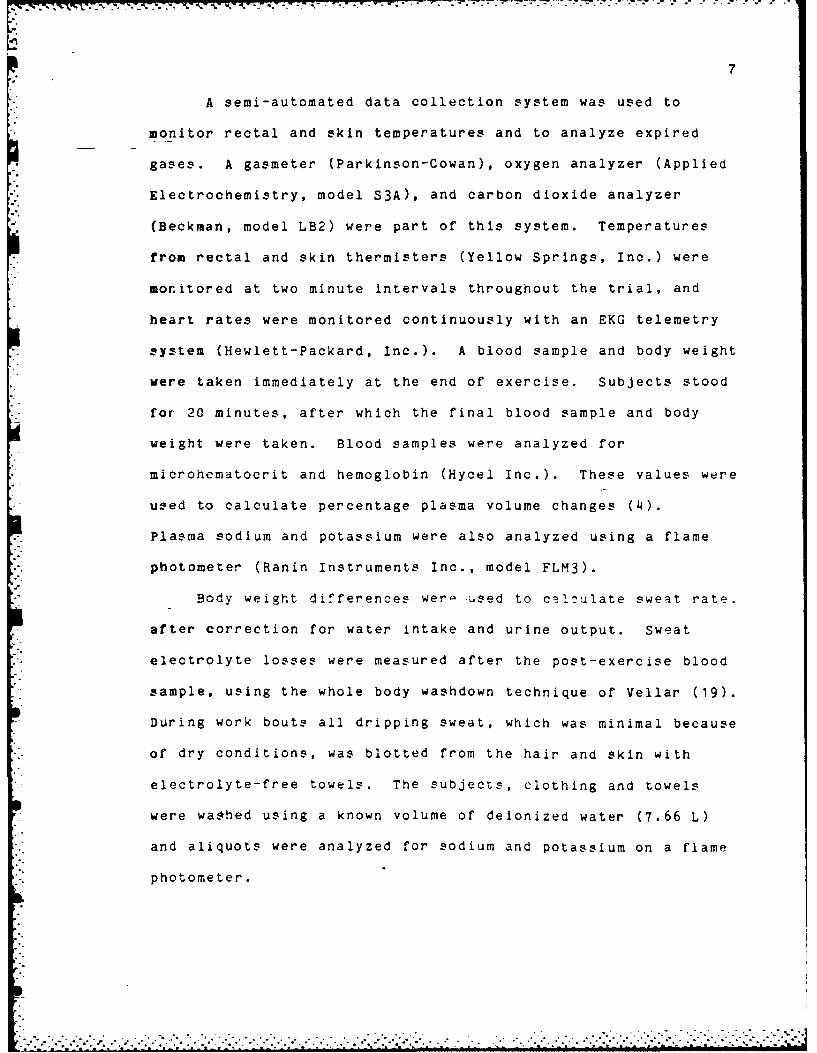
A semi-automated data collection system was used to
monitor rectal and skin temperatures and to analyze expired
gases. A gasmeter (Parkinson-Cowan), oxygen analyzer (Applied
Electrochemistry, model S3A), and carbon dioxide analyzer
(Beckman, model LB2) were part of this system. Temperatures
from rectal and skin thermisters (Yellow Springs, Inc.) were
monitored at two minute intervals throughout the trial, and
heart rates were monitored continuously with an EKG telemetry
system (Hewlett-Packard, Inc.). A blood sample and body weight
were taken immediately at the end of exercise. Subjects stood
for 20 minutes, after which the final blood sample and body
weight were taken. Blood samples were analyzed for
microhematocrit and hemoglobin (Hycel Inc.). These values were
used to calculate percentage plasma volume changes (4).
Plasma sodium and potassium were also analyzed using a flame
photometer (Ranin Instruments Inc., model FLM3).
Body weight differences were -used to calculate sweat rate.
after correction for water intake and urine output. Sweat
electrolyte losses were measured after the post-exercise blood
sample, using the whole body washdown technique of Vellar (19).
During work bouts all dripping sweat, which was minimal because
of dry conditions, was blotted from the hair and skin with
electrolyte-free towels. The subjects, clothing and towels
were washed using a known volume of deionized water (7.66 L)
and aliquots were analyzed for sodium and potassium on a flame
photometer.
.......................-

[', 8
The paired two-tail t-test and one-way ANOVA were used to
comnare spring and summer trials. The .05 level of confidence
was used throughout.
Results
TABLE 2 Table 2 presents a comparison of subject pre-trial status
for the spring (TI ) and summer (T2 ) trials. No significant
differences were found in training habits (except for number of
interval workouts per month), dietary intake, or measures of
pre-trial body water status. Rectal temperature and mean
FIG. 3 weighted skin temperature (MWST) for T and T2 appear in Figure
3. The only significant differences appeared after 50 min of
exercise, when MWST was significantly higher during T 2* Heart
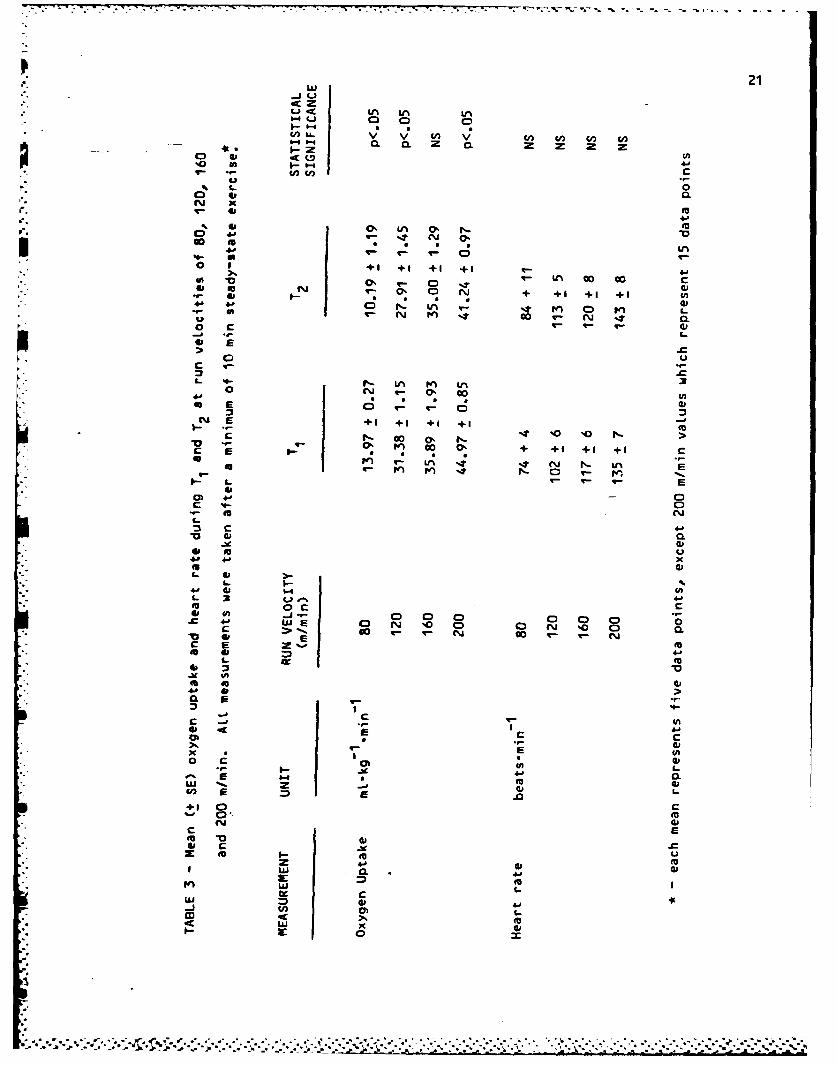
TABLE 3 rate (Table 3) exhibited no T vs T2 differences at all
measured trial segments. A significant (p<.05) between-season
difference in oxygen uptake was observed during exercise at 80,
120, and 200 m'min (Table 3). Sweat rates and sweat
electrolyte losses for each trial are shown in Table 4. Sweat
TABLE 4 rate (Table 4) was higher only during the initial 30 min of
exercise (80-160 m'min 1) 'zring :z. r. Therr I n
vs T2 differences in either sweat concentration or total mEq
TABLE 5 lost. Plasma electrolytes and plasma volume changes (Table 5)
also indicated that there were no T1 vs T2 differences.
Discussion
Whe'n advising highly trained distance runners (DR) about
training-racing in hot environments, one must recognize that
these athletes perform well in heat tolerance tests during any
season of the year (10,15). Although previous research
n7 ................ ..........................-.- -.

9
indicates that heat acclimatization is incomplete unless
untrained subjects do some work in the heat (2,6,9,17), the
results of this investigation indicate that DR demonstrated
essentially the same ability to thermoregulate in a 30.3%C
environment in the spring as they did after 14.5 weeks of
summer training. Although exercise during thermoregulation
trials T and T2 stimulated 1.1-1.4 liters of sweat per hour
and resulted in average peak rectal temperatures between 38.3-
38.40C, there were no statistical differences between T I and T2
in peak rectal temperature, mean weighted skin temperature
(except at 50 min of exercise), heart rate, sweat rate (except
during the initial 30 min of exercise), sweat Na+ and K+
concentration, plasma Na+ and K+, or plasma volume change
(Table 5).
These findings do not indicate that distance runners should
omit heat exposure from their training when preparing for hot
environments, because these data are specific to northern areas
of the United States (Figure 1), to exercise intensities
typical of ultramarathon and marathon training (60-65 % VO• 2
), and to thermoregulation at or near 30.3 0 C. Drinkwatermax
(5) noted that optimal acclimatization procedures involve
training in an environment which is comparable to the one in
which competition will occur. Indeed, a similar approach was
utilized to successfully acclimatize a marathon runner prior to
the 1984 Summer Olympic Games (1). Had the DR of the present
investigation trained in the Southern United States, it is
*likely that they would have developed physiological adaptations
. - - -. o, ,.. , % ". -, '. . . •. . ° , % , • •. , ° • .• , . . . ." . . . . .- S . ° °

10
indicative of greater heat tolerance (14), in spite-of their
high level of fitness and great cardiovascular stability at T1 .
Numerous studies have appeared in the literature
concerning the effects of physical training on heat tolerance
(8,9,10,14,15 ). The results of the present investigation
contribute to this body of information by (1) demonstrating
that DR met the summer thermoregulatory requirements of the
Northeastern United States (exemplified by T1 and T 2 ) before
training during June, July and August, and (2) by supporting
those studies which observed that DR responded to winter heat
tolerance trials as though they were already heat acclimatized
(10,15). This "preacclimatization" of distance runners has
been attributed to stimulation of sweating and cutaneous blood
flow during strenuous workouts (15), high maximal oxygen
consumption, increased evaporative cooling, greater
cardiovascular stability, expansion of blood volume (10), more
favorble body fluid dynamics (17), and earlier onset of
sweating (13). The present investigation supports the concept
of an earlier onset of sweating (see initial 30 min in Table
4), but it is improbable that this small increase in sweat
production between T and T 2 (20 mlm 2 -1
e rectal temperature during exercise (1).
The MWST (Figure 3) during spring and summer trials
indicated that cutaneous circulation generally decreased during
exercise, while working muscles received increased blood flow
to meet the metabolic demands of exercise. The mean rectal
0temperature peaked at 38.3-38.4 C and decreased during the
.- ...... . . ...-..- -.--... *.--.*-*-.'-.*..*.. ' *.'.. .*'-- ..". ° ,°". ,"". " " "". " . ""°. """. "°"m . .", . .. , .. .°"% . " . . ". h "% " ".". ". " Q . ".

final 20 min of exercise, indicating that DR thermoregulatec
"successfully. The only T I vs T 2 statistical difference (p<.05)
was observed after 50 min of exercise, when the summer MWST was
higher than the spring. Because rectal temperatures (Figure 3)
and sweat rates (Table 4) were not different at that point,
this T vs T difference was probably due to a greater1 2
cutaneous circulation during T2 . Heart rate data (Table 3)
also may be interpreted to support this hypothesis, in that
increased peripheral circulation reduces central blood volume
and acts to increase heart rate in an effort to maintain
cardiac output.
Table 3 indicates that the 14.5 weeks of summer training
between T1 and T resulted in changes in submaximal oxygen1 2
consumption. Because there were no T vs T2 differences in
mean body weight or surface area, this decreased oxygen
consumption meant that 8 % less metabolic heat (M) had to be-1dissipated (while running at 200 m'min 1) during T2 than during
T Sawka et al. (16) have observed similar 3 % and 5 %
reductions in cool and hot environments when submaximal
exercise was performed before and after 10 days of heat
acclimation. We propose that there are four likely
explanations for such reductions in M. First, the DR of the
present investigation ran nearly the same number of workouts
per month, km per day, and competitive events per month, prior
to T and T2 (Table 2). Although no measure of daily training
intensity was undertaken (e.g. field measurements of oxygen
uptake), the number of interval workouts per month (Table 2)
....'.'.
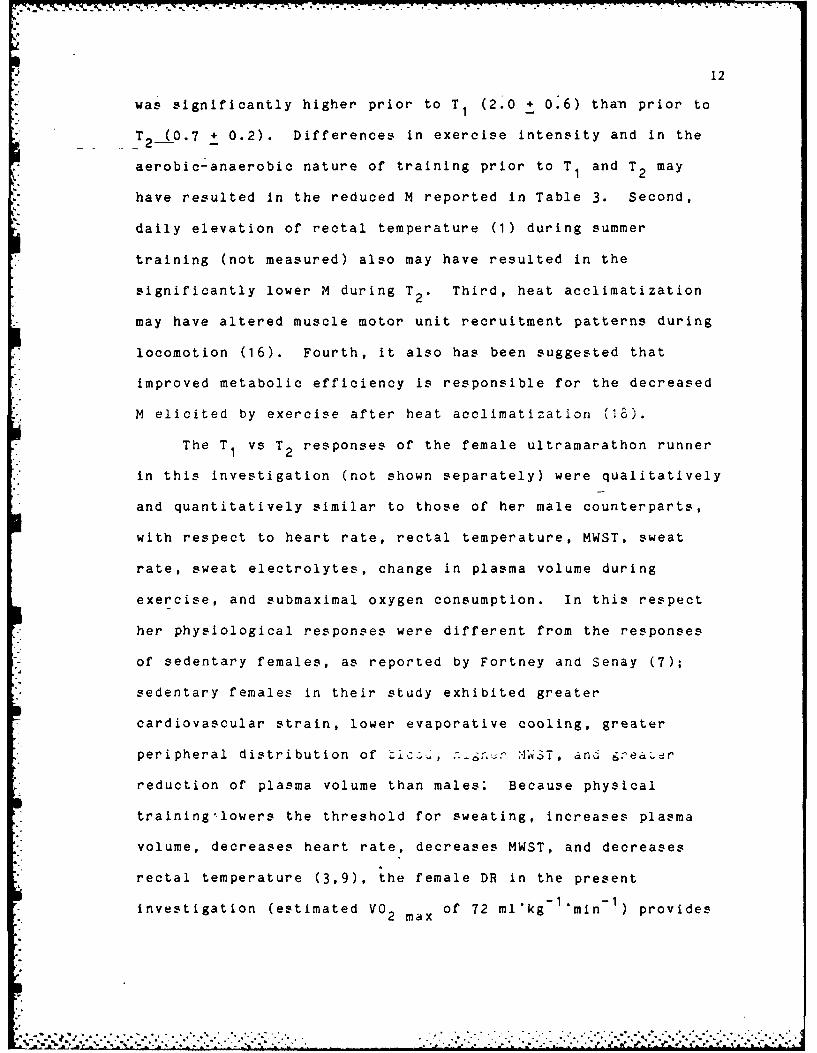
12
was significantly higher prior to T I (2.0 + 0.6) than prior to
T _ T2 (0.7 + 0.2). Differences in exercise intensity and in the
aerobic-anaerobic nature of training prior to T and T may1 m 2
have resulted in the reduced M reported in Table 3. Second,
daily elevation of rectal temperature (1) during summer
training (not measured) also may have resulted in the
significantly lower M during T 2. Third, heat acclimatization
may have altered muscle motor unit recruitment patterns during
locomotion (16). Fourth, it also has been suggested that
improved metabolic efficiency is responsible for the decreased
M elicited by exercise after heat acclimatization (18).
The T vs T 2 responses of the female ultramarathon runner
in this investigation (not shown separately) were qualitatively
and quantitatively similar to those of her male counterparts,
with respect to heart rate, rectal temperature, MWST, sweat
rate, sweat electrolytes, change in plasma volume during
exercise, and submaximal oxygen consumption. In this respect
her physiological responses were different from the responses
of sedentary females, as reported by Fortney and Senay (7);
sedentary females in their study exhibited greater
cardiovascular strain, lower evaporative cooling, greater
peripheral distribution of :ited, ngr :WS7, and ea ear
reduction of plasma volume than males; Because physical
training'lowers the threshold for sweating, increases plasma
volume, decreases heart rate, decreases MWST, and decreases
rectal temperature (3,9), the female DR in the present
investigation (estimated VO2 max of 72 ml'kg min-) provides
2 ma
%% b. . .. . . . . . . . . .. '..... ....-.... .. . ." • . .

13
evidence that previously reported male-female thermoregulatory
differences (7) may have been due to differences in fitness
levels between subjects. A recent review paper (12) supports
this position by concluding that few differences in male and
female responses to heat stress exist when groups are matched
for maximal oxygen consumption.
.. .
. . . .

14
Acknowledgements
The authors gratefully acknowledge the technical
assistance of the following persons: Dr. Patricia Szlyk, Dr.
Joseph Dziados, Dr. Mark Malconian, Dr. Michael Durkot, Ingrid
Sils, June Ferguson, H. John Hodenpel, Jeffrey Young, Oswaldo
Martinez, and Mike Bosselears.
The views, opinions, and/or findings contained in this
report are those of the authors and should not be construed as
an official department of the Army position, policy, or
decision, unless so designated by other official documentation.
Human subjects participated in these studies after giving their
free and informed voluntary consent. Investigators adhered to
AR 70-25 and USAMRDC Regulation 70-25 on Use of Volunteers in
Research.
°. -
... . . . . . . . . . . .. , . . . . . .?. . . .. . . ?. .
15
References
1. Armstrong, L.E., R.W. Hubbard, B.H. Jones, and J.T.
Daniels. Preparing Alberto Salazar for the heat of the 1984
olympic marathon. Phys. Sportsmed., in press, 1985.
2. Bean, W.B. and L.W. Eichna. Performance in relation to
environmental temperature: reactions of normal young men to
simulated desert environment. Fed. Proceed. 22:144-158, 1943.
3. Convertino, V.A., J.E. Greenleaf, and E.M. Bernauer. Role
of thermal and exercise factors in the mechanism of
hypervolemia. J. Appl. Physiol. 48(4):657-664, 1980.
4. Dill, D.B. and D.L. Costill. Calculation of percentage
changes in volumes of blood, plasma, and red cells in
dehydration. J. Appl. Physiol. 37:247-248, 1974.
5. Drinkwater, B.L. Heat as a limiting factor in endurance
sports. In: Limits of Human Performance, D.H. Clarke and H.M.
Eckert (Eds.). Champaign, IL: Human Kinetics Publishers, 1985,
pp. 93-100.
6. Eichna, L.W., W.B. Bean, W.F. Ashe, and N. Nelson.
Performance in relation to environmental temperature: reactions
of normal young men to a hot, humid (simulated jungle)
environment. Bull. Johns Hopkins Hosp. 76:25-58, 1945.
7. Fortney, S.M. and L.C. Senay. Effect of training and heat
acclimation on exercise responses of sedentary females. J.
Appl. Physiol. 47(5):978-984, 1979.
8. Gisolfi, C.V. Work-heat tolerance derived from interval
training. J. Appi. Physiol. 35(3):349-354, 1973.
<-.-

16
9. Gisolfi, C.V. and Cohen, J.S. Relationships among
training, heat acclimation, and heat tolerance in men and
women: the controversy revisited. Med. Sci. Sports 11(l):56-
59, 1979.
10. Gisolfi, C.V. and S. Robinson. Relations between physical
training, acclimatization, and heat tolerance. J. Appl.
Physiol. 26(5):530-534, 1969.
11. Greenleaf, J.E. and C.J. Greenleaf. Human acclimation and
acclimatization to heat: a compendium of research. Moffett
Field, CA: Ames Research Center, NASA Technical Memorandum No.
TM X-62008, pp. 1-188.
12. Haymes, E.M. Physiological responses of female athletes to
heat stress: a review. Phys. Sportsmed. 12(3):45-54, 1984.
13. Nadel, E.R. Control of sweating rate while exercising in
the heat. Med. Sci. Sports 11(l):31-35, 1979.
14. Piwonka, R.W. and S. Robinson. Acclimatization of highly
trained men to work in severe heat. Frederick, MD: U.S. Army
Medical Research & Development Command, Contract Report No. DA
49-193-MD 2449, 1966.
15. Piwonka, R.W., S. Robinson, V.L. Gay, and R.S. Manalis.
Preacclimatization of men to heat by training. J. Appl.
Physiol. 20( 3 ):3 7 9- 384, 1965.
16. Sawka, M.N., K.B. Pandolf, B.A. Avellini, and Y. Shapiro.
Does heat acclimation lower the rate of metabolism elicited by
muscular exercise? Aviat. Space Environ. Med. 54(1):27-31,
1983.
17. Senay, L.C. Effects of exercise in the heat on body fluid
distribution. Med. Sci. Sports 11(1):42-48, 1979.

-~ 17
18. Senay, L.C. and R. Kok. Effects of training and heat
acclimatization on blood plasma contents of exercising young
- men. J. Appi. Physiol. 43:591-599, 1977.
19. Vellar, O.D. Nutrient Losses Through Sweating. Oslo,
Norway, Institute of Hygiene, University of Oslo, 1969.

18
Figure Titles
FIGURE I - Mean (' SE) outdoor maximum and minimum
temperatures at the location of this investigation.
FIGURE 2 - Design of thermoregulation trials T and T2 in the
environmental chamber. Arrows denote body weight
measurements (+ lOg). Symbols: V - oxygen uptake,
S - pre-trial shower, U - urine sample, B - venous
blood sample, W - whole body washdown.
FIGURE 3 - Rectal temperatures and mean weighted
skin temperatures during T1 and T 2 (mean + SE).F2
.J.
A.**Wk*&.~** . * . . . . .
.4 A* * . .* .**r. . . - ...... .

7V7 . . P
19
co fn 0 0 0 co N-N~ 0 0 U.' %0 co r-%0 0"1 0 co 0 NO U.'
q- 02 0:' ~-. Nn %0U. 0 N- %0
'a
+1q- %0 N- 0 fn U.n~
CWu C o %0 -0 Co Go N-
E
41
- 4)I
41.
U. WL. X
Lz I
m 1 g

20
I-C
* ~ ~ ~ ~ ~ 4 (flJ.U #DV ClUC/) C) U) ) U) ) Ci
IN0
E
1- Lnp 0 -
00
L- T- +1
o 0 0 + I.- +8 +8 + I +1 I
+ I + +1 0 00 c0. m +' +1 00 r- N~ '0 Nl 00 i- 00
Z:9 9*C)9
4) 0
Eu -W
0. 41
L
03 N-o C4V9 N- + 1 CD 0
0 ; 0+C
.0 (D +1 +1 +1 00 +1 2Z +1 +1 CO m8
N- +1 0'.- 0 N~ N% 1. 0 cm In
(u (m cm '0 S N '0 C q- 0cl N -. wO 4
L 0.Eu E
00
CD 0.9 I41 4J c:0.- 0 C EL ~ ~ ~ r Eu E~In. E
4J U ) (A 0D 'a 0 EN- . . >1 u Eu % 4.
W ~l 0 L E x H 419
U)l olI
Cm ml im mEu0 '801 u 0
8-0 C 08 419 8 4-9 .2 3 .0 03 E LI1 . u 41' 4.ui I- =1 Go 03 m w) 0SE 01 0) 0) - 4m# I 4.9g I9- CL L. I
9-8 >9 9 41' L.1 N. 6 21. 3 3 0m ~ cI c c L. do El a) 3 0 0 g 0 4oLo) . (U- CL 0 4.98 L. 4.9 .0 >4 m.C Eac Eul Eu Eu 4.9 E 038 0 'D 0 L. 41 -g '0 ISLai L.1 L L c 0 .- 1 c 0 L. Eu 08 0Go
t- CI 8-I (n C- u4 1.6 8I WE x .
* . *. . . . ,. . U % X . . .' . .. *-
w 21
V) U,
" 1-4 CL 0. Z C. z z 2Z
CK LA 0. -
T- -r r 0.
o + +IM- C 0 Go C
go fm Nl a-0 + +1 +1 +1 04a 4a CD - in %T M C) f0 ' 4 . N U 1
oC9- *9-n
t
0' 0 9 0 co@*1 o 0 &- q
CD q- C.9u 0E + " + o +~ +. +1+
*- co U, r- % NO NO N >
E3 -n 00 o
.9- EUL 4~~CC
4 0 3 0 .4a 41.'
41 0@4WU @3 4
@30 .0- 0 0 0C 0C 10 E- N 0 o 0- OV 40 EU
L.a
@3 c
0C .1.- I 4
+1
414'9-. O5 84
qc NoC j

wi 22
4c z
4.'- V ) (n n cn V) th wn Wn )- bz CL z Z Z z z z Z 2
q- 0 M' N~co r- - NO on 0 NO 0
*+1 +1 +1 +1 +1 +1N% +1 +1 +1
I-rn 0O-N N N~ -rW) c 0 NO 0 NO 9- T- -
14 "0 M0 "0 - * "0Cj+ + +
+4 +
4E 00 0' N 0 0
-0a 10
Go. r0 N4 Ui N .LI "
-Z
0
LU
44,
44D
Uc*0
(a-. 0
IU WE 6 0- w. ' 'c 4 I
S~~~ + O N N .m. + m*iz l
ui-41 1 44,m
w (4ca 3
% %

23
4c
..JL)
I-z z z z z z z z z
Nl NO' - i-
* +1 +1 0 3 0D 0 ; 00E 10 + I + + +1 +1 +
ol %t %St -T 9
L.L
> 41
OU +1+1 00 0 0
c I-
-. - .0. 0 N ) 0 C1 U
EUE
+
z IEU +
a w 00 m
O) I
-PL -P p -aO flU i

FIGURE 1 -24-
_.1z Z -I a II
| z|I- C -
C4
*~ 0 a- - 0 L4
0
Co" . -. . - --- - -. -, - - -.. . . ... . ... - - - -
.'.0
Go 00 0oo t-% MS
0 lo in 0inC4 C4
o 3~~uifIHd~43 Hooaino

FIGURE 2 -25-
0 u1
x +.+. E
'a
0
M1
~~1 Lu
ix ~ >>1

* - * -. ** * ** -- * - - . - 6-
FIGURE 3 -6
(00) -dVI3 NI>IS C13LHO13M NV3V4J
0 Cd 0
z~10
zm z
z
o 2
I-
0 C,GoL cat.
r0Q (n
(0o) dIN3. IV03biNVa-

r r V-T-
p.
q*
' DTICo. * % % *Nt


![Thermoregulation [compatibility mode] (1)](https://img.pdfslide.us/doc/110x75/58f0d50f1a28ab39538b45d7/thermoregulation-compatibility-mode-1.jpg)