Embed Size (px)
Citation preview

April 2018 ISSN 2006-9758 DOI: 10.5897/JPBCSwww.academicjournals.org academicJournals
Academic Journals
O PE N A C C E S S
Journal of
Plant Breeding and Crop Science

ABOUT JPBCS
The Journal of Plant Breeding and Crop Science (JPBCS) is published monthly (one volume per year) by Academic Journals.
The Journal of Plant Breeding and Crop Science (JPBCS) (ISSN: 2006-9758) is an open access journal that provides rapid publication (monthly) of articles in all areas of the subject such as Sustainable use of plant protection products, Agronomic and molecular evaluation of recombinant inbred lines (RILs) of lentil, Pollen behaviour and fertilization impairment in plants, Development of a fast and reliable ozone screening method in rice etc.
The Journal welcomes the submission of manuscripts that meet the general criteria of significance and scientific excellence. Papers will be published shortly after acceptance. All articles published in JPBCS are peer-reviewed.
Contact Us
Editorial Office: [email protected]
Help Desk: [email protected]
Website: http://www.academicjournals.org/journal/JPBCS
Submit manuscript online http://ms.academicjournals.me/
Editors
Dr. Munir Aziz Noah Turk Crop Production Department, Faculty of Agriculture Jordan University of Science & Technology Irbid, Jordan
E-mail: [email protected]
http://www.academicjournals.org/jpbcs
Dr. B.Sasikumar ITEC Expert (Spices Technology) National Agril.Res.Inst.,
Mon Repos,ECD,Guyana" India
Dr. Abdul Jaleel Cheruth Stress Physiology Lab, Department of Botany,Annamalai University,Annamalainagar - 608 002, Tamilnadu, PO Box No- 15711, AL-AIN, UAE, India
Dr. S. Paulsamy Kongunadu Arts and Science College, Coimbatore - 641 029, India
Dr. Ivana Maksimovic Department of Field and Vegetable Crops Faculty of Agriculture, University of Novi sad, Serbia
Dr. Aboul-Ata E Aboul-Ata Plant Virus and Mycoplasma Res. Sec., Plant Path. Res. Inst., ARC, PO Box 12619, Giza, Egypt
Dr. Lusike A. Wasilwa Kenya Agricultural Research Institute P. O. Box 57811-00200, Nairobi, Kenya
Dr. Neeraj Verma University of California Riverside, CA 92521, USA
Dr. Yongsheng Liu Research Center for Bio-resource and Eco-environment College of Life Science,
Sichuan University, Chengdu 610064, P. R. China
Editorial Board Dr. Hadia Ahmed Mohamed Moustafa Heikal Genetic Engineering & Biotechnology Research, Institute (GEBRI), Sadat City, Menoufiya University Egypt
Dr. Nambangia Justin Okolle
Research Entomologist, African Research Center on Bananas and Plantains (CARBAP) Njombe, Cameroon
Dr. Nihaluddin Mari Rice Research Institute Dokri, District Larkana, Sindh, Pakistan
Dr. Veronica Sanda Chedea
Department of Chemistry and Biochemistry, University of Agricultural Sciences and Veterinary Medicine (USAMV), Cluj-Napoca, str. Manastur 3-5, 400372 Cluj-Napoca Romania
Dr. Marku Elda Tirana University, Faculty of Natural Sciences, Chemistry Department, Tirana Albania
Dr. Mershad Zeinalabedini ABRII Agricultural Biotechnology Research, Institute of Iran Iran
Dr. Md. Mainul Hasan Visiting Fellow (Plant Cell Biotechnology Lab.): 2008-Present: MU Department of Agricultural Botany, Faculty of Agriculture, Patuakhali Science and Technology University (PSTU), Bangladesh
Thailand
Dr. Amr Farouk Abdelkhalik Moustafa Rice Research and Training Center, 33717. Sakha. Kafr El-Shiekh, Egypt
Prof P.B. Kirti Department of Plant Sciences, University of Hyderabad, Hyderabad - 500 046, India
Dr. Abdel Gabar Eltayeb
University of Sudan, College of Agricultural Studies, Crop Science Department, P.O. Box 71 Shambat, Khartoum North Sudan

Table of Contents: Volume 10 Number 4 February, 2018
Journal of Plant Breeding and Crop Science
ARTICLES
Compatibility studies in Cola nitida genotypes 80 Odutayo, O. I., Adeyemi, F. A., Adebola, P. O. and Sotimehim, O. I. Genotypes × Environment interaction analysis for Ethiopian mustard (Brassica carinata L.) genotypes using AMMI model 86 Tadele Tadesse, Gashaw Sefera and Amanuel Tekalign

Vol. 10(4), pp. 80- 85, April 2018
DOI: 10.5897/JPBCS2017.0637
Article Number: F69486A56526
ISSN 2006-9758
Copyright ©2018
Author(s) retain the copyright of this article
http://www.academicjournals.org/JPBCS
Journal of Plant Breeding and Crop Science
Full Length Research Paper
Compatibility studies in Cola nitida genotypes
Odutayo, O. I.1, Adeyemi, F. A.2, Adebola, P. O.3 and Sotimehim, O. I.2
1Department of Basic Sciences, Babcock University, Ilishan, Remo, Nigeria.
2Department of Biological Sciences, Olabisi Onabanjo University, Ago-Iwoye, Nigeria.
3Department of Plant Breeding, Cocoa Research Institute of Nigeria Idi – Ayunre, Ibadan, Nigeria.
Received 6 January, 2017; Accepted 20 February, 2017
Cross and self-pollination compatibility studies were carried out using 10 Cola nitida genotypes from the Cocoa Research Institute of Nigeria, Ibadan. The few genotypes that were self-pollinated tended to show low pod production; whereas, crosses between the genotypes showed higher pod production. These data would suggest that multiple genotypes should be included in plantations to achieve higher levels of cross-pollination for seed production. Several genotypes (AA231, AA86 and AD44) used in crosses produced pods at a higher frequency. This would suggest higher compatibility of these genotypes. Successful crosses achieved in this work have therefore created a way by which Cola production could be given a boost in Nigeria. This could be achieved by substituting the incompatible genotypes in plantations with cross compatible genotypes discovered in this research work. Key words: Compatibility, Cola nitida, cross and self-pollination, pod production.
INTRODUCTION The genus Cola Schot and Endl., belongs to the family Sterculiaceae and is one of the economically important genera of this family. According to Bodard (1962), the genus is comprised 90 species with S50 native to West Africa. Two species, Cola nitida (Vent) Schot and Endl and Cola acuminata (Pal. De beauv) Scholet and Endl. are of major economic importance in Nigeria. Both species bear a striking resemblance to each other and are cultivated for their edible seeds (Kolanuts). The chromosome numbers of C. nitida and C. acuminata are 2n = 40, which also have been reported in wild Cola species (Adebola and Morakinyo, 2005). Purseglove (1968), reported that the basic chromosome number for the genus was n=10 indicating the occurrence of polyploids in the genus.
Kolanuts are regularly chewed and have varied socio-
cultural importance. Nutritional analysis of three Cola species was carried out by Duran et al. (2015). They reported that the lipid content was very low and that the protein content in C. nitida and C. acuminate were relatively high, with high energy value and high mineral composition. C. nitida is characterized by nuts with two cotyledons and this species is of greater commercial importance as seeds are in higher demand for exports. C. acuminata has nuts with three to six cotyledons and this species is of social, religious and ceremonial values among the Yoruba, Edo, Igala, Igbo and Nupe societies of Nigeria. The C. nitida plants are functionally monoecious possessing both male and female (hermaphrodite) flowers. The male flowers have rudimentary gynoecium, which is non-functional. The hermaphrodite flowers have well-developed androecium
*Corresponding author. E-mail: [email protected].
Author(s) agree that this article remain permanently open access under the terms of the Creative Commons Attribution
License 4.0 International License

and gynoecium. The pollen sacs in the hermaphrodite flowers do not dehisce nor sporulate. Although, pollen grains from hermaphrodite flowers are viable, they have been confirmed to be non-functional when used for either self or cross pollination (Opeke, 1982). C. nitida is self-fertile, although with varying degrees of self-incompatibilities occurring among individual trees (Bodard, 1995). The sticky nature and the size of C. nitida pollen grains indicate that pollination is likely to be anemophilous. The flowers of Cola have in addition a penetrating scent that attracts different types of insects (Bodard, 1962; Russel, 1955).
The main objective of the study is to develop Cola genotypes through cross pollination that would show some level of heterosis over the existing genotypes. These new genotypes would be used to replace the old and low yielding genotypes in the plantations. MATERIALS AND METHODS Ten C. nitida genotypes were selected from experimental plots (64/5) at the Cocoa Research Institute of Nigeria, Ibadan. The genotypes were randomly picked as representatives of various plots based on their yield performance. A diallele mating design including reciprocals was used to assay cross-pollination among genotypes. Pollinations were carried out during the major flowering season from July to September and also in the minor flowering period between November and December.
For cross-pollination, a female flower on an inflorescence was selected and bagged a day before anthesis after removing all the male and young flower buds on the inflorescence. On the day of anthesis, the protecting bag was quickly removed and fresh pollen grains collected from respective pollinator parent were transferred to the stigmatic lobes of the female flower. This was done carefully by removing the perianth of the male flowers and rubbing the fused stamens with the exposed pollen grains on the stigmatic lobes of the freshly opened female flower (Jacob, 1970). The pollinated flowers were re-bagged and properly labeled with tags indicating the date, parents, and serial number of pollination. The bags were removed after 48 h. Pollinations resulting in fruit production after two weeks were regarded as initial fruit set. Pollinations with fruits retained after 90 days were recorded as being successful. The number of pods collected on successful pollination was recorded. Percentage of harvested pods was calculated as: H (%) = X/PK where X = Number of pods harvested, P = Total number of flowers pollinated, and K = A constant = 3.
RESULTS A total of 180 flowers were pollinated during the study. From these pollinations, 88 flowers set fruits (45.6%) and 67 pods were harvested (11.57%). Data from the self and cross-pollinations for the 10 C. nitida genotypes are presented in Table 1. The small number of flowers pollinated for some genotypes was the result of non-synchronous flowering. For three genotypes that were self-pollinated, only AA 231 successfully produced pods,
Odutayo et al. 81 however, frequency of pod produced was low (5.5%). The harvested pods for this genotype are shown in Figure 1.
From the 90 possible cross-pollination combinations, crosses were conducted for 18 combinations (Table 1). Fifteen of these combinations successfully produced pods. Two failed to set fruit and one set fruit, but failed to produce pods. Pods from crosses AA 231 × AD44 and AA231 × AB 15 are presented in Figures 2 and 3. Seeds harvested from three successful crosses are presented in Figure 4. The level of compatibility within and between selected genotypes is given in Table 2. Among theselections, AA231 × AD 44 scored the highest percentage of flower setting (55.5%) and fruit harvest(18.5%). For the cross-pollinations, fruit set averaged 45.3% with cross AA86 × T5139 showing the highest frequency of fruit set; whereas, the highest percentage of pods harvested was observed for cross AA86 × L47 (Table 1). However, genotype AA231 tended to show pod produced in crosses with a greater number of genotypes suggesting a higher level of compatibility. DISCUSSION The productivity of C. nitida groves in Nigeria is extremely variable, where a large number of trees are either non-productive or low yielding. Russell (1955) estimated that as much as 72% of the total yield from some C. nitida groves at Agege, Nigeria might be realized from only 21% of the trees if they were normally productive. This means that most of the Nigerian groves need either complete or selective rehabilitation. From the results of this study, clones such as AA231, AF112 and AD44 can be used for rehabilitation. According to Jacob (1973), compatibility is confirmed if 15% fruit set and 5% fruit harvest result from either self-pollination involving a single genotype or cross pollination involving two different genotypes. Reports of Bodard (1962), Russell (1955), and Eijnatten (1969) indicated that usual range of success lies between 30% and 50%. The close range obtained in this study could be attributed to the use of three distinct Cola populations of different origins.
Findings from this study may partly explain the complaints made by farmers that plantations are not yielding at all or yielding at low capacity, because of the compatibility status of the materials originally planted. It is thereby recommended that for commercial production of C. nitida nuts, some of the compatible clones identified during this work could be used to establish new C. nitida plantations or rehabilitate unproductive groves.
Conclusion Considering the socio-economic importance of C. nitida, breeding new varieties that would enhance greater

82 J. Plant Breed. Crop Sci. Table 1. Results of pollination in diallele combinations involving 10 Cola nitida genotypes.
Female/Male AA231 (%) AA86 (%) AB15 (%) AD44 (%) AD56 (%) AF112 (%) AF129 (%) L47 (%) L48 (%) TS139 (%)
AA231
P 12 - - 2 4 2 - - - -
S 8 (66.67) - - 1 (50.00) 2 (50.00) 1 (50.00) - - - -
H 2 (5.5) - - 1 (16.67) 1 (8.35) 1 (16.67) - - - -
AA86
P 18 10 - - - - - - -
S 9 (50.00) 0 (0) - - - - - - - -
H 6 (11.11) 0 (0) - - - - - - -
AB 15
P 16 - - 5 - - - - - -
S 7 (43.75) - - 3 (60.00) - - - - - -
H 7 (14.58) - - 1 (6.67) - - - - - -
AD 44
P 18 4 - - - 4 - 6 - -
S 10 (55.55) 2 (50.00) - - - 2 (50.00) - 3 (50.00) - -
H 10 (18.50) 2 (16.67) - - - 1 (16.67) - 3 (16.67) - -
AD 56
P 5 3 - - 4 - - - - -
S 0 0 (0%) - - 3 (75) - - - - -
H 0 0 (0%) - - 0 - - - - -
AF 112
P 13 - - - - - - - 30 -
S 7 (53.84) - - - - - - - 12 (40.00) -
H 7 (17.95) - - - - - - - 12 (13.35) -
AF 129
P - - - - - 3 - - - -
S - - - - - 1 (33.33) - - - -
H - - - - - 0 (0) - - - -
L 47
P 4 4 - - - - - - - -
S 2 (50.00) 3 (50.00) - - - - - - - -
H 2 (16.67 3 (25.00) - - - - - - - -
L 48
P - - - - - - - - - -
S - - - - - - - - - -
H - - - - - - - - - -

Odutayo et al. 83 Table 1. Contd.
T 5139
P - 13 - - - - - - - -
S - 10 (76.92) - - - - - - - -
H - 5 (12.82) - - - - - - - -
Number of flowers pollinated (P); number of initial fruit set (S); number of pods harvested (H) percentage in parenthesis.
Figure 1. Harvested pods of self-pollinated AA231, 130 days after pollination.

84 J. Plant Breed. Crop Sci.
Figure 2. Matured pods of successful cross compatible genotypes of AA231XAD44.
Figure 3. Matured pods of successful cross compatible genotypes of AA231XAB15.

Odutayo et al. 85
Figure 4. (1) The nuts of AA231XAB15; (2) The nuts of AA231XAD44; (3) The nuts of L48XAF112.
Table 2. Compatible genotypic combinations among Cola nitida.
Selection (Male × Female) Number of flowers
pollinated Number of
fruit set Percentage of fruit set
Number of fruits harvested
Percentage of fruits harvested
AA231 × AD 44 18 10 55.55±2.05 10 18.50±1.15
AD 44 × AA 231 2 1 50.00±1.85 1 16.67±0.07
AF 112 × AA 231 2 1 50.00±2.1 1 16.67±1.05
AA231 × AF 112 13 7 53.84±2.25 7 17.95±1.25
production should be vigorously pursued.
Moreover, statistics on the existing Cola trees have shown that most of the existing Cola stands on our various plantations are old thereby reducing their yield capabilities. Efforts should therefore be geared towards self and cross breeding of these old stands to replace them with more vigorous hybrids to ensure continuous production. It is hereby recommended that further breeding studies be carried out on Cola to enhance its productivity. This has become imperative because greater percentage of the existing populations is less productive due to age and climate change. Breeding of more vigorous genotypes and those that could be more tolerant to the ever changing climatic conditions would sustain the yield and production of kolanuts. CONFLICT OF INTERESTS The authors have not declared any conflict of interests. REFERENCES Adebola PO, Morakinyo JA (2005), Chromosome Numbers of Four
Nigerian Species of Cola Schott.& Endlicher. Silvae Genetica. 54(1):42-45.
Bodard M (1962). Contribution on the systemic study of Cola in Africa, Annales of the Faculty of Sciences, University of Dakar.
Bodard M (1995). Contribution on the study of Cola nitida. Bull. Center Res. Argon. Bingerville. pp. 23-26.
Duran DN, Adolphe A., Haziz S, Pacome AN, Nafan D, Charles P, Yann EM, Mamoudu HD, and Lamine BM, (2015). Nutritional And Anti-Nutrient Composition of Three Kola Nuts (Cola nitida, Cola acuminata and Garcinia kola) Produced in Benin. Food Nutr. Sci. 6:1395-1407.
Eijnatten CLM (1969). Cola, its Botany and Cultivation. Communication: 59, The Dept. of Agric. Res. Koninklijk Institute Voor de Tropen Amsterdam.
Jacob VJ (1970). Self incompatibility in Cola nitida. Cocoa Research Institute of Nigeria Ann. Rep. 1969-1970, 16-22.
Jacob VJ (1973). Yield characteristics in compatibility and sterility studies in Cola nitida. Ph. D. Thesis submitted to University of Ibadan. Nigeria.
Opeke LK (1982). Tropical Tree Crops. Spectrum books Ltd., Ibadan 327pp.
Purseglove JW (1968). Tropical Crops. Dicotyledons. The English Language Society Book and Longman. 322p.
Russell T (1955). The Cola of Nigeria and the Cameroon. Tropical Agric. Trin. 32:210-240.

Vol. 10(4), pp. 86-92, April 2018
DOI: 10.5897/JPBCS2017.0701
Article Number: 212BD2656528
ISSN 2006-9758
Copyright ©2018
Author(s) retain the copyright of this article
http://www.academicjournals.org/JPBCS
Journal of Plant Breeding and Crop Science
Full Length Research Paper
Genotypes × Environment interaction analysis for Ethiopian mustard (Brassica carinata L.) genotypes
using AMMI model
Tadele Tadesse*, Gashaw Sefera and Amanuel Tekalign
Oromia Agriculture Research Institute, Sinana Agriculture Research Center, Bale-Robe, Ethiopia.
Received 24 October, 2017; Accepted 10 January, 2018
The genotype x environment interaction (GEI) has an influence on the selection and recommendation of genotypes. To this end, G x E interaction and grain yield stability study was conducted for 17 advanced Ethiopian mustard across three districts (Sinana, Adaba and Agarfa) in the highlands of Bale zone during 2014 and 2015 main cropping season. Randomized complete block design with four replications was used. The combined analysis for the mean grain yield was highly significant (p≤0.01) for genotypes, environment and genotype x environment interaction. The mean seed yield of the locations was ranged from 0.9427 t ha
-1 for Agarfa to 2.645 t ha
-1 for Sinana in 2014. The Additive Main effects and
Multiplicative Interaction (AMMI) analysis indicated that 76.7% of the GE sum squares was justified by the first two AMMI (AMMI1 and AMMI 2) components. The regression coefficient (bi) of genotypes ranged from 0.629 to 1.345. Genotypes G7 was the most stable with optimum grain yield (2.21 t ha
-1), bi-
value nearer to unity (bi = 1.03) and minimum value of deviation from regression (0.12). Based on the AMMI Stability Value (ASV), G12, G10, G17, G5, G3, G2, G7, and G8 showed the lowest ASV indicating as they are most stable. However the most stable genotypes would not necessarily give the highest yield. Therefore, based on mean grain yield and the result of stability parameters such as ASV, bi and Genotypes Selection Index (GSI), genotype G7 was found the best candidate variety and recommended for possible release for the test environments and similar agro-ecologies. Key words: Additive Main effects and Multiplicative Interaction (AMMI), AMMI stability value (ASV), biplot, genotypes selection index (GSI), mustard, stability.
INTRODUCTION Brassica carinata L. (2n=34) is an amphidiploid (an allopolyploid behaving as a diploid) derived from an ancient cross between Brassica oleracea (2n=18) and Brassica nigra (2n=16) (Mabberley, 2008; Stace, 2010). Throughout most of Africa, where it is cultivated, it is used as leafy vegetable, but in Ethiopia, it is also grown
for its seed oil (Mnzava and Schippers, 2007; NGRP, 2014; Taylor et al., 2010; Warwick et al., 2006). Wild forms of B. carinata have not been reported but there are diverse ecotypes (Alemayehu and Becker, 2002).
The species is currently being bred to improve a variety of traits. B. carinata likely originated in Ethiopia a few
*Corresponding author. E-mail: [email protected].
Author(s) agree that this article remain permanently open access under the terms of the Creative Commons Attribution
License 4.0 International License

thousand years ago (Mnzava and Schippers, 2007; Warwick et al., 2006). Its exact native distribution is not well understood because it has been cultivated for a long time in Africa; furthermore, it is often confused with Brassica juncea (Mnzava and Schippers, 2007). It is currently cultivated, native, and/or escaping from cultivation in many countries in Africa (Mnzava and Schippers, 2007). "Truly wild types are not known” (Mnzava and Schippers, 2007). The NGRP (2014) reports B. carinata as naturalized in Ethiopia, but because this is where the species is believed to have originated (Warwick et al., 2006).
Stability of yield under different environments is an important concern in plant breeding programs. The goal of plant breeders in crop improvement programs is to develop varieties, which are widely adapted to diversified environments. Some genotypes perform well in some environments but not so well in others (Dhillon et al., 1999). This variability in response is due to genotype by environment interaction (GEI). These interactions of genotypes with environments can be attributed to biotic and abiotic environmental stresses, like drought, temperature, rainfall, soil texture, pests and diseases. The adaptability of a variety over diverse environments is usually tested by its degree of interaction with different growing environments. A variety or genotype is considered to be more adaptive or stable if it has a high mean yield but low degree of fluctuation in yielding ability when grown over diverse environments (Falconer, 1981). Failure of genotypes to respond consistently to variable environmental conditions is attributed to GEI. Knowledge of GEI is advantageous to have a cultivar that gives consistently high yield in a broad range of environments and to increase efficiency of breeding program and selection of best genotypes. Therefore, this work was carried out to determine the adaptability and stability of mustard genotypes in the highlands of Bale zone, Southeastern, Ethiopia. MATERIALS AND METHODS Seventeen mustard genotypes including two released varieties and local cultivar were evaluated for two consecutive years (2014 and 2015) at three locations (Sinana, Adaba and Agarfa) in the highlands of Bale zone, Ethiopia. Sinana Research Center (7° N latitude and 40°E longitude; 2400 m a.s.l.) is located at 463 km south east of Addis Ababa and East of Robe, the capital of Bale zone. The other location is located at 45 and 60 km from the capital zone of Bale in the Southwest direction.
The genotypes were arranged using randomized complete block design with four replications with plot size of 7.2 m2 (6 rows at 30 cm spacing in rows of 4 m long). The four central rows used for data collection and as net harvest. The data will be subjected to individual location analysis to taste the homogeneity of the testing environment and combined analysis of variance using balanced analysis of variance (ANOVA) as well as the regression analysis was computed using Cropstat program. LSD is used for the mean separation of the genotypes evaluated.
The additive main effect and multiplicative interaction (AMMI) analysis was performed using the model suggested by Crossa et al.
Tadesse et al. 87 (1991). The ASV is the distance from the coordinate point to the origin in a two dimensional of IPCA1 score against IPCA2 scores in the AMMI model (Purchase et al., 2000). This weight is calculated for each genotypes and environment according to the relative contribution of IPCA1 to IPCA2 to the interaction Sum of Squares as follows:
ASV=√⌊
( )⌋
⌈ ⌉
where
is the weight given to the IPCA1 value by dividing the
IPCA1 sum squares by the IPCA2 sum of squares. The larger the IPCA score, either negative or positive, the more specifically adapted a genotype is to certain environments. Smaller IPCA score indicates a more stable genotype across environments.
Genotype selection index (GSI) was calculated for each genotype which incorporates both mean grain yield and stability index in single criteria (GSIi) as (Farshadfar and Sutka 2003):
GSIi= RYi +RASVi,
where GSI = genotype selection index, RYi = rank of mean grain yield, RASV = rank for the AMMI stability value for the genotypes.
RESULT AND DISCUSSION
AMMI analysis of mean seed yield for mustard genotypes
The analysis of variance for individual location revealed non-significant variation for most of the parameters used. The pooled analysis of variance for mean grain yield revealed (Table 2) high significant differences (P<0.01) for genotypes, environment and GE interaction. The same has been reported by Ali et al. (2001), Khan et al. (1988), Wani (1992), Aslam et al. (2015), and Maqbool et al. (2015). Such statistical interaction among the genotypes resulted from the change in the magnitudes of difference between genotypes from one environment to another.
The significant GEI showed that seed yield ranking of genotypes was changed over the locations due to the presence of environment interaction indicating that the necessity of testing mustard genotypes at multiple locations. This shows the difficulties encountered by breeders for selecting new genotypes. These difficulties arise from the masking effects of variable environment (Goncalves et al., 2003). Mean comparison for the tested genotypes indicated that maximum grain yield was obtained from G7 (2.21 tha
-1), followed by G9 (1.82 tha
-1)
and G8 (1.78 tha-1
) whereas the least mean grain yield was obtained from G17 (1.55 tha
-1). The highest yield
was obtained from Sinana 2014 (2.65 tha-1
), whereas the lowest yield was obtained from Agarfa 2014 (0.94 tha
-1)
(Table 3). Regression analysis The regression analysis for 17 mustard genotypes grain yield (tha
-1) tested in six environments shows that 79.67%

88 J. Plant Breed. Crop Sci.
Table 1. List of Ethiopian mustard (Brassica carinata L.) genotypes used in the study.
Genotype code Genotype name Status Origin
G1 YDZ1-A088/A Line developed from collection Ethiopian collection
G2 PGRC/E 21257 Line developed from collection Ethiopian collection
G3 PGRC/E 210102 Line developed from collection Ethiopian collection
G4 PGRC/E 208594/1 Line developed from collection Ethiopian collection
G5 PGRC/E 20140/B Line developed from collection Ethiopian collection
G6 PGRC/E 21013 Line developed from collection Ethiopian collection
G7 PGRC/E 21207/A Line developed from collection Ethiopian collection
G8 PGRC/E 208419/1 Line developed from collection Ethiopian collection
G9 YDZ1-A088/5 Line developed from collection Ethiopian collection
G10 PGRC/E 208524/3 Line developed from collection Ethiopian collection
G11 PGRC/E 21007/B Line developed from collection Ethiopian collection
G12 PGRC/E 21312 Line developed from collection Ethiopian collection
G13 PGRC/E 210114 Line developed from collection Ethiopian collection
G14 PGRC/E 208584/4 Line developed from collection Ethiopian collection
G15 Shaya Released used as check Released by Sinana, Ethiopia
G16 Yellow dodola Released used as check Released by Holeta, Ethiopia
G17 Local check, landrace Local cultivar As local check
Table 2. Combined analysis of variance for mean seed yield of Ethiopian Mustard (Brassica carinata L.) genotypes.
Source of variation Degre of freedom Mean square (Total %TSS)
Year (Y) 1 4.58072** 1.53
Location (L) 2 64.6334** 43.11
Replication 3 0.367477** 0.37
Genotype (G) 16 0.556143** 2.97
Y × L 2 7.29348** 118.33
Y × G 16 0.484343** 62.86
L × GL 32 0.385236** 138.43
Y × L × G 32 0.278298** 2.97
Residual 303 0.371115** -
Total 407 0.736771 -
**Significant at 1% level of probability.
of the total sum of square was attributed to the environmental effect, only 4.78% for genotypic effect and 15.55% for GE interaction effects (Table 4). The environments were diverse and caused the greatest variation in the mean grain yield. The GE interaction sum of squares was 3.25 times larger than that of the genotypic effect which determined substantial differences in genotypic response across environment. Similar result was reported by Tarakanovas and Rusgas (2006). AMMI analysis The results of the AMMI model were interpreted on the basis of two AMMI biplots, a biplot that showed the main and first interaction principal components analysis axis
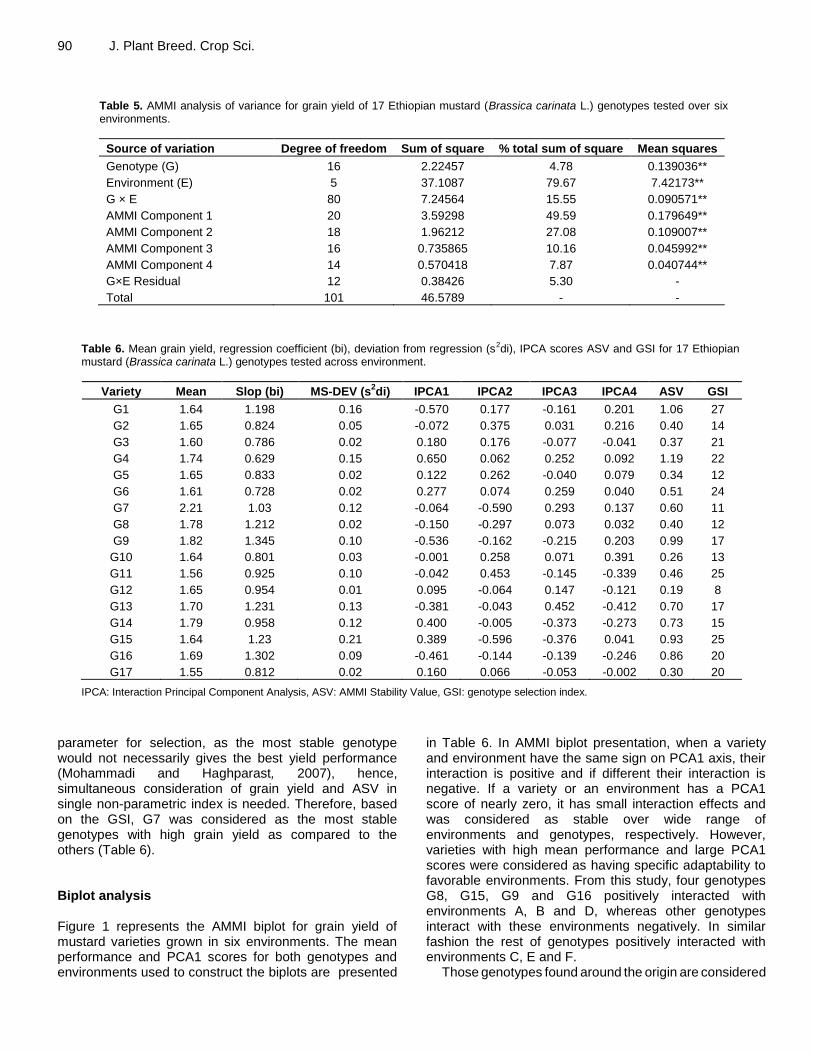
(IPCA) effects of both G and E and a biplot that showed the nominal yield (expected yield from the AMMI model equation without environmental deviation) of genotypes across IPCA 1 scores (Gauch and Zobel, 1997). Accordingly, the AMMI analysis of variance for the mean grain yield of the mustard genotypes tested across the studied environments revealed that significant variation was observed for genotypes, environment, and GE interaction (Table 5). The result of the AMMI analysis revealed that 49.59% of the GE interaction sum of squares accounted for AMMI 1, followed by AMMI 2 (27.08%), AMMI 3 (10.16%), and AMMI 4 (7.87%) (Table 5). The first two IPCA scores cumulatively accounted for 76.67% of the total GE interaction. This indicates the importance of undertaking GE interaction analysis when targeting the genotypes mustard to specific location.

Tadesse et al. 89
Table 3. Mean grain yield (tha-1) of 17 Ethiopian mustard (Brassica carinata L.) genotypes across locations.
Genotype code†
Sinana 2014 (A)
Adaba 2014 (B)
Agarfa 2014 (C)
Sinana 2015 (D)
Adaba 2015 (E)
Agarfa 2015 (F)
Genotypes MEANS
G1 2.52 0.49 0.99 2.72 1.76 1.36 1.64
G2 2.38 0.97 1.08 2.18 1.83 1.46 1.65
G3 2.49 1.22 1.15 2.02 1.34 1.42 1.61
G4 2.56 1.94 0.89 1.78 1.66 1.65 1.75
G5 2.54 1.17 1.03 2.04 1.71 1.45 1.65
G6 2.33 1.43 0.94 2.02 1.37 1.59 1.61
G7 3.10 1.97 0.98 3.32 1.77 2.13 2.21
G8 2.77 1.26 0.76 2.73 1.52 1.64 1.78
G9 2.81 0.86 0.99 3.09 1.71 1.47 1.82
G10 2.29 1.14 1.01 2.24 1.80 1.38 1.64
G11 2.65 0.70 1.06 1.83 1.61 1.51 1.56
G12 2.57 1.27 0.86 2.23 1.33 1.63 1.65
G13 2.66 0.74 0.65 2.54 1.54 2.07 1.70
G14 3.11 1.59 1.11 1.98 1.51 1.46 1.79
G15 3.03 1.75 0.49 2.27 1.23 1.10 1.64
G16 2.78 0.71 1.00 2.80 1.27 1.59 1.69
G17 2.40 1.21 1.06 2.08 1.18 1.35 1.55
Mean 2.65 1.20 0.94 2.35 1.54 1.54 1.70
LSD 1 % 0.71 1.19 0.29 0.85 0.68 0.44 0.95
CV% 19.4 18.0 21.1 24.3 21.0 20.0 18.2 †See Table 1 for genotype names.
Table 4. Regression analysis of phenotypic stability for 17 Ethiopian mustard (Brassica carinata L.) genotypes.
Source of variation Degree of freedom. Sum of square Mean squares % Total sum of square
Genotype (G) 16 2.22457 0.13904** 4.78
Environment (E) 5 37.1087 7.42173** 79.67
G × E 80 7.24564 0.09057** 15.55
G × Site Reg 16 1.86429 0.11652** 25.73
Deviation 64 5.38135 0.08408** 74.27
Total 101 46.5789 - -
**Significant at 1% level of probability.
Furthermore, the use of the two AMMI model (AMMI 1 and AMMI 2) can best fit to justify the present sets of data (Table 5).
The stability parameters from seed yield were calculated for 17 B. carinata genotypes (Table 6). The regression coefficient (bi) of B. carinata genotypes ranged from 0.629 to 1.345. G9 had the highest regression coefficient (bi=1.345) followed by G16 (bi =1.306), the regression coefficient greater than unity (bi>1.0) indicated that these entries are suitable for favorable environments. The genotypes G11 (bi=0.925), G12 (bi=0.954) and G14 (bi=0.958), had regression coefficient lower than unity (bi<1) indicating that these entries are suitable for unfavorable environments. The G7 (bi=1.03) had regression coefficient close to unity and low deviation from regression indicated that this genotype
is the most stable and well adaptive and suitable for commercial cultivation across the tested environments. Similar results have been reported by Ali et al. (2002). AMMI stability value (ASV) Furthermore, the ASV which is the distance from the coordinate point to the origin in a two dimensional scattergram of IPCA1 scores against IPCA2 score should also be seen to decide the stability of a genotypes (Purchase et al., 2000). In ASV method, genotype with least ASV score is the most stable. From this study, ASV discriminated genotypes G 12, G10, G17, G5, G3, G2, G8, and G7, as the stable genotypes (Table 6).
However, since stability in itself should not be the only
90 J. Plant Breed. Crop Sci.
Table 5. AMMI analysis of variance for grain yield of 17 Ethiopian mustard (Brassica carinata L.) genotypes tested over six environments.
Source of variation Degree of freedom Sum of square % total sum of square Mean squares
Genotype (G) 16 2.22457 4.78 0.139036**
Environment (E) 5 37.1087 79.67 7.42173**
G × E 80 7.24564 15.55 0.090571**
AMMI Component 1 20 3.59298 49.59 0.179649**
AMMI Component 2 18 1.96212 27.08 0.109007**
AMMI Component 3 16 0.735865 10.16 0.045992**
AMMI Component 4 14 0.570418 7.87 0.040744**
G×E Residual 12 0.38426 5.30 -
Total 101 46.5789 - -
Table 6. Mean grain yield, regression coefficient (bi), deviation from regression (s2di), IPCA scores ASV and GSI for 17 Ethiopian mustard (Brassica carinata L.) genotypes tested across environment.
Variety Mean Slop (bi) MS-DEV (s2di) IPCA1 IPCA2 IPCA3 IPCA4 ASV GSI
G1 1.64 1.198 0.16 -0.570 0.177 -0.161 0.201 1.06 27
G2 1.65 0.824 0.05 -0.072 0.375 0.031 0.216 0.40 14
G3 1.60 0.786 0.02 0.180 0.176 -0.077 -0.041 0.37 21
G4 1.74 0.629 0.15 0.650 0.062 0.252 0.092 1.19 22
G5 1.65 0.833 0.02 0.122 0.262 -0.040 0.079 0.34 12
G6 1.61 0.728 0.02 0.277 0.074 0.259 0.040 0.51 24
G7 2.21 1.03 0.12 -0.064 -0.590 0.293 0.137 0.60 11
G8 1.78 1.212 0.02 -0.150 -0.297 0.073 0.032 0.40 12
G9 1.82 1.345 0.10 -0.536 -0.162 -0.215 0.203 0.99 17
G10 1.64 0.801 0.03 -0.001 0.258 0.071 0.391 0.26 13
G11 1.56 0.925 0.10 -0.042 0.453 -0.145 -0.339 0.46 25
G12 1.65 0.954 0.01 0.095 -0.064 0.147 -0.121 0.19 8
G13 1.70 1.231 0.13 -0.381 -0.043 0.452 -0.412 0.70 17
G14 1.79 0.958 0.12 0.400 -0.005 -0.373 -0.273 0.73 15
G15 1.64 1.23 0.21 0.389 -0.596 -0.376 0.041 0.93 25
G16 1.69 1.302 0.09 -0.461 -0.144 -0.139 -0.246 0.86 20
G17 1.55 0.812 0.02 0.160 0.066 -0.053 -0.002 0.30 20
IPCA: Interaction Principal Component Analysis, ASV: AMMI Stability Value, GSI: genotype selection index.
parameter for selection, as the most stable genotype would not necessarily gives the best yield performance (Mohammadi and Haghparast, 2007), hence, simultaneous consideration of grain yield and ASV in single non-parametric index is needed. Therefore, based on the GSI, G7 was considered as the most stable genotypes with high grain yield as compared to the others (Table 6). Biplot analysis Figure 1 represents the AMMI biplot for grain yield of mustard varieties grown in six environments. The mean performance and PCA1 scores for both genotypes and environments used to construct the biplots are presented
in Table 6. In AMMI biplot presentation, when a variety and environment have the same sign on PCA1 axis, their interaction is positive and if different their interaction is negative. If a variety or an environment has a PCA1 score of nearly zero, it has small interaction effects and was considered as stable over wide range of environments and genotypes, respectively. However, varieties with high mean performance and large PCA1 scores were considered as having specific adaptability to favorable environments. From this study, four genotypes G8, G15, G9 and G16 positively interacted with environments A, B and D, whereas other genotypes interact with these environments negatively. In similar fashion the rest of genotypes positively interacted with environments C, E and F.
Those genotypes found around the origin are considered

Tadesse et al. 91
Figure 1. Biplot analysis of GE interaction based on AMM2 model for the first two interactions principal component scores for 17 Ethiopian mustard (Brassica carinata L.) genotypes for two consecutive years (2014 and 2015) at three locations (Sinana, Adaba and Agarfa) in the highlands of Bale Zone southeaster of Ethiopia. See Tables1 and 3 for genotypes and environments names, respectively.
to be more stable. G4, G7, G8, G9 and G14 gave mean seed yield above the grand mean. However, regarding their stability, G4, G14, G8 and G9 were though they had high mean performance and these genotypes are more suited to specific environments, on the other hand, G7 which gave the highest grain yield and having lower GSI is considered as the most stable genotypes for all the environments under study. Conclusion This paper demonstrated the usefulness of AMMI model and biplot analyses in interpretation of grain yield data from a multi environment experiment in identifying stable genotypes. The AMMI model analysis provided estimates of the magnitude and significance of the effects of GE interaction and its interaction principal components relative to G and E effects. Stability and adaptability of genotypes were estimated through AMMI biplots.
According to the results based on mean of grain yield, coefficient of regression and deviation from regression, ASV and GSI genotype 7 were the most stable and adaptable in all the studied environments and therefore
selected for the possible release in the coming cropping season. CONFLICT OF INTERESTS
The authors have not declared any conflict of interests.
ACKNOWLEDGEMENTS The authors would like to thank Oromia Agriculture Research Institute for financial support. Besides, the authors also thank Sinana Agriculture Research Center for providing the necessary support and Pulse and Oil Crops research case team staff for the entire trial management and data collection. REFERENCES Alemayehu N, Becker H (2002). Genotypic diversity and patterns of
variation in a germplasm material of Ethiopian mustard (Brassica carinata A. Braun). Genet. Resour. Crop Evol. 49(6):573-582.
Ali N, Javidfar F, Attry AA (2002). Stability analysis of seed yield in winter type rapeseed (Brassica napus) varieties. Pak. J. Bot.
MODEL FIT: 76.7% OF GXE SS
IPCA1 1.1 0.7 0.3 -0.1 -0.5 -0.9
IPCA2
0.7
0.44
0.18
-0.08
-0.34
1
2
3
4
5
6 7
8
9
10
11
12 13 14
15
16
17
A
B
C
D
E
F

92 J. Plant Breed. Crop Sci.
34(2):151-155. Ali N, Nawaz MS, Mirza MY, Hazara GR (2001). Stability analysis for
pod yield in groundnut (Arachis hypogaea L.). Pak. J. Bot. 33:191-196.
Aslam M, Maqbool MA, Yaseen M, Zaman QU (2015). AMMI Biplot analysis for comparative evaluation of maize genotypes under different saline environments. Pak. J. Agric. Sci. 52:339-347.
Crossa J, Fox PN, Pfeiffer WH, Rajaram S, Gauch HG (1991). AMMI adjustment for statistical analysis of an interactional wheat yield trial. Theor. Appl. Genet. 81:27-37.
Dhillon SS, Sing K, Bar KS (1999). Stability analysis of elite strain in Indian mustard. PAU, Regional Research station, Bathinda, India-151001. http://www.regional.org.au.gcirc
Falconer DS (1981). Introduction to quantitative genetics. 2nd ed. Longman Group Limited, New York. 340p.
Farshadfar E, Sutka J (2003). Locating QTLs controlling adaptation in wheat using AMMI model. Cereal Res. Commun. 31:249-254.
Gauch, HG, Zobel Jr RW (1997). Identifying mega-environmentsand targeting genotypes. Crop Sci. 37:311-326.
Goncalves P, Bartoletto N, Martins R, Gallo P (2003). Genotype x environment interaction and phenotypic stability for girth growth rubber yield of Hevea clones in Sao Paulo State, Brazil. Genet. Mol. Biol. 26:441-448.
Khan, IA, Malik BA, Bashir M (1988). Investigation of genotype x environments interaction for seed yield in chickpea. Pak. J. Bot. 20:201-204.
Mabberley DJ (2008). Mabberley's Plant-Book: A Portable Dictionary of Plants, Their Classification and Uses (3rd edition). Cambridge University Press, New York. 1021p.
Maqbool MA, Aslam M, Ali H, Shah TM, Atta BM (2015). GGE biplot analysis based selection of superior chickpea (Cicer arietinum L.) inbred lines under variable water environments. Pak. J. Bot. 47:1901-1908.
Mnzava NA, Schippers RR (2007). Brassica carinata A. Braun.: Internetrecord from Plant Resources of Tropical Africa (PROTA), Protologue Flora 24: 267 (1841) OnlineDatabase. Wageningen University. http://www.prota4u. org.protav8
Mohammadi R, Haghparast R (2007) Biplot analysis of multi-environment trials for identification of winter wheat mega-environment in Iran. World J. Agric. Sci. 3:475-480.
National Genetic Resources Program (NGRP) (2014). Germplasm Resources Information Network (GRIN). United States Department of Agriculture, Agricultural Research Service. https://www.ars-grin.gov/
Purchase JL, Hatting H Vandenventer CS (2000). Genotype x
environment interaction of winter wheat in south Africa: II. Stability analysis of yield performance. South Afr. J. Plant Soil 17:101-107.
Stace C (2010). New Flora of the British Isles (3rd ed.). Cambridge University Press, Cambridge, United Kingdom. 1130 p.
Tarakanovas P, Rusgas V (2006). Additive main effect and multiplicative interaction analysis of grain yield of wheat varieties in Lithuania. Agron. Res. 4:91-98.
Taylor DC, Falk KC, Palmer CD, Hammerlindl J, Babic V, Mietkiewska E, Jadhav A, Marillia EF, Francis T, Hoffman T, Giblin EM, Katavic V, Keller WA (2010). Brassica carinata - A new molecular farming platform for delivering bio-industrial oil feedstocks: Case studies of genetic modifications to improve very long-chain fatty acid and oil content in seeds. Biofuels, Bioprod. Biorefin. 4(5):538-561.
Warwick SI, Gugel RK, McDonald T, Falk KC (2006). Genetic variation of Ethiopian mustard (Brassica carinata A. Braun) germplasm in western Canada. Genet. Resour. Crop Evol. 53(2):297-312.
Wani SA (1992). Genotype x environment interaction for yield and its components in Indian mustard. Adv. Plant Sci. 5:421-425.

OPEN
ACCESS
Journal of
Agricultural Extension
and Rural Development
International Journal of
Fisheries and Aquaculture
Journal of
Cereals and Oilseeds
academicJournalswww.academicjournals.org
Journal of Ag ricultural
Biotechnolog y and
Sustainable Developm ent
International Journal of
Livestock Production
African Journal of
Agricultural Research
1st - 5th July 2018. Chania, Greece


![[original_publication] [call number] [volume] [title] [year] [editor] [author] [filetype] [DOI] [ISBN] [ISSN] [pages] [date] [permalink] [author_first]](https://img.pdfslide.us/doc/110x75/56649e7c5503460f94b7ec01/originalpublication-call-number-volume-title-year-editor-author.jpg)


![[NC-Rase 18] ISSN 2348 8034 DOI: 10.5281/zenodo.1488661 ...gjesr.com/Issues PDF/NC-Rase 18 (Recent Advances in... · [NC-Rase 18] ISSN 2348 – 8034 DOI: 10.5281/zenodo.1488661 Impact](https://img.pdfslide.us/doc/110x75/5e7a00f60586ba041e420c8d/nc-rase-18-issn-2348-8034-doi-105281zenodo1488661-gjesrcomissues-pdfnc-rase.jpg)


![AUTOMATIKA - c-develop4]_Reyneke... · AUTOMATIKA . Journal for Control, Measurement, Electronics, Computing and Communications . Online ISSN 1848-3380, Print ISSN 0005-1144, doi:](https://img.pdfslide.us/doc/110x75/5e31bc3bd3916a4c7866752f/automatika-c-develop-4reyneke-automatika-journal-for-control-measurement.jpg)