Embed Size (px)
Citation preview
“A STUDY ON CUSTOMER PERCEPTION TOWARDS ROYAL ENFIELD WITH SPECIAL REFERENCE TO MALAPPURAM DISTRICT”
Name:Mr.FAISAL.T
Designation:Research Scholar(M-phil)
Postal address:Thottiyil[H]
:Kuzhippuram
:Iringalloor[post]
:Vengara[via]
:Malappuram[dist]
:Kerala . 676304[pin]
Phone:09744255977
Mail ID:[email protected]
INTRODUCTION
It is being hard to please the present day customers. The market conscious
society turned smarter and more priced conscious and in turn more demanding
and less forgiving. They checkout the competitors with similar or at times even
better offers. So the challenge is not to produce for customers, any firm could do
it. The real challenge is to produce delighted customers and more importantly
loyal customers.
Customers are the king and without satisfying their needs none can exist in
the corporate competitive world. Customer perception is a marketing concept
that encompasses a customer’s impression, awareness and/or consciousness
about a company on its offerings. Customer perception is typically affected by
advertising, reviews, public relation, social media, personal experience and other
channels.
By way of analyzing customer perception we can clearly understood how
much a firm treats its customers, what is the quality of their products, is it
capable to serve the dynamic needs of customers, what will be their future in
what way they need to making changes etc…
The project report deals with the analysis of customer perception
conducted among customers of Royal Enfield who purchased different brands
Royal Enfield.
REVIEW OF LITERATURE A Study named “CUSTOMER PERCEPTION WITH MOTOR CYCLE”
Conducted by Dr: L. Vijay, Professor in SA Eng. College Chennai and B.
Jayachitra associate professor Vel Sreenivasa college Chennai. And published in
International Journal of Marketing and Human Resource Management
(IJMHRM). It is a comparative study between customers of Hero Honda, Bajaj
and TVS to know customer perception and the reason to a customer opt for a
particular brand. The study suggests that it is better to introduce eco- friendly
bikes and to reduce cost in case of Hero Honda. Better to Introduce bikes for
women and improve mileage incase of Bajaj. And it is better to take necessary
step to improve brand image in case of TVS.
A STUDY ON CONSUMER PERCEPTION AND EXPECTATIONS FOR
TATA NANO” Conducted by Dr.Garima Malik Asst.Prof in Amity Business
School- Noida. Main objectives of the study are, to know general perception and
awareness about NANO, factors influencing purchasing decision and customer
expectations from NANO, etc... The study reveals that long waiting period, bad
word of mouth and reports in the market like “Auto-rickshaw”, etc...have
negative impact on the products demand. Customers are satisfied in price and
fuel efficiency, effective sales promotion activities with the theme of ‘Young-car’
and steps to solve complaints from customers are necessary to improve
customers’ satisfaction.
OBJECTIVES OF THE STUDY
To evaluate the attitude of young generation towards Royal Enfield
To identify the factors influencing in selection of Royal Enfield
To analyze the problem of Royal Enfield while compared to other Bikes
To know the influence and impact of competitors
To study whether there is any change in perception of new generation
towards Royal Enfield.
To understand the reasons for change in perception, if any.
To analyze the level of preference for new and old model of Royal Enfield.
SCOPE OF THE STUDYThis study will helps to evaluate the present position of Royal Enfield
among the existing customers. The study helps to identify the important reason
why do youngsters likes Royal Enfield, which is the most important feature of
Royal Enfield, in which way customers need modification on existing models, how
is the level of customer acceptance in the areas of product and services. And also is
there any kind of dissatisfaction in mind of existing customers and the reason for
their dissatisfaction, etc…
Simply the study makes a chance to the firm to delight their customers,
ultimately for the existence and earnings in present corporate competition by way
of adjusting their products according to the customer needs, if necessary and also
to know the strength, weakness, opportunity and threat of the product or the firm.
RESEARCH METHODOLOGY
Research is done for collecting the information that helps to solve certain
problems effectively. It is a frame work with a specific logic from the researcher to
find out a reasonable solution for a problem. Research is a step by step activity
which needs to be accurate and reliable. It is completed when the researcher gets
proper solutions for his task. It aims at definite solutions within a particular period.
It covers some challenging task such as how, when, where, who and why?
Research methodology is way to solve the research problem systematically.
It deals with the objective of research study, the method defining research
problem, the type of hypothesis formulated, the type of data collected, method
used for data collection and analysis etc… the methodology includes collection
primary and secondary data.
RESEARCH DESIGN
A research design is basis frame work, which provides guidelines for the rest
of research process. It is the map or blueprint according to which, the research is to
be conducted. The research design specifies the method of study. Research design
is prepared after formulating the research problem and need to be most suitable to
solve the problem.
POPULATION
Here the researcher selected 250 customers who purchased different brands
of Royal Enfield.
SAMPLE SIZE
It refers to the number of items to be selected from the universe to constitute
a sample. An optimum sample is one, which fulfills the requirement of efficiency,
representative, reliability and flexibility. So the researcher selected 100
respondents as sample from the population.
SAMPLING METHOD
Sampling technique used in the study is convenient sampling which comes
under the purposive sampling which is also called non- random sampling.
DATA COLLECTION
The collection of data is the primary step in statistical investigation.
Collection of data is process of enumeration together with the proper recording of
results. The success of an enquiry depends upon proper data collection. The
methodology of this study involved collection of the primary data and the
secondary data.
SOURCE OF DATA
Data are the raw materials in which the research works. The task of data
collection begins after research problem has been defined and research design
chalked out. The data collection is classified as Primary data and Secondary data.
PRIMARY DATA
Primary datas are collected directly by way of using questionnaires as
well as by meeting the company managers, service head, store keeper and
also few sales executives of different agencies. So it will be reliable and
accurate and can easily by respondent.
SECONDARY DATA
These are datas already collected and recorded. Here secondary datas
were collected from the company’s office records like customer register and
delivery book, newspapers, official website of Royal Enfield, other web
sites, library books and also from previous project reports in related areas.
STATISTICAL TOOLS USED
PERCENTAGE ANALYSIS This is the simplest way to analysis different types of data in this
method percentage rate of each data was found that and with respect to total
and with the help of the percentage (%) rate the analyzing the data was
carried out.
Pie Diagram.
Doughnut
Bar Diagram
CHI-SQUARE TEST
Chi square test is the important type of non parametric tests. Non
parametric tests are used when assumptions required by the parametric
counterpart tests are not met are questionable. All test involving ranked data
are non parametric. In non parametric tests no assumptions are made about
the parameters of population from which we draw our samples are made.
These tests are distribution free.
It explains the magnitude of difference between observed frequencies
and the theoretical or expected frequencies under certain assumptions. With
the help of chi square test we are able to find out whether such differences
are significant or insignificant and could have arisen due to sampling
fluctuations.
ANALYSIS OF DATA
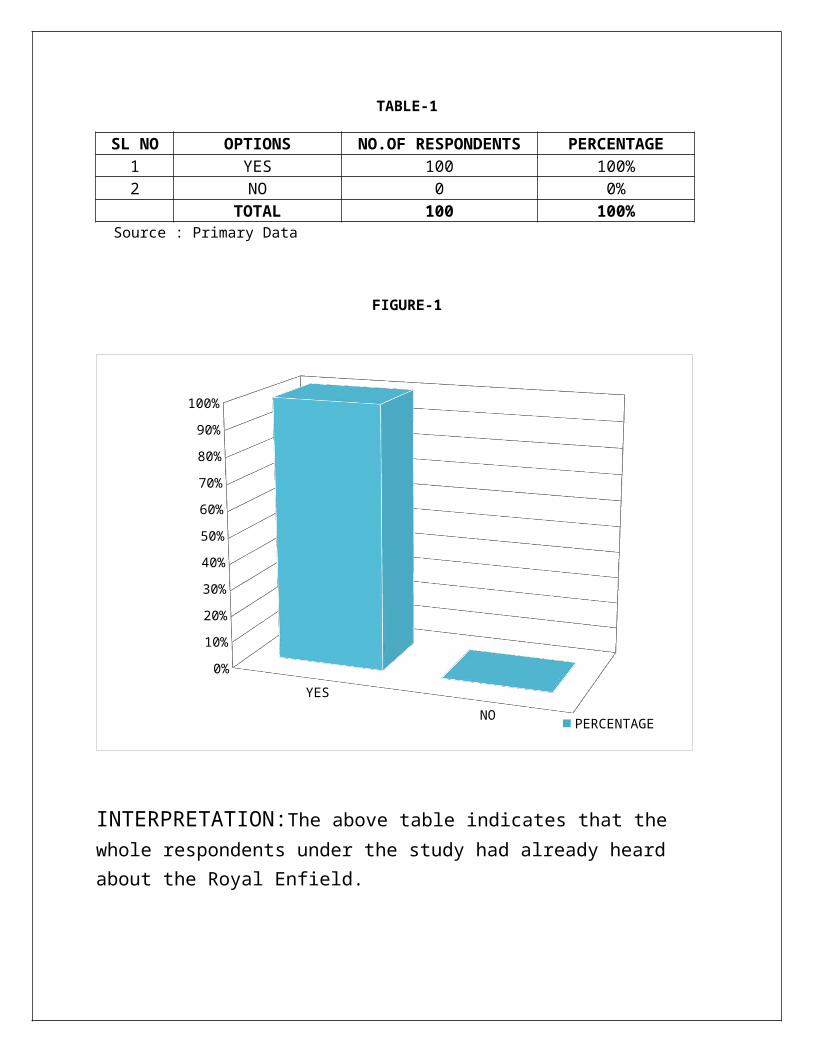
TABLE AND FIGURE SHOWING THE RESPONDENTS’ KNOWLEDGE ABOUT THE ROYAL ENFIELD
TABLE-1
SL NO OPTIONS NO.OF RESPONDENTS PERCENTAGE1 YES 100 100%2 NO 0 0%
TOTAL 100 100% Source : Primary Data
FIGURE-1
YES
NO
0%
10%
20%
30%
40%
50%
60%
70%
80%
90%
100%
PERCENTAGE
INTERPRETATION:The above table indicates that the whole respondents under the study had already heard about the Royal Enfield.
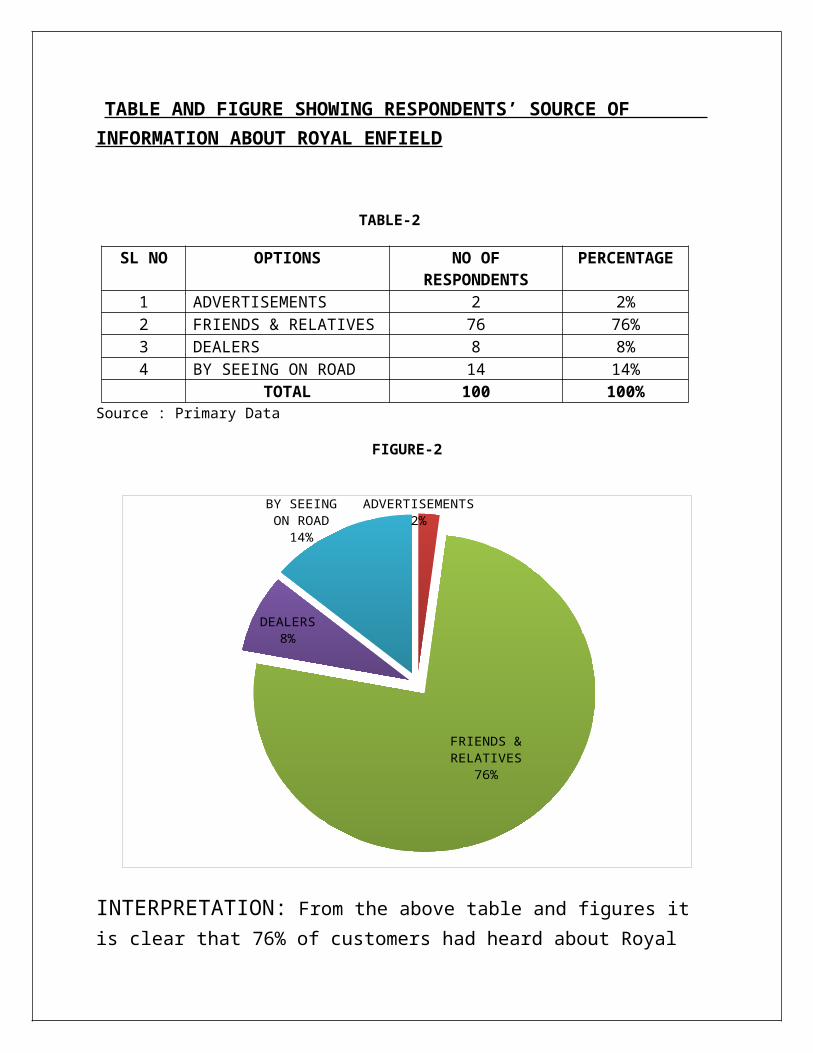
TABLE AND FIGURE SHOWING RESPONDENTS’ SOURCE OF INFORMATION ABOUT ROYAL ENFIELD
TABLE-2
SL NO OPTIONS NO OF RESPONDENTS
PERCENTAGE
1 ADVERTISEMENTS 2 2%2 FRIENDS & RELATIVES 76 76%3 DEALERS 8 8%4 BY SEEING ON ROAD 14 14%
TOTAL 100 100%Source : Primary Data
FIGURE-2
ADVERTISEMENTS2%
FRIENDS & RELATIVES
76%
DEALERS8%
BY SEEING ON ROAD14%
INTERPRETATION: From the above table and figures it is clear that 76% of customers had heard about Royal Enfield from their friends and relatives, 14% by seeing on road, 8% from dealers and rest of 2% from advertisement.
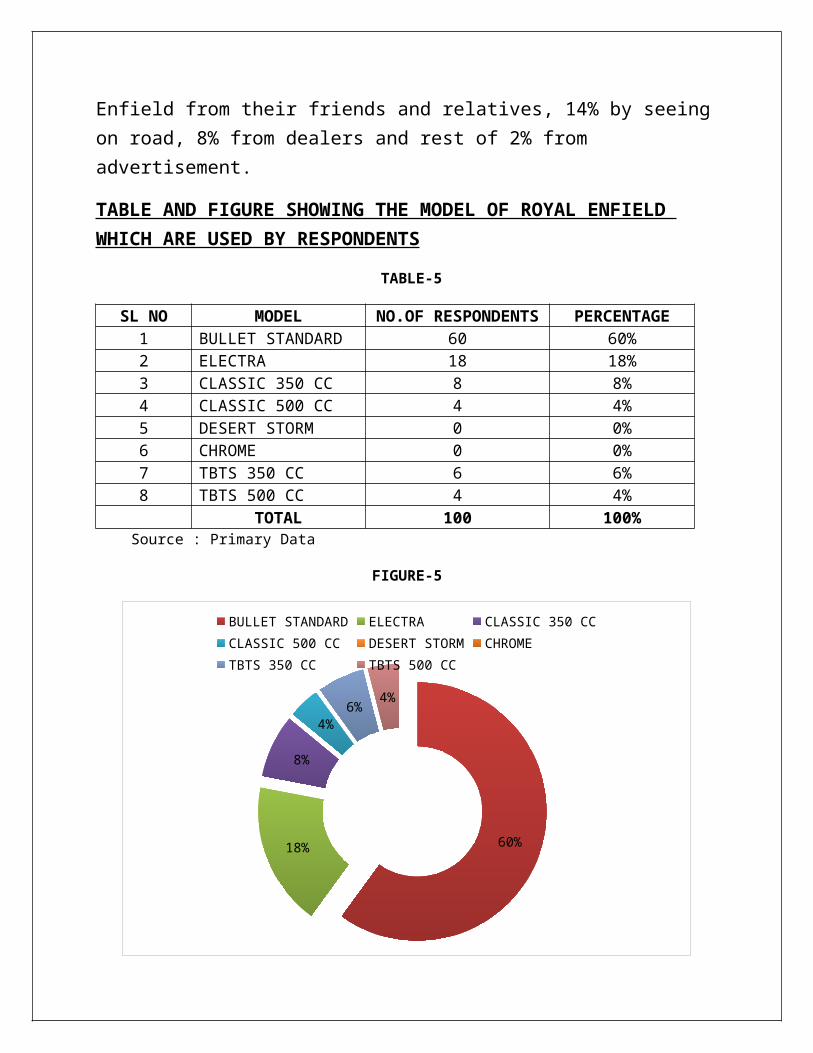
TABLE AND FIGURE SHOWING THE MODEL OF ROYAL ENFIELD WHICH ARE USED BY RESPONDENTS
TABLE-5
SL NO MODEL NO.OF RESPONDENTS PERCENTAGE
1 BULLET STANDARD 60 60%2 ELECTRA 18 18%3 CLASSIC 350 CC 8 8%4 CLASSIC 500 CC 4 4%5 DESERT STORM 0 0%6 CHROME 0 0%7 TBTS 350 CC 6 6%8 TBTS 500 CC 4 4%
TOTAL 100 100% Source : Primary Data
FIGURE-5
60%18%
8%
4%6%
4%
BULLET STANDARD ELECTRA CLASSIC 350 CC CLASSIC 500 CCDESERT STORM CHROME TBTS 350 CC TBTS 500 CC
INTERPRETATION:
It is clear that 70% of respondents are using Bullet Standard, 18% are using Electra, 8% are using Classic 350 CC, 4% are using Classic 500 CC, 6% are using TBT 350 CC, 4% are using TBT 500 CC and no respondents under study are using the models like Chrome and Desert Storm.
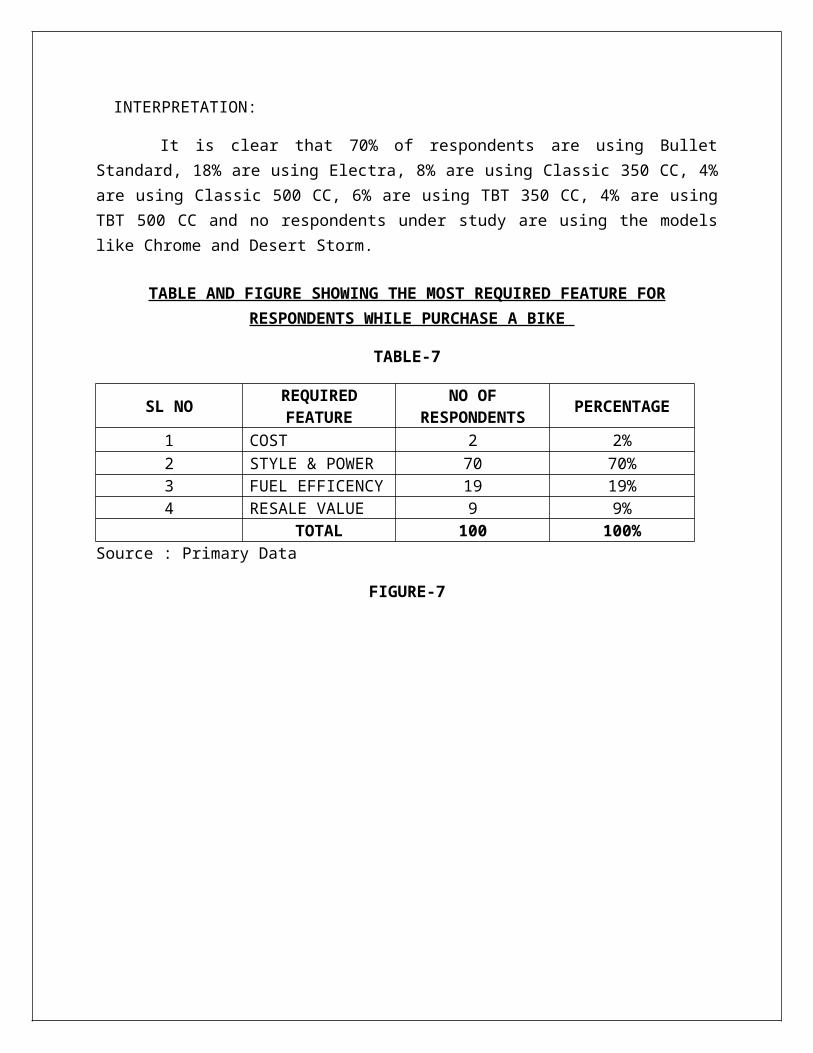
TABLE AND FIGURE SHOWING THE MOST REQUIRED FEATURE FOR RESPONDENTS WHILE PURCHASE A BIKE
TABLE-7
SL NO REQUIRED FEATURE
NO OF RESPONDENTS PERCENTAGE
1 COST 2 2%2 STYLE & POWER 70 70%3 FUEL EFFICENCY 19 19%4 RESALE VALUE 9 9%
TOTAL 100 100%Source : Primary Data
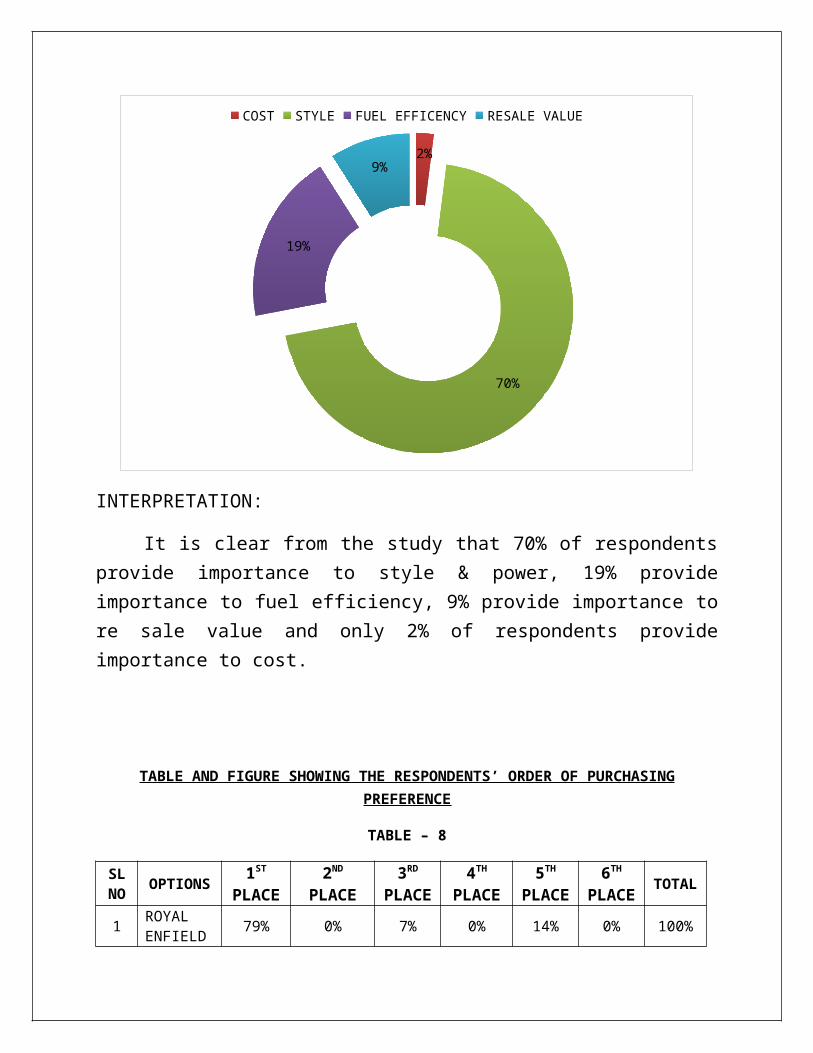
FIGURE-7
2%
70%
19%
9%
COST STYLE FUEL EFFICENCY RESALE VALUE
INTERPRETATION:
It is clear from the study that 70% of respondents provide importance to style & power, 19% provide importance to fuel efficiency, 9% provide importance to re sale value and only 2% of respondents provide importance to cost.
TABLE AND FIGURE SHOWING THE RESPONDENTS’ ORDER OF PURCHASING PREFERENCE
TABLE – 8
SL NO OPTIONS 1ST
PLACE2ND
PLACE
3RD
PLACE
4TH
PLACE
5TH
PLACE
6TH
PLACE
TOTAL
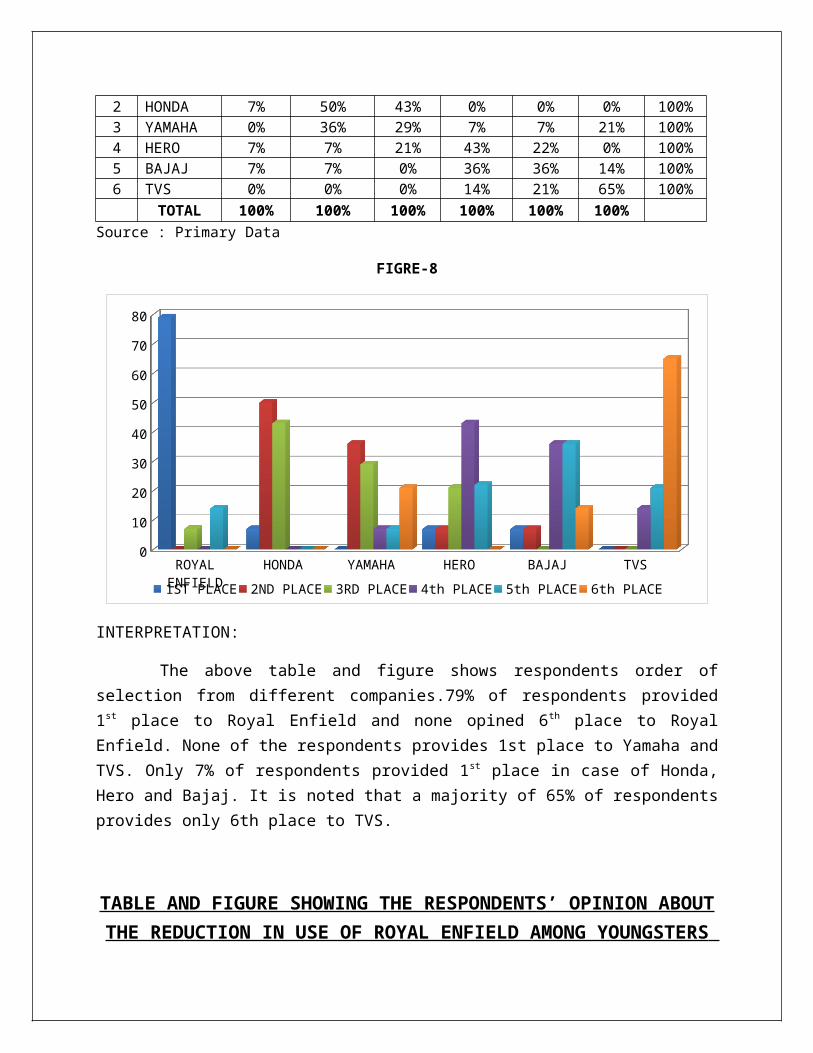
1 ROYAL ENFIELD 79% 0% 7% 0% 14% 0% 100%
2 HONDA 7% 50% 43% 0% 0% 0% 100%3 YAMAHA 0% 36% 29% 7% 7% 21% 100%4 HERO 7% 7% 21% 43% 22% 0% 100%5 BAJAJ 7% 7% 0% 36% 36% 14% 100%6 TVS 0% 0% 0% 14% 21% 65% 100%
TOTAL 100% 100% 100% 100% 100% 100%Source : Primary Data
FIGRE-8
ROYAL ENFIELD HONDA YAMAHA HERO BAJAJ TVS0
10
20
30
40
50
60
70
80
1ST PLACE 2ND PLACE 3RD PLACE 4th PLACE 5th PLACE 6th PLACE
INTERPRETATION:
The above table and figure shows respondents order of selection from different companies.79% of respondents provided 1st place to Royal Enfield and none opined 6 th place to Royal Enfield. None of the respondents provides 1st place to Yamaha and TVS. Only 7% of respondents provided 1st place in case of Honda, Hero and Bajaj. It is noted that a majority of 65% of respondents provides only 6th place to TVS.
TABLE AND FIGURE SHOWING THE RESPONDENTS’ OPINION ABOUT THE REDUCTION IN USE OF ROYAL ENFIELD AMONG
YOUNGSTERS
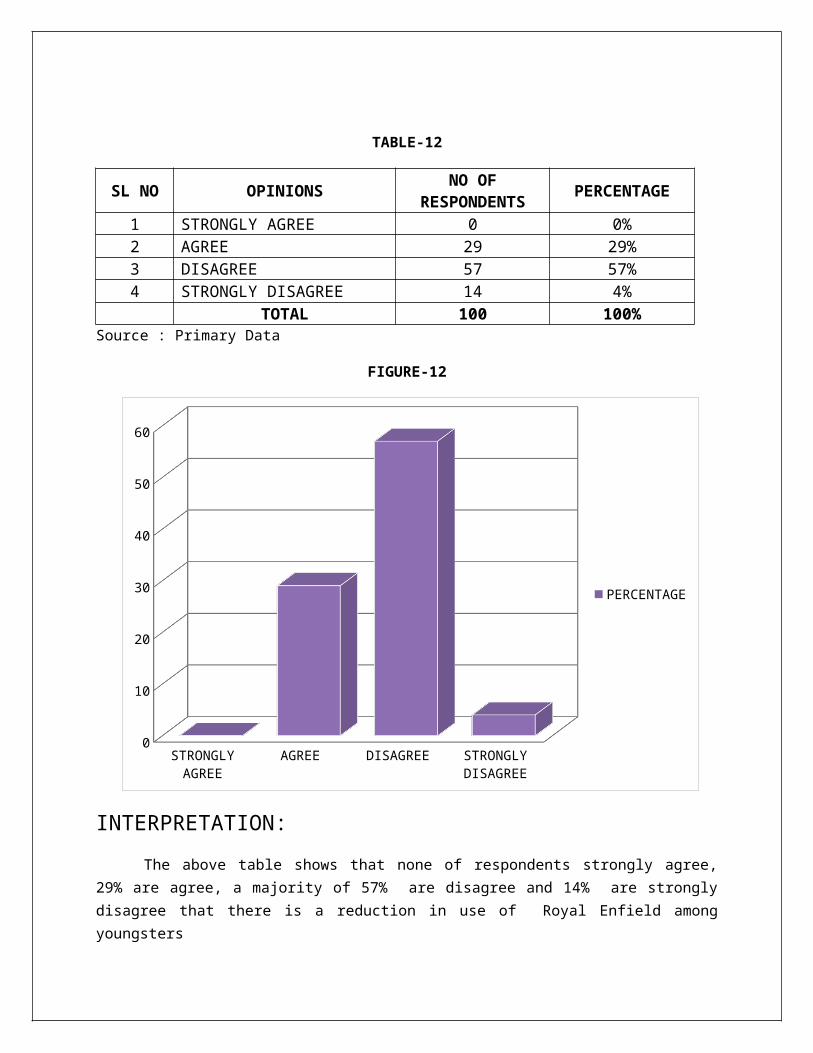
TABLE-12
SL NO OPINIONS NO OF RESPONDENTS PERCENTAGE
1 STRONGLY AGREE 0 0%2 AGREE 29 29%3 DISAGREE 57 57%4 STRONGLY DISAGREE 14 4%
TOTAL 100 100%Source : Primary Data
FIGURE-12
STRONGLY AGREE AGREE DISAGREE STRONGLY DISAGREE
0
10
20
30
40
50
60
PERCENTAGE
INTERPRETATION:
The above table shows that none of respondents strongly agree, 29% are agree, a majority of 57% are disagree and 14% are strongly disagree that there is a reduction in use of Royal Enfield among youngsters
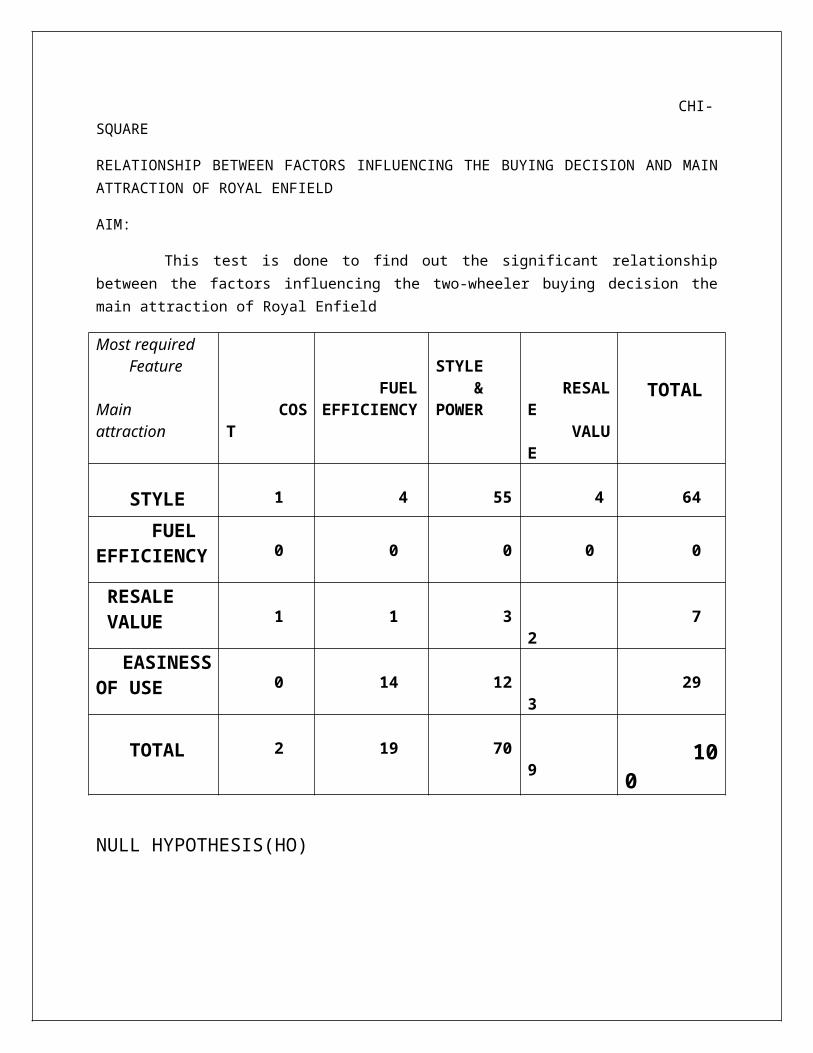
CHI-SQUARE
RELATIONSHIP BETWEEN FACTORS INFLUENCING THE BUYING DECISION AND MAIN ATTRACTION OF ROYAL ENFIELD
AIM:
This test is done to find out the significant relationship between the factors influencing the two-wheeler buying decision the main attraction of Royal Enfield
Most required Feature
Mainattraction
COST
FUELEFFICIENCY
STYLE &POWER
RESALE VALUE TOTAL
STYLE 1 4 55 4 64
FUELEFFICIENCY 0 0 0 0 0
RESALE VALUE 1 1 3 2 7
EASINESS OF USE 0 14 12 3 29
TOTAL 2 19 70 9 100
NULL HYPOTHESIS(HO)
There is no significant relationship between the factors influencing buying decision and the main attraction of Royal Enfield.
ALTERNATIVE HYPOTHESIS(H1)
There is significant relationship between the factors influencing buying decision and the main attraction of Royal Enfield.
Chi-square calculation
O E O-E (O-E)2 (O-E)2/E
1 1.46 -.46 0.2116 0.1449
0 0 0 0 0
1 0.14 0.86 0.7396 5.2829
0 0.58 -.58 0.3364 0.58
4 12.16 -8.16 66.5856 5.4758
0 0 0 0 0
1 1.33 -.33 0.1089 0.0819
14 5.51 8.49 72.0801 13.0817
55 44.8 10.2 104.04 2.3223
0 0 0 0 0
3 4.9 -1.9 3.61 0.7367
12 20.3 -8.3 68.89 3.3936
4 5.76 -1.76 3.0976 0.5378
0 0 0 0 0
2 0.63 1.37 1.876 2.9778
3 2.61 0.39 0.1521 0.0583
100.18 34.6737
Level of significance of χ2 =0.05 choose to test
Formula is χ2=(O-E)2/E
O=Observed frequency
E=Expected frequency
E=Row total*Column total/Grand total
Degree of freedom=(r-1)(c-1)=(4-1)(4-1)
=3*3
=9
Table value of Chi-square at 5% level of significance at 9 degree of freedom(Chi square value)=16.919
Computed value=34.6737
INFERENCES
Since the calculated value is greater than the table value, we accept the alternative hypothesis (H1) that there is no significant relationship between the factors influencing buying decision(required feature) and the main attraction of Royal Enfield.
FINDINGS
It is clear from the study that a majority having 76% of respondents had heard about Royal Enfield from their friends and relatives.
Advertisement is rare in case of Royal Enfield.
Majority of Royal Enfield customers are giving importance to style and power. Style and power is the main attraction of Royal Enfield.
Whole customers are satisfied in the resale value of Royal Enfield. It also
shows that the second hand market for Royal Enfield is satisfactory.
CONCLUSION
By the project entitled “A STUDY ON CUSTOMER PERCEPTION TOWARDS ROYAL ENFIELD
WITH SPECIAL REFERENCE TO MALAPPURAM DISTRICT” was undertaken with the
objective of finding out customer’s perception level on Royal Enfield bikes. Here
adopted suitable methodology for data collection and analysis. It is clear from the study
that the most customers of Royal Enfield are highly satisfied in almost all areas offered
by Royal Enfield. And most majorities among the satisfied customers are delighted
customers. This study reveals that by way of reducing the lead-time, improving fuel
efficiency, service and advertisement and by introducing new models capable to
compete with the fresher’s in the market, Royal Enfield can easily make the whole
customers into highly delighted customers.
REFERENCES
TEXT BOOKS
MARKETING MANAGEMENT. -Kotler Philip
Pearsons Education-Singapore. Pvt.Ltd. (12th edition-2006).
-Rajan Saxena
Tata Mc Graw, Hill publishing Co. New Delhi (2nd edition-2002).
-Sonatakki.C.N
Kalyani Publishers, New Delhi-2001.
SERVICE MARKETING. -S.M.Jha
Himalaya Publishing House, Mumbai (2009).
MARKETING AND BRANDING; THE INDIAN SCENARIO. -Ramesh Kumr.S
Pearsons Education-Singapore. Pvt.Ltd (2007).
RESEARCH METHODOLOGY -C.R.Kothari
New Age publication-New Delhi (2nd Edition-2005)
WEBSITES
Official website or Royal Enfield.
Investopedia.
Wikipedia.