Embed Size (px)
Citation preview

•
ZO OGC
No. 324
, d Ecology of
'ida : 0 · goc aeta) is osal S·tes ofW st Benga
ei Mic 0 ial Associa · on
.K. HAZRA&A.P. NANDI
U V I YOFIND A

OCCASIONAL PAPER No. 324
RECORDS OF THE
ZOOLOGICAL SURVEY OF INDIA
On TaxonoDlY and Ecology of Earth",orllls (Annelida: Oligo chaeta) frolll Uncultivated
and Waste Disposal Sites of West Bengal mth sOllle notes on their
Microbial Association
A. CHOWDHURY Dept. of Zoology, East Calcutta Girls' College, Lake Town, Kolkata 700 089
A.K. HAZRA AL 262, Sector II, Salt Lake City, Kolkata 700 091
A.P. NANDI* Dept. of Zoology, University of Burdwan, Burdwan 713 104
Edited by the Director, Zoological Survey of India, Kolkata
~~
Zoological Survey of India Kolkata

CITATION
Chowdhury, A., Hazra, A.K. and Nandi, A.P. 2011. On Taxonomy and Ecology of Earthworms (Annelida: Oligochaeta) from Uncultivated and Waste Disposal Sites of West Bengal with some notes on their Microbial Association. Rec. zool. Surv. India, Occ. Paper No., 324 : 1-190, (Published by the Director, Zool. Surv. India, Kolkata)
Published : February, 2011
ISBN 978-81-8171-284-4
© Govt. of India, 2011
ALL RIGHTS RESERVED
• No Part of this publication may be reproduced, stored in a retrieval system or transmitted in any form or by any means, electronic, mechanical, photocopying, recording or otherwise without the prior permission of the publisher.
• This book is sold subject to the condition that it shall not, by way of trade, be lent, resold, hired out or otherwise disposed off without the publisher's consent, in a form of binding or cover other than that in which, it is published.
• The correct price of this publication is the price printed on this page. Any revised price indicated by a rubber stamp or by a sticker or by any other means is incorrect and should be unacceptable.
PRICE Indian ~ 500.00
Foreign $ 50 £ 40
Published at the Publication Division, by the Director, Zoological Survey of India, 234/4 A.J .C. Bose Road, 2nd MSO Building, Nizam Palace (13th floor), Kolkata 700 020 and printed at Typographia, Kolkata 700 012.

RECORDS OF THE
ZOOLOGICAL SURVEY OF INDIA OCCASIONAL PAPER
No. 324 2011 Page 1-190
CONTENTS
INTRODUCTION .................................................................................................................. 1
MATERIALS AND METHODS ........................................................................................... 2
OBSERVATIONS .................................................................................................................. 3
TAXONOMY ......................................................................................................................... 3
SYSTEMATIC ACCOUNT ................................................................................................... 5
ECOLOGY OF EARTHWORM FAUNA AND MICROBIAL
FLORA IN STUDIED SITES ............................................................................................. 18
SITE - I - DHAPA, MUNICIPAL WASTES DISPOSAL SITE,
OF KOLKATA (DP) ............................................................................................................ 18
SITE - II - MADHYAMGRAM, UNCULTIVATED FIELD,
NORTH 24 PGS. (MD) ...................................................................................................... 21
SITE - III - BETHUADAHARI RESERVE FOREST, NADIA (BRF) .......................... 24
STATISTICAL ANALYSIS OF DATA ............................................................................ 27
LINEAR CORRELATION ................................................................................................. 27
ANALYSIS OF VARIANCE ............................................................................................. 30
STEP REGRESSION ANALYSIS ...................................................................................... 31
DISCUSSION ...................................................................................................................... 34
SUMMARY ........................................................................................................................ 50
ACKNOWLEDGEMENTS ................................................................................................... 53
REFERENCES ...................................................................................................................... 54
MAP........................................................................................................................... ......... 7 3
TABLES .............................................................................................................................. 74
FIGURES .......................................................................................................................... 140
PlATES ......................................................................................................................... I -XXI

INTRODUCTION Systematic studies of earthworms of the Indian subcontinent were initiated by
Templeton (1844). There after a series of workers have published on earthworm taxonomy viz. Perrier (1872), Beddard (1883, 1895, 1900, 1901, 1902), Michaelsen (1900, 1909a, b, 1913), Stephenson (1913, 1916, 1917, 1920, 1922a, b, 1923, 1930), Gates' (1937a, b, 1938a, b, 1972), Tembe and Dubash (1961), Halder and Julka (1967), Soota and Julka (1970, 1972), Julka (1975a, b, 1976a, b, 1977, 1978, 1979, 1981a, b, 1983, 1988, 1993a, b, c, 1995, 2001, 2005), Julka and Halder (197sa, b, 1977), Soota and Halder (1977a, b, 1980a, b, 1981), Kale and Krishnamoorthy (1978), Julka and Rao (1982), Ismail and Murthy (1985), Ismail (1986), Julka and Chandra (1986), Julka and Senapati (1987), Julka and Paliwal (1989b, 1993, 1994), Julka et ale (1989), Bano and Kale (1991), Julka et ale (1997), Blanchart and Julka (1997), Halder (1998, 1999, 2000), Patnaik et ale (2004), Tripathi and Bhardwaj (2004), Chowdhury and Hazra (2009).
Charles Darwin (1881) perhaps first discovered the relationship between earthworm and soil fertility. There after several workers have studied on ecology of earthworm fauna as well as microbial communities in soil of different ecological sites in India and abroad viz. Bassalik (1913), Stockli (1928), Evans (1948a, b), Hopp and Slater (1948, 1949), Joshi and Kelkar (1952), Roy (1957), Khambata and Bhatt (1957), Satchell (1958, 1960, 1980, 1983a), Gates (1961), Parle (1963a, b), Dash and Cragg (1972), Huntjens (1972), Dash et ale (1974, 1979), Alexander (1977), Dash and Patra (1977, 1979), Laudelout et ale (1978), Rahno et ale (1978), Senapati et ale (1979, 1999, 2002), Verma and Chauhan (1979), Chauhan (1980), Dash and Senapati (1980, 1981, 1982, 1986), Behera and Dash (1981), Kale and Krishnamoorthy (1981, 1982), Kaleemurrahman and Ismail (1981), Senapati and Dash (1981, 1983, 1984, 1991), Ghabbour and Shakir (1982), Choudhuri and Mitra (1983), Julka et ale (1983), Lee (1983, 1985, 1987), Julka and Mukherjee (1984), Mishra and Dash (1984), Sahu and Senapati (1986, 1991), Christensen (1987, 1991), Huhta and Kulmala (1987), Scheu (1987), Edwards and Fletcher (1988), Krishnamoorthy and Ramachandra (1988), Sahu et ale (1988), Bhadauria and Ramakrishnan (1989), Julka and Paliwal (1989a), Tiwari et ale (1989, 1992), Hazra and Choudhuri (1990), Ismail et ale (1990), Senapati and Sahu (1991, 1993), Darlong and Alfred (1991), Marinissen (1991), Daniel and Anderson (1992), Kristufek et ale (1992), Pal et ale (1992), Bhadauria et ale (1997), Lavelle et ale (1998, 2000, 2003), Brown et ale (1999), Senapati (1999), Haynes et ale (2003), Hubers et ale (2003), Shuster et al. (2003), Kale and Dinesh (2005), Chowdhury et ale (2007).

2 Rec. zool. Suru. India, Occ. Paper No. 324
Several authors have studied the impact of heavy metals on earthworm fauna and soil microflora viz. Gish and Christensen (1973), Van Hook (1974), Van Rhee (1975, 1977), Ireland (197sa, b, 1979, 1983), Ireland and Wooton (1976), Ireland and Richards (1977), Anderson (1979, 1980), Carter et ale (1980, 1983), Curry and Cotton (1980), Hartenstein et a1. (1980), Ma (1982), Malecki et ale (1982), Morgan and Morgan (1999), Hazra and Bhattacharyya (2003), Homa et ale (2003), Nahmani et ale (2003), Chowdhury and Hazra (2007).
The review of literature revealed that in India the research work on these fields either lacking or fragmentary. No consolidated work has been carried out on taxonomy, ecology, impact of heavy metals and soil microorganisms in respect to earthworm. Therefore to fill up these lacunae the authors made the present investigation in order to have more or less comprehensive picture on soil bacteria, actinomycetes, fungi, and earthworm in relation to different biotic and abiotic factors and polluting agents like heavy metal contaminated soil. In this context the present investigation· has been conducted in three different habitats of West Bengal with the following objectives:
1. To study the taxonomy, diversity, seasonal abundance and population fluctuation of earthworm fauna in three different ecological sites.
2. To ascertain the quantitative and qualitative composition and population fluctuation of fungi and bacteria-actinomycetes communities of these sites.
3. To evaluate the soil factors like temperature, relative humidity, pH, electrical conductivity, organic Carbon, Nitrate, Phosphate, Potassium and their impact on the population and distribution pattern of earthworm fauna as well as on soil microorganisms.
4. To analyze the heavy metal pollution (viz. Cadmium, Zinc, Lead and Copper) on soil and its effects on earthworm and microbial popUlation.
5. To correlate these edaphic factors on the fluctuation of population of earthworm and microorganisms by statistical means.
MATERIALS AND METHODS Collection, narcotisation and preservation of earthworm samples were carried out
following Julka (1988). Collection, preparation and analysis of soil samples was done by adopting the standard methodology as described in Basak (2000). Mechanical analysis of soil has been done by Hydrometer method (Piper, 1942). Soil thermometer was used to record the temperature of the soil. Soil relative humidity was measured by dial hygrometer (HUGER - 85 mm - MODEL - 8265). pH of the soil was determined in water by the electronic pH meter Model No. 335 - Systronics). Electrical conductivity of the

CHOWDHURY et. ale : On Taxonomy and Ecology of Earthworms (Annelida : Oligochaeta) ... 3
soil was determined by direct reading conductivity meter (Model No. 304 - Systronics, conductivity cell type C. 0-10). Analysis of soil Zn, Cd, Pb and Cu was done after acid (Nitric and Perchloric) digestion by using a Varian Techtron AA - 575 atomic absorption spectrophotometer in R.S.I.C, Bose Institute, Kolkata. Cultivation and isolation of microorganisms has been done as per Kanwar et ale (1997). Identification of fungi has been made as per Alexopoulos et ale (1996) and bacteria-actinomycetes genera have identified by series of biochemical tests as per Kanwar et ale (1997) and Bergey's Manual of Determinative Bacteriology (Holt et al., 2000).
OBSERVATIONS TAXONOMY
Earthworm samples collected randomly from three different habitats viz. Municipal wastes disposal site at Ohapa, Kolkata (DP); uncultivated field site at Madhyamgram, North 24 Pgs. District (MD) and Bethuadahari Reserve Forest, Nadia District (BRF) for taxonomic study.
A key to the identification of earthworms of studied agroecosystems and waste disposal site in West Bengal
1. Male pores in intersegmental furrow 10/11 ............... 2. (Family: Moniligastridae).
Male pores behind segment xvi ................................................................................. 3.
2. Male pores superficial in a semicircular arch ........... Drawida papillijer papilliJer.
Male pores distinct on markedly protuberant porophores ..... Drawida nepalensis.
3. Setae 4 pairs on each segment; prostate tubular ......... 4. (Family: Octochaetidae).
Setae numerous on each segment; prostate racemose ..................................... ~ ...... 8 (Family: Megascolecidae).
4. Male and prostatic pores on segment xvii; seminal grooves absent ....................... 5.
Male pores on segment xviii; prostatic pores at the end of sem\nal grooves on t .. d' 7 segmen s XVII an XIX •••••••••••••••••••••••••••••••••••••••••• 0-...................................................... .
5. Male pores discharge directly on body surface on low circular porophores (avestibulate), penes absent ............................................. Eutyphoeus incommodus.
Male pores discharge into deep paired copulatory pouches (vestibulate), each pore on posterior wall of an annular to elongate pene .................................................... 6.
6. Spermatheal pores at ab; penes elongate and tubular ....... Eutyphoeus nicholsoni.
Spermathecal pores at be; penes annular .............................. Eutyphoeus orientalis.

4 Rec. zool. Surv. India, Dcc. Paper No. 324
7. Spermathecal pores median to a line, close to midventralline; no setae on segments viii and ix copulatory; seminal grooves at or median to a line . .......... Octochaetona beatrix.
Spermathecal pores minute, at ab, setae a, b on segments viii and ix copulatory and surrounded by well developed tumescences; seminal grooves at or median to b line . .... .... ........ .... ...... ...... .......... .... ...... ... ........ ................. ..... ............ Octochaetona surensis.
8. First dorsal pore at or anterior to intersegmental furrow 5/6 ................................ 9·
First dorsal pore at or posterior to intersegmental furrow 9/10 .......................... 10.
9. Male pores on slightly raised circular to oval areas, penes absent; penial setae present ......................................................................................... Perionyx excavatus.
Male pores at the base of elongate and medially grooved penes arising from center of a cushion like large porophores; penial setae absent .......... Perionyx simlaensis.
10. Clitellum on segments xiii-xvii; female pores paired; penial setae present. L 't 't" .............................................................................................. ........... ampz 0 maurz II.
Clitellum on segments xiv-xvi; female pore single; penial setae absent ............... 11.
11. Male pores discharging directly onto body surface .................... Amynthus corticis.
Male pores discharging into copulatory pouches opening onto body surface through secondary male pores .............................................................................................. 12.
12. External genital markings absent; spermathecal pores 3 pairs at intersegmental furrows 6/7/8/9 ........................................................................... Metaphire houlleti.
External genital markings present; spermathecal pores otherwise ..................... 13.
13. Spermathecal pores in paired groups of 2-5, at intersegmental furrows 5/6/7 or absent; openings of male copulatory pouches longitudinal; cresentic genital markings usually in some or all of segments xix-xxiv ...... Polypheretima .elongata.
Spermathecal pores 4 paired, at intersegmental furrows 5/6-8/9; opening of male copulatory pouches circular; genital markings usually on segments xvii and xix . ................................................................................................... Metaphire posthuma.

CHOWDHURY et. al. : On Taxonomy and Ecology of Earthworms (Annelida : Oligochaeta) ... 5
SYSTEMATIC ACCOUNT Class Oligochaeta
Order MONILIGASTRIDA
I. Family MONILIGASTRIDAE
1. Genus Drawida Michaelsen, 1900
1. Drawida nepalensis Michaelsen, 1907
(Plate Ia and b)
1907. Drawida nepalensis Michaelsen, Mitt. Naturh. Mus. Hamb., 24 : 146. (Type locality: Gowchar
near Katmandu, Nepal; types in Zoological Survey of India, Kolkata).
1995. Drawida nepalensis, Reynolds, Julka and Khan, Megadrilogica, 6 (6) : 56.
Diagnosis : Length 45-132 mm; diameter 2-4.5 mm. Segments 115-166. Setae lumbricine. Clitellum ix-xiv. Setae aa = or slightly >or <bc, dd; ca. = or slightly> 1/2 c. One small, circular, translucent genital marking, lateral to each male porophore, another similar one on vii, just anterior to each spermathecal pore. Nephropores at or near d. Spermathecal pores paired, small transverse slits, at 7/8, just median to c. Female pores paired, at b in 11/12. Male pores paired, at or median to bc in 10/11, on markedly protuberant porophores.
Septa all present from 4/5, 5/6-9/10 muscular. Gizzards 2-4, in xii-xx; intestinal origin in xxvii or xxviii. Intestinal caeca and supra-intestinal glands absent. Holonephridia in iii and posteriad segments. Nephridia of x lacking in adults. Capsular prostates paired, in x. Prostates glandular; prostatic capsule 2-4 mm long, club-shaped. Spermathecal ampulla irregularly pear-shaped; diverticulum sac-like, in vii. Genital marking glands solid, spheroidal.
Material Examined : 4 exs, MD; 14. x. 2001; 3 exs, MD; 11. xi. 2001; 6 exs, MD; 13. i. 2002; 8 exs, MD; 20. x. 2002; 10 exs, MD; 12. i. 2003; 4 exs, BRF; 18. viii. 2002;
14 exs, BRF; 19. i. 2003. A. Chowdhury collected all specimens.
Distribution : INDIA: West Bengal (North 24 Pgs., Nadia, I<.olkata, Bankura, Coochbehar, Darjeeling, Jalpaiguri); Andaman and Nicobar Islands; Assam; Bihar; Himachal Pradesh; Meghalaya; Sikkim; Uttar Pradesh.
Elsewhere: PAKISTAN; NEPAL; BANGLADESH; MYANMAR; INDONESIA.
Re.marks : No appreciable variation was observed in the present material. Only four specimens observed which have no genital markings.

6 Rec. zool. Suru. India, Dcc. Paper No. 324
2. Drawida papillijer papillijer Stephenson, 1917
(Plate IIa and b) 1917. Drawida papillifer Stephenson, Rec. Indian Mus., 13 : 370. (Type locality : Rangamati,
Chittagong Hill Tracts, BangIa Desh; Types in Zoological Survey of India, Kolkata.)
1995. Dr(lwida papillijer papillijer, Reynolds, Julka and Khan, Megadrilogica, 6 (6) : 56.
Diagnosis : Length 60-130; diameter 3-5 mm, Segments 110-165. Clitellum, red, ix-xiv. Colour bluish. Setae lumbricine. Setae, aa < be, dd = or > 1/2 c. Male pores, very small, superficial, without protrusible porophore, paired, in x, at or just lateral to b or nearer to middle of bc, each in a whitened semicircular area with base at 10/1!. Spermathecal pores paired in 7/8, very small, at or slightly median to c. Genital markings, small, nearly circular transverse areas of translucence, in vii-viii and x-xi near spermathecal and male pores, occasionally in other positions on vii-xii. Nephropores at or near d, somewhat more dorsal in viii.
Septa 5/6-9/10 muscular. Gizzards, 2-4, in xiii-xx. Intestinal origin, in xxiii or xiv. Intestinal caeca and supra-intestinal glands absent. Holonephric. Sperm ducts, short,
• 4
5-10 mm long. Paired capsular prostates, in x. Prostates, 2-3 mm long. Spermathecal diverticula, saccular, with a short stalk, in vii. Genital marking glands, small, spheroidal, beneath longitudinal musculature.
Material Examined. : 54 exs, MD; 14. x. 2001; 35 exs, MD; 13. i. 2002; 19 exs, MD; 14. iv. 2002; 13 exs, MD; 11. viii. 2002; 48 exs, MD; 12. i. 2003; 28 exs, MD; 9. ii. 2003. A. Chowdhury collected all specimens.
Distribution: INDIA: West Bengal (North 24 Pgs.); Meghalaya.
Elsewhere: BANGLADESH; MYANMAR.
Remarks: In India, so far, this species was known to occur only from Meghalaya. In this study it is newly recorded from West Bengal. No appreciable variation was observed in the present material.
Order HAPLOTAXIDA
Suborder LUMBRICINA
Superfamily MEGASCOLECOIDEA
II. Family OCTOCHAETIDAE
2. Genus: Eutyphoeus Michaelsen, 1900.
3· Eutyphoeus incommodus (Beddard, 1901)
(Plate III a and b) 1901. Typhoeus incommodus Beddard, Proc. Zool. Soc. Lond., 1901 : 200. (Type locality.: Kolkata,
West Bengal; typus amissus.)

CHOWDHURY et. ale : On Taxonomy and Ecology of Earthworms (Annelida : Oligochaeta) ... 7
1903. Eutyphoeus incommodus, Michaelsen, Die geogr. Verbr. der Oligochaten : 109.
1988. Eutyphoeus incommodus, Julka, Fauna of India, Megadrile Oligochaeta, 1 : 145-
Diagnosis : Length 38-137 mm; diameter 2.5-5.5 mm. Segments 83-166. Setae lumbricine. Clitellum annular; xiii, 1/2 xiii-xvii, xviii. Paired genital markings, postsetal in ab, on xii, xiii-xvi. Dorsal pores present, first dorsal pore generally at 11/12,
occasionally at 10/11. Spermathecal pores paired, small, transverse slits, slightly lateral to b in 7/8. Male pores paired, near to paired prostatic pores on xvii. Female pores paired, presetal, on xiv, at or slightly median to u. Avestibulate and apenile; male pores within slight transversely placed fissures, at or close to h, each fissure at the centre of a discshaped to slightly conical porophore.
Oesophagus with a single gizzard between septa 5/6 and 8/9, one pair of discrete, i"ntramural calciferous glands in xii. Intestine begins in xv; Lateral intestinal caeca lacking; ventral intestinal caeca 3-9 in xxvii-xxxvi; supra-intestinal glands 3-6 pairs in lxii-Ixxv; typhlosole simple, lamelliform, begins in xxv-xxvi. Dorsal blood vessel extends anterior to gizzard into iii; last pair of hearts in xiii. Holandric; testes and male funnels enclosed in annular sacs, in x and xi; seminal vesicles in ix and xii, extending posteriorly to xiii. Prostates paired, prostatic duct 2-6 mm long, slender. Penial setae almost straight, distal end slightly curved; tip bluntly rounded; ornamented. Prostates tubular. Spermathecae paired, in viii; ampulla globular, duct straight; polydiverticulate.
Material Examined: 2 exs, BRF; 18. v. 2003; 10 exs, BRF; 15. vi. 2003; 5 exs, BRF; 20. vii. 2003; 27 exs, MD; 10. vi. 2001; 26 exs, MD; 12. viii. 2001; 64 exs, MD; 9. ix. 2001;
44 exs, MD; 14. x. 2001; 11 exs, MD; 12. v. 2002; 14 exs, MD; 8. xii. 2002; 8 exs, MD; 9. iii. 2003. A. Chowdhury collected all specimens.
Distribution : INDIA: West Bengal (North 24 Pgs., Nadia, Kolkata, Birbhum, Murshidabad, West Dinajpur); Bihar; Hariana; Himachal Pradesh; Orissa; Punjab; Rajasthan; Uttar Pradesh.
Elsewhere: PAKISTAN.
Remarks: No appreciable variation was observed in the present material. So~e variations were observed in the position of genital markings. Two specimens having paired genital markings extended to xvii and xviii.
4. Eutyphoeus nicholsoni (Beddard, 1901)
(Plate IVa and b)
1901. Typhoeus nicholsoni Beddard, Proc. Zool. Soc. Lond., 1901 : 206. (Type locality: Kolkata, West
Bengal, India; typus amissus.)

8 Rec. zool. Surv. India, Occ. Paper No. 324
1903. Eutyphoeus nicholsoni, Michaelsen, Die geogr. Verbr. der Oligochaten : 109.
1988. Eutyphoeus nicholsoni, Julka, Fauna of India, Megadrile Oligochaeta, 1 : 158.
Diagnosis : Length 138-175 mm; diameter 5-5 mm. Segments 179-205. Setae lumbricine. Clitellum annular, xiii-xvii. Setae a b <e d <b c < a a. Genital markings paired, circular or oval, in 15/16. Dorsal pores present, first dorsal pore at 11/12. Spermathecal pores paired, at ab, in 7/8. Male pores paired, near to paired prostatic pores on xvii. Female pore single, on left side of xiv, presetal, at a. Bivestibulate and penile; vestibula deep and well-like, apertures transversely slit-like about in ab; penes elongate, tubular each with a slit-like aperture at the tip.
Oesophagus with a single gizzard between septa 5/6 and 8/9, one pair of discrete, intramural calciferous glands in xii. Intestine begins in xv. Lateral intestinal caeca lacking; median ventral intestinal caeca 24-30 in xxxv-Ixix; supra intestinal glands 4-7 pairs in lxxx-Ixxxxix, typhlosole simple, lamelliform, begins in xxviii-xxix. Dorsal blood vessel terminates posterior to gizzard in vii, rarely extending anteriorly to vi; last pair of hearts in xiii. Metandric; testis sac ventral; seminal vesicles in xii extending posteriorly to xiv. Prostates paired, coiled, duct muscular and long, in an S-shaped curve. Penial setae shaft nearly straight or gently curved ectally; tip bluntly rounded; ornamented. Prostates tubular. Spermathecal ampulla broad and lobed; polydiverticulate.
Material Examined: 3 exs, BRF; 18. v. 2003; 6 exs, BRF; 15. vi. 2003; 7 exs, BRF; 20. vii. 2003; 11 exs, BRF; 17. viii. 2003. A. Chowdhury collected all specimens.
Distribution: INDIA: West Bengal (Nadia, Kolkata, Birbhum, Murshidabad); Bihar; Uttar Pradesh; Madhya Pradesh; Himachal Pradesh.
Remarks : No appreciable variation was observed in the present material except 11 specimens where genital markings were absent.
5. Eutyphoeus orientalis (Beddard, 1883)
(Plate Va and b)
1883. Typhoeus orientalis Beddard. Ann. Mag. Nat. Hist., (ser. 5), 12 : 219. (Type locality: Kolkata, West Bengal, India; typus amissus.)
1900. Eutyphoeus orientalis, Michaelsen, Tierreich, 10 : 322.
1988. Eutyphoeus orienta lis , Julka, Fauna of India, Megadrile Oligochaeta, 1 : 161.
Diagnosis : Length 136-233 mm; diameter 5-8.5 mm. Segments 148-236. Setae lumbricin~. Clitellum annular, xiv-xvi. Genital markings paired, postsetal, ea, on xv-xvi and in 18/19-20/21, occasionally on ix-x, xiii-xiv.and 21/22-25/26. Dorsal pores present, first dorsal pore at 11/12. Spermathecal pores paired, in be, in 7/8. Female pore single, on left side of xiv., presetal at a. Bivestibulate and penile; penes short and annular, each
CHOWDHURY et. al. : On Taxonomy and Ecology of Earthworms (Annelida : Oligochaeta) ... 9
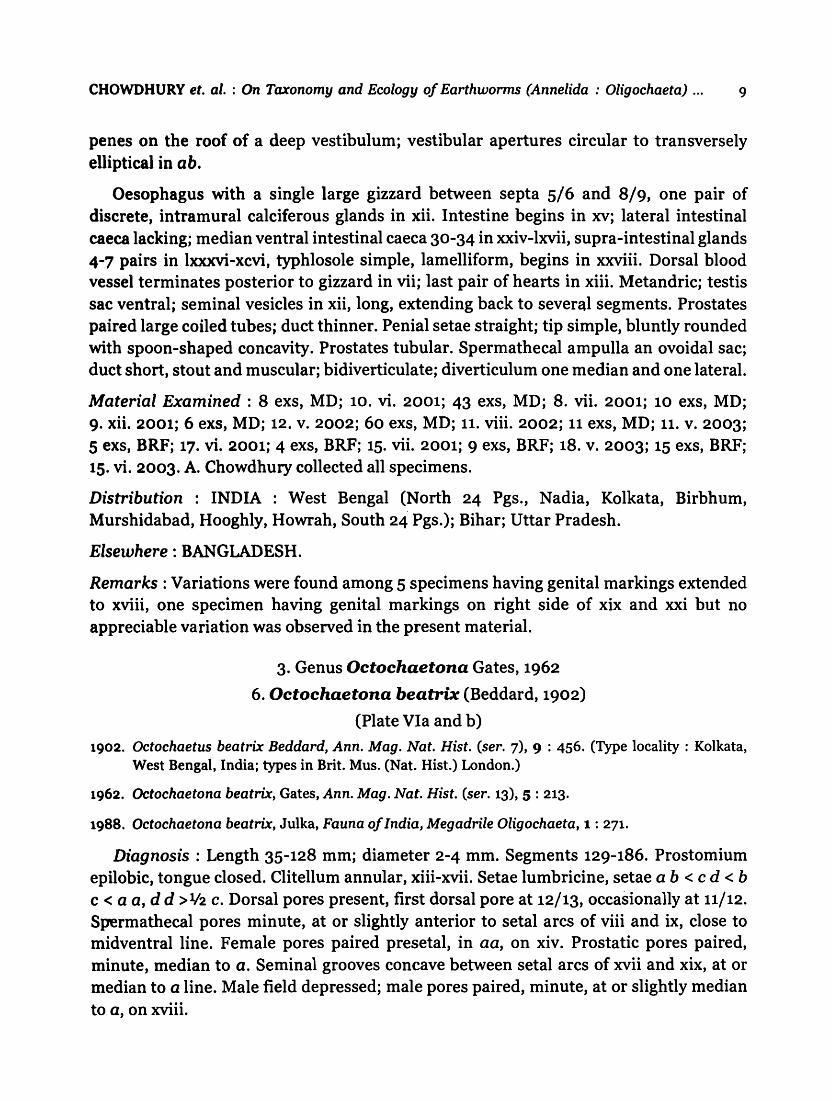
penes on the roof of a deep vestibulum; vestibular apertures circular to transversely elliptical in abo
Oesophagus with a single large gizzard between septa 5/6 and 8/9, one pair of discrete, intramural calciferous glands in xii. Intestine begins in xv; lateral intestinal caeca lacking; median ventral intestinal caeca 30-34 in xxiv-lxvii, supra-intestinal glands 4-7 pairs in lxxxvi-xcvi, typhlosole simple, lamelliform, begins in xxviii. Dorsal blood vessel terminates posterior to gizzard in vii; last pair of hearts in xiii. Metandric; testis sac ventral; seminal vesicles in xii, long, extending back to several segments. Prostates paired large coiled tubes; duct thinner. Penial setae straight; tip simple, bluntly rounded with spoon-shaped concavity. Prostates tubular. Spermathecal ampulla an ovoidal sac; duct short, stout and muscular; bidiverticulate; diverticulum one median and one lateral.
Material Examined: 8 exs, MD; 10. vi. 2001; 43 exs, MD; 8. vii. 2001; 10 exs, MD; 9. xii. 2001; 6 exs, MD; 12. v. 2002; 60 exs, MD; 11. viii. 2002; 11 exs, MD; 11. v. 2003;
5 exs, BRF; 17. vi. 2001; 4 exs, BRF; 15. vii. 2001; 9 exs, BRF; 18. v. 2003; 15 exs, BRF; 15. vi. 2003. A. Chowdhury collected all specimens.
Distribution : INDIA : West Bengal (North 24 Pgs., Nadia, Kolkata, Birbhum, Murshidabad, Hooghly, Howrah, South 24 Pgs.); Bihar; Uttar Pradesh.
Elsewhere: BANGLADESH.
Remarks: Variations were found among 5 specimens having genital markings extended to xviii, one specimen having genital markings on right side of xix and xxi but no appreciable variation was observed in the present material.
3. Genus Octochaetona Gates, 1962
6. Octochaetona beat"ri% (Beddard, 1902)
(Plate VIa and b) 1902. Octochaetus beatrix Beddard, Ann. Mag. Nat. Hist. (ser. 7), 9 : 456. (Type locality: Kolkata,
West Bengal, India; types in Brit. Mus. (Nat. Hist.) London.)
1962. Octochaetona beatrix, Gates, Ann. Mag. Nat. Hist. (ser. 13), 5 : 213.
1988. Octochaetona beatrix, Julka, Fauna of India, Megadrile Oligochaeta, 1 : 271.
Diagnosis: Length 35-128 mm; diameter 2-4 mm. Segments 129-186. Prostomium epilobic, tongue closed. Clitellum annular, xiii-xvii. Setae lumbricine, setae a b < cd < b c < a a, d d > 1/2 c. Dorsal pores present, first dorsal pore at 12/13, occasionally at 11/12.
Spermathecal pores minute, at or slightly anterior to setal arcs of viii and ix, close to midventral line. Female pores paired presetal, in aa, on xiv. Prostatic pores paired, minute, median to a. Seminal grooves concave between setal arcs of xvii and xix, at or median to a line. Male field depressed; male pores paired, minute, at or slightly median to a, on xviii.

10 Rec. zool. Surv. India, Dcc. Paper No. 324
Septa 5/6-7/8 absent and 4/5, 8/9-11/12 muscular. Gizzard between 4/5 and 8/9; calciferous glands one pair, discrete, extramural, shortly and slenderly stalked, asymmetrical, opening into oesophagus close to the attachment of septum, 15/16, one gland in xv and the other in xvi, intestinal origin in xvii; intestinal caeca and supra intestinal gla~ds absent; typhlo'sole lamelliform, ventrally bifid, in xxv to civ-cxii. Dorsal vessel single and complete, last pair of hearts in xiii. Metandric; testes and male funnels enclosed in a sub-oesophageal U -shaped sac, in xi, male funnels present in x; seminal vesicles small, in xii. Prostates paired in xvii and xix; duct thin and short. Penial setae curved; tip pointed; ornamented. Prostates tubular. Spermathecae paired, in viii and ix; ampulla small, ovoid, beneath the gut;· duct muscular and shorter than ampulla; unidiverticulate; diverticulum spherodial.
Material Examined: 4 exs, BRF; 18. viii. 2002; 1 ex, BRF; 15. ix. 2002; 2 exs, BRF; 20. vii. 2003; 3 exs, BRF; 17. viii. 2003; A. Chowdhury collected all specimens.
Distribution : INDIA : West Bengal (Nadia, Kolkata, Burdwan, Murshidabad, Darjeeling, South 24 Pgs.); Assam; Gujarat; Himachal Pradesh; Karnataka; Jammu and Kashmir; Rajasthan; Kerala; Madhya Pradesh; Maharashtra; Orissa; Punjab; Uttar Pradesh.
Elsewhere: PAKISTAN; NEPAL; MALAY PENINSULA; MYANMAR; PHILIPPINES.
Remarks: No appreciable variation was observed in the present material.
7. Octochaetona surensis (Michaelsen, 1910)
(Plate VIla and b)
1910. Octochaetus surensis Michaelsen, Abh. Geb. Naturw. Hamburg, 19 (5) : BB. (Type locality: Sur
Lake, Puri Dist., Orissa, India; Typus amissus).
1962. Octochaetona surensis, Gates, Ann. Mag. Nat. Hist. (ser. 13), 5 : 213.
19B8. Octochaetona surensis, Julka, Fauna of India, Megadrile Dligochaeta, 1 : 292.
Diagnosis : Length 65-130 mm, diameter 3-5 mm, 102-160 segments. Prostomium epilobic, tongue closed. Dorsal pores present, first dorsal pore 12/13. Clitellum annular, xiii-xvii. Setae lumbricine, setae aa = 2.1-4.1 ab = 1-1.1 bc = 1.2-2.1 cd = 0.15-0.2 dd on xii. Setae a, b on viii and ix copulatory, this encircled by developed tumescences. Male genital field xvi-xx, with deep depressions on xvii and xix. Male pores paired minute, median to b, on xviii. Prostatic pores paired minute at b. Female pores paired, presetal, in a lines, on xiv. Spermathecal pores paired, minute, on viii and ix, at abo Genital markings on some of xviii-xxii, at aa or bb.
Septa 5/6/7/8 absent and 4/5, 8/9-10/11 muscular. Gizzard between septa 4/5 and 8/9. Calciferous glands one pair, discrete, extramural, shortly and slenderly stalked,

CHOWDHURY et. ale : On Taxonomy and Ecology of Earthworms (Annelida : Oligochaeta) ... 11
asymmetrical, close to the attachment of septum 15/16, one gland in xv and the other in xvi, intestinal origin in xvii; intestinal caeca and supra intestinal glands absent; typhlosole lamelliform, ventrally bifid, in xxii-xxiii to ci-cxv. Dorsal vessel single and complete. Last pair of hearts in xiii. Holandric, seminal vesicles in ix and xii. Penial setae ornamented. Prostates tubular. Sparmathecae paired in viii and ix, each with a shortly stalked diverticulum. Copulatory setae ornamented.
Maten'al Examined : 5 exs, MD; 9. ix. 2001; 2 exs, MD; 14. x. 2001; 1 ex, MD; 9. vi. 2002; 5 exs, MD; 8. ix. 2002; 3 exs, MD; 20. x. 2002; ,I ex, MD; 11. v. 2003; 1 ex, MD; 8. vi. 2003. A. Chowdhury collected all specimens.
Distribution: INDIA: West Bengal (North 24 Pgs.) Assam; Madhya Pradesh; Orissa; Uttar Pradesh.
Elsewhere : MYANMAR.
Remarks: This is recorded for the first time from West Bengal. Variations were observed in the male genital field region of 11 specimens, the area of which was nearly hexagonal in shape.
III. Family MEGASCOLECIDAE
4. Genus Lampito Kinberg, 1867
8. Lampito mauritii Kinberg, 1867
(Plate VIII a and b)
1867. Lampito mauritii Kinberg, Olvers. K. Vetens. Akad. Forhandl. Stockholm, ~3 : 103. (Type locality : Mauritus; types in Naturhistoriska Riksmuseet, Stockholm).
1995. Lampito mauritii, Reynolds, Julka and Khan, Megadrilogica, 6(6) : 54.
Diagnosis: Length 89-145 mm; diameter 3-5.5 mm. Segments 151-192. Prostomium prolobic. Clitellum annular in 13/14-17/18. Setae perichaetine, 40-48 on viii. 30-39 on xx, 10-15 between spermathecal' pores and none between male pores. Dorsal pores present, first dorsal pore at 10/11-12/13. Spermathecal pores 3 pairs, large, in eg, in 6/7-8/9. Female pores closely paired, presetal, within aa, on xiv. Male pores paired, on slightly raised porophore, at or lateral to b, on xviii.
Septa all present from 4/5, 7/8-12/13 muscular. Digestive system with a single oesophageal gizzard in v. Intestinal origin in xv, typhlosole rudimentary, but intestinal caeca and supra intestinal glands absent. Last pair of hearts in xiii. Meronephric. Holandric; testes free in x and xi; seminal vesicles in xi and xii. Biprostatic, prostates racemose, in xviii; duct straight. Penial setae with horseshoe-shaped or scoop-shaped tips, ornamented. Sexthecal, in vii-ix; each spermathecae with median and lateral digitiform diverticula; ampulla elongate; duct barrel shapped.

12 Rec. zool. Surv. India, Dcc. Paper No. 324
Material Examined: 17 exs, BRF; 15. vii. 2001; 24 exs, BRF; 19. viii. 2001; 3 exs, BRF; 15. xii. 2002; 49 exs, BRF; 20. vii. 2003; 51 exs, BRF; 17. viii. 2003; 70 exs, DP; 3. vi. 2001; 106 exs, OP; 1. vii. 2001; 68 exs, DP; 6. i. 2002; 77 exs, DP; 7. iv. 2002; 8 exs, DP; 2. ii. 2003; 48 exs, DP; 2. iii. 2003. A. Chowdhury collected all specimens.
Distribution: INDIA: West Bengal (Nadia, Kolkata, Burdwan, Bankura, Birbhum, Coochbehar, Darjeeling, Jalpaiguri, Murshidabad, MaIda, Midnapur, Purulia, West Dinajpur, South 24 Pgs., North 24 Pgs., Howrah); Andaman and Nicobar Islands; Andhra Pradesh; Bihar; Gujarat; Karnataka; Kerala; Laccadive and Minicoy Islads; Madhya Pradesh; Maharashtra; Orissa; Rajasthan; Tamil Nadu; Uttar Pradesh.
Elsewhere : PAKISTAN; SRI LANKA; CHINA; MALDIVES; THAILAND; BANGLADESH; HONG KONG; SEYCHELLES IS.; NEW CALEDONIA; MAURITUS; MADAGASCAR; COMORO IS.; INDONESIA; MALAY PENINSULA; MYANMAR; PHILIPPINES; ZANZIBAR.
Remarks: Some variations have been observed in the morphology. In two specimens spermathecal pores are present in v, vi and vii. Two specimens have found with male pores on xvii and female pore on xiii. One specimen with unidiverticulate spermathecae in the left side of vi and vii. Penial setae in seven specimens were only one pair.
5. Genus Metaphire Sims and Easton, 1972
9. Metaphire posthuma (Vaillant, 1868)
(Plate IXa and b)
1868. Perichaeta posthuma Vaillant, Annl Sci. Nat., (ser. 5), 10 : 228. (Type locality: Java; types in Museum National d' Historic Naturelle, Paris).
1972. Metaplzire posthuma, Sims and Easton, Bioi. J. Linn. Soc., 4 (3) : 239.
1995· Metaphire posthuma, Reynolds, Julka and Khan, Megadrilogica, 6 (6) : 54.
Diagnosis: Length 56-132 mm; diameter 3-6.5 mm. Segments 81-114. Prostomium epilobic, tongue open. Clitellum annular, xiv-xvi. Setae perichaetine, setae present on clitellar segments ventrally, 103-125 on viii, 75-91 on xx 33-41 between spermathecal pores and 16-22 between male pores. Genital markings paired, circular in setal circle, slightly median to male pore line, usually on xvii and xix. Dorsal pores present, first dorsal pore at 12/13. Spermathecal pores 4 pairs, minute and superficial, in 5/6-8/9. Female pore single, mid-ventral, presetal on xiv. Male pores, minute on xviii. Opening of male copulatory pouches circular.
Septa 5/6-8/9 muscular, 9/10 lacking. Oesophagus with a single gizzard between septa 7/8 and 9/10; intestinal origin in xv; intestinal caeca paired, simple, originating in xxvii and extending forward to xxiv; typhlosole simple, lamelliform; supra intestinal

CHOWDHURY et. ale : On Taxonomy and Ecology of Earthworms (Annelida : Oligochaeta) ... 13
glands absent. Last pair of hearts in xiii. Meronephric. Holandric; seminal vesicles in xi and xii, former is larger. Prostates racemose, in xv-xxi; each in a U-shaped loop. Octothecal; ampulla ovoid; duct shorter than ampulla; unidiverticulate, diverticulum arises from median face of duct. Genital marking glands sessile.
Material Examined: 3 exs, BRF; 15. vii. 2001; 6 exs, BRF; 19. viii. 2001; 2 exs, BRF; 19. v. 2002; 5 exs, BRF; 24. xi. 2002; 17 exs, BRF; 20. vii. 2003; 5 exs, MD; 10. vi. 2001;
3 exs, MD; 8. vii. 2001; 8 exs, MD; 9. vi. 2002; 7 exs, MD; 11. viii. 2002; 9 exs, MO; 10. viii. 2003; 1 ex, DP; 3. vi. 2001; 2 exs, OP; 1. vii. 2001; 6 exs, DP; 5. viii. 2001; 2 exs, DP; 5. v. 2002; 8 exs, DP; 1. xii. 2002; 15 exs, OP; 1. vi. 2003; 11 exs, DP; 3. viii. 2003.
A. Chowdhury collected all specimens.
Distribution : INDIA : West Bengal (Nadia, Kolkata, North 24 Pgs., Burdwan, Bankura, Coochbehar, Jalpaiguri, Murshidabad, MaIda, Midnapur, West Dinajpur, South 24 Pgs., Howrah); Andaman Islands; Himachal Pradesh; Jammu and Kashmir; Bihar; Gujarat; Hariana; Madhya Pradesh; Maharashtra; Orissa; Rajasthan; Punjab; Uttar Pradesh.
Elsewhere : PAKISTAN; THAILAND; BANGLADESH; VIETNAM; INDONESIA; MALAY PENINSULA; MYANMAR; PHILIPPINES; U.S.A.
Remarks : No appreciable variations were found in the present material. In two specimens an extra structure like genital markings have observed on xx.
10. Metaphire hou"eti (Perrier, 1872)
(Plate Xa and b)
1872. Perichaeta houlleti Perrier, Nouv. Arch. Mus. Hist. Nat. Paris, 8 : 99. (Type locality: Kolkata,
West Bengal, India; types in Musum National d' Historie Naturelle, Paris).
1972. Metaphire houlleti houlleti, h. rugosa; campanulata campanulata, c. meridiana, c. penitralis;
Wimberleyana, Sims and Easton, Bioi. J. Linn. Soc., 4 (3) : 238.
1982. Metaphire houlleti, Julka, Rec. Zool. Surv. India, 80 : 142.
Diagnosis: Length 46-191 mm; diameter 3-6.5 mm. Segments 85-132. Prostomium epilobic, tongue open. Clitellum annular, xiv-xvi. Setae perichaetine, setae often present in clitellar segments, 30-50 on viii, 46-60 on xx, 13-28 between spermathecal pores and 4-13 between male pores. Dorsal pores present, first dorsal pore in region of 9/10-11/12.
Spermathecal pores 3 pairs, minute, ca, in 6/7-8/9. Female pore single, mid-ventral, on xiv. Male pores minute, on xviii, each pore on a penial body.
Septa 8/9-9/10 lacking. Oesophagus with a single gizzard between septa 7/8 and 9/10; Intestinal origin in xv; intestinal caeca paired, simple, originating in xxvii and extending forward to xxii, typhlosole simple, lamelliform; supra intestinal glands absent.

14 Rec. zool. Surv. India, Dcc. Paper No. 324
Last pair of hearts in xiii. Meronephric. Holandric; testis sacs unpaired and ventral in x and xi; seminal vesicle in xi and xii. Sexthecal; spermatheca unidiverticulate; diverticulum arises from ectal end of duct. Genital marking glands stalked.
Material Examined: 3 exs, BRF; 20. vii. 2003; 3 exs, BRF; 17· viii. 2003; 1 ex, MD; 9. ix. 2001; 7 exs, MD; 14. x. 2001; 2 exs, MD; 14. vii. 2002; 4 exs, MD; 8. ix. 2002; 8 exs, MD; 20. x. 2002; 1 ex, MD; 13.vii. 2003; 3 exs, MD; 10. viii. 2003. A. Chowdhury collected
all specimens.
Distribution: INDIA: West Bengal (Nadia, North 24 Pgs., Burdwan, Bankura, Birbhum, Murshidabad, South 24 Pgs., Darjeeling, Howrah); Andaman and Nicobar Islands; Meghalaya, Uttar Pradesh.
Elsewhere: PAKISTAN; CHINA; THAILAND; BANGLADESH; INDONESIA; MALAY PENINSULA; MYANMAR; PHILIPPINES; U.S.A; WEST INDIES; BAHAMAS; CUBA.
Remarks: No appreciable variations were found in the present material.
6. Genus Perionyx Perrier,·1872
11. Perionyx excauatus Perrier, 1872
(Fig. 33, Plate Xla and b)
1872. Perionyx excavatus Perrier, Nouv. Arch. Mus. Hist. Nat. Paris, 8 : 126. (Type locality: Saigon,
Vietnam; types in Museum National d' Historic Naturelle, Paris).
1995. Perionyx excavatus, Reynolds, Julka and Khan, Megadrilogica, 6 (6) : 55.
Diagnosis: Length 41-173 mm; diameter 3-5 mm. Segments 119-168. Colour dorsally deep purple, ventrally pale. Prostomium epilobic, tongue open. Clitellum annular, xiii-xvii. Setae perichaetine, setae 43-53 on ix, 46-49 on xx, 4-5 between spermathecal potes. Nephridiopores inconspicuous. Dorsal pores present, first dorsal pore at any of 2/3-5/6. Spermathecal pores 2 pairs, near mid-ventral line, in 7/8 and 8/9. Female pore unpaired, median, presetal on xiv. Male pores in small transverse protuberances within a common field on xviii.
Septa all present from 4/5. Gizzard rudimentary in v; oesophagus widened in xiii with calciferous ridges, intestinal origin in xv or xvi! intestinal caeca, supra-intestinal glands and typhlosole absent. Last pair of hearts in xii. Holonephric. Holandric, testes free in x and xi; seminal vesicles in xi and xii, those of xii extend to septum 14/15- Prostates racemose in xviii; ducts straight. Penial setae ornamentd, tip.bluntly rounded or finely pointed. Quadrithecal; ampulla large; duct short and stout.
Material Examined: 9 exs, BRF; 17. vi. 2001; 4 exs, BRF; 15. vii. 2001; 22 exs, BRF; 20. i. 2002; 7 exs, BRF; 18. viii. 2002; 14 exs, BRF; 16. ii. 2003; 23 exs, BRF; 16. iii. 2003;

CHOWDHURY et. 0/. : On Taxonomy and Ecology of Earthworms (Annelida : Oligochaeta) ... 15
19 exs, BRF; 20.iV. 2003; 4 exs, MD; 10. vi. 2001; 7 exs, MD; 8. vii. 2001; 4 exs, MD; 13. i. 2002; 6 exs, MD; 14. iv. 2002; 10 exs, MD; 12. v. 2002; 12 exs, MD; 9. iii. 2003; 15 exs, MD; 8. vi. 2003; 19 exs, DP; 6. iv. 2003; 16 exs, DP; 4. v. 2003; 8 exs, DP; 1. vi. 2003.
A. Chowdhury collected all specimens.
Distribution: INDIA: West Bengal (Nadia, Kolkata, North 24 Pgs.,. Burdwan, Bankura, Coochbehar, Darjeeling, Hooghly, Jalpaiguri, Murshidabad, MaIda, Midnapur, Purulia, West Dinajpur, South 24 Pgs., Howrah); Andaman Islands; Arunachal Pradesh; Assam; Himachal Pradesh; Manipur; Sikkim; Maharashtra; Orissa; Tamil Nadu; Uttar Pradesh.
Elsewhere : SRI LANKA; THAILAND; MADAGASCAR AND ITS ADJACENT ISLANDS; INDONESIA; MALAY PENINSULA; MYANMAR; PHILIPPINES; TAIWAN; WEST INDIES.
12. Perionyx simlaensis (Michaelsen, 1907)
(Plate XIIa and b)
1907. Perionychella simlaensis Michaelsen, Mt. Mus. Hamburg, xxiv: 157. (Type locality: Dharampur,
Simla Hills.)
1923. Perionyx simlaensis, Stephenson, The Fauna of British India, Oligochaeta : 359.
Diagnosis: Length 85-121 mm; diameter 3-5 mm. Segments 95-128. Colour violetred; ventrally whitish. Prostomium epHobic. Dorsal pores from 4/5 or 5/6. Setae much closer ventrally than dorsally; setae 45 on v, 46 on viii, 52 on xii, 45 on xix, 43 on xxvi. Clitellum annular, xiii-xvii. Male genital area in xviii, rectangular with rounded angles, containing a pair of swollen disc, each of which bears rod shaped penes. Combined male and prostatic pores are in the middle of the disc. Setae absent between the male pores. Female pore minute at mid-ventral line in xiv. Spermathecal pores in 7/8 and 8/9 at cline.
Gizzard very small, in v. Intestines begins in xvii; calciferous glands, typhlosole, intestinal caeca and supra intestinal glands absent. Last pair of hearts in xiii. Holonephric. Holandric, testes and funnels free in x and xi. Seminal vesicles three / four pairs, in x-xii or x-xiii. Prostates disc-shaped, duct with loop. Penial setae absent. Spermathecae paired in vii and viii. Spermathecal ampulla large, globoid, with numerous pears shaped projections; duct much shorter and thinner than the ampulla; seminal chambel'S unrecognizable.
Material Examined: 1 ex, MD; 8. vii. 2001; 2 exs, MD; 14. iv. 2002; 2 exs, MD; 12. v. 2002; 4 exs, MD; 9. iii. 2003; 2 exs, MD; 13. iv. 2003; 3 exs, MD; 8. vi. 2003.
A. Chowdhury collected all specimens.

16 Rec. zool. Surv. India, Occ. Paper No. 324
Distribution : INDIA : West Bengal (North 24 Pgs.); Himachal Pradesh, Uttar Pradesh.
Remarks : This species is previously known from western part of the gangetic plains and foothills of the Western Himalaya. Its' present record from West Bengal of great significance.
7. Genus Polypheretima Michaelsen, 1934
13. Polypheretima elongata (Perrier, 1872)
(Plate Xllla and b)
1872. Perichaeta elongata Perrier, Nouv. Arch. Mus. Hist. Nat. Paris, 8 : 124. (Type locality: Peru;
types in Museum National d' Histoire Naturelle, Paris.)
1979. Polypheretima elongata, Easton, Bull. Br. Mus. Nat. Hist. (Zool.), 35 : 53.
1995. Polypheretima elongata, Reynolds, Julka and Khan, Megadrilogica, 6 (6) : 55.
Diagnosis: Length 45-388 mm; diameter 3-10 mm. Segments 146-2Sl. Prostomium rudimentary. Clitellum annular, in xiv-xvi. Setae perichaetine, setae 61-101 on viii, 51-71
on xx, 11-19 between spermathecal pores and 7-13 between male pores. Genital markings transversely elliptical, paired, presetal on xix and successive segments in line with or slightly median to male pores, occasionally on vi, vii and xvii. Dorsal pores present, first dorsal pore at 12/13. Spermathecal pores when present, in paired groups of 2-5, at intersegmental furrows 5/6/7, minute and superficial. Female pore single, mid-ventral, on xiv. Male pores paired, on squat penes within shallow copulatory pouches, ca, on xviii. Opening of male copulatory pouches longitudinal.
Septa 8/9-9/10 absent. Oesophageal gizzard single, in viii; Intestinal origin in xv; intestinal caeca absent. Last pair of hearts in xii. Holandric; testis sacs large, unpaired and annular in x and xi; seminal vesicles in xi and xii. Prostates racemose, in xvi-xxi; ducts 2-5 mm long and looped. PolYthecal; small spermathecal batterirs in 5/6 and 6/7
or 5/6 or 6/7 only or absent; unidiverticulate; diverticulum arises from ectal end of duct. Genital marking glands sessile on parietes.
Material Examined: 4 exs, MD; 9. ix. 2001; 7 exs, MD; 14. x. 2001; 6 exs, MD; 11. xi. 2001; 4 exs, MD; 9. xii. 2001; 2 exs, MD; 14. vii. 2002; 2 exs, MD; 8. ix. 2002; 10 exs, MD; 20. x. 2002; 3 exs, MD; 10. xi. 2002; 4 exs, MD; 10. viii. 2003. A. Chowdhury collected all speCImens.
Distribution: INDIA: West Bengal (North 24 Pgs., South 24 Pgs., Kolkata); Andaman and Nicobar Islands; Andhra Pradesh; Karnataka; Maharashtra; Madhya Pradesh; Tamil Nadu.

CHOWDHURY et. ale : On Taxonomy and Ecology of Earthwonns (Annelida : Oligochaeta) ... 17
Elsewhere: AFRICA; SRI LANKA; THAILAND; MADAGASCAR; COMORO IS.; PAKISTAN; BANGLADESH; MYANMAR; INDONESIA; MALAY PENINSULA; PHILIPPINES; TAIWAN; INDONESIA; AUSTRALIA; PAPUA NEW GUINEA; NEW CALEDONIA; WEST INDIES; SOUTH AMERICA; TAHITI; CAROLINE IS.
Remarks: No appreciable variations were recorded in the present material. One specimen without genital marking on right side of xxiii, one without genital marking on left side of xxiv. In two specimens genital markings absent on right side of both xxiii and xxiv. Three specimens having no genital markings.
8. Genus Amynthas Kinberg, 1867
14. Amynthas corticis (Kinberg, 1867)
(Plate XIVa and b)
1867. Perichaeta corticis Kinberg, Ofvers K. Vetens Akad. Forhandl. Stockholm., 23 : 102
1981. Amynthas corticis, Easton, Bull. Br. Mus. Nat. Hist. (Zool.), 40 (2) : 49.
1995. Amynthas corticis, Julka, Fauna West Himalaya., 1 : 18.
Diagnosis: Length 41-166 mm; diameter 3-5.5 mm. Segments 71-119. Prostomium epilobic, tongue open. Clitellum annular, xiv-xvi. Setae perichaetine, setae 23-41 on viii, 32-51 on xx, 6-13 between spermathecal pores and 8-13 between male pores. Gential markings small, circular to shortly elliptical discs, paired-presetal, just median to the line of spermathecal pores in some or all or vi-ix; post setal, just in front of spermathecal pores in some or all of v-viii, occasionally one or more near each male porophore on xviii. Dorsal pores present, first dorsal pore usually at 11/12. Spermathecal pores 4 pairs, minute, superficial, each in a small circular to transversely elliptical disc in 5/6-8/9. Female pore midventral, on xiv.
Septa 8/9-9/10 lacking. Gizzard large, somewhat conical; intestinal origin usually in xvi; typhlosole lamelliform; intestinal caeca simple extending forward to xxii. Last pair of hearts in xiii. Meronephridial. Holandric; testis sacs unpaired and ventral; seminal vesicles in xi and xii. Prostates racemose, xvi-xxii; ducts muscular and looped. Octothecal; ampulla inverted pearshaped, duct shorter than ampulla; unidiverticulate; diverticulum arises from anterior face of duct. Genital marking glands stalked and coelomic.
Material Examined: 2 exs, BRF; 18. viii. 2002; 2 exs, BRF; 15. ix. 2002; 1 ex, BRF; 17. viii. 2003; A. Chowdhury collected all specimens.
Distribution : INDIA: West Bengal (Nadia, Darjeeling, Jalpaiguri); Arunachal Pradesh; Assam; Himachal Pradesh; Jammu and Kashmir; Manipur; Karnataka; Sikkim; Meghalaya; Tamil Nadu; Uttar Pradesh.

18 Rec. zool. Surv. India, Occ. Paper No. 324
Elsewhere: AFRICA; SRI LANKA; THAILAND; MADAGASCAR AND ITS ADJACENT ISLANDS; BANGLADESH; BHUTAN; CHINA; KOREA; JAPAN; NEPAL; MYANMAR; INDONESIA; PHILIPPINES; TAIWAN; HONG KONG; INDONESIA; AUSTRALIA; NEW ZEALAND; WEST INDIES; SOUTH AMERICA.
Remarks : No appreciable variations were observed in the present material.
ECOLOGY OF EARTHWORM FAUNA AND MICROBIAL FLORA IN STUDIED SITES
The present investigation involves extraction of earthworm fauna and microorganisms from the soil samples of 12 sampling plots in three different habitats such as, 1. Municipal wastes disposal site at Dhapa, Kolkata (DP); II. Uncultivated field site at Madhyamgram, North 24 Pgs. District (MD) and III. Bethuadahari Reserve Forest, Nadia District (BRF) of West Bengal (Map 1), a state in the Eastern region of the Indian Republic situated between 22° N - 27° Nand 86° E - 89° E.
SITE - I - Dhapa, Municipal wastes disposal site of Kolkata (DP)
Characteristics of sampling site: The site is dumping ground of city wastes, located by the side of Eastern Metropolitan bypass, Kolkata (Map 1). It included four sampling plots, each measuring nearly 100 metre square. The main constituents of the dumped materials were household wastes, residues of vegetables etc. Some parts of these plots were used for cultivation of different seasonal vegetables like cauliflower, maize, cucurbita, lettuce, cabbage etc. (Plate XV).
Vegetation : The plots were covered with grasses, sedges and herbs like, Cynodon dactylon, Commelina bengalensis, Cyperus rotundus, Digitaria adscendens, Echinochloa colonum and margins of the plots with few scattered trees like Accacia arabica.
Soil Factors: Soil of these plots was Gangetic alluvium in nature, blackish in colour and silty sand to sandy loam in texture with well developed humus mainly comprised of decomposed and semi decomposed litter. pH varied from 6.5 to 7.38 and electrical conductivity varied from 0.18 to 1.5 dSm-1 (Tab. 2). During August in each sampling year subsoil relative humidity in the soil was maximum 96% in 2001, 100% in 2002 and 98% in 2003 and subsoil temperature was at that time 29°C in both 2001 and in 2002 and 27°C in 2003. In August other soil factors like organic Carbon were 3.86% in 2001, 3.73% in 2002 and 4.1% in 2003 and available Nitrogen were 386 Kgha-1 in 2001, 475 Kgha-1 in 2002 and 510 Kgha-1 in 2003. During the month of January and February 2003, subsoil humidity was 80% and 82% and subsoil temperature was at that time 22°C and 20°C, respectively. In January other soil factors such as organic Carbon, available Nitrogen, available P2 0
S and available K20 were 3.29%,356 Kg ha-1, 185 Kg ha-1 and 494 Kg ha-1
,
respectively in 2002 and 3.46%, 395 Kg ha-t, 102 Kg ha-1 and 644 Kg ha-1, respectively in

CHOWDHURY et. ale : On Taxonomy and Ecology of Earthworms (Annelida : Oligochaeta) ... 19
2003 (Tab. 2). Mechanical analysis of soil sample showed maximum percentage of coarse sand 57.95% (Tab. 1).
Heavy Metals: Month wise mean concentration of heavy metals (Cd, Zn, Pb and Cu) obtained from soil samples have been shown in Tab. 2, from which it would be evident that, in this polluted site, in the month of August the concentration of heavy metals such as Cadmium, Zinc, Lead and Copper were comparatively low (3 ppm, 600 ppm, 270 ppm and 170 ppm, respectively in 2003). While, in the month of February and March 2003, except Copper the concentrations of heavy metals were found to be high in this site (Tab. 2).
Earthworm Fauna : The earthworm fauna obtained from this site belonged to three species under three genera. The species Lampito mauritii was the most dominant form being collected from all the soil samples and comprising 94.3% of the total population collected from this site. Metaphire posthuma and Perionyx excavatus comprising 3.34% and 2.0596 occupied second and third position, respectively (Tab. 3; Fig. 1). Number of earthworm obtained in each month (Tab. 2) showed maximum populations usually in August when soil factors like relative humidity, organic Carbon, available Nitrogen, available P 205 and available ~O were all at higher levels; whereas heavy metals such as Cadmium, Zinc, Lead and Copper were minimum (Figs. 2-9 and 10-13). Increase of population in July-September as obtained in this site might be due to prevalence of optimum conditions of different soil factors (Tab. 2 and Figs. 2-9).
Seasonal Changes: The total populations of earthworm obtained from this site were maximum in August in each sampling year (Figs. 2-9). Seasonal changes of each species of earthworm obtained from this site revealed that, Lampito mauritii had August peak in all the year, this might be due to higher humidity, organic Carbon and low heavy metals concentration in this month. Second peak was in the month of September and third peak was in the month of July. Lowest population was found in the month of January and February 2003; this might be due to the lower subsoil temperature, subsoil humidity, available K
20 and higher concentration of soil heavy metals (Tab. 2). While other species
population was numerically very low, the Metaphire posthuma showed maximum peak in the month of June 2003 but in 2002 the peak was shifted to December. Perionyx excavatus was found only in the year 2003 and showed its peak in the month of April. In spite of higher heavy metal contents, second population peak of Lampito mauritii was found in the year September 2002. This may be because it can withstand toxic pressure of heavy metals to some extent (Tab. 2).
Microbial flora
Fungi: The soil fungi obtained from this site belonged to seven genera. The genus Penicillium sp. was the most dominant occupying 61.95% of the total fungal population obtained from this site. The genus Aspergillus sp. constituted 17.93% while Fusarium sp.

20 Rec. zool. Surv. India, Dcc. Paper No. 324
constituted 6.09% of total population. Other genera recorded were numerically poor and irregular in occurrence (Tab. 5; Fig. 14). The maximum percentage representation of fungi encountered in August in every studied year found to be coincided with the higher population of earthworm, bacteria-actinomycetes as well as maximum concentration of soil factors like relative humidity, organic Carbon, nitrate, phosphate and also minimum concentration of soil heavy metals (Tab. 4; Figs. 16-24 and 25-28).
Seasonal Changes: Fungi populations were maximum in the month of August in all the sampling years (Figs. 17-24). The Penicillium sp. had its peak in September in each year of observation. Aspergillus sp. had its peak in July in each year of observation. The maximum abundance of other genera varied among years as well as in months of observation due to their irregular occurrence in this field (Tab. 5). In January 2003 and May 2003, absence of some genera and poor occurrence of the dominant resulted in minimum population density of total fungal community.
Bacteria-Acinomycetes : The soil bacteria-actinomycetes obtained from this site belonged to eleven genera. The genus Bacillus sp. was the most dominant and represented 43.33% of the total population recorded. The genus Streptomyces sp. occupied 24.07% and Micrococcus sp. occupied 13.55%. In addition some more genera were also recorded from this field but, their occurrences were irregular (Tab. 6, Fig. 15).
A maximum population of 8.29% was found in August 2003 and 7.18%, 6.14% observed in September 2002 and August 2001, respectively (Tab. 6). The high percentage of total bacteria-actinomycetes during this period coincided with the high concentration of soil factors like relative humidity, organic Carbon, nitrate, phosphate and also minimum concentration of soil heavy metals (Tab. 4; Fig. 17-24 and 25-28). The minimum population recorded in the month of April and May, 2002 and in February, 2003, coincided with that of lower population of earthworm and fungi as well as minimum content of soil relative humidity, phosphate and maximum concentration of soil heavy metals (Tab. 4; Figs. 16-24 and 25-28).
Seasonal Changes: Bacteria-actinomycetes population showed its peak in the month of August in 2001, September in 2002 and again in the month of August in 2003 (Figs. 17-24). It is evident that, population peak of dominant genera varied among years as well as in months of observation. The population of Bacillus sp. showed its peak in August 2001, September 2002 and August 2003. Lowest population was found in April 2002 and February 2003. However, in remaining months it remained more or less high with slight fluctuation. Another dominant genus Streptomyces sp. showing wide fluctuation, its population peaks were recorded in July 2002 and August 2003. The population of Micrococcus sp. showed fluctuation with the highest peak in August 2001 and September 2002, with little variation among Micrococcus I and II. The other genera also revealed irregular population peak due to their infrequent occurrence in this field. In January and February 2003, absence of some genera accompanied with low population of

CHOWDHURY et. ale : On Taxonomy and Ecology of Earthworms (Annelida : Oligochaeta) ... 21
predominant genera resulted in the minimum population density of Bacteriaacinomycetes population (Tab. 6).
SITE - II - Madhyamgram, Uncultivated field, North 24 Pgs. (MD)
Characteristics of sampling site : The site is nearly 40 km north from Kolkata, in the district of North 24 pgs., West Bengal (Map 1). It included four sampling plots, each 100 metre square (approx.). In these plots no cultivation is being made. Scattered cowdungs were also found due to occasional visit of the domestic cattle in this field (Plate XVI).
Vegetation: The plots were covered with grasses, sedges and herbs like, Cynodon dactylon, Euphorbia hirta, Chrysopogon aciculatus, Solanum nigram, Centella asiatica, Coccinia cordifolia, Eclipta prostrata, Marsilea minuta, Colocasia esculenta. The other vegetations mainly belong to Mangifera indica and Annona squamosa, Cocos nucifera, Musa paradisiaca.
Soil Factors: Soil of these plots was Gangetic alluvium in nature, brown in colour and clay silt loam in texture. pH varied from 5.66 to 7.4 and electrical conductivity varied from 0.1 to 1.5 dSm-1 (Tab. 7). During October in each sampling year subsoil relative humidity in the soil was maximum 90% in 2001 and 95% in 2002 and subsoil temperature was at that time 25°C in 2001 and 26°C in 2002. Subsoil relative humidity of 10096 was recorded in the month of July 2002 and 2003. In October other soil factors like organic Carbon were 1.73% in 2001,1.71% in 2002 and available Nitrogen were 386 Kgha-1 in 2001 and 404 Kgha-1 in 2002. In the month of January and February 2003, s,ubsoil humidity was 81% and 80% respectively and subsoil temperature was 17°C and 20°C during that period. In May 2002, surface soil temperature, subsoil temperature, surface soil humidity and subsoil humidity was 37°C, 31°C, 64% and 70%, respectively. During the month of January other soil factors such as organic Carbon, available Nitrogen, available P 205' available K20 were 1.56%, 310 Kg ha-1
, 205 Kg ha-1 and 510 Kg ha-1, respectively in 2002 and 1.42%, 342 Kg ha-1, 195 Kg ha-1 and 660 Kg ha-t, respectively in 2003 (Tab. 7). Mechanical analysis of soil samples showed maximum percentage of clay 32.07% (Tab. 1).
Table 1 : Mechanical analysis of soil in different sites (expressed in %)
Sampling Coarse Medium Fine Coarse to Fine silt Clay site sand sand sand Medium silt
Site I: DP 57.95 3.94 8.59 9.01 1.0 9.49
Site II : MD 1.0 2.0 1.57 32.03 31.31 34·07
Site III : BRF 4.36 2.45 20.47 33.59 21.66 17.43

22 Rec. zool. Surv. India, Dcc. Paper No. 324'
Heavy Metals: Month wise mean concentration ,of heavy metals (Cd, Zn, Pb and Cu) obtained from soil samples have been shown in table 7, from which it would be evident that, in the month of August, September and October the concentration of heavy metals such as Cadmium, Zinc, Lead and Copper were comparatively low (0.7 ppm, 45 ppm, 22 ppm and 25 ppm, respectively in August 2001). While, in the month of May and June the concentration of all these metals were found to be high in this site (Cd 4 ppm, Zn 90 ppm, Pb 35 ppm and Cu 50 ppm in June 2003) (Tab. 7).
Earthworm Fauna : The earthworm fauna obtained from this site belonged to ten species under six genera. The species Eutyphoeus incommodus was the most dominant form and comprising 32.45% of the total popUlation collected from this site. Drawida papilliJer papillifer was the second largest comprising 31.16% of the total population collected from this site. The species Eutyphoeus orientalis contributed 20.1%, Perionyx excavatus contributed 4.3%, Metaphire posthuma contributed 2.96% and Drawida nepalensis contributed 2.63% (Tab. 8; Fig. 29). Populations of other species from'this site were numerically low and highly irregular in distribution pattern. Number of earthworm obtained in each month showed maximum populations usually in October and second highest in the month of September in all of the studied year, when soil factors like relativ~ humidity, organic Carbon, available Nitrogen and availabl,e P 205 were all at higher levels; whereas heavy metals such as Cadmium, Zinc, Lead and Copper were minimum (Tab. 7; Figs. 30-37 and 38-41).
Seasonal Changes: The total populations of earthworm obtained from this site were maximum in October in each sampling year (Figs. 30-37). Seasonal changes of each species of earthworm obtained from this site revealed that, Eutyphoeus incommodus had September peak in all the year, second peak was in the month of October and third peak was in the month of July. This coincided with the higher amount of available N
2, available
p 205' subsoil humidity; optimum concentration of organic Carbon, subsoil temperature and lower concentration of heavy metals. Zero population was found in the month of January 2002 and in February 2003, this might be due to the lower subsoil temperature, subsoil humidity and higher concentration of heavy metals (Tab. 7). While, Drawida papillifer papillifer showed maximum peak in the month of October, second peak in November 2001. In the year 2002 the maximum peak was in the month of October, the second peak was in the month of November and there was a third peak in the month of January. In the year 2003 there was a distinct peak in the month of January; it reveals that it can tolerate lower subsoil temperature than any other studied species. Lowest population of this species was found in the month of May and June; this might be due to the lower organic Carbon, available N2 , subsoil humidity and higher concentration of heavy metals (Tab. 7). The species Eutyphoeus ol"ientalis showed maximum peak in the month of July 2001 but in 2002 the peak shifted to August. This coincided with the higher subsoil humidity, higher content of available N2 and lower concentration ,of heavy metals.

CHOWDHURYet. 01. : On Taxonomy and Ecology of Earthwonns (Annelida: Oligochaeta) ... 23
Zero population of this species was found in the month of January 2002, January to March 2003. This may be due to the lower subsoil temperature, subsoil humidity, organic Carbon and higher concentration of heavy metals. Perionyx excavarus was found maximum in the month of June 2003. Metaphire posthuma showed its peak in June to August 2003 while Drawida nepalensis in the month of October, November 2002' and January 2003. Other species showed variation in sampling years as well as during months, which is probably due to their irregular occurrence in this field (Tab. 7).
Microbial flora
Fungi: The soil fungi obtained from this site belonged to seven genera. The genus Penicillium sp. was the most dominant and 57.73% of the total population recorded from this site. The genus Aspergillus sp. contributed 20.83% and Rhizopus sp. contributed 6.6996. Populations of other genera recorded were numerically low and irregular in occurrence (Tab. 10; Fig. 42). The higher percentage representation of total fungi obtained in October 2001, 2002 and August 2003, coincided with the high population of earthworm fauna, maximum concentration of soil factors like relative humidity, organic Carbon and also low concentration of heavy metals (Tab. 9; Figs. 44-52 and 53-56).
Seasonal Changes : Fungi populations were maximum in the month of August in 2001, October in 2002 and again in the month of August in 2003 (Figs. 45-52).
Penicillum sp. had peak in July 2001 and second peak in October 2002. Aspergillus sp. showing wide fluctuation had its highest peak in October 2001 and was numerically high during September 2002 and August 2003. The abundance of other genera varied among years as well as in months of observation in this field as evident from the Table 10. In May and June, absence of some genera and poor occurrence of the dominant forms resulted in minimum population density of total fungi community in this site.
Bacteria-Actinomycetes : The soil bacteria-actinomycetes obtained from this site belonged to seven genera. The genus Streptomyces sp. was the most dominant with 47.6796 of the total population recorded from this site, followed by Arthrobacter sp. (20.4696) and Bacillus sp. (17.80%). In addition some other genera were also obtained from this study site, but, they were irregular and numerically very poor (Tab. 11; Fig. 43).
A maximum of 8.73% population ofbacteria-actinomycetes were recorded in the month of September 2002. The population was high when the concentration of soil relative humidity, organic Carbon, available nitrate and available phosphate was fairly high. The minimum population obtained in the month of January 2002,2003 and February 2003,
found to be coincided with that of lower population of earthworm and fungi as minimum content of soil relative humidity, organic Carbon and the high level of heavy metals in soil (Tab. 9; Figs. 44-52 and 53-56).

24 Rec. zool. Surv. India, Occ. Paper No. 324
Seasonal Changes: Bacteria-actinomycetes population showed its peak in the month of September among all the sampling months (Figs. 45-52). The population of Streptomyces sp. showed its peak in October. Lowest population was found in January 2002 and February 2003. However, in remaining months it remained more or less high with slight fluctuation. Another dominant genus Arthrobacter sp. showing wide fluctuation, its population peaks were recorded in September 2001; in the month of July and September 2002 and in August 2003. The popUlation of Bacillus sp. showed fluctuation with the highest peak in September 2002. The other genera also revealed irregular population peak due to their infrequent occurrence in this field. In February 2003, absence of some genera accompanied with low population of predominant genera resulted in the minimum population density of Bacteria-acinomycetes population (Tab. 11).
SITE - III - Bethuadahari Reserve Forest, Nadia (BRF)
Characteristics of sampling site: It is a man made forest, located at Bethuadahari, by the side ofNH-34, about 138 Km North of Kolkata, in the district of Nadia, at the eastern part of West Bengal is being situated in the Gangetic plain (Map 1). Tropic of cancer runs across the middle of the district. Annual rainfall ranges from 77-84.70 cm. It included four sampling plots, each 100 metre square (approx.). Forest floor is covered with undergrowth. The litter of the forest floor contains the fallen leaves and dried twigs of the above trees and under growth. This site was severely hit by flood on 18 Sept 2000, flood continued for 15 days, which had an adverse effect on earthworm populations (Plate XVIII).
Vegetation : Plots were covered with the undergrowth of grasses and sedges like Sporobolus diander, Dichanthium annulatum, Eragrostis brachyphylla, Digitaria marginata, D. royleana, Cynodon dactylon, Euphorbia hirta and Lantana camara. The forest contains major tress like, Shorea robusta, Tectona grandis, Dalbergia sisso, Ficus religiosa, Mangifera indica and Azadirachat indica.
Soil Factors: Soil of these plots was Gangetic alluvium in nature, blackish brown in colour and sandy silt in texture. pH varied from 6.3 to 7.9 and electrical conductivity varied from 0.1 to 0.59 dSm-1 (Tab. 12). During August in each sampling year subsoil relative humidity in the soil was maximum 96% in 2001, 96% in 2002 and 95% in 2003 and subsoil temperature was at that time 27°C in 2001, 28°C in 2002 and 28°C in 2003, respectively. In August other soil factors like organic Carbon were 2.42% in 2001, 2.95% in 2002 and 3.07% in 2003 and available Nitrogen were 300 Kgha-1 in 2001, 320 Kgha-1 in 2002 and 369 Kgha-1 in 2003. During January 2002 and February 2003, subsoil humidity was 75% and 82% and subsoil temperature was at that time 17°C and 20°C, respectively. In the month of May 2002, surface soil temperature, subsoil temperature, surface soil humidity and subsoil humidity was 36°C, 31°C, 64% and 70%,

CHOWDHURY et. ale : On Taxonomy and Ecology of Earthworms (Annelida : Oligochaeta) ... 25
respectively. In January other soil factors such as organic Carbon, available Nitrogen, available P 205 and available K20 were 1.78%, 300 Kg ha-1
, 270 Kg ha-1 and 510 Kg ha-1,
respectively in 2002 and 2.1%, 320 Kg ha-1, 200 Kg ha-1
, 460 Kg ha-t, respectively in 2003 (Tab. 12). Mechanical analysis of soil samples showed maximum percentage of coarse to medium silt 33.59% and more or less equal percentage of fine sand and fine silt (Tab. 1).
Heavy Metals: Month wise mean concentration of heavy metals (Cd, Zn, Pb and Cu) obtained from soil samples have been shown in Table 12, from which it would be evident that, in the month of July, August and September the concentration of heavy metals such as Cadmium, Zinc, Lead and Copper were comparatively low (0.5 ppm, 48 ppm, 26 ppm and 14 ppm, respectively in July 2003). While, in the month of May and June the concentration of all these metals were found to be high in this site (Cd 3 ppm, Zn 132 ppm, Pb 38 ppm and Cu 42 ppm in May 2003) (Tab. 12).
Earthworm Fauna : The earthworm fauna obtained from this site belonged to ten species under seven genera. The species Lampito mauritii was the most dominant and comprising 40.69% of the total population collected from this site. Second largest was the Eutyphoeus orientalis comprising 16.4% of the total population collected from this site. Perionyx excavatus contributed 15.9%, Metaphire posthuma contributed 14.2% and Drawida nepalensis contributed 6.13%. Populations of other species from this site were numerically low and highly irregular in distribution pattern (Tab. 13; Fig. 57). Number of earthworm obtained was found to be maximum in the month of August in all of the studied year and second highest in the month of October in 2001, in the month of September in 2002 and in the month of July in 2003; when soil factors like subsoil humidity, organic Carbon, available Nitrogen were all at higher levels; whereas heavy metals such as Cadmium, Zinc, Lead and Copper were minimum (Tab. 12; Figs. 58-65
and 66-69).
Seasonal Changes: The total popUlations of earthworrn obtained from this site were maximum in August in each sampling year (Figs. 58-65). Seasonal changes of each species of earthworm obtained from this site revealed that, Lampito mauritii had August peak in all the year, which coincided with the higher concentration of soil factors like subsoil humidity, organic Carbon, available Nitrogen and optimum temperature; second peak was in September, third peak was in October. Zero population was found in the month of June 2001; in the month of January, April, May in 2002 and February to May in 2003; this might be due to the lower humidity, available K
20, organic Carbon and higher
concentration of heavy metals (Tab. 12). Eutyphoeus orientalis had October peak in 2001 but peak shifted to June in the year 2002. There was also a second peak in the month of October 2002. In the year 2003, this species showed its maximum population in the month of July, second peak in the month of June. This coincided with the optimum subsoil temperature, higher subsoil humidity, organic Carbon and lower concentration

Rec. zool. Surv. India, Occ. Paper No. 324
of heavy metals. Zero population was found in the month of November and December 2001, January 2002 and January to March 2003. This might be due to the lower subsoil temperature, humidity, available P
20
S and higher concentration of heavy metals
(Tab. 12). Perionyx excavatus showed maximum peak in January 2002 but in 2003 the peak shifted to March. No species was found in August to December 2001, September to December 2002, January and July 2003. Population peak was observed when level of heavy metals in soil was in higher side and probably it has the capability to resist some toxic effect of heavy metals. Me taph ire posthuma showed its peak in September in all the studied year, second peak was in October in 2001 and in August in 2002 and there was a distinct peak in July 2003, which coincided with the higher subsoil humidity, optimum subsoil temperature and lower concentration of heavy metals. Zero population of this species was found in December 2001, January and December 2002, January, February and May 2003. This may be due to the lower subsoil humidity and higher concentration of heavy metals. Other species showed variation in sampling years as well as during months, which is probably due to their irregular occurrence in this field (Tab. 12).
Microbial flora
Fungi : The soil fungi obtained from this site belonged to nine genera. The genus Penicillium sp. was the most dominant and 60.43% of the total population recorded from this site. The genus Aspergillus sp. contributed 15.68% and Rhizopus sp. contributed 7.19%. Populations of other genera recorded was numerically low and irregular in occurrence (Tab. 15; Fig. 70). The maximum percentage representation of total fungi, which obtained in August of all the studied years, coincided with the higher population of earthworm fauna, maximum concentration of soil factors like relative humidity, organic Carbon and also low concentration of heavy metals (Tab. 14; Figs. 72-80 and 81-84).
Seasonal Changes: Fungi populations were maximum in the month of August in all the studied year (Figs. 73-80). Penicillum sp. had its peak in August 2001, second peak in July 2002 and third peak in August 2003. Aspergillus sp. had its highest peak in August 2001 and was numerically high during September 2002. The abundance of other genera varied among years as well as in months of observation due to their irregular occurrence in this field that is evident from Table 15 .. In May, absence of some genera and poor occurrence of the dominant forms resulted in minimum population density of total fungi community in this site.
Bacteria-Actinomycetes : The soil bacteria-actinomycetes obtained from this site belonged to 8 genera. The genus Streptomyces sp. was the most dominant with 39.26%
of the total population recorded from this site, followed by Bacillus sp. (23.90%) and Micrococcus sp. (17.53%). In addition some other genera were also obtained from this study site, but, they were irregular and numerically very poor (Tab. 16; Fig. 71).
A maximum of 6.29% population of bacteria-actinomycetes were recorded in the month

CHOWDHURYet. ale : On Taxonomy and Ecology of Earthworms (Annelida: Oligochaeta) ... 27
of July 2003 and 5.8796 in both July 2001 and August 2003. The population was high when the concentration of soil relative humidity, organic Carbon was fairly high. The minimum population obtained in the month of May in each year, found to be coincided with that of lower population of earthworm and fungi as low content of soil relative humidity, organic Carbon and the high level of heavy metals in soil (Tab. 14; Figs. 72-80
and 81-84).
Seasonal Changes: Bacteria-actinomycetes population showed its peak in the month of July in 2001, August in 2002 and again in July in 2003. The genus Streptomyces sp. showed more or less gradual trend in fluctuation tltroughout the study period with the highest peak in August 2003. The population of Bacillus sp. exhibits wide fluctuations became very best in April 2002. The population of Micrococcus sp., both I and II, during the months of observation exhibited fluctuations. The highest peak of Micrococcus I was in September 2001 and June 2003. Micrococcus II, in comparison to Micrococcus I, was showing less fluctuation. The population density and the trend of fluctuation of the other genera were found to be numerically very low and irregular. In May, absence of some genera and poor occurrence of the dominant forms resulted in minimum population density of total bacteria-actinomycetes communities in this site (Tab. 16).
STATISTICAL ANALYSIS OF DATA The statistical analysis of the complex soil earthworm and microbial communities has
been conducted to show the relationship between the soil factors, heavy metals, microorganisms and earthworms. The application of linear correlation, anova and step wise regression were undertaken in the present study involving the data of soil factors, heavy metals, microbial and earthworm population densities separately for each site. All the analysis has been carried out by BMDP Statistical Software, Inc. in Indian Statistical Institute, Kolkata.
Linear correlation
The correlation coefficient ('r' value) of each variable (i.e. total and predominant earthworm, total fungi, total bacteria-actinomycetes, different soil factors and four heavy metals) on each other in individual site was shown in Tables 17-20.
Site 1/ DP
The correlation coefficient data ('r' value) mentioned in the Table 17 indicated that in Municipal wastes disposal site the edaphic factors like upper surface temperature, subsoil temperature, upper surface relative humidity, subsoil relative humidity, pH and available P 2 0 5 showed strong positive significant correlation, but heavy metals like Zinc, Lead showed strong negative significant correlation with Lampito mauritii in waste disposal site. Organic Carbon showed significant positive correlation with Metaphire

28 Rec. zool. Surv. India, Dcc. Paper No. 324
posthuma in this site. Among the abiotic factors organic Carbon showed significant positive correlation with available P 2°
5 but significant negative correlation with Zinc.
Except Cadmium, all the studied heavy metals showed significant negative correlations with soil temperature and relative humidity but lead fails to show any significant relationship with soil relative humidity. Electrical conductivity showed significant positive correlation with Zinc and Lead.
From Table 20 it has been found that in Site I earthworm population shows significant positive correlations with fungi and bacteria-actinomycetes population as well as with surface and subsoil temperature, surface and subsoil relative humidity, soil pH, available P 205 and available K20, but shows significant negative correlations with Zinc and Copper. Fungi population shows significant positive correlations with bacteriaactinomycetes population as well as with surface and subsoil relative humidity and available K
20. Bacteria-actinomycetes population shows significant positive correlations
with surface and subsoil relative humidity and available K2 0.
Site 11/ MD
The correlation coefficient data C'r' value) mentioned in the Table 18 indicated that in uncultivated field Metaphire posthuma, Eutyphoeus orientalis and Eutyphoeus incommodus shows significant positive correlation with subsoil relative humidity. Upper surface temperature showed significant positive correlation with Eutyphoeus orientalis and Perionyx simlaensis, but significant negative correlation found with Drawida nepalensis and Drawida papillijer papillijer. Subsoil temperature and upper surface relative humidity showed significant positive correlation with Eutyphoeus orientalis and Eutyphoeus incommodus but subsoil temperature shows significant negative correlation with Drawida nepalensis and Drawida papillijer papillijer. Organic Carbon shows significant positive correlations with Drawida nepalensis, Perionyx simlaensis, Polypheretima elongata and Drawida papillijer papillijer but significant negative correlation found with Metaphire posthuma and Perionyx excavatus. Except Perionyx excavatus and Perionyx simlaensis, Eutyphoeus orientalis, Eutyphoeus incommodus, PoLypheretima elongata and Metaphire houlleti shows significant negative correlation with Cadmium. Perionyx excavatus and Perionyx simlaensis shows significant positive correlations but Eutyphoeus incommodus, Polypheretima elongata and Metaphire houlleti shows significant negative correlations with Zinc. Drawida nepalensis, Polypheretima elongata, Metaphire houlleti, Octochaetona surensis, Drawida papillijer papillijer all shows significant negative correlations with soil Lead content except Perionyx excavatus and Perionyx simlaensis. Only Eutyphoeus orientalis shows significant negative correlations but Perionyx excavatus and Perionyx simlaensis shows significant positive correlations with soil Copper content. Except Perionyx excavatus and Perionyx simlaensis, Drawida nepalensis, Polypheretima elongata, Metaphire houlleti,

CHOWDHURY et. ale : On Taxonomy and Ecology of Earthworms (Annelida : Oligochaeta) ... 29
Octochaetona surensis, Drawida papillijer papillijer all shows significant positive correlations with nitrate. Only Eutyphoeus incommodus shows significant positive correlations with phosphate. Drawida nepalensis and Drawida papillifer papillifer shows significant positive correlations with available K
20 but Eutyphoeus orientalis
shows significant negative correlations. All the studied he~vy metals shows significant negative correlations with organic Carbon. Except copper all the studied heavy metals shows significant negative correlations with pH. Organic Carbon shows positive correlations with nitrate. Cadmium, Zinc contents shows significant negative correlations with soil humidity, both soil surface and subsoil.
In Site II earthworm population shows significant positive correlations with fungi and bacteria-actinomycetes population as well as with subsoil relative humidity and available Nitrogen but shows significant negative correlations with all four studied heavy metals i.e. Cadmium, Zinc, Lead and Copper and also with soil electrical conductivity. Fungi population shows significant positive correlations with bacteria-actinomycetes population as well as with surface and subsoil relative humidity, soil pH, available Nitrogen and available P 2°
5 but shows significant negative correlations with all four
studied heavy metals and also with soil electrical conductivity and available K2 0. Bacteria-actinomycetes population shows significant positive correlations with surface and subsoil relative humidity, surface and subsoil temperature, but shows significant negative correlations with all four studied heavy metals and also with soil electrical conductivity and available K
20 (Table 20).
Site III/ BRF The correlation coefficient data ('r' value) mentioned in the Table 19 indicates that in
Reserve forest only Eutyphoeus orientalis shows significant positive correlations with surface temperature. Metaphire posthuma and Eutyphoeus orientalis shows significant positive correlations with subsoil temperature. Lampito mauritii, Metaphire posthuma, Eutyphoeus orien talis , Eutyphoeus nicholsoni, Eutyphoeus incommodus all shows significant positive correlations with surface and subsoil humidity. Octochaetona beatrix shows significant positive correlations with ~urface humidity. Only Eutyphoeus nicholsoni shows significant positive correlations with soil pH. Organic Carbon shows significant positive correlations with Lampito mauritii, Metaphire posthuma, Eutyphoeus nicholsoni, Metaphire houlleti, Octochaetona beatrix. Metaphire houlleti and Octochaetona beatrix shows significant pos.itive correlations with nitrate. Eutyphoeus nicholsoni and Eutyphoeus incommodus shows significant positive correlations with available K
20. Cadmium shows significant negative correlations with
Lampito mauritii, Metaphire posthuma, Eutyphoeus orientalis, Octochaetona beatrix and Amynthas corticis. Zinc shows significant negative correlations with Lampito mauritii, Metaphire posthuma, Metaphire houlleti, Octochaetona beatrix. Lead shows

30 Rec. zool. Surv. India, Dcc. Paper No. 324
significant negative correlations with Lampito mauritii and Eutyphoeus orientalis. Copper shows significant negative correlations with Lampito mauritii, Metaphire posthuma, Metaphire hOlllleti. All the studied heavy metals shows significant negative correlations with both soil surface and subsoil humidity. All the studied heavy metals shows significant negative correlations with organic Carbon. Available P 205 shows significant negative correlations with organic Carbon, but available K2 ° shows significant positive correlations.
In Site III earthworm population shows significant positive correlations with fungi and bacteria-actinomycetes population as well as with surface and subsoil relative humidity, soil organic Carbon and available K
20, but shows significant negative correlations with all
four studied heavy metals. Fungi population shows significant positive correlations with bacteria-actinomycetes population as well as with surface and subsoil relative humidity, organic Carbon, available Nitrogen but shows significant negative correlations with all four studied heavy metals. Bacteria-actinomycetes popUlation shows significant positive correlations with surface and subsoil r~lative humidity, organic Carbon, available Nitrogen and available K
20, but shows significant negative correlations with all four studied heavy
metals and with available P 205 (Table 20).
Analysis of variance
An univariate analysis of variant with the month and locality as a factor have been carried out to find out whether any significant seasonal fluctuation as well as site wise fluctuation exists or not in the population of total and individual species of earthworm, total and individual genera of fungi, total and individual genera of bacteriaactinomycetes, different soil abiotic factors and heavy metals. The results of analysis are represented in the Tables 21-25. From the Tables 21a-210, it is evident that site wise fluctuation of earthworm population as well as different species namely, Lampito mauritii, Metaphire posthuma, Perionyx excavatus, Eutyphoeus orientalis, EutyphDeus incommodus, Drawida nepalensis and Me taph ire houlleti were significant. In the fungal community site wise significant fluctuation were shown by fungal population and different genera of fungi viz. Penicillium sp., Aspergillus sp., Fusarium sp., Trichoderma sp. and Cladosporium sp .. (Tables 22a-22k). From the Tables 23a-23n, it is evident that site wise fluctuation ofbacteria-actinomyetes population as well as individual genera viz. Streptomyces sp., Micrococcus I, Micrococcus II, Arthrobacter sp., Pseudomonas sp., Promicromonospora sp., Azotobacter sp. was significant. Site wise significant fluctuation was shown by upper surface and subsoil temperature, pH, electrical conductivity, organic Carbon, available Nitrogen and available K
20 and all the four
studied heavy metals (Tables 24 and 25).
From the Tables 21a-210, it is evident that except Eutyphoeus nicholsoni, Drawida nepalensis, Amynthas corticis and Octochaetona beatrix all other earthworm species as

CHOWDHURYet. al. : On Taxonomy and Ecology of Earthworms (Annelida: Oligochaeta) ... 31
well as earthworm population shows significant seasonal fluctuation. In the fungal community significant seasonal fluctuation were shown by fungi population and different genera of fungi except Cephalosporium sp. and Sclerotium sp. (Tables 22a-22k). Except Arthrobacter sp., E. coli, Azotobacter sp. and Nocardia sp. all other bacteria-actinomycetes genera as well as bacteria-actinomycetes population shows significant seasonal fluctuation (Tables 23a-23n). All the studied abiotic factors and heavy metals showed significant seasonal fluctuation (Tables 24 and 25).
Step Regression Analysis
To determine the effects of soil factors on the earthworm community usually the linear regression technique is followed. But, in that case, the factors are assumed to be independent, which is rather inapplicable. Therefore, Stepwise Linear Regression analysis was ca"rried out, with the inclusion of a new factor already considered at every stage. However, there is no a priori theory about which factor or factors (biotic/abiotic) are most important. The steps were not been repeated until all the factors were included" in the model. In this study, the predominant species .of earthworm in a given site were considered as dependable variables and the observations of analysis were continued till the factors considered the improvement value up to 1% level. The results of tests are showed in the Tables 26a-26i.
Table 26a showed that effects of only Lampito mauritii and Perionyx excavatus were most important on the total population of earthworm in Site I. In Site II Micrococcus I, Metaphire houlleti, Eutyphoeus incommodus, Drawida nepalensis, Eutyphoeus orientalis, Drawida papillijer papillijer, Perionyx excavatus, Metaphire po~thuma, Po lyphere tim a elongata, Perionyx simlaensis w~re dominant on total P9pulation of earthworm whereas in Site III, the total population of earthworm were governed by Lampito mauritii, Eutyphoeus incomntodus, Perionyx excavatus, Eutyphoeus orientalis, Drawida nepalensis, Metaphire posthuma, Eutyphoeus nicholsoni, Octochaetona beatrix, humidity (upper surface), Metaphire houlleti.
Table 26b showed that effects of the total earthworm population and Perionyx excavatus were most important on the population density of the most domi.nant species Lampito mauritii in Site I. In Site III ten factors namely total earthworm population, Perionyx excavatus, Eutyphoeus incommodus, Eutyphoeus orientalis, Drawida nepalensis, Metaphire posthuma, Eutyphoeus nicholsoni, Octochaetona beatrix, humidity (upper surface), Metaphire houlleti found to have important impact on the population density of Lampito mauritii.
The abundance of Metaphire posthuma was governed by twenty-one factors namely organic Carbon, Cd, electrical conductivity, Rhizopus sp., Micrococcus I, Lampito mauritii, total population of earthworm, Flavobacterium sp., Available P 205'

32 Rec. zool. Surv. India, Dcc. Paper No. 324
Arthrobacter sp., humidity (subsoil), Cu, Aspergillus sp., Cephalosporium sp., Streptomyces sp., Zn, Pseudomonas sp, Mucor sp., available K
20, temperature (subsoil),
Fusarium sp. in Site I, but in Site II, it is governed by twenty-two factors namely, humidity (subsoil), Pb, Rhizopus sp., Cd, Eutyphoeus orientalis, Streptomyces sp., Micrococcus I, Perionyx simlaensis, Octochaetona surensis, Pseudomonas· sp., Fusarium sp., Aspergillus sp., pH, Perionyx excavatus, total earthworm population, Metaphire houlleti, available P 205' Zn, available ~O, Polypheretima elongata, electrical conductivity, Penicillium sp. In Site III it is governed by twenty-three factors namely, total earthworm population, Eutyphoeus nicholsoni, Curvularia sp., Octochaetona beatrix, Penicillium sp., organic Carbon, Aspergillus sp., pH, Fusarium sp., electrical conductivity, Rhizopus sp., available N
2, Lampito mauritii, Perionyx excavatus, Bacillus
sp., humidity (subsoil), Trichoderma sp., available P 205' temperature (subsoil), Metaphire houlleti, Pb, total bacteria-actinomycetes genera, Pseudomonas sp. (Table 26c).
Table 26d showed that effect of the following twenty-four factors namely, subsoil relative humidity, Micrococcus II, available nitrate, pH, E. coli, Penicillium sp., Total fungi genera, surface soil relative humidity, Zinc, organic Carbon, Fusarium sp., Pb, Aspergillus sp., Metaphire posthuma, Lampito mauritii, electrical conductivity, Streptomyces sp., Bacillus sp., Promicromonospora sp., surface soil temperature, Enterobacter sp., Mucor sp., available K
20, subsoil temperature were most important on
the population density of Perionyx excavatus in Site I, but, in Site II, twenty-four factors namely, Perionyx simlaensis, Pseudomonas ~p., Drawida papillifer papillifer, Aspergillus sp., Azotobacter sp., Zn, Octochaetona surensis, total bacteriaactinomycetes gener~, available P 205' Fusarium sp., Mucor sp., Metaphire posthuma, Eutyphoeus orientalis, Micrococcus I, Eutyphoeus incommodus, available N
2, humidity
(upper surface), humidity (subsoil), electrical copductivity, Rhizopus sp., temperature (subsoil), Streptomyces sp., total fungi genera, organic Carbon have impact on the population, in Site III, twenty-one factors namely, Cu, humidity (upper surface), Rhizopus sp., available K20, Aspergillus sp., Metaphire posthuma, Eutyphoeus incommodus, Octochaetona beatrix, total earthworm population, Lampito mauritii, temperature (upper surface), Drawida nepalensis, Eutyphoeus orientalis, Metaphire houlleti, Arthrobacter sp., humidity (subsoil), Sclerotium sp., Mucor sp., Trichoderma sp., Azotobacter sp., Pseudomonas sp. found to have impact on the population.
In Site II the population of Eutyphoeus orientalis was governed by twenty-two factors namely humidity (subsoil), total bacteria-actinomycetes genera; available K
20, Mucor
sp., Trichoderma sp., Pb, Metaphire houlleti, total earthworm popUlation, temperature (upper surface), Eutyphoeus incommodus, Drawida papillifer papillifer, Metaphire posthuma, Azotobacter sp., Nocardia sp., Perionyx excavatus, Aspergillus sp.,

CHOWDHURY et. ale : On Taxonomy and Ecology of Earthworms (Annelida : Oligochaeta) ... 33
Fusarium spo, available N2, Streptomyces sp., total fungi genera, available P 205' Cu but in Site III it is controlled by twenty factors namely, total earthworm population, temperature (subsoil), Amynthas corticis, available P 205; organic Carbon, available K20,
pH, Perionyx excavatus, electrical conductivity, Drawida nepalensis, Lampito mauritii, Trichoderma sp., Aspergillus sp., Mucor sp., Metaphire posthuma, temperature (upper surface), Fusarium sp., total fungi genera, Pb, Azotobacter sp. (Tab~e 26e). From Ta?le 26f it has been found that population of Eutyphoeus incommodus was controlled by twenty-three factors namely, total earthworm population, Drawidapapillifer papillifer, Eutyphoeus orientalis, Perionyx excavatus" Drawida nepaiensis" Polypheretima elongata, Metaphire posthuma, Pseudomonas sp., Metaphire houlleti, total fungi genera, Octochaetona surensis, Aspergillus sp., Rhizopus sp'., Nocardia sp., ~treptomyces sp., Trichoderma spo, Fusarium sp., Mucor sp., organic Carbon, Ph, temperature (upper surface), electrical cond~ctivity, Azotobactel' sp., in Site II. But, in Site III it was controlled by 'twenty-two factors namely, ~utyphoeus nicholsoni, 'Metaphire houlleti; Metaphire posthuma, Amynthas corticis, Sclerotium spo, Fusarium sp., Arthrobacter spo, Cu, Azotobacter sp., Micrococcus II, Perionyx excavatus, Rhizopus spo, Aspergillus sp., Curvularia sp., Available N
2, pH, Micrococcus I, Streptomyces sp.,
humidity (subsoil), Eutyphoeus orien ta lis, Promicromonospora sp., total bacteriaactinomycetes genera. Table 26g showed that effect of the following twenty-three factors namely Drawida papillijer papillifer, available P 205' surface soil temperature, Trichoderma sp., Cadmium, electrical conductivity, Penicillium sp . ., humidity (upper surface), Streptomyces sp., Cu, temperature (subsoil), Rhizopus sp., available N
2,
Perionyx simlaensis, Metaphire houlleti, Azotobacter sp., Fusarium sp., Polypheretima e'ongata, Metaphire posthuma, Nocardia sp., pH, Bacillus sp., Eutyphoeus orientalis were most important on the population density of Drawida nepalensis in Site II, but, in Site III, it was governed by twenty-one factors namely, Eutyphoeus, nicholsoni, Amynthas corticis, temperature (subsoil), Perionyx excavatus, available ,K
20, electrical
conductivity, total earthworm population, Curvularia sp., Metaphire posthuma, Lampito mauritii, Mucor sp., pH, Sclerotium sp'., Streptomyces sp., Octochaetona beatrix, available N
2, Fusarium sp., total bacteria-actinomycetes genera, Micrococcus II,
Trichoderma sp., temperature (upper surface). The abundance of Polypheretima elongata was governed by twenty-one factors namely, Metaphire houlleti, electrical conductiVity, cadmium, Streptomyces sp., Pseuc!omon..as sp., humidity (~pper surface), pH, Nocardia sp., Cu, Fusarium sp., Perionyx excavatus, Micrococcus I, Drawida papilliJer papillifer, Drawida nepalensis, organic Carbon, Bac~llus sp., total bacteriaactinomycetes genera, Zn, humidity (subsoil), Mucor sp., temperature (subsoil) (Table 26h).
From Table 26i it has been found that population of Dratpida papillifer papillijer was controlled by twenty-three factors namely, Drawida nepalensis, Poiypheretima

34 Rec. zoo/. Surv. India, Dcc. Paper No. 324
elongata, temperature (subsoil), Azotobacter sp., Metaphire posthuma, organic Carbon, Fusarium sp., Perionyx excavatus, Zn, Cd, available P 205' available N2, electrical conductivity, total fungi genera, Perionyx simlaensis, Trichoderma sp., temperature (upper surface), Pb, total bacteria-actinomycetes genera, Pseudomonas sp., Penicillium sp., Octochaetona surensis, available K
20.
DISCUSSION The present studies were based on the sample survey of twelve plots from ,three
contrast ecological habitats of West Bengal over a period of twenty-five months (June 2001 to August 2003). Among the plots sampled, four had polluted environment, four were from an uncultivated field and remaining four were from the forest floor that was affected by flood in the year 2001. All the plots under study were in the Gangetic plain exposed to tropical climate with high humidity and high temperature; both of which were comparatively low during winter months. The general nature of soil in all the plots was more or less identical.
The surface soil of the plots. in general contained good vegetational cover except wastes disposal site.
Th~ earthworm fauna obtained here belonged to eight genera under three families viz. Megascolicidae, Octochaetidae and Moniligastridae (Plates I-XIV). However, all the Indian earthworm species belonged to ten families (Julka, 1988). As mentioned earlier, some forms differed in their abundance from one site to other and from season to season. MoreQver, the number of genera occurring in the different sampling s~tes also varied, maximum being extracted from the Reserve forest, ten species under seven genera and minimum from the Wastes disposal site, three species under three genera (Tables 3 and 13). Of the e~ght genera encountered in this study the predominant were Lampito (one species), Eutyphoeus (three species), Drawida, Metaphire, Perionyx (each with two species), Polypheretima (one species), Octochaetona (two species) and Amynthus (one species) i,n order of dominance (Tab. 27, Fig. 85). The genus Lampito, consi~ting of single species, L. mauritii, was found only in two sampling sites, except Site II, comprising of 48.03% of total earthworm population (Table 27, Fig. 86) and being numerically dominant over other forms. In Site I the species comprises over 90% of the total earthworm population (Fjg. ,I). This might be due to .the existences of favourable microclimatic ~onditions requiring for this species. This genus exhibited its peak population in the month of August; another medium peak was in September (Tab. 28, Fig. 86). The species was not found in Site II might be due to presence of high percentage of clay content which causes less porosity and aeration in soil (Tab. 1). As it is an anecic species higher clay content might have poised problem to make vertical burrow. Similar observation was also made by Piearce (1978) and Muys et ale (1992) in case of deep

CHOWDHURY et. ale : On Taxonomy and Ecology of Earthworms (Annelida : Oligochaeta) ... 35
burrowing anecic species Lumbricus terrestris. Ismail and Murthy (1985) found that L. mauritii prefers sandy loam soil. Hernandez et ale (2003) also found that Aporrectodea trapezoids were abundant in places with high porosity and aeration. Gonzalez et ale (1999) observed that the composition of plant species could influence the distribution of earthworm in wet tropical forests.
The second dominant genus Eutyphoeus was represented by thre.e species and comprising of 23.99% of total earthworm population, being found in two sites except wastes disposal site. Among this genus, the species E. incommodus was the most dominant and comprising of 12.56% of total earthworm population (Tab. 27, Fig. 85). This species was most abundant in the uncultivated field (Site II) and comprising of 32.4596 of the total earthworm fauna collected from this site. This species showed its peak population in September and followed by October (Tab. 28, Fig. 86). In order of dominance Eutyphoeus orientalis occupies second position consisting of 16.4% of the earthworm fauna collected from Reserve forest (Site III) and 20.1% from uncultivated field (Site II), being maximum in June-July in Site III and July-August in Site II (Tables 27 and 28, Figs. 85 and 86). The third species belonging to this genus was Eutyphoeus nicholsoni, found only in Reserve forest floor being numerically very poor and showed its peak in August (Tables 27 and 28, Figs. 85 and 86).
The third dominant genus was Drawida comprising 13.93% of total earthworm population, represented by two species and occurred in two sites, which was not found in wastes disposal site. The species D. papillijer papillijer was the most. dominant taxon under this genus, comprising of 11.69% of total earthworm population, found only in Site II and recorded for the first time from West Bengal (Tab. 27, Fig. 85). The population of this species comprising of 31.16% and was the second dominant species collected from Site II. The spe'cies found maximum in number in October and.November and other peak population in January 2003 (Tab. 28, Fig. 86). The species D. nepa{ensis obtained under this genus was found to occur in both reserve forest area and uncultivated field. In Site II peak population was found in October-November and January. In forest floor site the maximum population was in August-September and another peak was in January (Tables 27 and 28, Figs. 85 and 86).
The fourth dOlninant genus Metaphire was found in all the studied sites comprising of 6.2296 of total earthworm population (Tab. 27, Fig .. 85). The species M. posthuma was the most dominant among this genus and comprising of 5.44% of the total earthworm population and distributed in all the sites. The population was maximum in AugustSeptember and other small peak was found in June and October (Tab. 27, Fig. 86). The species M. houlletii belonging to this genus was found in both forest floors as well as in uncultivated field and present numerically very low. The maximum population of this species were in the month of October from the uncultivated field. In forest floor the population was maximum in July-August (Tables 27 and 28, Figs. 85 and 86).

Rec. zool. Surv. India, Dcc. Paper No. 324
The fifth dominant genus was Perionyx occurred in all the sites and comprising of 6.09% of total earthworm population. Two species were found under this genus namely P. excavatus and P. simlaensis, of which P. simlaensis was found only in uncultivated field and also recorded for the first time from West Bengal, comprising of 0.36% of total earthworm population (Tab. 27, Fig. 85). The species P. excavatus was found in all the sites comprising of 5.73% of total number of earthworm collected (Tab. 27, Fig. 85). The population was maximum in April-May in Site I, March and June in Site II, January and Ma,rch in Site III (Tab. 28, Fig. 86).
The genus, Polypheretima was represented by single species namely P. elongata, found only in uncultivated field (Site II), comprising of 0.84% of total earthworm population. The peak population was in October (Tables 27 and 28, Figs. 8S and 86).
The genus Octochaetona was represented by two species namely o. surensis and o. beatrix and comprising of 0.72% of total earthworm population. O. surensis found only in uncll:ltivated field. It is interesting to note that this species was recorded for the first time from West Bengal. The population of this species was very low comprising of 0.52% of total earthworm population. The peak popUlation was in September. The population of O. beatrix was also very low and comprising of 0.20% of total earthworm population, found only from forest floor and population was maximum in August (Tables 27 and 28, Figs. 85 and 86).
The genus Amynthas was represented by single species A. corticis and found only in forest floor. The number of occurrence of this species was very poor and found in the month of August and September (Tables 27 and 28, Figs. 85 and 86).
The quantitative and qualitative variations of earthworm population from one site to other and also from one month to another month might be due to the differences in vegetations and micro climatic conditions of the studied area. Some earthworm genera \vere occurring regularly in different sampling sites, they could tolerate wide range of habitats and aptly called "ubiquitous" or "ecological generalists groups"; on the other hand, some species were restricted to a particular ecological condition and they were accordingly termed as "stenoecious" or "ecological specialists groups"
The seven species of earthworms namely Lampito mauritii, Metaphire posthuma, Perionyx excavatus, Eutyphoeus orientalis, Eutyphoeus incommodus, Drawida nepalensis, Metaphire houlleti seemed to have wider tolerance for various habitats in the present study, therefore, they were "ubiquitous" (Tab. 29). While other seven species of earthworms were found to be restricted to any single site of three contrasting habitats namely, Eutyphoeus nicholsoni, Perionyx simlaensis, Polypheretima elongata, Amynthas corticis, Octochaetona beatrix, Octochaetona surensis, Drawida papillifer papillijer and as such they were "stenoecious" (Tab. 29). Chaudhuri and Bhattacharjee (1999) while working with earthworm resources of Tripura found seventeen species in

CHOWDHURYet. al. : On Taxonomy and Ecology of Earthworms (Annelida: Oligochaeta) .t. 37
three different habitats. Bano and Kale (1991), while studying earthworm fauna of Southern Karnataka, obtained forty-four species in three different habitats, among them four species were found to be ubiquitous. According to Julka and Paliwal (1986) IndoGanga plain have pauper fauna, majority of the genera have endemicity in the Deccan Peninsula.
The species diversity of the earthworm community at a given locality is influenced by the characteristics of the soil, climate and organic resources of the locality, as well as its history of land use and soil disturbance (Edwards and Bohlen, 1996). The earthworm communities of the tropical rainforests contained from four to fourteen species and had a mean species richness 6.S±1.3 species (Lee, 1985). The distribution pattern of various species of earthworm and their numerical importance in total earthworm fauna expressed in terms of relative density. The results thus obtained are presented in the Table 27 and Figure 86. Kale (1993) opined that as soil moisture and available organic matter are important limiting factors for their distribution, species diversity is more in heavy rainfall areas with large plantations and forests than in the plains ~th dry farm lands which experience unpredictable and poor rainfall.
The population of earthworm fauna obtained from all the sampling sites in the present study showed numerically variation with the change of season (Figs. 2-9, 30-37 and 58-65). It was minimum in January in Site I, May-June in Site II and December in Site III. A low summer and winter population of earthworm agreed with the general experience of this group as reported from different types of habitat of India by several workers. Senapati and Sahu (1993) opined that too dry and too cold or too warm soil is unfavourable for soft bodied poikilotherms like earthworms which are devoid of any exoskeletal protective cover. Evans and Guild (1947), Satchell (1967) and Reynolds (1972) also recorded the earthworm density pattern in direct proportion to soil moisture. A remarkable variation observed in their maximum population. Highest population observed during monsoon (August) in Site I and III and in Site II it was observed during post monsoon season i.e. in October (Figs. 2-9, 30-37 and 58-65). Soil temperature and soil moisture considered to affect seasonal fluctuations in the popUlation density of earthworms (Edwards and Lofty, 1977). Gates (1961), Dash and Patra (1977) and Dash and Senapati (1980) reported that earthworms were mainly active during the summer rains between May and October in the tropical climate of Burma and subtropical cliina~e of India. Chauhan (1980) observed that the worm's population was very much affected in March, April and May of summer and December·in winter. Kaleemurrahman and Ismail (1981) correlates increase in biomass with increase in moisture content of soil. Darlong and Alfred (1991) observed that the number and biomass of different species of earthworms fluctuated seasonally, with an increase in the monsoon or rainy season (April-October) and a decrease in the dry winter season (November-March). Nakamura (1968 a, b) also have the similar observations in grassland in Japan, the greatest numbers

Rec. zool. Surv. India, Dcc. faper No. 324
of earthworms occurred in autumn, especially in October and the numbers were very low in winter, particularly during January and February. The seasonal dynamics over an annual cycle have shown that the earthworm populations and biomass were high in the rainy and early winter season and low in summer (Bhadauria and Ramakrishnan, 1989).
In this study the population densities of earthworm fauna collected from waste disposal site was maximum (42.06%), followed by the uncultivated field (37.53%) and forest site (20.40%) (Fig. 87). Comparatively poor populations in forest floor may be due to the effect of flood in the year 2001. As Site I is a polluted environment so species diversity is very poor, only three earthworm species o1>tained but total number of earthworms was very high. Organic residues were left on soil surface reducing the moisture loss and providing relatively continuous substrate for decomposers; organic matter input is more gradual as in nutrient release. In Site I higher amount of organic carbon, optimal condition of temperature and moisture probably provides a more favourable environment for earthworm populations. Plots with organic manure are known to support higher populations of earthworms (Satchell, 1955) as food supply appears to be the major factor for earthworm distribution (Abbott and Parker, 1980). Senapati and Sahu (1993) observed a maximum number of five species occur in natural grassland whereas in man interfered grassland and crop field one to three species has been reported in different agroecosystems of Orissa.
Population fluctuation of same species have shown differences in abundance or peak from one site to another site which might be the effect of soil type, microbial population, different edaphic parameters and heavy metal content of a particular site. Bellinger .(1954) suggested that the habitat preference of soil animal determined by soil microflora with many edaphic factors.
The study of association of earthworms with the soil microorganisms previously recorded by Khambata and Bhatt (1957), Parle (1963a, b), Dash and Cragg (1972), Dash et ale (1979), Satchell (1983b), Srinivasulu (1985), Bhattacharya and Chakrabarti (1986), Edwards and Fletcher (1988), Foster (1988), Striganova et al. (1989), Tiwari et ale (1989), Baroi~. (1992), Daniel and Anderson (1992), Judas (1992), Kristufek et ale (1992), Karsten and Drake (1995, 1997), Trigo el' ale (1999), Wolter and Scheu (1999), Furlong et ale (2002), Ihssen et ale (2003). Satchell (1974) and Parkinson (1983) reviewed the interactive roles of the litter microflora and fauna in decomposition processes and they reiterated the view that soil invertebrate biomass acted "as a reservoir of plant nutrients" and served as a brake to nutrient leaching from decomposing litter. This implied considerable consumption of microbial tissue (the primary decomposer organisms) by invertebrates.
In this study, the soil microbial community encountered, belonged to ten fungal genera, eleven bacterial genera and two actinomycetes genera (Tables 30 and 33). As

CHOWDHURY et. ale : On Taxonomy and Ecology of Earthworms (Annelida : Oligochaeta) ... 39
stated earlier, the abundance of these forms were varied from one site to other and from season to season (Figs. 88 and 89). The density of most of the dominant taxa in microbial flora generally took remarkable changes throughout the year in which one or two outstanding maximum and minimum population occurred.
Of the ten fungal genera encountered Penicillium sp., Aspergillus sp. and Rhizopus sp. is mentioned in order of dominance (Tab. 30, Fig. 88).
The most prevalent form was Penicillium sp. consisting of 60.21% of the total fungi flora obtained during this study and was isolated from all the samples collected for this study. Interestingly the peak population of this genus in each site coincided with that of the peak population of total fungi. The peak population of this genus was found in the month of August in all the studied year (Tables 30 and 31, Figs. 88 and 89).
The second dominant genus was Aspergillus sp., built up 18.1% of the total fungal population. Interestingly, this genus holds second dominant position in all the three sampling sites. Its occurrence was most pronounced in Site I (6.97% of total fungi population) and presents in all the samples of Site I and II. But in Site III it exhibited infrequent occurrence. The maximum population of this genus was observed in the month of August in the year 2001 and 2003 and in the month of ~eptember in the year 2002 (Tables 30 and 31, Figs. 88 and 89).
The genus Rhizopus sp. occupied third dominant position, consisting of 5.49% of the total fungal flora. This form was isolated from all the study sites. The population of this genus was maximum in reserve forest (2.23% of total fungal population). This genus showed maximum population in the month of August and very irregular in occurrence (Tables 30 and 31, Figs. 88 and 89).
The other important fungi isolated were Fusarium sp., Mucor sp., Trichoderma sp., Cladosporium sp. and Cephalosporium sp. constituted 4.77%, 4.01%, 3.56%, 1.5% and 1.1696, respectively of total fungal population buildup (Tab. 30, Fig. 88).
Among the fungi community encountered in this study, six genera namely Penicillium sp., Aspergillus sp., Fusarium sp., Rhizopus sp., Muco"r sp. and Trichoderma sp. were "ubiquitous" indicating their capability to withstand a varying ecological condition in comparison to other four genera. Cladosporium sp., Cephalosporium sp., Sclerotium sp. and Curvularia sp. occupied individually very minor position in relation to total fungi community and were termed as "stenoecious" being restricted as localized forms in single sampling site (Tab. 32). Hazra and Choudhuri (1990) also found that the Penicillium sp. and Aspergillus sp. having capability to tolerate eleven different habitats of West Bengal.
It is evident from the Table 33 and Fig. 91 that in bacteria-actinomycetes community the actinomycetes genus Streptomyces sp. outnumbered all the other forms and

40 Ree. zool. Surv. India, Dec. Paper No. 324
consisting of 36.48% of total population followed by Bacillus sp. (28.94%), Arthrobacter sp. (12.49%) and Micrococcus I (8.22%).
Maximum isolates of Streptomyces sp. obtained from Site II, consisting of 15.30% of total bacteria-actinomycetes population. In Site III this genus consisting of 12.5% of total bacteria-actinomycetes population and in wastes disposal Site it consisting of 8.68% of total bacteria-actinomycetes population. Peak population of this genus occurred in July. However, in the year 2003 the maximum population of this genus were in August (Tables 33 and 34, Figs. 91 and 92). Jensen (1930), Kuster (1968), Kutzner (1968) and Huntjens (1972) identified actinomycetes as a major group of soil microorganisms and mentioned their active participation in turnover of soil organic matter.
In the present study, another genus of actinomycetes namely Nocardia sp. was obtained but only from Site II. It consisting of 1.49% of total bacteria-actinomycetes population. The members of the actinomycetes genus Strep'tomyces sp. (constituted 96.06% of actinomycetes population) found to be dominated over the bacterial genera in all the sampling sites except waste disposal area (Tables 33 and 34, Figs. 91 and 92). Prevalence of Streptomyces sp. among the soil actinomycetes was also well documented by Davis and Williams (1970); Selin (1971); Alexander (1977). The actinomycetes population was consisting of 37.98% of total bacteria actinomycetes population in this observation. Alexander (1977) observed soil actinomycetes population made up 10-50% of total bacteria-actinomycetes population.
The second dominant form in bacteria-actinomycetes community was the BCl;Cilius sp., which consisting of 28.94% of total population. It is interesting to note that only in waste disposal area this genus "found to be dominated over the other forms (Tab. 33, Fig. 91). This genus appeared in all samples collected during this study period. Peak population of this genus occurred in August in the year 2001. But in the year 2002 the population maxima were found in the month of September. In the year 2003, peak population was obtained both in the month of January and August (Tab. 34, Fig. 92).
The third major form in bacteria-actinomycetes community was the bacterial genus Arthrobacter sp. consisting of 12.49% of total bacteria-actinomycetes population. Maximum number of this genus was obtained from Site II (6.57% of total bacteriaactinomycetes population), followed by Site III (3.41% of total bacteria-actinomycetes population) and Site I (2.51% of total bacteria-actinomycetes population). It was found as a second dominant form in Site II. The peak population of this genus occurred in September in the year 2001 and 2002, but in the month of August in the year 2003 (Tables 33 and 34, Figs. 91 and 92).
In the present study two cocci forms were obtained in the bacterial community, Micrococcus I and Micrococcus II. Micrococcus I occurred in all sites being an important member in microbial community and occupied fourth dominant position in bacteria-

CHOWDHURY et. ale : On Taxonomy and Ecology of Earthworms (Annelida : Oligochaeta) ... 41
actinomycetes community. Micrococcus I was abundant in forest site (3.65% of total bacteria-actinomycetes population) whereas Micrococcus II was abundant in wastes disposal site (2.03% of total bacteria-actinomycetes population). Population density of Micrococcus I was maximum in the month of September in the year 2001 and 2002, whereas for Micrococcus II it varies from year to year with irregular occurrence (Tables 33 and 34, Figs. 91 and 92).
In this study Pseudomonas sp. and E. coli were found to be gram-negative, of which E. coil was obtained only from wastes disposal site and consisting of 0.8% of total bacteria-actinomycetes population. The genus Pseudomonas sp. was obtained from all the study sites, being maximum in Site II (0.53% of total bacteria-actinomycetes population) followed by wastes disposal site (0.45% of total bacteria-actinomycetes population) (Tables 33 and 34, Figs. 91 and 92). Both this gram-negative strains together constituted 3.68% of total bacteria-actinomycetes population.
The other bacterial genera obtained in this study were Cytophaga sp, Flavobacterium sp., Enterobacter sp., Promicromonospora sp. and Azotobacter sp. which consisting of 1.6896, 0.2496, 0.5396, 0.9% and 1.33%, respectively of total bacteria-actinomycetes population (Tab. 33).
The Table 35 revealed that, the bacterial genera Cytophaga sp., E. coli, Flavobacterium sp., Enterobacter sp. and the actinomycetes Nocardia sp. were recorded from only one site and may be called as 'stenoecious' form. On the contrary, the distribution pattern of other five genera namely Streptomyces sp., Bacillus sp., Arthrobacter sp., Micrococcus I and Pseudomonas sp. suggested their capability to withstand varying ecological conditions and thus they may be termed as 'ubiquitous' (Tab. 35).
Population densities of bacteria-actinomycetes obtained from all the sites showed numerical variations with changes of season. It was minimum when the population of fungi as well as earthworm was also minimum in summer month particularly in the month of May (Tables 4, 9 and 14). In some cases lower population of bacteriaactinomycetes was also obtained during winter season, along with the lower occurrences of earthworm and fungi population (Figs. 16, 44 and 72). Behera and Dash (1981) in Orrisa, Hazra and Choudhuri (1990), Pal et ale (1992) in West Bengal found minimum population of fungi only in the month of May. Reduction in the number of microorganism as well as earthworm fauna in summer months and in some winter month may be due to the lower moisture content of the soil. Reduction in population of earthworm in association with decline in fungal and bacteria-actinomycetes popUlation in this study may be one of the reason that microflora especially fungi serves as food for earthworm. Dash and Cragg (1972), Dash et ale (1979) opined that fungal hyphae and spores were the major food for earthworm.
42 Rec. zool. Surv. India, Occ. Paper No. 324
The peak population of earthworm and microorganisms were fQund in the month of August or October i.e. in the monsoon and post monsoon season. This significant increase in population may be due to the higher moisture content of soil. Hazra and Choudhuri (1990), Pal et ale (1992) opined that significant increase in the moisture content of soil leading to a luxuriant growth of macro and micro flora during monsoon. Present study pointed out that almost similar seasonal fluctuation exists among earthworm fauna and soil microorganisms (Figs. 16, 44 and 72). It might be due to the similar requirements of different soil factors viz. temperature, moisture, organic carbon, nitrate, phosphate etc. among the earthworm and microorganisms. It is a well known fact that earthworms prefer various microorganisms as their food (Piearce, 1978; Dash et al., 1979, 1984; Cooke, 1983; Edwards and Fletcher, 1988). So, increase or decrease in the microorganism population might affect the abundance of earthworm population. Lee (1985) opined that there is evidence that earthworms derive much of their nutritional requirements from fungi and microorganisms that are ingested with detritus, so overall rates of cocoon production and seasonal variations in rates may relate more to rates of production of fungal and microbial tissue on decaying detritus than directly to physical parameters of the soil environment. Similar dependence of microflora and earthworms on the nature of available organic matter was reported by Bhat (1974). This situation was also observed by Kale et ale (1991) under laboratory conditions.
In this study the population densities of earthworm fauna collected from wastes disposal site was maximum (42.06%), followed by the uncultivated field (37.53%) and forest site (20.40%) (Fig. 87). The bacteria-actinomycetes population was also found in the same sequence among the three sampling sites i.e. 36.06%, 32.10% and 31.83%, respectively (Fig. 93). Maximum population of fungi was also obtained from wastes disposal sites (38.89%) and minimum found in uncultivated field (30.04%) (Fig. 90). Highest population of earthworm as well as microflora in wastes disposal site might be due to the higher amount of organic carbon, moisture and available nitrogen content in soil.
The number of isolates of microbial flora obtained from wastes disposal site were under ten bacteria-actinomycetes genera and seven fungal genera; while forest floor harboured seven bacteria-actinomycetes genera and nine fungal genera. On the other hand, in uncultivated field, seven number of each bacteria -actinomycetes and fungal genera were obtained. The increase in number of genera of microflora in waste disposal site and forest floor in comparison to uncultivated field might be due to the presence of higher amount of inorganic and organic nutrients in the form of inorganic and organic wastes in wastes disposal site and litter deposition in the forest soil. Reduction in number of earthworm forms (only three species) in the wastes disposal site was perhaps due to the potential toxic effects of some of the pollutants or heavy metals on earthworm

CHOWDHURY et. al. : On Taxonomy and Ecology of Earthworms (Annelida : Oligochaeta) ... 43
species. However the toxicity of pollutants exerted much adverse effect on the earthworm community compared to fungi or bacteria-actinomycetes communities as it was evident from Table 4, 5 and 6.
As to the role of edaphic factors on the distribution and population pattern of different groups of soil inhabiting microflora and fauna, it might be assumed that the factors analysed in this study exerted both significant and insignificant effects either singly or in a cumulative way, depending on the nature of the site. This could be substantiated if an analysis was made as to the extent of important different factors by taking into consideration the mean value of the soil factors during maximum and minimum population peaks in different sampling sites (Tab. 36). The data in the Table 36 showed that in all sampling sites the population was maximum when the factors like soil relative humidity, organic Carbon, nitrate, phosphate and microflora population also were maximum or significantly high and other conditions were optimum. Reddy and Pasha (1993) concluded that physical soil factors were more important collectively in influencing seasonal variations in populations and distributions than chemical factors.
Soil temperature and moisture appear to be the main driving force for seasonal fluctuation of earthworm population. In the summer months soil temperature was significantly high, thus the minimum population resulted. This may also attributed to both the lesser water content and to the physical instability of the humas layer in the climatic conditions of West Bengal. Evans and Guild (1947) opined that the two soil conditions that affected earthworm activity most were temperature and moisture. In this study as the sampling sites belonged to typical tropical monsoon climate, the variation in soil temperature ranged from 18°C to 37°C in contrast to the subsoil relative humidity content which varied widely ranging from 65% to 100%, resulting in minimum (summer) and maximum (monsoon) populations of earthworm fauna and microflora (Tables 2, 7 and 12, Fig·. 94). In the monsoon months when the maximum population occurred; the relative humidity content is recorded to be maximum, also the soil temperature remains higher being more or less near to summer temperature in the climate of Gangetic West Bengal (India), having high precipitation rate and temperature. However it is evident from the Tables 17 and 20 that at Site I earthworm population as well as population of Lampito mauritii showed significant positive correlation with soil temperature. In Site II population of Metaphire posthuma, Eutyphoeus orientalis and E. incommodus shows significant positive correlation whereas Drawida nepalensis and D. papillijer papillijer shows significant negative correlation with soil temperature (Tab. 18). In Site III population of Me tap h ire posthuma and Eutyphoeus orientalis shows significant positive correlation with soil temperature (Tab. 19). It may be due to the interspecific variation among the earthworm species for favourable temperature. Bhadauria and Ramakrishnan (1989) found population size was significantly correlated with soil temperature. Lee (1985) opined that tropical earthworm species tend to have higher temperature optima

44 Rec. zool. Surv. India, Dcc. Paper No. 324
than species from temperate regions. The species of Drawida probably favour lower temperature than that of the other studied species. Bhadauria and Ramakrishnan (1989) observed seasonal fluctuations with maximum population size during the wet season for all species ~xcept Amynthas corticis, which peaked during the winter. Th~ bacteriaactinomycetes population only at Site II shows significant positive correlation with soil temperature. Lower count ofbacteria-actinomycetes population during summer may be due to the moisture deficiency in soil for high temperature during that period. Thus the direct influence of temperature on the distribution pattern of earthworm was difficult to evaluate, it might be evaluated in conjunction with the effect of soil humidity. During the study period, the soil humidity content recorded minimum in summer and winter month then earthworm population was also encountered in minimum. It is not easy to define soil temperature for particular earthworms in field conditions, as soil temperature varies with depth and with diurnal and seasonal changes in ambient temperature. High soil temperatures are commonly associated with desiccation and moisture stress and it is not always easy to distinguish the effects of these factors.
In the present study the relative humidity content of soil was recorded to be maximum 100% in the entire three studied site and minimum 56% in surface soil and 65% in sub soil in Site II (Tables 2, 7 and 12). So a wide range of variation was observed in different sites in different season (Fig. 94). There was significant positive correlation between soil humidity and earthworm population in all the studied fields (Tab. 20). Similar observation was also made by Reddy and Alfred (1978), Ismail and Murthy (1985), Senapati and Sahu (1993). Among earthworm fauna Lampito mauritii, Metaphire posthuma, Eutyphoeus orienta..lis, E. incommodus and E. nicholsoni shows significant positive correlation with soil humidity (Tabs. 17-19). Julka and Mukherjee (1984) observed seasonal activity of earthworms in hill forest soil and found a significant positive correlation between the soil moisture and changes in the popUlation size of predominant species Octolasion tyrtaeum. Tiwari et ale (1992) also found a significant correlation between earthworm popUlations and temperature and moisture in a pineapple field. Jairajpuri (1993) opined that the soil temperature and moisture are two important factors that influence seasonality and distribution of earthworm.
Highly significant positive correlation with earthworm population and its monsoon and post monsoon population peak has been found in an the study sites. Increase in biomass correlates with increase in moisture content of the soil also supported by the observation of Kaleemurrahman and Ismail (1981). El-Duweini and Ghabbour {1965) investigated the survival of Aporrectodea turgida in relation to soil moisture content in Egypt, had reported that an increase in moisture content of from 15 to 34% was associated with an increase in numbers of Aporrectodea turgida, but above 34% extra moisture had no effect. Wood (1974) showed that there was a strong positive correlation between earthworm biomass and increased soil moisture content for topsoil-inhabiting

CHOWDHURY et. ale : On Taxonomy and Ecology of Earthworms (Annelida : Oligochaeta) ... 45
earthworm species. Bhadauria and Ramakrishnan (1989) found population size was significantly correlated with soil moisture. Optimum soil moisture contents for earthworm activity are not the same for all species and it is apparent that even within species there is considerable scope for adaptation (Lee, 1985). Julka and Paliwal (1989a) studied the seasonal fluctuations in the population of earthworms in. a plum orchard and found a significant positive correlation between the combined influence of soil temperature and soil moisture with that of the seasonality of the earthworms. J airajpuri (1993) opined that in sub-tropical climate India, earthworms are active and abundant mainly during summer rains. Lee (1985) also opined that high mortality is related more closely to seasonal variations in soil moisture than in soil temperature. Temperature and moisture are usually inversely related and high surface temperatures and dry soils are much more limiting to earthworms than low temperatures and waterlogged soils (Nordstrom and Rundgren, 1974). Microbial population also shows significant positive correlation with soil humidity in all the studied sites (Tab. 20). Similar was the observation of Laudelout et ale (1978). In case of fungi this study is also supported by the observations of Hazra and Bhattacharyya (2003). From the information available it might be assumed that the moisture content of soil exerted direct or indirect influence on the faunal and microfloral population by i) maintaining the soil reaction, ii) controlling humification and nutrification, iii) stimulating the growth of macro- and microflora.
The content of organic Carbon varied between 0.63% and 4.23% (Fig. 94) in the present study and exhibited significant positive correlations with the earthworm, fungi and bacteria-actinomycetes population in forest floor (Tab. 20). Same was the observation by Senapati and Sahu (1993) for earthworm population. Present study pointed out that except Perionyx excavatus and Metaphire posthuma in Site II other species viz. Lampito mauritii, Metaphire posthuma, Drawida nepalensis, D. papillijer papillijer, Polypheretima elongata, Perionyx simlaensis, Eutyphoeus nicholsoni, Metaphire houlleti, Octochaetona beatrix shows significant positive correlations with organic Carbon (Tabs. 17-19). Increases in the organic Carbon content of fourteen Egyptian soils were associated with increased numbers and biomass of earthworm (EI-Duweini and Ghabbour, 1965; Ghabbour and Shakir, 1982). Ismail and Murthy
(1985) opined that organic matter of soils is generally positively correlated to earthworm distribution. Hendrix et ale (1992) showed a strong positive correlation between earthworm population density and soil organic matter content. Bhadauria and Ramakrishnan (1989) found population size was significantly correlated with soil organic matter. Bhadauria et ale (1997) observed that the addition of organic manure encouraged increase in the earthworm populations. Choudhuri and Mitra (1983) observed that the earthworm population as well as the diversity of species was maximum in August being positively correlated with the corresponding higher values of soil moisture, temperature and organic Carbon. The high temperature and low moisture content of soil seemed to

Rec. zool. Surv. India, Dcc. Paper No. 324
influence the amount of organic Carbon as it was evident from the present study that during summer, soil contained less amount of organic carbon which might be due to low moisture level and ready oxidation occurring in organic matter.
Another important factor that affecting the population fluctuation of soil biota is soil pH. It was measured minimum 5.66 at Site I and maximum 7.9 at Reserve forest (Tables 2 and 12). The graphical presentation of seasonal changes of pH is exhibiting very little fluctuation (Fig. 94). Hazra and Choudhuri (1983) opined that more or less neutral pH was favourable to soil organisms. Present study shows that soil pH has significant positive correlations with the earthworm population in waste disposal site (Tab. 20) and with fungi population in uncultivated field (Tab. 20). Reddy and Alfred (1978), Senapati et ale (1979) also reported a positive correlation of earthworm biomass or population size to soil pH. Reddy and Pasha (1993) also reported a significant positive correlation between pH and the seasonal abundance of juvenile and young adult of Octochaetona phillotti in semi-arid tropical grassland in India, but the populations of adult earthworms was affected more by rainfall than by pH. Hazra and Chowdhury (1990) have reported that soil pH may exert indirect influence on the growth and activities of soil micro and macro flora and also the vegetation and other physiochemical properties of soil. Most species of earthworms prefer soils with a pI-I of about 7.0 (Arrhenius, 1921; Moore, 1922; Bodenheimer, 1935; Petrov, 1946). The effects of soil pH on lumbricid earthworms were reviewed by Edwards and Lofty (1977); the preferences and tolerances of most species appear to fall in the ubiquitous range (Satchell, 1955) i.e. 3.7-7.0. There is little information on the pH preferences and tolerances of nonlumbricid earthworms. Lee (1959) found no megascolecids in New Zealand soils with pH < 4.0 and no obvious relationship had been observed between species distribution and pH. Bano and Kale (1991) reported that the moisture and pH play an important role in distribution of earthworm. Baath (1989) commented that, different process in soil are pH dependent; therefore, it will be difficult to differentiate or to assess the effects due to pI-{ changes or other parameters like toxicity of heavy metals under field condition. Soil pH is related to other soil factors that have an important influence on earthworm populations; it is often difficult to establish a direct cause and effect relationship between soil pH and the size of earthworm populations (Edwards and Bohlen, 1996).
The categories of soils with respect to conductivity i.e. total soluble salts in the soils in the present studied sites showing more or less with in normal range (Tabs. 2, 7 and 12, Fig. 94). Maximum being occur in both wastes disposal and uncultivated site (1.5 dSm-1
) and minimUln both in Reserve forest and uncultivated field (0.1 dSm-1). From Table 20 it has been found that in every case it showed negative correlations with earthworm, fungi and bacterial population, but ~ignificant negative correlation found only in uncultivated field. Salinity exerts its influence on earthworm fauna and microflora by changing the osmotic pressure of surrounding water. Kale and

CHOWDHURY et. ale : On Taxonomy and Ecology of Earthworms (Annelida : Oligochaeta) ... 47
Krishnamoorthy (1978) observed that the moisture content, salinity and organic matter concentration were the principal factors controlling the distribution and bionomics of the earthworm population.
Available Nitrogen content of the soil measured maximum 520 kg ha-1 at waste disposal site and minimum 170 kg ha-1 in forest floor (Tables 2 and 12). A strong positive correlation found between soil available nitrate and earthworm population, as well as with fungi population in Site II (Tables 18, 20). Similar significant positive correlation also observed by Christensen (1991). Significant positive correlation also observed between soil available nitrate and fungi population, as well as with bacteriaactinomycetes population in forest site (Site III) (Tables 19 and 20). Availability of adequate Nitrogen appears to be one of the most important factors limiting earthworm populations and their distribution, especially in tropical regions, where the Nitrogen content of soils is low compared with that of soils of temperate regions (Lee, 1983). The organic Carbon, available nitrate is a measure of the quality of soil organic matter as an energy source. It is also an important determinant of humus types and is related to soil moisture, pH and too many other soil properties. Evans and Guild (1948) showed that earthworms fed on Nitrogen rich diets grew faster and produced more cocoons than those with little Nitrogen available. Wittich (1953) observed that the litter most readily consumed by earthworms was generally Nitrogen rich. The nitrate as essential macronutrients of plant probably exerts its influence on earthworm population through vegetation. The availability of adequate organic Carbon and Nitrogen in assimilable forms is essential for the survival and growth of all animals. Absolute deficiency of one or both elements sometimes limits earthworm populations (Lee, 1985). Satchell (1967) regarded Nitrogen content of food materials as the critical factor limiting earthworm populations in heathlands and grasslands in England and Lee (1983) concluded that the same restriction must also apply to tropical earthworm populations. In the monsoon months increased content of moisture stimulated decomposition, ammonification and nitrification through activities of some bacteria and resulted to a higher nitrate level. Therefore, it might be assumed that the content of nitrate brought about appreciable changes in both macro- and micro- climates and thus led to population fluctuations.
In the present investigation the available Phosphate content of the soil measured maximum 314.2 kgha-1 in wastes disposal site and minimum 94 kgha-1 at uncultivated field (Tables 2 and 7). Strong positive correlation found between soil available Phosphate and earthworm population in waste disposal site (Tab. 20). Nuutinen etal. (1998) opined that earthworm populations have been associated with soil extractable Phosphate. Significant positive correlation also exists between available Phosphate and fungi flora at Site II (Tab. 20). But at forest floor bacterial population shows significant negative correlation with available Phosphate (Tab. 20). Thus the present study pointed out that the relation between soil Phosphate and microorganism are not consistent. It may be

Rec. zool. Surv. India, Dcc. Paper No. 324
a~sumed that Phosphate as a single factor did not exert any significant influence on the population but in combination with other factors might contribute to the population of soil biota.
Available Potassium content of the soil measured maximum 785 kg ha-1 at waste disposal site and minimum 180 kg ha-1 in uncultivated field (Tables 2 and 7). Strong positive correlation found between soil available Potassium and earthworm population, as well as with fungi and bacteria-actinomycetes populations in waste disposal site (Tab. 20). Strong positive correlation also found between soil available Potassium and earthworm population, as well as with bacteria-actinomycetes population in forest site (Tab. 20). In contrast to this, significant negative correlation exists between soil available Potassium and microbial popUlation in uncultivated site (Tab. 20). So relation between soil available Potassium and microorganisms was not consistent, but with earthworm population it is very significant. Probably Potassium along with Nitrogen and phosphate exerts its influence through plant debris, which serves as food for earthworm.
In the heterogeneous atmosphere of soil, the heavy metals, as nondegradable substances accumulated in the upper layer of soil mainly in the organic part of the soil profile where the biological activities are maximum and thus the decomposer organisms inhabiting the litter layer suffer more from metal exposure. In natural polluted soil, never a single .metal is found to be responsible for toxicity of soil habitat; it is mainly by the cumulative effect of all the possible metals.
In this investigation, a simple comparative approach was made to demonstrate the impact of heavy metals like Cd, Zn, Pb and Cu on the earthworm population as well as on soil bacteria-actinomycetes and fungi population by correlation study. But it is very difficult to evaluate the impact of single metal on soil earthworm fauna or microbial flora.
The concentration levels of heavy metals in the soil found in the present study showed wide range of variation from 0.2 ppm to 6.25 ppm Cadmium, 40 ppm to 750 ppm Zinc, 15 ppm to 410 ppm Lead and 14 to 300 ppm Copper (Tables 2, 7 and 12). Strong negative correlation exists between all studied heavy metals and earthworm as well as microbial population in Site II and III (Tab. 20). In Site I, Zn and Pb shows significant negative correlation with earthworm population (Tab. 20). It is interesting to note that earthworm species Perionyx excavatus exhibited significant positive correlations with all the studied heavy metals in Site II and Site III (Tables 18 and 19). So this species may be tolerant to all this studied metals when other factors remain in optimuln condition. In all the studied sites, populations were found to be maximum when the concentration levels of these heavy metals were significantly low and minimum in summer, when the levels of metals were high. Due to the low rainfall for more than three months in summer, the deposited solid wastes remain over the soil surface and during monsoon it perhaps percolates through the soil pores.

CHOWDHURYet. al. : On Taxonomy and Ecology of Earthworms (Annelida: Oligochaeta) ... 49
It is interesting to note that the highest concentration levels of all the metals were recorded in the waste disposal site that supported the maximum population densities of soil microflora and earthworm fauna particularly the species Lampito mauritii. The main source of metals in the soil may be the garbage material dumped by Kolkata Municipal Corporation. The wastes mainly include household's refuge, industrial discharges and residues of different vegetables that might have contributed a lot to the organic matter in this field. Among the all studied sites the wastes disposal site also recorded highest organic Carbon content in the soil, which might be an important factor in reducing the toxicity of metals (Fig. 94). Similar was the observation of Baath (1989). Since the soil environment is very heterogeneous, metal concentration might vary greatly between microhabitats that are different with respect to the soil texture and organic matter. The bioavailability of these metals might be influenced by the other abiotic factors viz. organic Carbon, pH, moisture and temperature. It is difficult to evaluate the influence of any parameter in a field study, as in natural condition these factors interact together and exert cumulative effect.
On the other hand, the waste disposal site witnessed a decline in earthworm species diversity as compared to other two sites. Bengtsson et ale (1988) concluded that, the common effect of metal contamination in all the invertebrates is a decrease in species diversity. According to them, the total abundance is Iiot clearly affected, as decrease in some species is compensated for by and increase number of individual of more tolerant. species. Present study pointed out that low diversity in earthworm community in polluted soil is associated with the predominance of one species Lampito mauritii (94.3%), which may be due to the development of increased tolerance to the toxicity of the studied heavy metals by this species. In present study some fungal genera namely, Penicillium sp., Aspergillus sp., Fusarium sp., Trichoderma sp. and Cephalosporium sp. were found to be more abundant in wastes disposal site in comparison to other two sites. Pugh et ale (1975) found a metal sensitive species of Trichoderma. Jensen (1977) while examining the effect of Lead noticed the occurrence of the dominant species of Fusarium. However, no definite conclusion could be drawn as to whether the microflora and earthworm fauna collected from the wastes disposal sites, which contained a rather high level of various heavy metals were tolerant populations. Further studies should be made on the toxicity of heavy metals on the microflora and earthworm fauna collected from this highly polluted area.
The composition of bacterial population encountered from waste disposal site was dominated by gram positive taxa Bacillus sp. (15.63% of total bacteria-actinomycetes population). The actinomycetes represented by Streptomyces sp. obtained minimum from this site (8.68% of total bacteria-actinomycetes population), while Kandaswamy et ale (1981) found no growth of actinomycetes in the effluent added soil from chemical industries.

50 Ree. zool. Surv. India, Oee. Paper No. 324
Besides the geographical position and composition of the habitats, the earthworm communities were probably regulated by a"number of factors. Soil fertility, soil profile, humus type, water content and microfloral conditions might have influenced their distribution and life conditions in environmentally poorest and richest soils. It is revealed from the present study that the heavy metals viz. Cd, Zn, Pb and Cu were negatively correlated with soil microbial flora and earthworm fauna. On the basis of the results obtained here, it might be inferred that the absence or lower population of earthworm communities may be used as an indicator of damage soil environment. It is not possible to conclude definite,ly with the variation of single earthworm species. However, the earthworm community as a whole may be consider as an indicator for the damage soil ecosystem.
It might be inferred from the present study that the biotic and abiotic factors evaluated here in conjunction with the other factors not considered in this study collectively contributed to the population fluctuation and the distribution pattern of earthworm fauna and microflora in the different habitats of tropical climate of Eastern India.
Lastly, it would be worth mentioning that any attempt to unravel the interactions between edaphic factors and earthworm / microflora population would be abortive unless the behaviour of individual earthworm species in relation to each factor and pollutant were separately studied under controlled laboratory condition.
SUMMARY 1. Present studies contained results of taxonomy, ecology and microbiological study
involving the impact of different soil factors and some heavy metal pollutants on earthworm and microbial population and association of earthworms with microbial populations from three different viz. polluted, uncultivated and forest habitats of West Bengal.
2. A total of 1200 soil samples were drawn from various plots at monthly intervals over a period of twenty five months (June 2001 to August 2003). Among the plots sampled, four had polluted soil environment, four were from an uncultivated field and remaining four were from the forest floor that was affected by flood in the year 2001.
3. Soil factors like temperature, relative humidity, pH, organic Carbon, electrical conductivity, available Nitrogen, available Phosphate, available Potassium and heavy metals such as Cadmium, Zinc, Lead and Copper were taken into consideration. Fungi and bacteria-actinomycetes population and their interactions with these parameters and earthworm fauna were also studied. All these were found to vary sampling sitewise and seasonally.

CHOWDHURYet. ale : On Taxonomy and Ecology of Earthworms (Annelida: Oligochaeta) ... 51
4. Population density of total earthworm, fungi and bacteria-actinomycetes in order of abundance were 42.0696, 38.8996 and 36.06%, respectively at waste disposal site; 37.5396, 30.0496 and 32.10%, respectively at the uncultivated field; 20.40%, 31.0696 and 31.8396, respectively at forest floor.
5. The earthworm fauna encountered, belonged to fourteen species including three new records from West Bengal viz. Perionyx simlaensis, Octochaetona surensis, Drawida papillijer papillijer under 8 genera of the families Megascolicidae, Octochaetidae and Moniligastridae. Moreover, the number of genera occurring in the different sampling sites also varied, maximum species diversity was obtained both from the reserve forest floor (ten species under seven genera) and uncultivated field (ten species under six genera) and minimum diversity of species was recorded in the wastes disposal site. Species composition of earthworm of three different habitats differed considerably, only seven species of earthworms out of total fourteen species were found to occur in all the habitats namely Lampito mauritii, Metaphire posthuma, Perionyx excavatus, Eutyphoeus orientalis, Eutyphoeus incommodus, Drawida nepalensis, Metaphire houlleti, while the species viz. Eutyphoeus nicholsoni, Amynthas corticis, Octochaetona beatrix found to occur only in Reserve forest floor, Perionyx simlaensis, Polypheretima elongata, Octochaetona surensis, Drawida papillijer papillijer were restricted to only uncultivated field.
6. Fungal population studied belonged to ten genera and the bacteria-actinomycetes community comprised of eleven bacterial genera and two actinomycetes genera. Six genera of fungi namely Penicillium sp., Aspergillus sp., Fusarium sp., Rhizopus sp., Mucor sp. and Trichoderma sp.; four genera of bacteria namely Bacillus sp., Arthrobacter sp., Micrococcus and Pseudomonas sp. and the actinomycetes strain Streptomyces sp. were found in all the three habitats studied. On the other hand four genera of fungi Cladosporium sp., Cephalosporium sp., Sclerotium sp. and Curvularia sp.; four genera of bacteria Cytophaga sp., E. coli, Flavobacterium sp., Enterobacter sp. and one genus of actinomycetes Nocardia sp. were found to be confined to a particular site.
7. Numerically the genus L. mauritii occupied topmost position among all the earthworms and was widely distributed. Eutyphoeus and Drawida respectively occupied second and third position and the other genera like Metaphire, Perionyx, Polypheretima and Octochaetona mentioned in order of dominance. Populations of most of the other genera were numerically low and irregular in distribution pattern.
8. In order of dominance the Penicillium sp. and Streptomyces sp. occupied topmost position among the fungal and bacteria-actinomycetes commur~~ties respectively.

52 Rec. zool. Surv. India, Dcc. Paper No. 324
9. Population density of both earthworm fauna and microflora varied considerably from month to month, season to season in different habitats. The population peak was also varied from one site to other, usually minimum in summer and dry winter month. The peak population of earthworm and microorganisms found to be coincided in all sites in respective months, like during monsoon or post monsoon period.
10. The fluctuation of populations of both earthworm and microorganisms showed a regular trend in some major species, but majority of earthworms and microbial genera exhibited irregular trend.
11. When the correlation was examined in respect to the population of earthworm fauna and microbial flora, in all cases it showed a significant positive relationship.
12. It is evident from analysis of variance that site wise fluctuation of earthworm population as well as different species namely, Lampito mauritii, Metaphire posthuma, Perionyx excavatus, Eutyphoeus orientalis, Eutyphoeus incommodus, Drawida nepalensis and Metaphire houlleti were significant. In the fungal community site wise significant fluctuation shown by fungal population and different genera of fungi viz. Penicillium sp., Aspergillus sp., Fusarium sp., Trichoderma sp. and Cladosporium sp. It is evident that sitewise fluctuation of bacteria-actinomyetes population as well as individual genera viz. Streptomyces sp., Micrococcus I, Micrococcus II, Arthrobacter sp., Pseudomonas sp., Promicromonospora sp., Azotobacter sp. was significant. It is also evident from analysis of variance that except Eutyphoeus nicholsoni, Drawida nepalensis, Amynthas corticis and Octochaetona beatrix all other earthworm species as well as earthworm population shows significant seasonal fluctuation. In the fungal community significant seasonal fluctuation were shown by fungi population and different genera of fungi except Cephalosporium sp. and Sclerotium sp. Except Arthrobacter sp., E. coli, Azotobacter sp. and Nocardia sp. all other bacteriaactinomycetes genera as well as bacteria-actinomycetes population shows significant seasonal fluctuation.
13. Of the soil factors subsoil relative humidity showed strong positive correlations with earthworm population as well as with microbial populations in all the studied sites. Soil temperature showed significant positive correlation with earthworm population only in waste disposal site and with bacteria-actinomycetes population in uncultivated site. The soil pH shows strong positive correl!ltion with earthworm population in waste disposal site, whereas, it exhibit significant positive correlation with fungi population in uncultivated site only. In all cases electrical conductivity of soil shows negative correlation with earthworm as well as microbial population, but it was significant only in uncultivated field. Significant positive

CHOWDHURY et. ale : On Taxonomy and Ecology of Earthworms (Annelida : OligoC!laeta) ... 53
correlation found between organic Carbon and earthworm as well as with microorganisms in only forest floor. Available Nitrogen content of soil shows significant positive correlation with earthworm and fungi population in uncultivated field, not only that it also shows significant positive correlation with fungi and bacteria-actinomycetes population in forest site.
14. The heavy metal pollutants like Cadmium, Zinc, Lead and Copper showed significant negative correlation with earthworm and microorganisms in all the sites. Strong negative correlation found between Cadmium and earthworm as well as with microorganisms in uncultivated field and forest floor. Zinc shows significant negative correlation with earthworm population in all the sites but with microorganisms it shows significant negative correlation in uncultivated field and forest site only. Lead and Copper showed strong negative correlation with both earthworm and microbial populations in uncultivated and forest sites and in waste disposal site Lead shows significant negative correlation with only earthworm population.
15. As the population of earthworm, fu~gi and bacteria-actinomycetes are interrelated or interdependent and depend upon the soil factors. As there is no a priori, theory about the governing variables, the Stepwise Linear Regression analysis revealed that, these are subjected to change, i.e. the type and number of variables found to be important for the population density of earthworm forms varied for different species in a given site as well as for a same species in different sites.
16. From the present investigation it might be inferred that the effect of dumping of municipal wastes on soil surface which caused the polluted soil environment reduced the total soil fauna both quantitatively and qualitatively specially the earthworm community. Thus, the reduction of these active biological agents the process of soil formation would be very slow associated with the drastic ultimate effects on the soil health in general.
ACKNOWLEDGEMENTS Authors are grateful to Dr. Ramakrishnan, Director, Zoological Survey of India for
providing laboratory facilities. Authors are thankful to the Head of the Department of Zoology, University of Burdwan for helping in various ways during the course of this study. Thanks are due to Dr. J. M. Julka, Emeritus scientist, Zoological Survey of India, Solan for constructive criticism, showing keen interest for this study, kind helps in preparing key to the species and also for providing some literature. Thanks are also due to Prof. B. K. Senapati, School of Life Science, Sambalpur University, Orissa for providing some valuable literatures. We acknowledge the help of D. Roy, Co-ordinator, C.S.S.C.,

54 Rec. zool. Surv. India, Dcc. Paper No. 324
Indian Statistical Institute, Kolkata for statistical analysis of data. We also acknowledge the Director, Bose Institute, Kolkata for providing laboratory facilities for heavy metal analysis. Last but not the least to Prof. S.S. Kanwar, Head of the Department of Microbiology, College of Basic Sciences, CSK HPKV, Palampur, Himachal Pradesh for taking pain in identifying the microorganisms and valuable comments during this work.
REFERENCES ABBOTT, I. and Parker, C.A. 1980. The occurrence of earthworms in the wheat belt
of Western Australia in relation to land use and rainfall. Aust. J. Soil Res., 18 : 343-352.
ALEXANDER, M. 1977. Introduction to soil microbiology. John Wiley and sons Inc, New York.
ALEXOPOULOS, C.J., Mims, C.W. and Blackwell, M. 1996. Introductory Mycology, 4th Edn. John Wiley and Sons, Chichester.
ANDERSEN, C. 1979. Cadmium, lead and calcium content, number and biomass, in earthworms (Lumbricidae) from sewage sludge treated soil. Pedobiologia, 19 : 309-319·
ANDERSEN, C. 1980. Lead and cadmium content in earthworms (Lumbricidae) from sewage sludge amended arable soil. .In : Soil Biology as related to land use practices (Dindal, D.L. ed.). Proceedings of the VII International Colloquium of Soil Zoology, 148-156.
ARRHENIUS, O. 1921. Influence of soil reaction on earthworms. Ecology, 2 : 255-257.
BAATH, E. 1989. Effects of heavy metals in soil on microbial processes and populations (A review), Water, Air and Soil Pollution, 47(1-4) : 335-379.
BANO, K. and Kale, R.D. 1991. Earthworm fauna of southern Karnataka, India. In : Advances in Management and Conservation of Soil Fauna, (eds Veeresh, G.K., Rajagopal, D. and Viraktamath, C.A.), Oxford and IBH, New Delhi, 627-634.
BAROIS, I. 1992. Mucus production and microbial activity in the gut of two species of Amynthas (Megascolecidae) from cold and warm tropical climates. Soil Bioi. Biochem. 24 : 1507-1510.
BASAK, R.K. 2000. Soil Testing and Recommendation. Kalyani Publishers. 163 pp.
BASSALIK 1913. Uber Silikatersetzung durch Bodenbakterien. Z. GiirPhysiol. 2 : 1-32.
BEDDARD, F.E. 1883. Note on some earthworms from India. Ann. Mag. Nat. Hist. (ser. 5), 12 : 213-224.

CHOWDHURY et. ale : On Taxonomy and Ecology of Earthworms (Annelida : Oligochaeta) ... 55
BEDDARD, F.E. 1895. A monograph o/the order Oligochaeta, Claredon Press, Oxford. xii + 769 pp.
BEDDARD, F.E. 1900. On a new species of earthworm from India belonging to the genus Amyntas. Proc. Zool. Soc. Lond., 1900 : 998-1002.
BEDDARD, F.E. 1901. Contribution to the knowledge of the structure and systematic arrangement of earthworms. Proc. Zool. Soc. Lond., 1901 : 187-206.
BEDDARD, F.E. 1902. On two new earthworms of the family Megascolecidae. Ann. Mag. Nat. Hist. (ser. 7), 9 : 456-463.
BEHERA, N. and Dash, M.e. 1981. Seasonal dynamics of microfungal population in some crop fields of Sambalpur. In : Progress in Soil Biology and Ecology in India (Ed. G.K. Veeresh). UAS Tech. Series No. 37: 36.
BELLINGER, P.F. 1954. Studies of soil fauna with special reference to Collembola. Comm. Agric. Expt. Sta. Bull., 538 : 1-67.
BENGTSSON, G., Gunnarson, T. and Rundgren, S. 1988. Influence of metals on reproduction, mortality and population growth in Onychiurus armatus (Collembola). J. Appl. Ecol., 22: 967-978.
BHADAURIA, T. and Ramakrishnan, P.S. 1989. Earthworm population dynamics and contribution to nutrient cycling during cropping and fallow phases of shifting agriculture (Jhum) in North-East India. J. Appl. Ecol., 26 : 505-520.
BHADAURIA, T., Ramakrishnan, P.S. and Srivastava, K.N. 1997. Population dynamics of earthworms during crop rotation under rainfed agriculture in Central Himalayas, India. Appl Soil Ecol, 6 : 205-215.
BHAT, J.V. 1974. Suitability of experimental diets for earthworm culture. Current Science, 43(9) : 266-268.
BHATIACHARYA, T. and Chakrabarti, G. 1986. Mycoflora of earthworm cast, adjacent soil and the gut content of two species of earthworm. Environment and Ecology, 4(4) : 619-621.
BLANCHART, E. and Julka, J.M. 1997. Influence of forest disturbance on earthworm (Oligochaeta) communities in the Western Ghats (South India). Soil Bioi. Biochem., 29 : 303-306.
BODENHEIMER, F.S. 1935. Soil conditions which limit earthworm distribution". Zoogeographica, 2 : 572-578.
BROWN, G.G., Pashanasi, B., Villenave, C., Patron, J.e., Senapati, B.K., Giri, S., Barois, I., Lavelle, P., Blanchart, E., Blakemore, R.J., Spain, A.V. and Boyer, J. 1999. Effect

56 Rec. zool. Surv. India, Occ. Paper No. 324
of earthworms on plant production in the Tropicseci. In : Earthworms management in tropical agroecosystems (Eds. P . LAVELLE, L. BRUSSAARD and P. HENDRIX). London, CAB International, Wallingford (U.K.), 87-148.
CARTER, A., Hayes, E.A. and Lau Kulich, L.M. 1980. Earthworms as biological monitors of changes in heavy metal levels in an agricultural soil in British Columbia. In : Soil Biology as related to land use practices (Dindal, D.L. ed). Proceedings of the VII International Colloquium of Soil Zoology, 344-357.
CARTER, A., Kenney, E.A., Guthrie, T.F. and Timmenga, H. 1983. Heavy metals in earthworms in non-contaminated and contaminated agricultural soil from near Vancouver, Canada. In : Earthworm Ecology, (ed. J .E. Satchell), Chapman & Hall, London, 267-274.
CHAUDHURI, P.S. and Bhattacharjee, G. 1999. Earthworm resources of Tripura. Proc. Nat. Acad. Sci. India, 69(B), II: 159-170. http://www.urbanfischer.de/journals/ pedo.
CHAUHAN, T.P.S. 1980. Seasonal changes in the activities of some tropical earthworms. Compo Physiol. Ecol., 5 : 288-298.
CHOUDHURI, D.K. and Mitra, K. 1983. Fluctuations of earthworm population in different soil conditions. Geobios, 10 : 55-59.
CHOWDHURY, A. and Hazra, A.K. 2007. Effect of some heavy metals on Lampito mauritii Kinberg (Annelida: Oligo chaeta) in Municipal wastes disposal site and a reserve forest floor site of West Bengal, India. Rec. Zool. Surv. India, 107(2) : 1-19.
CHOWDHURY, A. and Hazra, A.K. 2009. Earthworm Fauna of Bibhutibhusan Sanctuary, West Bengal. Bionotes, 11(1) : 16.
CHOWDHURY, A., Hazra, A.K., Mahajan, S., and Choudhury, .J. 2007. Microbial communities of earthworm (Perionyx excavatus Perrier) gut, cast and adjacent soil in two different fields of West Bengal. Rec. Zool. Surv. India, 107(4) : 101-113·
CHRISTENSEN, O. 1987. The effect of earthworms on nitrogen cycling in arable soils. In : Soil fauna and soil fertility. Striganova, B.R. (ed-in-chief). The 9th International CQlloquium on Soil Zoology. Moscow, 106-118.
CHRISTENSEN, O. 1991. Lumbricid earthworms as bio-indicators relative to soil factors in different agro-ecosystems. In : Advances in Management and Conservation of Soil Fauna. Veeresh, G.K., Rajagopal, D. and Viraktamath, C.A. (Eds.). Oxford and I.B.H. Publishing Co. Pvt. Ltd., 839-849.

CHOWDHURY et. al. : On Taxonomy and Ecology of Earthworms (Annelida : Oligochaeta) ... 57
COOKE, A. 1983. The effects of fungi on food selection by Lumbricus terrestris L. In : Earthworm Ecology, (ed. J .E. Satchell), Chapman & Hall, London, 365-374.
CURRY, J.P. and Cotton D.C.F. 1980. Effect of heavy pig slurry contamination on earthworms in grassland. In : Soil Biology as related to land use practices (Dindal, D.L. ed.). Proceedings of the VII International Colloquium of Soil Zoology, 336-343.
DANIEL, O. and Anderson, J .M. 1992. Microbial biomass and activity in contrasting soil materials after passage through the gut of the earthworm Lumbricus rubellus Hoffmeister. Soil Bioi. Biochem. 24 : 465-470.
DARLONG, V.T. and Alfred, J.R.B. 1991. Effect of shifting cultivation (Jhum) on soil fauna with particular reference to Earthworms in North East India. In : Advances in Management and Conservation of Soil Fauna. Veeresh, G.K., Rajagopal, D. and Viraktamath, C.A. (Eds.). Oxford and LB.H. Publishing Co. Pvt. Ltd., 299-308.
DARWIN, C. 1881. Theformation of vegetable mould through the action of worms, with observations on their habitats. Murray, London. 326 pp.
DASH, M.C. and Cragg, J .B. 1972. Selection of microfungi by Enchytraeidae (Oligochaeta) and other members of soil fauna. Pedobiologia, 12 : 282-286.
DASH, M.C. and Patra, U.C. 1977. Density, biomass and energy budget of a tropical earthworm population from a grassland site in Orissa, India. Rev. Ecol. BioI. Sol., 14 : 461-471.
DASH, M.C. and Patra, U.C. 1979. Wormcast production and nitrogen contribution to soil by a tropical earthworm population from a grassland site in Orissa, India. Rev. Ecol. Bioi. Sol., 16(1) : 79-83.
DASH, M.C. and Senapati, B.K. 1980. Cocoon morphology, hatching, emergence pattern in tropical earthworms. Pedobiologia, 20 : 316-324.
DASH, M.C. and Senapati, B.K. 1981. Primary production and activity of oligochaetes in a tropical grassland in India. In : Progress in soil biology and ecology in India. Veeresh, G.K. (ed.). U.A.S. Tech. Series, 37 : 78.
DASH, M.C. and Senapati, B.K. 1982. Environmental regulation of oligochaete reproduction in tropical pastures. Pedobiologia, 23 : 270-271.
DASH, M.C. and Senapati, B.K. 1986. Vermitechnology, an option for organic waste management in India. In : Proc. Nat. Sem. Drg. Waste Utiliz. Vermicomp. Part B : Verms and Vermicomposting (Dash, M.C., Senapati B.K. and Mishra P.C. eds). Sambalpur University, Orissa, 157-172.

58 Rec. zool. Surv. India, Dcc. Paper No. 324
DASH, M.C., Mishra, P.C. and Behera, N. 1979. Fungal feeding by a tropical earthworm. Tropical Ecol., 20(1) : 9-12.
DASH, M.C., Patra, U.C. and Thambi, A.V. 1974. Comparison of primary production of plant material and secondary production of Oligochaetes in a tropical grassland of Southern Orissa, India. Tropical Ecology, 15 : 16-21.
DASH, M.C., Binapani, S., Behera, N. and Dei, C. 1984. Gut load and turnover of soil, plant and fungal material by Drawida calebi, a tropical earthworm. Rev. Ecol. Bioi. Sol., 21 : 387-393.
DAVIS, M.C. and Williams, S.T. 1970. Studies on the ecology of actinomycetes in soil. I. The occurrence and distribution of actinomycetes in a pine forest soil. Soil Bioi. Biochem., 2 : 227-238.
EDWARDS, C.A. and Bohlen, P.J. 1996. Biology and Ecology of Earthworms (3rd Ed), Chapman & Hall, London, xii + 426 pp.
EDWARDS, C.A. and Fletcher, K.E. 1988. Interactions between earthworms and microorganisms in organic-matter breakdown. Agric. Ecosys. Environ. 24 :
235-247·
EDWARDS, C.A. and Lofty, J.R. 1977. Biology of earthworms (2nd Ed). Chapman and Hall Ltd., London. xiii + 283 pp.
EL-DUWEINI, A.K. and Ghabbour, S.1. 1965. Population density and biomass of earthworms in different types of Egyptian soils. J. Appl. Ecol., 2 : 271-287.
EVANS, A.C. 1948a. Some effects of earthworms on soil structure. Ann. Appl. BioI., 35 : 1-13·
EVANS, A.C. 1948b. Relations of worms to soil fertility. Discovery, Norwich, 9(3) : 83-106.
EVANS, A.C. and Guild, W.J. Mc. L. 1947. Studies on the relationships between earthworms and soil fertility. I. Biological studies in the field. Ann. Appl. BioI., 34 : 307-330.
EVANS, A.C. and Guild W.J. Mc. L. 1948. Studies on the relationship between earthworms and soil fertility. IV. On the life cycles of some British Lumbricidae. Ann. Appl. BioI., 35 : 471-484.
FOSTER, R.C. 1988. Microenvironments of soil microorganisms. BioI. Fertil. Soils, 6,189-203·
FURLONG, M.A., Singleton, D.R., Coleman, D.C. and Whitman, W.B. 2002. Molecular and culture-based analysis of prokaryotic communities from an agricultural soil

CHOWDHURY et. al. : On Taxonomy and Ecology of Earthworms (Annelida : Oligochaeta) ... 59
and the burrows and casts of the earthworm Lumbricus rubellus. Appl. Environ. Microbiol.,68: 1265-1279.
GATES, G.E. 1937a. Indian earthworms. I. The genus Pheretima. Rec. Indian Mus., 39 : 175-212.
GATES, G.E. 1937b. Indian earthworms. II. Scolioscolides gen. nov. Rec. Indian Mus., 39 : 305-310.
GATES, G.E. 1938a. Indian earthworms. III. The genus Eutyphoeus. Rec. Indian Mus., 40 : 39-119·
GATES, G.E. 1938b. Indian earthworms. IV. The genus Lampito Kinberg. V. Nellogaster gen. nov., with a note on Indian species of Woodwardiella. Rec. Indian Mus., 40 : 423-429·
GATES, G.E. 1961. Ecology of some earthworms with special reference to seasonal activity. Am. Midi. Nat., 66 : 61-86.
GATES, G.E. 1972. Burmese earthworms. An introduction to the systematics and biology of megadrile oligochaetes with special reference to southeast Asia. Trans. Am. Phil. Soc., 62(7) : 1-326.
GHABBOUR, S.I. and Shakir, S.H. 1982. Population density and biomass of earthworms in agro-ecosystems of the Mariut coastal desert region. Pedobiologia, 23 : 189-198.
GISH, C.D. and Christensen, R.E. 1973. Cadmium, nickel, lead and zinc in earthworm from roadside soil. Environ. Sci. Technol., 7 : 1060-1062.
GONzALEZ, G., Zou, Z., Sabat, A. and Fetcher, N. 1999. Earthworm abundance and distribution pattern in contrasting plant communities within a tropical wet forest in Puerto Rico. Caribbean Journal of Science, 35 : 93-100.
HALDER, K.R. 1998. Annelida: Oligo chaeta : Earthworms. In : State Fauna Series 3 (Z.S.I.) : Fauna of West Bengal, Part 10 : 17-93.
HALDER, K.R. 1999. Oligochaeta : Earthworm. In : State Fauna Series 4 (Z.S.I.) : Fauna of Meghalaya, Part 9 : 393-439·
HALDER, K.R. 2000. Oligochaeta : Earthworm. In : State Fauna Series 7 (Z.S.I.) : Fauna ofTripura, Part 4 : 239-256.
HALDER, K.R. and Julka, J.M. 1967. On the occurrence of Pheretima peguana (Rosa) (Oligochaeta: Megascolicidae) from Kolkata. Curro Sci., 36(17) : 467.
HARTENSTEIN, R., Neuhauser, E.F. and Collier, J. 1980. Accumulation of heavy metals in the earthworm Eiseniafoetida. J. Environ. Qual., 9 : 23-26.

60 Rec. zool. Surv. India, Dcc. Paper No. 324
HAYNES, R.J., Fraser, P.M., Piercy, J.E. and Tregurtha, RJ. 2003. Casts ofAporrectodea caliginosa (Savigny) and Lumbricus rubellus (Hoffmeister) differ in microbial activity, nutrient availability and aggregate stability. Pedobiologia, 47, © Urban & Fischer Verlag. http://www.urbanfischer.de/journals/pedo
HAZRA, A.K. and Bhattacharyya, B. 2003. Studies of Collembola from Agricultural fields and Wastes Disposal Sites of West Bengal with special reference to their Microbial Association. Rec. Zool. Surv. India, Occ. Paper No. 214, i-vi + 1-199.
HAZRA, A.K. and Choudhuri, D.K. 1983. A study of Collembola communities in cultivated and uncultivated sites of West Bengal in relation to three major soil factors. Rev. Ecol. Bioi. Sol., 20(3) : 385-401.
HAZRA, A.K. and Choudhuri, D.K. 1990. Ecology of subterranean macro and micro arthropod fauna in different degraded and polluted soil environment of West Bengal, India. Rec. Zool. Surv. India, Occasional paper no. 120 : 1-295.
HENDRIX, P.J., Mueller, B.R. and Bruce, R.R. 1992. Abundance and distribution of earthworms in relation to lan,dscape factors on the Georgia Piedmont, U.S.A., Soil Bioi. Biochem., 24 : 1357-1361.
HERNANDEZ, P., Gutierrez, M., Ramajo, M., Trigo, D. and Diaz Cosin, D.J. 2003. Horizontal distribution of an earthworm community at El Molar, Madrid (Spain). Pedobiologia, 47, © Urban & Fischer Verlag. http://www.urbanfischer.de/ journals/pedo
HOLT, J.G., Krieg, N.R., Sneath, P.R.A., Staley, J.T. and Williams, S.T. 2000. Bergey's Manual of Determinative Bacteriology. 9th edn. Lippincott Williams and Wilkins. Philadelphia, U.S.A., XVIII + 1-787 pp.
HOMA, J., Niklinska, M., apd Plytycz, B. 2003. Effect of heavy metals on coelomocytes of the earthworm Allolobophora chlorotica. Pedobiologia, 47, © Urban & Fischer. Verlag. http://www.urbanfischer.de/journals/pedo
HOPP, H. aud Slater, C.S. 1948. Influence of earthworms on soil productivity. Soil Sci., 66 : 421-508.
HOPP, H. and Slater, C.S. 1949. The effect of earthworms on the productivity of agricultural soil. J. Agric. Res., 78 : 325-339.
HUBERS, H., Borges, S. and Alfaro, M. 2003. The oligochaetofauna of the Nipe soils in the Maricao State Forest, Puerto Rico. Pedobiologia, 47, © Urban & Fischer Verlag. http://www.urbanfischer.de/journals/pedo
HUHTA, V. and Kulmala, S. 1987. Management of earthworm populations in coniferous forests. In : Soil fauna and soil fertility. Striganova, B.R. (ed-in-chief). The 9th International Colloquiunl on Soil Zoology. Moscow, 168-172.

CHOWDHURY et. al. : On Taxonomy and Ecology of Earthworms (Annelida : Oligochaeta) ... 61
HUNTJENS, J.L.M. 1972. Amino acid composition of humic acid like polymers produced by streptomycetes and of humic acid from pasture and arable land. Soil BioI. Biochem., 4 : 339-345·
IHSSEN, J., Horn, M.A., Matthies, C., Goner, A., Schramm, A. and Drake, H.L. 2003. N
20-producing microorganisms in the gut of the earthworm Aporrectodea
caliginosa are indicative of ingested soil bacteria. Appl. Environ. Microbiol., 69 : 1655-1661.
IRELAND, M.P. 1975a. Metal content of Dendrobaena rubida (Oligochaeta) in a base metal mining area. Dikos., 26 : 74-79.
IRELAND, M.P. 1975b. The effect of the earthworm Dendrobaena rubida on the solubility of lead, zinc and calcium in heavy metal contaminated soil in Wales. J. Soil. Sci., 26 : 313-318.
IRELAND, M.P. 1979. Metal accumulation by the earthworms Lumbricus rubellus, Dendrobaena veneta and Eiseniella tetraedra living in heavy metal polluted sites. Environ. Pollut, 19 : 201-206.
IRELAND, M.P. 1983. Heavy metal uptake and tissue distribution in earthworms. In : Earthworm ecology (Satchell, J .E. ed), Chapman and Hall, London, 247-265·
IRELAND, M.P. and Richards, K.S. 1977. The occurrence and localisation of heavy metals and glycogen in the earthworms Lumbricus rubellus and Dendrobaena rubida from a heavy metal site. Histochemistry, 51 : 153-166.
IRELAND, M.P. and Wooton, R.J. 1976. Variations in the lead, zinc and calcium content of Dendrobaena rubida (Oligochaeta) in a base metal mining area. Environ. Pollut, 10 : 201-208.
ISMAIL, S.A. 1986. Earthworm resources of Madras. In : Proc. Nat. Sem. Drg. Waste Utilize Vermicomp. Part B : Verms and Vermicomposting (Dash, M.C., Senapati, B.K. and Mishra, P.C. eds). Sambalpur University, Orissa, 8-15.
ISMAIL, S.A. and Murthy V.A. 1985. Distribution of earthworms in Madras. Proc. Indian Acad. Sci., (Anim. Sci.), 94 : 557-566.
ISMAIL, S.A., Ramakrishnan, C. and Anzar, M.M. 1990. Density and diversity in relation to the distribution of earthworms in madras. Proc. Indian Acad. Sci., (Anim. Sci.), 99(1) : 73-78.
JAlRAJPURI, M.S. 1993. Earthworms and Vermiculture : An introduction. In : Earthworm Resources and Vermiculture, The Director (ed), ZSI, 1-5.
JENSEN, H.L. 1930. Actinomycetes in Danish soils. Soil Sci., 39 : 59-77·

62 Rec. zool. Surv. India, Dcc. Paper No. 324
JENSEN, V. 1977. Effects of lead on biodegradation of hydrocarbons in soil. Oikos, 28 : 220-224.
JOSHI, N.V. and Kelkar, B.V. 1952. The role of earthworms in soil fertility. Indian J. Agric. Sci., 22 : 189-196.
JUDAS, M. 1992. Gut content analysis of earthworms (Lumbricidae) in a beechwood. Soil Biol. Biochem. 24 : 1413-1417.
JULKA, J.M. 1975a. Notes on the earthworms from Darjeeling district, with descriptions of two new species. Mitt. Zool. Mus. Berlin, 51(1) : 19-27.
JULKA, J .M. 1975b. Abnormal variations in Perionyx millardi Stephenson (Megascolecidae : Oligochaeta). Newsl. Zool. Surv. India, 1(2) : 26-27.
JULKA, J.M. 1976a. Studies on the earthworms collected during the Daphabum Expedition in Arunachal Pradesh, India. Rec. Zool. Surv. India, 69 : 229-239.
JULKA, J.M.1976b. Studies on the earthworm fauna of Orissa (India). 1. Moniligastridae and Ocnerodrilidae. Mitt. Zool. Mus. Berlin, 52 : 321-329.
JULKA, J.M. 1977. Contribution to the knowledge of the earthworm Fauna (Oligo chaeta : Annelida) of Meghalaya. Newsl. Zool. Surv. India, 3(6) : 398-400.
JULKA, J.M. 1978. Studies on the earthworm fauna of Orissa (India). 2. Megascolecidae, Octochaetidae and Microchaetidae. Mitt. Zool. Mus. Berlin, 54 : 185-197.
JULKA, J.M. 1979. First record of Lumbricus castaneus (Savigny) from India (Lumbricidae : Oligochaeta). J. Bombay Nat. Rist. Soc., 76(1) : 191-192.
JULKA, J.M. 1981a. Taxonomic studies on the earthworms collected during the Subansiri Expedition in Arunachal Pradesh, India. Rec. Zool. Surv. India, Occ. Pap. No. 26 : 1-37.
JULKA, J.M. 1981b. Anthropochorous earthworms of Lahaul Valley (Himachal Pradesh) with notes on their ecology. In : Progress in Soil Biology and Ecology in India. Veeresh, G.K. (ed.). U.A.S. Tech Series No., 37: 69-76.
JULKA, J .M. 1983. A new genus and species of earthworm (Octochaetidae : Oligochaeta) from South India. Geobios New Reports, 2 : 48-50.
JULKA, J.M. 1988. Fauna of India. Megadrile Oligochaeta (Earthworms) : Fam : Octochaetidae, xiv + 400 pp.
JULKA, J.M. 1993a. General morphology and characters of taxonomic importance. In : Earthworm Resources and Vermiculture. The Director (ed), Z.S.L, 17-26.
JULKA, J.M. 1993b. Distribution pattern in Indian Earthworms. In : Earthworm Resources and Vermiculture. The Director (ed), Z.S.L, 27-:-31.

CHOWDHURY et. 01. : On Taxonomy and Ecology of Earthworms (Annelida : Oligochaeta) ... 63
JULKA, J .M. 1993c. Earthworm resources of India and their utilization in vermiculture. In : Earthworm Resources and Vermiculture. The Director (ed), Z.S.I., 51-56.
JULKA, J .M. 1995. Oligochaeta. Himalayan Ecosys·tem Series (Z.S.I) : Fauna of Western Himalaya, Part 1 : Uttar Pradesh, 17-22.
JULKA, J .M. 2001. Earthworm diversity and its role in Agro-systems. VII National Symposium on Soil Biology and Ecology, Bangalore, 13-17.
JULKA, J .M. 2005. Earthworms as bioindicators in conservation areas. (Abstract). In : National Seminar on Vermitechnology and waste management (Eds. Rajashe~al" Patil and Rameshchandra Rao). Dept. Appi. Zool. Mangalore Univ., Mangalore. Sponsored by DBT, New Delhi, India.
JULKA, J .M. and Chandra, M. 1986. On a small collection of Earthworms and Leeches (Annelida) from the Silent Valley, Kerala, India. Rec. Zool. Surv. India, 84(1-4) : 165-171.
JULKA, J.M. and Halder, K.R. 1975a. Record of Pheretima malaca Gates (Oligochaeta : Megascolecidae) from Andaman Islands. Newsl. Zool. Surv. India, 1(4) : 65-66.
JULKA, J.M. and Halder, K.R. 1975b. On the occurrence of giant earthworm Perionyx macintoshi Beddard (Oligochaeta : Megascolecidae) in Bhutan and Arunachal Pradesh (India). Proc. Zool. Soc., Kolkata, 28 : 15-17.
JULKA, J.M. and Halder, K.R. 1977. New records of earthworms (Oligochaeta : Lumbricidae) from Sikkim. Newsl. Zool. Surv. India, 3 : 296-297.
JULKA, J.M. and Mukherjee, R.N. 1984. Some observations on the seasonal.activity of earthworms (Oligochaeta : Annelida) in hill forest soil. Bull. Zool. Surv. India, 5(2 & 3) : 35-39·
JULKA, J .M. and Paliwal, R. 1986. Distribution of Indian earthworms. Proc. Nat. SemI Org. Waste Utilize Vermicomp. Part B : Verms and Vermicompositing, Dash, M.C., Senapati, B.K. and Misra, P .C. (Eds.), 16-22.
JULKA, J.M. and Paliwal, R. 1989a. Seasonal changes in the population of Earthworms (Oligochaeta) in an Orchard. J.Bomb. Nat. Hist. Soc., 87 : 323-326.
JULKA, J.M. and Paliwal, R. 1989b. A note on a monstrous earthworm. Punjab University Research Bulletin (Sci.), 40 : (III -IV) : 301-302.
JULKA, J .M. and Paliwal, R. 1993. A new species of Perionyx Perrier (Megascolecidae, Oligochaeta) from North West Himalaya, India. J. Bombay Nat. Hist. Soc., 90 : 461-462.

Rec. zool. Surv. India, Occ. Paper No. 324
JULKA, J .M. and Paliwal, R. 1994. On a new species of Plutellus Perrier (Acanthodrilidae : Oligochaeta) from North West Himalaya, India. Punjab University Research Bulletin (Sci.), 44(I-IV) : 217-220.
JULKA, J.M. and Rao, B.R. 1982. A new earthworm Mallehulla indica gen.et sp. nov. (Oligochaeta : Octochaetidae) from Karnataka, India. J. Soil BioI. Ecol., 2(2) : 67-72.
JULKA, J.M. and Senapati, B.K. 1987. Earthworm (Oligochaeta : Annelida) of Orissa, India. Rec. Zool. Surv. India, Occasional Paper No. 92 : 1-49.
JULKA, J.M., Chandra, M. and Mukherjee, R.N. 1983. Mass migration of Earthworms in the Simla Hills. Proc. Wkshp. High Alt. Ent. & Wildl. Ecol. Zoo I. Surv. India, 347-351.
JULKA, J.M., Senapati, B.K. and Paliwal, R. 1989. Oligochaeta - A Checklist. Fauna of Orissa: State Fauna Series 1 (Z.S.I.), 2 : 79-82.
JULKA, J.M., Giri, S., Panigrahi, P.K. and Senapati, B.K. 1997. Parryodrilus lavellei gen. nov. and sp. nov. (Octochaetidae, Oligochaeta) from Western Ghats, South India. Eur. J. Soil BioI., 33(3) : 141-144.
KALE, R.D .. 1993. Know-how of Earthworms - The soil Macrofauna. In : Earthworm Resources and Vermiculture. The Director (ed), Z.S.I., 43-49.
KALE, R.D. and Dinesh, M.S. 2005. Earthworm: Component of Soil Biota. In : National Workshop on Conservation and Sustainable Management of Belowground Biodiversity, KFRI, India, 313-330.
KALE, R.D. and Krishnamoorthy, R.V. 1978. Distribution of earthworms in relation to soil conditions in Bangalore. In : Soil Biology and Ecology in India (Edwards, C.A. and Veeresh, G.K. Eds). UAS Tech. Series, no. 22, University of Agricultural Sciences, Bangalore, 63-69.
KALE, R.D. and Krishnamoorthy, R.V. 1981. Enrichment of soil fertility by earthworm activity. In : Progress in soil biology and ecology in India. Veeresh, G.K. Ced.), 64-68.
KALE, R.D. and Krishnamoorthy, R.V. 1982. Cyclic fluctuations in the populations and distribution of three species of tropical earthworms in a farrnya rd garden in Bangalore. Rev. Ecol. Bioi. Sol., 19 : 61-71.
KALE, R.D., Bano, K., Sreenivasa, M.N., Vinayak, K. and Bagyaraj, D.J. 1991. Incidence of cellulolytic and Lignolytic organisms in the earthworm '''1orked soils. In : Advances in Management and Conservation of Soil Fauna. Veeresh, G.K., Rajagopal, D. and Viraktamath, C.A. (Eds.). Oxford and I.B.H. Publishing Co. Pvt. Ltd, 599-603.

CHOWDHURYet. all : On Taxonomy and Ecology of Earthworms (Annelida: Oligochaeta) ... 65
KALEEMURRAHMAN, M. and Ismail, S.A. 1981. Earthworm - An index of the physical nature of the soil. In : Progress in soil biology and ecology in India. Veeresh, G.K. (ed.), 60-63.
KANDASW AMY, D., Narayanan, R. and Oblisamt, G. 1981. Effects of particulate pollutants from cementklin on soil microflora and crop plants. In : Progress in soil Biology and Ecology in India, (Ed. G.K. Veeresh), U.A.S. Tech. series No. 37: 16-17.
KANWAR, S.S., Gupta, M.K. and Punj, V. 1997. Biochemical reaction and their significance. In : Laboratory Manual of Basic Microbiology, Dept. of Microbiology, College of Basic Sciences, CSK HPKV, Palampur, 54-64.
KARSTEN, G.R. and Drake, H.L. 1995. Comparative assessment of the aerobic and anaerobic microfloras of earthworm guts and forest soils. Appl. Environ. Microbial., 61 : 1039-1044.
KARSTEN, G.R. and Drake, H.L. 1997. Denitrifying bacteria in the earthworm gastrointestinal tract and in vivo emission of nitrous oxide (N
20) by earthworms.
Appl. Environ. Jklicrobial., 63 : 1878-1882.
KHAMBATA, S.R. and Bhatt, J.V. 1957. A contribution to the study of the intestinal microflora of Indian earthworms. Arch. Mikrobiol., 28 : 69-80.
KRISHNAMOORTHY, R.V. and Ramachandra, S. 1988. Population structure of earthworms in woodlands of Karnataka. Proc. Indian Acad. Sci. (Anim. Sci.), 97(4) : 355-362.
KRISTUFEK, V., Ravasz, K. and· Pizl, V. 1992. Changes in densities of bacteria and microfungi during gut transit in Lumbricus rubellus and Aporrectodea caliginosa (Oligochaeta : Lumbricidae). Soil Bioi. Biochem., 12 : 1499-1500.
KUSTER, E. 1968. Taxonomy of soil actinomycetes and related organisms. In : The Ecology of Soil Bacteria (Eds. T.R.G. Gray and D. Parkinson), Liverpool Univ. Press, Liverpool, 322-336.
KUTZNER, H.J. 1968. Uber die Bildung von Huminstoffen durch Streptomyceten. Landwirtsch Forsch., 21 : 48-61.
LAUDELOUT, H., Lambert, R. and Pham, M.L. 1978. Variation saisonniere de la population microbienne du sol. Rev. Ecol. Bioi. Sol., 15(2) : 147-158.
LAVELLE, P., Barois, I., Blanchart, E., Brown, G., Brussaard, L., Decaens, T., Fragoso, C., Jhnenez, J.J., Kajondo, K.K., Martinez, M.A., Moreno, A., Pashanasi, B., Senapati, B.K. and Villenave, C. 1998. Earthworm as a resource in tropical agroecosystems. Nature & Resources, UNESCO - Elsevier (France), 34 : 26-41.

66 Rec. zool. Surv. India, Dcc. Paper No. 324
LAVELLE, P., Barois, I., Blanchart, E., Brown, G., Brussaard, L., Decaens, T., Fragoso, C., Jimenez, J.J., Kajondo, K.K., Moreno, A., Pashanasi, B., Senapati, B.K. and Villenave, C. 2000. Earthworms as a resource in tropical agroecosystems. Science Publishers Inc., U.S.A., 163-181.
LAVELLE, P., Senapati, B.K. and Barros, E. 2003. Soil Macrofauna. In: Trees, Crops and Soilfertility concepts and Research Methods. (Eds.) G. Schroth and F.L. Sinclair, CABI Publishing, Wallingford, Oxon, U.K., 303-324.
LEE, K.E. 1959. A key for the identification of New Zealand earthworms. Tuatara, 8(1) : 13-60.
LEE, K.E. 1983. Earthworms of Tropical regions - some aspects of their ecology and relationships with soils. In : Earthworm ecology (Satchell, J .E. ed), Chapman and Hall, London, 179-193.
LEE, K.E. 1985. Earthworms: Their ecology and relationships with soils and land use. Academic Press, Sydney, Australia. 411 pp.
LEE, K.E. 1987. Some objectives for earthworm research. In : Soilfauna and soilfertility. Striganova, B.R. (ed-in-chiet). The 9th International Colloquium on Soil Zoology. Moscow, 234-241.
MALECKI, M.R., Neuhauser, E.F. and Loehr, R.C. 1982. The effect of metals on the growth and reproduction of Eisenia foetida (Oligochaeta, Lumbricidae). Pedobiologia, 24 : 129-137.
MARINISSEN, J.C.Y. 1991. Colonization of arable fields by earthworms in a newly reclaimed polder in the Netherlands - A Preliminary Results. In : Advances in Management and Conservation of Soil Fauna. Veeresh, G.K., Rajagopal, D. and Viraktamath, C.A. (Eds.). Oxford and I.B.H. Publishing Co. Pvt. Ltd., 341-348.
MA, WEI-CHUN. 1982. The influence of soil properties and worm related factors on the concentration of heavy metals in earthworms. Pedobiologia, 24 : 109-119.
MICHAELSEN, W. 1900. Oligochaeta. Das Tierreich, 10 : 1-575.
MICHAELSEN, W. 1909a. The Oligochaeta of India, Nepal, Ceylon, Burma and the Andaman Islands. Mem. Indian Mus., 1 : 103-253.
MICHAELSEN, W. 1909b. On a new Megascolexfrom Ceylon. Spolia zeylan, 6 : 96-101.
MICHAELSEN, .W. 1913. Oligochaten von Travancore und Borneo. Jb. Ramb. Wiss. Anst., 30 : 73-92.
MISHRA, P.C. and Dash, M.C. 1984. Population dynamics and production studies in earthworm population of an Orissan forest ecosystem. Trop. Ecol., 25(1) : 105-118.

CHOWDHURY et. al. : On Taxonomy and Ecology of Earthworms (Annelida : Oligochaeta) ... 67
MOORE, B. 1922. Earthworms and soil reaction. Ecology, 3 : 347-348.
MORGAN, J.E. and Morgan, A.J. 1999. The accumulation of metals (Cd, Cu, Pb, Zn and Cal by two ecologically contrasting earthworm species (Lumbricus rubellus and Aporrectodea caliginosa) : implications for ecotoxicological testing. Applied Soil Ecology, 13 : 9-20.
MUYS, B., LUST, N. and Granval, PH. 1992. Effects of grassland afforestation with different tree species on earthworm communities, litter decomposition and nutrient status. Soil Bioi. Biochem., 24 : 1459-1466.
NAHMANI, J., Lavelle, P., Lapied, E. and Folkert Van Oort, F.V. 2003. Effects of heavy metal soil pollution on earthworm communities in the north of France. Pedobiologia, 47, © Urban & Fischer Verlag. http://www.urbanfischer.de/ journals/pedo.
NAKAMURA, Y. 1968a. Studies on the ecology of terrestrial Oligochaeta. I. Seasonal variation in the population density of earthworms in alluvial soil grassland in Sapporo, Hokkaido. Jap. J. Appl. Entomol. Zool., 3(2) : 89-95.
NAKAMURA, Y. 1968b. Population density and biomass of the terrestrial earthworm in the grasslands of three different soil types near Sapporo. Jap. J. Appl. Entomol. Zool., 11 : 164-168.
NORDSTROM, S. and Rundgren, S. 1974. Environmental factors and lumbricid associations in Southern Sweden. Pedobiologia, 14 : 1-27.
NUUTINEN, V., Pitkanen, J., Kuusela, E., Widbom, T. and Lohilahti, H. 1998. Spatial variation of an earthworm community related to soil properties and yield in a grassclover field. Applied Soil Ecology, 8 : 85-94.
PAL, A., Chattopadhyay, B. and Roy, S. 1992. Distribution of Collembola and fungal flora in relation to different soil factors in a forest site at Burdwan. Proc. Zool. Soc. Calcutta, 45 (Suppl. A) : 519-526.
PARKINSON, D. 1983. Functional relationships between soil organisms. New Trends in Soil Biology (Ed. Ph. Lebrun et al.). Proceedings VIII. International Colloquium o/Soil Zoology. Louvain-Ia-Neuve (Belgium), 153-165.
PARLE, J.N. 1963a. Microorganisms in the intestines of earthworms. J. Gen. Microbiol., 31 : 1-11.
PARLE, J.N. 1963b. A microbiological study of earthworm casts. J. Gen. Microbiol., 31 : 13-23·
PATNAIK, H.P., Panda, S. and Samal, M. 2004. Preliminary studies on the earthworm species of Kenduuhar (Orissa). J. Appl. Zool. Researche', 15 : 91-95.

68 Ree. zool. Surv. India, Oee. Paper No. 324
PERRIER, E. 1872. Recherches pour sevir a I' histoire des Lombricien.s terrestres. Nouv. Archs Mus. Hist. Nat., Paris, 8 : 5-198.
PETROV, B.C. 1946. The active reaction of soil (pH) as a factor in the distribution of earthworms. Zool, J., 25(1) : 107-110.
PIEARCE, T.G. 1978. Gut contents of some lumbricid earthworms. Pedobiologia, 18 :
153-157.
PIPER, C.S. 1942. Soil and plant analysis. Mongr. Waita Agric. Res. Inst., Univ. Adelaide, South Australia, 368 pp.
PUGH, G.J.F., Williams, J.I. and Wainwright, M. 1975. The effects of fungicides on microbial activities in the soil. In : Progress in Soil Zoology. (Ed. J. Vanek), Prague, 489-496.
RAHNO, P., Aksel, M. and Rus, H. 1978. Seasonal dynamics of the number of soil microorganisms. Pedobiologia, 18 : 279-288.
REDDY, M.V. and Alfred, J.R.B. 1978. Some observations on the earthworms population and the biomass in sub-tropical pine forest soil. In : Soil Biology and Ecology in India. (Eds.) C.A. Edwards and G.K. Veeresh, U.A.S. Tech. Series No. 22 : 78-82.
REDDY, M.V. and Pasha, M. 1993. Influence of rainfall, temperature and some soil physiochemical variables on seasonal population structure and vertical distribution of earthworms in two semi- and tropical grassland soils. Int. J. Biotech., 37 : 19-26.
REYNOLDS, J.W. 1972. The relationship of earthworm (Oligochaeta : A~anthodrilidae and Lumbricidae) distribution and biomass in six heterogeneous woodlot sites in Tippecanoe County, Indiana. J. Tenn. Acad. Sci., 47 : 63-67.
ROY, S.K. 1957. Studies on the activities of earthworms. Proc. Zool. Soc., Calcutta, 10(2) : 81-98.
SAHU, S.K. and Senapati, B.K. 1986. Population density, Dynamics, Reproductive Biology and Secondary Production of Dichogaster bolaui (Michaelsen). In : Proc. Nat. Sern. Drg. Waste Utilize Vermicornp. Part B : Verms and Vermicomposting (Dash, M.C., Senapati, B.K., and Mishra, P.C. eds), Sambalpur University, Orissa, 29-46.
SAHU, S.K. and Senapati, B.K. 1991. Reproductive strategy of a r selected and k selected earthworm from tropical pastures of Orissa, India. In : Advances in Management and Conservation of Soil Fauna. Veeresh, G.K., Rajagopal, D. and Viraktamath, C.A. (Eds.). Oxford and I.B.H. Publishing Co. Pvt. Ltd. New Delhi, 665-669.

CHOWDHURY et. ale : On Taxonomy and Ecology of Earthwonns (Annelida : Oligochaeta) ... 69
SAHU, S.K., Mishra, S.K. and Senapati, B.K. 1988. Population biology and reproductive strategy of Dichogaster bolaui (Oligochaeta : Octochaetidae) in two tropical agroecosystems. Proc. Indian Acad. Sci. (Anim. Sci.), 97(3) : 239-250.
SATCHELL, J.E. 1955. Some aspects of earthworm ecology. In : Soil Zoology (Ed. D. K. Mc. E. Kevan), Butterworths, London, 180-201.
SATCHELL, J .E. 1958. Earthworm biology and soil fertility. Soils Fert., 21 : 209-219.
SATCHELL, J.E. 1960. Earthworms and soil f~rtility. New Sci., 7: 79-81.
SATCHELL, J.E. 1967. Lumbricidae, in Soil Biology, (eds. Burges and Raw), Academic Press, London, 259-322.
SATCHELL, J.E. 1974. Introduction. Litter-interface of animate/inanimate matter. In : C.H. Dickinson and G.J.F. Pugh (Eds.), Biology of plant litter decomposition. Academic press, London. 1 : 13-44.
SATCHELL, J.E. 1980. r worms and k worms: A basis for classifying Lumbricid earthworm strategies. In : Soil Biology as related to land use practices (Dindal, D.L. ed.). Proceedings of the VII International Colloquium of Soil Zoology, 848-864·
SATCHELL, J.E. 1983a. Earthworm ecology in forest soils. In : Earthworm ecology (Satchell, J.E. ed), Chapman and Hall, London, 161-170.
SATCHELL, J.E. 1983b. Earthworm microbiology. In : Earthworm ecology (Satchell, J .E. ed), Chapman and Hall, London, 351-364.
SCHEU, S. 1987. Microbial activi~ and nutrient dynamics in earthworm casts (Lumbricidae). BioI. Fertil. Soils, 5 : 230-234.
SEUN, M.S.N.E.D. 1971. Search of anoagonistic Actinomycetae in Libyan soils. Can. J.
Microbiol., 17 : 731-735·
SENAPATI, B.K. 1999. Innovations in Soil Management through Earthworm Technology : A Case Study in Tea Agroecosystem. In : Modern Approaches and Innovations.in Soil Management, (Eds. D.J. Bagyaraj, Ajit Verma, K.K .. Khanna and H.K. Kehri), Rastogi Publications Meerut (India), 282-300.
SENAPATI, B.K. and Dash, M.C. 1981. Effect of grazing on the elements of production in vegetation and oligochaete components of a tropical pasture. Rev. Ecol. BioI. Sol., 18 : 487-505.
SENAPATI, B.K. and Dash, M.C. 1983. Energetics of earthworm populations in tropical pastures from India. Proc. Indian Acad. Sci. (Anim. Sci.), 92 : 315-322.

70 Rec. zool. Surv. India, Occ. Paper No. 324
SENAPATI, B.K. and Dash, M.C. 1984. Influence of soil temperature and moisture on the reproductive activity of tropical earthworms of Orissa. J. Soil Bioi. Ecol., 4 : 13-21.
SENAPATI, B.K. and Dash, M.C. 1991. Energetic strategy and life table analysis of two peregrine Indian earthworms. In : Advances in Management and Conservation of Soil Fauna. Veeresh, G.K., Rajagopal, D. and Viraktamath, C.A. (Eds.). Oxford and I.B.H. Publishing Co. Pvt. Ltd, 677-681. j
SENAPATI, B.K. and Sahu, S.K. 1991. Energy utilisation strategy in a r selected and k selected earthworm from tropical pastures of Orissa, India. In : Advances in Management and Conservation of Soil Fauna. Veeresh, G.K., Rajagopal, D. and Viraktamath, C.A. (Eds.). Oxford and I.B.H. Publishing Co. Pvt. Ltd, 671-675.
SENAPATI, B.K. and Sahu, S.K. 1993. Population, Biomass and Secondary Production in Earthworms. In : Earthworm Resources and Vermiculture. The Director (ed),
Z.S.I., 57-78.
SENAPATI, B.K., Dash, H.K. and Dash, M.e. 1979. Seasonal dynamics and emergence pattern of a tropical earthworm Drawida' calebi (Oligochaeta). Int. J. Invertebr. Reprod., 1 : 271-277.
SENAPATI, B.K., Lavelle, P., Giri, S., Pashanasi, B., Alegre, J., Decaens, T., Jimenez, J.J 0, Albrecht, A., Blanchart, E., Mahieux, M., Rousseaux, L., Thomas, R., Panigrahi, P.K. and Venkatachalam, M.M. 1999. In soil Earthworm Technologies for Tropical Agroecosystems. In: Earthworm Management in Tropica~Agroecosystems. (Eds. P. Lavelle, L. Brussard and P. Hendrix), CAB International, Wallingford (U.K.),
199-238.
SENAPATI, B.K., Lavelle, P., Panigrahi, P.K., Girl, S. and Brown, G.G. 2002. Restoring soil fertility and enhancing productivity in Indian tea plantations with earthworms and organic fertilizers. In : Biological management of soil ecosystems. Embrapa,
172-190.
SHUSTER, W.D., Shipitalo, M.J., Bohlen, P.J., Subler, S. and Edwards, C.A. 2003. Population dynamics of ambient and altered earthworm communities in row-crop agroecosystems in the Midwestern U.S. The 7th international symposium on earthworm ecology, Cardiff, Wales, Pedobiologia, 47, © Urban & Fischer Verlag, http://www.urbanfischer.de/journals/pedo
SOOTA, T.D. and Halder, K.R. 1977a. A new locality of f?Aetaphire californica (Kinberg, 1867) (Oligochaeta : Megascolecidae) from Kalimpong, Darjiling district, West Bengal. Newsl. Zool. Surv. India, 3(3) : 129.

CHOWDHURY et. ale : On Taxonomy and Ecology of Earthworms (Annelida : Oligochaeta) ... 71
SOOTA, T.D. and Halder, K.R. 1977h. Two species of the genus Amynthas (OIigochaeta : Megascolecidae) from Sikkim. Newsl. Zool. Surv. India, 3(4) : ISO-lSI.
SOOTA. T.D. and Halder, K.R. 1980a. On some earthworms from western Himalayas. Rec. Zool. Surv. India, 76 : 195-205.
SOOTA, T.D. and Halder, K.R. 1980h. Further records of earthworms from the Andaman and Nicobar Islands. Rec. Zool. Suru.India, 77: 1-5.
SOOTA, T.D. and Halder, K.R. 1981. On some earthworms from eastern Himalayas. Rec. Zool. Surv. India, 79 : 231-234.
SOOTA, T.D. and Julka, J .M. 1970. Notes .on earthworms of the Andaman and Nicobar Islands. Proc. Zool. Soc., Kolkata, 23 : 201-206.
SOOTA, T.D. and Julka, J.M. 1972. Notes on some earthworms of Goa with description of two new species. Zool. Anz., 189 : 400-404.
SRINIVASULU, B.V. 1985. Mycoflora associated with the gut of Pheretimaposthuma. In : Proc. Nat. Sem. Org. Waste Utilize Vermicomp. Part A : Organic Waste Biomass Their Decomposition and Utilization (Dash, M.C., Senapati, B.K., and Mishra, P.C. eds), Sambalpur University, Orissa, 145-147.
STEPHENSON, J. 1913. On a collection of Oligochaeta, mainly from Ceylon. 'Spolia zeyian., 8 : 251-276.
STEPHENSON, J. 1916. On a collection of Oligo chaeta belonging to the Indian Museum. Rec. Indian Mus., 12 : 299-354.
STEPHENSON, J. 1917. On a collection of Oligochaeta from various parts of India and further India. Rec.Indian Mus., 13 : 353-416.
STEPHENSON, J. 1920. On a collection of Oligochaeta from the lesser known parts of India and from eastern Persia. Mem. Indian Mus., 7 : 191-261.
STEPHENSON, J. 1922a. A note on some supposed new species of earthworms of the genus Glyphidrilus. Ann. Mag. Nat. Hist. (ser. 9), 9 : 387.
STEPHENSON, J. 1922h. Some earthworms from Kashmir, Bombay and other parts of India. Rec.Indian Mus., 24 : 427-4.43.
STEPHENSON, J. 1923. The Fauna of British India: Oligochaeta. Taylor and Francis, London. 518 pp.
STEPHENSON, J. 1930. The Oligoc~aeta. Clarendon Press, Oxford, xvi + 978 pp.
STOCKLI, A. 1928. Studien iiber den Einfluss der Regenwiirmer auf die Beschaffenheit des Bodens. Landwirtsch. Jahrb. Schweiz., 42 : 1.

72 Rec. zool. Surv. India, Dcc. Paper No. 324
STRIGANOVA, B.R., MARFENI NA, O.E. AND PONOMARENKO, V.A. 1989. Some aspects of the effect of earthworms on soil fungi. Bioi. Bull. Acad. Sci. USSR, 15 : 460-503·
TEMBE, V.B.-and Dubash, P.J. 1961. The Earthworms: A Review. J. Bombay Nat. Hist. Soc., 58(1) : 171-201.
TEMPLETON, R. 1844. Description of Megascolex caeruleus. Proc. :Zool. Soc. Lond., 12 (1844) : 89-91.
TIWARI, S.C., Tiwari, B.K. and Mishra, R.R. 1989. Microbial populations, enzyme activities and nitrogen-phosphorus-potassium enrichment in earthworm casts and in the surrounding soil of a pineapple plantation. Bioi. Fertil. Soils, 8 : 178-182.
TIWARI, S.C., Tiwari, B.K. and Mishra, R.R. 1992. Relationship between seasonal populations of earthworms and abiotic factors in pineapple plantations. Proc. Nat. Acad. Sci. Ind. Sec. B : (Bioi. Sci.), 62(2) : 223-226.
TRIGO, D., Barois, I., Garvin, M.H., Esperznza, H., Irisson, S. and Lavelle, P. 1999. Mutualism between earthworms and soil microflora. Pedobiologia, 43 : 866-873.
TRIPATHI, G. and Bharadwaj, P. 2004. Earthworm diversity and habitat preferences in arid regions of Rajasthan. Zoos' Print J. 19 : 1515-1519.
VAN HOOK, R.I. 1974. Cadmium, lead and zinc distributions between earth~orms and soils: potentials for biological accumulation. Bull. Environ. Contam. Toxicol., 12 : 509-511.
VAN RHEE, J .A. 1975. Copper contamination effects on earthworms by disposal of pig waste in pastures. In : Progress in Soil Zoology, (ed. J. Vanek.), 451-457.
VAN RHEE, J.A. 1977. Effects of soil pollution on earthworms. Pedobiologia, 17 : 201-208.
VERMA, B.R. and Chauhan, T.P .S. 1979. Preference for pH of some tropical eaI:1hworms. Geobios (Jodhpur), 6(4) : 150-153.
WITTICH, W. 1953. Untersuchungen iiber den VerI auf der Streuzersetzung auf einem Boden mit Regenwurmtatigkeit. Schrift Reige Forstl. Fak. Univ. Gottingen, 9 : 7-33·
WOLTER, C. AND SCHEU, S. 1999. Changes in bacterial numbers and hyphal lengths during the gut passage through Lumbricus terrestris (Lumbricidae, Oligochaeta). Pedobiologia, 43 : 891-900.
WOOD, T.G. 1974. The distribution of earthworms (Megascolecidae) in relation to soils, vegetation and altitude on the slopes of Mt. Kosciusko, Australia. J. Anim. Ecol., 43: 87-106.

CHOWDHURY ,et. al. : On Taxonomy a,nd Ecology of Earth,worms (Annelida : Oligochaeta)... 73
Map 1 : Location of sampling sites
I - Site I (DP) II - Site II (MD) III - Site III (BRF)
I: Site I, Dbapa (DP), Municipal wastes disposal site, Kolkata; II = Site ,I , Madhyamgram (MD), uncu tivated field, North 24 Pgs,.; 111- Site Ill,
Bethuadabari Reserve Forest (BRF), Nadia

.c .., C 0 :E
June '01
July'01
Aug. '01
Sept. '01
Oct. '01
Nov. '01
Dec. '01
Jan. '02
April '02
May '02
June '02
July '02
Table 2 : Showing total and individual species population of earthworm (nos. / m2),
values of edaphic factors and heavy metals at Site - I (DP).
-0 ~ 0 0
II) - 0 - - N 0 CD 0 - ~~ -EN' ~~ ~ z_ N
U 0 1 - N_ ~~ --oE .cu . - E ~ CD~ Q.~ E
Q.'t: c.= .- cu ._- _I CD ~ CD 1
J9 ~'- :2'1: -0= 0 .e cu c. "'I""" N (II) E ~ E ~ l: tJ) - _ cu 0- 0 cu~ -~ .c~ c.
{2~ui w w w CD tn {!.c E :::J E tn Q. -0 0 =C) ~C) cu C) -t=o F ... :::J tn :::J.c - cu~ =~ -0
:::J 0 0 =~ 0 cu c CD tn :J: ... :J: :::J >- cu - cu -CD - C. CD tn W c( ~ ~ - C. Q. -:::J Q. - :::J -
71 70 1 0 29 26 70 86 7.1 0.25 3.66 370 180 504 4
108 106 2 0 34 29 80 92 7.2 0.36 3.54 403 190 596 3
133 127 6 0 31 29 83 96 7.3 0.63 3.86 386 150 698 3
119 118 1 0 30 27 80 95 7 1 0.56 3.33 398 286 644 3
81 79 2 0 28 26 80 91 7.08 0.76 3.46 520 205 674 2.75
82 79 3 0 28 25 65 86 7.15 0.36 2.69 376 201 702 2.5
81 ·80 1 0 22 18 70 82 7.2 0.33 3.02 402 125 572 2.5
69 68 1 0 20 17 65 80 6.86 0.84 3.29 356 185 494 2.75
78 77 1 0 35 30 60 78 7.22 0.3 2.96 350 265 348 5
68 66 2 0 34 30 66 80 7.16 0.59 3.23 385 288 452 6
62 62 0 0 28 27 85 99 7.15 0.22 2.94 480 227.4 536 5
119 113 6 0 33 30 85 94 7.24 0.31 3.86 462 192 548 4
- - -E E E c. c. c. c. c. c. - - -C .c :::J N Q. 0
550 280 201
580 270 220
600 290 220
600 301 170
630 345 265
650 320 250
650 360 270
670 390 300
650 320 250
650 320 210
610 260 230
610 260 210

Table 2 : (Contd.)
-U ~ 0 0 - 1ft 0 - - - N 0
E~ • 0 - 0
~8 ~~ - z_ N U 0 I - Q.N~ ~-.J:. -~E ••
0_ E ~ .- -o.'t: 0.= -. -- -. CD
1 .' ... J!~- :2't: 't:t- 0 _ca
C ~ N CW) E ~ E ~ eO :J: U) - .l2.J:. - . 0 ~.J:.fIi w w w E ~ a. 't:t U ..!e» .l2.J:. .l2.J:.
CD ., ~.l2 caO) cae» :e ~ II) ~ II) - "i~ 1:: 0 .... ~ =e.g 0 =~ =~ ftS C • ~ =e~ 0 >- ftS -
ca _ CD- Q. II) CD II) W c( ~
> - Q. Q. - c( ~
Q. - ~ -Aug. '02 143 139 4 0 32 29 87 100 7.3 0.67 3.73 475 270 646
Sept. '02 134 134 0 0 29 27 80 92 7.15 0.35 3.5 420 314.2 536
Oct. '02 76 76 0 0 27 26 75 84 6.9 0.9 2.33 455 291 736
Nov. '02 92 91 1 0 30 28 70 86 7.2 0.42 2.55 386 272 710
Dec. '02 52 44 8 0 21 18 80 88 7.3 0.29 2.86 379 247.7 690
Jan. '03 2 1 1 0 24 22 65 80 6.94 0.91 3.46 395 102 644
Feb. '03' 8 8 0 0 23 20 75 82 6.5 1.5 3.39 456 92 360
Mar. '03 48 48 0 0 28 24 75 78 6.93 0.73 3.38 470 227 380
April '03 88 69 0 19 32 28 72 80 7.38 0.19 2.21 504 254 440
May '03 67 50 1 16 33 29 73 78 7.2 0.62 3.23 386 214 536
June '03 65 42 15 8 31 29 72 80 7.16 0.18 4.23 504 250 500
July '03 101 96 5 0 30 28 80 95 7.16 0.23 3.68 437 288 636
Aug. '03 135 124 11 0 30 27 86 98 6.9 0.7 4.1 510 300 785
Explanations: El = Lampito mauritii; E2 = Metaphire posthuma; E3 = Perionyx excavatus
- -E E Q. a. Q. a. - -'t:t C 0 N
4 580
6.25 650
3 660
3 630
2.5 690
3 650
6.25 680
5.5 750
4 630
5 650
5 570
3 580
3 600
-E a. Q. -.l2 a.
300
330
316
380
350
410
380
400
340
322
285
250
270
-E Q. Q. -~ u
190
250
204
190
300
220
200
166
220
195
210
200
170
o -~. o g. Q ~
e

Rec. zool. Surv. India, Occ. Paper No. 324
Table 3 : Showing abundance of total and individual earthworm species obtained per month from Site I: DP (expressed in %)
Month Total earthworm E1 E2 E3
June '01 3.41 3.36 0.04 -
July '01 5.18 5.09 0.09 -Aug. '01 6.38 6.09 0.28 -
Sept. '01 5.71 5.66 0.04 -
Oct. '01 3.89 3.79 .
0.09 -Nov. '01 3.93 3.79 0.14 -Dec. '01 3.89 3.84 0.04 -
Jan. '02 3.31 3.26 0.04 -April '02 3.74 3.69 0.04 -
May '02 3.26 3.17 0.09 -June '02 2.97 2.97 - -
July '02 5.71 5.42 0.28 -
Aug. '02 6.86 6.67 0.19 -
Sept. '02 6.43 6.43 - -
Oct. '02 3.65 3.65 - -
Nov. '02 4.41 4.37 0.04 -Dec. '02 2.49 2.11 0.38 -
Jan. '03 0.09 0.04 0.04 -Feb. '03 0.38 0.3 - -
Mar. '03 2.30 2.3 - -
April '03 4.22 3.31 - 0.91
May '03 3.21 2.4 0.04 0.76
June '03 3.12 2.01 0.72 0.38
July '03 4.85 4.61 0.24 -
Aug. '03 6.48 5.95 0.52 -TOTAL 94.3 3.34 2.05
Explanations : El = Lampito mauritii; E2 = Metaphire posthuma; E3 = Perionyx excavatus

e.;""" .&: o E ...
~ ....... C 0 ~ .
1::'" :IE CI 0 w S
June'01 71
July '01 108
Aug. '01 133
Sept. '01 119
Oct. '01 81
Nov. '01 82
Dec. '01 81
Jan. '02 69
April '02 78
May '02 68
June '02 62
July '02 119
Table 4 : Showing total population of Earthworm, Fungi, Bacteria-Actinomycetes, values of edaphic factors and heavy metals at Site - I (DP).
-E -...-., u ~ .... .,,~ 0 - 1ft 0 o E - - N 0 CD 1ft • U - ~~ - Z...-., N .0) , .. 0 U ~3
~
~N::, 0 , - ~- -0 ....... CGCD.- ci;! . .-. E ~ .~ ~ E
Co -c ~)( 0.= :2~ -- -. •• .' "a = _ II 0.
E ~ % U) - .o~ -... SE::) E ~ - 0 -.I:. .a.&: a.. E ::I E ." a. "a U .!!O) .oQ m>< Uo&&.. 4» ." ~.o ClQ -CGee.,) F ~ ::I ." ::1.0 - .~ .!~ =~ "a 0 c:::l CD .- 4» ::I :z:~ :1:::1 U >- II - 11- U
::I~ .. -- Co ." 4» ." W c( ~ ~ ~ 0 - Co L&.u a.. -0 ::I Co ::I e - --
26 36 29 26 70 86 7.1 0.25 3.66 370 180 504 4
38 68 34 29 80 92 7.2 0.36 3.54 403 190 596 3
62 83 31 29 83 96 7.3 0.63 3.86 386 150 698 3
50 49 30 27 80 95 7.1 0.56 3.33 398 286 644 3
33 52 28 26 80 91 7.08 0.76 3.46 520 205 674 2.75
37 76 28 25 65 86 7.15 0.36 2.69 376 201 702 2.5
32 35 22 18 70 82 7.2 0.33 3.02 402 125 572 2.5
33 34 20 17 65 80 6.86 0.84 3.29 356 185 494 2.75
32 21 35 30 60 78 7.22 0.3 2.96 350 265 348 5
23 20 34 30 66 80 7.16 0.59 3.23 385 288 452 6
33 53 28 27 85 99 7.15 0.22 2.94 480 227.4 536 5
32 60 33 30 85 94 7.24 0.31 3.86 462 192 548 4
- -E E 0. 0. a. a. - -C .a N ~
550 280
580 270
600 290
600 301
630 345
650 320
650 360
670 390
650 320
650 320
610 260
610 260
...-.,
E a. a. -::I U
201
220
220
170
265
250
270
300
250
210
230
210
o -cS' o (") ;::ro Q ~ ..... e

Table 4 : (Contd.)
-:'" -- E 0 ~ tn~ 0 0 ..... - It) - - 0
E~ o E cult) cp 0 - 0 N 0 ~B ~~ z_ N .C) ._0 CJ 0 - - D.. N::--- ~- - - - -o E 0-" CU CU .- .ca . - ..... ~ CP ..... E E E E s::. .- u >< 0.= .- ca .- - ..... .... c'O ~ >- Q..'t: :2't: "=
1 0 _I cp l cp l
C ~-.. -,.. .!!E:l E ::l E ~ .- 0 ::t o E - .a ca _ ca _ca 0. 0. 0. 0. 0 .c. .s, >< cp II) E ::l E II) 0. Wen 0 ca.c .a.c .a.c 0. 0. 0. 0.
1: ~ Uou. ,!.a ::l II) =C) caC) ca C) - - - -:E c:;:, cu co Fo ~ ::l J: ~
::l.a " 0 ca~ =~ =~ " c .a ::l ca c a:I .- cp II) J: ::J - >- ca -ca _
0 N D.. 0 -.... cp w- ::Ju. u 0 0. - 0. II) « ~ ~ u. o cu • 0. -0. 0 ::l ::l C - --
Aug. '02 r- 143 48 61 32 29 87 100 7.3 0.67 3.73 475 270 646 4 580 300 190
Sept. '02 134 42 97 29 27 80 92 7.15 0.35 3.5 420 314.2 536 6.25 650 330 250
Oct. '02 76 41 58 27 26 75 84 6.9 0.9 2.33 455 291 736 3 660 316 204
Nov. '02 92 35 59 30 28 70 86 7.2 0.42 2.55 386 272 710 3 630 380 190
Dec. '02 52 33 39 21 18 80 88 7.3 0.29 2.86 379 247.7 690 2.5 690 350 300
Jan. '03 2 18 74 24 22 65 80 6.94 0.91 3.46 395 102 644 3 650 410 220
Feb. '03 8 25 22 23 20 75 82 6.5 1.5 3.39 456 92 360 6.25 680 380 200
Mar. '03 48 30 34 28 24 75 78 6.93 0.73 3.38 470 227 380 5.5 750 400 166
April '03 88 38 49 32 28 72 80 7.38 0.19 2.21 504 254 440 4 630 340 220
May'03 67 18 31 33 29 73 78 7.2 0.62 3.23 386 214 536 5 650 322 195
June'03 65 29 59 31 29 72 80 7.16 0.18 4.23 504 250 500 5 570 285 210
July'03 101 34 68 30 28 80 95 7.16 0.23 3.68 437 288 636 3 580 250 200
Aug. '03 135 48 112 30 27 86 98 6.9 0.7 4.1 510 300 785 3 600 270 170

Table 5 : Showing abundance of total and individual fungal genera obtained per month from Site I: DP (expressed in ").
Genera June July Aug. Sept. Od. Nov. Dec. Jan. April May June July Aug.
'01 '01 '01 '01 '01 '01 '01 '02 '02 '02 '02 '02 '02
Penicillium 1.49 1.49 3.79 4.36 1.95 2.64 2.18 2.64 2.64 1.26 2.64 1.60 3.21
Aspergillus 0.68 1.72 1.03 0.68 1.03 1.37 0.80 0.80 0.11 0.57 0.57 1.26 0.80
Fusarium 0 0 0.45 0.45 0.57 0 0.11 0.34 0 0.11 0 0.34 0.57
Trichoderma 0.45 0.22 1.26 0.22 0 0 0 0 0.22 0 0 0.11 0.45
Rhizopus 0.11 0.68 0.22 0 0 0 0.11 0 0.57 0 0.22 0.34 0
Cephalosporium 0 0 0 0 0 0.22 0.45 0 0 0.68 0.11 0 0.34
Mucor' 0.22 0.22 0.34 0 0.22 0 0 0 0.11 0 0.22 0 0.11
Total 2.98 4.36 7.12 5.74 3.79 4.25 3.67 3.79 3.67 2.64 3.79 3.67 '5.51
Genera Sept. Oct. Nov. Dec. Jan. Feb. Mar. April May June July Aug. Total
'02 '02 '02 '02 '03 '03 '03 '03 '03 '03 '03 '03
Penicillium 3.10 2.52 2.87 2.98 1.49 1.26 1.72 3.79 1.83 2.52 2.06 3.79 61.95
Aspergillus 0.57 0.45 0.91 0.45 0.45 0.22 0.45 0.34 0.11 0.80 0.80 0.80 17.93
Fusarium 0.57 0.22 0 0.34 0.11 0.80 0.22 0.11 0.11 0 0.34 0.22 6.09
Trichoderma 0 0.45 0.22 0 0 0.57 0.34 0.11 0 0 0.11 0.45 5.28
Rhizopus 0.22 0 0 0 0 0 0.34 0 0 0 0.34 0 3.21
Cephalosporium 0 0.80 0 0 0 0 0.22 0 0 0 0 0.11 2.98
Mucor 0.34 0.22 0 0 0 0 0.11 0 0 0 0.22 0.11 2.52
Total 4.82 4.71 4.02 3.79 2.06 2.87 3.44 4.36 2.06 3.33 3.90 5.51
o -cEo o (")
~ e

Table 6 : Showing abundance of total and individual bacteria-actinomycetes genera obtained per month from Site I: DP (expressed in %).
Genera June July Aug. Sept. Oct. Nov. Dec. Jan. April May June July
'01 '01 '01 '01 '01 '01 '01 '02 '02 '02 '02 '02
Bacillus 1.55 2.44 2.74 2.66 2.14 0.96 1.62 0.81 0.37 0.81 2.14 1.70 Streptomyces 0.37 1.33 0.96 0.59 0.88 1.25 0.37 0.22 0.88 0.44 1.11 1.92 Micrococcus I 0.37 0.51 0.81 0 0 0.66 0.22 0.22 0.14 0.22 0.22 0 Micrococcus II 0 0 0.51 0.22 0.29 0.29 0 0.22 0 0 0.29 0 Arthrobacter 0.14 0.59 0.22 0 0.07 0.51 0 0.22 0.14 0 0.14 0.22 Pseudomonas 0.22 0 0 0.14 0 0 0 0.07 0 0 0 0.22 Promicromonospora 0 0 0 0 0.44 0 0 0.14 0 0 0 0 Cytophaga 0 0.14 0.39 0 0 0.96 0 0 0 0 0 0.14 E. coli 0 0 0.22 0 0 0.51 0.22 0.14 0 0 0 0 Flavobacterium 0 0 0 0 0 0.22 0.14 0 0 0 0 0
Enterobacter 0 0 0.07 0 0 0.22 0 0.44 0 0 0 0.22 Total 2.66 5.03 6.14 3.62 3.85 5.62 2.59 2.51 1.55 1.48 3:92 4.44
Genera Sept. Oct. Nov. Dec. Jan. Feb. Mar. April May June July Aug.
'02 '02 '02 '02 '03 '03 '03 '03 '03 '03 '03 '03
Bacillus 3.03 2.44 0.66 2 2.44 0.37 0.96 1.03 0.66 2.59 2.07 2.74
Streptomyces 0.81 0.59 1.25 0.66 1.33 0.44 1.55 1.40 0.22 1.18 1.40 2.14
Micrococcus I 0.59 0 0.44 0 0.37 0 0 0.66 0.81 0 0.44 0.81
Micrococcus II 0.81 0.29 0.29 0 0.22 0.44 0 0 0.59 0 0.44 0.37
Arthrobacter 0.96 0.07 0.51 0 0.22 0.22 0 0.37 0 0 0.66 0.96
Pseudomonas 0.14 0 0 0 0.07 0 0 0 0 0 0 0.37 Promicromonospora 0 0.44 0 0 0.14 0 0 0.14 0 0.22 0 0.22 Cytophaga 0.66 0.22 0.37 0 0.29 0 0 0 0 0.37 0 0.66
E. coli 0 0.22 0.51 0.22 0 0.14 0 0 0 0 0 0 Flavobacterium 0.14 0 0.14 0 0 0 0 0 0 0 0 0 Enterobacter 0 0 0.14 0 0.37 0 0 0 0 0 0 0 Total 7.18 4.29 4.37 2.88 5.48 1.62 2.51 3.62 2.29 4.37 5.03 8.29
Aug.
'02 2.29 0.66 0.37 0.29 0.66
0 0
0.22 0 0 0
4.51
Total
43.33 24.07 7.92 5.62 6.96 1.25 1.77 4.66 2.22 0.66 1.48
00 o

~ .c -0 .. c J!~ 0 {!..c
::E 1::' ca CD
June '01 47
July '01 83
Aug. '01 67
Sept. '01 104
Oct. '01 127
Nov. '01 72
Dec. '01 74
Jan. '02 45
April '02 48
May '02 33
June '02 73
July '02 60
Aug. '02 97
Sept. '02 120
Table 7 : Showing total and individual species population of earthworm (nos. / m2), values of edaphic factors and heavy metals at Site - II (MD)
0 -0 ~ - - -CD 0 - b~ u ~8 0 .ca . -.. o..'t: 0..= :2e! --N CW') .. It) .-.. co eft 0 CW')
E ~ ~-w w w w w w w ~ ~ ~ E ~ E ~ EO w w w CD en ~.rJ ~~ ~ en ~ en
CD ~ :e ~ :e.g en a.. - & en a.. a.. -~ ~ - -5 4 8 27 0 0 0 0 0 3 28 27 80 92
3 7 43 18 0 1 0 0 1 10 31 27 90 98
0 0 22 26 0 0 0 0 0 19 29 27 82 96
0 0 16 64 0 0 4 1 5 14 33 30 83 90
0 0 9 44 4 0 7 7 2 54 27 25 80 90
0 0 11 11 3 0 6 3 2 36 28 25 70 82
0 0 10 25 3 0 4 0 2 30 22 18 60 80
0 4 0 0 6 0 0 0 0 35 20 17 56 65
0 6 11 10 0 2 0 0 0 19 33 28 60 72
0 10 6 11 0 2 0 0 0 4 37 31 64 70
8 0 12 47 0 0 0 0 1 5 30 28 84 96
0 0 20 26 0 0 2 2 0 10 27 26 100 100
7 0 · 60 16 1 0 0 0 0 13 31 28 80 96
0 0 21 69 0 0 2 4 5 19 32 29 83 92
-.. E % In a.. ~ -0 w
6.6 0.49
7.4 0.18
7.1 0.31
6.7 0.23
6.6 0.21
6.9 0.33
7.1 1.5
6.6 0.56
5.9 0.69
6.4 0.49
6.9 0.59
6.8 0.22
6.8 0.29
6.62 0.15

Table 7 : (Contd.)
0 -~ 0 0 - - -E G) 0 - >.'#. -CJ b~ -0 I
.t: ... ·cu . - ..,- E - 0 Co't: Co:: .- cu .-.~ .., 0 CW') 0III:t :2't: "C::
C of! ~ N C") 0III:t &n ..... co 0') ~ ~ ~ E :l E ~. .- 0 ::t: en
0 ~~ w w w w w w w w w w E :l E en Co "C :E
G) en t!.c :l en -~ ... :l.c
cu G) :l ::t: ; ::t: :l 0 en G) Co - Co en w Co Co -::s :l - -
Oct. '02 137 0 0 4 47 8 0 10 8 3 57 28 26 84 95 6.9 0.2
Nov. '02 93 0 0 15 19 8 0 3 4 2 42 26 24 85 90 6.4 0.39
Dec. '02 59 0 0 9 14 6 0 0 0 1 29 20 18 76 86 6.9 0.76
Jan. '03 59 0 0 0 1 10 0 0 0 0 48 19 17 75 81 6.3 . 0.65
Feb. '03 35 0 7 0 0 0 0 0 0 0 28 22 20 75 80 6.31 0.41
Mar. '03 58 0 12 0 8 0 4 0 0 0 34 26 22 72 80 6.8 0.53
April '03 62 0 3 15 15 0 2 0 0 0 27 30 25 63 78 5.66 0.41
May '03 47 0 9 11 15 0 4 0 0 1 7 34 28 72 78 6.4 0.53
June '03 77 12 15 23 18 0 3 0 0 1 5 31 27 73 92 6.5 0.44
July '03 91 11 3 19 41 0 0 0 1 0 16 28 26 95 100 6.86 0.14
Aug. '03 90 9 0 28 31 0 0 4 3 0 15 30 26 88 96 7.3 0.1
Explanations: E2 = Metaphire posthuma; E3 = Perionyx excavatus; E4 = Eutyphoeus orientalis; ES = Eutyphoeus incommodus; E7 = Drawida nepalensis; E8 = Perionyx simlaensis; E9 = Polypheretima elongata; EI0 = Metaphire houlleti; E13 = Octochaetona surensis; E14 = Drawida papillijer papillijer

Table 7: (Contd.)
1ft 0 N 0 E z.-, N - o.N;:, ~;:' - - - -.,or E E E E ~ - 0 tfl. _I .1 .,1
~ 0 " .. a. a. a. a. c S ~ N CW) .. 1ft ~ CD ~ - .oCl _CI _CI
0 ~~ w w w w w w w .... .... .... U • .c .o.c .a.c a. a. a. a. w w W -Q "Q Cia» - - - -:e 0 "i~ =~ =~ " C .0 ~
• >- .- .- U N A- U CD C ~ ~
June '01 47 5 4 8 27 0 0 0 0 0 3 0.72 195 180 470 3 76 42 50
July '01 83 3 7 43 18 0 1 0 0 1 10 1.1 280 236 310 1.25 55 25 30
Aug. '01 67 0 0 22 26 0 0 0 0 0 19 1.72 285 210 320 0.7 45 22 25
Sept. '01 104 0 0 16 64 0 0 4 1 5 14 1.66 372 240 330 1 40 25 25
Oct. '01 127 0 0 9 44 4 0 7 7 2 54 1.73 386 260 470 1.75 42 20 26
Nov. '01 72 0 0 11 11 3 0 6 3 2 36 1.32 360 105 510 2 65 20 26
Dec. '01 74 0 0 10 25 3 0 4 0 2 30 2.57 330 116.2 680 2 65 30 33
Jan. '02 45 0 4 0 0 6 0 0 0 0 35 1.56 310 205 510 2.75 71 31 33
April '02 48 0 6 11 10 0 2 0 0 0 19 1.24 236 195 330 3.75 80 33 50
May '02 33 0 10 6 11 0 2 0 0 0 4 1.1 195 172 430 4 80 40 55
June '02 73 8 0 12 47 0 0 0 0 1 5 0.63 190 222.4 620 4 80 40 60
July '02 60 0 0 20 26 0 0 2 2 0 10 1.24 250 228 350 1.25 62 26 31
Aug. '02 97 7 0 60 16 1 0 0 0 0 13 1.64 320 190.7 350 1 65 26 21
Sept. '02 120 0 0 21 69 0 0 2 4 5 19 1.52 380 252 360 1.75 70 27 32

Table 7 : (Contd.)
." 0
E N 0 Z_ C"I_ N - ~- - - - -.c ~
~ G)'" a. ... ... E E E E - 0 _I G)I G)I .. .s ~ 0 C"') ~ 0
.a '" a. a. a. a. c N C"') ~ It) to- 00 CD - - '" - '" W W W W W W W ..- .... .... ",.c .a.c .a.c a. a. a. a. 0 ~€ w w w 0 =C) ca C) ca C) - - - -:E 0 "'~ =~ =~ " c .a ~
'" >- ca -ca _ 0 N a. 0
G) <C ~ ~
Oct. '02 137 0 0 4 47 8 0 10 8 3 57 1.71 404 272 480 1.5 60 15 39
Nov. '02 93 0 0 15 19 8 0 3 4 2 42 1.58 366 94 520 2 49 19 22
Dec. '02 59 0 0 9 14 6 0 0 0 1 29 2.21 350 110 560 2.75 65 30 30
Jan. '03 59 0 0 0 1 10 0 0 0 0 48 1.42 342 195 660 3 80 30 38
Feb. '03 35 0 7 0 0 0 0 0 0 0 28 1.08 252 232 552 3 75 35 50
Mar. '03 58 0 12 0 8 0 4 0 0 0 34 0.9 276 255 560 3 73 44 39
April '03 62 0 3 15 15 0 2 0 0 0 27 1.22 220 232 300 3 85 35 42
May '03 47 0 9 11 15 0 4 0 0 1 7 1.07 188 185 420 3.5 90 42 50
June '03 77 12 15 23 18 0 3 0 0 1 5 0.9 220 210 495 4 90 35 50
July '03 91 11 3 19 41 0 0 0 1 0 16 1.01 235 218 324 1 50 30 30
Aug. '03 90 9 0 28 31 0 0 4 3 0 15 1.44 379 218 180 1 50 30 20
Explanations : Metaphire posthuma; E3 = Perionyx excavatus; E4 = Eutyphoeus orientalis; ES =' Eutyphoeus incommodus; E7 = Drawida nepalensis; EB = Perionyx simlaensis; E9 = Polypheretima elongata; E10 = Metaphire houlleti; E13 = Octochaetona surensis; E14 = Drawida papillijer papillijer

CHOWDHURY et. al. : On Taxonomy and Ecology of Earthwonns (Annelida : Oligochaeta) ... 85
Table 8 : Showing abundance of total and individual earthworm species obtained per month from Site II: MD (expressed in %)
Month Total E2 E3 E4 E5 E7 E8 E9 E10 E13 E14
earthworm
June '01 2.52 0.27 0.22 0.43 1.45 - - - - - 0.16
July '01 4.46 0.16 0.38 2.31 0.97 - 0.05 - - 0.05 0.54
Aug. '01 3.60 - - 1.18 1.4 - - - - - 1.02
Sept. '01 5.59 - - 0.86 3.44 - - 0.22 0.05 0.27 0.75
Oct. '01 6.83 - - 0.48 2.37 0.21 - 0.38 0.38 0.11 2.91
Nov. '01 3.87 - - 0.59 0.59 0.16 - 0.32 0.16 0.11 1.94
Dec. '01 3.98 - - 0.54 1.35 0.16 - 0.22 - 0.11 1.62
Jan. '02 2.42 - 0.2 - - 0.32 - - - - 1.93
April '02 2.58 - 0.32 0.59 0.54 - 0.11 - - - 1.02
May '02 1.77 - 0.54 0.32 0.59 - 0.11 - - - 0.22
June '02 3.92 0.43 - 0.65 2.53 - - - - 0.05 0.27
July '02 3.22 - - 1.08 1.4 - - 0.11 0.11 - 0.54
Aug. '02 5.22 0.38 - 3.23 0.86 0.05 - - - - 0.7
Sept. '02 6.45 - - 1.13 3.71 - - 0.11 0.22 0.27 1.02
Oct. '02 7.37 - - 0.22 2.53 0.43 - 0.54 0.43 0.16 3.07
Nov. '02 5.00 - - 0.81 1.02 0.43 - 0.16 0.22 0.11 2.26
Dec. '02 3.17 - - 0.48 0.75 0.32 - - - 0.05 1.55
Jan. '03 3.17 - - - 0.05 0.54 - - - - 2.58
Feb. '03 1.88 - 0.38 - - - - - - - 1.5
Mar. '03 3.12 - 0.64 - 0.43 - 0.21 - - - 1.83
April '03 3.33 - 0.16 0.81 0.81 - 0.11 - - - 1.45
May '03 2.52 - 0.48 0.59 0.81 - 0.21 - - 0.05 0.38
June '03 4.14 0.65 0.8 1.24 0.97 - 0.16 - - 0.05 0.27
July '03 4.89 0.59 0.16 1.02 2.21 - - - 0.05 - 0.86
Aug. '03 4.84 0.48 - 1.51 1.67 - - 0.22 0.16 - 0.81
TOTAL 2.96 4.3 20.1 32.45 2.63 0.96 2.28 1.78 1.39 31.16
Explanations: E2 = Metaphire posthuma; E3 = Perionyx excavatus; E4 = Eutyphoeus orientalis; ES = Eutyphoeus incommodus; E7 = Drawida nepalensis; EB = Perionyx simlaensis,' E9 = Polypheretima elongata; E10 = Metaphire houlleti; E13 = Octochaetona surensis; E14 = Drawida papillifer papillifer

.s:. .... c 0 2
June '01
,July'01
Aug. '01
Sept. '01
Oct. '01
Nov. '01 .--'
Dec. '01
Jan. '02
April '02
May'02
June '02
. July '02
Aug. '02
Sept. '02
Table 9 : Showing total population of Earthworm, Fungi, pacteria - Actinomycetes, values of edaphic factors and heavy metals at Site - II (MO)
....... ....... ....... e u ~
'0& =~ 0 --- ollt 0 ....... ....... N
E~ fl u ....... ~~
....... 0.2»
, .. 0 I! .. z ....... N ....... ':l':-- ....... 0 E ....... .......
o E -8 .... ci~ ........ . ....... 'if!. G)l' o.l' E E c..., ·c >- >< a.= .! l'd
--:-: E ~ ,,- ::z:: U) - ftI G) ftI a. a. ,,-,,0
~E:::» E = ·s ·0 --- i.s:. -,s;, .Q.c a. €B ~ E = a. " U i f:J) a. .- G) en ~.Q = fA = f:J) ftI f:J) - -a»)( .ou. F .. = II) - =~ " C
ftI C c~ m .5u G) = ::c .. ::c-§ u 0 ftI~ =~ (J N fA >- ftI-ftI ___
w--- ~L&. u'S a. --- B- II) w C ~ ~ U- u • a. ---0 = a. c "-" = ----
47 12 35 28 27 80 92 6.6 0.49 0.72 195 180 470 3 76
83 36 56 31 27 90 98 7.4 0.18 1.1 280 236 310 1.25 55
67 44 63 29 27 82 96 7.1 0.31 1.72 285 210 320 0.7 45 "
104 33 72 33 30 83 90 6.7 0.23 1.66 372 240 330 1 40
127 43 51 27 25 80 90 6.6 0.21 1.73 386 260 470 1.75 42
72 17 54 28 25 70 82 6.9 0.33 1.32 360 105 510 2 65
74 17 43 22 18 60 80 7.1 1.5 2.57 330 1~6.2 680 2 65
45 27 23 20 17 56 65 6.6 0.56 1.56 310 205 510 2.75 71
48 23 41 33 28 60 72 5.9 0.69 1.24 236 195 330 3.75 80
33 11 26~ 37 31 64 70 6.4 0.49 1.1 195 172 430 4 80
73 13 44 30 28 84 96 6.9 0.59 0.63 190 222.4 620 4 80
60 31 71 27 26 100 100 6.8 0.22 1.24 250 228 350 1.25 62
97 38 59 31 28 80 96 6.8 0.29 1.64 320 190.7 350 1 65
120 32 105 32 29 83 92 6.62 0.15 1.52 380 252 360 1.75 70
....... ....... E E ca. a. a. a. --- ---.Q = 0. U
42 50
25 30
22 25
25 25
20 26
20 26
30 33
31 33
33 50
40 55
40 60
26 31
26 21
27 32

Table 9 : (Contd.)
-:" -- E (J fI!. .... 0 .~ 0 - ." 0 o E - - N 0 EN' CD'" CD (J - ~~ - Z.- N om , .. 0 CJ ~8 - ~N:, ~:' - - - .-0 I ....... .&. o E 0-" .".~
a.~ 0_ e ~ .- e E e e c.., -CJ>< Q.= -ca -- - . CD r .! • ..
~-... >- :21: ,,- 0 a. Q. Q. a. c _0 SE::J E ~ E ~ eO % tn - ~.&.
_ ca 0 .&.0 ... e :::J 0. " (J ..!!m .Q'&' Sl.J:! a. a. a. a.
1:: II) 0,)( CJOLL. . ." ~Sl ca m ca m - - - -:Ii :::J ." :::J ., - "i~ " C .Q :::J ca 0 "'cy ..- .. :z:.g 0 ::~ =~ c~ a::a .- CD :::J l: .. (J >- ca - ca- (J N ~ U w S :::Ju.
...... 0. ., CD ., W c( ~ ~ ~ 0 - Q.
u.u a. -0 :::J Co C - :::J --
Oct. '02 137 45 49 28 26 84 95 6.9 0.2 1.71 404 272 480 1.5 60 15 39
Nov. '02 93 23 40 26 24 85 90 6.4 0.39 1.58 366 94 520 2 49 19 22
Dec. '02 59 25 38 20 18 76 86 6.9 0.76 2.21 350 110 560 2.75 65 30 30
Jan. '03 59 26 21 19 17 75 81 6.3 0.65 1.42 342 195 660 3 80 30 38
Feb. '03 ·35 31 11 22 20 75 80 6.31 0.41 1.08 252 232 552 3 75 35 50
Mar. '03 58 16 39 26 22 72 80 6.8 0.53 0.9 276 255 560 3 73 44 39 -
April '03 62 18 53 30 25 63 78 5.66 0.41 1.22 220 232 300 3 85 35 42
May '03 47 12 33 34 28 72 78 6.4 0.53 1.07 188 185 420 3.5 90 42 50
'. June '03 77 21 48 31 27 73 92 6.5 0.44 0.9 220 210 495 4 90 35 50
July '03 91 34 52 28 26 95 100 6.86 0.14 1.01 235 218 324 1 50 30 30
Aug. '03 90 4'4 75 30 26 a8 96 7.3 0.1 1.44 379 218 180 1 50 30 20

Table 10: Showing abundance of total and individual fungal genera obtained per month from Site II : MD (expressed in %)
Genera Sept. Oct. Nov. Dec. Jan. Feb. Mar. April May June July Aug. Total '02 '02 '02 '02 '03 '03 '03 '03 '03 '03 '03 '03
Penicillium 1.04 4.31 2.52 2.38 3.27 0.89 1.63 1.93 1.93 0.74 1.33 2.38 2.82
Aspergillus 0.74 1.04 1.33 1.48 1.63 1.04 0.14 0.89 0.89 0.44 0.14 1.19 1.19
Rhizopus 0 0 0.74 0.29 0.59 0.44 0.29 0.89 0 0.14 0 0 0.59
Mucor 0 0 0.29 0.29 0.44 0.14 0 0.14 0.14 0 0.29 0.59 0.14
Fusarium 0 0 1.19 0 0.14 0 0.14 0 0.29 0 0.14 0.29 0
Trichoderma 0 0 0.44 0.44 0.29 0 0.14 0 0 0 0 0.14 0.29
Cladosporium 0 0 0 0'" 0 0 0.14 0.14 0.14 0.29 0 0 0.59
Total 1.78 5.35 6.54 4.91 6.39 2.52 2.52 4.01 3.42 1.63 1.93 4.61 5.65
Genera Sept. Oct. Nov. Dec. Jan. Feb. Mar. April May June July Aug. Total
'02 '02 '02 '02 '03 '03 '03 '03 '03 '03 '03 '03
Penicillium 2.23 4.01 1.93 2.82 2.67 3.12 1.78 1.93 1.33 2.52 2.82 3.27 57.73
Aspergillus 1.33 0.74 1.19 0.14 0.44 0.89 0.14 0.74 0.14 0.44 1.04 1.33 20.83
Rhizopus 0.14 0.14 0.14 0.44 0 0.29 0 0 0.14 0.14 0.74 0.44 6.69
Mucor 0.14 0.29 0.14 0 0.29 0.14 0.14 0 0.14 0 0.14 0.74 4.76
Fusarium 0.29 0.44 0 0 0.29 0 0 0 0 0 0.14 0.44 3.86
Trichoderma 0.44 0.89 0 0 0.14 0 0.14 0 0 0 0.14 0 3.57
Cladosporium 0.14 0.14 0 0.29 0 0.14 0.14 0 0 0 0 0.29 2.52
Total 4.76 6.69 3.42 3.72 3.86 4.61 2.38 2.67 1.78 3.12 5.05 6.54

Table 11 : Shsowing abundance of total and individual bacteria-actinomycetes genera obtained per month from Site II: MD (expressed in %)
Genera June July Aug. Sept. Oct. Nov. Dec. Jan. April May June July Aug.
'01 '01 '01 '01 '01 '01 '01 '02 '02 '02 '02 '02 '02
Streptomyces 1.41 2.74 2.41 2.57 3.24 2.32 1.83 0.58 1.16 0.91 1.16 2.49 1.91
Arthrobacter 0.41 0.58 0.91 1.58 0.16 1.16 0.41 0.41 1.33 0.74 0.74 1.58 0.66
Bacillus 0.66 0.41 1.08 0.74 0.41 0.74 0.41 0.74 0.91 0.49 0.24 1.49 1.08
Micrococcus I 0.41 0.24 0.41 0.49 0 0 0.24 0.16 0 0 0.58 0.16 0.33
Nocardia 0 0.66 0.41 0.24 0 0 0.66 0 0 0 0.91 0.16 0.24
Azotobacter 0 0 0 0.16 0.41 0 0 0 0 0 0 0 0.49
Pseudomonas 0 0 0 0.16 0 0.24 0 0 0 0 0 0 0.16
Total 2.91 4.65 5.24 5.99 4.24 4.49 3.57 1.91 3.41 2.16 3.66 5.90 4.90
Genera Sept. Oct. Nov. Dec. Jan. Feb. Mar. April May June July Aug. Total
'02 '02 '02 '02 '03 '03 '03 '03 '03 '03 '03 '03
Streptomyces 3.66 2.91 1.83 1.16 0.91 0.41 1.49 1.74 0.83 3.07 2.07 2.74 47.67
Arthrobacter 1.49 0.58 0.83 0.41 0.49 0.24 0.66 1.08 1.33 0.49 0.49 1.58 20.46
Bacillus 1.74 0.41 0.24 1.58 0.33 0.24 0.58 1.08 0.33 0.24 0.74 0.74 17.80
Micrococcus I 0.74 0 0 0 0 0 0.24 0 0.24 0.16 0.33 0.49 5.32
Nocardia 0.41 0 0 0 0 0 0.24 0 0 0 0.24 0.41 4.65
Azotobacter 0.41 0.16 0 0 0 0 0 0.49 0 0 0.24 0 2.41
Pseudomonas 0.24 0 0.41 0 0 0 0 0 0 0 0.16 0.24 1.66
Total 8.73 4.07 3.32 3.16 1.74 0.91 3.24 4.40 2.74 3.99 4.32 6.23
o -~. o g. Q ~ e

E .c ...
- 0 ~ S ~ c 0 t2€ :E cu
CD
June '01 18
July '01 28"
Aug. '01 41
Sept. '01 38
Oct. '01 40
Nov. '01 15
Dec. '01 9
Jan. '02 22
April '02 15
May '02 22
June '02 28
July '02 57
Aug. '02 89
Sept. '02 77
Table 12 : Showing total and individual speci~s population of earthworm (nos. / m2), values of edaphic factors and heavy metals at Site - III (BRF)
u -~ 0 0 - - -CD u - 0 u ~~ ~~ 0
ci.~ . -0.= .- cu ._-0 ~ N :2'1: "= ~ N M ~ It') U) to-~ ~ ~ E :s E ~ .- 0 w w w w w w w w w w CD fA E :s E fA
~ .. ~,rl :s fA :S,rl CD :s J: ... J: :s a. fA CD fA - 0. 0. 0. -:s :s - -
0 4 9 5 0 0 0 0 0 0 33 30 80 90
17 3 4 4 0 0 0 0 0 0 30 27 90 98
24 6 0 11 0 0 0 0 0 0 29 27 80 96
22 8 0 8 0 0 0 0 0 0 30 28 78 90
19 8 0 13 0 0 0 0 0 0 27 25 80 88
13 2 0 0 0 0 0 0 0 0 27 24 70 82
9 0 0 0 0 0 0 0 0 0 20 18 66 80
0 0 22 O· 0 0 0 0 0 0 18 17 70 75
0 4 7 4 0 0 0 0 0 0 30 26 70 81
0 2 13 7 0 0 0 0 0 0 36 31 64 70
3 7 7 11 0 0 0 0 0 0 30 28 84 96
28 11 11 7 0 0 0 0 0 0 27 26 95 100
51 13 7 8 0 0 4 0 2 4 31 28 90 96
43 18 0 6 0 0 7 0 2 1 32 29 72 90
J: 0.
7.5
7.2
7.1-
6.3
6.5
6.7
6.83
6.7
7.3
6.8
7.5
7.5
7.2
6.62
-~ I E
UJ
" -U W
0.52
0.18
0.31
0.23
0.21
0.33
0.1
0.3
0.14
0.33
0.59
0.22
0.29
0.15
\0 o

Table 12 : (Contd.)
·U -0
;I-- - -e • u - ~~ -CJ ~8 ~
~ 0 I .s::. - 0 ci~ . - E ~= J2~ --~ J! ~ 0 ~ N "a-C ~ N CW) ~ It) CD ..... E ~ % en 0 ~~ w w w w w w w ~ ~ ~ E ~ E ~ eO ~ "a W W W . ., ~ .-~ t!i ~ ., ~ ., -as • ., 2: ~ %i u
4D ~ - & ., w ~ ~ .-~ ~ - -
Oct. '02 57 41 6 0 10 0 0 0 0 0 0 28 26 84 95 6.5 0.2
Nov. '02 19 10 5 0 4 0 0 0 0 0 0 26 24 75 86 7.9 0.28
Dec. '02 16 13 0 0 1 0 0 2 0 0 0 20 18 75 82 6.9 0.16
Jan. '03 25 11 0 0 0 0 0 14 0 0 0 19 17 75 80 6.7 0.3
Feb. '03 15 0 0 14 0 0 0 1 0 0 0 18 20 73 82 6.9 0.22
Mar. '03 32 0 7 23 0 0 0 2 0 0 0 22 19 70 78 7.3 0.19
April '03 35 0 3 19 13 0 0 0 0 0 0 28 25 72 83 7.5 0.14
May '03 23 0 0 9 9 2 3 0 0 0 0 33 28 72 90 7.2 0.21
June '03 69 7 11 14 15 10 6 6 0 0 0 28 25 92 100 7.7 0.4
July '03 110 49 17 0 17 5 7 10 3 0 2 26 26 88 100 7.3 0.13
Aug. '03 110 51 8 2 13 2 11 16 3 1 3 33 28 88 95 7.63 0.1
Explanations: El = Lampito mauritii; E2 = Metaphire posthuma; E3 = Perionyx excavatus; E4 = Eutyphoeus orientalis; E5 = Eutyphoeus incommodus; E6 = Eutyphoeus nicholsoni; E7 = Drawida nepalensis; EI0 = Metaphire houlleti; Ell = Amynthas corticis; E12 = Octochaetona beatrix
c ...... ~.
o g.. Q n:I e

Table 12 : (Contd.)
E -.c ~
~ - 0 .., S ~ 0 ~ N 0
c: ~ N (It) V It) co " -0 ~€ w w w w w w w or- ~ ~
0 W UJ W ~ 0 ns
CD
June '01 18 0 4 9 5 0 0 0 0 0 0 2.27
July '01 28 17 3 4 4 0 0 0 0 0 0 2.54
Aug. '01 41 24 6 0 11 0 0 0 0 0 0 2.42
Sept. '01 38 22 8 0 8 0 0 0 0 0 0 2.1
Oct. '01 40 19 8 0 13 0 0 0 0 0 0 1.93
Nov. '01 15 13 2 0 0 0 0 0 0 0 0 2.16
Dec. '01 9 9 0 0 0 0 0 0 0 0 0 2.07
Jan. '02 22 0 0 22 0 0 0 0 0 0 0 1.78
April '02 15 0 4 7 4 0 0 0 0 0 0 1.46
May '02 22 0 2 13 7 0 0 0 0 0 0 2.01
June '02 28 3 7 7 11 0 0 0 0 0 0 2.8
July '02 57 28 11 11 7 0 0 0 0 0 0 3
Aug. '02 89 51 "13 7 8 0 0 4 0 2 4 2.95
Sept. '02 77 43 18 0 6 0 0 7 0 2 1 2.08
It)
0 N 0 Z_ N o..N :::' ~- -CD .... .... E _I CD 1 CD 1 .a ns Q. _ ns _ ns
ns .c .a.c .as:. Q. == C) C'CS C) ns C) --C'CS~ =~ ::~ " >-- C'CS- ns- 0 ~ ~ ~
280 220 610 2
280 180 590 0.76
300 210 560 1
226 290 580 1
260 296 680 1
170 105 625 2
353 290 590 2
300 270 510 2.75
222 200 420 3
195 286 465 3.25
270 222.4 620 1.55
290 228 550 0.2
320 190.7 600 0.5
210 210 490 0.7
- -E E Q. Q. Q. Q. - -c .a N 0..
94 34
80 22
70 20
70 28
65 26
60 32
94 36
80 30
90 30
100 30
65 32
56 18
63 25
65 33
-E Q. Q. -::s 0
35
20
16
22
25
32
32
35
40
40
22
18
26
21
o ("') ("')

Table 12·: (Contd.)
1ft 0 E
N 0 Z_ N - ~N::, ~::' - - - -.s::, ~
~ CD - E E E E -0 _I CD • CD I .. S ~ 0 N 0 .a as a. a. a. a. c .... N CW) .- It) CD ,.... .... - _ as
-J:; .oJ:; 0 ~€ w w w w w w w .... .... .... 0 asJ:; i a» a. a. a. a. w w w - a» as a» - - - -:& 0 ii~ =~ =~ ~ c .a :I
tV >- tV -tV_ 0 N ~ 0
CD c( ~ ~
Oct. '02 57 41 6 0 10 0 0 0 0 0 0 2.54 260 280 555 1.25 60 25 20
Nov. '02 19 10 5 0 4 0 0 0 0 0 0 2.71 210 180 490 1.5 70 25 24
Dec. '02 10 13 0 0 1 0 0 2 0 0 0 2.01 350 260 610 2 75 30 30
Jan. '03 25 11 0 0 0 0 0 14 0 0 0 2.1 320 200 460 3 86 30 30
Feb. '03 15 0 0 14 0 0 0 1 0 0 0 1.85 312 272 480 3 90 36 38
Mar. '03 32 0 7 23 0 0 0 2 0 0 0 2.3 276 210 480 2.88 100 41 40
April '03 35 0 3 19 13 0 0 0 0 0 0 0.74 252 290 520 2.5 120 32 40
May '03 23 0 0 9 9 2 3 0 0 0 0 1.51 188 220 580 3 132 38 42
June '03 69 7 11 14 15 10 6 6 0 0 0 2.82 286 269.9 680 2.6 105 ~O 38
July '03 110 49 17 0 17 5 7 10 3 0 2 2.91 353 136 650 0.5 48 26 14
Aug. '03 110 51 8 2 13 2 11 16 3 1 3 3.07 369 136 680 0.8 50 22 16
Explanations: El = Lampito mauritii; E2 = Metaphire posthuma; E3 = Perionyx excavatus; E4 = Eutyphoeus orientalis; ES = Eutyphoeus incommodus; E6 = Eutyphoeus nicholsoni; E7 = Drawida nepalensis; EIO = Metaphire ho.ulleti; Ell, = Amynthas corticis; E12 = Octochaetona beatrix
..
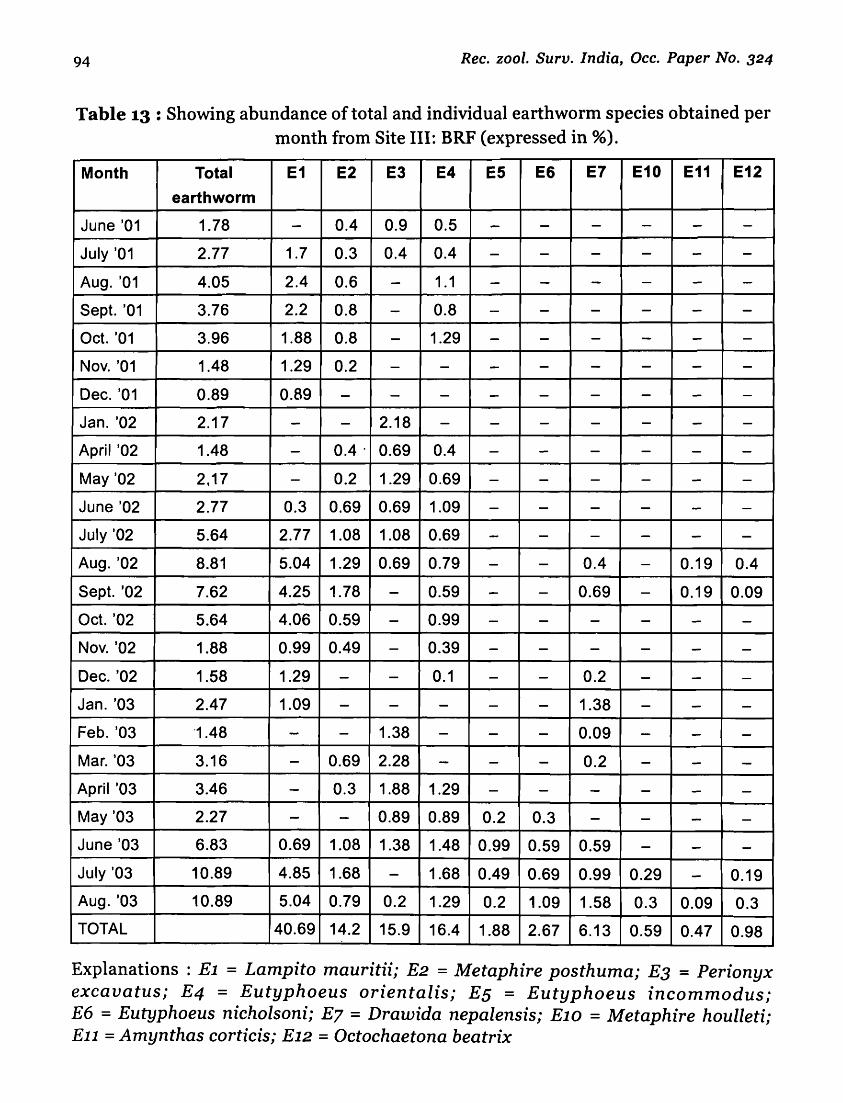
94 Rec. zool. Surv. India, Dcc. Paper No. 324
Table 13 : Showing abundance of total and individual earthworm species obtained per month from Site III: BRF (expressed in %).
Month Total E1 E2 E3 E4 E5 E6 E7 E10 E11 E12 earthworm
June '01 1.78 - 0.4 0.9 0.5 - - - - - -
July '01 2.77 1.7 0.3 0.4 0.4 - - - - - -
Aug. '01 4.05 2.4 0.6 - 1.1 - - - - - -
Sept. '01 3.76 2.2 0.8 - 0.8 - - - - - -
Oct. '01 3.96 1.88 0.8 - 1.29 - - - - - -
Nov. '01 1.48 1.29 0.2 - - - - - - - -
Dec. '01 0.89 0.89 - - - - - - - - -Jan. '02 2.17 - - 2.18 - - - - - - -April '02 1.48 - 0.4 . 0.69 0.4 - - - - - -
May '02 2.17 - 0.2 1.29 0.69 - - - - - -June '02 2.77 0.3 0.69 0.69 1.09 - - - - - -
July '02 5.64 2.77 1.08 1.08 0.69 - - - - - -Aug. '02 8.81 5.04 1.29 0.69 0.79 - - 0.4 - 0.19 0.4
Sept. '02 7.62 4.25 1.78 - 0.59 - - 0.69 - 0.19 0.09
Oct. '02 5.64 4.06 0.59 - 0.99 - - - - - -Nov. '02 1.88 0.99 0.49 - 0.39 - - - - - -
Dec. '02 1.58 1.29 - - 0.1 - - 0.2 - - -
Jan. '03 2.47 1.09 - - - - - 1.38 - - -
Feb. '03 "1.48 - - 1.38 - - - 0.09 - - -
Mar. '03 3.16 - 0.69 2.28 - - - 0.2 - - -April '03 3.46 - 0.3 1.88 1.29 - - - - - -May '03 2.27 - - 0.89 0.89 0.2 0.3 - - - -June '03 6.83 0.69 1.08 1.38 1.48 0.99 0.59 0.59 - - -July '03 10.89 4.85 1.68 - 1.68 0.49 0.69 0.99 0.29 - 0.19
Aug. '03 10.89 5.04 0.79 0.2 1.29 0.2 1.09 1.58 0.3 0.09 0.3
TOTAL 40.69 14.2 15.9 16.4 1.88 2.67 6.13 0.59 0.47 0.98
Explanations: El = Lampito mauritii; E2 = Metaphire posthuma; E3 = Perionyx excavatus; E4 = Eutyphoeus orientalis; ES = Eutyphoeus incommodus; E6 = Eutyphoeus nicholsoni; E7 = Drawida nepalensis; E10 = Metaphire houlleti; Ell = Amynthas corticis; E12 = Octochaetona beatrix

E~ ~ o E ..
~-C 0 ~.
t:~ :E ca c w-
June '01 18
July '01 28
Aug. '01 41
Sept. '01 38
Oct. '01 40
Nov. '01 15
Dec. '01 9
Jan. '02 22
April '02 15
May '02 22
June '02 28
July '02 57
Aug. '02 89
Sept. '02 77
Table 14 : Showing total population of Earthworm, Fungi, Bacteria - Actinomycetes, values of edaphic factors and heavy metals at Site - III (BRF)
-II) E -- u '# .... t»~
0 -- If)
0 o E - - N 0 e u - ~~ - z_ N .0) ."0 U ~3
... N_ ~- -cat» .... 0 I - 0.- E 0- -.::: ~>< ci~ .- E fI!. CD - .!! -. ceo a.= -&a -- _I
CD ~ l!'t: ~= .Q &a a. E ~ % U) --- .... SE::::» E ~ -0 • .l! -s:, .Q.l! Q. E ~ E II) Q. ~ U .a CI .s, )( UOL&. t» ." ~.a - Q II CI -~~ ~ (I) ~.a - "ii~ ~~ =~ 'a cacu 0 c~ m·- ... CD ~ X .. %~ (J >- C'G -- ca-- U
~"- a. II) t» II) W c( ~ ~ u 0 - a. "-u a. -ca . ~ a. 0 ~ c - --
16 43 33 30 80 90 7.5 0.52 2.27 280 220 610 2
34 70 30 27 90 98 7.2 0.18 2.54 280 180 590 0.76
57 62 29 27 80 96 7.1 0.31 2.42 300 210 560 1
31 56 30 28 78 90 6.3 0.23 2.1 226 290 580 1
20 49 27 25 80 88 6.5 0.21 1.93 260 296 680 1
19 59 27 24 70 82 6.7 0.33 2.16 170 105 625 2
17 46 20 18 66 80 6.83 0.1 2.07 353 290 590 2
36 44 18 17 70 75 6.7 0.3 1.78 300 270 510 2.75
27 35 30 26 70 81 7.3 0.14 1.46 222 200 420 3
8 22 36 31 64 70 6.8 0.33 2.01 195 286 465 3.25
16 43 30 28 84 96 7.5 0.59 2.8 270 222.4 620 1.55
48 55 27. 26 95 100 7.5 0.22 3 290 228 550 0.2
53 68 31 28 90 96 7.2 0.29 2.95 320 190.7 .600 0.5
37 53 32 29 72 90 6.62 0.15 2.08 210 210 490 0.7
- - -E e E a. Q. Q. a. a. Q. - - --C .a ~ N Q. U
94 34 35
80 22 20
70 20 16
70 28 22
65 26 25
60 32 32
94 36 32
80 30 35
90 30 40
100 30 40 ..
65 32 22
56 18 18
63 25 26
65 33 21

Table 14 : (Contd.)
-en ~ -- 0 ~
0 0 ..... - - It)
0 o E G);n- G) - - N 0 EN" 0 ~~ -.C) .~O (.) ~5 - z_ Q.N ::'
N ""G)~ 0 1 - ~- - - - -.s:: o E 0- .- (.) .ftS . - E ~ G) - - E E E E cCO ... ~>< D.'t ~:: .- "" .- - _I
G) ~ .!! ~ .. ~- E ~ :2't "0= :J:
0 .c ftS 0. 0. 0. C. C -~ .sE~ E ::a .- 0 rn - -.s:: 0 .s:: • E :l E en 0. "'C U ftS-'= ~ C)
.0-'= 0. 0. C. c. t: en 's, >< CJo~ G) en t!.a :l en - = C) ftS C) - - - -:E ftS g ""co ~ .. :l.a 0 ""~ =~ =~ "0 C .c ::a c::) G) :l l: ... :J: ::a U U N Q. U m.- .... en >- ftS- ""-w- :lu. U 0 D. - . G) en W « ~ ~ u. o Q. 0. -"" . 0. 0 :l ::a c - --Oct. '02 57 31 44 28 26 84 95 6.5 0.2 2.54 260 280 555 1.25 60 25 20 ,
Nov. '02 19 22 35 26 24 75 86 7.9 0.28 2.71 210 180 490 1.5 70 25 24
Dec. '02 16 23 44 20 18 75 82 6.9 0.16 2.01 350 260 610 2 75 30 30
Jan. '03 25 29 47 19 17 75 80 6.7 0.3 2.1 320 200 460 3 86 30 30
Feb. '03 15 25 27 18 20 73 82 6.9 0.22 1.85 312 272 480 3 90 36 38
Mar. '03 32 15 38 22 19 70 78 7.3 0.19 2.3 276 210 480 2.88 100 41 40
April '03 35 11 31 28 25 72 83 7.5 0.14 0.74 252 290 520 2.5 120 32 40
May '03 23 10 19 33 28 72 90 7.2 0.21 1.51 188 220 580 3 132 38 42
June '03 69 15 57 28 25 92 100 7.7 0.4 2.82 286 269.9 680 2.6 105 30 38
July '03 110 42 75 26 26 88 100 7.3 0.13 2.91 353 136 650 0.5 48 26 14
Aug. '03 110 53 70 33 28 88 95 7.63 0.1" 3.07 369 136 680 0.8 50 22 16

Table 15 : Showing abundance of total and individual fungal genera obtained per month from Site III: BRF (expressed in 96)
Genera June July Aug. Sept. Oct. Nov. Dec. Jan. April May June July Aug. '01 '01 '01 '01 '01 '01 '01 '02 '02 '02 '02 '02 '02
Penicillium 1.29 3.02 3.74 2.58 1.72 1.00 1.58 2.30 1.72 0.71 1.58 4.74 4.02
Aspergillus 0.71 0.43 1.72 1.29 0.57 1.29 0.14 0.86 1.15 0 0.14 0.71 1.29
Rhizopus 0.28 0.71 0.71 0.28 0 0.28 0.28 1.15 0.28 0.14 0 0.28 0.57
Mucor 0 0.43 0.28 0.28 0.43 0.14 0 0.14 0.14 0 0.43 0.57 0.14
Fusarium 0 0.14 1.15 0 0.14 0 0.14 0 0.28 0 0.14 0.43 0
Cladosporium 0 0 0 0 0 0 0.14 0.14 0.14 0.28 0 0 0.57
Sclerotium 0 0 0.14 0 0 0 0 0.14 0 0 0 0 0.71
Curvularia 0 0 0 0 0 0 0.14 0.43 0.14 0 0 0 0
Trichoderma 0 0.14 0.43 0 0 0 0 0 0 0 0 0.14 0.28
Total 2.30 4.89 8.20 4.46 2.87 2.73 2.44 5.17 3.88 1.15 2.30 6.90 7.62
Genera Sept. Oct. Nov. Dec. Jan. Feb. Mar. April May June July Aug. Total '02 '02 '02 '02 '03 '03 '03 '03 '03 '03 '03 '03
Penicillium 2.15 3.45 2.44 2.73 3.02 2.44 1.72 1.58 1.29 2.01 3.45 4.02 60.43
Aspergillus 1.58 0.28 0.43 0.14 0.28 0.43 0 0 0.14 0 1.00 1.00 15.68
Rhizopus 0.14 0 0.14 0 0 0 0 0 0 0.14 0.71 1.00 7.19
Mucor 0.14 0 0.14 0 0.28 0.14 0.14 0 0 0 0.57 0.71 5.17
Fusarium 0.28 0.43 0 0 0.28 0 0 0 0 0 0.14 0.43 4.02
Cladosporium 0.14 0 0 0.28 0 0.14 0.14 0 0 0 0 0.28 2.30
Sclerotium 0.86 0 0 0.14 0 0 0 0 0 0 0 0 2.01
Curvularia 0 0.28 0 0 0.14 0.43 0 0 0 0 0 0.14 1.72
Trichoderma 0 0 0 0 0.14 0 0.14 0 0 0 0.14 0 1.43
Total 5.32 4.46 3.16 3.30 4.17 3.59 2.15 1.58 1.43 2.15 6.04 7.62

Table 16 : Showing abundance of total and individual bacteria-actinomycetes genera obtained per month from Site III: BRF (expressed in %)
Genera June July Aug. Sept. Oct. Nov. Dec. Jan. April May June '01 '01 '01 '01 '01 '01 '01 '02 '02 '02 '02
Streptomyces 1.09 2.68 2.26 0.83 2.68 2.34 1.59 0.75 0.92 0.58 1.25
Bacillus 1.76 1.34 1.00 0.16 0.75 1.34 0.16 1.59 1.92 0.75 0.92
Micrococcus I 0.25 0.92 0.58 1.67 0.16 a 0.41 0.58 0 0 0.41
Micrococcus II 0.16 0.25 0.25 0.33 0.16 0.25 0.25 0 0 0.08 0.25
Arthrobacter 0.16 0.41 0.58 1.00 0.25 0.41 0.92 0.50 0.08 0.33 0.16
Pseudomonas 0.16 0.16 0.25 0.50 0.08 0.58 0.41 0.08 0 0.08 0.58
Promicromonospora 0 0 0.08 0 0 0 0 0.16 0 0 0
Azotobacter 0 0.08 0.16 0.16 a 0 0.08 0 0 0 0
Total 3.60 5.87 5.20 4.69 4.11 4.94 3.85 3.69 2.93 1.84 3.60
Genera Sept. Oct. Nov. Dec. Jan. Feb. Mar. April May June July '02 '02 '02 '02 '03 '03 '03 '03 '03 '03 '03
Streptomyces 1.09 1.59 0.92 1.42 0.33 0.08 1.42 0.75 0.25 2.01 3.52
Bacillus 1.00 0.41 0.25 0.83 1.25 1.09 0.92 1.51 1.00 0.83 0.25
Micrococcus I 0.92 0.16 0.33 0.75 0.67 0.50 0.16 0.16 0 1.42 0.58
Micrococcus II 0.16 0.58 0.25 0.08 0.41 0.16 0.33 0.16 0 0.25 0.58
A rthrobacter 0.58 0.67 0.58 0.25 0.67 0.16 0.16 0 0.16 0.16 1.09
Pseudomonas 0.50 0 0.25 0.16 0.50 0.16 a 0 0.16 0.08 0
Promicromonospora 0 0 0.25 0.16 0 0.08 a 0 0 0 0
Azotobacter 0.16 0.25 0.08 0 0.08 0 0.16 0 0 0 0.25
Total 4.44 3.69 2.93 3.69 3.94 2.26 3.18 2.60 1.59 4.78 6.29
July Aug. '02 '02
2.34 2.60
0.83 1.59
0 0.41
0.25 0.58
0.41 0.16
0.75 0.16
0 0
0 0.16
4.61 5.70
Aug. Total '03
3.85 39.26
0.33 23.90
0.33 11.49
0.16 6.04
0.75 10.73
0.25 5.95
0.08 0.83
0.08 1.76
5.87

Table 17: Correlations between different variables in Site I / DP
E1 E2 E3 51 52 53 54 55 56 57 58 59
E1 1.000
E2 0.137 1.000
E3 -0.215 0.026 1.000
51 0.449* 0.118 0.284 1.000
52 0.472* 0.163 0.234 0.965** 1.000
53 0.534** 0.305 -0.130 0.140 0.235 1.000
54 0.709** 0.249 -0.383 0.179 0.293 0.845** 1.000
55 0.445* 0.181 0.306 0.494* 0.470* 0.133 0.228 1.000
56 -0.323 -0.252 -0.207 -0.380 -0.367 -0.027 -0.169 -0.811** 1.000
57 0.233 0.588** -0.231 0.178 0.199 0.401* 0.363 -0.115 0.065 1.000
58 0.059 0.302 0.226 0.123 0.211 0.556** 0.292 -0.119 0.083 0.214 1.000
59 0.487* 0.181 0.078 0.448* 0.494* 0.213 0.251 0.323 -0.381 -0.116 0.186 1.000
510 0.414* 0.319 -0.257 -0.107 0.019 0.402* 0.564** 0.028 -0.034 0.024 0.055 0.183
511 -0.218 -0.167 0.192 0.305 0.280 -0.061 -0.263 -0.196 0.124 0.138 0.154 0.320
512 -0.466* -0.385 -0.036 -0.462* -0.532** -0.331 -0.552** -0.369 0.422* -0.449* -0.137 0.227
513 -0.549** -0.424 0.008 -0.581** -0.637** -0.528** -0.641** -0.390 0.506** -0.383 -0.212 0.124
514 -0.148 -0.052 -0.112 -0.511** -0.540** -0.280 -0.170 0.164 -0.174 -0.261 -0.327 -0.132
** Significant at 1 % level, * Significant at 5% level.

Table 17 : (Contd.)
S10 S11 S12 S13 S14
E1
E2
E3
S1
S2
S3
S4
S5
S6
S7
S8
S9
S10 1.000
S11 -0.744** 1.000
S12 -0.300 0.210 1.000
S13 -0.226 0.028 0.763** 1.000
S14 -0.019 -0.273 0.251 0.261 1.000
** Significant at 1 % level, * Significant at 5% level.
.... o o

Table 18 : Correlations between different variables in Site II / MD
E2 E3 E4 ES E7 E8 E9 E10 E13 E14 51 52
E2 1.000
E3 0.185 1.000
E4 0.466* -0.129 1.000
E5 0.168 -0.429* 0.176 1.000
E7 -0.338 -0.392 -0.354 -0.184 1.000
E8 -0.004 0.831 ** -0.113 -0.338 -0.356 1.000
E9 -0.218 -0.458* -0.127 0.456* 0.384 -0.352 1.000
E10 -0.160 -0.419* -0.081 0.511** 0.394 -0.331 0.876** 1.000
E13 -0.243 -0.328 -0.006 0.735** 0.133 -0.229 0.577** 0.523** 1.000
E14 -0.486* -0.357 -0.433* -0.087 0.791** -0.257 0.588** 0.595** 0.201 1.000
51 0.218 0.285 0.414* 0.367 -0.641** 0.403* -0.020 0.029 0.187 -0.591** 1.000
52 0.274 0.131 0.449** 0.510** -0.612** 0.204 0.048 0.139 0.242 -0.576** 0.955** 1.000
53 0.353 -0.334 0.417* 0.517** -0.118 -0.376 0.168 0.343 0.151 -0.163 0.119 0.334
54 0.513** -0.359 0.576** 0.583** -0.168 -0.389 0.210 0.317 0.191 -0.196 0.154 0.367
55 0.276 -0.264 0.364 0.290 -0.041 -0.358 0.266 0.144 0.140 -0.096 -0.088 -0.002
86 -0.230 0.070 -0.367 -0.363 0.209 0.126 -0.182 -0.436 -0.133 0.074 -0.404 -0.535
87 -0.410* -0.554** 0.036 0.111 0.482* 0.424* 0.429* 0.261 0.359 0.481* -0.394 -0.417*
88 -0.281 -0.608** 0.056 0.321 0.578** -0.523** 0.701** 0.658** 0.577** 0.675** -0.326 -0.266
89 0.113 0.155 0.051 0.396* -0.321 0.129 0.078 0.228 0.088 -0.013 0.246 0.296
810 -0.217 0.040 -0.575** -0.280 0.532** -0.038 0.031 -0.081 0.026 0.403* . -0.617** -0.623**
811 -0.017 0.598** -0.506** -0.431* -0.031 0.560** -0.424* -0.399* -0.285 -0.167 0.038 -0.093
812 0.044 0.567** -0.266 -0.463* -0.132 0.581** -0.494* -0.476* -0.337 -0.273 0.070 -0.071
813 0.206 0.631** -0.264 -0.318 -0.472* 0.604** -0.682** -0.679** -0.455* -0.540** 0.137 0.014
814 0.074 0.579** -0.438* -0.202 -0.260 0.483* -0.381 -0.363 -0.258 -0.339 0.212 0.139
** Significant at 1 % level, * Significant at 5% level. .... o ....

Table 18 : (Contd.)
S3 S4 S5 S6 57 S8 59 S10 S11 S12 S13 S14
E2
E3
E4
ES
E7
E8
E9
E10
E13
E14
S1
52 53 1.000
54 0.907** 1.000
55 0.494* 0.569** 1.000
S6 -0.639 -0.S14** -0.113 1.000
57 -0.169 -0.066 0.241 0.375 1.000
S8 0.160 0.176 0.341 -0.162 0.696** 1.000
S9 0.298 0.257 -0.013 -0.531 ** -0.344 -0.044 1.000
510 -0.357 -0.327 -0.058 0.666** 0.140 0.026 -0.363 1.000
511 -0.600** -0.614** -0.585** 0.457* -0.444* -0.599** -0.151 0.480* 1.000
512 -0.542** -0.512*" -0.553** 0.391 -0.451 * -0.631 ** -0.066 0.330 0.855** 1.000
513 -0.354 -0.393 -0.309 0.346 -0.568** -0.768** 0.042 0.169 0.719** 0.714** 1.000
514 -0.365 -0.375 -0.467* 0.310 -0.593** -0.752** 0.132 0.330 0.866** 0.802** 0.726** 1.000
** Significant at 1 % level, * Significant at 5% level.

Table 19 : Correlations between different variables in Site III I BRF
E1 E2 E3 E4 E5 E6 E7 E10 E11 E12 51 52
E1 1.000
E2 0.710** 1.000
E3 -0.530** -0.181 1.000
E4 0.434* 0.586** -0.120 1.000
E5 0.110 0.368 0.099 0.539** 1.000
E6 0.423* 0.340 -0.081 0.562** 0.690** 1.000
E7 0.510** 0.426* -0.201 0.110 0.323 0.506** 1.000
E10 0.568*· 0.391 -0.218 0.473* 0.371 0.856** 0.461* 1.000
E11 0.637*· 0.573** -0.156 0.105 -0.058 0.145 0.596·* 0.156 1.000
E12 0.752*· 0.544*· -0.162 0.336 0.151 0.520** 0.567*· 0.607*· 0.762** 1.000 51 0.241 0.363 -0.128 0.547** 0.085 0.218 -0.046 0.129 0.315 0.264 1.000
52 0.319 0.472* -0.169 0.613** 0.093 0.194 -0.085 0.157 0.309 0.276 0.962** 1.000
53 0.572*· 0.558** -0.166 0.563** 0.422* 0.418* 0.217 0.342 0.177 0.418* 0.222 0.341
54 0.602*· 0.634** -0.323 0.654** 0.430* 0.414* 0.160 0.331 0.223 0.365 0.349 0.484*
55 -0.093 0.158 0.283 0.291 0.369 0.398* 0.033 0.263 -0.031 0.187 0.211 0.202
56 -0.345 -0.064 0.161 0.035 0.082 -0.208 -0.183 -0.333 -0.158 -0.205 0.197 0.236
57 0.591** 0.536** -0.301 0.258 0.313 0.404* 0.307 0.404* 0.248 0.466* 0.148 0.225
58 0.332 0.070 -0.054 0.061 0.180 0.381 0.388 0.473* 0.076 0.407* -0.460* -0.412*
59 -0.378 -0.262 0.303 0.008 -0.071 -0.383 -0.440* -0.504* -0.259 -0.452* -0.193 -0.171
510 0.379 0.287 -0.317 0.538** 0.470* 0.531** 0.180 0.411* 0.043 0.321 0.203 0.228
511 -0.815** -0.679** 0.535** -0.424* 0.040 -0.175 -0.135 -0.351 -0.425* -0.484* -0.269 -0.402*
512 -0.742** -0.515** 0.563** -0.158 0.125 -0.164 -0.231 -0.430* -0.309 -0.435* -0.001 -0.125
513 -0.590** -0.335 0.398* -0.405* -0.018 -0.189 -0.038 -0.279 -0.105 -0.294 -0.235 -0.315
51~ -0.788** -0.555** 0.640** -0.381 0.045 -0.240 -0.229 -0.454* -0.265 -0.378 -0.143 -0.274
** Significant at 1 % level, * Significant at 5% level.

Table 19 : (Contd.)
53 54 55 56 57 58 59 510 511 512 513 514
E1
E2
E3
E4
E5
E6
E7
E10
E11
E12
51
S2
S3 1.000
54 0.904** 1.000
S5 0.384 0.356 1.000
S6 0.139 0.098 0.196 1.000
S7 0.730** 0.642** 0.321 0.239 1.000
S8 0.397* 0.236 0.150 -0.198 0.372 1.000
S9 -0.245 -0.291 -0.360 0.008 -0.440* -0.009 1.000
510 0.579** 0.600** 0.125 0.139 0.452* 0.328 -0.147 1.000
511 -0.682** -0.739** -0.032 0.150 -0.619** -0.238 0.299 -0.489* 1.000
S12 -0.477* -0.424* 0.142 0.044 -0.661** -0.273 0.421* -0.319 0.774** 1.000
513 -0.667** -0.559** -0.124 0.086 -0.525** -0.221 0.214 -0.256 0.703** 0.645** 1.000
514 -0.621 ** -0.670** 0.028 0.108 -0.667** -0.319 0.350 -0.389 0.904** 0.851** 0.749** 1.000
** Significant at 1 % level, * Significant at 5% level.

Table 20 : Correlations between earthworm, fungi, bacteria-actinomycetes population and different soil factors
Site -I Site -II Site -III ET FT BT ET FT BT ET FT BT
ET 1.000 1.000 1.000 FT 0.780** 1.000 0.632* 1.000 0.622* 1.000
BT 0.553** 0.564** 1.000 0.635** 0.449* 1.000 0.661 ** 0.717** 1.000
51 0.501 * 0.169 0.128 0.146 -0.070 0.423* 0.326 0.040 0.089
52 0.522** 0.230 0.251 0.263 0.049 0.509** 0.377 0.124 0.147
53 0.548** 0.544** 0.479* 0.378 0.517** 0.521 ** 0.645** 0.544** 0.678** 54 0.681 ** 0.665** 0.607** 0.596** 0.528** 0.592** 0.641** 0.508** 0.644**
55 0.507** 0.256 0.110 0.339 0.402* 0.347 0.194 0.002 0.030 56 -0.378 -0.084 -0.131 -0.433* -0.561** -0.480* -0.237 -0.245 -0.099 57 0.262 0.110 0.329 0.336 0.366 0.165 0.572** 0.520** 0.653**
58 0.122 0.139 0.288 0.684** 0.598** 0.376 0.364 0.458* 0.453*
59 0.517** 0.320 0.227 0.324 0.458* 0.290 -0.341 -0.390 -0.500*
510 0.411* 0.491* 0.669** -0.208 -0.468* -0.606** 0.433* 0.060 0.503*
511 -0.208 -0.342 -0.311 -0.605** -0.777** -0.616** -0.623** -0.691** -0.760**
512 -0.511** -0.301 -0.373 -0.592** -0.711** -0.437* -0.507** -0.687** -0.699**
513 -0.592** -0.361 -0.348 -0.691** -0.706** -0.409* -0.449* -0.721** -0.606**
514 -0.170 -0.112 -0.164 -0.528** -0.641 ** -0.509** -0.576** -0.733** -0.741**
** Significant at 1% level, * Significant at 5% level.
Explanations : El = Lampito mauritii; E2 = Metaphire posthuma; E3 = Perionyx excavatus; E4 = Eutyphoeus orientalis; E5 = Eutyphoeus incommodus; E6 = Eutyphoeus nicholsoni; E7 = Drawida nepalensis; E8 = Perionyx simlaensis; E9 = Polypheretima elongata; EI0 = Metaphire houlleti; Ell = Amynthas corticis; E12 = Octochaetona beatrix; E13 = Octochaetona surensis; E14 = Drawida papillijer papillijer. S1 = Temperature (upper soil surface), S2 = Temperature (subsoil), S3 = Relative humidity (upper soil surface), S4 = Relative humidity (subsoil), S5 = pH of soil, S6 = Soil electrical conductivity, S7 = Soil organic Carbon, S8 = Soil available N2 , S9 = Soil available P 205' S10 = Soil available K
20, Sll = Soil Cadmium, S12 = Soil Zinc, S13 = Soil Lead, S14 = Soil Copper, ET = Total number of
Earthworms, Ff = Total number of Fungi, BAT = Total number of Bacteria-actinomycetes ... o
CJ1
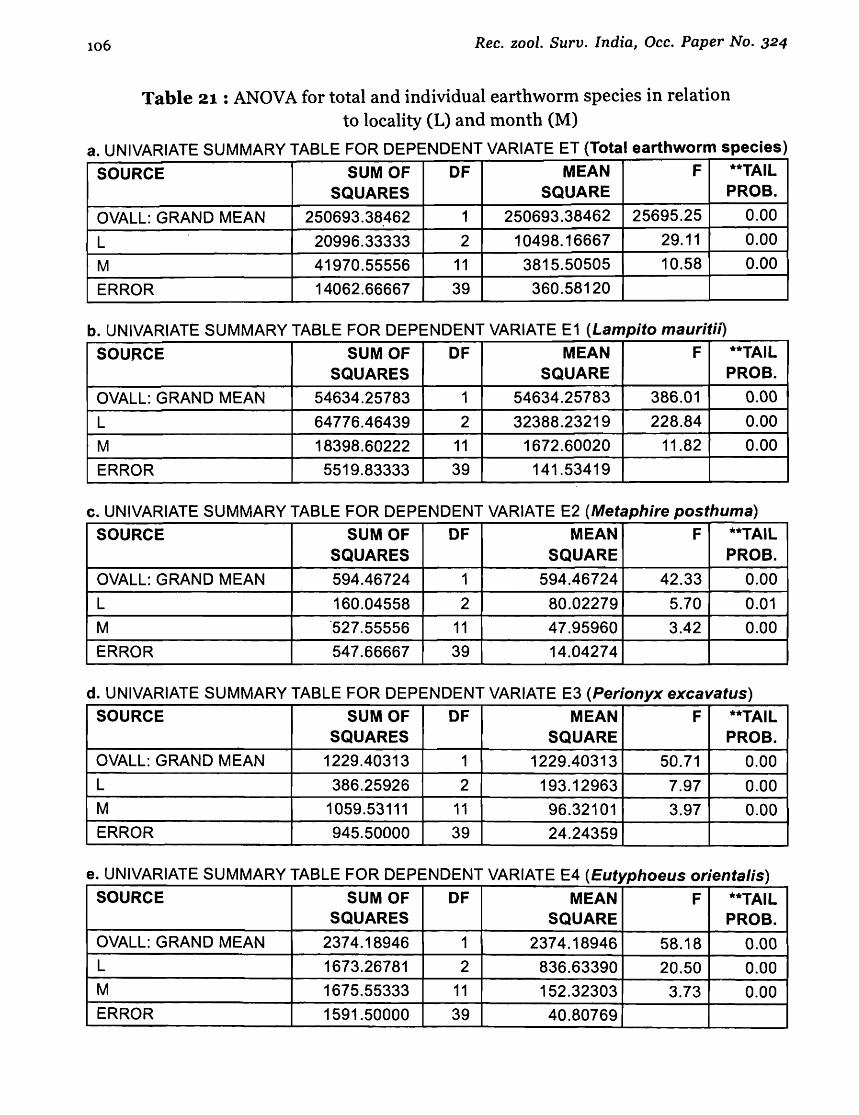
106 Rec. zool. Surv. India, Dcc. Paper No. 324
Table 21 : ANOV A for total and individual earthworm species in relation to locality eL) and month eM)
a. UNIVARIATE SUMMARY TABLE FOR DEPENDENT VARIATE ET (Total earthworm species)
SOURCE SUM OF OF MEAN F **TAIL SQUARES SQUARE PROBe
OVALL: GRAND MEAN 250693.38462 1 250693.38462 25695.25 0.00
L 20996.33333 2 10498.16667 29.11 0.00
M 41970.55556 11 3815.50505 10.58 0.00
ERROR 14062.66667 39 360.58120
b. UNIVARIATE SUMMARY TABLE FOR DEPENDENT VARIATE E1 (Lampito mauritill
SOURCE SUM OF OF MEAN F **TAIL SQUARES SQUARE PROBe
OVALL: GRAND MEAN 54634.25783 1 54634.25783 386.01 0.00
L 64776.46439 2 32388.23219 228.84 0.00
M 18398.60222 11 1672.60020 11.82 0.00
ERROR 5519.83333 39 141.53419
c. UNIVARIATE SUMMARY TABLE FOR DEPENDENT VARIATE E2 (Metaphire posthuma)
SOURCE SUM OF OF MEAN F **TAIL SQUARES SQUARE PROBe
OVALL: GRAND MEAN 594.46724 1 594.46724 42.33 0.00
L 160.04558 2 80.02279 5.70 0.01
M °527.55556 11 47.95960 3.42 0.00
ERROR 547.66667 39 14.04274
d. UNIVARIATE SUMMARY TABLE FOR DEPENDENT VARIATE E3 (Perionyx excavatus)
SOURCE SUM OF OF MEAN F **TAIL SQUARES SQUARE PROBe
OVALL: GRAND MEAN 1229.40313 1 1229.40313 50.71 0.00
L 386.25926 2 193.12963 7.97 0.00
M 1059.53111 11 96.32101 3.97 0.00
ERROR 945.50000 39 24.24359
e. UNIVARIATE SUMMARY TABLE FOR DEPENDENT VARIATE E4 (Eutyphoeus orientalis) SOURCE SUM OF OF MEAN F **TAIL
SQUARES SQUARE PROBe OVALL: GRAND MEAN 2374.18946 1 2374.18946 58.18 0.00 L 1673.26781 2 836.63390 20.50 0.00 M 1675.55333 11 152.32303 3.73 0.00 ERROR 1591.50000 39 40.80769

CHOWDHURY et. 0/. : On Taxonomy and Ecology of Earthwol°ms (Annelida: Oligochaeta) ... 107
f. UNIVARIATE SUMMARY TABLE FOR DEPENDENT VARIATE E5 (Eutyphoeus incommodus)
SOURCE SUM OF OF MEAN F **TAIL SQUARES SQUARE PROBe
OVALL: GRAND MEAN 3752.32051 1 3752.32051 139.57 0.00
L 6963.44444 2 3481.72222 129.51 0.00
M 2510.71333 11 228.24667 8.49 0.00
ERROR 1048.50000 39 26.88462
g. UNIVARIATE SUMMARY TABLE FOR DEPENDENT VARIATE E6 (Eutyphoeus nicholsoni)#
SOURCE SUM OF OF MEAN F **TAIL SQUARES SQUARE PROBe
OVALL: GRAND MEAN 4.62821 1 4.62821 1.27 0.27
M 14.66889 11 1.33354 0.37 0.96
ERROR 141.83333 39 3.63675
h. UNIVARIATE SUMMARY TABLE FOR DEPENDENT VARIATE E7 (Drawida nepalensis)
SOURCE SUM OF OF MEAN F **TAIL SQUARES SQUARE PROBe
OVALL: GRAND MEAN 132.51425 1 132.51425 13.34 0.00
L 66.61823 2 33.30912 3.35 0.05
M 123.99778 11 11.27253 1.13 0.36 ~
ERROR 387.50000 39 9.93590
I. UNIVARIATE SUMMARY TABLE FOR DEPENDENT VARIATE E8 (Perionyx simlaensis)#
SOURCE SUM OF OF MEAN F **TAIL SQUARES SQUARE PROBe
OVALL: GRAND MEAN 5.47578 1 5.47578 24.64 0.00
M 10.79111 11 0.98101 4.41 0.00
ERROR 8.66667 39 0.22222
j. UNIVARIATE SUMMARY TABLE FOR DEPENDENT VARIATE E9 (Polypheretima e/ongata)#
SOURCE SUM OF OF MEAN F **TAIL SQUARES SQUARE PROBe
OVALL: GRAND MEAN 20.51282 1 20.51282 24.74 0.00
M 49.03556 11 4.45778 5.38 0.00
ERROR 32.33333 39 0.8"2906

108 Rec. zool. Surv. India, Oee. Paper No. 324
k. UNIVARIATE SUMMARY TABLE FOR DEPENDENT VARIATE E10 (Metaphire houl/etl)
SOURCE SUM OF OF MEAN F **TAIL SQUARES SQUARE PROS.
OVALL: GRAND MEAN 15.70513 1 15.70513 24.02 0.00
L 21.87179 2 10.93590 16.73 0.00
M 37.55333 11 3.41394 5.22 0.00
ERROR 25.50000 39 0.65385
I. UNIVARIATE SUMMARY TABLE FOR DEPENDENT VARIATE E11 (Amynthas corticis)#
SOURCE SUM OF OF MEAN F **TAIL SQUARES SQUARE PROS.
OVALL: GRAND MEAN 0.20513 1 0.20513 2.00 0.17
M 1.33333 11 0.12121 1.18 0.33
ERROR 4.00000 39 0.10256
m. UNIVARIATE SUMMARY TABLE FOR DEPENDENT VARIATE E12 (Octochaetona beatrix)#
SOURCE SUM OF OF MEAN F **TAIL SQUARES SQUARE PROS.
OVALL: GRAND MEAN 0.62821 1 0.62821 2.07 0.16
M 4.72222 11 0.42929 1.41 0.21
ERROR 11.83333 39 0.30342
n. UNIVARIATE SUMMARY TABLE FOR DEPENDENT VARIATE E13 (Octochaetona surensis)#
SOURCE SUM OF OF MEAN F **TAIL SQUARES SQUARE PROS.
OVALL: GRAND MEAN 8.01282 1 8.01282 110.29 0.00
M 16.70889 11 1.51899 20.91 0.00
ERROR 2.83333 39 0.07265
o. UNIVARIATE SUMMARY TABLE FOR DEPENDENT VARIATE E14 (Drawida papillifer papillifer)#
SOURCE SUM OF OF MEAN F **TAIL SQUARES SQUARE PROS.
OVALL: GRAND MEAN 4754.88462 1 4754.88462 918.78 0.00
M 1935.17556 11 175.92505 33.99 0.00
ERROR 201.83333 39 5.17521
** < 0.05 significant, # Restricted to single site only.

CHOWDHURY et. 01. : On Taxonomy and Ecology of Earthworms (Annelida : Oligochaeta) ... 109
Table 22 : ANOVA for total and individual fungi genera in relation to locality (L) and month (M)
8. UNIVARIATE SUMMARY TABLE FOR DEPENDENT VARIATI: FT (Total fungi genera)
SOURCE SUM OF OF MEAN F **TAIL SQUARES SQUARE PROBe
OVALL: GRAND MEAN 54405.12821 1 54405.12821 2356.68 0.00
L 854.36752 2 427.18376 18.50 0.00
M 7655.96889 11 695.99717 30.15 0.00
ERROR 900.33333 39 23.08547
b. UNIVARIATE SUMMARY TABLE FOR DEPENDENT VARIATE F1 (Penicillium sp.)
SOURCE SUM OF OF MEAN F **TAIL SQUARES SQUARE PROBe
OVALL: GRAND MEAN 20128.32051 1 20128.32051 948.65 0.00
L 389.10256 2 194.55128 9.17 0.00
M 1518.93556 11 138.08505 6.51 0.00
ERROR 827.50000 39 21.21795
c. UNIVARIATE SUMMARY TABLE FOR DEPENDENT VARIATE F2 (Aspergillus sp.)
SOURCE SUM OF OF MEAN F **TAIL SQUARES SQUARE PROBe
OVALL: GRAND MEAN 1670.78205 1 1670.78205 311.52 0.00
L 36.77778 2 18.38889 3.43 0.04
M 451.38889 11 41.03535 7.65 0.00
ERROR 209.16667 39 5.36325
d. UNIVARIATE SUMMARY TABLE FOR DEPENDENT VARIATE F3 (Fusarium sp.)
SOURCE SUM OF OF MEAN F **TAIL SQUARES SQUARE PROBe
OVALL: GRAND MEAN 127.35185 1 127.35185 45.78 0.00
L 30.84900 2 15.42450 5.54 0.01
M 95.40222 11 8.67293 3.12 0.00
ERROR 108.50000 39 2.78205
8. UNIVARIATE SUMMARY TABLE FOR DEPENDENT VARIATE F4 (Trichoderma sp.)
SOURCE SUM OF OF MEAN F **TAIL SQUARES SQUARE PROBe
OVALL: GRAND MEAN 74.05128 1 74.05128 38.00 0.00
L 26.26496 2 13.13248 6.74 0.00
M 73.22222 11 6.65657 3.42 0.00
ERROR 76.00000 39 1.94872

110 Rec. zool. Surv. India, Occ. Paper No. 324
f. UNIVARIATE SUMMARY TABLE FOR DEPENDENT VARIATE F5 (Rhizopus sp.) SOURCE SUM OF DF MEAN F **TAIL
SQUARES SQUARE PROBe OVALL: GRAND MEAN 144.05128 1 144.05128 46.56 0.00 L 5.80342 2 2.90171 0.94 0.40 M 77.50222 11 7.04566 2.28 0.03 ERROR 120.66667 39 3.09402
g. UNIVARIATE SUMMARY TABLE FOR DEPENDENT VARIATE F6 (Cephalosporium sp.)# SOURCE SUM OF OF MEAN F **TAIL
SQUARES SQUARE PROBe OVALL: GRAND MEAN 8.89031 1 8.89031 6.00 0.02 M 11.70889 11 1.06444 0.72 0.71 ERROR 57.83333 39 1.48291
h. UNIVARIATE SUMMARY TABLE FOR DEPENDENT VARIATE F7 (Mucor sp.) SOURCE SUM OF OF MEAN F **TAIL
SQUARES SQUARE PROBe OVALL: GRAND MEAN 78.66809 1 78.66809 53.98 0.00 L 3.25071 2 1.62536 1.12 0.34 M 46.61111 11 4.23737 2.91 0.01 ERROR 56.83333 39 1.45726
i. UNIVARIATE SUMMARY TABLE FOR DEPENDENT VARIATE F8 (Cladosporium sp.) SOURCE SUM OF OF MEAN F **TAIL
SQUARES SQUARE PROBe OVALL: GRAND MEAN 3.56125 1 3.56125 11.90 0.00 L 7.12251 2 3.56125 11.90 0.00 M 18.45778 11 1.67798 5.61 0.00 ERROR 11.66667 39 0.29915
j. UNIVARIATE SUMMARY TABLE FOR DEPENDENT VARIATE F9 (Sclerotium sp.)# SOURCE SUM OF OF MEAN F **TAIL
SQUARES SQUARE PROBe OVALL: GRAND MEAN 1.84615 1 1.84615 2.18 0.15 M 7.72000 11 0.70182 0.83 0.61 ERROR 33.00000 39 0.84615
k. UNIVARIATE SUMMARY TABLE FOR DEPENDENT VARIATE F10 (Curvularia sp.)# SOURCE SUM OF OF MEAN F **TAIL
SQUARES SQUARE PROBe OVALL: GRAND MEAN 2.75783 1 2.75783 18.98 0.00 M .
4.85778 11 0.44162 3.04 0.01 ERROR 5.66667 39 0.14530
** < 0.05 significant, # Restricted to single site only.

CHOWDHURY et. ale : On Taxonomy and Ecology of Earthworms (Annelida : Oligochaeta) ... 111
Table 23 : ANOVA for total and individual bacteria - actinomycetes genera in relation to locality (L) and month (M)
8. UNIVARIATE SUMMARY TABLE FOR DEPENDENT VARIATE BAT (Total bacteriaactinomycete. genera)
SOURCE SUM OF OF MEAN F **TAIL SQUARES SQUARE PROBe
OVALL: GRAND MEAN 13.96154 1 13.96154 22.22 0.00
L . 7.00000 2 3.50000 5.57 0.01
M 14.98000 11 1.36182 2.17 0.04
ERROR 24.50000 39 0.62821
b. UNIVARIATE SUMMARY TABLE FOR DEPENDENT VARIATE BA1 (Bacillus sp.)
SOURCE SUM OF OF MEAN F **TAIL SQUARES SQUARE PROBe
OVALL: GRAND MEAN 145284.61681 1 145284.61681 928.79 0.00
L 407.33618 2 203.66809 1.30 0.28
M 18191.35333 11 1653.75939 10.57 0.00
ERROR 6100.50000 39· 156.42308
c. UNIVARIATE SUMMARY TABLE FOR DEPENDENT VARIATE BA2 (Streptomyces sp.)
SOURCE SUM OF OF MEAN F **TAIL SQUARES SQUARE PROBe
OVALL: GRAND MEAN 12371.52279 1 12371.52279 374.17 0.00
L 2070.98575 2 1035.49288 31.32 0.00
M 1082.64222 11 98.42202 2.98 0.01
ERROR 1289.50000 39 33.06410
d. UNIVARIATE SUMMARY TABLE FOR DEPENDENT VARIATE BA3 (Micrococcus I)
SOURCE SUM OF OF MEAN F **TAIL SQUARES SQUARE PROBe
OVALL: GRAND MEAN 19009. 12963 1 19009. 12963 435.88 0.00
L 879.95157 2 439.97578 10.09 0.00 M 3919.86444 11 356.35131 8.17 0.00 ERROR 1700.83333 39 43.61111
e. UNIVARIATE SUMMARY TABLE FOR DEPENDENT VARIATE BA4 (Micrococcus II)
SOURCE SUM OF OF MEAN F **TAIL SQUARES SQUARE PROBe
OVALL: GRAND MEAN 939.23647 1 939.23647 83.76 o.eo L 96.97721 2 48.48860 4.32 0.02 M 348.48000 11 31.68000 2.83 0.01 ERROR 437.33333 39 11.21368

112 Rec. zool. Surv. India, Occ. Paper No. 324
·f. UNIVARIATE SUMMARY TABLE FOR DEPENDENT VARIATE BA5 (Arthrobactersp.)
SOURCE SUM OF OF MEAN F **TAIL SQUARES SQUARE PROBe
OVALL: GRAND MEAN 252.48006 1 252.48006 61.48 0.00
L 127.01140 2 63.50570 15.46 0.00
M 62.33556 11 5.66687 1.38 0.22
ERROR 160.16667 39 4.10684
g. UNIVARIATE SUMMARY TABLE FOR DEPENDENT VARIATE BA6 (Pseudomonas sp.)
SOURCE SUM OF OF MEAN F **TAIL SQUARES SQUARE PROBe
OVALL: GRAND MEAN 2304.82051 1 2304.82051 171.65 0.00
L 447.85470 2 223.92735 16.68 0.00
M 523.68000 11 47.60727 3.55 0.00
ERROR 523.66667 39 13.42735
h. UNIVARIATE SUMMARY TABLE FOR DEPENDENT VARIATE SA7 (Promicromonospora sp.)
SOURCE SUM OF OF MEAN F **TAIL SQUARES SQUARE PROBe
OVALL: GRAND MEAN 114.08689 1 114.08689 34.09 0.00
L 59.02849 2 29.51425 8.82 0.00
M 79.86889 11 7.26081 2.17 0.04
ERROR 130.50000 39 3.34615
i. UNIVARIATE SUMMARY TABLE FOR DEPENDENT VARIATE BA8 (Cytophaga sp.)#
SOURCE SUM OF OF MEAN F **TAIL SQUARES SQUARE PROBe
OVALL: GRAND MEAN 13.40313 1 13.40313 22.56 0.00
M 21 !53111 11 1.95737 3.30 0.00
ERROR 23.16667 39 0.59402
j. UNIVARIATE SUMMARY TABLE FOR DEPENDENT VARIATE BA9 (E.coli)#
SOURCE SUM OF OF MEAN F **TAIL SQUARES SQUARE PROB.
OVALL: GRAND MEAN 36.46724 1 36.46724 11.38 0.00
M 6.7.74667 11 6.15879 1.92 0.07
ERROR 125.00000 39 3.20513

CHOWDHURY et. al. : On Taxonomy and Ecology of Earthworms (Annelida : Oligochaeta) ... 113
k. UNIVARIATE SUMMARY TABLE FOR DEPENDENT VARIATE BA10 (Flavobacterium sp.)#
SOURCE SUM OF OF MEAN F **TAIL SQUARES SQUARE PROBe
OVALL: GRAND MEAN 12.32051 1 12.32051 38.44 0.00
M 31.16667 11 2.83333 8.84 0.00
ERROR 12.50000 39 0.32051
I. UNIVARIATE SUMMARY TABLE FOR DEPENDENT VARIATE BA11 (Enterobacter sp.)#
SOURCE SUM OF OF MEAN F **TAIL SQUARES SQUARE PROBe
OVALL: GRAND MEAN 1.03846 1 1.03846 9.00 0.00
M 4.42000 11 0.40182 3.48 0.00
ERROR 4.50000 39 0.11538
m. UNIVARIATE SUMMARY TABLE FOR DEPENDENT VARIATE BA12 (Azotobactersp.)
SOURCE SUM OF OF MEAN F **TAIL SQUARES SQUARE PROBe
OVALL: GRAND MEAN 27.12821 1 27.12821 15.48 0.00
L 14.25641 2 7.12821 4.07 0.02
M 30.22222 11 2.74747 1.57 0.15
ERROR 68.33333 39 1.75214
n. UNIVARIATE SUMMARY TABLE FOR DEPENDENT VARIATE BA13 (Nocardia sp.)#
SOURCE SUM OF OF MEAN F **TAIL SQUARES SQUARE PROBe
OVALL: GRAND MEAN 27.92023 1 27.92023 7.89 0.01
M 33.52000 11 3.04727 0.86 0.58
ERROR 138.00000 39 3.53846
** < 0.05 significant, # Restricted to single site only.

114 Rec. zool. Surv. India, Occ. Paper No. 324
Table 24 : ANOVA for abiotic factors in relation to locality (L) and month (M)
a. UNIVARIATE SUMMARY TABLE FOR DEPENDENT VARIATE S1 (Upper surface temperature)
SOURCE SUM OF OF MEAN F **TAIL SQUARES SQUARE PROBe
OVALL: GRAND MEAN 49957.38462 1 49957.38462 19290.47 0.00
L 45.70085 2 22.85043 8.82 0.00
M 1351.55556 11 122.86869 47.44 0.00
ERROR 101.00000 39 2.58974
b. UNIVARIATE SUMMARY TABLE FOR DEPENDENT VARIATE S2 (Subsoil temperature)
SOURCE SUM OF DF MEAN F **TAIL SQUARES SQUARE PROBe
OVALL: GRAND MEAN 40256.20513 1 40256.20513 25053.06 0.00
L 19.56410 2 9.78205 6.09 0.01
M 1082.74222 11 98.43111 61.26 0.00
ERROR 62.66667 39 1.60684
c. UNIVARIATE SUMMARY TABLE FOR DEPENDENT VARIATE S3 (Upper surface humidity)
SOURCE SUM OF OF MEAN F **TAIL SQUARES SQUARE PROBe
OVALL: GRAND MEAN 379358.63390 1 379358.63390 12089.05 0.00
L 45.48148 2· 22.74074 0.72 0.49
M 4162.13556 11 378.37596 12.06 0.00
ERROR 1223.83333 39 31.38034
d. UNIVARIATE SUMMARY TABLE FOR DEPENDENT VARIATE S4 (Subsoil humidity)
SOURCE SUM OF OF MEAN F **TAIL SQUARES SQUARE PROBe
OVALL: GRAND MEAN 489487.70513 1 489487.70513 23534.03 0.00
L 13.34188 2 6.67094 0.32 0.73
M 4216.86889 11 383.35172 18.43 0.00
ERROR 811.16667 39 20.79915
e. UNIVARIATE SUMMARY TABLE FOR DEPENDENT VARIATE S5 (pH)
SOURCE SUM OF OF MEAN F **TAIL SQUARES SQUARE PROBe
OVALL: GRAND MEAN 3180.60266 1 3180.60266 63392.61 0.00
L 2.76723 2 1.38362 27.58 0.00
M 2.84146 11 0.25831 5.15 0.00
ERROR 1.95675 39 0.05017

CHOWDHURYet. ale : On Taxonomy and Ecology of Earthworms (Annelida: Oligochaeta) ... 115
f. UNIVARIATE SUMMARY TABLE FOR DEPENDENT VARIATE S6 (Electrical conductivity)
SOURCE SUM OF OF MEAN F **TAIL SQUARES SQUARE PROBe
OVALL: GRAND MEAN 12.15679 1 12.15679 978.63 0.00
L 1.41378 2 0.70689 56.91 0.00
M 1.09786 11 0.09981 8.03 0.00
ERROR 0.48447 39 0.01242
g. UNIVARIATE SUMMARY TABLE FOR DEPENDENT VARIATE S7 (Organic Carbon)
SOURCE SUM OF OF MEAN F **TAIL SQUARES SQUARE PROBe
OVALL: GRAND MEAN 340.14077 1 340.14077 3810.08 0.00
L 39.68625 2 19.84313 222.27 0.00
M 6.03315 11 0.54847 6.14 0.00
ERROR 3.48168 39 0.08927
h UNIVARIATE SUMMARY TABLE FOR DEPENDENT VARIATE 58 (Available N ) . '2
SOURCE SUM OF OF MEAN F **TAIL SQUARES SQUARE PROBe
OVALL: GRAND MEAN 7284648.32051 1 7284648.32051 5684.89 0.00
L 311603.59829 2 155801.79915 121.59 0.00
M 82296.24667 11 7481.47697 5.84 0.00
ERROR 49974.83333 39 1281.40598
I UNIVARIATE SUMMARY TABLE FOR DEPENDENT VARIATE S9 (Available PO) . 2S
SOURCE SUM OF OF MEAN F **TAIL SQUARES SQUARE PROBe
OVALL: GRAND MEAN 3148772.69241 1 3148772.69241 1795.41 0.00
L 8266.82363 2 4133.41181 2.36 0.11
M 62822.51677 11 5711.13789 3.26 0.00
ERROR 68397.79110 39 1753.78952
J. UNIVARIATE SUMMARY TABLE FOR DEPENDENT VARIATE 810 (Available ~O)
SOURCE SUM OF OF MEAN F **TAIL SQUARES SQUARE PROBe
OVALL: GRAND MEAN 18069574.25783 1 1.806957 4E + 7 4780.02 0.00 L 121629.62678 2 60814.81339 16.09 0.00
M 271649.53556 11 24695.41232 6.53 0.00
ERROR 147428.83333 39 3780.22650
** < 0.05 significant, # Restricted to single site only.

116 Rec. ZOOt. Suru. India, Dcc. Paper No. 324
Table 25 : ANOVA for abiotic heavy metals in relation to locality (L) and month (M)
a. UNIVARIATE SUMMARY TABLE FOR DEPENDENT VARIATE 511 (Cadmium)
SOURCE SUM OF OF MEAN F **TAIL SQUARES SQUARE PROBe
OVALL: GRAND MEAN 542.02838 1 542.02838 1256.10 0.00
L 59.69165 2 29.84583 69.16 0.00
M 66.14162 11 6.01287 13.93 0.00
ERROR 16.82915 39 0.43152
b. UNIVARIATE SUMMARY TABLE FOR DEPENDENT VARIATE S12 (Zinc)
SOURCE SUM OF OF MEAN F **TAIL SQUARES SQUARE PROBe
OVALL: GRAND MEAN 4641693.57407 1 4641693.57407 18248.90 0.00
L 4777141.50712 2 2388570.75356 9390.71 0.00
M 27935.17556 11 2539.56141 9.98 0.00
ERROR 9919.83333 39 254.35470
c. UNIVARIATE SUMMARY TABLE FOR DEPENDENT VARIATE 513 (Lead)
SOURCE SUM OF OF MEAN F **TAIL SQUARES SQUARE PROBe
OVALL: GRAND MEAN 1151698.51282 1 1151698.51282 10341.42 0.00
L 1355949.34188 2 677974.67094 6087.72 0.00
M 19454.01333 11 1768.54667 15.88 0.00
ERROR 4343.33333 39 111.36752
d. UNIVARIATE SUMMARY TABLE FOR DEPENDENT VARIATE S14 (Copper)
SOURCE SUM OF OF MEAN F **TAIL SQUARES SQUARE PROBe
OVALL. GRAND MEAN 606145.84615 1 606145.84615 1746.99 0.00
L 508734.36752 2 254367 18376 733.12 0.00
M 9326.92000 11 847.90182 2.44 0.02
ERROR 13531.66667 39 346.96581
** < 0.05 significant, # Restricted to single site only.

CHOWDHURY et. ale : On Taxonomy and Ecology of Earthworms (Annelida: Oligochaeta) ... 117
Table 26 : Summary table of Step Regression Analysis (Total earthworm population ~nd dominant individual species)
Variables used = ET, E1 I E2, E3, E4, E5, E6, E7, E8, E9, E10, E11, E12, E13, E14, 51,52,53,54, S5,S6,S7,S8,59,510,511,512,513,514,FtF1,F2,F3,F4,F5,F6, F7,F8,F8,F9,F10,BAt BA1,BA2,BA3, BA4,BA5,BA6, BA7,BA8,BA9,BA10,BA11,BA12,BA13.
8. Dependent '/ariable = ET (Total earthworm population).
Independent variables = E1 to E14, S1 to 514, FT to F10, BAT to BA13.
Site II DP
Step Variable Multiple Change Adjusted F to F No. Entered R RSQ in RSQ RSQ Enter ,Ratio OF
1 E1 0.9843 0.9689 0.9689 0.9675 715.40 715.40 1
.2 E3 0.9946 0.9892 0.0203 0.9882 41.23 1003.98 2
Site III MD
Step Variable Multiple Change Adjusted F to F No. Entered R RSQ in RSQ RSQ Enter Ratio OF
1 BA3 0.8095 0.6552 0.6552 0.6402 43.71 43.71 1
2 E10 0.8842 0.7818 0.1266 0.7620. 12.76 39.41 2
3 E5 0.9109 0.8297 0.0479 0.8054 5.91 34.11 3 4 E7 0.9346 0.8734 0.0437 0.8481 6.91 34.51 4
5 E4 0.9622 0.9258 0.0524 0.9063 13.41 47.42 5
6 E14 0.9819 0.9641 0.0383 0.9522 19.23 80.64 6 7 E3 0.9946 0.9892 0.0250 0.9847 39.32 221.87 7 8 E2 0.9980 0.9960 0.0068 0.9939 26.81 492.29 8 9 E9 0.9996 0.9991 0.0032 0.9986 53.35 1875.17 9
10 E8 0.9998 0.9995 0.0004 0.9992 12.66 3001.33 10
Site 1111 BRF
Step Variable Multiple Change Adjusted F to F No. Entered R RSQ in RSQ RSQ Enter Ratio OF
1 E1 0.8555 0.7319 0.7319 0.7202 62.78 62.78 1
2 E5 0.9350 0.8742 0.1423 0.8628 24.89 76.44 2
3 E3 0.9725 0.9457 0.0715 0.9380 27.69 122.03 3 4 E4 0.9820 0.9644 0.0186 0.9573 10.47 135.43 4
5 E7 0.9946 0.9892 0.0248 0.9864 43.69 348.35 5 6 E2 0.9978 0.9957 0.0065 0.9942 26.97 691.60 6 7 E6 0.9996 ·0.9992 0.0036 0.9989 79.47 3188.58 7 8 E12 1.0000 0.9999 0.0007 0.9999 210.38 37179.59 8 9 53. 1.0000 1.0000 0.0000 0.9999 7.73 46950:42 9
10 E10 1.0000 1.0000 0.0000 1.0000 4.02 50765.65 10

118 Rec. zool. Surv. India, Dcc. Paper No. 324
b. Dependent variable = E1 (Lampito mauritii).
Independent variables = ET. E2 to E14, 51 to 514. FT to F10. BAT to BA13.
Site II OP
Step Variable Multiple Change Adjusted F to No. Entered R RSQ in RSQ RSQ Enter
1 ET 0.9843 0.9689 0.9689 0.9675 715.41
2 E3 0.9948 0.9896 0.0208 0.9887 43.96
Site 1111 BRF
Step Variable Multiple Change Adjusted F to No. Entered R RSQ in RSQ RSQ Enter
1 ET 0.8555 0'.7319 0.7319 0.7202 62.78
2 E3 0.9401 0.8837 0.1518 0.8731 28.72
3 E5 0.9740 0.9487 0.0650 0.9414 26.60
4 E4 0.9800 0.9605 0.0118 0.9526 5.96
5 E7 0.9917 0.9836 0.0231 0.9792 26.69
6 E2 0.9956 0.9912 0.0076 0.9882 15.52
7 E6 0.9991 0.9981 0.0070 0.9974 64.12
8 E12 0.9999 0.9999 0.0017 0.9998 183.32
9 53 1.0000 0.9999 0.0001 0.9998 8.07
10 E10 1.0000 0.9999 0.0000 0.9999 3.99
c. Dependent variable = E2 (Metaphire posthuma).
F Ratio
715.41
1047.76
F Ratio
62.78
83.58
129.42
121.46
227.29
336.77
1309.99
13462.28
17254.91
18627.91
Independent variables= ET to E1, E3 to E14. 51 to 814, FT to F10. BAT to BA13.
Site II DP
Step Variable Multiple Change Adjusted F to F No. Entered R RSQ in RSQ RSQ Enter Ratio
1 87 0.5887 0.3465 0.3465 0.3181 12.20 12.20
2 511 0.6675 0.4456 0.0991 0.3952 3.93 8.84
3 56 0.7296 0.5324 0.0868 0.4656 3.90 7.97
4 F5 0.7957 0.6331 0.1007 0.5597 5.49 8.63
5 BA3 0.8186 0.6702 0.0371 0.5834 2.14 7.72"
6 E1 0.8331 0.6940 0.0238 0.5920 1.40 6.80
7 ET 0.8717 0.7598 0.0658 0.6610 4.66 7.68
8 BA10 0.8976 0.8056 0.0458 0.7084 3.77 8.29
9 59 0.9327 0.8700 0.0644 0 .. 7920 7.43 11.16
10 BA5 0..9487 0.9000 0.0300 0.8286 4.20 12.60
OF
1
2
OF
1
2
3
4
5
6
7
8
9
10
OF
1
2
3
4
5
6
7
8
9
10

CHOWDHURY eta al. : On Taxonomy and Ecology of Earthworms (Annelida : Oligochaeta) ... 119
Step Variable Multiple Change Adjusted F to F No. Entered R RSQ In RSQ RSQ Enter Ratio OF
11 S4 0.9639 0.9290 0.0290 0.8690 5.32 15.47 11
12 S14 0.9772 0.9549 0.0259 0.9098 6.88 21.16 12
13 F2 0.9837 0.9677 0.0128 0.9295 4.37 25.36 13
14 F6 0.9911 0.9824 0.0147 0.9577 8.32 39.81 14
15 BA2 0.9949 0.9899 0.0075 0.9731 6.71 58.82 15
16 812 0.9968 0.9937 0.0038 0.9811 4.80 78.71 16
17 BA6 0.9973 0.9946 0.0009 0.9814 1.16 75.64 17
18 F7 0.9980 0.9960 0.0014 0.9841 2.18 83.57 18
19 S10 0.9983 0.9967 0.0006 0.9840 0.94 78.49 19
20 S2 0.9985 0.9970 0.0004 0.9822 0.49 67.05 20
21 F3 0.9987 0.9974 0.0004 0.9793 0.45 55.03 21
Site II' MD
Step Variable Multiple Change Adjusted F to F No. Entered R RSQ In RSQ RSQ Enter Ratio OF
1 S4 0.5137 0.2639 0.2639 0.2319 8.24 8.24 1
2 813 0.6791 0.4612 0.1973 0.4122 8.06 9.42 2 3 P20 0.7500 0.5625 0.1013 0.5000 4.86 9.00 3 4 811 0.8054 0.6486 0.0862 0.5784 4.91 9.23 4
5 E4 0.8458 0.7154 0.0667 0.6405 4.46 9.55 5 6 BA2 0.8713 0.7591 0.0437 0.6788 3.27 9.46 6 7 SA3 0.8821 0.7782 0.0190 0.6868 1.46 8.52 7 8 E8 0.8906 0.7933 0.0151 0.6899 1.17 7.67 8 9 E13 0.9004 0.8108 0.0175 0.6972 1.39 7.14 9
10 BA6 0.9087 0.8258 0.0150 0.7014 1.21 6.64 10 11 F3 0.9209 0.8481 0.0223 0.7197 1.91 6.60 11 12 F2 0.9307 0.8661 0.0180 0.7323 1.61 6.47 12 13 85 0.9414 0.8862 0.0201 0.7517 1.94 6.59 13 14 E3 0.9567 0.9153 0.0291 0.7967 3.43 7.72 14 15 ET 0.9758 0.9522 0.0369 0.8725 6.95 11.95 15 16 E10 0.9863 0.9727 0.0205 0.9182 6.02 17.83 16 17 89 0.9938 0.9877 0.0150 0.9578 8.53 33.08 17 18 812 0.9957 0.9914 0.0037 0.9655 2.55 38.28 18 19 S10 0.9990 0.9981 0.0067 0.9908 17.56 137.32 19 20 E9 0.9998 0.9995 0.0014 0.9971 11.80 412.90 20 21 86 1.0000 0.9999 0.0004 0.9995 18.94 2158.08 21
22 F1 1.0000 1.0000 0.0000 0.9997 3.51 3786.00 22

120 Rec. zool. Surv. India, Oec. Paper No. 324
Site 1111 BRF
Step Variable Multiple Change Adjusted F to F No. Entered R RSQ in RSQ RSQ Enter Ratio
1 ET 0.8204 0.6731 0.6731 0.6589 47.35 47.35
2 P6 0.8813 0.7766 0.1036 0.7563 10.20 38.25
3 F10 0.9112 0.8303 0.0536 0.8060 6.64 34.25
4 E12 0.9261 0.8576 0.0273 0.8291 3.84 30.11
5 F1 0.9368 0.8776 0.0200 0.8454 3.11 27.25
6 57 0.9478 0.8984 0.0208 0.8645 3.68 26.53
7 F2 0.9588 0.9194 0.0210 0.8862 4.42 27.69
8 55 0.9679 0.9368 0.0174 0.9052 4.40 29.63
9 F3 0.9737 0.9480 0.0112 0.9168 3.24 30.39
10 S6 0.9786 0.9577 0.0097 0.9275 3.22 31.72
11 F5 0.9827 0.9657 0.0080 0.9367 3.03 33.29
12 S8 0.9875 0.9752 0.0094 0.9503 4.56 39.27
13 E1 0.9907 0.9814 0.0063 0.9595 3.72 44.76
14 E3 0.9940 0.9881 0.0066 0.9714 5.55 59.15
15 BA1 0.9960 0.9921 0.0040 0.9789 4.58 75.29
16 54 0.9980 0.9959 0.0038 0.9877 7.47 121.76
17 F4 0.9989 0.9979 0.0020 0.9928 6.56 194.60
18 59 0.9995 0.9989 0.0011 0.9958 5.96 314.35
19 S2 0.9998 0.9996 0.0006 0.9979 7.11 601.25
20 E10 0.9999 0.9997 0.0002 0.9984 2.52 744.41
21 P13 0.9999 0.9998 0.0001 0.9985 1.23 750.26
22 BAT 1.0000 1.0000 0.0001 0.9995 6.68 2071.48
23 BA6 1.0000 1.0000 0.0000 0.9996 1.70 2670.92
d. Dependent variable = E3 (Perionyx excavatus).
Independent variables ='ET to E2, E4 to E14, 81 to'S14, FT to F10, BAT to BA13.
Site II DP
Step Variable Multiple Change Adjusted F to F No. Entered R RSQ in RSQ RSQ Enter Ratio
1 S4 0.3834 0.1470 0.1470 0.1099 3.96 3.96
2 BA4 0.5724 0.3277 0.1807 0.2666 5.91 5.36
3 S8 0.7331 0.5375 0.2098 0.4714 9.53 8.13 4 55 0.6231· 0.6775 0.1401 0.6130 8.69 10.51
5 BA9 0.8655 0.7491 ·0.0716 0.6831 5.42 11.35
OF
1
2
3
4
5
6
7
8
9
10
11
12
13
14
15
16
17
18
·19
20
21
22
23
OF
1
2
3
4
5

CHOWDHURY et. al. : On Taxono~y and Ecology of Earthworms (Annelida : Oligochaeta) ... 121
Step Variable Multiple Change Adjusted F to F No. Entered R RSQ in RSQ RSQ Enter Ratio OF
6 F1 0.8894 0.7911 0.0420 0.7215 3.62 11.36 6
7 FT 0.9034 0.8162 0.0251 0.7405 2.32 10.78 7
8 53 0.9218 0.8498 0.0336 0.7747 3.58 11.32 8
9 512 0.9449 0.8929 0.0431 0.8287 6.04 13.90 9
10 87 0.9555 0.9131 0.0201 0.8510 3.24 14.71 10
11 F3 0.9642 0.9297 0.0166 0.8702 3.07 15.62 11
12 513 0.9716 0.9440 0.0144 0.8881 3.08 16.87 12
13 F2 0.9799 0.9602 0.0162 0.9132 4.48 20.43 13
14 E2 0.9843 0.9689 0.0086 0.9253 2.77 22.23 14
15 E1 0.9913 0.9826 0.0137 0.9537 7.12 33.92 15
16 56 0.9959 0.9918 0.0091 0.9753 8.85 60.11 16
17 BA2 0.9973 0.9946 0.0029 0.9816 3.75 76.25 17
18 BA1 0.9981 0.9962 0.0016 0.9848 2.46 87.15 18
19 BA7 0.9987 0.9973 0.0011 0.9871 2.08 97.56 19
20 S1 0.9993 0.9987 0.0014 0.9920 4.10 150.39 20
21 BA11 0.9998 0.9996 0.0010 0.9970 7.74 384.88 21
22 F7 1.0000 0.9999 0.0003 0.9991 8.34 1266.23 22
23 510 1.0000 1.0000 0.0000 0.9992 1.15 1301.15 23
24 52 1.0000 1.0000 0.0000 0.0000 INF INF 24
Site III MD
Step Variable Multiple Change Adjusted F to F No. Entered R RSQ in RSQ RSQ Enter Ratio OF
1 E8 0.8311 0.6907 0.6907 0.6772 51.35 51.35 1
2 BA6 0.8773 0.7696 0.0789 0.7486 7.53 36.74 2
3 E14 0.9131 0.8337 0.0642 0.8100 8.11 35.10 3
4 F2 0.9245 0.8547 0.0209 0.8256 2.88 29.40 4
5 BA12 0.9483 0.8992 0.0445 0.8726 8.39 33.89 5
6 512 0.9609 0.9233 0.0241 0.8978 5.67 36.13 6
7 E13 0.9671 0.9352 0.0119 0.9086 3.12 35.06 7
8 BAT 0.9703 0.9414 0.0062 0.9122 1.70 32.15 8
9 59 0.9743 0.9492 0.0077 0.9187 2.28 31.12 9
10 F3 0.9778 0.9561 0.0069 0.9248 2.21 30.50 10
11 F7 0.9807 0.9619 0.0058 0.9296 1.96 29.81 11
12 E2 0.9846 0.9694 0.0075 0.9388 2.96 31.69 12

122 Rec. zool. Surv. India, Oc~. Paper No. 324
Step Variable Multiple Change Adjusted F to F No. Entered R RSQ in RSQ RSQ Enter Ratio OF
13 E4 0.9879 0.9760 0.0065 0.9475 2.99 34.34 13
14 BA3 0.9901 0.9802 0.0043 0.9526 2.17 35.45 14
15 E5 0.9934 0.9869 0.0066 0.9650 4.53 45.06 15
16 88 0.9956 0.9913 0.0044 0.9739 4.06 56.87 16
17 83 0.9970 0.9940 0.0027 0.9794 3.14 68.02 17
18 84 0.9987 0.9974 0.0035 0.9897 8.07 129.60 18 ,
19 86 0.9994 0.9988 0.0014 0.9942 5.60 217.18 19
20 F5 0.9996 0.9992 0.0005 0.9955 2.45 266.39 20
21 S2 0.9999 0.9998 0.0005 0.9984 8.13 706.25 21
22 BA2 1.0000 1.0000 0.0002 0.9995 8.14 2279.53 22
23 FT 1.0000 1.0000 0.0000 0.9991 0.09 1188.14 23
24 S7 1.0000 1.0000 0.0000 0.0000 INF INF 24
Site 1111 BRF
Step Variable Multiple Change Adjusted F to F No. Entered R RSQ in RSQ RSQ Enter Ratio OF
1 814 0.6407 0.4105 0.4105 0.3849 16.02 16.02 1 2 S3 0.7056 0.4979 0.0874 0.4523 3.83 10.91 2 3 F5 0.7517 0.5650 0.0671 0.5029 3.24 9.09 3 4 810 0.7951 0.6321 0.0671 0.5586 -3.65 8.59 4 5 F2 0.8171 0.6677 0.0355 0.5802 2.03 7.63 5 6 E2 0.8522 0.7262 0.0585 0.6349 3.85 7.96 6 7 E5 0.8817 0.7773 0.0511 0.6856 3.90 8.48 7 8 E12 0.9092 0.8266 0.0493 0.7400 4.55 9.54 8 9 ET 0.9246 0.8549 0.0283 0.7679 2.93 9.82 9
10 E1 0.9466 0.8960 0.0411 0.8218 5.54 12.07 10 11 S1 0.9598 0.9213 0.0252 0.8547 4.17 13.83 11 12 E7 0.9764 0.9534 0.0321 0.9067 8.25 20.44 12 13 E4 0.99'15 0.9831 0.0297 0.963'1 19.36 49.22 13 14 E10 0.9969 0.9939 0.0108 0.9854 17.73 116.50 14 15 BA5 0.9985 0.9970 0.0030 0.9919 9.00 196.33 15 16 S4 0.9988 0.9975 0.0006 0.9926 1.91 202.73 16 17 F9 0.9996 0.9992 0.0017 0.9973 14.87 522.40 17 18 F7 0.9997 0.9995 0.0003 0.9979 3.03 636.52 18 19 F4 0.9998 0.9996 0.0002 0.9983 2.33 736.87 1"9 20 BA12 0.9999 0.9998 0.0001 0.9987 2.63 928.46 20 21 BA6 1.0000 0.9999 0.0001 0.9994 5.48 1874.12 21

CHOWDHURY et. al. : On Taxonomy and Ecology of Earthworms (Annelida : Oligochaeta) ... 123
e. Dependent variable = E4 (Eutyphoeus or/entalis).
Independent variables= ET to E3, E5 to E14, S1 to S14, FT to F10, BAT to BA13.
Site III MD
Step Variable Multiple Change Adjusted F to No. Entered R RSQ In RSQ RSQ Enter
1 54 0.5760 0.3318 0.3318 0.3028 11.42
2 BAT 0.7219 0.5212 0.1894 0.4776 8.70
3 510 0.7999 0.6398 0.1187 0.5884 6.92
4 F7 0.8437 0.7119 0.0720 0.6543 5.00
5 F4 0.8609 0.7412 0.0293 0.6731 2.15
6 513 0.8801 0.7745 0.0333 0.6994 2.66
7 E10 0.9014 0.8125 0.0380 0.7354 3.45
8 ET 0.9283 0.8617 0.0491 0.7925 5.68
9 S1 0.9471 0.8970 0.0353 0.8351 5.14
10 E5 0.9638 0.9289 0.0319 0.8781 6.28
11 E14 0.9718 0.9444 0.0155 0.8974 '3.63
12 E2 0.9825 0.9653 0.0209 0.9306 7.23
13 BA12 0.9915 0.9831 0.0178 0.9631 11.56
14 BA13 0.9954 0.9908 0.0078 0.9780 8.46
15 E3 0.9977 0.9953 0.0045 0.9876 8.72
16 F2 0.9990 0.9980 0.0026 0.9939 10.34
17 F3 0.9993 0.9986 0.0007 0.9953 3.44
18 58 0.9996 0.9992 0.0006 0.9969 4.46
19 BA2 0.9998 0.9996 0.0003 0.9979 4.00
20 FT 0.9999 0.9997 0.0001 0.9983 2.02
21 59 0.9999 0.9999 0.0002 0.9989 3.36
22 514 1.0000 1.0000 0.0001 0.9998 15.57
Site III J BRF
Step Variable Multiple Change Adjusted F to No. Entered R RSQ in RSQ RSQ Enter
1 ET 0.6713 0.4507 0.4507 0.4268 18.87
2 52 0.7758 0.6019 0.1512 0.5657 8.36
3 E11 0.8751 0.7658 0.1639 0.7323 14.69
4 59 0.9084 0.8252 0.0594 0.7902 6.80
5 57 0.9194 0.8453 0.0201 0.8046 2.47
F Ratio OF
11.42 1
11.97 2
12.44 3
12.35 4
10.88 5
10.31 6
10.53 7
12.46 8
14.51 9
18.28 10
20.08 11
27.84 12
49.20 13
77.28 14
128.37 15
245.84 16
302.29 17
426.70 18
606.81 19
693.80 20
1050.69 21
5873.68 22
F Ratio OF
18.87 1
16.63 2
22.89 3
23.60 4
20.76 5

124 Rec. zool. Surv. India, Dcc. Paper No. 324
Step Variable Multiple Change Adjusted F to F No. Entered R RSQ in RSQ RSQ Enter Ratio
6 510 0.9363 0.8766 0.0313 0.8355 4.57 21.31
7 S5 0.9487 0.9001 0.0235 0.8590 4.00 21.89
8 E3 0.9576 0.9171 0.0169 0.8756 3.27 22.11
9 S6 0.9710 0.9429 0.0259 0.9087 6.80 27.53
10 E7 0.9751 0.9508 0.0079 0.9157 2.26 27.08
11 E1 0.9781 0.9567 0.0058 0.9200 1 :75 26.10
12 F4 0.9816 0.9636 0.0069 0.9273 2.29 26.50
13 F2 0.9856 0.9714 0.0078 0.9376 3.00 28.76
14 F7 0.9906 '0.9814 0.0100 0.9553 5.35 37.65
15 E2 0.9960 0.9920 0.0106 0.9786 11.88 74.15
16 S1 0.9978 0.9956 0.0036 0.9867 6.50 112.42
17 F3 0.9982 0.9964 0.0008 0.9875 1.53 112.87
18 FT 0.9986 0.9972 0.0009 0.9890 1.92 120.71
19 S13 0.9990 0.9981 0.0009 0.9909 2.24 138.11
20 BA12 0.9994 0.9988 0.0007 0.9929 2.40 168.01
f. Dependent variable = E5 (Eutyphoeus incommodus).
Independent variables = ET to E4. E6 to E14, 81 to 514. FT to F10. BAT to BA13.
Site III MD
Step Variable Multiple Change Adjusted F to F No. Entered R RSQ in RSQ RSQ Enter Ratio
1 ET 0.7503 0.5629 0.5629 0.5439 29.62 29.62
2 E14 0.8453 0.7145 0.1515 0.6885 11.68 27.53
3 E4 0.9506 0.9036 0.1892 0.8899 41.23 65.65
4 E3 0.9813 0.9630 0.0593 0.9556 32.03 129.99
5 E7 0.9881 0.9763 0.0133 0.9700 10.65 156.31 .
6 E9 0.9930 0.9861 0.0099 0.9815 12.84 213.55
7 E2 0.9988 0.9976 0.0115 0.9966 82.09 1019.34
8 BA6 0.9992 0.9985 0.0009 0.9977 9.06 1315.72
9 E10 0.9995 0.9990 0.0005 0.9984 7.86 1671.66
10 FT 0.9998 0.9996 0.0006 0.9993 18.06 3217.06
11 E13 0.9998 0.9997 0.0001 0.9994 4.72 3701·.97
12 F2 0.9999 0.9998 0.0001 0.9995 4.57 4326.82
13 F5 0.9999 0.9998 0.0000 0.9996 3.02 4666.96
OF
6
7
8
9
10
11
12
13
14
15
16.
17
18
19
20
OF
1
2
3
4
5
6
7
8
9
10
11
12
13

CHOWDHURY et. al. : On Taxonomy and Ecology of Earthworms (Annelida : Oligochaeta) ... 125
Step Variable Multiple Change Adjusted F to F No. Entered R RSQ in RSQ RSQ Enter Ratio OF
14 BA13 0.9999 0.9998 0.0000 0.9996 1.67 4596.78 14
15 BA2 0.9999 0.9999 0.0001 0.9997 4.96 5990.62 15
16 F4 1.0000 0.9999 0.0000 0.9998 4.05 7518.93 16
17 F3 1.0000 1.0000 0.0000 0.9999 5.16 10757.48 17
18 F7 1.0000 1.0000 0.0000 0.9999 3.37 13597.48 18
19 57 1.0000 1.0000 0.0000 0.9999 3.10 17385.84 19
20 513 1.0000 1.0000 0.0000 0.9999 2.21 20514.65 20
21 51 1.0000 1.0000 0.0000 1.0000 3.46 31537.76 21
22 56 1.0000 1.0000 0.0000 1.0000 1.61 36188.09 22
23 BA12 1.0000 1.0000 0.0000 1.0000 0.26 21806.84 23
Site 111/ BRF
Step Variable Multiple Change Adjusted F to F No. Entered R RSQ in RSQ RSQ Enter Ratio OF
1 E6 0.6904 0.4767 0.4767 0.4539 20.95 20.95 1
2 E10 0.8118 0.6591 0.1824 0.6281 11.77 21.26 2
3 E2 0.8450 0.7140 0.0549 0.6731 4.03 17.47 3
4 E11 0.9043 0.8177 0.1038 0.7813 11.38 22.43 4
5 F9 0.9374 0.8788 0.0611 0.8469 9.57 27.55 5
6 F3 0.9538 0.9097 0.0310 0.8796 6.17 30.24 6
7 BA5 0.9700 0.9409 0.0312 0.9166 8.98 '38.68 7
8 S14 0.9751 0.9508 0.0099 0.9262 3.20 38.64 8
9 BA12 0.9807 0.9618 0.0111 0.9389 4.35 42.01 9
10 BA4 0.9844 0.9690 0.0072 0.9469 3.25 43.81 10
11 E3 0.9861 0.9724 0.0034 0.9491 1.61 41.70 11
12 F5 0.9888 0.9777 0.0052 0.9554 2.82 43.80 12
13 F2 0.9925 0.9851 0.0074 0.9674 5.43 55.76 13
14 F10 0.9940 0.9879 0.0029 0.9711 2.40 58.53 14
15 S8 0.9952 0.9904 0.0025 0.9745 2.34 62.09 15
16 S5 0.9968 0.9937 0.0032 0.9810 4.07 78.30 16
17 SA3 0.9981 0.9963 0.0026 0.9872 4.94 110.27 17
18 SA2 0.9986 0.9972 0.0009 0.9888 1.99 118.92 18

126 Ree. zool. Surv. India, Oee. Paper No. 324
Step Variable Multiple Change Adjusted F to F No. Entered R RSQ in RSQ RSQ Enter Ratio
19 54 0.9993 0.9986 0.0014 0.9933 5.09 189.64
20 E4 0.9996 0.9991 0.0005 0.9946 2.21 223.89
21 BA7 0.9999 0.9998 0.0007 0.9982 8.86 632.49
22 BAT 1.0000 1.0000 0.0002 0.9997 19.64 4355.77
g. Dependent variable = E7 (Drawida nepaiensis).
Independent variables = ET to E6, E8 to E14, 51 to 514, FT to F10, BAT to BA13.
Site III MD
Step Variable Multiple Change Adjusted F to No. Entered R RSQ in RSQ RSQ Enter
1 E14 0.7914 0.6263 0.6263 0.6100 38.54
2 59 0.8503 0.7230 0.0968 0.6979 7.69
3 51 0.8601 0.7398 0.0168 0.7027 1.36
4 F4 0.8688 0.7548 0.0149 0.7057 1.22
5 511 0.8793 0.7732 0.0184 0.7135 1.54
6 56 0.8979 0.8063 0.0331 0.7417 3.08
7 F1 0.9114 0.8307 0.0244 0.7610 2.45
8 E3 0.9192 0.8449 0.0142 0.7673 1.46,
9 BA2 0.9261 0.8577 0.0128 0.7723 1.35
10 514 0.9379 0.8796 0.0219 0.7936 2.55
11 52 0.9428 0.8889 0.0093 0.7950 1.09
12 F5 0.9481 0.8990 0.0100 0.7980 1.19
13 58 0.9538 0.9098 0.0108 0.8031 1.32
14 E8 0.9607 0.9230 0.0132 0.8151 1.71
15 E10 0.9685 0.9381 0.0151 0.8348 2.19
16 BA12 0.9753 0.9513 0.0132 0.8538 2.17
17 F3 0.9807 0.9617 0.0104 0.8687 1.91
18 E9 0.9860 0.9722 0.0105 0.8889 2.27
19 E2 0.9874 0.9749 0.0027 0.8794 0.53
20 BA13 0.9900 0.9801 0.0052 0.8805 1.04
21 55 0.9934 0.9869 0.0068 0.8953 1.57
22 BA1 0.9995 0.9991 0.0121 0.9887 25.90
23 E4 0.9998 0.9996 0.0005 0.9902 1.29
F Ratio
38.54
28.72
19.91
15.39
12.95
12.49
11.91
10.89
10.05
10.23
9.46
8.90
8.53
8.56
9.09
9.76
10.34
11.67
10.21
9.84
10.77
96.83
106.18
OF
19
20
21
22
OF
1
2
3
4
5
6
7
8
9
10
11
12
13
14
15
16
17'
18
19
20
21
22
23

CHOWDHURY et. ale : On Taxonomy and Ecology of Earthworms (Annelida : Oligochaeta) ... 127
Site 1111 BRF
Step Variable Multiple Change Adjusted F to No. Entered R RSQ In RSQ RSQ Enter
1 E6 0.6997 0.4896 0.4896 0.4674 22.06
2 E11 0.7625 0.5814 0.0919 0.5434 4.83
3 82 0.8238 0.6786 0.0971 0.6326 6.35
4 E3 0.8423 0.7094 0.0308 0.6513 2.12
5 510 0.8738 0.7635 0.0541 0.7013 4.35
6 56 0.8997 0.8095 0.0459 0.7460 4.34
7 ET 0.9149 0.8371 0.0276 0.7700 2.88
8 F10 0.9236 0.8531 0.0160 0.7796 1.74
9 E2 0.9357 0.8755 0.0224 0.8009 2.70
10 E1 0.9466 0.8960 0.0204 0.8217 2.75
11 F7 0.9575 0.9168 0.0209 0.8465 3.26
12 55 0.9667 0.9345 0.0176 0.8689 3.23
13 F9 0.9718 0.9444 0.0099 0.8787 1.96
14 BA2 0.9777 0.9559 0.0115 0.8942 2.62
15 E12 0.9823 0.9649 0.0090 0.9065 2.32
16 58 0.9895 0.9791 0.0141 0.9372 5.40
17 F3 0.9962 0.9924 0.0133 0.9738 12.20
18 BAT 0.9980 0.9959 0.0036 0.9837 5.24
19 BA4 0.9986 0.9972 0.0013 0.9867 2.37
20 F4 0.9991 0.9983 0.0010 0.9895 2.33
21 51 0.9993 0.9987 0.0004 0.9896 1.03
h. Dependent variable = E9 (Polypheretima e/ongata)
Independent variables= ET to E8, E10 to E14, 51 to 514, FT to F10, BAT to BA13.
Sitaill MD
Step Variable Multiple Change Adjusted F to No. Entered R RSQ in RSQ RSQ Enter
1 E10 0.8769 0.7689 0.7689 0.7589 76.54
2 S6 0.9047 0.8185 0.0496 0.8020 6.01
3 511 0.9199 0.8462 0.0277 0.8243 3.79
4 BA2 0.9288 0.8626 0.0164 0.8351 2.38
F Ratio OF
22.06 1
15.28 2
14.78 3
12.21 4
12.27 5
12.75 6
12.48 7 . 11.61 8
11.72 9
12.06 10
13.03 11
14.26 12
14.37 13
15.49 14
16.51 15
23.39 16
53.56 17
81.49 18
94.92 19
114.26 20
109.78 21
F Ratio OF
76.54 1
49.61 2
38.53 3
31.39 4

128 Ree. zool. Surv. India, Dec. Paper No. 324
Step Variable Multiple Change Adjusted No. Entered R RSQ in RSQ RSQ
5 BA6 0.9412 0.8858 0.0232 0.8557
6 53 0.9477 0.8980 0.0122 0.8641
7 55 0.9535 0.9092 0.0111 0.8718
8 BA13 0.9573 0.9164 0.0072 0.8746
9 514 0.9631 0.9276 0.0112 0.8842
10 F3 0.9681 0.9371 0.0095 0.8923
11 E3 0.9732 0.9470 0.0099 0.9022
12 BA3 0.9824 0.9651 0.0181 0.9303
13 E14 0.9876 0.9754 0.0103 0.9463
14 E7 0.9916 0.9832 0.0078 0.9598
15 57 0.9934 0.9868 0.0035 0.9647
16 BA1 0.9942 0.9885 0.0017 0.9654
17 BAT 0.9955 0.9910 0.0025 0.9691
18 512 0.9969 0.9938 0.0028 0.9751
19 S4 0.9976 0.9952 0.0014 0.9771
20 F7 0.9979 0.9958 0.0006 0.9748
21 52 0.9979 0.9958 0.0000 0.9666
I. Dependent variable = E 14 (Drawida papillifer papillifer)
Independent variables= ET to E13, 51 to 514, FT to F10, BAT to BA13.
Site III MO
Step Variable Multiple Change Adjusted No. Entered R RSQ in RSQ RSQ
1 E7 0.7914 0.6263 0.6263 0.6100
2 E9 0.8492 0.7211 0.0948 0.6957
3 52 0.8871 0.7869 0.0658 0.7565
4 BA12 0.9128 0.8331 0.0462 0.7998
5 E2 0.9290 0.8631 0.0299 0.8271
6 S7 0.9461 0.8951 0.0320 0.8601
7 F3 0.9574 0.9167 0.0216 0.8824
8 E3 0.9680 0.9370 0.0203 0.9055
9 512 0.9758 0.9522 0.0152 0.9236
F to F Enter Ratio OF
3.86 29.47 5
2.16 26.42 6
2.08 24.31 7
1.38 21.92 8
2.33 21.37 9
2.12 20.87 10
2.43 21.13 11
6.23 27.69 12
4.59 33.56 13
4.67 41.89 14
2.40 44.73 15
1.19 42.89 16
1.96 45.35 17
2.69 53.32 18
1.51 54.86 19
0.55 47.43 20
0.02 34.12 21
F to F Enter Ratio OF
38.54 38.54 1
7.48 28.44 2
6.48 25.85 3
5.54 24.96 4.
4.16 23.95 5
5.48 25.59 6
4.41 26.72 7
5.16 29.75 8
4.78 33.23 9

CHOWDHURY et. al. : On Taxonomy and Ecology of Earthworms (Annelidcr : Oligochaeta) ... 129
Step Variable Multiple Change Adjusted F to F No. Entered R RSQ in RSQ RSQ Enter Ratio OF
10 S11 0.9813 0.9630 0.0107 0.9365 4.05 36.39 10
11 S9 0.9852 0.9706 0.0077 0.9458 3.39 39.04 11
12 S8 0.9875 0.9751 0.0045 0.9503 2.19 39.24 12
13 S6 0.9897 0.9796 0.0044 0.9554 2.38 40.58 13
14 FT 0.9927 0.9855 0.0059 0.9652 4.11 48.61 14
15 E8 0.9957 0.9914 0.0059 0.9771 6.19 69.34 15
16 F4 0.9967 0.9934 0.0020 0.9803 2.44 75.52 16
17 51 0.9978 0.9956 0.0022 0.9848 3.40 92.61 17
18 513 0.9990 0.9981 0.0025 0.9924 7.97 175.02 18
19 BAT 0.9994 0.9987 0.0006 0.9939 2.42 205.17 19
20 BA6 0.9995 0.9990 0.0003 0.9942 1.34 208.17 20
21 F1 0.9999 0.9997 0.0007 0.9978 7.58 524.86 21
22 E13 0.9999 0.9998 0.0000 0.9972 0.37 395.71 22
23 510 0.9999 0.9998 0.0000 0.9946 0.02 192.60 23
Explanations: ET = Total earthworm population, EI= Lampito mauritii, E2 = Metaphire posthuma, E3 = Perionyx excavatus, E4 = Eutyphoeus orientalis, ES = Eutyphoeus incommodus, E6 = Eutyphoeus nicholsoni, E7 = Drawida nepalensis, EB = Perionyx simlaensis, E9 = Polypheretima elongata, EIO = Metaphire houlleti, Ell = Amynthas corticis, E12 = Octochaetona beatrix, El3 = Octochaetona surensis, El4 = Drawida papillifer papillifer, 81 = Temperature (upper surface), 82 = Temperature (subsoil), 83 = Humidity (upper surface), 84 = Humidity (subsoil), 85 = pH, 86 = Electrical Conductivity, 87 = Organic Carbon, 88 = Available N 2' 89 = Available P 20 5'
810 = Available K20, 811= Cd, 812 = Zn, 813 = Pb, 814 = Cu, IT = Total fungi genera,
Fl = Penicillium sp., F2 = Aspergillus sp., F3 = Fusarium sp., F4= Trichoderma sp., FS = Rhizopus sp., F6 = Cephalosporium sp., F7 = Mucor sp., FB = Cladosporium sp., F9 = Sclerotium sp., FlO = Curvularia sp., BAT = Total bacteria-actinomycetes genera, BA1 = Bacillus sp., BA2 = Streptomyces sp., BA3 = Micrococcus I, BA4 = Micrococcus II, BAs = Arthrobacter sp., BA6 = Pseudomonas sp., BA7 = Promicromonospora sp., BA8 = Cytophaga sp., BA9 = E. coli, BAlD = Flavobacterium sp., BAll = Enterobacter sp., BA12 = Azotobacter sp., BA13 = Nocardia sp.

130 Ree. zool. Surv. India, Dec. Paper No. 324
Table 27 : Showing relative abundance of different earthworm species in different sampling sites (%)
Species Site I: DP Site II: MD Site III: BRF TOTAL
Lampito mauritii 39.73 - 8.3 48.03
Metaphire posthuma 1.45 1.11 2.88 5.44
Perionyx excavatus 0.86 1.61 3.25 5.72
Eutyphoeus orientalis - 7.53 3.35 10.88
Eutyphoeus incommodus - 12.18 0.38 12.56
Eutyphoeus nicholsoni - - 0.54 0.54
Drawida nepf/llensis - 0.98 1.25 2.23
Perionyx simlaensis - 0.36 - 0.36
Po/ypheretima a/ongata - 0.84 - 0.84
Metaphire houl/eti - 0.66 0.12 0.78
Amynthas corticis - - 0.10 0.10
Octochaetona beatrix - - 0.20 0.20
Octochaetona surensis - 0.52 - 0.52
Drawida papil/ifer papil/ifer - 11.69 - 11.69
Table 28 : Showing abundance of earthworm species obtained per month (June 2001
to August 2003) from all sampling sites (expressed in % of total population)
Species J J A S 0 N D
Lampito mauritii 1.41 2.48 3.05 2.82 1.97 1.85 1.79
Metaphire posthuma 0.20 0.16 0.24 0.18 0.20 0.10 0.02
Perionyx excavatus 0.26 0.22 0 0 0 0 0
Eutyphoeus orientalis 0.26 0.94 0.66 0.48 0.44 0.22 0.20
Eutyphoeus incommodus 0.54 0.36 0.52 1.29 0.88 0.22 0.50
Eutyphoeus nicholsoni 0 0 0 0 0 0 0
Drawida nepalensis 0 0 0 0 0.08 0.06 0.06
Perionyx simlaensis 0 0.02 0 0 0 0 '0
Po/ypheretima elongata 0 0.0 0 0 0 0 0
Metaphire houlleti 0 0 0 0.02 0.14 0.06 0
Amynthas corticis 0 0 0 0.0 0.002 0.001 0
Octochaetona beatrix 0 0 0 0 0 0 0
Octochaetona surensis 0 0.02 0 0.10 0.04 0.04 0.04
Drawida papillifer papillifer 0.06 0.20 0.38 0.28 1.09 0.72 0.60

CHOWDHURY et. 0/. : On Taxonomy and Ecology of EarthwornlS (Annelida : Oligochaeta) ... 131
Table 28 : (Contd.)
Specie. J A M J J A S
Lampito mauritil 1.37 1.55 1.33 1.31 2.84 3.83 3.57
Metaphire posthuma 0.02 0.10 0.08 0.30 0.34 0.48 0.36
Perionyx excavatus 0.52 0.26 0.46 0.14 0.22 0.14 0
Eutyphoeus orientalis 0 0.30 0.26 0.46 0.54 1.37 0.54
Eutyphoeus incommodus 0 0.20 0.22 0.94 0.52 0.32 1.39
Eutyphoeus nicholsoni 0 0 0 0 0 0 0
Drawida nepa/ensis 0.12 0 0 0 0 0.10 0.14
Perionyx sim/aensis 0 0.04 0.04 0 0 0 0
Pa/ypheretima e/ongata 0 0.0 0.0 0 0 0 0
Metaphire haul/eti 0 0 0 0 0.04 0 0.08
Amynthas corticis 0 0 0 0 0.0 0 0.001
Octochaetona beatrix 0 0 0 0 0 0.08 0.02
Octochaetona surensis 0 0 0 0.02 0 0 0.10
Drawide papillifer papillifer 0.70 0.38 0.08 0.10 0.20 0.26 0.38
Species 0 N 0 J F M A
Lampito mauritii 2.36 2.04 1.15 0.24 0.16 0.96 1.39
Metaphire posthuma 0.12 0.12 0.16 0.02 0 0.14 0.06
Perionyx excavatus 0 0 0 0 0.42 0.70 0.82
EutyplJoeus orientalis 0.28 0.38 0.20 0 0 0 0.56
Eutyphoeus incommodus 0.94 0.38 0.28 0.02 0 0.16 0.30
Eutyphoeus nicholsoni 0 0 0 0 0 0 0
Drawide nepa/ensis 0.16 0.16 0.16 0.48 0.02 0.04 0
Perionyx sim/sensis 0 0 0 0 0 0.08 0.04
Polypheretima e/ongata 0 0 0 0 0 0.0 0.0
Metaphire houlleti 0.16 0.08 0 0 0 0 0
Amynthas corticis 0.0 0.0 0 0 0 0 0
Octochaetona beatrix 0 0 0 0 0 0 0
Octochaetona surensis 0.06 0.04 0.02 0 0 0 0
Drawida papillifer papillifer 1.15 0.84 0.58 0.96 0.56 0.68 0.54

132 Rec. zool. Surv. India, Dcc. Paper No. 324
Table 28 : (Contd.)
Species M J J A
Lampito mauritii 1.01 0.98 2.92 3.53
Metaphire posthuma 0.02 0.76 0.66 0.56
Perionyx excavatus 0.68 0.74 0.06 0.04
Eutyphoeus orientalis 0.40 0.76 0.72 0.82
Eutyphoeus incommodus 0.34 0.56 0.92 0.66
Eutyphoeus nicholsoni 0.06 0.12 0.14 0.22
Drawida nepalensis 0 0.12 0.20 0.32
Perionyx simlaensis 0.08 0.06 0 0
Polypheretima elongata 0.001 0.001 0 0
Metaphire houl/eti 0 0 0.08 0.12
Amynthas corticis 0 0 0.001 0.002
Octochaetona beatrix 0 0 0.04 0.06
Octochaetona surensis 0.02 0.02 0 0
Drawida papillifer papillifer 0.14 0 .. 10 0.32 0.30
Table 29 : Showing 'Ubiquitous' and 'Stenoecious' species of earthworm in the study sites
'Stenoecious' species 'Ubiquitous' species
(restricted to) (present in two or all sites)
Site II (MD) Site III (BRF) Lampito mauritii
Perionyx simlaensis Eutyphoeus nicholsoni
Octochaetona surensis Amynthas corti cis Metaphire posthuma
Drawida papillifer papillifer Octochaetona beatrix Perionyx excavatus
Polypheretima elongata Eutyphoeus orientalis
Eutyphoeus incommodus
Drawida nepalensis
Metaphire houlleti

CHOWDHURY et. ale : On Taxonomy and Ecology of Earthworms (Annelida : Oligochaeta) ... 133
Table 30 : Showing relative abundance of different fungal genera in different sampling sites (%)
Gener. Site I Site II Site III Total (DP) (MD) (BRF)
Penicillium sp. 24.09 17.34 18.77 60.21
Aspergillus sp. 6.97 6.25 4.87 18.1
Rhlzopus sp. 1.25 2.01 2.23 5.49
Mucor sp. 0.98 1.43 1.60 4.01
Fusarium sp. 2.36 1.16 1.25 4.77
Cladosporium sp. - 0.75 0.75 1.5
Sclerotium sp. - - 0.62 0.62
Curvularia sp. - - 0.53 0.53
Trichoderma sp. 2.05 1.07 0.44 3.56
Cephalosporium sp. 1.16 - - 1.16
Table 31 : Showing abundance of fungal genera obtained per month (June, 2001 to Aug. 2003) from all sampling sites (expressed in % of total population)
Genera June July Aug. Sept. Oct. Nov. Dec. Jan.
'01 '01 '01 '01 '01 '01 '01 '02
Penicillium sp. 1.29 2.81 3.39 3.21 2.27 1.60 1.83 2.32
Aspergillus sp. 0.71 1.11 1.34 1.11 1.07 1.25 0.40 0.84
Rhlzopus sp. 0.13 0.49 0.53 0.17 0.17 0.22 0.22 0.62
MuCOlsp. 0.08 0.22 0.31 0.17 0.35 0.08 0 0.08
Fusarium sp. 0 0.04 0.89 0.17 0.31 0 0.13 0.13
Trichoderma sp. 0.17 0.13 0.75 0.22 0.08 0 0.04 0
Cladosporium sp. 0 0 0 0 0 0 0.08 0.08
Cephalosporium sp. 0 0 0 0 0 0.08 0.17 0
Sclerotium sp. 0 0 0.04 0 0 0 0 0.04
Curvularia sp. 0 0 0 0 0 0 0.04 0.13

134 Rec. zool. Surv. India, Dcc. Paper No. 324
Table 31 : (Contd.)
Genera April I May June July Aug. Sept. Oct. Nov. Dec.
'02 '02 '02 '02 '02 '02 '02 '02 "02
Penicillium sp. 2.14 0.93 1.92 2.81 3.35 2.54 3.26 2.45 2.86
Aspergillus sp. 0.67 0.35 0.31 1.07 1.07 1.11 0.49 0.84 0.26
Rhizopus sp. 0.31 0.08 0.08 0.22 0.35 0.17 0.04 0.08 0.13
Mucor sp. 0.13 0 0.31 0.35 0.13 0.22 0.17 0.08 0
Fusarium sp. 0.17 0.04 0.08 0.35 0.22 0.40 0.35 0 0.13
Trichoderma sp. .08. 0 0 0.13 0.35 0.13 0.44 0.08 0
Cladosporium sp. 0.08 0 .. 17 0 0 0.35 0.08 0.04 0 0.17
Cephalosporium sp. 0 0.26 0.04 0 0.13 0 0.31 0 0
Sclerotium sp. 0 0 0 0 0.22 0.26 0 0 0.04
Curvularia sp. 0.04 0 0 0 0 0 0.08 0 0
Genera Jan. Feb. Mar. April May June July Aug. '03 '03 '03 '03 '03 '03 '03 '03
Penicillium sp. 2.32 2.19 1.74 2.54 1.51 2.36 2.72 3.71
Aspergillus sp. 0.40 0.49 0.22 0.35 0.13 0.44 0.93 1.02
Rhizopus sp. 0 0.08 0.13 0 0.04 0.08 0.58 0.44
Mucor sp. 0.17 0.08 0.13 0 0.04 0 0.31 0.49
Fusarium sp. 0.22 0.31 0.08 0.04 0.04 0 0.22 0.35
Trichoderma sp. 0.08 0.22 0.22 0.04 0 0 0.13 0.17
Clad,osporium sp. 0 0.08 0.08 0 0 0 0 0.17
Cephalosporium sp. 0 0 0.08 0 0 0 0 0.04
Sclerotium sp. 0 0 0 0 0 0 0 0
Curvularia sp. 0.04 0.13 0 0 0 0 0 0.04

CHOWDHURY et. ale : On Taxonomy and Ecology of Earthworms (Annelida : Oligochaeta) ... 135
Table 32 : Showing 'Ubiquitous' and 'Stenoecious' species of fungal genera in the study sites
'Stenoeclous' species 'Ubiquitous' species (restricted to) (present in two or all sites)
Site I (DP) Site III (BRF)
Cephalosporium sp. Sclerotium sp. Penicillium sp.
Curvularia sp. Aspergillus sp.
Fusarium sp.
Rhizopus sp.
Mucorsp.
Trichoderma sp.
Cladosporium sp.
Table 33 : Showing relative abundance of different bacteria-actinomycetes genera in different sampling sites (%)
Genera Site I Site II Site III Total (DP) (MO) (BRF)
Bacillus sp. 15.62 5.71 7.61 28.94
Streptomyces sp. 8.68 15.30 12.5 36.48
Micrococcus I 2.85 1.70 3.65 8.22
Micrococcus II 2.02 - 1.92 3.94
Arthrobacter sp. 2.51 6.57 3.41 12.49
Pseudomonas sp. 0.45 0.53 1.89 2.87
Promicromonospora sp. 0.64 - 0.26 0.9
Cytophaga sp. 1.68 - - 1.68
E. coli 0.80 - - 0.80
Flavobacterium sp. 0.24 - - 0.24
Enterobacter sp. 0.53 - - 0.53
Nocardia sp. - 1.49 - 1.49
Azotobacter sp. - 0.77 0.56 1.33

Table 34 : Showing abundance ofbacteria-actinomycetes genera obtained per month (June, 2001 to Aug. 2003) from all sampling sites (expressed in % of total population)
Genera June July Aug. Sept. Oct. Nov. Dec. '01 '01 '01 '01 '01 '01 '01
Bacillus sp. 1.33 1.44 1.65 1.25 1.14 1.01 0.77 Streptomyces sp. 0.93 2.21 1.84 1.30 2.21 1.94 1.22 Micrococcus I 0.34 0.56 0.61 0.69 0.05 0.24 0.29 Micrococcus II 0.05 0.08 0.26 0.18 0.16 0.18 0.08 Arlhrobacter sp. 0.24 0.53 0.56 0.82 0.16 0.69 0.42 Pseudomonas sp. 0.13 0.05 0.08 0.26 0.02 0.26 0.13 Promicromonospora sp. 0 0 0.02 0 0.16 0 0 Cytophaga sp. 0 0.05 0.21 0 0 0.34 0 E. coli 0 0 0.08 0 0 0.18 0.08 Flavobacterium sp. 0 0 0 0 0 0.08 0.05 Enterobacter sp. 0 0 0.02 0 0 0.08 0 Nocardia sp. 0 0.21 0.13 0.08 0 0 0.21 Azotobacter sp. 0 0.02 0.05 0.10 0.13 0 0.02
Genera April May June July Aug. Sept. Oct. Nov. '02 '02 '02 '02 '02 '02 '02 '02
Bacillus sp. 1.04 0.69 1.14 1.36 1.68 1.97 1.14 0.40 Streptomyces sp. 0.98 0.64 1.17 2.24 1.68 1.81 1.65 1.33 Micrococcus I 0.05 0.08 0.40 0.05 0.37 0.74 0.05 0.26 Micrococcus II 0 0.02 0.18 0.08 0.29 0.34 0.29 0.18 Arlhrobacter sp. 0.50 0.34 0.34 0.72 0.50 1.01 0.42 0.64 Pseudomonas sp. 0 0.02 0.18 0.32 0.10 0.29 0 0.21 Promicromonospora sp. 0 0 0 0 0 0 0.16 0.08 Cytophaga sp. 0 0 0 0.05 0.08 0.24 0.08 . 0.13 E. coli 0 0 0 0 0 0 0.08 0.18 Flavobacterium sp. 0 0 0 0 0 0.05 0 0.05 Enterobacter sp. 0 0 0 0.08 0 0 0 0.05 Nocardia sp. 0 0 0.29 0.05 0.08 0.13 0 0 Azotobacter sp. 0 0 0 0 0.21 0.18 0.13 0.02
Jan. '02 1.04 0.50 0.32 0.08 0.37 0.05 0.10
0 0.05
0 0.16
0 0
Dec. '02 1.49 1.06 0.24 0.02 0.21 0.05 0.05
0 0.08
0 0 0 0

Table 34: (Contd.).
Genera Jan. Feb. Mar. April May June July Aug. '03 '03 '03 '03 '03 '03 '03 '03
Bacillus sp. 1.38 0.56 0.82 1.20 0.66 1.28 1.06 1.33
Streptomyces sp. 0.88 0.32 1.49 1.30 0.42 2.05 2.29 2.88
Micrococcus I 0.34 0.16 0.13 0.29 0.37 0.50 0.45 0.56
Micrococcus II 0.21 0.21 0.10 0.05 0.21 0.08 0.34 0.18
Arlhrobacter sp. 0.45 0.21 0.26 0.48 0.48 0.21 0.74 1.09
Pseudomonas sp. 0.18 0.05 0 0 0.05 0.02 0.05 0.29 Promicromonospora sp. 0.05 0.02 0 0.05 0 0.08 0 0.10 Cytophaga sp. 0.10 0 0 0 0 0.13 0 0.24 E. coli 0 0.05 0 0 0 0 a 0 Flavobacterium sp. a 0 0 0 0 0 a 0 Enterobacter sp. 0.13 0 0 0 0 a a a Nocardia sp. 0 0 0.08 0 0 0 0.08 0.13 Azotobacter sp. 0.02 0 0.05 0.16 0 0 0.16 0.02
..

Ree. zool. Surv. India, Oee. Paper No. 324
Table 35 : Showing 'Ubiquitous' and 'Stenoecious' species of bacteria -actinomycetes genera in the study sites
'Stenoecious' species 'Ubiquitous' species (restricted to) (present in two or all sites)
Site I (OP) Site II (MO)
E. coli Nocardia sp. Streptomyces sp.
Flavobacterium sp. Bacillus sp.
Enterobacter sp. Arlhrobacter sp.
Cytophaga sp. Micrococcus I
Micrococcus II
Pseudomonas sp.
Promicromonospora sp.
Azotobacter sp.
Table 36 : Showing values of soil factors, levels of heavy metals, abundance of fungi and bacteria-actinomycetes population in the months when maximum and
minimum population of earthworm obtained from respective sites
Sampling Maxm. and min. Subsoil Subsoil Soil pH Soil Sites Earthworm Temp. relative organic
population (OC) humidity (%) carbon (%)
Month %
Site I (DP) Aug. 6.56 28 98 7.16 3.89
Jan. 1.69 19.5 80 6.9 3.37
Site II (MD) Oct. 7.1 25.5 92.5 6.75 1.72
May 2.1 29.5 74 6.4. 1.08
Site III (BRF) Aug. 7.91 27.66 95.66 7.41 2.81
Dec. 1.23 18 81 6.7 2.04

CHOWDHURYet. ale : On Taxonomy and Ecology of Earthworms (Annelida: Oligochaeta) ... 139
Table 36 : (Contd.)
Sampling Maxm. and min. Available Available Available Cadmium Sit •• Earthworm Nitrogen P20S K20 (ppm)
population (Kg ha-1) (Kg ha-1) (Kg ha-1)
Month 0/0
Site I (DP) Aug. 6.56 457 240 709.66 3.33
Jan. 1.69 375.5 143.5 569 2.87
Site II (MD) Oct. 7.1 395 266 475 1.62
May 2.1 191.5 178.5 425 3.75
Site III (BRF) Aug. 7.91 329.6 178.9 613.3 0.76
Dec. 1.23 351.5 275 600 2
Sampling Maxm. and min. Zinc Lead Copper Fungi Bacteria-Sites Earthworm (ppm) (ppm) (ppm) population actinomycetes
population (0/0) population (0/0)
Month %
Site I (DP) Aug. 6.56 593.33 286.66 193.33 6.04 6.31
Jan. 1.69 660 400 260 2.92 3.99
Site II (MD) Oct. 7.1 51 17.5 32.5 6.54 4.1
May 2.1 85 41 52.5 1.7 2.45
Site III (BRF) Aug. 7.91 43.6 22.3 19.3 7.81 5.59
Dec. 1.23 84.5 33 31 2.87 3.77
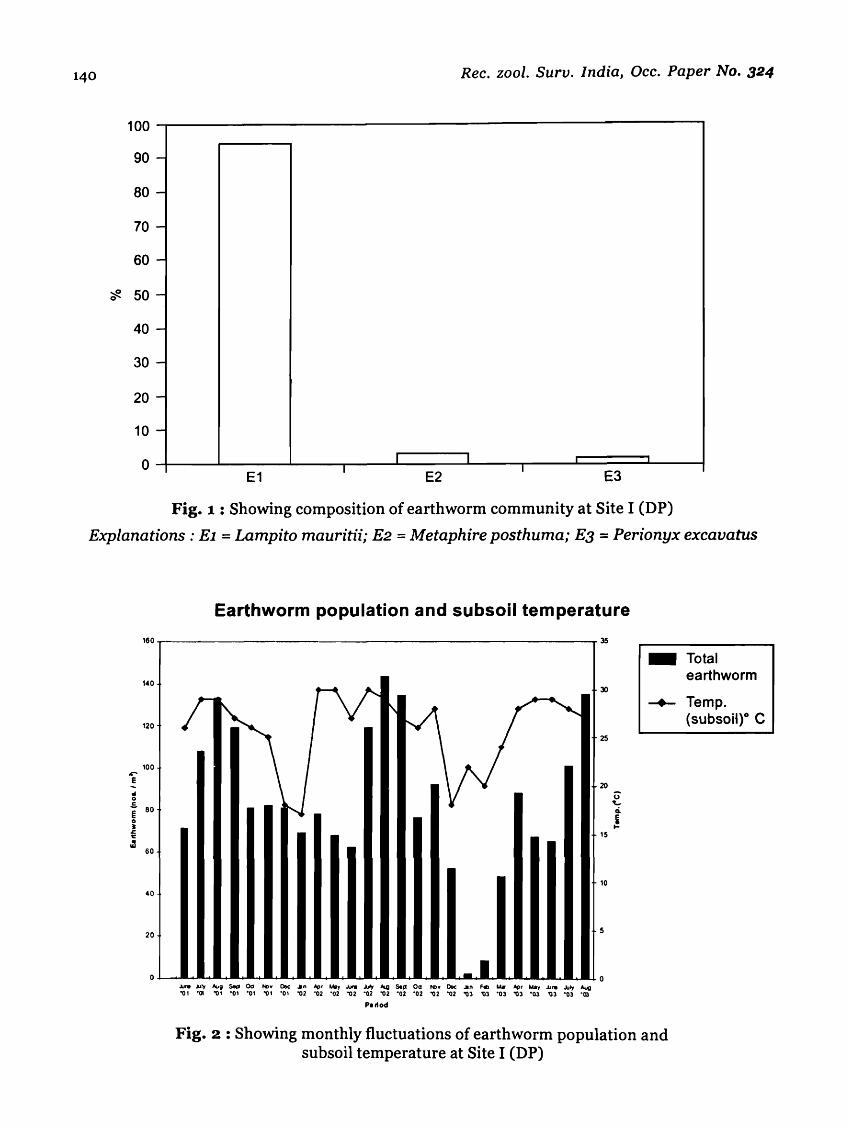
140 Rec. zool. Suru. India, Dcc. Paper No. 324
100
90 -
80 -
70 -
60 -
~ 50 0 -
40 -
30 -
20 -
10 -
0 I I ~
I I E1 E2 E3
Fig. 1 : Showing composition of earthworm community at Site I (DP)
Explanations: El = Lampito mauritii; E2 = Metaphire posthuma; E3 = Perionyx excavatus
r e .. o
160
140
120
100
.s. 80 ~ o ~ .I: ~
~ 60
40
20
Earthworm population and subsoil temperature
;- t\
_I .An1I ~!y ..... g S4II'I oa toIly Dec .an ~r Mly .AQ J.;, A&G Sal! Oa toIly Dec .an Ftb 1M' ~r .... y .Alre .lily Aug "01 "01 "01 ·01 ·01 "01 '01 "02 '02 ·02 "02 ·02 "02 ·02 '02 "02 ·02 "03 '1)3 '03 "03 ·03 '1)3 ·03 .(1)
Pellod
35
30
25
20
15
10
--+-
Fig. 2 : Showing monthly fluctuations of earthworm population and subsoil temperature at Site I (DP)
Total earthworm
Temp. (subsoil)O C

CHOWDHURY et. al. : On Taxononty and Ecology of Earthworms (Annelida : Oligochaeta) ... 141
Earthworm population and subsoil humidity
.0 r- -------------------------------,. 120
r I
•
wo
120
! 10
I
...
t .:s
eo
40
..... N., 04-4/ 5c>1 oa ~ o.c J.. "11 ~ .u>e lJ, AoQ Sop( 0:\ No. Oc: .an Fe M1r "11 ~ .lI>e JJIy Aug '01 ~I '01 "QI '01 '01 ~I ~2 ~2 "a/ '02 '02 '02 '02 '02 "02 "a/ '03 ~J '03 'tI3 'U3 °00 "03 om.
Period
10'0
80
40
20
_ Total earthworm
-+- Humidity (subsoil) (%)
Fig. 3 : Showing monthly fluctuations of earthworm population and subsoil relative humidity at Site I (DP)
Earthworm population and pH
/ ~ 1\
•
- I .Ao". J~ .-.q SIp! Oa fotI. o.c ... I>Q Mot .11,. .u., "'g 501>1 0;1 10 o.c J... Feb Ma, Af>, t.Uy .1J,. .1J1)I Aug
~I ~, .". 'V' "01 '01 '0' "a/ "Ql 'CC '02 "02 'tI2 '\J2 '\J2 °02 '02 '03 '03 om om "(II °03 '03 '03
PenOCl
7B
7A
72
66
64
62
_ Total earthworm
-+- pH
Fig. 4 : Showing monthly fluctuations of earthworm population and pH at Site I (DP)

142
,... E
" o
160
140
120
100
.:. 80 E o t .c ~
U1
,t;'"-
E -oj 0 ~ ~ 0 t € It W
60
40
20
160
140
120
100
80
60
40
20
Rec. zool. Surv. India, Dcc. Paper No. 324
Earthworm population and E.C.
~ ~
y ~ I \ V ~ I; ~ " \ V / / ~ '/ \
/ -V .,
- I .lJt-. JJIf II&ij Sell ekl Nl. DIIc Jln I>f' ,,"y ,L,. Juy A4I Slpl CI2 1«>. DIIc Jln feb MIl, AfJ' May .Aile JJIf #lug "01 "01 "01 "01 '01 "01 "01 "G/ '02 '02 "02 "G/ "G/ "IIi! '02 '02 "02 "(8 "IXI 'OJ "OJ "03 "IXI "U) 'aI.
Pltlod
1A
12
.~
0.8 ~ u III
0.6
OA
02
_ Total earthworm
--+- E"C" (dSm-1)
Fig. 5 : Showing monthly fluctuations of earthworm population and electrical conductivity at Site I (DP)
Earthworm population and organic carbon
v ~ ~
.~
- I JJ,. .lily .... g Sell Od NOt DIIc J~ Apt May J..,.. .lily Aug Stpt 0cJ N:w 0.: .lin FeD Mar /!flr May ..... JIlr .... g "01 "01 "01 "01 "01 "'01 '01 '02 "02 "IIi! "(1/ "IIi! "(1/ '02 "02 "02 "02 "Q3 "U) '03 '03 "03 "03 "Q3 "01
Period
4.5
3.5
2.5
~ U
2 d
1.5
0.5
o
_ Total earthworm
Fig. 6 : Showing monthly fluctuations of earthworm population and organic Carbon at Site I (DP)

CHOWDHURY et. al. : On Taxonomy and Ecology of Earthworms (Annelida: Oligochaeta) ... 143
f40
120
'Ill
"0
140
'10
'00
i -= £.
80
I • f ,:,
eo
40
20
Earthworm population and available N2 ._--------------------------------------------~eoo
500
400
/ i"'"
200
100
.1 ~ ... .u, AuQ SIo,. o.s 'CJ. o.c ... lOt ~ ........ JIIy ""G Slope ~, 'CJy o.c .. ~ Fe Mw I>{I ~y ...,.. .... ty ..... g t', -01 "01 'til "01 "01 '0\ 'W 'W "02 '02 'W "02 '02 'W "02 '02 "\D "03 "03 '03 "\D '03 '03 "01
Pellod
_ Total earthworm
-+- Available N2 Kgha-1
Fig. 7 : Showing monthly fluctuations of earthworm population and available Nitrogen at Site I (DP)
Fluctuation of total earthworm population and soil available P20S
~ I
I ~ ~ ~
r\ ~
. I Jun..AAt A.Jg 5 t1I1 Od ~v Dec .Ia'I Apr May JU'le JIJ.j kg Se.- Od Noot Dec Jan Feb Mil' AfI Mav June JlJy Aug
-,:)1 '01 '01 'ul '01 '01 '01 '02 "02 "02 "02 "(J2 "02 "02 "(J2 "02 "02 "03 "03 "03 "03 "03 "03 "03 "03. pwoj
350
300
250
200,... !
ct 150 0.
100
50
o
_ Total earthworm
Fig. 8 : Showing monthly fluctuations of earthworm population and available P 205 at Site I (DP)

144
HI>
140
120
100 ~
00
20
o
.. o c
Rec. zool. Surv. India, Dcc. Paper No. 324
Fluctuation of total earthworm population and soil available K20
,.
I ~ V ~
I [
. I June Juy Aug s~ Oct Nov Dec Jan Apr May June July Au;j SeI1 Oct NOlI Dec Jan Feb Mar Ars May June July Aug "01 "01 "01 "01 "01 "01 "01 "02 "02 "02 "02 "02 "02 "02 "02 "02 "02 "03 "03 "03 "03 "03 "03 "03 "03.
Perod
~o
8)0
100
000
~o
200
100
o
_ Total earthworm
--+- Available K20
Fig. 9 : Showing monthly fluctuations of earthworm population and available K
20 at Site I CDP)
Earthworm population and cadmium 160
140
I ~ I
I r-
120
100
6
5
_ Total earthworm
--+- Cd(ppm)
\ I
~ i 80 o ~
i! ~
60
40
20
r-.... r- r-
r-.... r- V
-I June JUy Aug Sej:'( Oct Nov Dec Jan Apt May Jure July ~ Sept Od Nov Dec Jan Feb Mar AII' May Juflll July Aug ·01 ·01 '01 '01 '01 "01 ·01 "Q2 ·02 "02 "Q2 "02 '02 "02 '02 "02 '02 "03 "03 "00 "03 "03 "03 '03 "01
Parbd
o
Fig. 10 : Showing monthly fluctuations of earthworm population and Cadmium at Site I (DP)

CHOWDHURY et. al. : On Taxonolny and Ecology of Earthworms (Annelida " Oligochaeta) 00' 145
Earthworm population and zinc \10 11)0 -Total
earthworm '.0 100
-+- Zn(ppm)
'20
~ f- i' V 11)0
100 !DO r I -.. 0 .!
80 I E
400 !
I .q . "" eo :DO
." 200
20 100
- I J.,.. J.iw '-9 5c'1 0:1 ... '" Dc J., /I4J Iolay .lJne Joh ~ Sell oa No. Dc "n Feb ~, Ifl, ...... .IJ.. .lJ1y Aug ". "1)1 01 "01 ill "()I ". '02 "QI il2 '02 "(]2 '02 "CR "02 '02 -a! "03 "1D 'm 03 '(13 '03 '03 '03
Period
Fig. 11 : Showing monthly fluctuations of earthworm population and Zinc at Site I CDP)
Earthworm population and lead
1410 450 -Total earthworm
"0 400
-+- Pb(ppm) 350
120
V I-'" :DO
100
-E
-i
10 E
........ V V V
250 E Q.
~ 0
1 SJ
200 A-t' ,:,
eo
lSO
40
100
20 50
- I J~/ ~ ~ ~I ~; ~; ~; ;;-; ~ ~; ~'; :: ~ ~ ~~ ':; ~: ~~ ~ ~ ~ ~ ~~ ~~ ~~
Period
Fig. 12 : Showing monthly fluctuations of earthworm population and Lead at Site I CDP)

160
140
120
100
.:; .. 0 ~ 80 ~ 0 J ~ 1:
~ 60
40
20
Ree. zool. Suru. India, Dec. Paper No. 324
Earthworm population and copper
- V ~ / ~ ~ \
.1 J",. illy )lug $ell Q:I NOI 0..: J", I>fr May ..IJne JIly ~ ~ Del "0. 0..: ..IIIn F.b MI, A{j, M~ ..IJr-e ..IJ1y Aug '01 "01 'Ill '0\ '01 '01 '01 '02 "tI2 '02 '02 'Il! '02 '(12 "02 '02 '(12 "03 "CD "In '03 'm '03 '03 '03
Period
350
300
250
200
150
100
50
o
_ Total earthworm
-+- Cu(ppm)
Fig. 13 : Showing monthly fluctuatibns of earthworm population and Copper at Site I (DP)
70
60
50
c: 0 ~ 40 co :; 0-0 0-~
0
~ 0
30
20
10
0 F1 F2 F3 F4 F5 F6 F7
Fungal genera
Fig. 14 : Showing composition of fungal community at Site I (DP)
Explanation: Fl = Penicillium, F2 = Aspergillus, F3 = Fusarium, F4 = Trichoderma, FS = Rhizopus, F6 = Cephalosporium, F7 = Mucor

CHOWDHURY et. al. : On Taxonomy and Ecology of Earthworms (Annelida: Oligochaeta) ... 147
50~------------------------------------------------------~
c:
45
40
35
~ 30 lU "5 ~ 25 &
I.-
o 20
15
10
5
BA 1 BA2 BA3 BA4 BA5 BA6 BA7 BA8 BAg BA 10 BA 11
Bacteria-actinomycetes genera
Fig. 15 : Showing composition of bacteria-actinomycetes community at Site I (DP)
Explanation: BAl = Bacillus, BA2 = Streptomyces, BA3 = Micrococcus I, BA4 = Micrococcus II, BAs = Arthrobacter, BA6 = Pseudomonas, BA7 = Promicromonospora, BAB = Cytophaga,
BA9 = E. coli, BAlo = Flavobacterium, BAll = Enterobacter
Fluctuations of earthworm, fungi and bacteria-actinomycetes population
,.,
140 t
po
~
I ~ / / \ ~ ~
r0- t /
(' r\ ./~
/ ~ ~ ~ ~
r-
~ V ~
~
~I ~ .l. ... .UI "'0 Soli ()Q Ie),. Doc J., Ap. Wly JJ", Ny ""V SIpl 01 Ie),. Doc .. n Fe> .... "'" IoII¥ ...... JJIt ~ 1), -0' -0' 'Ill "01 "(II "(II 1)2 '02 '02 "02 "(I "(I "!II 'Il2 'Il2 ~2 "OJ "0) "Ill "(8 ~ ~ 1)3 "Ill
P.,od
'20
'co
80 -:E
~ ~ ... u
60 '0 ! cS Ii ¥ i
40 III
20
- Earthworm
c:::l Fungi
-*- Bacteria-actinomycetes
Fig. 16 : Showing monthly fluctuations of Earthworm, Fungi and Bacteria-actinomycetes population at Site I(DP)

Rec. zool. Surv. India, Dcc. Paper Noo 324
Fluctuations of fungi, bacteria-actino,,",ycetes population and subsoil temp.
1~~---------------------------------------------'~
100
25
20
15
10
_ Fungi
[::J Bacteriaactinomycetes
"""*- Temp, subsoil
o 0 Ju .. J\Iy .... , Set Cd He>< Doc J.. AIlI ... , J",o All) A", Soli Cd .... Ooc Jon Fill> ... , AO' "''' Ju .. J~ ""' 'I)' '0' 'I), '01 '0' '0' '0' '1)2 'OZ '1)2 'OZ tl2 'OZ '1)2 'OZ '1)2 '(J/ 'OJ 'OJ '03 '1)3 '03 '1)3 '03 '03.
Period
Fig. 17 : Showing monthly fluctuations of Fungi, Bacteria-actinomycetes population and subsoil temperature at Site I (DP)
Fluctuations of fungi, bacteria-actinomycetes population and subsoil humidity
1~~---------------------------------------------- 120
100
20
.lIne.llly Aug Sell Od I'e. Dc .IIIn A# ~ JUl. -"II' ~ Sell Od M:I. DIe: .. n RIb ~, A# ~ JUl • ..uty ~ 'Ill 'Ill '01 '01 '01 '01 '01 'CI! '(II 'Ql 'Ql '02 '02 '02 '02 '02 '02 '03 'CD 'CD 'CD "CD 'CD '03 "CD
Period
100
40
20
- Fungi
CJ Bacteria-actinomycetes
"""*- Humidity subsoil
Fig. 18 : Showing monthly fluctuations of Fungi, Bacteria-actinomycetes population and subsoil relative humidity at Site I (DP)

CHOWDHURY et. ale : On Taxonomy and Ecology of Earthworms (Annelida : Oligochaeta) ... 149
Fluctuations of fungi, bacteria-actinomycetes population and pH ."~--------------------------------------------~ 7.t
til
! II(
i ~ .. • ! S , J to
E " a )(
:» ~ ~
" ! ~ J.
Jo ... Jolf ... .. .. Od _ Dc .... 14#16 MIw .&1>. J"r AuQ _, Otl NOt Dc Jan Fell Met Att MIw J",. ~ Aug ~, ~ ~ ~I ~ ~ ~ ~ ~ ~ ~ ~ ~ ~ ~ ~ ~ ~ ~ ~ w ~ ~ w ~
Pe10d
l4
t2
u
- Fungi
CJ Bacteria-actinomycetes
-6- pH
Fig. 19 : Showing monthly fluctuations of Fungi, Bacteria-actinomycetes population and pH at Site I (DP)
Fluctuations of fungi, bacteria-actinomycetes population and E.C. UII
'CD
~ I \ I
. ....
~ :~ J ~ ~ ~ ~ ~
I ~
~
»"ot ~ "'-'II $IICl Ot. _ DIe ... .... ,..." J",. J~ "'-'II $ ... , OIl _ o.~ ~... ~ loW 14#16 1M, -lI .. J", Aug ~, ll' ll' ll' ~, '0' ~, 'Oz ~ ~ 1Z ~ ~ ~ 1)Z 1)2 ~2 W W '03 ~ ~ ~ "11\ 1)3
P.w,d
1.8
1A
";e II)
0.8 a o iii
0.8
OA
02
_ Fungi
c::J Bacteriaactinomycetes
-6- E.C.
Fig. 20 : Showing monthly fluctuations of Fungi, Bacteria-actinomycetes population and electrical conductivity at Site I (DP)

150 Rec. zool. Surv. India, Vcc. Paper No. 324
Fluctuations of fungi, bacteria-actinomycetes population and Organic carbon
1~~----------------------------------------~----~ 45
100
~ "b )(
~ u 80 'e
! e 'tS ~ T.l 11:1
60
~ '§ ~ ~ 40
'e
i 'eo 5 u.
20
- Fungi
4 c::J Bacteria-actinomycetes
3.5 ........ OC
3
4 25
~ 0 0
2
1.5
05
..... ..." Aye I., Od N.. 0.. JIrI A.II' ... , J\I\ • ..." A". a., Od Naw 0.. .... r.. "'_ .... ..., ....,11 .Nit A.~. 'III "01 "01 "1)1. "01 'II' "01 '112 "CR "02 "CR -az '112 "CR '112 "CR '112 "as "03 'U "CD '113 "as '113 "U
Period
Fig. 21 : Showing monthly fluctuations of Fungi, Bacteria-actinomycetes population and organic Carbon at Site I (OP)
Fluctuations of fungi, bacteria-actinomycetes population and available N2 120~----------------------------------------------~
1110
100 -~ "0
~ ~ 80 'e o .s-a u 'I'
i 60
-c: g. i ~ 40 ~ '0 0 .s.. l!o 5 u.
20
- Fungi
c::J Bacteria- . 9)0 actinomycetes
........ Available N2
4)0
200
100
o 0 ~~-~~~~~~~~~-~~~~~~~~~~~~ ", "01 "01 "01 "01 ", ", "02 "02 "CJ2 "02 112 "2 112 "02 "(2 "02 "0» "3 "03 "03 "(8 "ID "(8 "0».
Period
Fig. 22 : Showing monthly fluctuations of Fungi, Bacteria-actinomycetes population and available Nitrogen at Site I (OP)

CHOWDHURY et. al. : On Taxonorny and Ecology of Earthworms (Annelida : Oligochaeta) ... 151
Fluctuations of fungi, bacteria-actinomycetes and available P 205
,.r----------------------------------------------~~O
tell
20
300
250
100
50
..... J#t ..... '.' 0lIl _ o • .10. ..... "or ........ ., Au, Ie. Oa ... 0.. .10_ f. U., "-, ... , J .... ~ .....
• ,' "' '00 '0\ "' ·crt 'QI '01 ", "ar 'ar ", 'ar 'ar "01 "at 'ar 'II' 'II' 'CD "CD ", "CD "CD "CII.
_ Fungi
[=:J Bacteriaactinomycetes
....,Aa- Available P 205
Fig. 23 : Showing monthly fluctuations of Fungi, Bacteria-actinomycetes population and available P 205 at Site I (DP)
Fluctuations of fungi, bacteria-actinomycetes population and avail. K20
120
'GO
!
20
1100 -Fungi
~ 800 [=:J Bacteria-
~ 700
800
actinomycetes
.....-- Available K20
4 -:-
300
200
100
.... ~ ""e -.. O<J ,..'" o.c .... ~, ... , J"', Uy "'8 Slop O<J ,..'" 0\1: ... Feb .... ~I ... , JIM .lily #ug 1)' ", "0' ". "Ot 'I), 'I), "02 "II "(I "II! '02 '02 '02 "ol "(I "(I '(3 ~ °03 "03 "CD "CD "CD "CD.
P • ..,d
Fig. 24 : Showing monthly fluctuations of Fungi, Bacteria-actinomycetes population and available K
20 at Site I (DP)
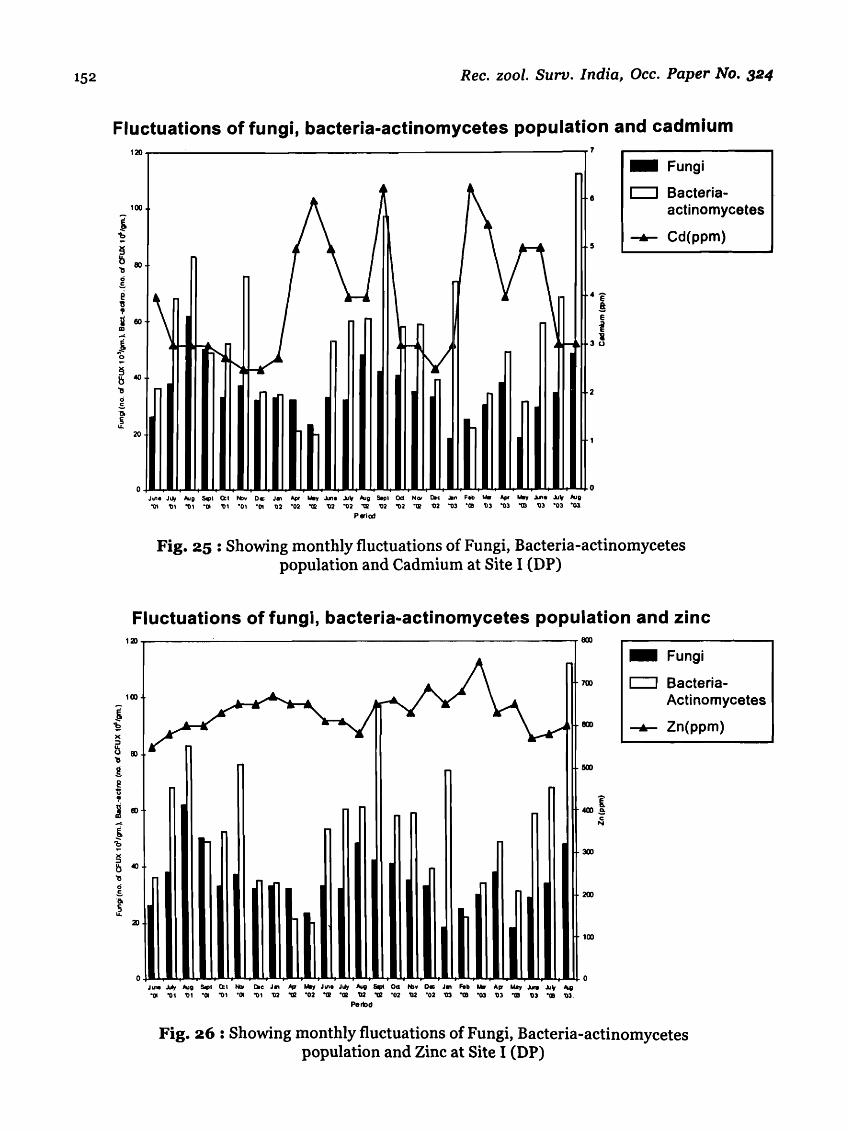
152 Rec. zool. Surv. India, Occ. Paper No. 324
Fluctuations of fungi, bacteria-actinomycetes population and cadmium
, 'b
~
120
100
~ 80
" IS .s-Ei
" , ~ 60 III
i ~
20
o
H
\ \ .. -,
~ .lr--,
~ ~ ...
Jill. Jolt .... " Slpl ttl ttlv Dc J.. AfJI "'-Y ~. ....It .... " Sept ()d HOI Ott .II" Feb ... AfJI "'-Y .lin. ....It .... 11 "01 '\:)\ "01 "01 'Ill "01 "01 '02 "02 'tR '02 "02 'tR '02 "02 -at '02 "03 "ce '03 "03 "CD '03 '03 "03.
PlI'iod
e
5
2
o
_ Fungi
c::J Bacteriaactinomycetes
-6- Cd(ppm)
Fig. 25 : Showing monthly fluctuations of Fungi, Bacteria-actinomycetes population and Cadmium at Site I (DP)
Fluctuations of fungi, bacteria-actinomycetes population and zinc 1~~------~--------------------------------------~ BOO
""" ~ ~ ~ ~ «l 't5 ci .s-a. ~
- Fungi
700 c::J Bacteria-Actinomycetes
BOO -6- Zn(ppm)
5CX)
i 400~
c ....
300
200
100
o 0 J.". J.Ay .... 11 SIp. ttl to Otc J.. /1fT "'-Y Jill. Jolt Aug &CIt 00 10" Dc J.. Fell MIr AII' May .... -"It 4G "01 "01 'Ill "01 "01 "01 "01 '02 'tR "02 -at OCR '02 'tR °02 '02 °02 '03 "CD "03 'OJ om '03 ace 'OJ.
Pel10d
Fig. 26 : Showing monthly fluctuations of Fungi, Bacteria-actinomycetes population and Zinc at Site I (DP)

CHOWDHURY et. al. : On Taxonomy and Ecology of Earthworms (Annelida : Oligochaeta) ,.. 153
Fluctuations of fungi, bacteria-actinomycetes population and lead UD
HII
o
Ul - Fungi 400
c:::::J Bacteria-
JS) Actinomycetes
-*- Pb(ppm) JOO y
,) 2S)
e ! f
200 .. HiD
100
50
0 JIN -"" Nt ... 0:1 _ Ole JII'I '" Mer JIN JIIr l'ug Sel Oes _ Dc J.. F.b U. "If Mly.lq J.it AI4I "01 '01 VI "01 '01 "01 '01 V2 "G '02 "Ill "IJl '02 "Ill '02 '02 "02 '03 '(8 "03 '03 "ID '03 '(8 '03
Period
Fig. 27 : Showing monthly fluctuations of Fungi, Bacteria-actinomycetes population and Lead at Site I (DP)
Fluctuations of fungi, bacteria-actinomycetes population and copper ,.r---------------------------------------------~ JS)
100
'fVv:~
J_ "'\I "'" Sel 0:\ - Ole J., '" ..., JIN J", l'ug s.- oes 101 Dc JII'I F.co lola' .11' May "',. J.it q "01 "0 I '01 "01 "01 "01 'III '02 "IJl "02 "G "Ill '02 "IJl '02 '02 "02 '03 "ID "03 '03 "ID '03 "(8 '03.
Period
3CII
2150
200
1150
100
50
_ Fungi
CJ Bacteria-Actinomycetes
-*- Cu(ppm)
e ! ~
U
Fig. 28 : Showing monthly fluctuations of Fungi, Bacteria-actinomycetes population and Copper at Site I CDP)

154
35
30
25
20 ~ 0
15
10
5
0
Rec. zool. Surv. India, Dcc. Paper No. 324
E2 E3 E4 E5 E7 E8 E9 E10 E13
Fig. 29 : Showing composition of earthworm community at Site II (MD)
Explanations: E2 = Metaphire posthuma; E3 = Perionyx excavatus;
E14
E4 = Eutyphoeus orientalis; ES = Eutyphoeus incommodus; E7 = Drawida nepalensis; EB = Perionyx simlaensis; E9 = Polypheretima elongata; EIO = Metaphire houlleti;
E13 = Octochaetona surensis; E14 = Drawidapapillijer papillijer
160
140
120
100 tr E .. 0 ..:. 80 ~ 0 • .I! 1:: .. w
60
40
20
0
Earthworm and subsoil temp.
~--------------------------------------------~~
25
20
15
10
J.n' ..IJ1y' Aug' ~. Ckt' NOt' DIe' JIIn' ~r' .... y • ..un.' .t.1y' .-ug' S4pt. Cd' NOlI' Doc' .an' FtI). J,b' AfT' ....,. J .... ' JIJy' ~ 01 01 01 01 01 01 01 02 02 Q2 Q2 Q2 02 02 02 02 02 OJ (J) (J) QI (J) 03 OJ "03
Pwlod
_ Earthworm
-+- Temp. (subsoil)O C
Fig. 30 : Showing monthly fluctuations of earthworm population and subsoil temperature at Site II (MO)

CHOWDHURY et. 0/. : On Taxonomy and Ecology of Earthworms (Annelida : Oligochaeta) ... 155
'Ie.
'.0
'JO
'00 r • f
I eo
-... eo
.0
20
Earthworm and subsoil humidity r-------------------------------------------------~120
~
...,.. Jolt· .... g 50",' oa' N ... · Dc' J .. ' /IfII' ""'v·.u.· J.I( ~. s.M' 0:1' ttlv' DIe' .. n· Feb' ""'. /IfII' ~. J. .... J..,. A&a 01 01 0 I a< 0' 0' 01 III 02 02 III 02 02 02 III aI 02 03 (l\ 03 t3 (l\ (l\ 03 ·03
Period
_ Earthworm
-+- Humidity 100 (subsoil) (%)
20
Fig. 31 : Showing monthly fluctuations of earthworm population and subsoil relative humidity at Site II (MD)
Earthworm population and pH
---------------------------------------------------------~
60
......... J",' ~ S ... ();I' I'4)v' Otc "n' ~r' ".,,' J ...... Juy' ..... g ~I' oa' 1'4)", Dc' .. n· Fe' Uar' ~" .... ,. JIMI' JUy' ~
'" 0' 0, 01 0' 0, 01 02 02 III 02 02 aI az o. az az 03 03 en 03 03 en 03 '03
Pe10d
_ Total earthworm
-+- pH
Fig. 32 : Showing monthly fluctuations of earthworm population and pH at Site II (MD)

156
.. o c
160
140
120
100
i' 80 o ~
€ .%I
60
40
20
V\ \ \
I ~ '/ ~
Rec. zool. Surv. India, Dcc. Paper No. 324
Earthworm and E.C.
V ~\ ~ I ./ \
"..
\ ........
1.11
1.4
1.2
Te 0.8 !
0.6
0.4
0.2
o
U 1&1
_ Earthworm
-+- E,C, (dSm-1)
J.".' .Ally' .... ". Sell' Oa' NOt' o.c' J.,' Apt. MIIy' JM' .Ally' .... g. Sell' Oa' NOt' Oc' J.,' Feb' Ma' Apt' !.Wt' J.,.' .Ally' .... 0 01 01 01 01 01 01 01 CII 02 02 02 CII CII CII 02 02 02 CD CD 03 03 03 m m 03
r E .. o c
160
140
120
100
i 80 o • .I! 1:
~ 60
40
20
I
P.lod
Fig. 33 : Showing monthly fluctuations of earthworm population and electrical conductivity at Site II (MD)
Earthworm and organic carbon
...
;/ \ r-... / i'.
I V V'"
V ./
2,5
~ 1.5 U
o
0,5
o
_ Earthworm
-+- 0 C (%)
J.".' Ny' AIQ' Sell' Oa' Nov' o.c' ..lin' Apt. ,",y'.A/t'e' ).J1y' Aug' Sep" a:r POv' 011:' ..lin' Feb' ~I' />fr' ~y' .AIle' JIJy' .to.G 01 01 01 01 III 01 01 02 02 02 a1 CII a1 a1 CII a1 02 03 03 03 03 03 03 03 '03
P.lod
Fig. 34 : Showing monthly fluctuations of earthworm population and organic Carbon at Site II (MD)

CHOWDHURY et. al. : On Taxonomy and Ecology of Earthworms (Annelida : Oligochaeta) ... 157
'\ -tI 0 .s.
I t .:!
180
,to
"0
100
"i , .&
10
J ~
60
40
20
'10
'40
1;'0
100
10
eo
40
~o
Earthworm and available N2 "'"""--
,/
.AI" ~ .... ~'O:I "a.' Ok' J.,' />(II' Moy' ........ · J\Jy' A~' s.>I' 0:1' ~. Ote' J.,' Fe' ... />(II' ~'JIII.· oUr' q ()I 01 01 01 01 01 01 CI 02 02 02 02 02 02 (II (II CI! (II 03 03 03 03 II (II '(II
... riod
450
400
350
300
250 'I j c
200
,50
100
50
o
_ e~.~~orm
......- Available N2 Kgha-1
Fig. 35 : Showing monthly fluctuations of earthworm population and available Nitrogen at Site II (MD)
Earthworm and available P20S
n
v v
300
251
200
~ ,51 .
j c
,00
50
_ Earthworm
-+- Available P20S Kgha-1
~ .. ~ .. "V Scot oa' ~ ClIoc· .... · "41' ..-y' J ..... oUr' A",' SocII' oa' ~. OK' ..... Fe' Mo,' Ap" Moy' Jill.' .LIy' "'Q 0' 01 0 , 0' 01 01 01 02 CI 02 02 (II 02 (II 02 (II 02 03 (II 03 (II 03 (II 03 "Q)
... lIod
Fig. 36 : Showing monthly fluctuations of earthworm population and available P 205 at Site II (MD)
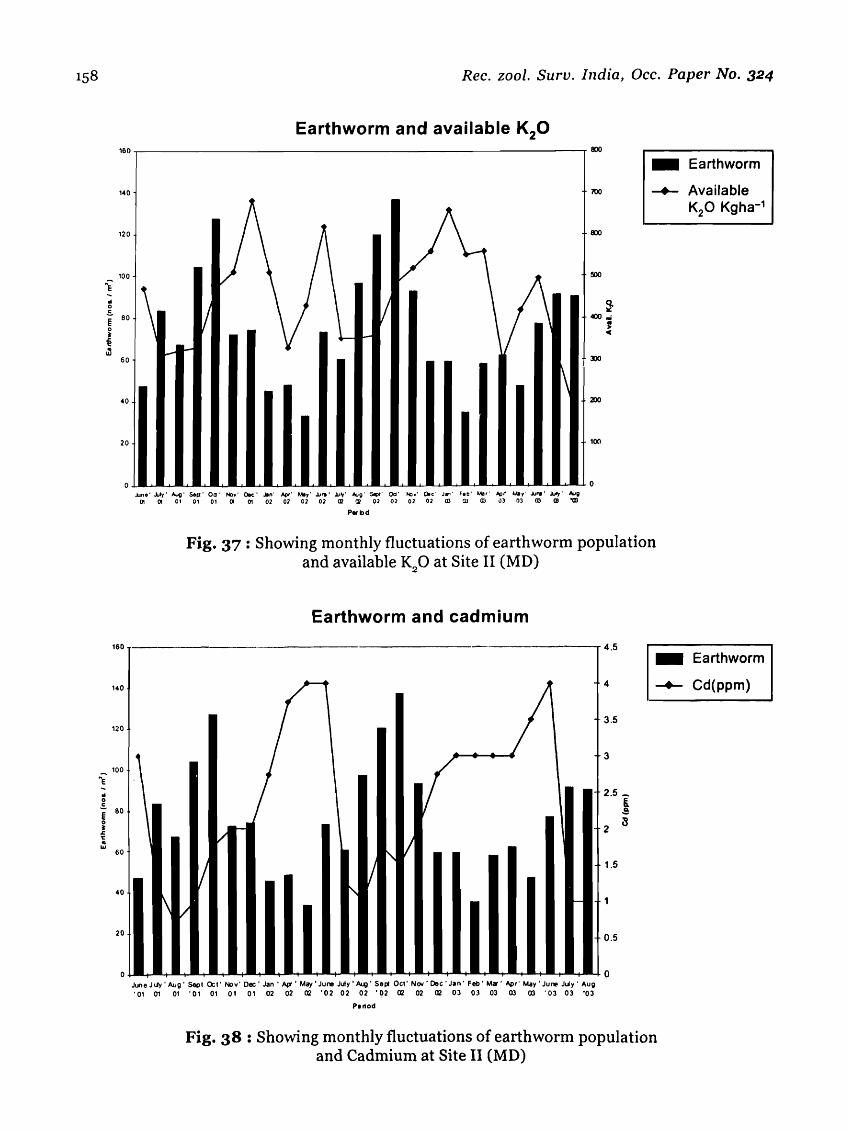
160
140
120
100
~ -01 0 .E. ao E 0 ~
€ ~
60
40
20
160
140
120
100 .. ~ -01 0
.:. 80 E 0 ~
.z: 1::
" w 60
40
20
Rec. zool. Surv. India, Occ. Paper No. 324
Earthworm and available K20
_ Earthworm
100 -+- Available K20 Kgha-1
\ V / ~ .. - ~
500
\ 2DO
100
o .Am.' .llly' Aug' Sell' Oil' ICy' Oec' Jon' ~' May' .ll,.' .lJIy' Aug' Sopt' Qa' I'()y' Ooc' J",' Feo' Ma,' Iofll' May' .ll,.'.lIIy' Aug
01 01 01 01 01 01 0\ 02 02 02 02 (12 (12 02 02 02 02 OJ (Xl (Xl OJ OJ OJ CD "03
\
Pertld
Fig. 37 : Showing monthly fluctuations of earthworm population and available K
20 at Site II (MD)
Earthworm and cadmium
4,5 _ Earthworm
~ I (
'"" '""
4 -+- Cd(ppm)
3.5
3
t/ I-
1/ " V V
" 1,5
I-
/
0.5
o June J lIy , Aug' Sept 0:,' Nov' Dec' Jan' Afr' May' June July' AI.g' Selll Oct' NCH ' Dec' Jan' Feb' Mcr' Apr' May' Jure July' Aug '01 01 01 '01 01 01 01 02 02 02 '02 02 02 '02 02 02 02 03 03 03 03 03 '03 03 ·03
Period
Fig. 38 : Showing monthly fluctuations of earthworm population and Cadmium at Site II (MD)

CHOWDHURY et. al. : On Taxonomy and Ecology of EarthwornlS (Annelida: Oligochaeta) ... 159
"0
140
'10
100
f • !
~Q
I ; § .!l
ec
.~
2J
Earthworm and zinc -------------- --------------------- 100
90
80
~\ 70
60
\ I-'
~ E f- 50 ~
,s
40
30
20
10
0 ..v-.. J oj, A...g - 5.,1 O~I No. ' Dec ' J 8n' A p . M _. J ..... Julv' Aug' S.p! Od' NOI 'Dec' Jan' Feb ' Mar' '" p 'M.y' J ..... JIioj' Aug
01 ~" ", 0' 01 01 C.l 02 02 02 '02 02 02 '02 Cl2 (J2 Cl2 03 03 03 03 03 '03 03 '03
Period
_ Earthworm
-+- Zn(ppm)
Fig. 39 : Showing monthly fluctuations of earthworm population and Zinc at Site II (MD)
Earthworm and lead 1eo ~---
140
120
50
45
40
35
_ Earthworm
-+- Pb{ppm)
_ 100 ... 30 -I eo
I • .... 00
v
I'V 1\ 1\ t-
E 25 !
.a Cl.
20
V 15
40
10
20
0 ).r-.J,c" A.~\l'S~IO:t-t<o. Dec Jal"';;'" May JIJ16J~'Y'A.ug'SeptOc:l-~,,'Dec'J3n'Feb'Mar'AtJf'MayJuI't8JlA.,.'Aug
01 C vI ~, 01 01 01 02 02 'CJ202 02 02 '02 02 02 02 03 03 CD 03 '03 '03 03 'CD
Period
Fig. 40 : Sho\\ring monthly fluctuations of earthworm population and Lead at Site II (MD)

160
.. o c
160
140
120
100
Rec. zool. Surv. India, Occ. Paper No. 324
Earthworm and copper
70
60
50
40
_ Earthworm
-+- Cu(ppm)
- 80 § l/ 1 ~
.:I \ l/ V
:\ ~ I-
r-
30
60
20
40
10 20
o o June J\Jy' ~ 'Se~ Oct' Nov'DeC'JIIl- AlJT' May'Jt.nI.NI('Aug' Sept Oct' Nov'Dec' Jill' Feb' Mar' Apr''My'J",e JUy' Aug '01 01 01 '01 01 ot Ot 02 02 02 '02 02 02 '02 02 02 Q2 03 03 03 03 03 '03 03 '03
70
60
50
c: ~ 40 co '3 Co 0
~30 0
:::e 0
20
10
0
sa dod
Fig. 41 : Showing monthly fluctuations of earthworm population and Copper at Site II (MD)
F1 F2 F5 F7
Fungal genera
F3 F4
Fig. 42 : Showing composition of fungal community at Site II (MD)
Fa
Explanation: Fl = Penicillium, F2 = Aspergillus, F3 = Fusarium, F4 = Trichoderma, FS = Rhizopus, F7 = Mucor, F8 = Cladosporium

CHOWDHURY et. al. : On Taxonomy and Ecology of Earthworms (Annelida : Oligochaeta) ... 161
c :S .!9
60~------------------------------------------------------~
50
40
a 30 8. ~ o ':Ie o 20
10
BA2 BA5 BA1 BA3 BA13 BA12 BA6 Bacteria-actinomycetes genera
Fig. 43 : Showing composition ofbacteria-actinomycetes community at Site II (MD)
Explanation: BAl = Bacillus, BA2 = Streptomyces, BA3 = Micrococcus I,
'II)
1«1
_ UD .. 8
~ ... 'II) \J '0
! r ., ... -'\ ... i ., f I E . '" 40
BAs = Arthrobacter, BA6 = Pseudomonas, BA12 = Azotobacter, BA13 = Nocardia
Fluctuations of earthworm, fungi, bacteria-actinomycetes polution
t
~ f
( / r'" ~ I~/~
~
I ~V~( ~ ~
~ ~ ~
J ~
~
~ ~ ~ ~ ~ ] ~. ~ J.".' .u,' ~'-..' Ocs' N ... · OK' ..,' ,.,,' .'.AM')if Aug' SIopI' Ct.' _' Otc' ..... Fe' "..,' Io(;t' '''''''.In' JJit' ~
01 0' 01 O. 01 O. O. (I 02 QI 02 02 02 02 QI 02 QI 03 as 03 03 CD 03 CD "03
P .. al
120
100
80 -:-e ~ "b
~ ~
60 ~ d S. o 1;
~ ~
40 CD
20
-CJ
--*-
Fig. 44 : Showing monthly fluctuations of Earthworm, Fungi and Bacteria-actinomycetes population at Site II (MD)
Earthworm
Fungi
Bacteria-acti nomycetes

162 Rec. zool. Surv. India, Occ. Paper No. 324
Fluctuations of fungi, bacteria-actinomycetes population and subsoil temperature
100 -~ -0
~ tl 00 '0 d ~
e u 'l'
----------------------------~~
30
25
20
15
10
Jill.' ..uly' /lug' SePI' ()d' -.0.' tec' .. n· I>f>" Mat',bw' JUy' Aug' Sell' Ctt' -.0.' 0",,' .... n· F.b· .... Apr' M ... • .a. ... .a. .... Aug
01 01 01 01 01 01 01 02 02 02 a/ 02 trl 02 trl 02 02 03 03 m 03 m 03 Q\ '03
Period
_ Fungi
CJ Bacteri~actinomycetes
-*- Temp. (subsoil)
Fig. 45 : Showing monthly fluctuations of Fungi, Bacteria-actinomycetes population and subsoil temperature at Site II (MD)
Fluctuations of fungi, bacteria-actinomycetes population and subsoil humidity
~ ~ )( :::I
tl '0
! @ '0 ., ! ..... ~
-b ~ tl 'b c:i .E-o. S u.
12O-r-------------------------r 120 _ Fungi
100
00
00
40
20
~ .. -,..
,.
II Jill.' J,Jy' Aug' Sell' Ctt' NOt' tee' .. n· Arz' May· ..... • Jilt· Aug' ~t' ()d' NOt' tec' .... n· Fib' Mar' /!>pr • ...., .... ,.' ..ut,. A&G
01 01 01 01 01 01 01 02 a/ 02 trl 02 a/ 02 02 02 02 03 03 Q\ 03 CD 03 Q\ ·03
Period
100
80
40
20
r:::::J Bacteriaactinomycetes
-6- Humidity (subsoil)
Fig. 4 6 : Showing monthly fluctuations of Fungi, Bacteria-actinomycetes population and subsoil relative humidity at Site II (MD)

CHOWDHURY et. al. : On Taxonomy and Ecology of Earthtvorms (Annelida: Oligochaeta) ... 163
Fluctuations of fungi, bacteria-actinomycetes polution and pH - --------
-I Ie
g 10 11
1
i , J • i I(
:) t) ., 11 0 ! 0
1 JO
1210
100
20
.AI .. .AI'W' "'e' SIN" o.s' - Oc' ...... Afl' .... y' J,#'e' Ny' "'e' SePI' ca' MI.' Dc' Jln' Feb' loa,' Afl' MI,' J,#'e' "'.". "'G o' III 01 01 01 01 01 02 CI 02 (I 02 02 CI 02 (II 02 03 03 03 CD 03 CD CD '03
P8'lOCI
.% ~
-Fungi
CJ Bacteria-actinomycetes
--.....- pH
Fig. 47 : Showing monthly fluctuations of Fungi, Bacteria-actinomycetes population and pH at Site II (MD)
Fluctuations of fungi, bacteria-actinomycetes polution and E.C. - 1.6 -Fungi
1A c::J Bacteria-actinomycetes
12 --.....- E.C.
V}y )r\ ~
I' ~ ~
~ lJ II ~ 1I I' I'" ~
~ 1\
II I I ~
I ~ ""
0.6
OA
02
o J",. ~ ..... 11· SecI' Ckl' toto. Oec;' ...... ~. tour' )\I>e' .lIy' ""'II' S.II' (tl' I>t>.' Ooc' Jan' Feb' .... Ap' Mly' "",,'JIIy' AuQ
III 01 01 0, 01 0' 01 02 (II 02 CI1 02 CII 02 CII 02 CII 03 (Il 03 CD 03 (Il OJ :(Il
Percd
Fig. 48 : Showing monthly fluctuations of Fungi, Bacteria-actinomycetes population and electrical conductivity at Site II (MD)

Rec. zool. Surv. India, Dcc. Paper No. 324
Fluctuations of fungi, bacteria-actinomycetes population and organic carbon 120
100
20
o
3 - Fungi
~ , c::J Bacteria-
2.S actinomycetes
-6- OC
~ ~
~ / ~ j
) V J " ~ j j
l 1.5 \oS
o
j
0.5
II I I ~ I o J.".',u,' Aug' Sill' Oc,' hbv' Dc' J .... Apt' ~'.ln' Uy' IO&Q' $4)(' Cd' NQI' Otc' .. n· Feb' Mit' />fl' u.,'",,',u,' Aug
01 01 01 01 0' 01 0' III 02 III 02 III 02 02 02 02 III 03 (8 03 CD 03 CD 03 "CD
Pertod
Fige 49 : Showing monthly fluctuations of Fungi, Bacteria-actinomycetes population and organic Carbon at Site II (MD)
Fluctuations of fungi, bacteria-actinomycetes population and available N2
1~~----------------------------------------------~ 450
100
)(
~ 40 b o .s. til S u.
- Fungi 4)0
c:::J Bacteria-actinomycetes
350
-6- Available N2 :1)0
250 . .! Ii ~ i
200 ,. ~
150
100
.lJne·JIIy· Aug' SIp,. Cd' Nov' Dc' J .... "'. u.,' .1Ine·JIIy· Aug' SIp" Cd' """. Dc' J .... Feb' ".... Afr' Ua" ...... • Uy' "'" 01 01 01 01 01 01 0' CR 02 02 III 02 CR OZ 02 III 02 CD 03 03 (8 03 CD CD 113
Period
Fig. 50 : Showing monthly fluctuations of Fungi, Bacteria-actinomycetes population and available Nitrogen at Site II (MD)

CHOWDHURY et. 01. : On Taxonomy and Ecology of Earthworms (Annelida : Oligochaeta) ... 165
Fluctuations of fungi, bacteria-actlnomycetes polution and available P 205
,. __ --------------------------------------------~~O
UD ZiO
3)0
100
.-
_ Fungi
c::J Bacteriaactinomycetes
~ Available P20S
,u,. J"" Aug' -.e' Ocs' _. Dc:' J .... ~. ""'y' .u..'J.,.,' Aug' Soopc' Ocs' _. Dc' J .... Fe!>' Mao' ~. ~"r' ...... "'Iy' A&G 01 0' 01 0' 0' 01 0' a! Ol 02 a! 04 (J/ 02 02 (J/ 02 <D 03 03 <D oJ CD <D 113
P.~d
Fig. 51 : Showing monthly fluctuations of Fungi, Bacteria-actinomycetes population and available P 205 at Site II (MD)
Fluctuations of fungi, bacteria-actinomycetes polution and available K20 ,.~ __ --____ ----------__ --__ ------__ ----__ ------~~O
'00
9 ~ 10 .. o .s. @ e • j III
700
600
soo
JOO
200
100
""ne Ny' .... g. Sel" Od' ~.' Oc' J.,' A(1' ""'.,. .lIn.'J.,.,' Aug' Sopt' 00' _. Dc:' J .... Feb' MIr' A(1' ""'y'.AnI' JiIot. AI; 01 0' 01 0' 0' 01 0' (J/ 02 02 a! 02 a! 02 02 CI! 02 <D 03 OJ <D 03 <D CD 1)3
Penod
_ Fungi
c::J Bacteriaactinomycetes
~ Available K20
Fig. 52 : Sho\ving monthly fluctuations of Fungi, Bacteria-actinomycetes popUlation and available ~O at Site II (MD)

166 Rec. zoo 1. Surv. India, Dcc. Paper No. 324
Fluctuations of fungi, bacteria-actinomycetes population and Cadmium
e ~
120
100
i 60 CD .....
)( b 40
'5 ci S li> 5 u.
20
~
.J -- -
~
I I \
-I
I I I 1 I JUle.l.lIy AIG Sell ()Q Iobv DIe .lin I>9f MIIy ,A,.. JIIy AIG SeI' ()Q Iobv DIe J., RIb MIl' "'" ...-, JUle J.Ay Aug "0\ "01 "01 "01 '01 "01 'Ill "02 '02 "11/ '02 "Il! '02 "Il! "02 "11/ "02 '03 "Ql '03 "en "03 "ID "03 "01
Pel'led
4.5
3.5
2.5
0.5
o
e I '0 (J
- Fungi
c::J Bacteria-actinomycetes
-A- Cd(ppm)
Fig. 53 : Showing monthly fluctuations of Fungi, Bacteria-actinomycetes population and Cadmium at Site II (MD)
Fluctuations of fungi, bacteria-actinomycetes population and Zinc
12Or-----------------------------------------------~100
~ "5? )( ::)
100
~ eo b g ~ 1S , ! 00
20
JUle JJIy Aug Slip! CIt. lOt DIe Jin "" MIl, JUle JIIy Aug SIll' ()Q Iobv Dc Jin Fell ""W Art MIl, ,A,.. .l.Itt ~ "01 "01 'Ill "01 "01 "01 "01 '02 "Il! "02 "Il! "(II '02 "Il! "02 '02 "02 '03 "Ql "03 '03 "Ql '03 "ID '03.
PeriJd
70
60
i 50 ~
40
20
10
c N
- Fungi
CJ Bacteria-actinomycetes
-A- Zn(ppm)
Fig. 54 : Showing monthly fluctuations of Fungi, BacteI1a-actinomycetes population and Zinc at Site II (MD)

CHOWDHURY et. af. : On Taxonomy and Ecology of Earthworms (Annelida : Oligochaeta) '" 167
Fluctuations of fungi, bacteria-actinomycetes polution and Lead 'mr---------------------------------------------~ 50
1(11 -l ! t» II)
" f
" , J ., .... , o
-Fungi 45
CJ Bacteria-4Q actinomycetes
-*- Pb(ppm) ~
30
i 25 !
f
20
15
10
J.,.., "'~ "'" IIttl Oct ,.."" a.: J.. ~t .... "' .. -"'It Ao4I _, Oct NCIt o.c .lin FtII ..., I{)t ..... , .1m. J.,., "'g "01 "0' "0\ ", "01 'Q' "0' 'Q2 "(I '02 "02 '1)2 "02 "(I "02 "QI "02 "(I) '03 "01 '\)3 "'tn 'Q3 "(I) "'lSI
P .. od
Fig. 55 : Showing monthly fluctuations of Fungi, Bacteria-actinomycetes population and Lead at Site II (MD)
Fluctuations of fungi. bacteria-actinomycetes polution and Copper
t~ __ ------------------------------------------------~70
tao -J. 'b
! ~ 10
" ~ e 15 , I 10
~J. o
60
50
40
20
10
J"'. U, Ao4I Sell Od "'CIt a.: J.. IiIp, ~ "",. ~ "'" ~ Od NCIt C.c .an Fe ~r • ~, l.o.,. JIIy "'g VI "0' "01 '01 "01 '01 '01 'Q2 "QI ';2 "02 ~2 -0: 'IJZ "02 "(Jl "02 "m '03 "QI 113 "CD 113 "CD 'QI.
Period
_ Fungi
c::J Bacteriaactinomycetes
.-.- Cu(ppm)
Fig. 56 : Showing monthly fluctuations of Fungi, Bacteria-actinomycetes population and Copper at Site II (MD)

168 Ree. zool. Surv. India, Oee. Paper No. 324
45
40
35
30
25 ~ 0
20
15
10
5
0
E1 E2 E3 E4 E5 E6 E7 E10 E11 E12
Fig. 57 : Showing comp'osition of earthworm community at Site III (BRF)
Explanation: El = Lampito mauritii; E2 = Metaphire posthuma; E3 = Perionyx excavatus; E4 = Eutyphoeus orientalis; ES = Eutyphoeus incommodus;
E6 = Eutyphoeus nicholsoni; E7 = Drawida nepalensis; ElO = Metaphire houlleti; Ell = Amynthas corticis; El2 = Octochaetona beatrix
Earthworm and subsoil temp.
1~~--------------------------------------------~~
100
eo
..un ..I.IIy 'ug Sell 0:1 M>v Dc J.. I>fJI "'- ....., Uy h4I Sell Od M>v Dec: .lin Fe .... , Af>t .... y Jm. Ny 'ug "01 '01 "01 'Ill "01 'Ill "01 '02 "'CJZ 'Il2 "02 '02 '02 "CJI '02 "'CJZ 'Il2 "(8 'Il3 "(8 'Il3 "UI 'Il3 "(8 'Il3
P.lod
30
25
20
15
10
_ Earthworm
-+- Temp. (subsoil)O C
Fig. 58 : Showing monthly fluctuations of earthworm population and subsoil temperature at Site III (BRF)

CHOWDHURY et. al. : On Taxonomy and Ecology of Earthworms (Annelida: Oligochaeta) ... 169
UD
100
eo .. ! If
I I eo
t ~
.a
Earthworm and subsoil humidity 120 --+-
J 100
r-..
80
! ~ 80 'V
I ~ ~
40
20
"'-' .lIOW "-'II s..>t Q, _ Ott J .. "11 ~ J",. J.t, .t.G SlIP Cd No. 0« .lin Fill M. ~, 1.11\' JIN Jily .t.G "0' ." 1>' ", "01 "'0' "0' 1>2 1>2 1>2 "m 0(Jl "02 "02 1>2 0(Jl "Q/ °m "03 °03 .,3 1>3 'U3 om "03
Pellod
Fig. 59 : Showing monthly fluctuations of earthworm population and subsoil relative humidity at Site III (BRF)
·Earthworm population and pH
Earthworm
Humidity (subsoil) (%)
ft __ ------------------------------------------------------~
.0
I U JJ) ~ 5." Qt f't!,; c.c .lin ~, ..., Nt. Jily Aug 5.,1 Cd HOI CIte .. n Fill Me, ~ lotIy .line .lily ~ "c" "J! 1>' "01 "\l'l "c' 1>' "tR "'02 '02 "(Jl "(Jl 1>2 "Q/ "(Jl 1>2 '02 'U3 °03 1>3 °m "'03 '03 °m °03
Perod
_ Total earthworm
-+- pH
Fig. 60 : Sho\\ing monthly fluctuations of earthworm population and pH at Site III (BRF)

170
1ft"
! II 0 .s. @ 0 • .c: t: II W
Ree. zool. Surv. India, Dec. Paper No. 324
Earthworm and E.C. '~.--------------------------------------------------------,01
100
II)
60
«l
06
05
OA
OJ
02
0.1
M> ..IJ1y Aug Sell oa NQI 01£ J., "flI May J.,.. ..IJ1y Aug Sep Oct ttl" 01£ J., Fe> IU ~, MIrr .1J". .1J., "" '01 "01 't'1 "01 '01 '01 "01 "1)2 '1)2 '02 'az "lIZ "1)2 '1)2 '(]I "lIZ "lIZ "03 "03 '03 'UI "03 "1)3 '03 '03
Plflod
r
~ ~ c,j
IAi
_ Earthworm
-+- E,C. (dSm-1)
Fig. 61 : Showing monthly fluctuations of earthworm population and electrical conductivity at Site III (BRF)
Earthworm and organic carbon '~~------------------------------------------------------~35
100
8)
'" ! II 0 .:. ~
60
0 • ! w
40
20
JUl JIiy Aug Sept Oct Nov Dee Jan ~ May JUle July Aug Sept 0:\ Nov Dec J ... Feb M. ~ May JUle Jut,- Aug '01 "01 '01 "01 '01 "01 '01 "02 '02 '02 '02 "02 '02 "02 '02 '02 '02 "03 '03 "03 '03 '03 '03 "03 ·03
IlIrlod
25
15
05
l c.J ci
_ Earthworm
-+- 0 C (%)
Fig. 62 : Showing monthly fluctuations of earthworm population and organic Carbon at Site III (BRF)

CHOWDHURY et. al. : On Taxonomy and Ecology of Earthworms (Annelida : Oligochaeta) ... 171
Earthworm and available N2 r-------------------------------------------------~~O
_ Earthworm
)50 --+- Available
:'>0
250
1~0
100
,V' ...., ~ SItII Q:I He.- Ot< J.. Aq IoIttr ...... .AJ\, .", Sell Q:I N>. OK J... Feb ,., Apt IA'¥ ..... ~ Aug 1)1 "\II "01 '1)1 '1)1 "\lI '()I 1)1 "at "Ol 1)2 'tJI "at '1)1 '1)2 'tJI "02 'I)) 'til 'til 'I)) '01 "0) "0) 'I))
Period
Fig. 63 : Showing monthly fluctuations of earthworm population and available Nitrogen at Site III (BRF)
N2 Kgha-1
Fluctuation of total earthworm population and soil available P 20S
1~~--______ .----__ ----------------------------------------_ 350
100
eo
.'J' M Aaw s~ Od No~ Dec Jal ~r M"1 Jure Jo,jy Aug Se\i Od Nov Dec Jal Feb Mar AII' MiJ1 J~ July Aug • 01 'Ul 'U 1 lJ 1 "01 "01 "01 "02 '02 '"02 "02 '02 "'02 "02 "(12 "'02 "02 '03 "03 "03 '03 '00 "03 "'03 "'03
Period
:ll0
250
200-! c;;. ~
~ 150 Il.
100
50
0
---+-
Fig. 64 : Showing monthly fluctuations of earthworm population and available P 205 at Site III (BRF)
Total earthworm
Available P20S

172 Rec. zool. Surv. India, Dcc. Paper No. 324
Fluctuation of total earthworm population and soil available K20 1~r------------------------------------------------------'~0
100
80
40
20
tr
! .. o .E. ~ 0 ~
.z:. ; w
700
000
500
3)0
200
100
-!
_ Total earthworm
-+- Available K20
Jill JIIy Aug SIlJX Oct Nov Dec J~ Apr May June JIIy Aug Se~ Oct Nov Dec J~ Feb Mar Arx May JIIle July Aug ·01 "01 "01 "01 "01 "01 "01 "(12 "02 "02 "02 "02 "02 "02 "(12 "02 "02 "03 "03 "03 ·03 "03 "03 "03 "03
Period
120
100
00
ro
40
20
Fig. 65 : Showing monthly fluctuations of earthworm population and available K
20 at Site III (BRF)
Earthworm and cadmium 3S --+-
2S
e-It :;' (J
1S
05
.1Jn JlJy Aug Sepl Q; 1 N QI 011: J>n Ag t.Iaf .1Jne .L1y .... g Sepl Cd NOot Doc .an Nt> M. ~ May ..IJ,. JIJ Y A <0 "01 'Q1 '01 'Q1 'Q1 '01 'Q1 "(]! .(]! ~2 ~2 '02 '02 '02 '02 '02 '02 ~3 ~J "03 "03 "OJ "OJ "03 "03
Period
Fig. 66 : Showing monthly fluctuations of earthworm population and Cadmium at Site III (BRF)
Earthworm
Cd(ppm)

CHOWDHURY et. al. : On Taxonomy and Ecology of Earthworms (Annelida: Oligochaeta) ... 173
! • 0 s ~ 0 • .c 1:
~
c-I • ! I • ~ .:I
Earthworm and zinc 110 -- -------- -----.--
_____________________ ~1~
tloJ
.... '
120
100
00
00
20
"-', _... • ~ "" _ 1 '~. loo. an lip ~, J",. ""II' Aug Sap! Oa No. Doc an feb 1.1., ~ ~ ...... ""., Aug ',. ,. - _, '--" T,' T., 't. 'u, 'Ill 'ar 'Ill 'Ill 'ar tl2 1)2 1)2 1)2 '03 '!Xl 'Ol '!Xl '(1) '<II tl3 'Il3
Period
i E; c N
_ Earthworm
-+- Zn(ppm)
Fig. 67 : Sho\ving monthly fluctuations of earthworm population and Zinc at Site III (BRF)
Earthworm and lead 120 .---.--- - -- --- . - -----------------------------,. 45
80
JO
4(1
-40 -+-
35
:I>
25 e Q.
.s 20
f
15
10
., '\0 -.,1 . 1 ...,. ~( a" .... ~, ..v. .v, Aug Sepl Od N", o.c J,., Feb 1.1., A(S ~ J..... !.*t Ioug -c' 'c, "2 'U 'U2 '1;2 '02 1)2 1)2 'Il2 t)2 tl2 tI) '0) '0) '03 'Il3 '!Xl '03 '(1)
P.riod
Fig. 68 : Sho\ving monthly fluctuations of earthworm population and Lead at Site III (BRF)
Earthworm
Pb(ppm)

174 Ree. zool. Surv. India, Oee. Paper No. 324
Earthworm and soil copper
1~~------------------------------------------------,
100
40
3S
25_ e a-S. :I
2l)CJ
15
10
5
_ Earthworm
-+- Cu(ppm)
O~~~~~~~~--__ ~ ____ ~ __ ~ __________ ~~~~O
.lJn J\Jy ~ Sass Oct IotIv o.c Jan • May ..... J.Jty lug ~pI 0<1 HOI Ote J.. Feb ~ .. , All May J",. JJt, Jug
70
60
50 c 0 ~
~ 40 :J 0-0 0-..... o 30 ~ 0
20
10
0
·01 "01 ·01 "01 "01 ·01 "01 ·02 ·02 "02 W ·02 ~2 '02 ~2 ~2 ~2 '03 ~3 '03 '03 ~3 .(1 '03 "Ql
F1
PeriOd
Fig. 69 : Showing monthly fluctuations of earthworm popUlation and Copper at Site III (BRF)
F9 F10 F4
Fig. 70 : Showing composition of fungal community at Site III (BRF)
Explanation: Fl = Penicillium, F2 = Aspergillus, F3 = Fusarium, F4 = Trichoderma, FS = Rhizopus, F7 = Mucor, F8 = Cladosporium, F9 = Sclerotium, FlO = Curvularia

CHOWDHURYet. al. : On Taxonomy and Ecology o/.Earthworms (Annelida: Oligochaeta) ... 175
45
40 - -35 -
i 30 -~ 25 - -&. '- 20 0 -'#.
15 -10
r- r---
5 r- r--
0 ,...., n
I I I I I I I I I I I I I I BA2 BA1 BA3 BA4 BA5 BA6 BA7 BA12
Bacteria-actinomycetes genera
Fig. ,1 : Showing composition ofbacteria-actinomycetes community at Site III (BRF)
Explanation: BAl = Bacillus, BA2 = Streptomyces, BA3 = Micrococcus I, BA4 = Micrococcus II, BAs = Arthrobacter, BA6 = Pseudomonas,
BA7 = Pronticromonospora, BA12 = Azotobacter
Fluctuations of earthworm, fungi and bacteria-actinomycetes population
gO __ ----------------------------------------------T~
100
20
Jill Jw'l """ Se& oa _ CIte J.. "<I "'y J"" .&." AI.; $11111 0:\ ICv Dc Jan F4I .... , ~ "'y ~.. ~Iy Aug "01 'Il1 .,. '01 "01 '01 "01 W 'Il2 'III 'III "02 '02 '02 W 'az ~ "03 '03 'Il3 om "(II °OJ "03 "03
PtrCd .
_ Earthworm
70 c:::J Fungi
~ Bacteria60 actinomycetes
20
10
Fig. 72 : Showing monthly fluctuations of Earthworm, Fungi and Bacteria-actinomycetes population at Site III (BRF)

Rec. zool. Surv. India, Occ. Paper No. 324
Fluctuations of fungi, bacteria-actinomycetes population and subsoil temperature 80
70
10
o
35 - Fungi
\ ~~ ~
~~ j
30 CJ Bacteria-actinomycetes
~ Temp, 25 (subsoil)O C
~ ~I'-, ~r-....
4
20
~ t " ...
15
10
I o .lin J.ty AIQ Sepl 0.1 toy OK .an #>0' May Jill. J~ l'ull S.II Ott to. c., .an feb Ma, ,... t.Ia/ .1.1... JJIy "G '01 '01 '01 '01 '01 '01 '01 '02 '02 'az -az 'az '02 '02 '02 '02 '02 "Ql 'm "Ql '03 '03 '03 '03 '03
Period
Fig. 73 : Showing monthly fluctuations of Fungi, Bacteria-actinomycetes population and subsoil temperature at Site III (BRF)
Fluctuations of fungi, bacteria-actinomycetes population and subsoil relative humidity
80~----------------------------------------------~'20
70
40
20
10
.lin JIIy Aug S.II Cd NOlI Dec: Jill #>0' May Jill. .I.I1y l'ug Sell Ctl toY IlK .an r.b ,,-, A(1 MItt ..... JIIy Aug '01 '01 'Ill '01 '01 '01 '01 '02 '02 -az -az 02 02 '02 '111 'az '02 '03 '03 'Ql '03 '03 '03 'Ql 'Il)
Rtrlod
_ Fungi
CJ Bacteriaactinomycetes
~ Humidity (subsoil) (%)
Fig. 74 : Showing monthly fluctuations of Fungi, Bacteria-actinomycetes population and subsoil relative humidity at Site III (BRF)

CHOWDHURYet. al. : On Taxonomy and Ecology of Earthwor1ns (Annelida: Oligochaeta) ... 177
Fluctuations of fungi, bacteria-actlnomycetes population and pH
. ----------------------------------------------~ • - Fungi
CJ Bacteria-actinomycetes
........- pH
I ~n .t.~ '" ..... Ckl PC>. Dc J.. A(I .. , J ........ " Aug ~ Ckl No. Doc J.. Feb M.- "" .. , J .... U, Aug ". "1 "01 ", ". ", °01 03 oar 113 'til 112 "<I 112 'til 112 "<I OJ "03 "03 "a) 113 om 113 "a)
P. rIO d
Fig. 75 : Showing monthly fluctuations of Fungi, Bacteria-actinomycetes population and pH at Site III (BRF)
Fluctuations of fungi, bacteria-actinomycetes population and electrical conductivity 10
10
.---_. 0.7 -Fungi
0.8 CJ Bacteria-actinomycetes
1 -*- EC (dSm-1) 0.5
~ 0.4
l
~ \ J ~ ~ \ \ \ \ ~
I "'l \ I 'l
I \
0
03 w
0.2
" 0.1
I .u. JoJ> '" So", oa ~. Oc .an "" "y ..... J~, Aug SoP! oa I't>o Ooc .lin F.b MI, Afl, """ Jill • .1IIy Aug "0' '\'I "iJ 01 "01 "\II ~ 'til "2 '02 "02 "0/ "(12 0;)2 °02 "02 'til "m 113 03 "03 "03 "a) 113 1)3
Petod
Fig. 76 : Showing monthly fluctuations of Fungi, Bacteria-actinomycetes population and electrical conductivity at Site III (BRF)

Rec. zool. Surv. India, Dcc. Paper No .. 324
Fluctuations of fungi, bacteria-actinomycetes population and organic carbon
80
70
10
35 - Fungi
~ 3 c:::J Bacteria-acti nomycetes
I ... ~ 1\ i ~ '" ) "" 4
~
-*- o C (%) 25
2
\ 15
05
I o JUl Ny Aug Stpt Qf Nov DC: J., 1>(>, "'" ..... Jilt A&Q ~I Oct Nov Otc .lin F.b IU 1>(>, "'" .1t.. .1t1y A&Q 1)1 '01 1)1 "01 '01 "01 "0\ '02 'til '02 "02 "02 "02 "(Ii! '02 'til '02 "(13 '03 '03 "m '03 'at '03 "03
Period
Fig. 77 : Showing monthly fluctuations of Fungi, Bacteria-actinomycetes population and organic Carbon at Site III (BRF)
Fluctuations of fungi, bacteria-actinomycetes population and available N2
80
70
10
~ 41
J ~ { .ft-1
~ ~
\ V 4
\ 4
4
I ... n Ny Aug Sell 0:\ NOt OIIc .lin 1>(>, "'" ..... JIIy Aug Sell Oa Nov 0IIc J., let> MI' All Mly JUle .lily A&Q "01 "0\ 1)1 "01 '01 "01 "01 "02 "(Ii! '02 "02 'til 'til '02 "02 "(Ii! '02 "03 'ID 113 '03 "03 "m 1)3 "03
P8"ild
350
2SO
150
100
50
o
_ Fungi
c:::J Bacteriaactinomycetes
--*- Available N2 Kgha-1
Fig. 78 : Showing monthly fluctuations of Fungi, Bacteria-actinomycetes population and available Nitrogen at Site III (BRF)

CHOWDHURYet. al. : On Taxonomy and Ecology of Earthworms (Annelida: Oligochaeta) ... 179
Fluctuations of fungi, bacterla-actlnomycetes population and available P 205
10
'0
10
r ~ 1\ ~ ~
, ~
I"'"
4
I J", J.- .... a., 011 It., Dc J.. ,., .. , J",. ""tr Nil Sip as NI. Ole .lin Fe .... Apt "'II' "" .. J~ AI4I ~. 'GI 'III 'VI "01 'III "01 "2 "III '\)2 "III "02 "(II ·02 '\)2 ·02 '\)2 ·CD '\)3 ·CD '\)3 ·CD ·03 ·at '(8
P.aI
350
300
250
100
!So
o
_ Fungi
c::::J Bacteriaactinomycetes
'"'"'*- Available P20 5 Kgha-1
Fig. 79 : Showing monthly fluctuations of Fungi, Bacteria-actinomycetes population and available P 205 at Site II-I (BRF)
Fluctuations of fungi, bacteria-actinomycetes population and available K20
•
o
~ 4
~ ... / ~
• ~
I ..... JoIr "'" .. (k, No. DIe .lin 1/01 ... .lI.. J<Iy Nil s.a 012 Pew Ole J.. IItIl tdIr Arr May J.... """ AICI ~, "01 '\)1 "0' .~ 'VI "01 "02 "(I '02 "02 "III "III '02 "(I '(1 '\)2 ·03 "'CD 03 '113 ·03 .(8 '03 "03
PInld
800
800
300
200
100
_ Fungi
c::::J Bacteriaactinomycetes
-*- Available K20 Kgha-1
Fig. 80 : Showing monthly fluctuations of Fungi, Bacteria-actinomycetes population and available K2 ° at Site III (BRF)

180 Rec. zool. Surv. India, Dcc. Paper No. 324
Fluctuations of fungi, bacteria-actinomycetes population and Cadmium
eo
70
10
70
10
.. ~
~ j'i
)' ~ [\ •
/
v \ V
~ 'I
I 'I
Ju,. J\Jy "'''g Sell oa ..."" o.c: J.. I(>r May Jill. ""Iy ~ ~I Q:1 lb. Oc: ..lin Feb U. ~ May JIIMI JJIy "'" "01 '01 'Ill 'Ill "01 '01 'Ill '02 "02 '(2 '02 "02 "02 '(2 '02 02 '(2 '(8 'til 1)3 '03 '(8 '1)3 '03 '03
Period
3.5
2.S
1.S
o.S
o
'Q (J
- Fungi
c::::J Bacteria-actinomycetes
-*- Cd(ppm)
Fig. 81 : Showing monthly fluctuations of Fungi, Bacteria-actinomycetes population and Cadmium at Site III (BRF)
Fluctuations of fungi, bacteria-actinomycetes population and Zinc
~
.1'1\ \ ~ , ~V ~
~
~ • ...
1\ ~ •
~
I JJre J\Jy ,tug ~I oa NGI 0.: ..lin ~ May JIIMI July Aug Sql1 0:1 Pel. Os: ... n Fe M. I>{s Mol! Ju,. J\Jy Aug "01 "01 1)1 '0\ "01 '01 -01 '(2 '02 "02 "CQ '02 '02 "t2 '1)2 '02 '(2 'til '03 'm '(8 '03 "03 'm 'm
Penocl
140
120
100
00
E ! c:
N
- Fungi
CJ Bacteria-actinomycetes
--*- Zn(ppm)
Fig. 82 : Showing monthly fluctuations of Fungi, Bacteria-actinomycetes population and Zinc at Site III (BRF)

CHOWDHURY et. al. : On Taxonomy and Ecology of Earthworms (Annelida : Oligochaeta) ... 181
Fluctuations of fungi, bacteria-actinomycetes population and Lead --- 45 -Fungi
40 c::J Bacteria-
.(\ ~\ / -- - ..
V~ \ 4
f\-
actinomycetes 35 -..- Pb(ppm)
30
25
"&
ro-. II So ~
20
15
10
I .... ~ A., ..... ell Ia. Dc .... 1>(1 "'- .v. "'Iy "IG StPI 0cJ !Go o.c Jon Fee MI, AII' ~y ..... JlJy Aug "0' "\)I VI ~I ~I "01 '(11 OCR oar 'Ill 'Ill "02 "CII "CII '02 '02 '02 '<11 '<11 '03 '03 "03 "03 'm '01
P.-aod
Fig. 83 : Showing monthly fluctuations of Fungi, Bacteria-actinomycetes population and Lead at Site III (BRF)
Fluctuations of fungi, bacteria-actinomycetes population and Copper 10
10
----- 45 - Fungi 40 CJ Bacteria-
actinomycetes 35 -..- Cu(ppm)
J 30
l) \ /
A V i\ ~
25
i ::I
U 20
" i.'" 15
10
. I
.L-. .u, A.. ., Q:~ '«>0 Dc .. , 1>(1 "'- .v. "''r AIG StPI 0cJ !Go Doc Jon Feb MI, Art ~y ..... JlJy Aug "Ii' 0(J oil' '01 '0' "01 '()I "CII 'ar '02 '02 '02 'ar "CII '02 '1)2 "02 '1lI "CD '\l3 '1)3 '03 '03 "CD '01
Perod
Fig. 84 : Sho\ving monthly fluctuations of Fungi, Bacteria-actinomycetes population and Copper at Site III (BRF)

182 Rec. zool. Surv. India, Dcc. Paper No. 324
60
50
40
fft. 30
20
10
E1 E2 E3 E4 E5 E6 E7 E8 E9 E10 E11 E12 E13 E14
Fig. 85 : Showing abundance of different earthworm species obtained
Explanation: El = Lampito mauritii; E2 = Metaphire posthuma; E3 = Perionyx excavatus; E4 = Eutyphoeus orientalis; ES = Eutyphoeus incommodus;
E6 = Eutyphoeus nicholsoni; E7 = Drawida nepalensis; EB = Perionyx simlaensis; E9 = Polypheretima elongata; E10 = Metaphire houlleti; Ell = Amynthas corticis;
E12 = Octochaetona beatrix; E13 = Octochaetona surensis; E14 = Drawida papillijer papillijer

CHOWDHURY et. ale : On Taxonomy and Ecology of Earthworms (Annelida : Oligochaeta) ... 183
.,.
45----------------------------------------------------------~
40
35
30
25
20
15
10
5
0 E1 E2 E3 E4 E5 E6 E7 E8 E9 E10
D Site I: DP
~ Site II: MD
II Site III: BRF
E11 E12 E13 E14
Fig. 86 : Showing relative abundance of individual earthworm species in different sampling sites
Explanation: El = Lampito mauritii; E2 = Metaphire posthuma; E3 = Perionyx excavatus; E4 = Eutyphoeus orientalis; E5 = Eutyphoeus incommodus;
E6 = Eutyphoeus nicholsoni; E7 = Drawida nepalensis; E8 = Perionyx simlaensis; E9 = Polypheretima elongata; El0 = Metaphire houlleti; Ell = Amynthas corticis;
E12 = Octochaetona beatrix; E13 = Octochaetona surensis; E14 = Drawida pap ill ije r papillijer

70
60
50 -~ 0 -c 40 0 :;; .!! ::l Q. 30 0
Q.
20
10
0
• • . . . .
Rec. zool. Surv. India, Dcc. Paper No. 324
• •• ~ . .
Fig. 87 : Showing site wise abundance of total population of earthworm
F1 F2 F3 F4 F5 F6 F7 FB F9 F10 Fungal genera
Fig. 88 : Showing abundance of different fungal genera obtained
Explanation: Fl = Penicillium, F2 = Aspergillus, F3 = Fusarium, F4 = Trichoderma, FS = Rhizopus, F6 = Cephalosporium, F7 = l.1ucor, FB = Cladosporium,
F9 = Sclerotium, FlO = Curvularia

CHOWDHURY et. ale : On Taxonomy and Ecology of Earthworms (Annelida : Oligochaeta) ... 185
-~ -C 0 ;: II !i c-o ~
30~---------------------------------------------' ~ Site I (OP)
D Site II (MO)
~ Site III (BRF) 25
20
15
10
5
o F1 F2 F3 F4 F5 F6 F7 Fa F9 F10
Fungal genera
Fig. 89 : Showing relative abundance of individual fungal genera in different sampling sites
Explanation: Fl = Penicillium, F2 = Aspergillus, F3 = Fusarium, F4 = Trichoderma, FS = Rhizopus, F6 = Cephalosporium, F7 = Mucor, FB = Cladosporium,
F9 = Sclerotium, FlO = Curvularia
-
-Fig. 90 : Showing site wise abundance of total population of fungal genera

186 Rec. zool. Surv. India, Dcc. Pape,- No. 324
40~----------------------------------------------------------------~
35
30
~25 o -c o ~ .! 20
::::J Q. o
Q.
15
10
5
BA1 BA2 BA3 BA4 BA5 BA6 BA? BA8 BAg BA10 BA11 BA12 BA13
Bacteria-actinomycetes genera
Fig. 91 : Showing abundance of different bacteria-actinomycetes genera obtained
Explanation: BAl = Bacillus, BA2 = Streptomyces, BA3 = Micrococcus I, BA4 = Micrococcus II, BAS = Arthrobacter, BA6 = Pseudomonas,
BA7 = Promicromonospora, BAB = Cytophaga, BA9 = E. coli, BA10 = Flavobacterium, BAll = Enterobacter, BA12 = Azotobacter, BA13 = Nocardia

CHOWDHURY et. al. : On Taxonomy and Ecology of EarthwornlS (Annelida : Oligochaeta) ... 187
18-------------------------------------------------------------------,
4
2
o
~ Site I (DP)
o Site II (MD)
II Site III (BRF)
BA1 BA2 BA3 BA4 BAS BA6 BA? BA8 BAg BA10 BA11 BA12 BA13
Bacteria-actinomycetes genera
Fig. 92 : Showing relative abundance of individual, bacteria-actinomycetes genera in different sampling sites
Explanation: BAl = Bacillus, BA2 = Streptomyces, BA3 = Micrococcus I, 8444 :: Micrococcus II, BAs = Arthrobacter, BA6 = Pseudomonas, BA7 = Promicromonospora,
BAB = Cytophaga, BA9 = E. coli, BA10 = Flavobacterium, BAll = Enterobacter, BA12 = Azotobacter, BA13 = Nocardia
• 111.1
Fig. 93 : Showing site wise abundance of total population ?f bacteria-actinomycetes genera

188
,80
78
010 76
74
Humidity (upper surface)
IBRF
Temperature (upper surfac le)
29
28 °c
27
7.5
7
6 .5
6
BRF
pH
BRF
Rec. zoot,. Surv. lndi,a, Oec. Paper No. ~_·
88 %
26 ,
25.5
IOC 25
ds nT1
0.6
0.4
0.2
Humidity (subsoil)
BRF
lemperature (subsoil)
MD BRF
EC
o -.----.:..:..-,~ ::::::~~ ___ L
BRF
Fig. 94 : Mean values of edaphic factors in the studied sites

o
230 ,225
220
cc
r 11 ",omy nd coi09Y of Earthworms C- nnelida : OUgochaeta) ... 189
n
Kg. ha-'
BRF
SOO
400
300
200
100
A v ai b nitro gan
o~~-.' OP MID
IBRF
lean v,alues of daphic fa,ctors in the stud' ed sites
BRF
BRF
• - ( on d.): ean .alues of edaphic factors and heavy metals in the studied sites

190 Rec. zoot. Surv. India, Dcc. ,Paper No S 4
Cadmium Znc
ppm 2 ppm
BR= BRF
Fi.g. 94 (Contd.) : Mean values of eda'phic factors and beavy m'etals in the studied sites
ead Copper
200 ppm ppm
100
0:-__ .. = BRF
Fig. 94 (Contd.) : Mean values of heavy metals 'n the studied sit,es

r wida nepalen c ael e
viw Figur< b: Ant rior nd, ventral view ' howing male genital region
I: Drawida pap tllije r pap illife r Stephenson
tire' orm ventro-Iateral vie'''' i,gu e b : terio end showing male genital region
Plate III . Eutyphoeu incommodus (Beddard)
e a : Entir worm \ entral vie'¥ . gu e b : Anterior end showing male g<enital region and permathe1cal pore. Sp.P,
permathecal por

Plate IV : Eutyphoeus nicholsoni (Beddard)
Figure a : Entire worm, ventral \;ew Figure b : Anterior end sho\\ring male genital and spernlathecal pore region. Sp.P, spermathecal pore
Plate V : Eutyphoeus orientalis (Beddard)
Figure a : Entire worm, ventral view Figure b : Anterior end , ventral view showing malt=' genital region
Plate VI : Octochaetona beatrix (Beddard)
Figure a : Entire worm, ventral view Figure b : Anterior end, ventral \'iew showing nlale genital region
Sp.P

Plate VII: Octochaetona surensis (Michaelsen)
Figure a : Entire worm, ventral view Figure b : Anterior end, ventral view showing male genital and spermathecal pore region. Sp.P,
spermathecal pore
Plate VIII: Lampito mauritii Kinberg
Figure a : Entire worm, ventral view Figure b : Anterior end, ventral view showing male genital region. Ps . penial setae
Plate IX : Metaphire posthulna (Vaillant)
Figure a : Entire worm, ventral view Figure b : Anterior end. ventral view showing Inale genital region . Gm, genital marking

P at ~ X : Metaphire houlleti (P rrier)
Figur a : ntireworrn v ntral view Figure : Ant '- fior end ventral vi w ho\-ving male genital region
Pia' e XI : Perlonyx excavatu Perrler
Figure a : Entire worm, ventra vi'ew Figure b : terio end ventral view howing male g nital region
P _at 'XII: Perionyx sim.laensl (Mic aelsen)
· gur a : Entire worm, ventral view ~ gure b : I terior end, ventral view howing male g,enital and spermathecal par'e region. Sp.P,
spermathecal pore

. \'
h T- tirn
Gm
n ta (P rrlr)
nd v tral . w ' howing nital r gi 'n
rnyntha I r~ti i (Kinb ~ r )
0gu ri r i nd ntral vi w howing male genital region
ae
amplin ite at hap a uni ipal' a te di po alite (' ite 1)

Showing ampling ' it, at ad a l gram" unculti at d fi Id (Site I)
ate XVII
I howing sampling , ite at Bethuadahari Reserve Forie t ( it,e III)

ultur for fronl on
'lat XIX
la' eXX
Figur b : howing coloni of 0'1 micr rgani m . n pr ad plat cultur
Fi,gur _ b : Showing coloni s of soil microorgani m in pread plate ,culture
Figure : howing treak~p ate culture for i olat 'on of pure bacterial train from oil

Plate
Figure a: howing bioch mical tests for i olafo of pur,e bact rial train
p
~--d' """"--~. Gm
--Se
I
~ · gure b : howing bioch mical te' t for i olation of pur a ' e ial rain
A
Ventral 'ew of a typical earthworm. Pr ProstOITliu' CI, Clitellum; Gm Genital Markin,g; 'e Setae' An, An u