Embed Size (px)
Citation preview

Institute for Public Policy Research
Glenn Gottfried
October 2014 © IPPR 2014
REPORT
CONTINENTAL DRIFTUNDERSTANDING THE GROWTH OF EUROSCEPTICISM

NEW IDEASfor CHANGE
ABOUT IPPRIPPR, the Institute for Public Policy Research, is the UK’s leading progressive thinktank. We are an independent charitable organisation with more than 40 staff members, paid interns and visiting fellows. Our main office is in London, with IPPR North, IPPR’s dedicated thinktank for the North of England, operating out of offices in Newcastle and Manchester.
The purpose of our work is to conduct and publish the results of research into and promote public education in the economic, social and political sciences, and in science and technology, including the effect of moral, social, political and scientific factors on public policy and on the living standards of all sections of the community.
IPPR 4th Floor 14 Buckingham Street London WC2N 6DF T: +44 (0)20 7470 6100 E: [email protected] www.ippr.org Registered charity no. 800065
This paper was first published in October 2014. © 2014 The contents and opinions in this paper are the author(s) only.

IPPR | Continental drift: Understanding the growth of Euroscepticism 1
CONTENTS
Introduction ........................................................................................................3
1. Shock to the system: Euroscepticism in 2014 ...............................................5
Eurosceptic parties have made strong gains among the European electorate ......... 6
Eurosceptic voters predominantly support mainstream political parties ................... 8
2. End of the honeymoon: Eurosceptism in the 1990s and 2000s ................... 10
Support for Europe no longer correlates with economic growth ............................ 10
Middle class voters have split from the upper-middle class ................................... 11
Education has become a stronger predictor of Euroscepticism ............................ 14
Euroscepticism has intensified among those who feel ‘cultural threat’ .................. 16
3. Eurosceptism after the crash: Finding new explanations for anti-EU attitudes........................................................................................................ 18
Class and education are relatively weak predictors of Euroscepticism .................. 18
Eurosceptics worry about the quality of public services ........................................ 19
Attitudes to immigration are a significant driver of attitudes to Europe .................. 20
A distrust of politics is the strongest predictor of Euroscepticism .......................... 20
4. Conclusions: A new story about Euroscepticism ......................................... 22
References ....................................................................................................... 23
Appendix 1: Eurosceptic parties in national and European elections ............. 25
Appendix 2: Binary logistic regression model predicting Euroscepticism ...... 30

IPPR | Continental drift: Understanding the growth of Euroscepticism 2
ABOUT THE AUTHORGlenn Gottfried is a research fellow at IPPR.
ACKNOWLEDGMENTSI’d like to give special thanks to my colleagues at IPPR for the substantial support they’ve provided through the duration of this project. I’m grateful to Mark Ballinger for his assistance in compiling this report, to Nick Pearce, Graeme Cooke and Guy Lodge for their comments, support and guidance, and to Alex Glennie for her comments on earlier drafts.
Lastly I’d like to thank David Claydon for his generous sponsorship for this research.

IPPR | Continental drift: Understanding the growth of Euroscepticism 3
INTRODUCTION
Euroscepticism is on the rise. Whether it is seen in decreasing levels of trust in Europe or belief in its virtues, or in an increasing desire to leave the European project behind altogether, public opinion seems to be hardening across the continent, including in the UK. Given the serious implications of this shift for the future of an integrated European community, understanding the factors that underpin and drive these changes is of vital importance. In this report, we assess the long- and short-term trends in public opinion concerning Europe, and consider the deeper issues – such as the economy, cultural change and trust in politics – that these trends might reflect or reveal.
Although it is frequently cited as a single, self-evident concept, ‘Euroscepticism’ takes many forms. Politically, we have witnessed the rise of Eurosceptic political parties – that is, parties with an explicit anti-EU agenda. Crucially, these parties have made recent gains both in elections to the European parliament and in national elections in member states. Political Euroscepticism is closely aligned with political populism – while populist parties are not necessarily Eurosceptic, and often embrace a variety of other populist causes or positions, in reality the bloc of Eurosceptic parties currently enjoying increased electoral favour across the continent are Eurosceptic in their stance towards the EU and further integration.1 As a result, electoral support for a Eurosceptic party – such as Ukip, in the UK – provides one indicator of public antipathy towards the European project.
More directly, various surveys of public opinion provide long-term data on shifts in attitudes towards Europe. In this report, we consider changes in the expressed level of trust in the EU, in the numbers who believe their country’s membership of the EU is a good thing, and in responses to the question of whether European integration has gone too far or should go further still. While none of these correlates to the hypothetical ‘Would you vote to leave the EU?’ question that interests those who are concerned about a potential EU membership referendum in the UK, together they provide a broad, long-term picture of public opinion and allow us to compare levels of Euroscepticism according to other demographic variables.
We also look at four countries – the UK, France, Denmark and the Netherlands – as case studies of member states where Euroscepticism has experienced electoral success to a varying extent at different times.
In this way, we can explore the factors that help to explain support for – and opposition to – European integration over the past 40 years. Europe has evolved over this time, from common market to single market to union, and expanded its borders from western Europe into the former communist states of central and eastern Europe. What determined someone’s support for Europe in the past may no longer apply now, in a different EU.
In chapter 1, we consider the state of European support in the present day, focusing on the performance of Eurosceptic parties in recent European and national elections. Crucially, we reveal that holding Eurosceptic views is not a strong predictor of electoral support for Eurosceptic parties; instead, a majority of ‘Eurosceptic voters’ continue to support mainstream political parties, and thus are larger in number than is indicated by actual votes for populist parties.
1 Integration being the process whereby economic and political institutions and functions across Europe are both brought more closely together and extended to include and work across more member states.

IPPR | Continental drift: Understanding the growth of Euroscepticism 4
In chapter 2, we consider the long-term trends in attitudes towards the European project, with a particular focus on the early 1990s, when public support for Europe entered the decline that continues to this day. By assessing support for Europe against other variables, we gauge the strength of various economic and cultural factors as predictors – and hence, as potential drivers – of Euroscepticism.
Finally, in chapter 3, we investigate the post-crash period since 2007 in more detail. Trust in the EU has collapsed in the wake of the financial crisis, and we argue that factors relating to trust in politics more generally are as strong – and in many cases stronger – than economic and cultural factors in predicting negative attitudes towards Europe. This finding carries the important implication that attempts to address or counter Euroscepticism will need to extend beyond traditionally recognised issues such as economic wellbeing and immigration in order to reassure and ‘win back’ the support of Eurosceptics across the continent.

IPPR | Continental drift: Understanding the growth of Euroscepticism 5
1. SHOCK TO THE SYSTEM: EUROSCEPTICISM IN 2014
Trust in the EU has fallen steeplyEuropean citizens have undoubtedly lost faith in the European project over recent years, since the onset of the financial crisis in 2007 and the previous round of European elections in 2009. According to the latest Eurobarometer survey, conducted in June 2014, less than one in three European citizens said that they trusted the EU – this is less than half of the level of trust that existed in 2007, prior to the crash and subsequent recession (see figure 1.1).
Not surprisingly, the countries in which this loss of faith is most apparent are those which have been most severely affected by the financial crisis and ongoing austerity measures. In Spain, where unemployment remains at an all-time high, the net loss of those trusting the EU is a staggering 49 per cent – down from 65 per cent to just 16 per cent – while Greece, Italy, Portugal and Cyprus saw net losses of between 34 and 39 per cent. Even in Germany, Europe’s strongest economy and the key creditor of the eurozone, trust collapsed from 56 per cent in 2007 to 30 per cent in 2014, making it one of the most Eurosceptic member states by this measure. In the UK, trust in the EU fell from an already-low level of 35 per cent to just 16 per cent, tied with Spain for the lowest in Europe.
Figure 1.1Trust in the EU, by member state, 2007 versus 2014
May 2007 June 2014
0%
10%
20%
30%
40%
50%
60%
70%
80%
ROLTBUMTEEFIDKBEHULTPONLHRSESILUSKFRIECZAUEUDEPTCYITELUKES
Source: Eurobarometer 67 (May 2007) and Eurobarometer 81 (June 2014) Question: ‘I would like to ask you a question about how much trust you have in certain institutions. For each of the following institutions, please tell me if you tend to trust it or tend not to trust it? [The European Union]
By this measure, Euroscepticism remains lowest (that is, trust remains highest) among citizens of central and eastern European countries that joined EU expansions over the last 10 years, such as Bulgaria, Lithuania and Romania.

IPPR | Continental drift: Understanding the growth of Euroscepticism 6
Eurosceptic parties have made strong gains among the European electorateIn May 2014, nearly 170 million voters across the continent went to the polls to participate in elections to the European parliament, the only directly elected chamber of the EU. At just over 43 per cent, turnout was low, suggesting that recent changes – for example, to elect the president of the European Commission from the largest ‘family’ of parties in the parliament – failed to reverse the long-term decline in turnout seen since the first direct elections in 1979.2
More notable, however, were the election results themselves, characterised by commentators as a ‘Eurosceptic surge’. Eurosceptic parties – that is, populist parties with an explicit anti-EU agenda – made significant gains in the parliament as a whole3 and among the representations of many countries. These insurgent parties include those of the far right, such as the Front National in France, which managed to increase its share of the vote by more than 18 percentage points, and the Danish People’s party, which improved by nearly 10 points over its previous election result. In Italy, the more centrist Five Star Movement achieved 21 per cent of the vote in its first European parliament election, while Ukip was the single most successful party in the UK, earning support of more than 27 per cent of British voters.
This ‘Eurosceptic surge’ can also be seen in the results of recent national elections, for example in Italy and the Netherlands. However, this apparent explosion in Euroscepticism – as expressed in support for ‘anti-EU’ political parties4 – has not come ‘out of nowhere’. As tables 1.1 and 1.2 show, support for Eurosceptic parties has existed since the 1980s, and in many cases has been increasing – consistently or intermittently – over the past 30 years.
Crucially, Eurosceptism is now a strong force in a number of core European member states. The UK, France, Italy, and Germany (four of the most populous member states) all now experience Euroscepticism in a party political form, and the increasing success and profile of these parties over the past decade could have a significant impact on the future of European integration. Although these parties are unlikely to make a significant impact within the European parliament itself – being largely unable to form a stable political grouping and outnumbered still by pro-European party ‘families’ – their growing influence is likely to create pressure within domestic political debates and upon national governments – and it is these national governments that ultimately direct the integration process (Heinen and Hartleb 2014).
Table 1.1Support for Eurosceptic parties in national elections, by member state, 1980–2014
1980–84 1985–89 1990–94 1995–99 2000–04 2005–10 2011–14
Austria 5.0 9.7 19.6 25.9 10.0 21.7 24.4
Belgium 1.1 1.7 7.8 10.8 13.7 10.9 –
Bulgaria – – 0.5 1.1 3.6 8.8 11.0
Croatia – – 7.1 5.0 5.8 3.5 3.0
Czech Republic – – 3.5 6.0 1.0 0.7 21.7
Denmark – – – 7.4 12 13.6 12.2
Finland – – – 0.5 1.6 4.0 19.1
France 0.4 9.7 12.7 15.3 12.2 4.3 13.6
Germany – – 2.0 3.0 0.6 0.6 4.9
2 It should be noted that the 2014 election turnout was very comparable to the 2009 election turnout (also 43 per cent).
3 Now, 140 out of 751 MEPs are from Eurosceptic parties (Barbière 2014).4 See appendix 1 for a list of political parties which, for the purposes of this chapter, are considered to
be ‘Eurosceptic’ at various national and European electoral moments. Note that, for the UK, this does not include the Conservative party.

IPPR | Continental drift: Understanding the growth of Euroscepticism 7
Greece – – – 0.2 1.4 4.8 9.2
Hungary – – 1.6 5.5 4.4 9.5 20.3
Ireland 0.3 1.0 1.6 2.5 6.5 6.9 9.9
Italy 0.6 1.3 8.7 11 4.3 7.9 29.6
Latvia – – – 14.7 5.4 7.4 13.9
Lithuania – – – – 11.4 12.7 7.3
Luxembourg 0.0 7.9 9.0 11.3 10.0 8.1 6.6
Netherlands 0.5 0.7 2.5 0.5 11.4 10.7 10.1
Portugal – – – – 0.1 0.2 0.3
Romania – – 3.9 4.5 16.3 3.2 1.2
Slovakia – – 9.1 9.1 3.3 8.4 4.6
Slovenia – – 9.9 3.2 5.4 5.4 2.0
Sweden – – 0.2 0.4 1.4 4.3 12.9
United Kingdom 0.1 – 0.2 0.4 1.7 4.0 –
Sources: See appendix 1 Note: No anti-EU parties participated in elections in Cyprus, Malta, Poland and Spain. If two elections were held in the same time period, the figure shown is the mean percentage of the two results. See appendix 1 for a full list of included parties for each country over time.
Table 1.2Support for Eurosceptic parties in European elections, by member state, 1979–2014
1979 1984 1989 1994 1999 2004 2009 2014
Austria – – – 27.5 23.4 6.3 17.3 23.0
Belgium – 1.3 4.1 10.8 10.9 17.1 11.2 4.3
Bulgaria – – – – – 14.2 12.0 6.0
Czech Republic – – – – – – 1.3 18.2
Denmark 21.0 20.8 18.9 25.5 29.2 21.1 24.8 34.7
Estonia – – – – – – – 1.3
Finland – – – 0.7 0.8 0.5 9.8 13.0
France 1.3 11.0 11.7 10.5 5.7 9.8 6.3 24.9
Germany – – 8.7 3.9 1.7 1.9 1.3 7.0
Greece – – – – 1.2 4.1 7.1 12.1
Hungary – – – – – 2.4 14.8 14.7
Ireland – 4.9 2.3 2.9 6.3 11.1 11.2 19.5
Italy – – 1.8 6.6 6.1 5.7 11.0 27.4
Latvia – – – – – 29.8 7.5 14.2
Lithuania – – – – – 6.8 12.2 14.3
Luxembourg – – – 6.9 9.0 8.0 7.4 7.5
Netherlands – 2.6 0.8 1.0 0.5 0.0 17 13.3
Portugal – – – – – – 0.4 0.5
Romania – – – – – 4.2 8.7 2.7
Slovakia – – – – – 2.0 5.6 3.6
Slovenia – – – – – 5.0 2.9 4.0
Sweden – – – – 0.3 1.1 3.3 9.7
United Kingdom – – – 1.2 7.5 21.1 22.7 28.6
Sources: See appendix 1 Note: No anti-EU parties participated in elections in Cyprus, Malta, Poland and Spain. If two elections were held in the same time period, the figure shown is the mean percentage of the two results. See appendix 1 for a full list of included parties for each country over time.
With regard to our four case study countries, table 1.2 shows that Eurosceptic parties made an early incursion into the electorates of Denmark and France, in the 1970s and ’80s, while consistent success came more recently in the Netherlands and UK, after 1990.
1980–84 1985–89 1990–94 1995–99 2000–04 2005–10 2011–14

IPPR | Continental drift: Understanding the growth of Euroscepticism 8
Eurosceptic voters predominantly support mainstream political partiesTrends in support for explicitly anti-EU political parties are a fair indicator of voter concern about European integration. However, it falls short in terms of explaining how deeply Euroscepticism permeates public attitudes, for two reasons.
First, as noted by Peter Mair (2013) and Ford and Goodwin (2014), support for populist parties is about much more than Europe and the EU – although, in practice, the vast majority of their supporters are against the idea of European integration. Instead, it is a rejection of the political class by voters who feel isolated and ‘left behind’ by mainstream political parties. From this perspective, then, the EU is a by-product of an elite political agenda which largely excludes their interests.
Second, individuals who have Eurosceptic attitudes are still overwhelmingly more likely to support a mainstream political party. Table 1.3 demonstrates this point, using national election results across our four case-study countries. Here, Euroscepticism is measured by responses to the 2012 European Social Survey, which asks people to describe their attitude to European integration on a scale of zero (integration has gone too far) to 10 (integration has not gone far enough). An individual is considered to be ‘Eurosceptic’ if they give a score of 0–3 (anti-integration), and ‘non-Eurosceptic’ if they give a score of four or more (neutral or pro-integration).5
Table 1.3Electoral support from voters with Eurosceptic and non-Eurosceptic attitudes, by party
United Kingdom (May 2010) France (June 2012)
Eurosceptic Non-Eurosceptic Eurosceptic Non-Eurosceptic
% of voters 46.2 53.8 % of voters 28.7 71.3
Conservative 41.0 29.3 Socialist Party 33.5 38.1
Labour 30.8 35.4 Union for Popular Movement
21.1 30.2
Liberal Democrat 13.6 23.7 National Front 19.3 8.4
Scottish National Party
3.0 2.1 Left Front 7.3 4.5
Plaid Cymru 2.1 0.9 Greens – Europe Ecology
2.2 4.2
Green Party 1.6 1.4 Other 12.6 12.4
Other (incl Ukip and BNP)
7.1 7.3
Denmark (September 2011) Netherlands (September 2012)
Eurosceptic Non-Eurosceptic Eurosceptic Non-Eurosceptic
% of voters 22.6 77.4 % of voters 24.6 75.4
Liberal Party 24.3 26.6 People’s Party for Freedom and Democracy
28.3 27.5
Social Democrats 22.9 28.0 Labour Party 17.3 26.1
Danish People’s Party
18.7 6.2 Party for Freedom 17.1 3.1
Socialist People’s Party
11.6 10.4 Socialist Party 12.4 8.9
Unity List 7.8 6.2 Christian Democratic Appeal
4.2 11.1
Radical Liberal Party
6.0 13.7 Democrats `66 3.0 10.8
Other 8.8 9.0 Other 17.8 12.6
Source: IPPR calculations based on European Social Survey 2012 Note: Parties classed as ‘Eurosceptic’ are shown in italics.
5 See chapter 3 for more on this measure of Euroscepticism.

IPPR | Continental drift: Understanding the growth of Euroscepticism 9
This data reveals that – at best – Eurosceptic parties have received the support of roughly one in five Eurosceptic voters. France’s National Front fare best at capturing Eurosceptic support, receiving just over 19 per cent of Eurosceptic votes. The Danish People’s party received slightly less than that in 2011, drawing 18.7 per cent of Eurosceptic voters, and Geert Wilders’ Party for Freedom received 17.1 per cent of Eurosceptic votes in the Netherlands in 2012. In the 2010 general election in the UK, Ukip and the BNP combined received significantly less than 10 per cent of all Eurosceptic votes. Unfortunately, Ukip and the BNP are not recorded separately within UK results, and so fall into the ‘Other’ category – nonetheless, this small ‘Other’ figure demonstrates that few of those with Eurosceptic attitudes voted for either party.6 By contrast, the mainstream Conservative party attracted the largest share of Eurosceptic votes, with 41 per cent. What this analysis shows is that by sheer weight of numbers, Eurosceptics who support mainstream parties have more political power than those who support Eurosceptic parties.
Much of the contemporary debate leading up to and following the 2014 European parliament election concentrated on public support for populism and what it meant for EU governance. But taking support for populist parties as a proxy for Euroscepticism effectively omits the majority of individuals with Eurosceptic views, which in turn pushes political discourse on Euroscepticism to focus primarily on the ‘populist electorate’: the predominantly white, working-class, ‘left-behind’ voter. This, we argue, could be misleading in any attempt to understand how the general public might vote on European issues or, for instance, in any referendum on the UK’s membership of the EU.
6 The more modest success of Ukip and the BNP in Britain compared to Eurosceptic parties in the other three countries may be partly attributed to the UK’s first-past-the-post electoral system, which disadvantages smaller parties (see Lodge and Gottfried 2011).
IPPR | Continental drift: Understanding the growth of Euroscepticism 10
2. END OF THE HONEYMOON: EUROSCEPTISM IN THE 1990s AND 2000s
For politicians and parties who wish to see a bright future for Europe and the European project, and that EU integration is preserved, if not grown and intensified further, a robust and appropriate response to the challenge of Euroscepticism is required. In turn, this demands a clear understanding of the underlying drivers of Eurosceptic attitudes and the issues that inform or contribute to a person’s support for or opposition to Europe.
Over the past two decades, the academic literature on the causes or contributing factors of Euroscepticism is divided. At various times, different issues are favoured or promoted as being essential to the debate. Economic factors include the effect of EU integration on trade, jobs, income and costs, with supporters emphasising the benefits of the single market and detractors emphasising the risks of ‘globalisation’ to workers poorly equipped to adapt. Cultural factors include free movement and immigration, multiculturalism and identity. In this way, the course of EU support may be seen as a continuous and complex interplay of economic and cultural factors determining increased or decreased support – and, by corollary, decreased or increased Euroscepticism. Broadly, individuals who express opposition or hostility to the EU are disproportionately those who fared less well from the structural economic changes of the last 20 years, and who are less comfortable with the higher levels of population mobility and cultural diversity which characterise an integrated Europe.
Against this backdrop, we ask whether it is possible to determine whether one set of factors (economic or cultural) is more important in determining attitudes to Europe, and thus more central to debates around Euroscepticism and EU integration or membership. Indeed, in chapter 3, we return to ask whether another, different set of factors – not precisely economic or cultural – is as if not more important in this post-crash period. Chapter 4 outlines a new story about Euroscepticism, arguing that the rise in anti-EU sentiment since the financial crash is in fact rooted in events of 25 years ago.
In this chapter, we use a measure of EU support taken from the Eurobarometer survey, which provides robust annual data on public attitudes to EU integration going back to the early 1970s. The most consistently asked question in this series asks respondents to describe their country’s membership of the EU as a ‘good thing’, ‘bad thing’ or ‘neither’.7 Here, ‘support for EU membership’ is the proportion of those who believe membership is a good thing, and net support is this number minus the proportion who believe it is a bad thing.
Support for Europe no longer correlates with economic growthFigure 2.1 shows that, through the 1970s and ’80s, net support for the EU was roughly aligned with GDP growth. Crucially, through the 1980s, support for the EU rose, at a time of sustained economic expansion, reaching a peak in the early 1990s.
7 This is frequently used to measure overall support for European integration: see for example Anderson and Reichert 1996, Gabel 1998, Anderson 1998, Carey 2002, McLaren 2006 and Serricchio et al 2013.

IPPR | Continental drift: Understanding the growth of Euroscepticism 11
Figure 2.1Net support for EU membership (left) versus GDP growth rate (right), all member states, 1973–2013
-6%
-4%
-2%
0%
2%
4%
6%
8%
0%
10%
20%
30%
40%
50%
60%
70%
2013
2011
2009
2007
2005
2003
2001
1999
1997
1995
1993
1991
1989
1987
1985
1983
1981
1979
1977
1975
1973
Net support (RHS)GDP growth rate (LHS)
Source: Eurobarometer and OECD library
After this peak, however, there is a decoupling of EU support from economic growth. After about 1992, public support dropped dramatically to its lowest level since polling began. Moreover, as economic conditions recovered through the late 1990s, EU support did not recover in step, leaving Europe even more vulnerable to the kind of hit to public confidence that was eventually provided by the financial crisis of 2007–08.
What could have sparked this divergence? Previous studies have produced little consensus view on underlying causes, and survey data gathered in this period is limited to judgments on the economic impacts of the common market. However, most commentators have focused on the signing of the Maastricht treaty in 1992, or the debate around that moment, as critical.8 The Maastricht treaty created the EU out of the old European Economic Community, strengthening Europe’s cornerstone institutions and setting in train a process of closer and closer fiscal and political integration. Arguably, it was at this point that a popular case for European integration on economic grounds gave way to a programme of wider and deeper integration that came to be perceived as an elitist exercise and thus has never enjoyed the same level of popular support. To explore this hypothesis further, we shall return to the question of elitism and political distrust in the following chapters.
Middle class voters have split from the upper-middle classThe public is in no way homogenous and integration can have different meaning for different groups within European society. Cultural perspectives, social class differences, educational attainment levels and national socioeconomic and political contexts can all contribute to variations in EU support. And, as figure 2.1 makes clear, time is clearly a factor. Groups who perceive themselves as ‘losers’ of integration today may not have done so a number of years ago, and the lens through which they see and judge integration may no longer be the same.9
8 See for example Franklin et al 1994, Eichenberg and Dalton 2007, Hooghe and Marks 2009.9 See for example Kriesi et al 2008.

IPPR | Continental drift: Understanding the growth of Euroscepticism 12
One important and illustrative case is provided by the middle class and its changing attitude to Euroscepticism. We analysed responses to the Eurobarometer question (‘is EU membership a good thing?’) by class, defined as upper-middle (professional and high managerial occupations), middle (middle management, clerical or administrative occupations) and working class (all manual and unskilled occupations).10
Our analysis shows that, broadly speaking, in the 1970s and ’80s, the upper-middle and middle classes were relatively united in their support for EU membership across the population, compared with relatively strong opposition among the working class. Since the early 1990s, however, middle class respondents have expressed reduced EU support and thus, as shown in figure 2.2, their net level of support has moved closer to that of working class than upper-middle class respondents.
Figure 2.2Net support for EU membership by class, 1973–2011
Upper middle class Middle class Working class
0%
10%
20%
30%
40%
50%
60%
70%
80%
2011
2009
2007
2005
2003
2001
1999
1997
1995
1993
1991
1989
1987
1985
1983
1981
1979
1977
1975
IPPR calculations based on Eurobarometer
Through the late 1970s and 1980s, the net level of EU support was roughly 20–25 percentage points lower among working class respondents than among the middle and upper-middle classes. In the mid-1980s, however, middle class support began to detach from the upper-middle class; by 1993, when overall support began to decline dramatically (as in figure 2.1), the middle class no longer resembled the upper-middle class in its views on integration. Since 2005, shortly after the new A8 accession countries gained membership status,11 middle class support has more closely resembled the working class view.
Given the size and electoral significance of the middle class across the developed economies of Europe, including the UK, understanding the role of class in attitudes towards the EU is important in forming a clear picture of the issue. The decoupling of middle class support from upper-middle class support suggests that the EU
10 Due to sample size restrictions and changing occupational codes over time within the Eurobarometer data, these three categories were created to achieve the most reliable figures. Where an individual was unemployed or retired, we used the last occupation held.
11 The ‘A8’ countries are the Czech Republic, Estonia, Hungary, Latvia, Lithuania, Poland, Slovakia and Slovenia.

IPPR | Continental drift: Understanding the growth of Euroscepticism 13
has become more vulnerable to Euroscepticism. It is also noteworthy that the convergence between support levels across all three groups occurred around 1989–91 and, in the UK and Netherlands at least, again in 2004. The financial crisis, however, seems to have reopened differences in attitudes between classes.
With variations, similar patterns of decoupling between the upper-middle and middle classes are seen in our four case study countries (see figure 2.3).
Figure 2.3Net support for EU membership by class, selected countries, 1973–2011
-60%
-40%
-20%
0%
20%
40%
60%
80%
2011
2007
2003
1999
1995
1991
1987
1983
1979
1975
0%
10%
20%
30%
40%
50%
60%
70%
80%
90%
2011
2007
2003
1999
1995
1991
1987
1983
1979
1975
-40%
-20%
0%
20%
40%
60%
80%
2011
2007
2003
1999
1995
1991
1987
1983
1979
1975
30%
40%
50%
60%
70%
80%
90%
100%
2011
2007
2003
1999
1995
1991
1987
1983
1979
1975
Upper middle class Middle class Working class
UK France
Denmark Netherlands
IPPR calculations based on Eurobarometer
In the UK, the upper-middle class and the middle class shared similar levels of EU support from 1980 through 1988 before diverging; by 1993, the middle class view had become more similar to that of the working class. By 2005, middle class and working class support were often identical to one another, and after the financial crisis support among both the middle and working classes reduced at a faster rate than among the upper-middle class. In 2011 the middle class was in fact less supportive of Europe – more Eurosceptical – than the working class.
In France, the divergence between the upper-middle class and other two class groups is even starker, following a break in the late 1980s. By 2011, EU support among the upper-middle class is almost 30 percentage points higher than among the middle and working classes.

IPPR | Continental drift: Understanding the growth of Euroscepticism 14
In Denmark – unique among the four case study countries in experiencing an overall increase in net EU support – the middle class view has generally been more similar to that of the working class, but the difference between all three class groups has reduced over time. That’s to say, the significance of class in predicting EU support has become weaker, including in the years following the financial crisis.
In the Netherlands, differences in support between classes have generally been small – indeed, in the late 1970s and early 1980s there were several periods when the middle class was actually more positive towards integration than the upper-middle class. Middle class opinion eventually decoupled from the upper-middle class view in 2001, and since the financial crisis support levels across the three class groups have both declined and become more different.
Education has become a stronger predictor of EuroscepticismAs with class, we analysed support for the EU against educational attainment, divided into three levels as follows: educated to the age of 15 (equivalent to secondary education), 16–19 (equivalent to sixth form), and beyond 20 years of age (equivalent to or beyond degree-level, including equivalent vocational training).
Figure 2.4Net support for EU membership by educational attainment, 1973–2011
20+ years 16–19 years Up to 15 years
0%
10%
20%
30%
40%
50%
60%
70%
80%
2011
2009
2007
2005
2003
2001
1999
1997
1995
1993
1991
1989
1987
1985
1983
1981
1979
1977
1975
1973
IPPR calculations based on Eurobarometer
Our analysis shows the changing significance of educational attainment over time. In the 1970s, EU support differed markedly by education level, with a gap of nearly 30 percentage points in net support between those in the lower and higher educational groups. As with class, these differences closed up over time, converging at around 1989–91, with EU support among the lower educational group rising quickly to ‘catch up’ with the already-high levels of support among the middle and higher groups. After 1992, as overall EU support declined, support declines across all three groups, and begins to diverge by around 1995. Now, as shown in figure 2.4, in the wake of the financial crisis and subsequent recession, levels of EU support clearly differ, with the overall pattern reflecting that of the 1970s. In short, educational attainment has once again become a strong predictor of Euroscepticism: unlike in the 1990s, graduates are now significantly more likely to express support for the EU than those who have spent fewer years in education.

IPPR | Continental drift: Understanding the growth of Euroscepticism 15
Looking at our four case study countries, we can see some variation in the signifi-cance of educational attainment to views on European integration.
Figure 2.5Net support for EU membership by educational attainment, selected countries, 1973–2011
-60%
-40%
-20%
0%
20%
40%
60%
80%
100%
2011
2007
2003
1999
1995
1991
1987
1983
1979
1975
-20%
-10%
0%
10%
20%
30%
40%
50%
60%
70%
80%
90%
2011
2007
2003
1999
1995
1991
1987
1983
1979
1975
-20%
-10%
0%
10%
20%
30%
40%
50%
60%
70%
2011
2007
2003
1999
1995
1991
1987
1983
1979
1975
0%
10%
20%
30%
40%
50%
60%
70%
80%
90%
100%
2011
2007
2003
1999
1995
1991
1987
1983
1979
1975
20+ years 16–19 years Up to 15 years
UK France
Denmark Netherlands
IPPR calculations based on Eurobarometer
In the UK, there has been clear variation between educational groups over time, with only slight convergence in the early 1990s. More significantly, the lower educational group has, for much of the past four decades, had a net negative level of EU support – that is, with only one durable exception in the early 1990s, more people in this group have thought that EU membership is a bad thing than a good thing. Moreover, since 2004 only the higher education group has had a net positive level of support, with both other groups – together representing the majority of the electorate – maintaining sub-zero levels of net support.
In France, with the exception of a conspicuous jump and convergence in support in 2007, the trend has been for levels of support across all three groups to decrease and to diverge, with loss of support being greater in the lower and middle educational groups.
In Denmark and the Netherlands, by contrast, there has been less variation in EU support by educational level over the 40-year period. In both cases, however, the
IPPR | Continental drift: Understanding the growth of Euroscepticism 16
greatest divergence has appeared in recent years, since the financial crisis, and EU support among the higher educational group is markedly higher than among the other two groups.
Euroscepticism has intensified among those who feel ‘cultural threat’The rise in Euroscepticism from the early 1990s – particularly among key indicator groups like the middle class and lower educational group – left popular support for the European project vulnerable to the shocks of an economic crisis. In addition to its own disruptive effects, the 2007–08 crash also followed on the heels of the large wave of intra-EU migration that followed the A8 expansion.
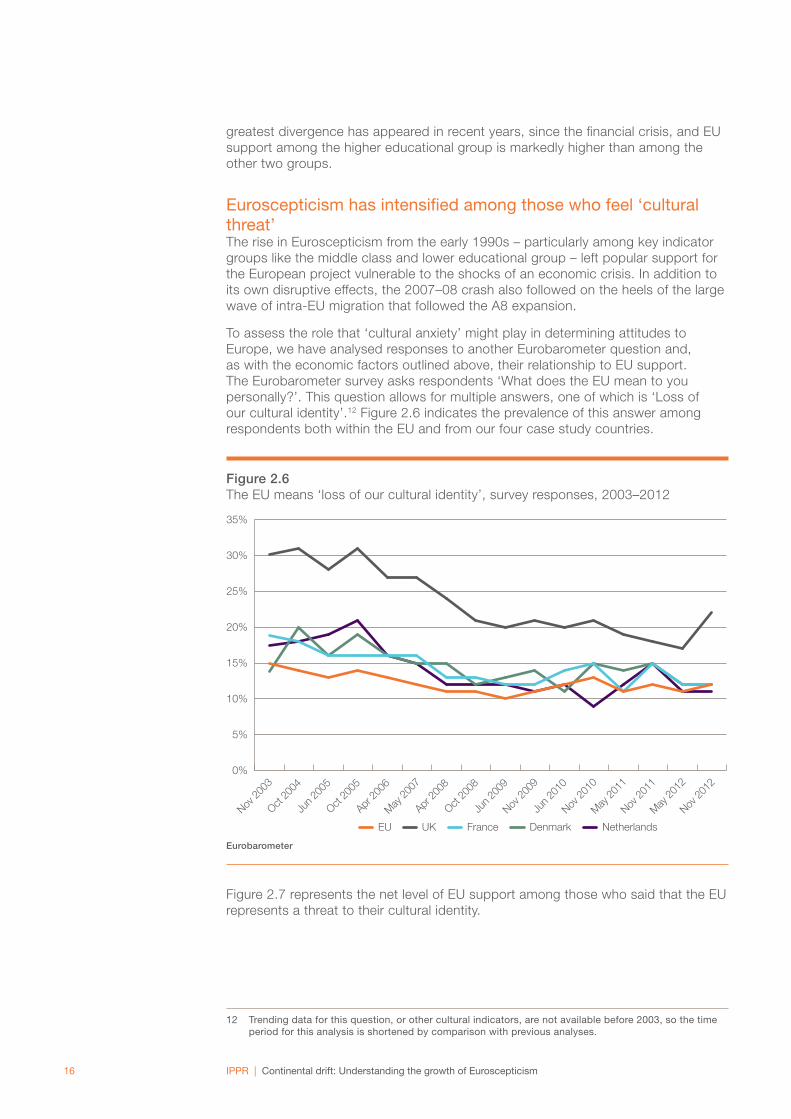
To assess the role that ‘cultural anxiety’ might play in determining attitudes to Europe, we have analysed responses to another Eurobarometer question and, as with the economic factors outlined above, their relationship to EU support. The Eurobarometer survey asks respondents ‘What does the EU mean to you personally?’. This question allows for multiple answers, one of which is ‘Loss of our cultural identity’.12 Figure 2.6 indicates the prevalence of this answer among respondents both within the EU and from our four case study countries.
Figure 2.6The EU means ‘loss of our cultural identity’, survey responses, 2003–2012
EU UK France Denmark Netherlands
0%
5%
10%
15%
20%
25%
30%
35%
Nov 20
12
May 20
12
Nov 20
11
May 20
11
Nov 20
10
Jun 2
010
Nov 20
09
Jun 2
009
Oct 20
08
Apr 20
08
May 20
07
Apr 20
06
Oct 20
05
Jun 2
005
Oct 20
04
Nov 20
03
Eurobarometer
Figure 2.7 represents the net level of EU support among those who said that the EU represents a threat to their cultural identity.
12 Trending data for this question, or other cultural indicators, are not available before 2003, so the time period for this analysis is shortened by comparison with previous analyses.

IPPR | Continental drift: Understanding the growth of Euroscepticism 17
Figure 2.7Net support for EU membership among those who perceive a cultural threat, 2003–2011
EU UK France Denmark Netherlands
-80%
-60%
-40%
-20%
0%
20%
40%
60%
80%
2011
2010
2009
2008
2007
2006
2005
2004
2003
IPPR calculations based on Eurobarometer
Unsurprisingly, the level of support for EU membership across the whole population is low among those who perceive a cultural threat, hovering around or below zero throughout this period. Of our four case study countries, only in the Netherlands has net EU support remained positive among those who perceive a cultural threat, although this has been in long-term decline since 2005. The cultural effect is strongest in the UK, where people are most likely to perceive the cultural threat, and where those people have the lowest levels of net EU support, falling to -55 per cent by 2011.
Despite an increase in Euroscepticism in both the EU and in the Netherlands after 2007, the evidence is not conclusive in the UK, France and Denmark to show that the cultural threat factor increased Euroscepticism in the wake of the financial crisis. In fact, the number of people mentioning that they fear a loss of cultural identity due to the EU was actually lower in the period after 2007 than it was before (see figure 2.6). This suggests that although there are fewer people who perceive the EU to be a cultural threat after the crisis than before, Euroscepticism among those who do has slightly intensified.

IPPR | Continental drift: Understanding the growth of Euroscepticism 18
3. EUROSCEPTISM AFTER THE CRASH: FINDING NEW EXPLANATIONS FOR ANTI-EU ATTITUDES
To gain a better understanding of the factors that may have driven the recent rise of Euroscepticism outlined in chapter 1, we constructed an analytical model based on data from the 2012 European Social Survey. Here we use the measure of Euroscepticism introduced in table 1.3: that is, individuals are considered to be Eurosceptic if they answered 0–3 when asked to describe their attitude to European integration on a scale of zero (integration has gone too far) to 10 (integration has not gone far enough). The binary logistic regression model allows us to isolate different variables, in each of our four case study countries, to provide a sense of how important they are in driving respondents’ views of Europe.13
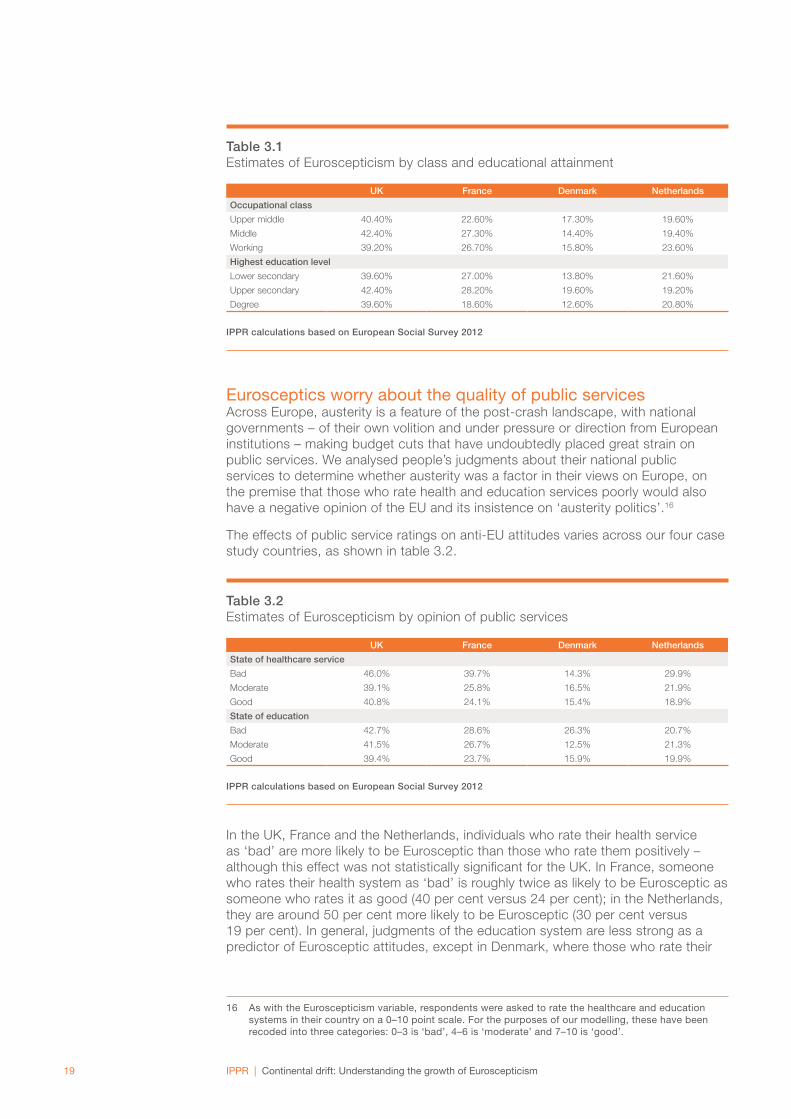
Class and education are relatively weak predictors of EuroscepticismOur analysis did not find that class was a strong factor in driving anti-EU sentiment in our four case study countries.14 As shown in table 3.1, the variation between classes in each country is low, a finding which is reinforced by the lack of statistical significance (see appendix 2) for any class as a predictor of Euroscepticism. In the UK and France, the middle class is more likely to be Eurosceptic, but only by one or two percentage points. At first glance, this is interesting in light of the findings of the previous chapter, which showed the decoupling of middle class attitudes from upper-middle class attitudes and the trend of the middle and working classes becoming more Eurosceptic over the past 10 years. The small difference between the estimates and the lack of statistical significance in the model may be a result of the converging of Eurosceptic attitudes between the two largest class groups (the working and middle classes). This suggests that class is not sufficient by itself to explaining Euroscepticism.
Education is a slightly stronger factor than class, particularly in France and Denmark.15 In France, those who hold a degree were least likely to be Eurosceptic, while in Denmark those with either a low or high level of education were less likely to be Eurosceptic than those with mid-level (upper-secondary) education. This implies that, although education has some influence in explaining Eurosceptic attitudes, this may not be an economic calculation, given that we find no statistically significant effect with class.
13 In order to isolate the impact of each specific variable, the estimate figures for ‘being Eurosceptic’ were calculated by holding other values at their mean level. This means that the probability of being Eurosceptic would in fact be even higher in cases where multiple ‘Euroscepticism-boosting’ variables are combined. See appendix 2 for more detail on the modelling used in this chapter.
14 Class is defined as in chapter 2: that is, in three tiers by current or latest occupation.15 Education level is defined as in chapter 2: this is, in three tiers equivalent to secondary, upper-
secondary and post-secondary education.
IPPR | Continental drift: Understanding the growth of Euroscepticism 19
Table 3.1Estimates of Euroscepticism by class and educational attainment
UK France Denmark Netherlands
Occupational class
Upper middle 40.40% 22.60% 17.30% 19.60%
Middle 42.40% 27.30% 14.40% 19.40%
Working 39.20% 26.70% 15.80% 23.60%
Highest education level
Lower secondary 39.60% 27.00% 13.80% 21.60%
Upper secondary 42.40% 28.20% 19.60% 19.20%
Degree 39.60% 18.60% 12.60% 20.80%
IPPR calculations based on European Social Survey 2012
Eurosceptics worry about the quality of public servicesAcross Europe, austerity is a feature of the post-crash landscape, with national governments – of their own volition and under pressure or direction from European institutions – making budget cuts that have undoubtedly placed great strain on public services. We analysed people’s judgments about their national public services to determine whether austerity was a factor in their views on Europe, on the premise that those who rate health and education services poorly would also have a negative opinion of the EU and its insistence on ‘austerity politics’.16
The effects of public service ratings on anti-EU attitudes varies across our four case study countries, as shown in table 3.2.
Table 3.2Estimates of Euroscepticism by opinion of public services
UK France Denmark Netherlands
State of healthcare service
Bad 46.0% 39.7% 14.3% 29.9%
Moderate 39.1% 25.8% 16.5% 21.9%
Good 40.8% 24.1% 15.4% 18.9%
State of education
Bad 42.7% 28.6% 26.3% 20.7%
Moderate 41.5% 26.7% 12.5% 21.3%
Good 39.4% 23.7% 15.9% 19.9%
IPPR calculations based on European Social Survey 2012
In the UK, France and the Netherlands, individuals who rate their health service as ‘bad’ are more likely to be Eurosceptic than those who rate them positively – although this effect was not statistically significant for the UK. In France, someone who rates their health system as ‘bad’ is roughly twice as likely to be Eurosceptic as someone who rates it as good (40 per cent versus 24 per cent); in the Netherlands, they are around 50 per cent more likely to be Eurosceptic (30 per cent versus 19 per cent). In general, judgments of the education system are less strong as a predictor of Eurosceptic attitudes, except in Denmark, where those who rate their
16 As with the Euroscepticism variable, respondents were asked to rate the healthcare and education systems in their country on a 0–10 point scale. For the purposes of our modelling, these have been recoded into three categories: 0–3 is ‘bad’, 4–6 is ‘moderate’ and 7–10 is ‘good’.

IPPR | Continental drift: Understanding the growth of Euroscepticism 20
education system as bad are clearly more likely to be Eurosceptic compared to those who rate it as good (26 per cent versus 16 per cent).
This analysis shows that there is a relationship between believing your country’s public services are deteriorating and Euroscepticism, with the implication that, should the EU continue to push the austerity agenda, levels of Euroscepticism within the wider population could continue to rise.
Attitudes to immigration are a significant driver of attitudes to EuropeThe European Social Survey allows us to analyse Euroscepticism in terms attitudes to immigration in two ways: economic and cultural. The survey asks respondents the following pair of questions:
• ‘Would you say it is generally bad or good for [your country]’s economy that people come to live here from other countries?’
• ‘Would you say that [your country]’s cultural life is generally undermined or enriched by people coming to live here from other countries?’
Our analysis uncovered a strong relationship between negative attitudes to immigration and negative attitudes to European integration, across the four countries in our study, as shown in table 3.3. This finding aligns with previous studies showing that immigration is a key predictor of anti-EU sentiment.
Crucially, in the UK, a sense that immigration has a negative cultural effect is more strongly related to anti-EU attitudes than perceptions of negative economic consequences of EU integration: concern on economic grounds equates to a 47 per cent chance of being Eurosceptic, while concern on cultural grounds raises this likelihood to 57 per cent. In France, Denmark and the Netherlands, however, the economic and cultural effects of immigration carry roughly equal weight; in the latter two countries, believing that immigration is a bad thing (on either economic or cultural grounds) more than doubles the likelihood that a person is hostile to the EU.
Table 3.3Estimates of Euroscepticism by attitude to immigration
UK France Denmark Netherlands
Immigration effect on economy
Bad 46.8% 32.8% 28.8% 36.7%
Neither 43.7% 22.9% 14.2% 19.3%
Good 28.3% 24.7% 11.1% 15.6%
Immigration effect on culture
Undermines 57.2% 33.2% 27.7% 37.9%
Neither 35.8% 23.7% 17.5% 20.4%
Enriches 34.2% 23.8% 12.5% 18.5%
IPPR calculations based on European Social Survey 2012
A distrust of politics is the strongest predictor of EuroscepticismAs noted in chapter 1, the political growth of Euroscepticism is largely described by the increased electoral success of populist parties in national and European elections. Populist parties, in addition to an anti-EU agenda, also tend to represent an opposition to traditional or mainstream politics and politicians, and therefore attract voters who share that hostility to ‘the establishment’ (Ford and Goodwin 2014). As a result, we would expect our analysis to show a strong relationship

IPPR | Continental drift: Understanding the growth of Euroscepticism 21
between negative perceptions of national (mainstream) political parties and national democracy on one hand, and Eurosceptic attitudes on the other.
The European Social Survey asks respondents the following pair of questions:
• ‘Please tell me on a score of 0–10 how much you personally trust each of the institutions I read out. 0 means you do not trust an institution at all, and 10 means you have complete trust … [political parties.]’17
• ‘On the whole, how satisfied are you with the way democracy works in [your country]? 0 means extremely dissatisfied and 10 means extremely satisfied.’18
As shown in table 3.4, our findings confirm our hypothesis. First, those who lack trust in their national political parties are far more likely to be Eurosceptic than those who do not. This is the case across all four case study countries: in Denmark and the Netherlands, the likelihood of being Eurosceptic for those who have ‘no or little trust’ in political parties is almost three times greater than it is for those who ‘mostly trust’ their political parties. Across the board, the impact of distrust as a factor in Euroscepticism is closely comparable with that of negative attitudes to immigration; only in the UK is low party trust markedly outweighed by another factor (that is, cultural concerns about immigration).
Second, democratic dissatisfaction is also a strong predictor of Euroscepticism, though with different characteristics between the case study countries. In France, Denmark and the Netherlands, those who are ‘mostly dissatisfied’ with their national democracy are more likely to be Eurosceptic, although this effect is weaker in France. In the UK, however, those who are ‘mostly satisfied’ with the national democracy are the most likely to be Eurosceptic, and those who are ambivalent are least likely. While the reasons for this apparent ‘switching’ are unclear, it may be that those who believe in British democracy are concerned by the EU’s apparent infringement upon the powers and sovereignty of the Westminster parliament.
Table 3.4Estimates of Euroscepticism by attitude to political parties and democracy
UK France Denmark Netherlands
Trust in political parties
No or little trust 48.2% 32.7% 27.7% 36.5%
Moderate trust 37.0% 19.6% 16.7% 20.0%
Mostly trust 26.6% 14.6% 9.6% 13.5%
Democratic satisfaction
Dissatisfied 41.4% 30.5% 27.1% 32.3%
Neither 36.3% 23.6% 12.2% 22.4%
Satisfied 45.5% 26.6% 16.1% 18.0%
IPPR calculations based on European Social Survey 2012
Increasing resentment towards national politics will undoubtedly have profound consequences for the future of European integration – and not just because it lead to increased support for anti-EU parties. Increasingly, if membership of the EU is put to a public referendum, as may occur in the UK, then citizens will be more likely to reject the position and arguments of any mainstream party. We can only guess at the struggle that lies ahead for David Cameron if an ‘in/out’ referendum on EU membership was to go ahead.
17 For the purposes of our modelling, this has been recoded into three categories: 0–3 is ‘little or no trust’, 4–6 is ‘moderate trust’ and 7–10 is ‘mostly trust’.
18 For the purposes of our modelling, this has been recoded into three categories: 0–3 is ‘mostly dissatisfied’, 4–6 is ‘ambivalent’ and 7–10 is ‘mostly satisfied’.

IPPR | Continental drift: Understanding the growth of Euroscepticism 22
4. CONCLUSIONS: A NEW STORY ABOUT EUROSCEPTICISM
Our analysis provides a telling account of Euroscepticism in the post-financial crisis world. Economic factors still have some ability to predict anti-EU attitudes, but they are significantly outweighed by concerns about immigration and distrust of mainstream political parties. This broadly endorses the view that Euroscepticism today is more about ‘mood’ than money (Ritzen et al 2014).
Populist and anti-EU parties were able to thrive off this feeling in the last European election, albeit with large support from the working class. Crucially, while class may be a useful indicator of populist party support, our analysis shows that Euroscepticism echoes beyond class divides and strict party loyalties. This is a wake-up call to all pro-Europeans: although most Eurosceptics have not yet voted for an anti-EU party, they are likely to share many of the same reasons for disliking the European project as those who have.
The recent surge in electoral support for anti-EU and populist parties is an indication that growing numbers of people are dissatisfied with the political elite. We argue that public attitudes towards Europe are more complex following the financial crisis – and that this is the extension of trends that have been emerging since the mid-1990s. Where it was originally conceived as a largely economic project, the politicisation of Europe in the 1990s opened up the EU to criticism within the national discourse of member states. As the public grew increasingly wary of European integration, the political elite instead pushed forward and intensified it. By 1996, the evidence shows a clear divide between elite and public attitudes to the EU: a poll conducted in that year found that 94 per cent of Europe’s political, media and cultural elites considered their country’s membership of the EU to be a ‘good thing’, almost twice the general public’s level of approval (48 per cent)(Spence 1996).19 Europe was swiftly becoming the symbolic project of the elite – an elite that the public have come more and more to deeply doubt. Peter Mair, among others, argues that support for populist parties is a result of the ‘depoliticisation’ of policy activity – that significant policy decisions are now made (and seen to be made) not by democractically accountable representatives but by unelected technocrats, whether in national central banks or the European Commission (Mair 2013). This political and democratic ‘void’ creates an opportunity for populism and, thus, for hostility to Europe to spread.
The financial crisis may have created the perfect storm for Euroscepticism. By 2007, a perceived threat to cultural identity and unease with immigration were already significant drivers towards Euroscepticism. After 2007, it became clear that Europe could no longer guarantee economic security – and the response from Europe’s elites was to integrate further still. In this light, then, and based on our new analysis, we contend that anger about mainstream politics is now one of the most significant factors underpinning Eurosceptic attitudes, and thus is of paramount interest and importance to those who would seek to protect and enhance the European project in the years ahead.
19 Among the elites, just 2 per cent thought EU membership was a ‘bad thing’ for their country, compared with 28 per cent of the general public.

IPPR | Continental drift: Understanding the growth of Euroscepticism 23
REFERENCES
Anderson C (1998) ‘When in Doubt, Use Proxies: Attitudes Toward Domestic Politics and Support for European Integration’, Comparative Political Studies, 31: 569–601
Anderson C and Reichert MS (1996) ‘Economic Benefits and Support for Membership in the E.U: A Cross-National Analysis’, Journal of Public Policy, 15: 231–249
Barbière C (2014) ‘Eurosceptic MEPs will have “marginal” influence in EU Parliament’, EurActiv website, 25 May 2014. http://www.euractiv.com/sections/eu-elections-2014/eurosceptic-meps-will-have-marginal-influence-eu-parliament-302482
Carey S (2002) ‘Undivided Loyalties: Is National Identity an Obstacle to European Integration?’ European Union Politics, 3: 387–413
Eichenberg R and Dalton R (2007) ‘Post-Maastricht Blues: The Transformation of Citizen Support for European Integration, 1973–2004’, Acta Politica, 42: 128–152
Ford R and Goodwin M (2014) Revolt to the right: Explaining support for the radical right in Britain, Abingdon: Routledge
Franklin M, Marsh M and McLaren L (1994) ‘Uncorking the bottle: Popular opposition to European unification in the wake of Maastricht’, Journal of Common Market Studies, 32(4): 455–472
Gabel M (1998a) Interests and Integration. Market Liberalization, Public Opinion, and European Union, Ann Arbor: University of Michigan Press
Gabel M (1998b) ‘Public Support for European Integration: An Empirical Test of Five Theories’, Journal of Politics, 60(2): 333–354
Heinen N and Hartleb F (2014) Euroscepticism gaining currency? Implications of the EU elections for economic policy, EU Monitor European integration, Frankfurt: Deutsche Bank Research. http://www.dbresearch.com/PROD/DBR_INTERNET_EN-PROD/PROD0000000000332443/Euroscepticism+gaining+currency%3F+Implications+of+the+EU+elections+for+economic+policy.PDF
Hooghe L and Marks G (2009) ‘A postfunctionalist theory of European integration: From permissive consensus to constraining dissensus’, British Journal of Political Science, 39(1): 1–23
Kriesi H, Grande E, Lachat R, Dolezal M, Bornschier S and Frey T (2008) ‘Globalization and its Impact on National Spaces of Competition’, in Kriesi H et al, West European Politics in the Age of Globalization, Cambridge: Cambridge University Press
Lodge G and Gottfried G (2011) Worst of both worlds: Why first past the post no longer works, London: IPPR. www.ippr.org/publications/worst-of-both-worlds-why-first-past-the-post-no-longer-works
Mair P (2013) The hollowing of western democracy, London: Verso
McLaren L (2006) Identity, interests and attitudes to European integration, Basingstoke: Palgrave Macmillan
Mudde C (2007) Populist radical right parties in Europe, Cambridge: Cambridge University Press

IPPR | Continental drift: Understanding the growth of Euroscepticism 24
Ritzen J, Zimmermann K and Wehner C (2014) ‘Euroskepticism in the Crisis: More Mood than Economy’, discussion paper no 8001, Bonn: Institute for the Study of Labor (IZA)
Serricchio F, Tsakatika M and Quaglia L (2013) ‘Euroscepticism and the Global Financial Crisis’, Journal of Common Market Studies, 51(1): 51–64
Spence J (1997) The European Union: A View from the Top, Wavre, Belgium: EOS Gallup Europe

IPPR | Continental drift: Understanding the growth of Euroscepticism 25
APPENDIX 1: EUROSCEPTIC PARTIES IN NATIONAL AND EUROPEAN ELECTIONS
Tables 1.1 and 1.2 present data on the vote share of populist parties within national parliamentary elections (1980–2014) and European parliamentary elections (1979–2014). The figures between 1979 and 2010 for the EU15 member states are taken from Peter Mair (2013: 112–113).
Mair based his inclusion of these parties on the three populist characteristics defined by Cas Mudde (2007):
• an ideology of nativism or belief in a homogeneous state
• authoritarianism and the desire for an ordered society
• the belief that two groups are pitted against each other within society – in simple terms ‘the pure’ versus ‘the corrupt elite’.
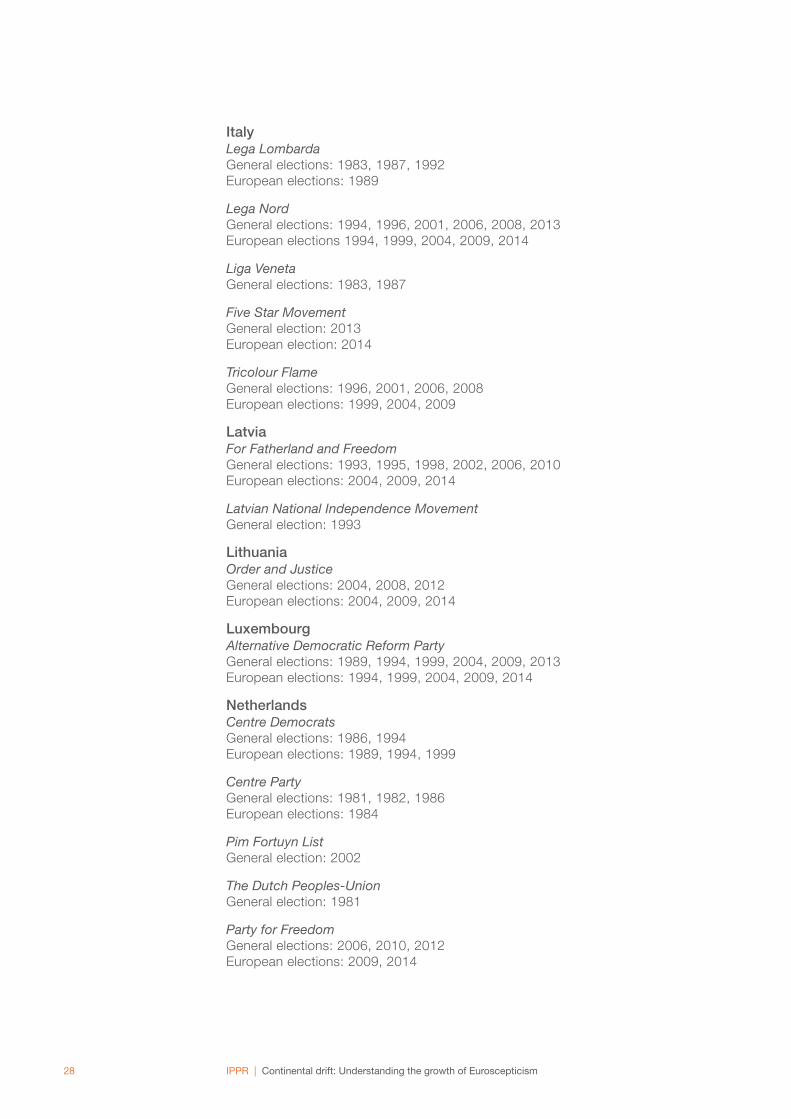
It is important to note that not all parties in this list are politically on the far right (such as the Five Star Movement in Italy and Ukip in the UK); however, they share most characteristics in Mudde’s definition. Although these parties are not exclusively single-issue anti-EU (though some are), all have in common their support for significant regression in or abolishment of EU authority over national politics. Using Mair’s selected parties and Mudde’s definition as a guideline, we have extended the data to cover the years 2011–2014 for the EU15 member states, and the 13 new accession states between 1990–2014.
List of ‘Eurosceptic parties’AustriaAlliance for the Future of AustriaGeneral elections: 2006, 2008, 2013 European elections: 2009, 2014
Freedom Party of AustriaGeneral elections: 1983, 1986, 1994, 1995, 1999, 2002, 2006, 2008, 2013 European elections: 1996, 1999, 2004, 2009, 2014
EU-STOPEuropean election: 2014
BelgiumAgirGeneral election: 1991
Front NationalGeneral elections: 1991, 1995, 1999, 2003 European elections: 1994, 1999, 2004, 2009
Vlaams BelangGeneral elections: 2007, 2010, 2014 European elections: 2009, 2014

IPPR | Continental drift: Understanding the growth of Euroscepticism 26
Vlaams BlokGeneral elections: 1981, 198, 1987, 1991, 1995, 1999, 2003 European elections: 1984, 1989, 1994, 1999, 2004
BulgariaAttackGeneral elections: 2005, 2010, 2013 European elections: 2007, 2009, 2014
Bulgarian National MovementGeneral election: 2001 European elections: 2009, 2014
Bulgarian National Radical PartyGeneral elections: 1991, 1994, 1997, 2001
Croatia Croatian Party of RightsGeneral elections: 1992, 1995, 2000, 2003, 2007, 2011
Czech RepublicAction of Dissatisfied CitizensGeneral election: 2013 European election: 2014
Party of Free CitizensGeneral elections: 2010, 2013 European elections: 2009, 2014
Rally for the RepublicGeneral election: 1992
Republicans of Miroslav SládekGeneral elections: 1996, 1998, 2002
DenmarkDanish People’s PartyGeneral elections: 1998, 2001, 2005, 2007, 2011 European elections: 1999, 2004, 2009, 2014
People’s Movement against the EUEuropean elections: 1979, 1984, 1989, 1994, 1999, 2004, 2009, 2014
June MovementEuropean elections: 1994, 1999, 2004, 2009
EstoniaEstonian Independence PartyEuropean election: 2014
FinlandFinns PartyEuropean election: 2014
True FinnsGeneral elections: 1999, 2003, 2007, 2011 European elections: 1996, 1999, 2004, 2009

IPPR | Continental drift: Understanding the growth of Euroscepticism 27
FranceFront NationalGeneral elections: 1981, 1986, 1988, 1993, 1997, 2002, 2007, 2012 European elections: 1979, 1984, 1989, 1994, 1999, 2004, 2009, 2014
National Republican MovementGeneral election: 2002
GermanyAlternative for GermanyGeneral election: 2013 European election: 2014
German People’s UnionGeneral election: 1998 European election: 1989
RepublicansGeneral elections: 1990, 1994, 1998, 2002, 2005, 2007, 2009, 2013 European elections: 1989, 1994, 1999, 2004, 2009
GreeceFront LineGeneral election: 2000
Golden DawnGeneral election: 2012 European election: 2014
Hellenic FrontGeneral election: 2000 European election: 1999
Popular Orthodox RallyGeneral elections: 2004, 2007, 2009, 2012 European elections: 2004, 2009, 2014
Party of HellenismGeneral election: 1996, 2000 European election: 1999
HungaryHungarian Justice and Life PartyGeneral elections: 1994, 1998, 2002, 2010 European election: 2004
Hungarian Justice and Life Party–Jobbik Third Way AllianceGeneral election: 2006
JobbikGeneral election: 2010, 2014 European elections: 2009, 2014
IrelandSinn FéinGeneral election: 1992, 1997, 2002, 2007, 2011 European elections: 1984, 1989, 1994, 1999, 2004, 2009, 2014
IPPR | Continental drift: Understanding the growth of Euroscepticism 28
ItalyLega LombardaGeneral elections: 1983, 1987, 1992 European elections: 1989
Lega NordGeneral elections: 1994, 1996, 2001, 2006, 2008, 2013 European elections 1994, 1999, 2004, 2009, 2014
Liga VenetaGeneral elections: 1983, 1987
Five Star MovementGeneral election: 2013 European election: 2014
Tricolour FlameGeneral elections: 1996, 2001, 2006, 2008 European elections: 1999, 2004, 2009
LatviaFor Fatherland and FreedomGeneral elections: 1993, 1995, 1998, 2002, 2006, 2010 European elections: 2004, 2009, 2014
Latvian National Independence MovementGeneral election: 1993
LithuaniaOrder and JusticeGeneral elections: 2004, 2008, 2012 European elections: 2004, 2009, 2014
LuxembourgAlternative Democratic Reform PartyGeneral elections: 1989, 1994, 1999, 2004, 2009, 2013 European elections: 1994, 1999, 2004, 2009, 2014
NetherlandsCentre DemocratsGeneral elections: 1986, 1994 European elections: 1989, 1994, 1999
Centre PartyGeneral elections: 1981, 1982, 1986 European elections: 1984
Pim Fortuyn ListGeneral election: 2002
The Dutch Peoples-UnionGeneral election: 1981
Party for FreedomGeneral elections: 2006, 2010, 2012 European elections: 2009, 2014

IPPR | Continental drift: Understanding the growth of Euroscepticism 29
PortugalNational Renovator PartyGeneral elections: 2002, 2005, 2009, 2011 European elections: 2009, 2014
RomaniaGreater Romania PartyGeneral elections: 1992, 1996, 2000, 2004, 2008, 2012 European elections: 2007, 2009, 2014
SlovakiaSlovak National PartyGeneral elections: 1990, 1992, 1994, 1998, 2002, 2006, 2010, 2012 European elections: 2004, 2009, 2014
SloveniaSlovenian National PartyGeneral elections: 1992, 1996, 2000, 2004, 2008, 2011, 2014 European elections: 2004, 2009, 2014
SwedenSwedish DemocratsGeneral elections: 1991, 1994, 1998, 2002, 2006, 2010 European elections: 1999, 2004, 2009, 2014
United KingdomBritish National PartyGeneral elections: 1992, 1997, 2001, 2005, 2010 European elections: 1999, 2004, 2009, 2014
National FrontGeneral elections: 1983, 1992
United Kingdom Independence PartyGeneral elections: 1997, 2001, 2005, 2010 European elections: 1994, 1999, 2004, 2009, 2014
Election dataElection data is available at:
• IPU Parline Database on National Parliaments: www.ipu.org/parline/parlinesearch.asp
• NSD European Elections database: www.nsd.uib.no/european_election_database/
• Parlgov database: http://www.parlgov.org/stable/index.html
IPPR | Continental drift: Understanding the growth of Euroscepticism 30
APPENDIX 2: BINARY LOGISTIC REGRESSION MODEL PREDICTING EUROSCEPTICISM
The European Social Survey (ESS) allows for more in-depth analysis into several EU member states into the reasons why or why not individuals support the European Union. We selected this dataset over Eurobarometer on the basis that the ESS was the most up-to-date dataset that includes the numerous variables we wanted to test in relation to Euroscepticism for the four case study countries as described in the text (the UK, France, Denmark and the Netherlands).
We conducted a binary logistic regression predicting whether or not an individual is ‘Eurosceptic’ (see variable description below). Using the regression estimates we were then able to calculate the probability of an individual being Eurosceptic dependent on each of the selected variables within the model. The probability scores for each variable presented within chapter 3 of this report are calculated by holding all other values at their means so as to isolate the effect of the designated variable. Individuals holding Eurosceptic values, however, are likely to have similar associations with some or all of the variables which we predict lead to Euroscepticism. For example, if an individual sees immigration as an economic threat then it wouldn’t be unexpected that they see immigration as a cultural threat as well – which would lead to a higher probability of being Eurosceptic.
The variable representing Euroscepticism in each of the models is based on the following question in the ESS:
‘Now thinking about the European Union, some say European unification should go further. Others say it has already gone too far. Using this card, what number on the scale best describes your position?’
The question is measured on 0–10 scale: 0 = ‘integration has gone too far’, 10 = ‘integration has not gone far enough’. To simplify the model for ease of interpretation, the variable has been recoded into binary form: 1 for ‘being Eurosceptic’ (those with an original score of 0–3) and 0 for ‘not being Eurosceptic’ (those with an original score of 4–10). Other variables originally given on a 0–10 scale were also recoded to provide a three-tier categorical sequence of high (7–10), middle (4–6) and low (0–3). These include ‘left/right ideology’, ‘trust in political parties’, ‘democratic satisfaction’, ‘the state of healthcare services’, ‘the state of education’, ‘immigration’s effect on economy’, ‘immigration’s effect on culture’ and ‘reduce inequality’. For each categorical variable the reference category for the analysis is included in brackets.

IPPR | Continental drift: Understanding the growth of Euroscepticism 31
Table A1Correlates of Euroscepticism in the UK, France, Denmark and the Netherlands (logistic regressions)
UK France Denmark Netherlands
Age (55+)
< 35 0.474** 0.715+ 0.452** 1.091
35–54 0.814 0.92 1.07 1.879**
Highest education level
Lower secondary 1.002 1.614+ 1.105 1.052
Upper secondary 1.126 1.713* 1.688** 0.91
Male (female) 1.585** 1.420** 0.925 1.197
Class occupation (working class)
Upper middle 1.05 0.802 1.119 0.787
Middle 1.139 1.028 0.898 0.779
Left/right ideology (right)
Left 0.681+ 1.437* 1.808** 0.85
Centre 0.644** 1.102 1.156 0.683*
Political interest (very interested)
Not at all interested 0.703 1.044 0.416 0.828
Hardly interested 0.775 0.896 0.498** 0.552*
Quite interested 1.087 1.055 0.576** 0.799
Trust in political parties (mostly trust)
No or little trust 2.571** 2.840** 3.634** 3.692**
Moderate trust 1.622* 1.421 1.895** 1.606*
Democratic satisfaction (mostly satisfied)
Mostly dissatisfied 0.845 1.213 1.935* 2.169*
Ambivalent 0.683* 0.855 0.722 1.316
State of healthcare service (good)
Bad 1.238 2.078** 0.915 1.835+
Moderate 0.931 1.098 1.081 1.205
State of education (good)
Bad 1.147 1.288 1.892 1.047
Moderate 1.09 1.176 0.759 1.094
Immigration’s effect on economy (good)
Bad 2.222** 1.489+ 3.237** 3.131**
Neither 1.963** 0.906 1.33 1.296
Immigration’s effect on culture (enriches)
Undermines 2.566** 1.586* 2.696** 2.695**
Neither 1.071 0.991 1.486* 1.135
Reduce inequality (disagree)
Agree 0.857 0.695 1.738** 2.050**
Neither agree nor disagree 0.819 0.671 1.073 1.168
Constant 0.283** 0.089** 0.061** 0.064**
N 1,575 1,797 1,438 1,602
chi2 179.971** 169.605** 217.569** 238.809**
+ p < 0.10 * p < 0.05 ** p < 0.01