Embed Size (px)
Citation preview
© Copyright IBM Corporation 2009
Performance Reporting: Insights from International Practice
Richard Boyle
December 2009

© Copyright IBM Corporation 20092
Overview
Analysis of Reported Performance Indicators Understanding the Breadth of
the Data Ensuring the Quality of
Reporting Indicators Varying Practices
Recommendations for Improvement
Resources and Contact Information
“The purpose of this report is to examine the reporting of outputs and outcomes in four countries.”
• Australia
• Canada
• Ireland
• United States
“What types of indicators are actually being reported?”

© Copyright IBM Corporation 20093
Analysis of Reported Performance Indicators
How Many Indicators Did Each Country Report On?
U.S. performance reports focused on small number of indicators, 30-40 per report.
Australian performance reports had an average of 100 indicators each.
Canada and Ireland fell in between.
U.S. Also Reported a Much Higher Proportion of Quantitative Indicators, and a Lower Number of Qualitative or Discrete Events
© Copyright IBM Corporation 20094
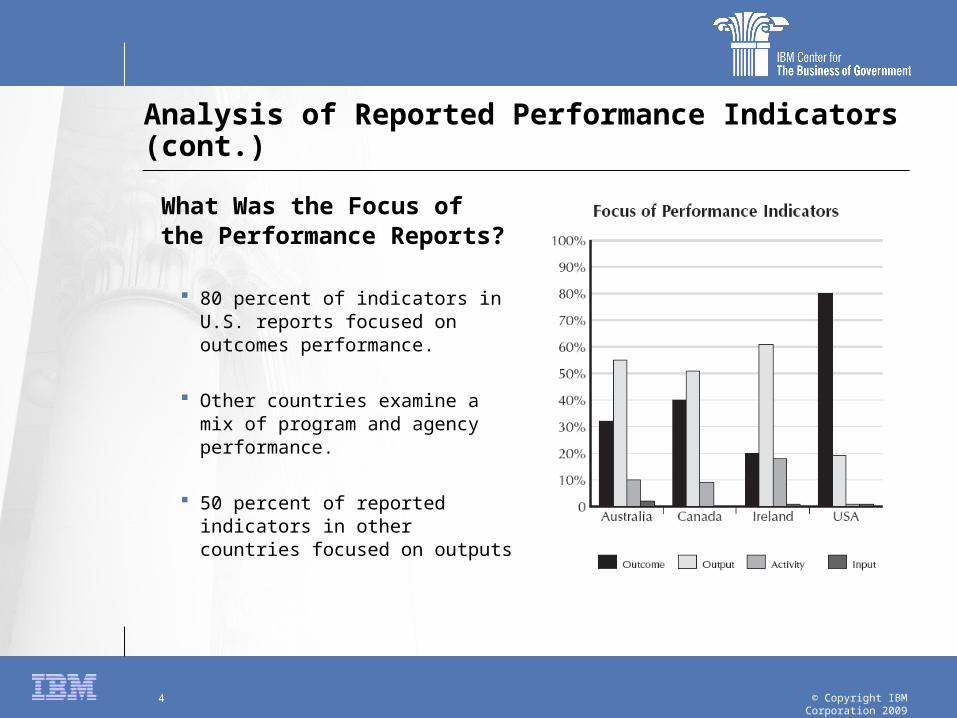
Analysis of Reported Performance Indicators (cont.)
What Was the Focus of the Performance Reports?
80 percent of indicators in U.S. reports focused on outcomes performance.
Other countries examine a mix of program and agency performance.
50 percent of reported indicators in other countries focused on outputs

© Copyright IBM Corporation 20095
Insuring the Quality of Reported Indicators
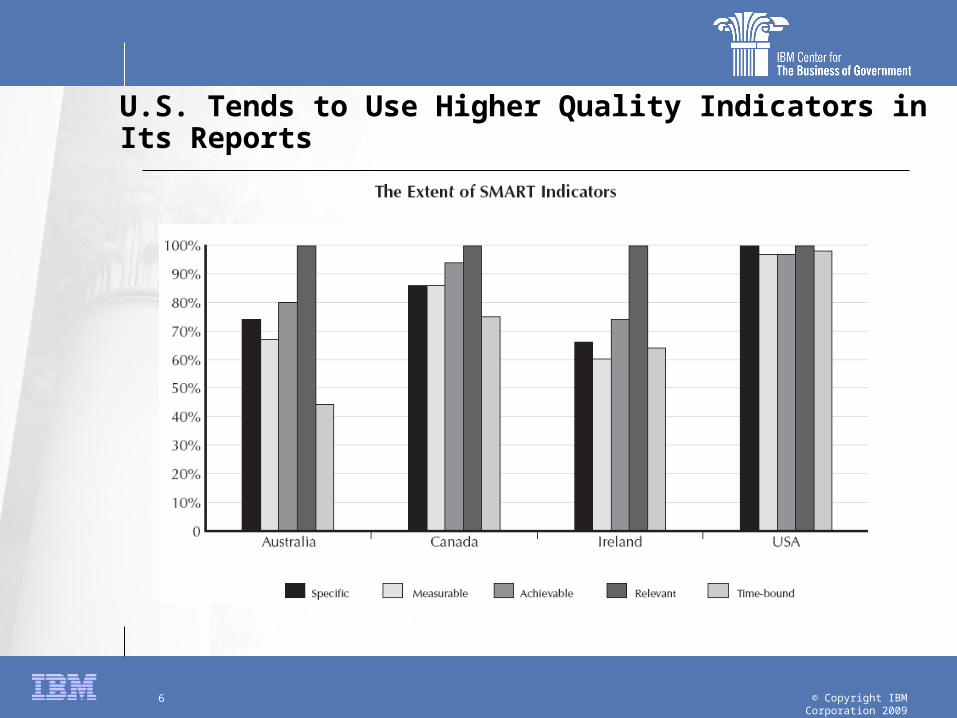
Each country’s indicators were rated against SMART Criteria to assess quality.
Varying Practices for:
The U.S Focus was strongly on outcomes Quantitative and quality indicators Targets and baseline data
Australia and Ireland Focus was more on output and activity
indicators
Canada Falls in between. Greater focus on outcome and
quantitative indicators
• Specific – The nature and the required level of performance can be identified.
• Measurable – the required performance can be measured.
• Achievable – the required performance associated with the indicator can be accomplished.
• Relevant – the required performance will contribute to the organization’s goals
• Time-bound – there is a deadline or specified time frame
© Copyright IBM Corporation 20096
U.S. Tends to Use Higher Quality Indicators in Its Reports

© Copyright IBM Corporation 20097
Recommendations on Developing a Good System for Reporting on Outputs and Outcomes
Recommendations to Improve
Report Preparation:
Use a consistent, comparable, and structured approach.
Include a good performance story to accompany the indicators.
Specify outcome indicators and explain the results against the indicator.
Recommendations to Improve Report Presentation:
Provide both target and baseline data to guide performance assessment over time.
Ensure effective use of technology in presenting the performance data collected
Present performance information that includes output and activity indicators in addition to outcome indicators, when discussing agency performance.

© Copyright IBM Corporation 20098
Resources
“Performance Reporting: Insights from International Practice”For free copies of this report, visit the IBM Center for The Business of Government website
www.businessofgovernment.org
Author:
Richard Boyle, PhDHead of ResearchInstitute of Public Administration57-61 Lansdowne RoadBallsbridgeDublin [email protected]
Prepared by Consueline Yaba