Embed Size (px)
Citation preview
I I 6c
Ino, 13011
UNIVERSITY^
a&ssss-
Pesticide Use in Illinois: Results of a 1988 Survey of Major Crops
f:7
Co University of Illinois at Urbana-Champaign
, -2 7 College of Agriculture
Cooperative Extension Service
Circular 1301
aW5 1930
ifelVE
UNIVERSITY OF ILLINOIS
^niCULJURE LIBRAE
Pesticide Use In Illinois:
Results of a 1988 Survey of Major Crops
David R. Pike
Ellery L. KnakeDonald E. Kuhlman
Marshal D. McGlameryNancy R. Pataky
2M - 2 - 90 - United - AD
Cooperative Extension ServiceUniversity of Illinois at Urbana-Champaign
Helping You Put Knowledge to Work
Urbana, Illinois January 1990
Authors:
David R. Pike, State Coordinator,
Pesticide Impact Assessment Program
Ellery Knake, Donald E. Kuhlman,Marshal D. McGlamery, andNancy R. Pataky,
Extension Specialists,
College of Agriculture
Issued in furtherance of Cooperative
Extension Work, Acts of May 8 and June
30, 1914, in cooperation with the U.S.
Department of Agriculture. DONALD L.
UCHTMANN, Director, Cooperative
Extension Service, University of Illinois at
Urbana-Champaign
The Illinois Cooperative Extension Service
provides equal opportunities in programs
and employment.
Contents
SURVEY OVERVIEW 1
Background and Objectives 1
Survey Methods 1
Data Presentation 1
RESULTS 2
Crop Acreage 2
Aggregate Pesticide Use 3
Tillage Practices 3
Herbicide Use for Weed Control in Corn 4
Herbicide Use for Weed Control in Soybeans 7
Summary of Herbicide Use 9
Insecticide Use 9
Crop Pest Scouting 14
Seed Treatments 14
Incidence of Damage by Corn and Soybean Insect Pests 15
Incidence of Crop Injury from Herbicide Carryover 16
Pesticide Safety 16
SUMMARY 18
APPENDIX A. Survey Form 21
APPENDIX B. Trade and Common Names of Herbicides,
Insecticides, Fungicides, and Seed Treatments 25
Digitized by the Internet Archive
in 2012 with funding from
University of Illinois Urbana-Champaign
http://www.archive.org/details/pesticideuseinil1301pike
List of Tables
Table 1. Statewide Acreage Reported by Crop in 1988
Table 2. Crops Used on Set-aside Acres
Table 3. Percent of Each Crop Grown by Reporting District in 1988
Table 4. Percent of Illinois Crop Acres Treated with Herbicides and Insecticides
Table 5. Primary Tillage Prior to Planting of CropTable 6. Percent of Acres Cultivated After Planting
Table 7. Herbicides Used on Corn for Control of Grass Weeds, 1972 to 1978
Table 8. Soil-Applied Herbicide Use on Corn for Control of Broadleaf Weeds,
1972 to 1988
Table 9. Herbicide Use on Corn for Control of Broadleaf Weeds, 1972 to 1988
Table 10. Herbicide Combinations Used on Corn in 1988
Table 11. Trends in Herbicide Use for Grass Control in Corn by Chemical Class,
1972 to 1988
Table 12. Trends in Herbicide Use for Broadleaf Weed Control in Corn by Chemi-
cal Class, 1972 to 1988
Table 13. Changes in the Application Rates of Corn Herbicides, 1978 to 1988
Table 14. Trends in Herbicide Use for Grass Weed Control in Soybeans, 1972 to
1988
Table 15. Trends in Herbicide Use for Broadleaf Weed Control in Soybeans, 1972
to 1988
Table 16. Trends in Herbicide Use for Grass Weed Control in Soybeans by Chemi-cal Class, 1972 to 1988
Table 17. Trends in Herbicide Use for Broadleaf Weed Control in Soybeans by
Chemical Class, 1972 to 1988
Table 18. Trends in the Application Rate of Soybean Herbicides, 1978 to 1988
Table 19. Total Amount of Active Ingredients in Herbicides Applied to Illinois Soils,
1978 to 1988
Table 20. Herbicide Use on Corn in Illinois, 1988
Table 21. Herbicide Use on Soybeans in Illinois, 1988
Table 22. Herbicide Use on Wheat in Illinois, 1988
Table 23. Herbicide Use on Hay and Pasture in Illinois, 1988
Table 24. Crop Rotation Acreages of Corn Planted in 1988 Following Various Crops
Grown in 1987 and the Amount of Each Rotation Treated with a Soil
Insecticide
Table 25. Soil Insecticide Use on Corn in Illinois, 1988
Table 26. Timing, Methods, and Target Pests of Soil Insecticide Use on Corn in
Illinois, 1988
Table 27. Trends in Soil Insecticide Use on Corn, 1978 to 1988
Table 28. Postemergence Insecticide Use on Corn in Illinois, 1988
Table 29. Postemergence Insecticide Use on Soybeans in Illinois, 1988
Table 30. Insecticide Use for Control of Alfalfa Weevils, 1988
Table 31. Postplanting Insecticide Use, 1988
Table 32. Pest Scouting Trends in Corn, Soybeans, and Alfalfa, 1982 to 1988
Table 33. Percent of Farmers Reporting Self-Applied Seed Treatments
Table 34. Acres Planted with Grower-Applied Seed Treatment, 1988
Table 35. Percent of Farmers Reporting Injury to Corn and Soybeans by Insect Pests
Table 36. Corn and Soybean Injury in 1988 Caused by Herbicide Carryover from
1987
Pesticide Use In Illinois:
Results of a 1988 Survey of Major Crops
SURVEY OVERVIEW
Background and Objectives. This sur-
vey was conducted by the Illinois State
Pesticide Impact Assessment Program
(PIAP). It is part of a continuing effort
to provide data on the risks and bene-
fits of pesticides to agencies and
groups that are making decisions re-
garding pesticide registration and use.
The state program is funded through a
grant from the United States Depart-
ment of Agriculture and is adminis-
tered by the University of Illinois
through a joint effort of the Coopera-
tive Extension Service and the Agricul-
tural Experiment Station. The purpose
of the 1988 survey was to determine
pest control methods in general and,
in specific, the kind, quantity, and tim-
ing of pesticide applications for major
agronomic crops. This information will
be used to direct University Extension
and research programs and to support
decisions regarding legislative and reg-
ulatory action on pesticides.
The use of trade names in this re-
port does not constitute an endorse-
ment of any product or manufacturer.
The inclusion or exclusion of a particu-
lar pesticide is based solely on quan-
tities reported by those participants
surveyed. Pesticides with reported use
totaling less than 1 percent of all crop
acres are generally not included. If a
single active ingredient has two or
more trade names, the most commontrade name or generic name is used in
the report with all quantities reported
under that name.
Survey Methods. Surveys were also
conducted in 1978, 1982, and 1985.
The surveys are available from the De-partment of Agronomy, N-305 Turner
Hall, University of Illinois, Urbana, Illi-
nois 61801. Where possible, informa-
tion from the previous surveys has
been included for comparison. The1988 survey included questions on pri-
mary and secondary tillage methods
and questions on crop scouting. Thesurvey instrument used (see Appen-dix A) was compiled from questions
used in previous years that were modi-
fied for 1988.
Approximately 1,200 survey forms
were mailed to Illinois farmers during
September 1988. The names of the
farmers were drawn at random from a
list maintained by the Illinois Coopera-
tive Crop Reporting Service. The re-
turn mailings and follow-up phonecalls were conducted through the Co-
operative Crop Reporting Service to
maintain confidentiality. Approximately
250 forms were returned by mail, and
an additional 375 forms were com-pleted in the telephone follow-ups.
The 625 useable forms told us that
33 percent of all acreage was repre-
sented by farms of 450 acres or less;
another 33 percent was represented
by farms between 451 acres and 1,000
acres; and the remaining 33 percent
was represented by farms larger than
1,000 acres. The number of farms re-
ported for each category was 377, 134,
and 57, respectively. No consistent
trends appeared to be attributable to
farm size except that a few small farm-
ers reported no pesticide use.
For the northern two-thirds of Illi-
nois, 1988 was a very dry year. Near-
drought conditions caused some rather
uncharacteristic increases in pesticide
usage. If significant changes in pesti-
cide use, such as additional use of post-
emergence herbicides to compensatefor failure of soil-applied preplant or
preemergence herbicides, were sus-
pected to have been caused by the
drought, notations are made in the
text.
Data Presentation. The margin of error
associated with the data is dependenton the number of individuals reporting
the practice. The typical margin of er-
ror in the figures representing the
total use of a particular pesticide is in
the range of plus or minus 3 percent.
The total crop acreage represented
by the returned survey forms was
257,789 acres. All values reported in
the tables were adjusted to represent
statewide totals for Illinois based on 24
million tillable crop acres. Approxi-
mately 60 percent of the respondents
did not enter herbicide rate informa-
tion on the survey form. The reason
for these omissions, according to sev-
eral farmers, was that their herbicides
were custom applied and they did not
have records of application rates. In
order to establish a reliable data set, a
subset of 245 of the 625 total forms
was used for calculating the herbicide
rates. The remaining forms were used
to confirm the application timing,
method, and general product usage.
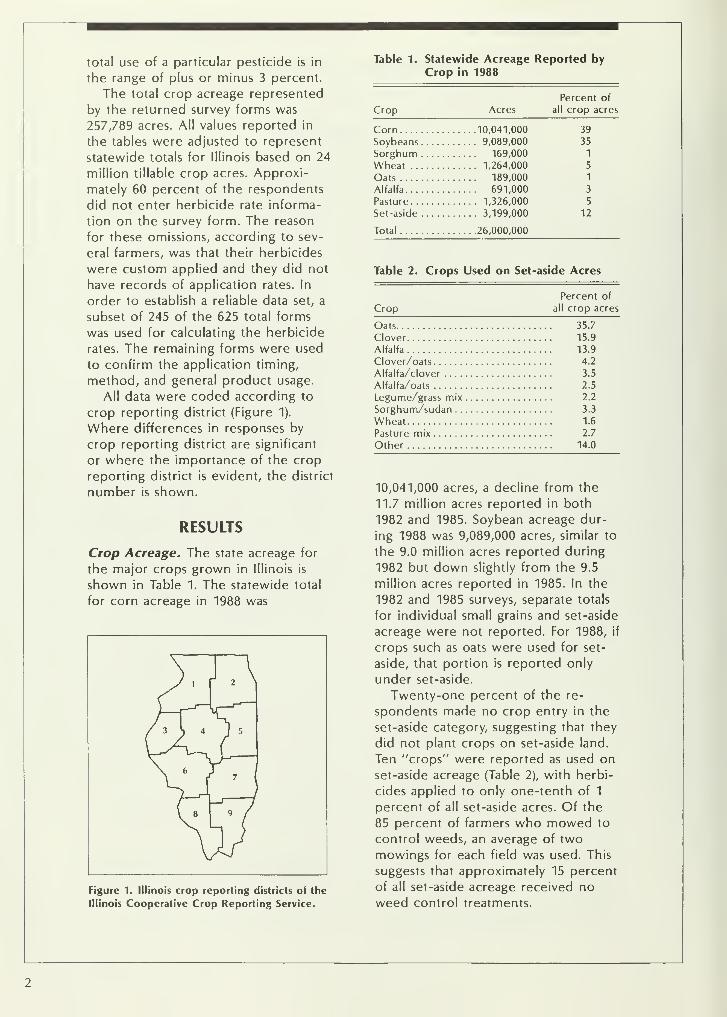
All data were coded according to
crop reporting district (Figure 1).
Where differences in responses by
crop reporting district are significant
or where the importance of the crop
reporting district is evident, the district
number is shown.
RESULTS
Crop Acreage. The state acreage for
the major crops grown in Illinois is
shown in Table 1. The statewide total
for corn acreage in 1988 was
Table 1. Statewide Acreage Reported byCrop in 1988
yj a
\ [
7
I 8 9 /
Crop Acres
Corn 10,041,000
Soybeans 9,089,000
Sorghum 169,000
Wheat 1,264,000
Oats 189,000
Alfalfa 691,000
Pasture 1,326,000
Set-aside 3,199,000
Total 26,000,000
Percent of
all crop acres
39
35
1
5
1
3
5
12
Figure 1. Illinois crop reporting districts of the
Illinois Cooperative Crop Reporting Service.
Table 2. Crops Used on Set-aside Acres
Percent of
Crop all crop acres
Oats 35.7
Clover 15.9
Alfalfa 13.9
Clover/oats 4.2
Alfalfa/clover 3.5
Alfalfa/oats 2.5
Legume/grass mix 2.2
Sorghum/sudan 3.3
Wheat 1.6
Pasture mix 2.7
Other 14.0
10,041,000 acres, a decline from the
11.7 million acres reported in both
1982 and 1985. Soybean acreage dur-
ing 1988 was 9,089,000 acres, similar to
the 9.0 million acres reported during
1982 but down slightly from the 9.5
million acres reported in 1985. In the
1982 and 1985 surveys, separate totals
for individual small grains and set-aside
acreage were not reported. For 1988, if
crops such as oats were used for set-
aside, that portion is reported only
under set-aside.
Twenty-one percent of the re-
spondents made no crop entry in the
set-aside category, suggesting that they
did not plant crops on set-aside land.
Ten "crops" were reported as used on
set-aside acreage (Table 2), with herbi-
cides applied to only one-tenth of 1
percent of all set-aside acres. Of the
85 percent of farmers who mowed to
control weeds, an average of twomowings for each field was used. This
suggests that approximately 15 percent
of all set-aside acreage received noweed control treatments.
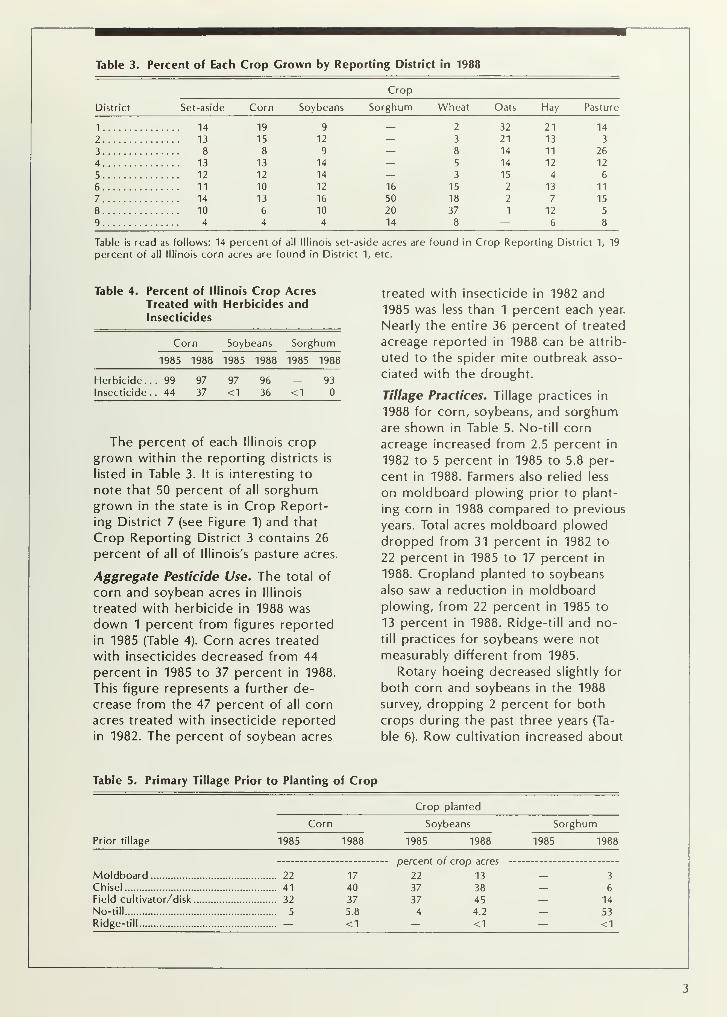
Table 3. Percent of Each Crop Grown by Reporting District in 1988
Crop
District Set-aside Corn Soybeans Sorghum Wheat Oats Hay Pasture
1 14 19 9 — 2 32 21 14
2 13 15 12 3 21 13 3
3 8 8 9 8 14 11 26
4 13 13 14 — 5 14 12 12
5 12 12 14 — 3 15 4 6
6 11 10 12 16 15 2 13 11
7 14 13 16 50 18 2 7 15
8 10 6 10 20 37 1 12 5
9 4 4 4 14 8 — 6 8
Table is read as follows: 14 percent of all Illinois set-aside acres are found in Crop Reporting District 1, 19
percent of all Illinois corn acres are found in District 1, etc.
Table 4. Percent of Illinois Crop AcresTreated with Herbicides andInsecticides
Corn
1985 1988
Soybeans
1985 1988
Sorghum
1985 1988
Herbicide.
.
Insecticide .
. 99 97
. 44 37
97 96
<1 36
— 93
<1
The percent of each Illinois crop
grown within the reporting districts is
listed in Table 3. It is interesting to
note that 50 percent of all sorghumgrown in the state is in Crop Report-
ing District 7 (see Figure 1) and that
Crop Reporting District 3 contains 26
percent of all of lllinois's pasture acres.
Aggregate Pesticide Use. The total of
corn and soybean acres in Illinois
treated with herbicide in 1988 was
down 1 percent from figures reported
in 1985 (Table 4). Corn acres treated
with insecticides decreased from 44
percent in 1985 to 37 percent in 1988.
This figure represents a further de-
crease from the 47 percent of all corn
acres treated with insecticide reported
in 1982. The percent of soybean acres
treated with insecticide in 1982 and
1985 was less than 1 percent each year.
Nearly the entire 36 percent of treated
acreage reported in 1988 can be attrib-
uted to the spider mite outbreak asso-
ciated with the drought.
Tillage Practices. Tillage practices in
1988 for corn, soybeans, and sorghumare shown in Table 5. No-till corn
acreage increased from 2.5 percent in
1982 to 5 percent in 1985 to 5.8 per-
cent in 1988. Farmers also relied less
on moldboard plowing prior to plant-
ing corn in 1988 compared to previous
years. Total acres moldboard plowed
dropped from 31 percent in 1982 to
22 percent in 1985 to 17 percent in
1988. Cropland planted to soybeans
also saw a reduction in moldboardplowing, from 22 percent in 1985 to
13 percent in 1988. Ridge-till and no-
till practices for soybeans were not
measurably different from 1985.
Rotary hoeing decreased slightly for
both corn and soybeans in the 1988
survey, dropping 2 percent for both
crops during the past three years (Ta-
ble 6). Row cultivation increased about
Table 5. Primary Tillage Prior to Planting of Crop
Crop planted
Corn Soybeans
Prior tillage 1985 1988 1985 1988
Sorghum
1985 1988
Moldboard 22
Chisel 41
Field cultivator/disk 32
No-till 5
Ridge-till —
17
40
37
5.8
<1
percent of crop acres
22 13
37 38
37 45
4 4.2
<1
3
6
14
53
<1
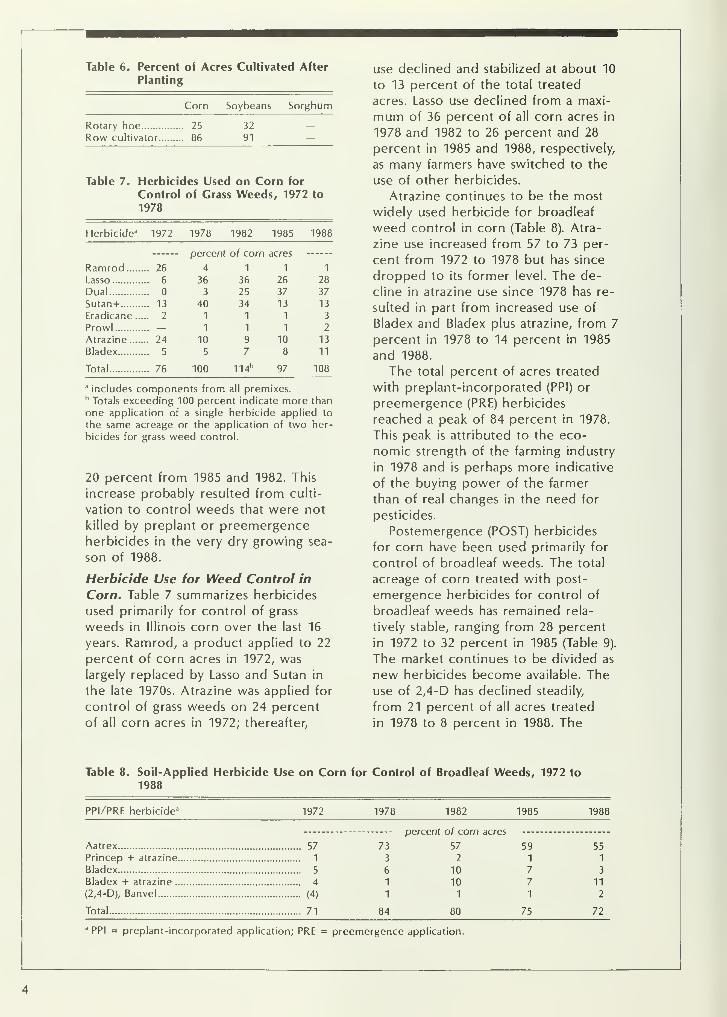
Table 6. Percent of Acres Cultivated After
Planting
Corn Soybeans Sorghum
Rotary hoe 25
Row cultivator 86
32
91
Table 7. Herbicides Used on Corn for
Control of Crass Weeds, 1972 to
1978
Herbicide 11 1972 1978 1982 1985 1988
percent of corn acres
Ramrod 26 4 1 1 1
Lasso 6 36 36 26 28
Dual 3 25 37 37
Sutan+ 13 40 34 13 13
Eradicane 2 1113Prowl — 1 1 1 2
Atrazine 24 10 9 10 13
Bladex 5 5 7 8 11
Total 76 100 114 b 97 108
a includes components from all premixes.b Totals exceeding 100 percent indicate more than
one application of a single herbicide applied to
the same acreage or the application of two her-
bicides for grass weed control.
20 percent from 1985 and 1982. This
increase probably resulted from culti-
vation to control weeds that were not
killed by preplant or preemergenceherbicides in the very dry growing sea-
son of 1988.
Herbicide Use for Weed Control in
Corn. Table 7 summarizes herbicides
used primarily for control of grass
weeds in Illinois corn over the last 16
years. Ramrod, a product applied to 22
percent of corn acres in 1972, was
largely replaced by Lasso and Sutan in
the late 1970s. Atrazine was applied for
control of grass weeds on 24 percent
of all corn acres in 1972; thereafter,
use declined and stabilized at about 10
to 13 percent of the total treated
acres. Lasso use declined from a maxi-
mum of 36 percent of all corn acres in
1978 and 1982 to 26 percent and 28
percent in 1985 and 1988, respectively,
as many farmers have switched to the
use of other herbicides.
Atrazine continues to be the most
widely used herbicide for broadleaf
weed control in corn (Table 8). Atra-
zine use increased from 57 to 73 per-
cent from 1972 to 1978 but has since
dropped to its former level. The de-
cline in atrazine use since 1978 has re-
sulted in part from increased use of
Bladex and Bladex plus atrazine, from 7
percent in 1978 to 14 percent in 1985
and 1988.
The total percent of acres treated
with preplant-incorporated (PPI) or
preemergence (PRE) herbicides
reached a peak of 84 percent in 1978.
This peak is attributed to the eco-
nomic strength of the farming industry
in 1978 and is perhaps more indicative
of the buying power of the farmer
than of real changes in the need for
pesticides.
Postemergence (POST) herbicides
for corn have been used primarily for
control of broadleaf weeds. The total
acreage of corn treated with post-
emergence herbicides for control of
broadleaf weeds has remained rela-
tively stable, ranging from 28 percent
in 1972 to 32 percent in 1985 (Table 9).
The market continues to be divided as
new herbicides become available. Theuse of 2,4-D has declined steadily,
from 21 percent of all acres treated
in 1978 to 8 percent in 1988. The
Table 8. Soil-Applied Herbicide Use on Corn for Control of Broadleaf Weeds, 1972 to
1988
PPI/PRE herbicide 8 1972 1978 1982 1985
percent of corn acres
Aatrex 57 73 57
Princep + atrazine 13 2
Bladex 5 6 10
Bladex + atrazine 4 1 10
(2,4-D), Banvel (4) 1 1
Total 71 84 80 75
a PPI = preplant-incorporated application; PRE = preemergence application.
1988
59 55
1 1
7 3
7 11
1 2
72
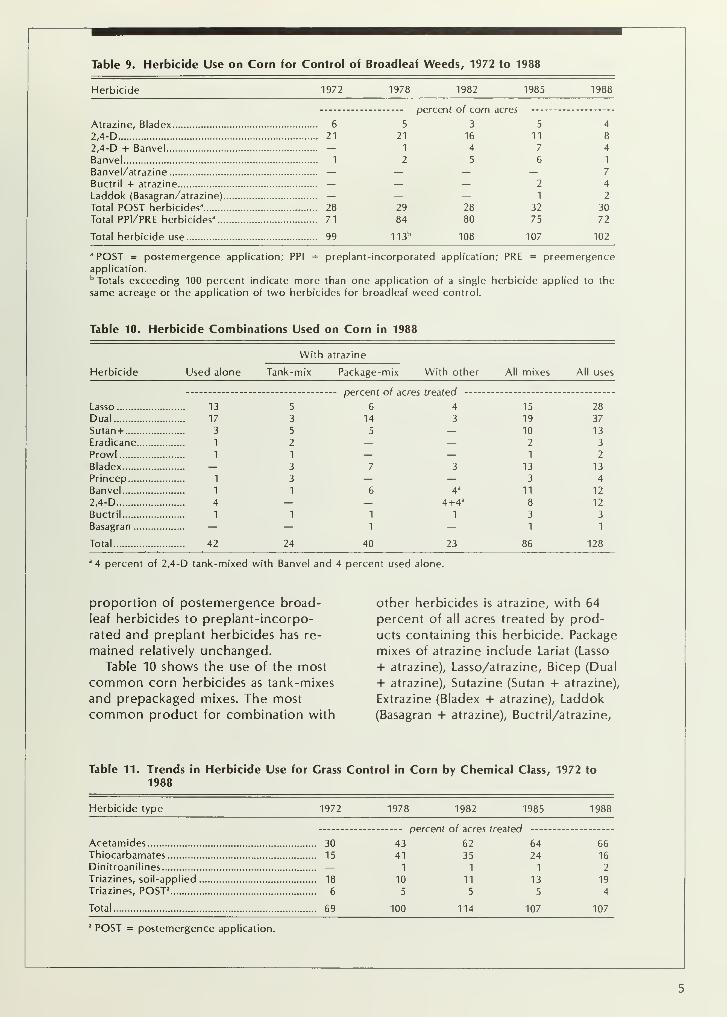
Table 9. Herbicide Use on Corn for Control of Broadleaf Weeds, 1972 to 1988
Herbicide 1972 1978 1982 1985 1988
percent of corn acres -
Atrazine, Bladex 6 5 3 5 4
2,4-D 21 21 16 11 8
2,4-D + Banvel — 1 4 7 4
Banvel 12 5 6 1
Banvel/atrazine — — — —Buctril + atrazine — — — 2 4
Laddok (Basagran/atrazine) — — — 12Total POST herbicides 3 28 29 28 32 30
Total PPI/PRE herbicides3 71 84 80 75 72
Total herbicide use 99 113 b 108 107 102
3 POST = postemergence application; PPI = preplant-incorporated application; PRE = preemergenceapplication.b Totals exceeding 100 percent indicate more than one application of a single herbicide applied to the
same acreage or the application of two herbicides for broadleaf weed control.
Table 10. Herbicide Combinations Used on Corn in 1988
With atrazine
Herbicide Used alone Tank-mix Package-mix With other
— -- percent of acres treated
Lasso 13 5 6 4
Dual 17 3 14 3
Sutan+ 3 5 5 —Eradicane 12 — —Prowl 11 — —Bladex — 3 7 3
Princep 13 — —Banvel 1 1 6 4 3
2,4-D 4 — — 4+4a
Buctril 1111Basagran — — 1 —Total 42 24 40 23
3 4 percent of 2,4-D tank-mixed with Banvel and 4 percent used alone.
All mixes All uses
15
19
10
2
1
13
3
11
8
3
1
86
28
37
13
3
2
13
4
12
12
3
1
128
proportion of postemergence broad-
leaf herbicides to preplant-incorpo-
rated and preplant herbicides has re-
mained relatively unchanged.
Table 10 shows the use of the most
common corn herbicides as tank-mixes
and prepackaged mixes. The mostcommon product for combination with
other herbicides is atrazine, with 64
percent of all acres treated by prod-
ucts containing this herbicide. Package
mixes of atrazine include Lariat (Lasso
+ atrazine), Lasso/atrazine, Bicep (Dual
+ atrazine), Sutazine (Sutan + atrazine),
Extrazine (Bladex + atrazine), Laddok
(Basagran + atrazine), Buctril/atrazine,
Table 11. Trends in Herbicide Use for Grass Control in Corn by Chemical Class, 1972 to
1988
Herbicide type 1972 1978 1982 1985 1988
AcetamidesThiocarbamates
Dinitroanilines
Triazines, soil-applied
Triazines, POST 3
Total 69
3 POST = postemergence application.
percent o/ acres treated —30 43 62 64
15 41 35 24— 1 1 1
18 10 11 13
6 5 5 5
100 114
64 66
24 16
1 2
13 19
5 4
107 107
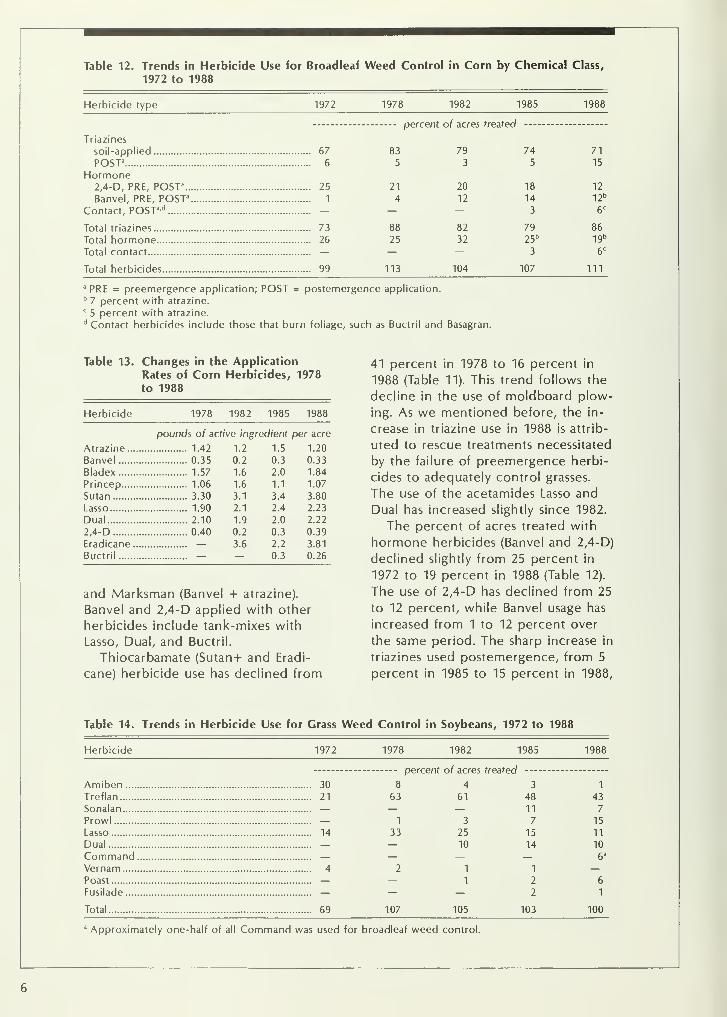
Table 12. Trends in Herbicide Use for Broadleaf Weed Control in Corn by Chemical Class,
1972 to 1988
Herbicide type 1972 1978 1982 1985 1988
percent of acres treated
Triazines
soil-applied 67 83 79 74 71
POST1 6 5 3 5 15
Hormone2,4-D, PRE, POSTa 25 21 20 18 12
Banvel, PRE, POST 31 4 12 14 12 b
Contact, POSTa 'd — — 3 6C
Total triazines 73 88 82 79 86
Total hormone 26 25 32 25 b 19b
Total contact — — — 3 6C
Total herbicides 99 113 104 107 111
a PRE = preemergence application; POST = postemergence application.b 7 percent with atrazine.c5 percent with atrazine.
d Contact herbicides include those that burn foliage, such as Buctril and Basagran.
Table 13. Changes in the Application
Rates of Corn Herbicides, 1978
to 1988
Herbicide 1978 1982 1985 1988
pounds of active ingredient per acre
Atrazine 1.42 1.2 1.5 1.20
Banvel 0.35 0.2 0.3 0.33
Bladex 1.57 1.6 2.0 1.84
Princep 1.06 1.6 1.1 1.07
Sutan 3.30 3.1 3.4 3.80
Lasso 1.90 2.1 2.4 2.23
Dual 2.10 1.9 2.0 2.22
2,4-D 0.40 0.2 0.3 0.39
Eradicane — 3.6 2.2 3.81
Buctril — — 0.3 0.26
and Marksman (Banvel + atrazine).
Banvel and 2,4-D applied with other
herbicides include tank-mixes with
Lasso, Dual, and Buctril.
Thiocarbamate (Sutan-l- and Eradi-
cane) herbicide use has declined from
41 percent in 1978 to 16 percent in
1988 (Table 11). This trend follows the
decline in the use of moldboard plow-
ing. As we mentioned before, the in-
crease in triazine use in 1988 is attrib-
uted to rescue treatments necessitated
by the failure of preemergence herbi-
cides to adequately control grasses.
The use of the acetamides Lasso and
Dual has increased slightly since 1982.
The percent of acres treated with
hormone herbicides (Banvel and 2,4-D)
declined slightly from 25 percent in
1972 to 19 percent in 1988 (Table 12).
The use of 2,4-D has declined from 25
to 12 percent, while Banvel usage has
increased from 1 to 12 percent over
the same period. The sharp increase in
triazines used postemergence, from 5
percent in 1985 to 15 percent in 1988,
Table 14. Trends in Herbicide Use for Crass Weed Control in Soybeans, 1972 to 1988
Herbicide 1972 1978 1982 1985
percent of acres treated
Amiben 30 8 4
Treflan 21 63 61
Sonalan — — —Prowl — 1 3
Lasso 14 33 25
Dual — — 10
Command — — —Vernam 4 2 1
Poast — — 1
Fusilade — — —Total 69 107 105 103
a Approximately one-half of all Command was used for broadleaf weed control.
1988
3 1
48 43
11 7
7 15
15 11
14 10— 6"
1 —2 6
2 1
100
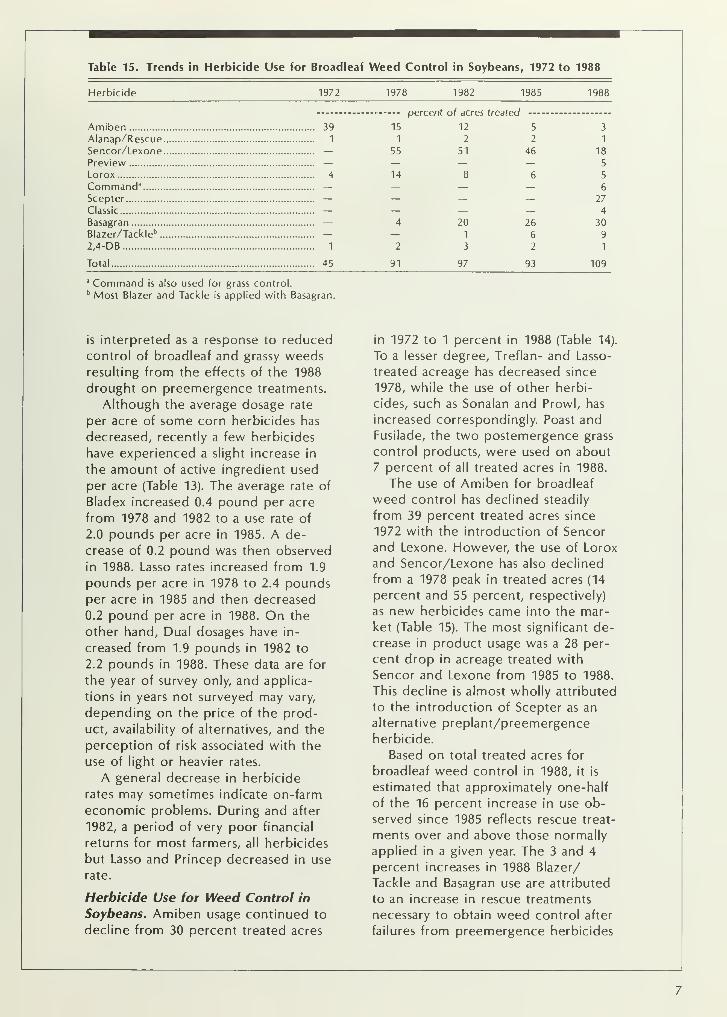
Table 15. Trends in Herbicide Use for Broadleaf Weed Control in Soybeans, 1972 to 1988
Herbicide 1972 1978 1982 1985 1988
Amiben 39
Alanap/Rescue 1
Sencor/Lexone —Preview —Lorox 4
Command'1 —Scepter —Classic —Basagran —Blazer/Tackle 6 —2,4-DB 1
Total 45
a Command is also used for grass control.b Most Blazer and Tackle is applied with Basagran.
--- percent of acres treated —15 12 5
1 2 2
55 51 46
14
2
91
8
20
1
3
97
26
6
2
93
3
1
18
5
5
6
27
4
30
9
1
109
is interpreted as a response to reduced
control of broadleaf and grassy weedsresulting from the effects of the 1988
drought on preemergence treatments.
Although the average dosage rate
per acre of some corn herbicides has
decreased, recently a few herbicides
have experienced a slight increase in
the amount of active ingredient used
per acre (Table 13). The average rate of
Bladex increased 0.4 pound per acre
from 1978 and 1982 to a use rate of
2.0 pounds per acre in 1985. A de-
crease of 0.2 pound was then observed
in 1988. Lasso rates increased from 1.9
pounds per acre in 1978 to 2.4 poundsper acre in 1985 and then decreased
0.2 pound per acre in 1988. On the
other hand, Dual dosages have in-
creased from 1.9 pounds in 1982 to
2.2 pounds in 1988. These data are for
the year of survey only, and applica-
tions in years not surveyed may vary,
depending on the price of the prod-
uct, availability of alternatives, and the
perception of risk associated with the
use of light or heavier rates.
A general decrease in herbicide
rates may sometimes indicate on-farm
economic problems. During and after
1982, a period of very poor financial
returns for most farmers, all herbicides
but Lasso and Princep decreased in use
rate.
Herbicide Use for Weed Control in
Soybeans. Amiben usage continued to
decline from 30 percent treated acres
in 1972 to 1 percent in 1988 (Table 14).
To a lesser degree, Treflan- and Lasso-
treated acreage has decreased since
1978, while the use of other herbi-
cides, such as Sonalan and Prowl, has
increased correspondingly. Poast andFusilade, the two postemergence grass
control products, were used on about
7 percent of all treated acres in 1988.
The use of Amiben for broadleaf
weed control has declined steadily
from 39 percent treated acres since
1972 with the introduction of Sencor
and Lexone. However, the use of Lorox
and Sencor/Lexone has also declined
from a 1978 peak in treated acres (14
percent and 55 percent, respectively)
as new herbicides came into the mar-
ket (Table 15). The most significant de-
crease in product usage was a 28 per-
cent drop in acreage treated with
Sencor and Lexone from 1985 to 1988.
This decline is almost wholly attributed
to the introduction of Scepter as an
alternative preplant/preemergence
herbicide.
Based on total treated acres for
broadleaf weed control in 1988, it is
estimated that approximately one-half
of the 16 percent increase in use ob-
served since 1985 reflects rescue treat-
ments over and above those normally
applied in a given year. The 3 and 4
percent increases in 1988 Blazer/
Tackle and Basagran use are attributed
to an increase in rescue treatments
necessary to obtain weed control after
failures from preemergence herbicides
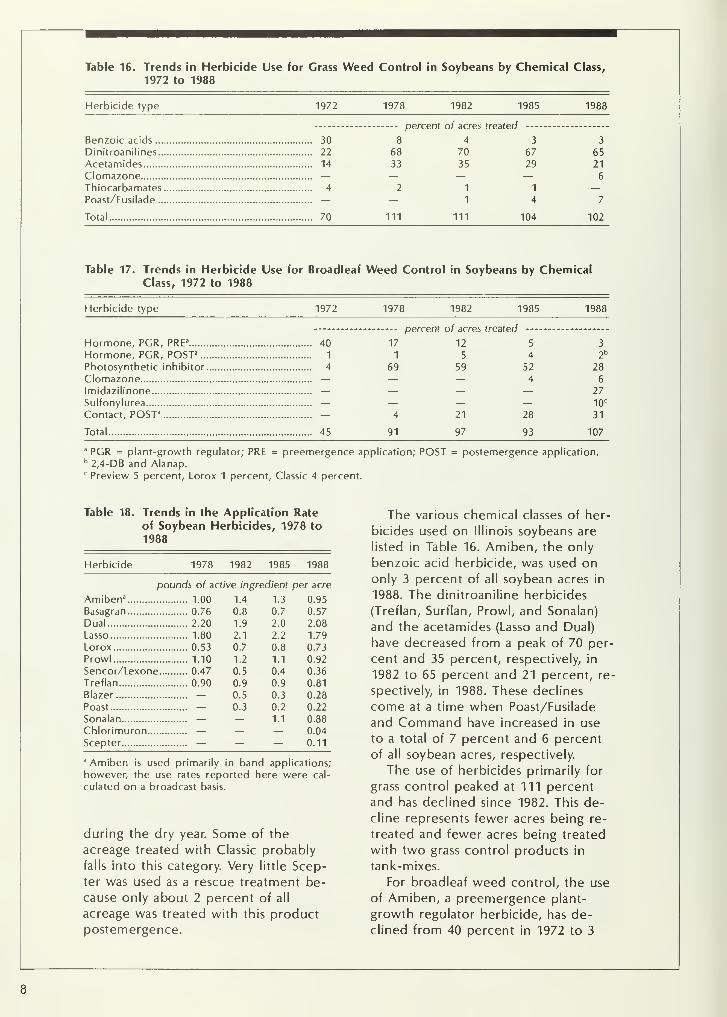
Table 16. Trends in Herbicide Use for Grass Weed Control in Soybeans by Chemical Class,
1972 to 1988
Herbicide type 1972 1978 1982 1985 1988
Benzoic acids ....
Dinitroanilines...
AcetamidesClomazoneThiocarbamates.
Poast/Fusilade ...
Total
percent of acres treated
30 8 4 3 3
22 68 70 67 65
14 33 35 29 21
6
4 2 1 1
— — 1 4 7
70 111 111 104 102
Table 17. Trends in Herbicide Use for Broadleaf Weed Control in Soybeans by ChemicalClass, 1972 to 1988
Herbicide type 1972 1978 1982 1985 1988
percent of acres treated
Hormone, PGR, PREa 40 17 12 5 3
Hormone, PCR, POST 2 115 4 2 b
Photosynthetic inhibitor 4 69 59 52 28
Clomazone — — — 4 6
Imidazilinone — — — — 27
Sulfonylurea — — — — 10 c
Contact, POST a — 4 21 28 31
Total 45 91 97 93 107
a PGR = plant-growth regulator; PRE = preemergence application; POST = postemergence application.b 2,4-DB and Alanap.c Preview 5 percent, Lorox 1 percent, Classic 4 percent.
Table 18. Trends in the Application Rate
of Soybean Herbicides, 1978 to
1988
Herbicide 1978 1982 1985 1988
pounds of active ingredient per acre
Amiben 31.00 1.4 1.3 0.95
Basagran 0.76 0.8 0.7 0.57
Dual 2.20 1.9 2.0 2.08
Lasso 1.80 2.1 2.2 1.79
Lorox 0.53 0.7 0.8 0.73
Prowl 1.10 1.2 1.1 0.92
Sencor/Lexone 0.47 0.5 0.4 0.36
Treflan 0.90 0.9 0.9 0.81
Blazer — 0.5 0.3 0.28
Poast — 0.3 0.2 0.22
Sonalan — — 1.1 0.88
Chlorimuron — — — 0.04
Scepter — — — 0.11
a Amiben is used primarily in band applications;
however, the use rates reported here were cal-
culated on a broadcast basis.
during the dry year. Some of the
acreage treated with Classic probably
falls into this category. Very little Scep-
ter was used as a rescue treatment be-
cause only about 2 percent of all
acreage was treated with this product
postemergence.
The various chemical classes of her-
bicides used on Illinois soybeans are
listed in Table 16. Amiben, the only
benzoic acid herbicide, was used ononly 3 percent of all soybean acres in
1988. The dinitroaniline herbicides
(Treflan, Surflan, Prowl, and Sonalan)
and the acetamides (Lasso and Dual)
have decreased from a peak of 70 per-
cent and 35 percent, respectively, in
1982 to 65 percent and 21 percent, re-
spectively, in 1988. These declines
come at a time when Poast/Fusilade
and Command have increased in use
to a total of 7 percent and 6 percent
of all soybean acres, respectively.
The use of herbicides primarily for
grass control peaked at 111 percent
and has declined since 1982. This de-
cline represents fewer acres being re-
treated and fewer acres being treated
with two grass control products in
tank-mixes.
For broadleaf weed control, the use
of Amiben, a preemergence plant-
growth regulator herbicide, has de-
clined from 40 percent in 1972 to 3
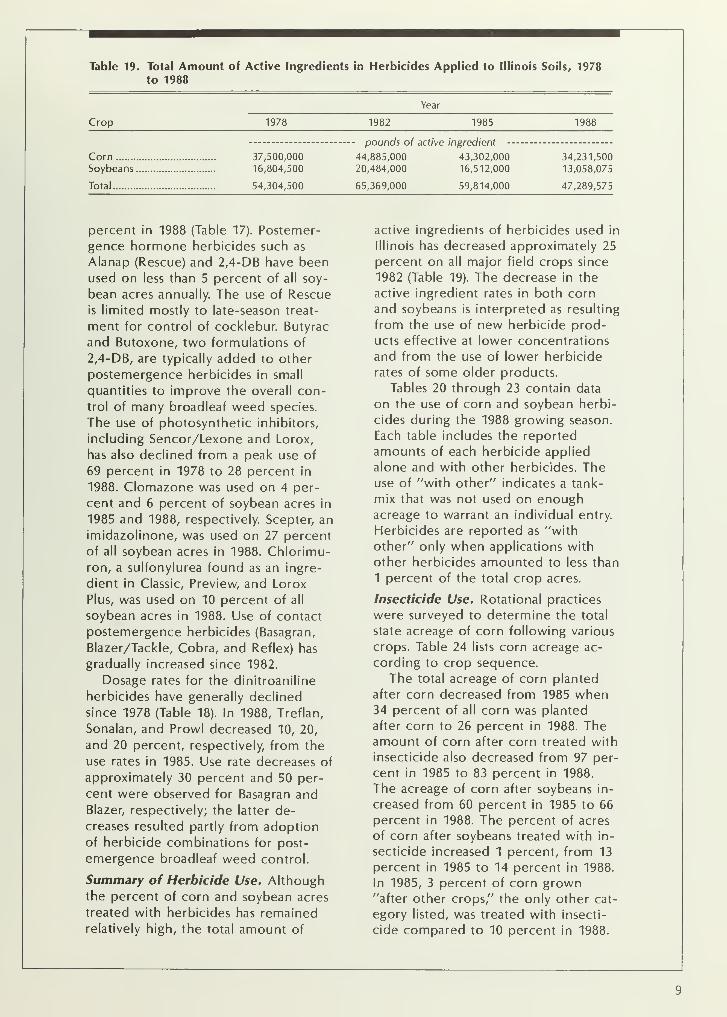
Table 19. Total Amount of Active Ingredients in Herbicides Applied to Illinois Soils, 1978
to 1988
Crop
Year
1978 1982 1985 1988
CornSoybeans.
Total
37,500,000
16,804,500
54,304,500
- pounds of active ingredient -
44,885,000 43,302,000
20,484,000 16,512,000
65,369,000 59,814,000
34,231,500
13,058,075
47,289,575
percent in 1988 (Table 17). Postemer-
gence hormone herbicides such as
Alanap (Rescue) and 2,4-DB have been
used on less than 5 percent of all soy-
bean acres annually. The use of Rescue
is limited mostly to late-season treat-
ment for control of cocklebur. Butyrac
and Butoxone, two formulations of
2,4-DB, are typically added to other
postemergence herbicides in small
quantities to improve the overall con-
trol of many broadleaf weed species.
The use of photosynthetic inhibitors,
including Sencor/Lexone and Lorox,
has also declined from a peak use of
69 percent in 1978 to 28 percent in
1988. Clomazone was used on 4 per-
cent and 6 percent of soybean acres in
1985 and 1988, respectively. Scepter, an
imidazolinone, was used on 27 percent
of all soybean acres in 1988. Chlorimu-
ron, a sulfonylurea found as an ingre-
dient in Classic, Preview, and Lorox
Plus, was used on 10 percent of all
soybean acres in 1988. Use of contact
postemergence herbicides (Basagran,
Blazer/Tackle, Cobra, and Reflex) has
gradually increased since 1982.
Dosage rates for the dinitroaniline
herbicides have generally declined
since 1978 (Table 18). In 1988, Treflan,
Sonalan, and Prowl decreased 10, 20,
and 20 percent, respectively, from the
use rates in 1985. Use rate decreases of
approximately 30 percent and 50 per-
cent were observed for Basagran andBlazer, respectively; the latter de-
creases resulted partly from adoption
of herbicide combinations for post-
emergence broadleaf weed control.
Summary of Herbicide Use. Althoughthe percent of corn and soybean acres
treated with herbicides has remainedrelatively high, the total amount of
active ingredients of herbicides used in
Illinois has decreased approximately 25
percent on all major field crops since
1982 (Table 19). The decrease in the
active ingredient rates in both corn
and soybeans is interpreted as resulting
from the use of new herbicide prod-
ucts effective at lower concentrations
and from the use of lower herbicide
rates of some older products.
Tables 20 through 23 contain data
on the use of corn and soybean herbi-
cides during the 1988 growing season.
Each table includes the reported
amounts of each herbicide applied
alone and with other herbicides. Theuse of "with other" indicates a tank-
mix that was not used on enoughacreage to warrant an individual entry.
Herbicides are reported as "with
other" only when applications with
other herbicides amounted to less than
1 percent of the total crop acres.
Insecticide Use. Rotational practices
were surveyed to determine the total
state acreage of corn following various
crops. Table 24 lists corn acreage ac-
cording to crop sequence.
The total acreage of corn planted
after corn decreased from 1985 when34 percent of all corn was planted
after corn to 26 percent in 1988. Theamount of corn after corn treated with
insecticide also decreased from 97 per-
cent in 1985 to 83 percent in 1988.
The acreage of corn after soybeans in-
creased from 60 percent in 1985 to 66
percent in 1988. The percent of acres
of corn after soybeans treated with in-
secticide increased 1 percent, from 13
percent in 1985 to 14 percent in 1988.
In 1985, 3 percent of corn grown"after other crops," the only other cat-
egory listed, was treated with insecti-
cide compared to 10 percent in 1988.
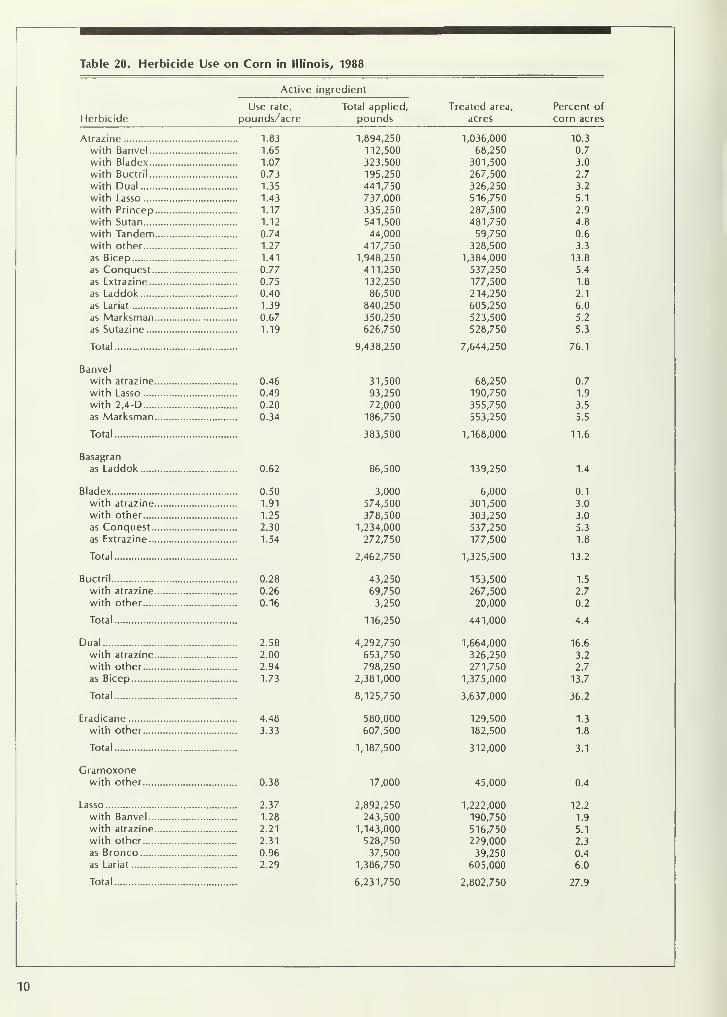
Table 20. Herbicide Use on Corn in Illinois, 1988
Active ingredient
Use rate,
Herbicide pounds/acre
Atrazine 1.83
with Banvel 1.65
with Bladex 1.07
with Buctril 0.73
with Dual 1.35
with Lasso 1.43
with Princep 1.17
with Sutan 1.12
with Tandem 0.74
with other 1.27
as Bicep 1.41
as Conquest 0.77
as Extrazine 0.75
as Laddok 0.40
as Lariat 1.39
as Marksman 0.67
as Sutazine 1.19
Total
Banvel
with atrazine 0.46
with Lasso 0.49
with 2,4-D 0.20
as Marksman 0.34
Total
Basagran
as Laddok 0.62
Bladex 0.50
with atrazine 1.91
with other 1.25
as Conquest 2.30
as Extrazine 1.54
Total
Buctril 0.28
with atrazine 0.26
with other 0.16
Total
Dual 2.58
with atrazine 2.00
with other 2.94
as Bicep 1.73
Total
Eradicane 4.48
with other 3.33
Total
Gramoxonewith other 0.38
Lasso 2.37
with Banvel 1.28
with atrazine 2.21
with other 2.31
as Bronco 0.96
as Lariat 2.29
Total
Total applied, Treated area, Percent of
pounds acres corn acres
1,894,250 1,036,000 10.3
112,500 68,250 0.7
323,500 301,500 3.0
195,250 267,500 2.7
441,750 326,250 3.2
737,000 516,750 5.1
335,250 287,500 2.9
541,500 481,750 4.8
44,000 59,750 0.6
417,750 328,500 3.3
1,948,250 1,384,000 13.8
411,250 537,250 5.4
132,250 177,500 1.8
86,500 214,250 2.1
840,250 605,250 6.0
350,250 523,500 5.2
626,750 528,750 5.3
9,438,250 7,644,250 76.1
31,500 68,250 0.7
93,250 190,750 1.9
72,000 355,750 3.5
186,750 553,250 5.5
383,500
86,500
1,187,500
17,000
1,168,000
139,250
312,000
45,000
11.6
1.4
3,000
574,500
378,500
1,234,000
272,750
6,000
301,500
303,250
537,250
177,500
0.1
3.0
3.0
5.3
1.8
2,462,750 1,325,500 13.2
43,250
69,750
3,250
153,500
267,500
20,000
1.5
2.7
0.2
116,250 441,000 4.4
4,292,750
653,750
798,250
2,381,000
1,664,000
326,250
271,750
1,375,000
16.6
3.2
2.7
13.7
8,125,750 3,637,000 36.2
580,000
607,500
129,500
182,500
1.3
1.8
3.1
0.4
2,892,250 1,222,000 12.2
243,500 190,750 1.9
1,143,000 516,750 5.1
528,750 229,000 2.3
37,500 39,250 0.4
1,386,750 605,000 6.0
6,231,750 2,802,750 27.9
10
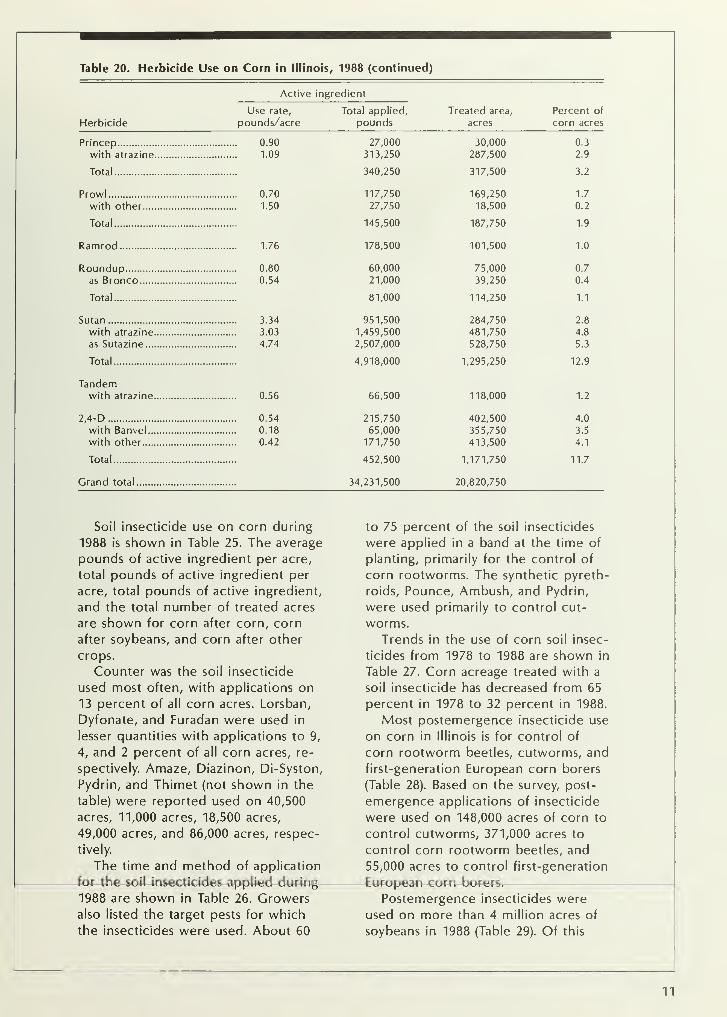
Table 20. Herbicide Use on Corn in Illinois, 1988 (continued)
Active ingredient
Use rate,
Herbicide pounds/acre
Princep 0.90
with atrazine 1.09
Total
Prowl 0.70
with other 1.50
Total
Ramrod 1.76
Roundup 0.80
as Bronco 0.54
Total
Sutan 3.34
with atrazine 3.03
as Sutazine 4.74
Total
Tandemwith atrazine 0.56
2,4-D 0.54
with Banvel 0.18
with other 0.42
Total
Grand total
Total applied,
poundsTreated area,
acres
Percent of
corn acres
27,000
313,250
30,000
287,500
0.3
2.9
340,250 317,500 3.2
117,750
27,750
169,250
18,500
1.7
0.2
145,500
178,500
66,500
187,750
101,500
118,000
1.9
1.0
60,000
21,000
75,000
39,250
0.7
0.4
81,000 114,250 1.1
951,500
1,459,500
2,507,000
284,750
481,750
528,750
2.8
4.8
5.3
4,918,000 1,295,250 12.9
1.2
215,750
65,000
171,750
402,500
355,750
413,500
4.0
3.5
4.1
452,500 1,171,750 11.7
,231,500 20,820,750
Soil insecticide use on corn during
1988 is shown in Table 25. The average
pounds of active ingredient per acre,
total pounds of active ingredient per
acre, total pounds of active ingredient,
and the total number of treated acres
are shown for corn after corn, corn
after soybeans, and corn after other
crops.
Counter was the soil insecticide
used most often, with applications on13 percent of all corn acres. Lorsban,
Dyfonate, and Furadan were used in
lesser quantities with applications to 9,
4, and 2 percent of all corn acres, re-
spectively. Amaze, Diazinon, Di-Syston,
Pydrin, and Thimet (not shown in the
table) were reported used on 40,500
acres, 11,000 acres, 18,500 acres,
49,000 acres, and 86,000 acres, respec-
tively.
The time and method of application
for the soil insecticides applied during
1988 are shown in Table 26. Growersalso listed the target pests for which
the insecticides were used. About 60
to 75 percent of the soil insecticides
were applied in a band at the time of
planting, primarily for the control of
corn rootworms. The synthetic pyreth-
roids, Pounce, Ambush, and Pydrin,
were used primarily to control cut-
worms.
Trends in the use of corn soil insec-
ticides from 1978 to 1988 are shown in
Table 27. Corn acreage treated with a
soil insecticide has decreased from 65
percent in 1978 to 32 percent in 1988.
Most postemergence insecticide use
on corn in Illinois is for control of
corn rootworm beetles, cutworms, and
first-generation European corn borers
(Table 28). Based on the survey, post-
emergence applications of insecticide
were used on 148,000 acres of corn to
control cutworms, 371,000 acres to
control corn rootworm beetles, and
55,000 acres to control first-generation
European corn borers.
Postemergence insecticides were
used on more than 4 million acres of
soybeans in 1988 (Table 29). Of this
11
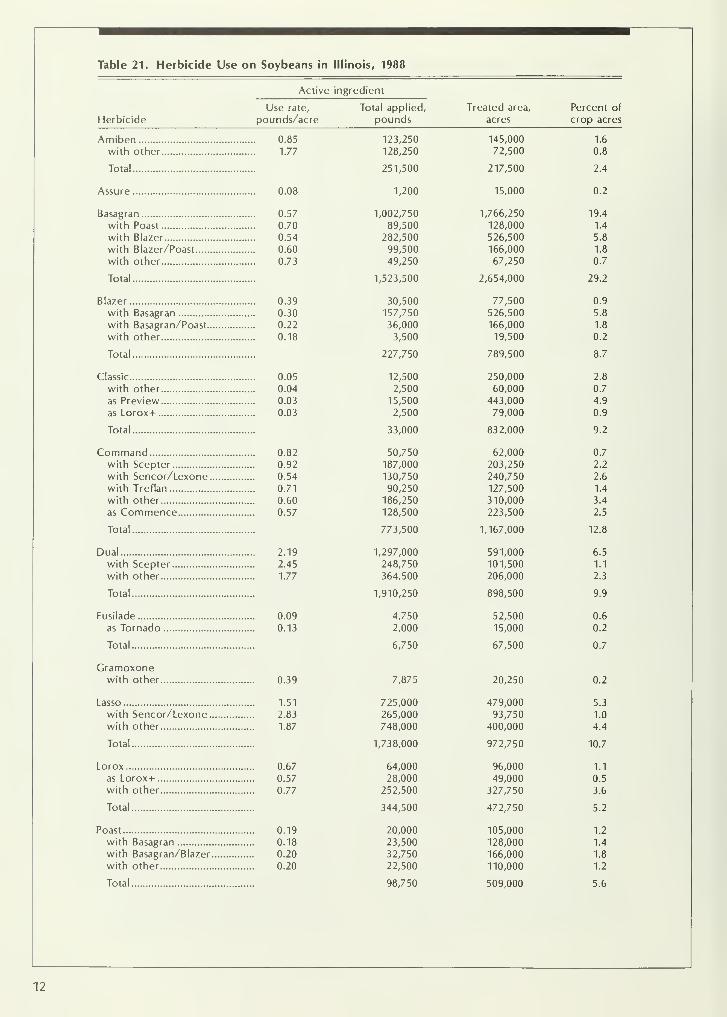
Table 21. Herbicide Use on Soybeans in Illinois, 1988
Active ingredient
Use rate,
Herbicide pounds/acre
Amiben 0.85
with other 1.77
Total
Assure 0.08
Basagran 0.57
with Poast 0.70
with Blazer 0.54
with Blazer/Poast 0.60
with other 0.73
Total
Blazer 0.39
with Basagran 0.30
with Basagran/Poast 0.22
with other 0.18
Total
Classic 0.05
with other 0.04
as Preview 0.03
as Lorox+ 0.03
Total
Command 0.82
with Scepter 0.92
with Sencor/Lexone 0.54
with Treflan 0.71
with other 0.60
as Commence 0.57
Total
Dual 2.19
with Scepter 2.45
with other 1.77
Total
Fusilade 0.09
as Tornado 0.13
Total
Gramoxonewith other 0.39
Lasso 1.51
with Sencor/Lexone 2.83
with other 1.87
Total
Lorox 0.67
as Lorox+ 0.57
with other 0.77
Total
Poast 0.19
with Basagran 0.18
with Basagran/Blazer 0.20
with other 0.20
Total
Total applied,
poundsTreated area,
acres
Percent of
crop acres
123,250
128,250
145,000
72,500
1.6
0.8
251,500 217,500 2.4
1,200 15,000 0.2
1,002,750
89,500
282,500
99,500
49,250
1,766,250
128,000
526,500
166,000
67,250
19.4
1.4
5.8
1.8
0.7
1,523,500 2,654,000 29.2
30,500
157,750
36,000
3,500
77,500
526,500
166,000
19,500
0.9
5.8
1.8
0.2
227,750 789,500 8.7
12,500
2,500
15,500
2,500
250,000
60,000
443,000
79,000
2.8
0.7
4.9
0.9
33,000 832,000 9.2
50,750
187,000
130,750
90,250
186,250
128,500
62,000
203,250
240,750
127,500
310,000
223,500
0.7
2.2
2.6
1.4
3.4
2.5
773,500 1,167,000 12.8
1,297,000
248,750
364,500
591,000
101,500
206,000
6.5
1.1
2.3
1,910,250 898,500 9.9
4,750
2,000
52,500
15,000
0.6
0.2
6,750 67,500 0.7
7,875 20,250 0.2
725,000
265,000
748,000
479,000
93,750
400,000
5.3
1.0
4.4
738,000 972,750 10.7
64,000
28,000
252,500
96,000
49,000
327,750
1.1
0.5
3.6
344,500 472,750 5.2
20,000
23,500
32,750
22,500
105,000
128,000
166,000
110,000
1.2
1.4
1.8
1.2
98,750 509,000 5.6
12
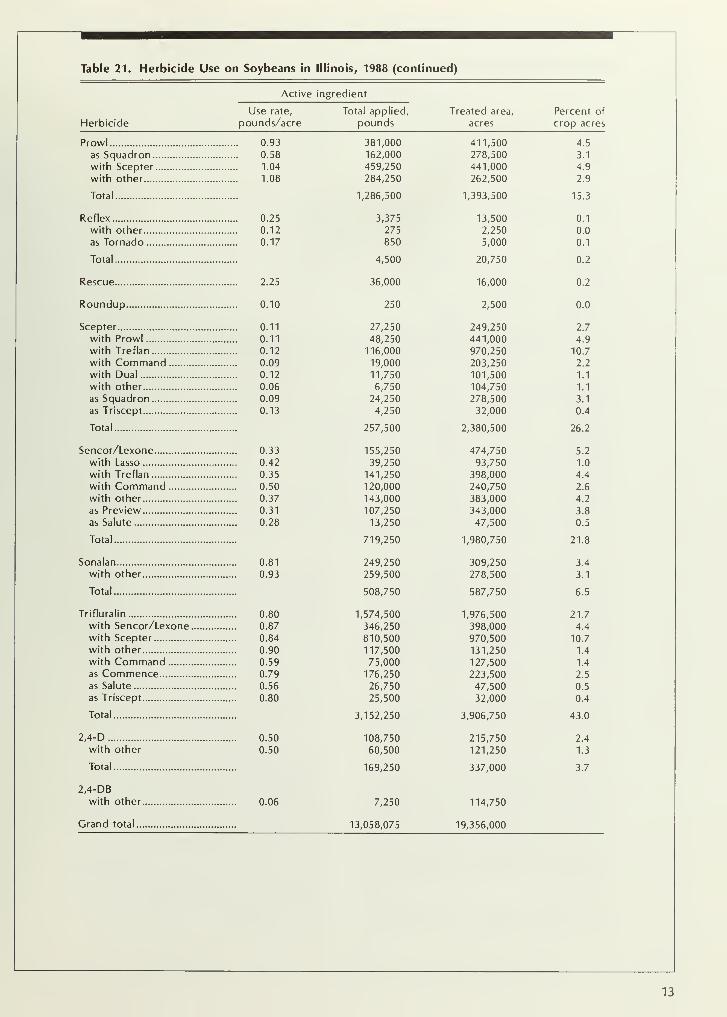
Table 21. Herbicide Use on Soybeans in Illinois, 1988 (continued)
Active ingredient
Use rate,
Herbicide pounds/acre
Prowl 0.93
as Squadron 0.58
with Scepter 1.04
with other 1.08
Total
Reflex 0.25
with other 0.12
as Tornado 0.17
Total
Rescue 2.25
Roundup 0.10
Scepter 0.11
with Prowl 0.11
with Treflan 0.12
with Command 0.09
with Dual 0.12
with other 0.06
as Squadron 0.09
as Triscept 0.13
Total
Sencor/Lexone 0.33
with Lasso 0.42
with Treflan 0.35
with Command 0.50
with other 0.37
as Preview 0.31
as Salute 0.28
Total
Sonalan 0.81
with other 0.93
Total
Trifluralin 0.80
with Sencor/Lexone 0.87
with Scepter 0.84
with other 0.90
with Command 0.59
as Commence 0.79
as Salute 0.56
as Triscept 0.80
Total
2,4-D 0.50
with other 0.50
Total
2,4-DBwith other 0.06
Grand total
Total applied, Treated area, Percent of
pounds acres crop acres
381,000 411,500 4.5
162,000 278,500 3.1
459,250 441,000 4.9
284,250 262,500 2.9
1,286,500 1,393,500 15.3
3,375 13,500 0.1
275 2,250 0.0
850 5,000 0.1
4,500 20,750 0.2
36,000 16,000 0.2
250 2,500 0.0
27,250 249,250 2.7
48,250 441,000 4.9
116,000 970,250 10.7
19,000 203,250 2.2
11,750 101,500 1.1
6,750 104,750 1.1
24,250 278,500 3.1
4,250 32,000 0.4
257,500 2,380,500 26.2
155,250 474,750 5.2
39,250 93,750 1.0
141,250 398,000 4.4
120,000 240,750 2.6
143,000 383,000 4.2
107,250 343,000 3.8
13,250 47,500 0.5
719,250 1,980,750 21.8
249,250 309,250 3.4
259,500 278,500 3.1
508,750 587,750 6.5
1,574,500 1,976,500 21.7
346,250 398,000 4.4
810,500 970,500 10.7
117,500 131,250 1.4
75,000 127,500 1.4
176,250 223,500 2.5
26,750 47,500 0.5
25,500 32,000 0.4
3,152,250 3,906,750 43.0
108,750 215,750 2.4
60,500 121,250 1.3
169,250 337,000 3.7
7,250 114,750
13,058,075 19,356,000
13
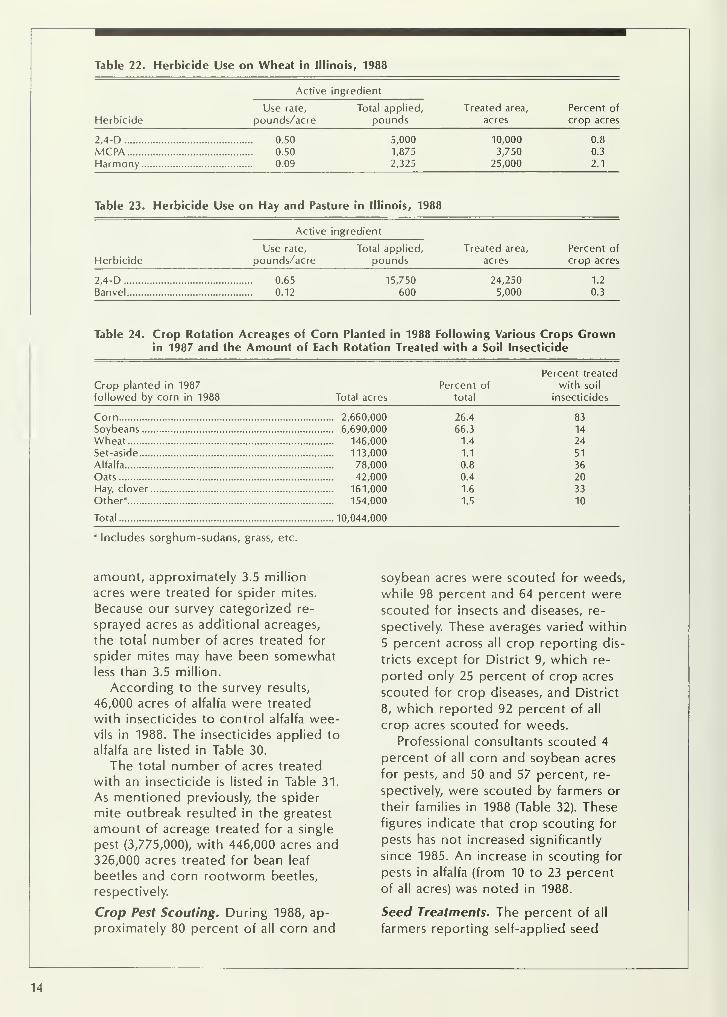
Table 22. Herbicide Use on Wheat in III' nois , 1988
Active ingr sdient
Treated area,
acresHerbicide
Use rate,
pounds/acreTotal applied,
poundsPercent of
crop acres
2,4-D 0.50 5,000
1,875
2,325
10,000
3,750
25,000
0.8
MCPAHarmony..
0.50
0.09
0.3
2.1
Table 23. Herbicide Use on Hay and Pasture in Illinois, 1988
Active ingr 2dient
Treated area,
acresHerbicide
Use rate,
pounds/acreTotal applied,
poundsPercent of
crop acres
2,4-D 0.65 15,750
60024,250
5,000
1.2
Banvel 0.12 0.3
Table 24. Crop Rotation Acreages of Corn Planted in 1988 Following Various Crops Grownin 1987 and the Amount of Each Rotation Treated with a Soil Insecticide
Crop planted in 1987
followed by corn in 1988 Total acres
Corn 2,660,000
Soybeans 6,690,000
Wheat 146,000
Set-aside 113,000
Alfalfa 78,000
Oats 42,000
Hay, clover 161,000
Other 3 154,000
Total 10,044,000
a Includes sorghum-sudans, grass, etc.
Percent treated
Percent of with soil
total insecticides
26.4 83
66.3 14
1.4 24
1.1 51
0.8 36
0.4 20
1.6 33
1.5 10
amount, approximately 3.5 million
acres were treated for spicier mites.
Because our survey categorized re-
sprayed acres as additional acreages,
the total number of acres treated for
spider mites may have been somewhatless than 3.5 million.
According to the survey results,
46,000 acres of alfalfa were treated
with insecticides to control alfalfa wee-vils in 1988. The insecticides applied to
alfalfa are listed in Table 30.
The total number of acres treated
with an insecticide is listed in Table 31.
As mentioned previously, the spider
mite outbreak resulted in the greatest
amount of acreage treated for a single
pest (3,775,000), with 446,000 acres and
326,000 acres treated for bean leaf
beetles and corn rootworm beetles,
respectively.
Crop Pest Scouting. During 1988, ap-
proximately 80 percent of all corn and
soybean acres were scouted for weeds,
while 98 percent and 64 percent werescouted for insects and diseases, re-
spectively. These averages varied within
5 percent across all crop reporting dis-
tricts except for District 9, which re-
ported only 25 percent of crop acres
scouted for crop diseases, and District
8, which reported 92 percent of all
crop acres scouted for weeds.
Professional consultants scouted 4
percent of all corn and soybean acres
for pests, and 50 and 57 percent, re-
spectively, were scouted by farmers or
their families in 1988 (Table 32). These
figures indicate that crop scouting for
pests has not increased significantly
since 1985. An increase in scouting for
pests in alfalfa (from 10 to 23 percent
of all acres) was noted in 1988.
Seed Treatments. The percent of all
farmers reporting self-applied seed
14
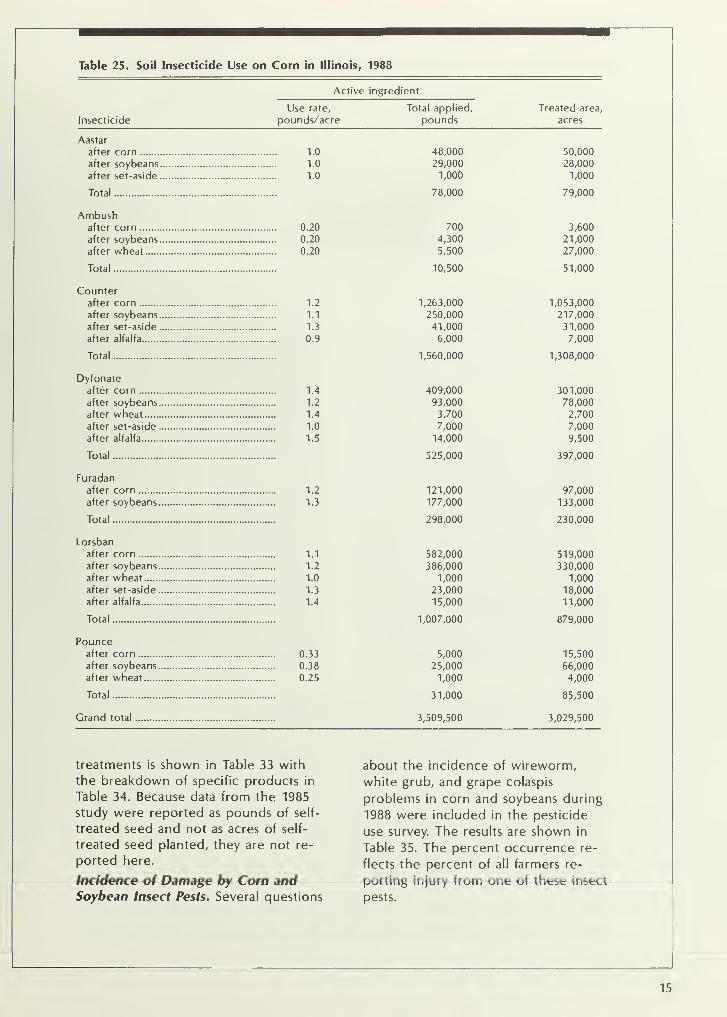
Table 25. Soil Insecticide Use on Corn in Illinois, 1988
Active ingredient
Use rate,
Insecticide pounds/acre
Aastar
after corn 1.0
after soybeans 1.0
after set-aside 1.0
Total
Ambushafter corn 0.20
after soybeans 0.20
after wheat 0.20
Total
Counterafter corn 1.2
after soybeans 1.1
after set-aside 1.3
after alfalfa 0.9
Total
Dyfonateafter corn 1.4
after soybeans 1.2
after wheat 1.4
after set-aside 1.0
after alfalfa 1.5
Total
Furadan
after corn 1.2
after soybeans 1.3
Total
Lorsban
after corn 1.1
after soybeans 1.2
after wheat 1.0
after set-aside 1.3
after alfalfa 1.4
Total
Pounceafter corn 0.33
after soybeans 0.38
after wheat 0.25
Total
Grand total
Total applied,
poundsTreated area,
acres
48,000
29,000
1,000
78,000
700
4,300
5,500
10,500
1,263,000
250,000
41,000
6,000
1,560,000
409,000
93,000
3,700
7,000
14,000
525,000
121,000
177,000
298,000
582,000
386,000
1,000
23,000
15,000
1,007,000
5,000
25,000
1,000
31,000
3,509,500
50,000
28,000
1,000
79,000
3,600
21,000
27,000
51,000
1,053,000
217,000
31,000
7,000
1,308,000
301,000
78,000
2,700
7,000
9,500
397,000
97,000
133,000
230,000
519,000
330,000
1,000
18,000
11,000
879,000
15,500
66,000
4,000
85,500
3,029,500
treatments is shown in Table 33 with
the breakdown of specific products in
Table 34. Because data from the 1985
study were reported as pounds of self-
treated seed and not as acres of self-
treated seed planted, they are not re-
ported here.
Incidence of Damage by Corn andSoybean Insect Pests. Several questions
about the incidence of wireworm,
white grub, and grape colaspis
problems in corn and soybeans during
1988 were included in the pesticide
use survey. The results are shown in
Table 35. The percent occurrence re-
flects the percent of all farmers re-
porting injury from one of these insect
pests.
15
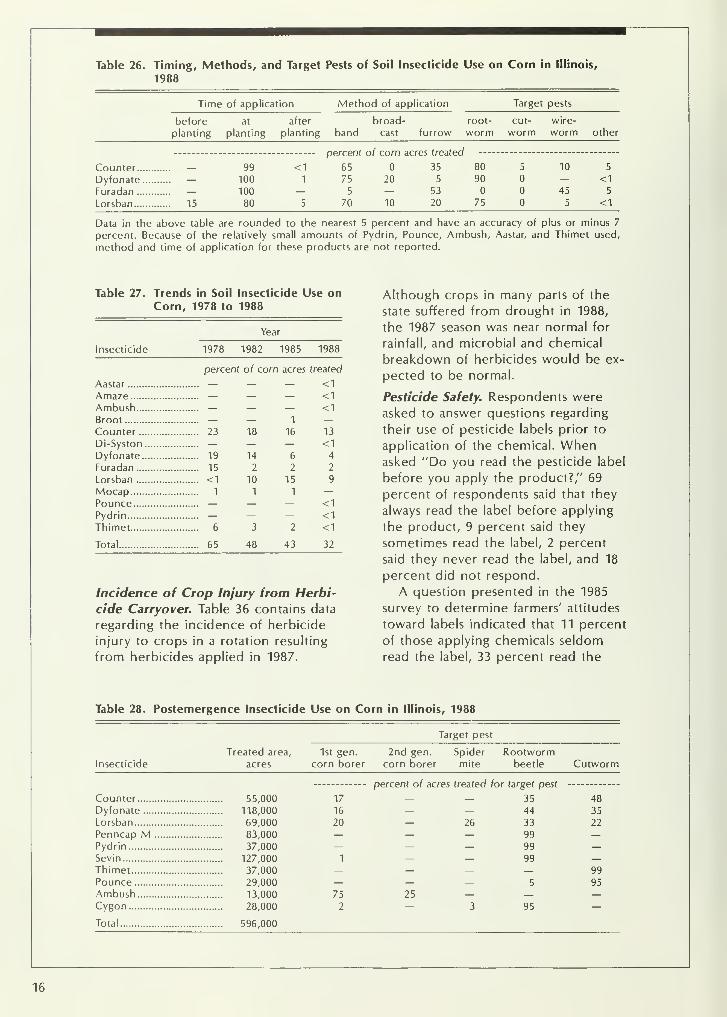
Table 26. Timing, Methods, and Target Pests of Soil Insecticide Use on Corn in Illinois,
1988
Time of application Method of application Target pests
before at after broad- root- cut- wire-
planting planting planting band cast furrow worm worm worm other
— percent of corn acres treated
Counter — 99 <1 65 35 80 5 10 5
Dyfonate — 100 1 75 20 5 90 — <1
Furadan — 100 5 53 45 5
Lorsban 15 80 5 70 10 20 75 5 <1
Data in the above table are rounded to the nearest 5 percent and have an accuracy of plus or minus 7
percent. Because of the relatively small amounts of Pydrin, Pounce, Ambush, Aastar, and Thimet used,
method and time of application for these products are not reported.
Table 27. Trends in Soil Insecticide Use onCorn, 1978 to 1988
Year
Insecticide 1978 1982 1985 1988
percent of com acres treated
Aastar — — — <1Amaze — — — <1Ambush — — — <1Broot — — 1
Counter 23 18 16 13
Di-Syston — — — <1Dyfonate 19 14 6 4
Furadan 15 2 2 2
Lorsban <1 10 15 9
Mocap 11 1 —Pounce — — — <1Pydrin — — — <1Thimet 6 3 2 <1
Total 65 48 43 32
Incidence of Crop Injury from Herbi-
cide Carryover. Table 36 contains data
regarding the incidence of herbicide
injury to crops in a rotation resulting
from herbicides applied in 1987.
Although crops in many parts of the
state suffered from drought in 1988,
the 1987 season was near normal for
rainfall, and microbial and chemical
breakdown of herbicides would be ex-
pected to be normal.
Pesticide Safety. Respondents were
asked to answer questions regarding
their use of pesticide labels prior to
application of the chemical. Whenasked "Do you read the pesticide label
before you apply the product?," 69
percent of respondents said that they
always read the label before applying
the product, 9 percent said they
sometimes read the label, 2 percent
said they never read the label, and 18
percent did not respond.
A question presented in the 1985
survey to determine farmers' attitudes
toward labels indicated that 11 percent
of those applying chemicals seldom
read the label, 33 percent read the
Table 28. Postemergence Insecticide Use on Corn in Illinois, 1988
Target pest
Treated area, 1st gen. 2nd gen. Spider
Insecticide acres corn borer corn borer mite
Rootwormbeetle Cutworm
Counter 55,000
Dyfonate 118,000
Lorsban 69,000
Penncap M 83,000
Pydrin 37,000
Sevin 127,000
Thimet 37,000
Pounce 29,000
Ambush 13,000
Cygon 28,000
Total 596,000
17
16
20
75
2
percent of acres treated for target pest
35— — 44
26 33
99
99
99
25
5
95
48
35
22
99
95
16
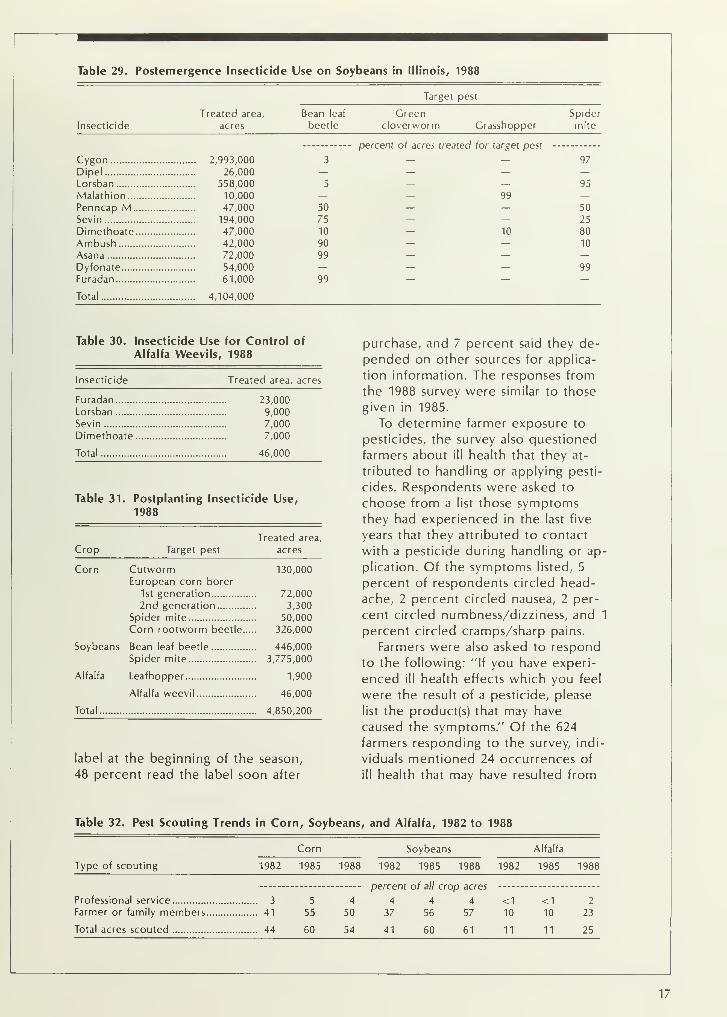
Table 29. Postemergence Insecticide Use on Soybeans in Illinois, 1988
Target pest
Insecticide
Treated area,
acres
Bean leaf
beetle
Greencloverworm Grasshopper
Spider
mite
Cygon 2,993,000
Dipel 26,000
Lorsban 558,000
Malathion 10,000
Penncap M 47,000
Sevin 194,000
Dimethoate 47,000
Ambush 42,000
Asana 72,000
Dyfonate 54,000
Furadan 61,000
Total 4,104,000
3
5
50
75
10
90
99
99
percent of acres treated for target pest
99
10
97
95
50
25
80
10
99
Table 30. Insecticide Use for Control of
Alfalfa Weevils, 1988
Insecticide Treated area, acres
Furadan 23,000
Lorsban 9,000
Sevin 7,000
Dimethoate 7,000
Total 46,000
Table 31. Postplanting Insecticide Use,
1988
Treated area,
Crop Target pest acres
Corn Cutworm 130,000
European corn borer
1st generation 72,000
2nd generation 3,300
Spider mite 50,000
Corn rootworm beetle 326,000
Soybeans Bean leaf beetle 446,000
Spider mite 3,775,000
Alfalfa Leafhopper 1,900
Alfalfa weevil 46,000
Total 4,850,200
label at the beginning of the season,
48 percent read the label soon after
purchase, and 7 percent said they de-
pended on other sources for applica-
tion information. The responses from
the 1988 survey were similar to those
given in 1985.
To determine farmer exposure to
pesticides, the survey also questioned
farmers about ill health that they at-
tributed to handling or applying pesti-
cides. Respondents were asked to
choose from a list those symptomsthey had experienced in the last five
years that they attributed to contact
with a pesticide during handling or ap-
plication. Of the symptoms listed, 5
percent of respondents circled head-
ache, 2 percent circled nausea, 2 per-
cent circled numbness/dizziness, and 1
percent circled cramps/sharp pains.
Farmers were also asked to respond
to the following: "If you have experi-
enced ill health effects which you feel
were the result of a pesticide, please
list the product(s) that may have
caused the symptoms." Of the 624
farmers responding to the survey, indi-
viduals mentioned 24 occurrences of
ill health that may have resulted from
Table 32. Pest Scouting Trends in Corn, Soybeans, and Alfalfa, 1982 to 1988
Corn Soybeans Alfalfa
Type of scouting 1982 1985 1988 1982 1985 1988 1982 1985 1988
Professional service 3
Farmer or family members 41
Total acres scouted 44
5
55
60
percent of all crop acres
4 4 4 4 <150 37 56 57 10
54 41 60 61 11
<110
11
2
23
25
17
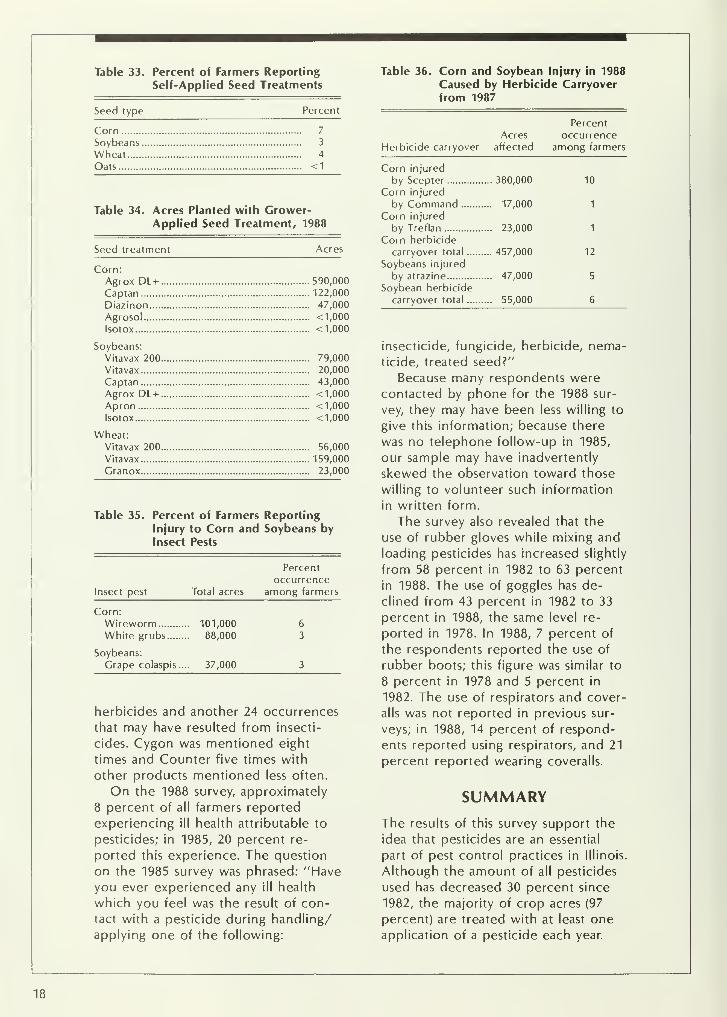
Table 33. Percent of Farmers Reporting
Self-Applied Seed Treatments
Seed type Percent
Corn 7
Soybeans 3
Wheat 4
Oats <1
Table 34. Acres Planted with Grower-Applied Seed Treatment, 1988
Seed treatment Acres
Corn:Agrox DL+ 590,000
Captan 122,000
Diazinon 47,000
Agrosol <1,000
Isotox <1,000
Soybeans:
Vitavax 200 79,000
Vitavax 20,000
Captan 43,000
Agrox DL+ <1,000Apron <1,000
Isotox <1,000
Wheat:Vitavax 200 56,000
Vitavax 159,000
Granox 23,000
Table 35. Percent of Farmers ReportingInjury to Corn and Soybeans by
Insect Pests
Table 36. Corn and Soybean Injury in 1988
Caused by Herbicide Carryover
from 1987
Insect pest Total acres
Percent
occurrenceamong farmers
Corn:
Wireworm 101,000
White grubs 88,000
Soybeans:
Crape colaspis .... 37,000
herbicides and another 24 occurrences
that may have resulted from insecti-
cides. Cygon was mentioned eight
times and Counter five times with
other products mentioned less often.
On the 1988 survey, approximately
8 percent of all farmers reported
experiencing ill health attributable to
pesticides; in 1985, 20 percent re-
ported this experience. The question
on the 1985 survey was phrased: "Haveyou ever experienced any ill health
which you feel was the result of con-
tact with a pesticide during handling/
applying one of the following:
Percent
Acres occurrence
Herbicide carryover affected among farmers
Corn injured
by Scepter .. 380,000 10
Corn injured
by Command .. 17,000 1
Corn injured
by Treflan .. 23,000 1
Corn herbicide
carryover total .. 457,000 12
Soybeans injured
by atrazine .. 47,000 5
Soybean herbicide
carryover total .. 55,000 6
insecticide, fungicide, herbicide, nema-ticide, treated seed?"
Because many respondents were
contacted by phone for the 1988 sur-
vey, they may have been less willing to
give this information; because there
was no telephone follow-up in 1985,
our sample may have inadvertently
skewed the observation toward those
willing to volunteer such information
in written form.
The survey also revealed that the
use of rubber gloves while mixing and
loading pesticides has increased slightly
from 58 percent in 1982 to 63 percent
in 1988. The use of goggles has de-
clined from 43 percent in 1982 to 33
percent in 1988, the same level re-
ported in 1978. In 1988, 7 percent of
the respondents reported the use of
rubber boots; this figure was similar to
8 percent in 1978 and 5 percent in
1982. The use of respirators and cover-
alls was not reported in previous sur-
veys; in 1988, 14 percent of respond-
ents reported using respirators, and 21
percent reported wearing coveralls.
SUMMARYThe results of this survey support the
idea that pesticides are an essential
part of pest control practices in Illinois.
Although the amount of all pesticides
used has decreased 30 percent since
1982, the majority of crop acres (97
percent) are treated with at least oneapplication of a pesticide each year.
18
Reasons for the drop in the amount of
active ingredient of pesticides may in-
clude better management, an effort to
reduce expenses, and use of pesticides
that are efficacious at much lower con-
centrations.
One of the more important trends
indicated by the results of this survey
is that more reduced tillage and less
moldboard plowing is done. Mold-board plows are used on only 17 and
13 percent of corn and soybean acres,
respectively, as tillage implements such
as field cultivators and multiple tillage
tools are used more extensively.
Cultivation, which has been consis-
tently used on 85 to 90 percent of all
corn and soybean acreage over the last
decade, is often used as a substitute
for herbicides. Farmers also continue
to use crop rotation to reduce the
need for insecticides. Approximately
three-fourths of Illinois corn, a crop
that typically must receive an insecti-
cide treatment when planted in con-
tinuous culture, is planted in rotations
of other crops.
Although the majority of farmers
seem concerned about pesticide safety,
their responses to the questions about
reading pesticide labels and using
safety equipment during mixing and
application indicate a need for ex-
panded pesticide safety education. Thenumber of occurrences of ill health at-
tributed to pesticide exposure also
emphasizes the need for further edu-
cation about using pesticides safely.
19
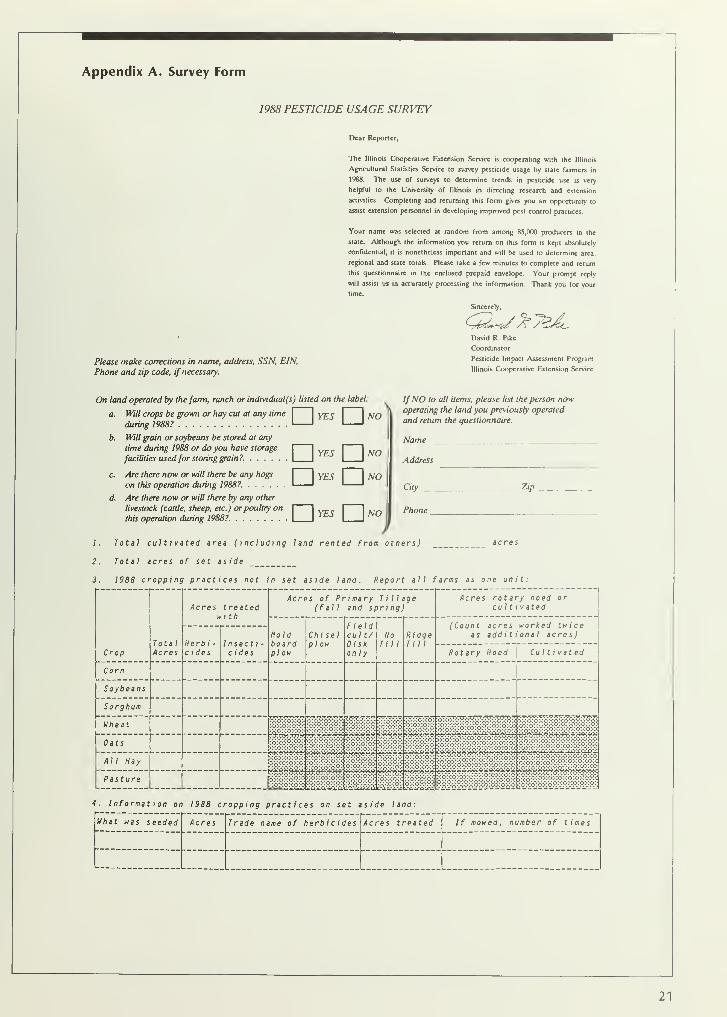
Appendix A. Survey Form
1988 PESTICIDE USAGE SURVEY
Dear Reporter,
The Illinois Cooperative Extension Service is cooperating with the Illinois
Agricultural Statistics Service to survey pesticide usage by state farmers in
1988. The use of surveys to determine trends in pesticide use is very
helpful to the University of Illinois in directing research and extension
activities. Completing and returning this form gives you an opportunity to
assist extension personnel in developing improved pest control practices.
Please make corrections in name, address, SSN, EIN,
Phone and zip code, if necessary.
Your name was selected at random from among 85,000 producers in the
state. Although the information you return on this form is kept absolutely
confidential, it is nonetheless important and will be used to determine area,
regional and state totals. Please take a few minutes to complete and return
this questionnaire in the enclosed prepaid envelope. Your prompt reply
will assist us in accurately processing the information. Thank you for your
time.
Sincerely,
David R. Pike
Coordinator
Pesticide Impact Assessment Program
Illinois Cooperative Extension Service
On land operated by the farm, ranch or individual(s) listed on the label:
a. Will crops be grown or hay cut at any time| | yES \ I
NOduring 1988? ' ' ' '
b. Will grain or soybeans be stored at any
time during 1988 or do you have storage I I I" ~|
facilities usedfor storing grain?. I I I I
c. Are there now or will there be any hogs
on this operation during 1988?. ....
d Are there now or will there by any other
livestock (cattle, sheep, etc.) or poultry on I I [" ~]
this operation during 1988?. I I
r"I I
NU
«* NO
IfNO to all items, please list the person nowoperating the land you previously operated
and return the questionnaire.
Name
Address
City Zip
Phone
/1. Total cultivated area (
l
ncludi ng land rented from otners) acres
2. Total acres of set aside
3. 1988 cropping practices not in set aside land. Report all farms as one unit:
CropTotalAcres
Acres treatedwith
Herbi-cides
1 nsecticides
Acres of Primary Tillage(fall and spring)
Holdboardpi ow
Chiselp 1 ow
Fieldcult/Diskonly
HoTill
RidgeTill
Acres rotary hoed orcultivated
(Count acres worked twiceas add i t i ona 1 acres)
Rotary Hoed Cultivated
Corn
Soybeans
Sorghum
Uheat
Oats
All Hay
Pasture
4. Information on 1988 cropping practices on set aside land:
What was seeded Acres Trade name of herbicides Acres treated If mowed, number of times
21
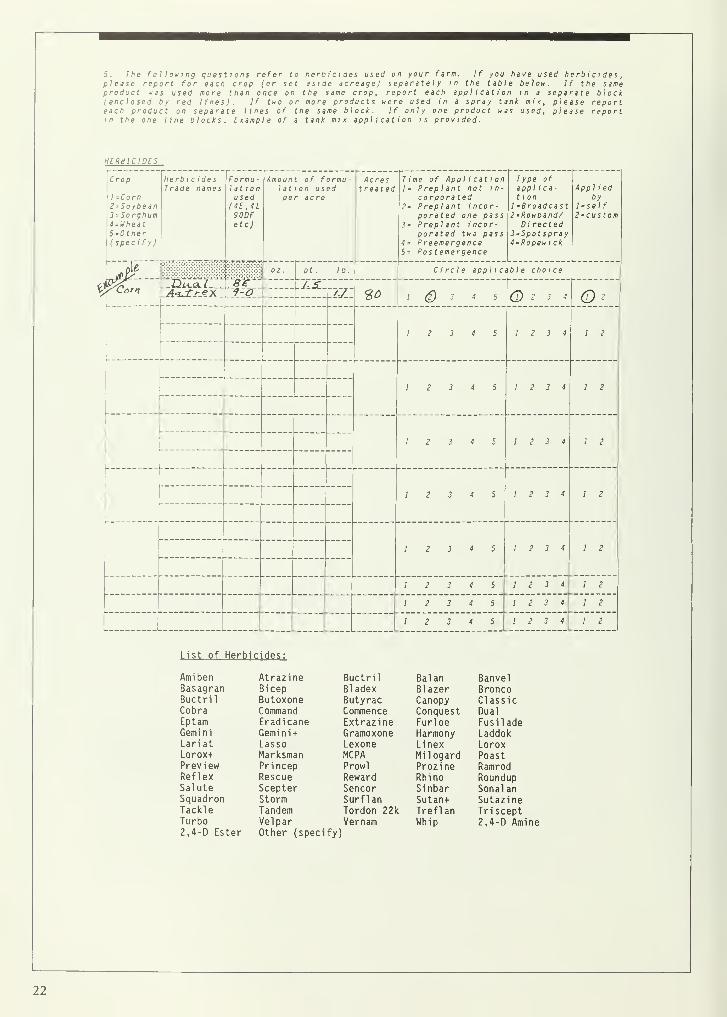
5. The following questions refer to herbicides used on your farm. If you have used herbicides,please report for each crop (or set aside acreage) separately in the table below. If the sameproduct was used more than once on the same crop, report each application in a separate block(enclosed by red lines). If two or more products were used in a spray tank mix, please reporteach product on separate lines of the same block. If only one product was used, please reportin the one line blocks. Example of a tank mix application is provided.
HERBICIDES
Crop
l=Corn2'Soybean3=Sorghum4=Uheat5'0ther(specify)
HerbicidesTrade names
Formu
-
1 at i onused(1E.4L90DFetc)
Amounlatpe
01 .
t of f
ion usr acre
,..
ormu -
ed
lb.
77/-
Acrestreated
SO
Time of Application Type of1= Preplant not in- applica-
corpora ted 1 1 on2= Preplant incor- 1-Broadcast
porated one pass 2-Rowband/J= Preplant incor- Directed
porated two pass 3*Spot spray4= Preemergence 4-Ropew i ck5= Post emergence
Circle applicable choice
1 (f) 3 4 5 Q 2 3 4
App 1 i edby
l*self2-custom
<c\
12 3 4 5 12 3 4 1 2
12 3 4 5 12 3 4 1 2
12 3 4 5 12 3 4 1 2
12 3 4 5 12 3 4 1 2
12 3 4 5 12 3 4 1 2
12 3 4 5 12 3 4 1 2
12 3 4 5 12 3 4 1 2
L
12 3 4 5 12 3 4 1 2
List of Herbicides:
Ami benBasagranBuctrilCobraEptamGeminiLariatLorox+PreviewReflexSaluteSquadronTackleTurbo2,4-D Ester
AtrazineBicepButoxoneCommandEradicaneGemini+LassoMarksmanPrincepRescueScepterStormTandemVelparOther (speci
BuctrilBladexButyracCommenceExtrazineGramoxoneLexoneMCPAProwl
RewardSencorSurfIanTordon 22kVernam
fy)
BalanBlazerCanopyConquestFurloeHarmonyLinexMilogardProzineRhinoSinbarSutan+TreflanWhip
BanvelBroncoClassicDual
FusiladeLaddokLoroxPoastRamrodRoundupSonalanSutazineTriscept2,4-D Amine
22
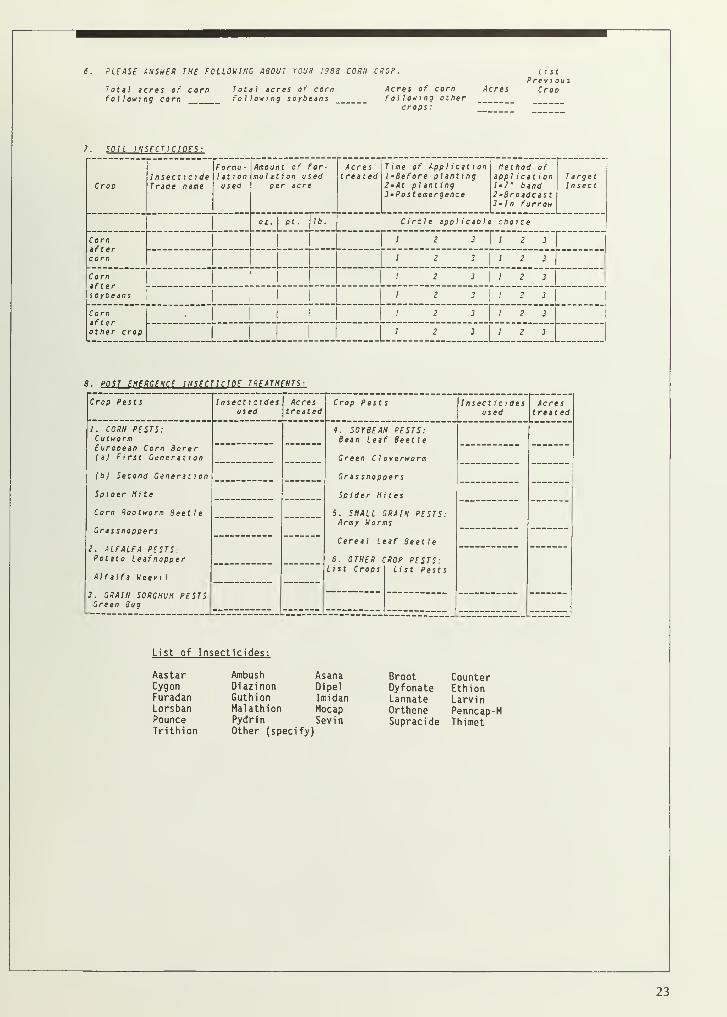
PLEASE ANSWER THE FOLLOWING ABOUT YOUR 1988 CORN CROP
Total acres of cornfollowing corn
Total acres of cornfollowing soybeans
CORN CROP. ListPrev i ous
Acres of corn Acres Cropf o 1 1 owi ng other
crops :
7. SOU INSECTICIDES:
CropInsect i cideTraae name
Fornu
-
1 at i onused
Amount of for-mulation used
per acre
Acrestreated
T ime of App 1 i c at i on1-Before planting2-At planting3-Pos t emergence
Method ofappl i cat i on1-7" band2-Broadcast3'ln furrow
T argetI nsect
L!fi,, lb. Circle appl i cabl e choice
Cornaftercorn
1 2 3 , . ,\
, 2 ,
Cornafterso yoeans
._...1 2 3 1 2 3
1
1
1 2 3 1 2 31
Cornafterother crop
1
1 2 3 |"; 2 3
1 .__;
_..__.i. lIl-ljJ
8. POST EMERGENCE INSECTICIDE TREATMENTS:
Crop Pests I nsecti cidesused
Acrestreated
Crop Pests Insect i cidesused
Acrestreated
I. CORN PESTS:CutwormEuropean Corn Borer( a ) First Genera t i on
4. SOYBEAN PESTS:Bean Leaf Beetle
Green C 1 overworm
( b) Second Generat i on Grasshoppers
Spiaer Mite Spider Mites
Corn Rootworn Beetle
Grasshoppers
2. ALFALFA PESTS:Potato Leafhopper
Alfalfa Weevi 1
5. SMALL (
Army Won
Cereal £<
6. OTHER C
List Crops
'.RAIN PESTS:is
'af Beetle
'ROP PESTS:List Pests
3. GRAIN SORGHUM PESTSGreen Bug
List of Insecticides:
Aastar Ambush Asana Broot CounterCygon Diazinon Dipel Dyfonate EthionFuradan Guthion Imidan Lannate LarvinLorsban Malathion Mocap Orthene Penncap-MPounce Pydrin Sevin Supracide ThimetTrithion Other (speci fy)
23
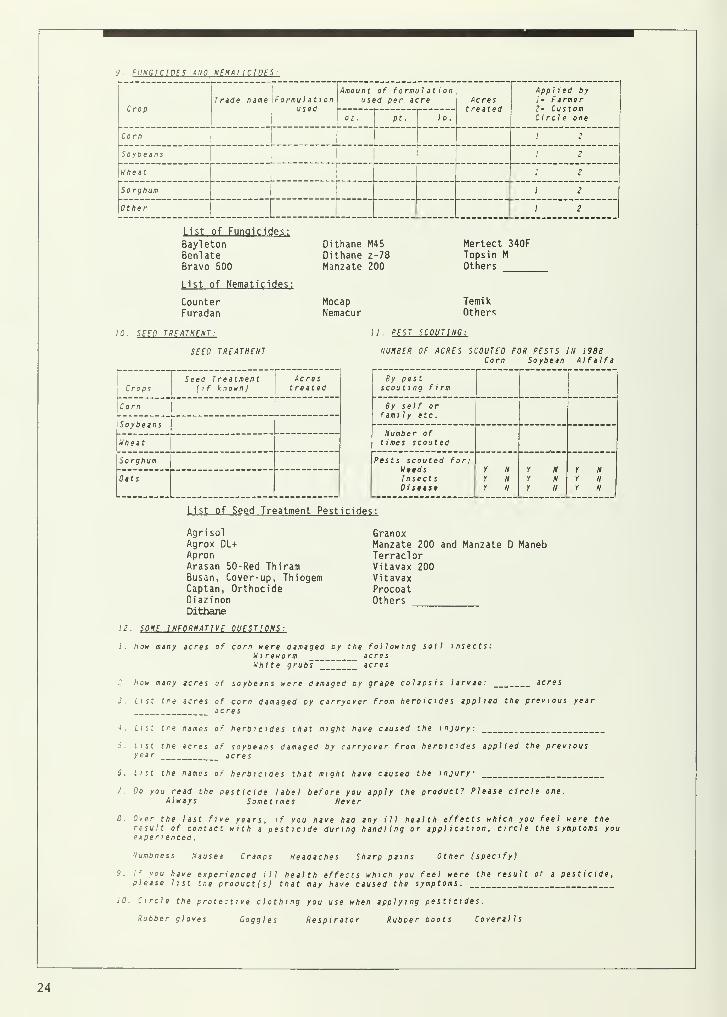
9 . FUNGICIDES AND NEMAI 1C1DES:
CropTrade name F ormu I at 1 on
used
Amount of formulationused per acre Acres
treated
Applied by1= Farmer2= CustomCircle one
.:.':...,.. lb.
Corn 1 2
Soybeans ! 2
Wheat 2
Sorghum 1 2
Other zz I 2
10.
List of Fungicides:
BayletonBenlateBravo 500
List of Nematicides:
CounterFuradan
SEED TREATMENT:
SEED TREATMENT
Dithane M45Dithane z-78Manzate 200
MocapNemacur
Mertect 340FTopsin MOthers
TemikOther-;
ij. PEST SCOUTING:
NUMBER OF ACRES SCOUTED FOR PESTS III 1988Corn Soybean Alfalfa
CropsSeed T reatment
(if known )
Acrest reated
Corn
Soybeans
Wheat
Sorghum
Oats
By pestscout i ng f i rm
1
By self orfamily etc.
Number oftimes scouted
Pests scouted for:WeedsInsectsDisease
r ni Nr n
r nY NY II
Y NY NY N
List of Seed Treatment Pesticides:
AgrisolAgrox DL+ApronArasan 50-Red ThiramBusan, Cover-up, ThiogemCaptan, OrthocideDiazinonDithane
12. SOME INFORMATIVE QUESTIONS:
GranoxManzate 200 and Manzate D ManebTerraclorVitavax 200VitavaxProcoatOthers
1. How many acres of corn were damaged by the following soil insects:W i reworm _ acresWhite grubs _ ™ acres
2. How many acres of soybeans were damaged by grape colapsis larvae: acres
3. List the acres of corn damaged by carryover from herbi cides applied the previous yearacres
J. List tne names of herbi ci des that might have caused the injury:
5. List the acres of soybeans damaged by carryover from herbi c ides applied the previousyear acres
6. List the names of herbi ci des that might have caused the injury:
/. Do you read the pesticide label before you apply the product? Please circle one.Always Sometimes Never
8. Over the last five years, if you have had any ill health effects which you feel were theresult of contact with a pesticide during handling or application, circle the symptoms youexpert enced
.
numbness Nausea Cramps Headaches Sharp pains Other (specify)
9. If you have experienced ill health effects which you fee! were the result of a pesticide ,
please list tne product ( s ) that may have caused the symptoms.
10. Circle the protect i ve clothing you use when applying pesticides.
Rubber gloves Goggles Respi rator Rubber boots Coveralls
24
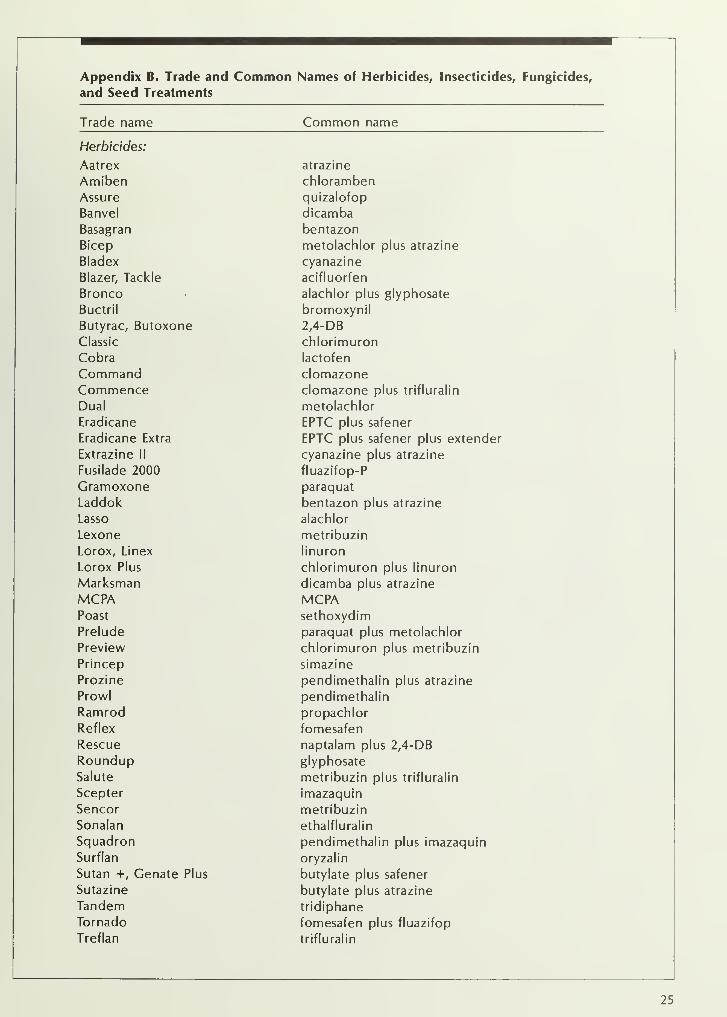
Appendix B. Trade and Common Names of Herbicides, Insecticides, Fungicides,
and Seed Treatments
Trade name Common name
Herbicides:
Aatrex atrazine
Amiben chloramben
Assure quizalofop
Banvel dicamba
Basagran bentazon
Bicep metolachlor plus atrazine
Bladex cyanazine
Blazer, Tackle acifluorfen
Bronco alachlor plus glyphosate
Buctril bromoxynil
Butyrac, Butoxone 2,4-DB
Classic chlorimuron
Cobra lactofen
Command clomazone
Commence clomazone plus trifluralin
Dual metolachlor
Eradicane EPTC plus safener
Eradicane Extra EPTC plus safener plus extender
Extrazine II cyanazine plus atrazine
Fusilade 2000 fluazifop-P
Gramoxone paraquat
Laddok bentazon plus atrazine
Lasso alachlor
Lexone metribuzin
Lorox, Linex linuron
Lorox Plus chlorimuron plus linuron
Marksman dicamba plus atrazine
MCPA MCPAPoast sethoxydim
Prelude paraquat plus metolachlor
Preview chlorimuron plus metribuzin
Princep simazine
Prozine pendimethalin plus atrazine
Prowl pendimethalin
Ramrod propachlor
Reflex fomesafen
Rescue naptalam plus 2,4-DB
Roundup glyphosate
Salute metribuzin plus trifluralin
Scepter imazaquin
Sencor metribuzin
Sonalan ethalfluralin
Squadron pendimethalin plus imazaquin
Surflan oryzalin
Sutan +, Genate Plus butylate plus safener
Sutazine butylate plus atrazine
Tandem tridiphane
Tornado fomesafen plus fluazifop
Treflan trifluralin
25
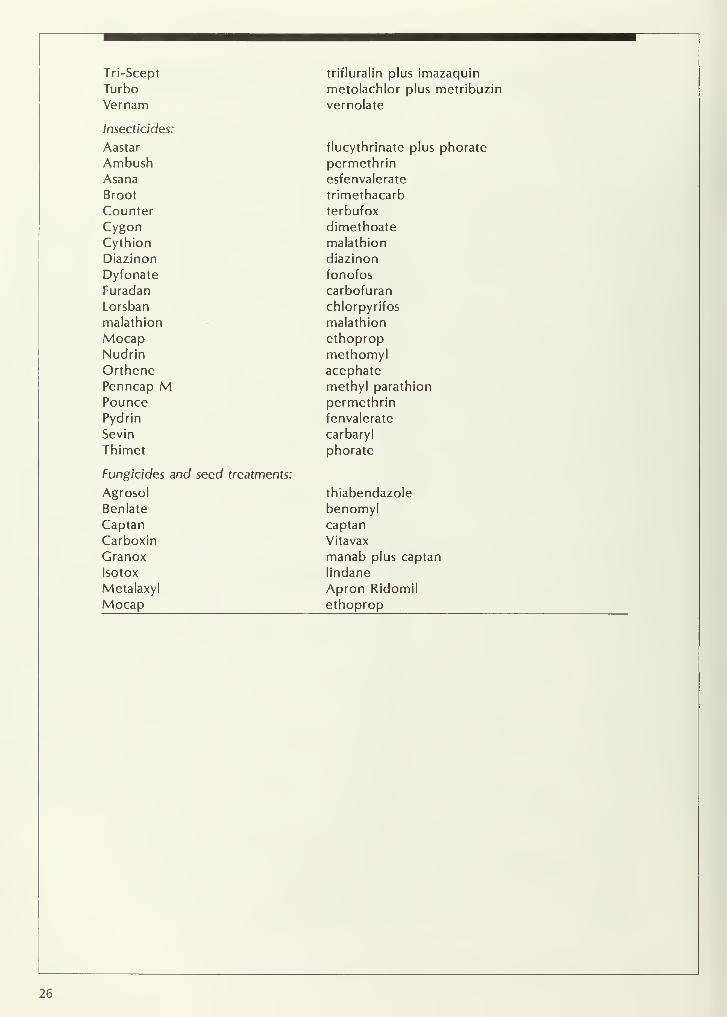
Tri-Scept trifluralin plus imazaquin
Turbo metolachlor plus metribuzin
Vernam vernolate
Insecticides:
Aastar flucythrinate plus phorate
Ambush permethrin
Asana esfenvalerate
Broot trimethacarb
Counter terbufox
Cygon dimethoate
Cythion malathion
Diazinon diazinon
Dyfonate fonofos
Furadan carbofuran
Lorsban chlorpyrifos
malathion malathion
Mocap ethoprop
Nudrin methomylOrthene acephate
Penncap M methyl parathion
Pounce permethrin
Pydrin fenvalerate
Sevin carbaryl
Thimet phorate
Fungicides and seed treatments:
Agrosol thiabendazole
Benlate benomylCaptan captan
Carboxin Vitavax
Granox manab plus captan
Isotox lindane
Metalaxyl Apron Ridomil
Mocap ethoprop
26


UNIVERSITY OF ILLINOIS-URBANA