Embed Size (px)
Citation preview
Predictors of Urinary and Blood Metal(loid) Concentrations among Pregnant Women in Northern Puerto Rico
Pahriya Ashrap1, Deborah J. Watkins1, Bhramar Mukherjee2, Jonathan Boss2, Michael J. Richards3, Zaira Rosario4, Carmen M. Vélez-Vega5, Akram Alshawabkeh6, José F Cordero4, John D. Meeker1
1University of Michigan School of Public Health, Department of Environmental Health Sciences, Ann Arbor, Michigan, United States
2University of Michigan School of Public Health, Department of Biostatistics, Ann Arbor, Michigan, United States
3NSF International, Ann Arbor, Michigan, United States
4Department of Epidemiology and Biostatistics, University of Georgia, Athens, Georgia, United States
5University of Puerto Rico Graduate School of Public Health, UPR Medical Sciences Campus, San Juan, Puerto Rico
6College of Engineering, Northeastern University, Boston, Massachusetts, United States
Abstract
Given the potential adverse health effects related to toxic trace metal exposure and insufficient or
excessive levels of essential trace metals in pregnant women and their fetuses, the present study
characterizes biomarkers of metal and metalloid exposure at repeated time points during
pregnancy among women in Puerto Rico. We recruited 1,040 pregnant women from prenatal
clinics and collected urine, blood, and questionnaire data on demographics, product use, food
consumption, and water usage at up to three visits. All samples were analyzed for 16 metal(loid)s:
arsenic (As), barium (Ba), beryllium (Be), cadmium (Cd), cobalt (Co), chromium (Cr), cesium
(Cs), copper (Cu), mercury (Hg), manganese (Mn), nickel (Ni), lead (Pb), titanium (Ti), uranium
(U), vanadium (V), and zinc (Zn). Urine samples were additionally analyzed for molybdenum
(Mo), platinum (Pt), antimony (Sb), tin (Sn), and tungsten (W). Mean concentrations of most
metal(loid)s were higher among participants compared to the general US female population. We
*Corresponding author: John D. Meeker, University of Michigan School of Public Health, Department of Environmental Health Sciences, 1415 Washington Heights, Ann Arbor, Michigan 48109, USA, [email protected], telephone: 1.734.764.7184.
Conflict of InterestThe authors declare that they have no actual or potential competing financial interests.Declaration of interestsThe authors declare that they have no known competing financial interests or personal relationships that could have appeared to influence the work reported in this paper.
Publisher's Disclaimer: This is a PDF file of an unedited manuscript that has been accepted for publication. As a service to our customers we are providing this early version of the manuscript. The manuscript will undergo copyediting, typesetting, and review of the resulting proof before it is published in its final form. Please note that during the production process errors may be discovered which could affect the content, and all legal disclaimers that apply to the journal pertain.
HHS Public AccessAuthor manuscriptEnviron Res. Author manuscript; available in PMC 2021 April 01.
Published in final edited form as:Environ Res. 2020 April ; 183: 109178. doi:10.1016/j.envres.2020.109178.
Author M
anuscriptA
uthor Manuscript
Author M
anuscriptA
uthor Manuscript

found weak to moderate correlations for inter-matrix comparisons, and moderate to strong
correlations between several metal(loid)s measured within each biological matrix. Blood
concentrations of Cu, Zn, Mn, Hg, and Pb, and urinary concentrations of As, Ni, and Co, were
shown to reflect reliable biomarkers of exposure. For other metals, repeated samples are
recommended for exposure assessment in epidemiology studies. Predictors of metal(loid)
biomarkers included fish and rice consumption (urinary As), fish and canned food (blood Hg),
drinking public water (blood Pb), smoking (blood Cd), and iron/folic acid supplement use (urinary
Cs, Mo, and Sb). Characterization of metal(loid) biomarker variation over time and between
matrices, and identification of important exposure sources, may inform future epidemiology
studies and exposure reduction strategies.
Keywords
Exposure assessment; Pregnancy; Metals; Blood; Urine; Biomarkers
INTRODUCTION
Metals and metalloids occur naturally in the environment and enter the human body through
ingestion of food, water, and supplements, and the use of metal-containing products via
inhalation, dermal absorption, and incidental ingestion (Borowska and Brzoska 2015;
Gorman Ng et al. 2017; Martin and Griswold 2009; Rehman et al. 2018; Singh et al. 2011).
In the United States, reports from the National Health and Nutrition Examination Survey
(NHANES) show that children and adults have detectable concentrations of a range of
metal(loid)s in their bodies (Centers for Disease Control and Prevention (CDC) 2019),
including pregnant women and their fetuses because of trans-placental metal(loid) transfer
(Caserta et al. 2013; Chen et al. 2014; Punshon et al. 2016). Some of these metals are
essential for human health and required for fetal growth (Horning et al. 2015; Nordberg et al.
2001), such as cobalt (Co), copper (Cu), iron (Fe), magnesium (Mg), manganese (Mn),
molybdenum (Mo), nickel (Ni), selenium (Se) and zinc (Zn). Excess or insufficient levels of
these metals may pose risks to pregnancy (Nordberg et al. 2001; O'Neal and Zheng 2015).
Other metal(loid)s do not play an essential physiologic role and can be toxic if present even
at low concentrations (Jaishankar et al. 2014; Jan et al. 2015; Singh et al. 2011); some,
including lead (Pb) and mercury (Hg), are reproductive toxicants and neurotoxicants, while
others, such as cadmium (Cd) and arsenic (As), are known human carcinogens. Several
metal(loid)s (Pb, Hg, Cd, As, Mn, Zn) are also suspected endocrine disruptors (Bloom et al.
2010; De Coster and van Larebeke 2012; Diamanti-Kandarakis et al. 2009; Mendiola et al.
2011).
Puerto Rico has a long-standing history of contamination with environmental chemicals,
with 200+ hazardous waste sites and 16 active Superfund sites (the hazardous waste lands
identified by the EPA as a site for cleanup because it poses a risk to human health and/or the
environment) (Padilla et al. 2011). Many contaminated sites are above unlined landfills that
overlie Karst aquifers, creating pathways for contamination of groundwater and potential
drinking water sources. Therefore, the risk of human exposure to metal(loid) contamination
is high. However, little is known regarding the extent and specific sources of human
Ashrap et al. Page 2
Environ Res. Author manuscript; available in PMC 2021 April 01.
Author M
anuscriptA
uthor Manuscript
Author M
anuscriptA
uthor Manuscript

metal(loid) exposure on the island. This is the first study to examine distributions, time
trends, and predictors of urinary and blood metal(loid) biomarkers measured at multiple
times during pregnancy among women living in Northern Puerto Rico. Characterizing
relationships of metal(loid) biomarkers over time and between matrices, and identifying
important exposure sources to metal(loid)s, may inform risk evaluations in epidemiology
and targeted approaches to reduce metal(loid) exposure.
METHODS
2.1. Study Population
This study was conducted among pregnant women participating in the Puerto Rico Testsite
for Exploring Contamination Threats (PROTECT) project (Ashrap et al. 2018; Cantonwine
et al. 2014; Meeker et al. 2013; Watkins et al. 2015), an ongoing prospective birth cohort in
the Northern Karst Region of Puerto Rico that began in 2010. PROTECT aims to explore
environmental toxicants and other factors contributing to preterm birth risk and other
adverse birth outcomes in Puerto Rico.
Study participants were recruited at approximately 14 ± 2 weeks of gestation at seven
prenatal clinics and hospitals throughout Northern Puerto Rico and followed until delivery.
The present analysis reflects 1,040 women recruited into the study thus far at 18 to 40 years
of age. Details on the recruitment and inclusion criteria have been described previously
(Cantonwine et al. 2014; Meeker et al. 2013). Spot urine samples were collected from
women at three separate study visits (18 ± 2 weeks, 22 ± 2 weeks, and 26 ± 2 weeks of
gestation) and blood samples were collected during the first and third visits. During the
initial visit, questionnaires collecting demographic information were administered to
participants. Information on housing characteristics, employment status, and family situation
were collected during a second, in-home visit using a nurse-administered questionnaire.
Household product, personal care product use, and water source and usage information were
collected at each visit.
The research protocol was approved by the Ethics and Research Committees of the
University of Puerto Rico and participating clinics, the University of Michigan, and
Northeastern University. The study was described in detail to all participants, and informed
consent was obtained prior to study enrollment.
2.2. Measurement of Metal(loid)s
Spot urine was collected in sterile polypropylene cups and aliquoted within one hour after
collection, while blood samples were collected in metal-free whole blood tubes. All samples
were frozen and stored at −80°C and shipped on dry ice to NSF International (Ann Arbor,
MI, USA) for analysis. Concentrations of 16 metals and metalloids (As) were measured in
both urine and blood: As, barium (Ba), beryllium (Be), Cd, Co, chromium (Cr), cesium (Cs),
Cu, Hg, Mn, Ni, Pb, titanium (Ti), uranium (U), vanadium (V), and Zn; an additional 5
metals and metalloids (antimony) were measured in urine only: Mo, platinum (Pt), antimony
(Sb), tin (Sn), and tungsten (W). Metal(loid) concentrations were measured using
inductively coupled plasma mass spectrometry (ICPMS) as described previously (Kim et al.
Ashrap et al. Page 3
Environ Res. Author manuscript; available in PMC 2021 April 01.
Author M
anuscriptA
uthor Manuscript
Author M
anuscriptA
uthor Manuscript
2018). Considering that biological samples have high levels of carbon and chloride in the
matrix, the laboratory selected the appropriate isotopes for the requested elements to best
avoid interferences where possible. The ICPMS was calibrated with a blank and a minimum
of 4 standards for each element of interest. An R2 value of >0.995 was the minimum criteria
for an acceptable calibration curve. The calibration curves were verified by initial checks at
three calibration points within the curve. Continuing calibration checks and blanks after
every 10 samples were also utilized throughout the analytical run to ensure the ICPMS
system was maintaining acceptable performance. Urinary specific gravity (SG) was
measured at the University of Puerto Rico Medical Sciences Campus using a hand-held
digital refractometer (Atago Co., Ltd., Tokyo, Japan) as an indicator of urine dilution.
2.3. Questionnaire
The product use questionnaire was adapted from questionnaires used in other studies of
adults to capture information on potential exposure sources with which the pregnant women
may have been in contact (Cantonwine et al. 2014; Meeker et al. 2013). At each visit, the
questionnaire was administered by a study nurse to collect data on product and water use.
The household/personal care product use section contained yes/no questions about the use of
different products in the 48-h period preceding biological sample collection: bar soap,
cologne/perfume, colored cosmetics, conditioner, deodorant, fingernail polish, hair cream,
hairspray/ hair gel, laundry products, liquid soap, lotion, mouthwash, other hair products,
shampoo, and shaving cream. In the water use section, participants were asked about the
type of water utilized for drinking and cooking (municipal water, private well water, bottled/
delivered water) as well as water storage behaviors (use of water cistern, filtration). In the
second visit, participants also completed a food frequency questionnaire on the consumption
of milk, cheese, fish, rice, yogurt, and other foods (never, <1 per month, 1 per month, 2–3
per month, 1 per week, 2 per week, 3–4 per week, 5-6 per week, 1 per day and 2 or more per
day) as well as yes/no questions regarding supplement use (iron, folic acid, multivitamin,
etc.).
2.4. Statistical Methods
To account for urinary dilution, metal(loid) concentrations in urine were corrected for SG
using the equation: Pc = P[(SGp – 1)/(SGi – 1)]; where Pc is the SG corrected biomarker
concentration (ng/mL), P is the measured biomarker concentration, SGp is the median
urinary specific gravity in this population (1.019), and SGi is the individual’s urinary
specific gravity. Biomarker concentrations below the limit of detection (LOD) were replaced
by LOD/√2. For statistical analysis, we included metal(loid)s with at least 50% of samples
having concentrations above the LOD (Carmichael et al. 2010; Curwin et al. 2005; Dorgan
et al. 1999).
Descriptive statistics and comparison to NHANES—Descriptive statistics
[geometric means (GM), geometric standard deviation (GSD), select percentiles] of urine
and blood concentrations were calculated to describe distributions of metal(loid)
concentrations among study participants and for comparison with previous reports. Using
GM and selected percentiles, we compared concentrations measured in the present study
Ashrap et al. Page 4
Environ Res. Author manuscript; available in PMC 2021 April 01.
Author M
anuscriptA
uthor Manuscript
Author M
anuscriptA
uthor Manuscript

with those measured in NHANES (2009-2010, 2011-2012, 2013-2014, 2015-2016),
including women aged between 18 and 40 years (N for urine=1604, N for blood=3585).
Correlations between and within blood and urine concentrations—Spearman
correlation coefficients and p values were calculated between blood and urine concentrations
for 10 metal(loid)s (As, Cd, Co, Cs, Cu, Hg, Mn, Ni, Pb, and Zn) that were measured in both
matrices and detected in >50% of samples; correlations were calculated using all samples
that have measurements in both matrices. The ratio of urine concentration to blood
concentration was constructed for each metal(loid) to further evaluate the relationship
between the two biomarkers. Spearman rank correlations and p values were also calculated
to assess relationships between different metal(loid)s within the same matrix; two sets of
correlations were calculated using samples collected at each visit and using GM of
metal(loid) concentrations over study visits.
Change in biomarkers across pregnancy (ICCs) and over time—To test for
significant changes in biomarker concentrations across pregnancy (i.e., time points in
gestation), linear mixed models (LMM) were used to account for repeated measurements
from individuals. We also assessed the proportion of variance attributed to between-person
variability across the three time points in pregnancy, using intra-class correlation coefficients
(ICCs) and their 95% confidence intervals (Hankinson et al. 1995). Ranging between 0 (no
reproducibility) and 1 (perfect reproducibility), ICCs reflect a poor degree of reliability
when below 0.40, a moderate to good reliability when between 0.40 and 0.75, and an
excellent reliability when above 0.75 (Rosner 2015). Next, to examine the changes in urinary
and blood metal(loid) concentrations over time (2011-2017), tests of linear trends across
study period were conducted by modeling the GM for each individual’s repeated
measurements, including the year of visit as a continuous variable, and assessing statistical
significance using the Wald test.
Predictor selection—Two approaches were taken to identify potential predictors of
metal(loid) concentrations in urine and blood. Covariates (predictors) of interest (n=61)
included demographic characteristics, 48-h recall of product use, dietary supplement intake,
food consumption, and water use and sources. In the first approach, we regressed each
covariate of interest against each measured biomarker, using linear mixed effects models
(LMMs) with random intercepts. LMM accounts for the intra-individual correlation and
variation of repeated measures over time and lead to smaller and more precise standard
errors around means. With LMMs, we assessed log- transformed metal(loid) concentrations
individually as continuous dependent variables; for urinary metal(loid)s, log-transformed
concentrations were further corrected for SG. Potential predictors were modeled individually
as independent variables. With the purpose of determining a subset of important predictor
variables for each metal(loid), in the second approach, we fit multivariable LMMs with
LASSO (least absolute shrinkage and selection operator) regularization (LMMLasso).
LASSO regularization shrinks estimated regression coefficients corresponding to “weakly
associated” covariates to zero, thereby embedding variable selection into the estimation
procedure (Groll and Tutz 2014). An optimal choice of the coefficient for the LASSO
regularization (λ), corresponding with the lowest Bayesian Information Criterion (BIC),
Ashrap et al. Page 5
Environ Res. Author manuscript; available in PMC 2021 April 01.
Author M
anuscriptA
uthor Manuscript
Author M
anuscriptA
uthor Manuscript

maximizes the probability of selecting the best model. In our analysis, for each metal, all
predictor variables were entered in the LMMLasso models at the same time. The λ was
identified using the R package glmmLasso version 1.3.3.
Furthermore, we analyzed associations between log-transformed metal(loid)s concentrations
and food frequency questionnaire information collected at the second visit, using linear
regression. To use the same/close time period for biomarkers and supplement use to assess
these relationships, urine metal(loid) concentrations measured at the second visit and blood
metal(loid) concentrations measured at the third visit were used, as blood samples were not
collected during the second visit. Data were analyzed using R version 3.2.2 and SAS 9.4
(SAS Institute Inc., Cary, NC)
RESULTS
Demographics
A total of 1,285 urine samples and 1,183 blood samples from 1,040 women with measured
metal(loid) concentrations in either blood and/or urine samples were included in this
analysis. Among those 1040 women, 660 and 824 women provided urine and blood samples,
respectively. Demographic characteristics of those women were described previously (Aker
et al. 2019; Ashrap et al. 2018) and are summarized in SI Table S1. Most women in our
study had private insurance, had an education above high school, were employed, and were
married or in a domestic partnership. Nearly half of them had household incomes below
$30,000/year. More than 80% of women never smoked while less than 2% smoked during
pregnancy and 6% reported second-hand smoking exposure (>1 hour per day). Nearly all
women reported no consumption of alcohol within the last few months. Demographic
characteristics do not differ between women who provided urine samples (660 women) and
blood samples (842 women).
GM and percentiles
Descriptive statistics (GM, GSD, select percentiles) are presented in Table 1. Nearly all of
the samples had detectable concentrations for most of the metals (98-100% > LOD), while a
majority had detectable Cd (74.5% > LOD), Pb (72.1% > LOD), and Sb (90% > LOD) in
urine and half had detected As (49% > LOD) and Cd (61% > LOD) in blood. 14 urinary
metal(loid)s (As, Ba, Cd, Co, Cs, Cu, Hg, Mn, Mo, Ni, Pb, Sb, Sn, and Zn) and 10 blood
metal(loid)s (As, Cd, Co, Cs, Cu, Hg, Mn, Ni, Pb, and Zn) with at least 50% of samples
having concentrations higher than LOD levels were included in the statistical analysis.
The comparisons with distributions among women 18 to 40 years old from NHANES
2009-10, 2011-12, 2013-14 and 2015-16 were included in SI Table S2 and S3. In the
NHANES cohort, some metals (Cu, Ni, and Zn) were not measured in urine samples and
only Cd, Hg, Mn, and Pb were measured in blood samples. When comparing uncorrected
urinary metal(loid) distributions with women of childbearing age enrolled in NHANES,
women in our study had higher GM concentrations of all urinary metal(loid)s except for Cd,
which were lower among PROTECT women, and Pb, which were similar in the two cohorts.
Median concentrations of As, Ba, Co, Hg, Mo, and Sb were 2-fold greater among women in
Ashrap et al. Page 6
Environ Res. Author manuscript; available in PMC 2021 April 01.
Author M
anuscriptA
uthor Manuscript
Author M
anuscriptA
uthor Manuscript

this study compared to NHANES. PROTECT women had a median concentration of Mn and
Sn that were 13 and 5 times greater than NHANES, respectively. For blood samples,
PROTECT women had higher concentrations of Hg and Mn compared to NHANES while
NHANES women had Cd and Pb concentrations (GM) that were twice as high as PROTECT
women. Among women of childbearing age enrolled in NHANES, a small portion was
pregnant (85 and 185 women in the urine and blood analysis, respectively) and the metal
concentrations measured among these pregnant women were similar to the levels measured
among other women included in our NHANES comparison.
Correlations between and within blood and urine concentrations
Spearman correlations between metal(loid)s within the same matrix did not differ when we
calculated using GM of metal(loid) concentrations over study visit or using samples
collected at each visit. Therefore, we presented the correlations between GM concentrations
in Figure 1. When looking across metal(loid)s measured in urine, there were some moderate
to strong correlations [r=0.47 (Pb and Ba), 0.55 (Cd and Pb), 0.55 (Ni and Co), 0.59 (Ni and
Ba)]. There were also weak to moderate (r = 0.30 to 0.45) but statistically significant (p<
0.05) correlations between several metal(loid)s. The correlations between metal(loid)s in
blood were generally weaker compared to urinary metal(loid)s with only a few pairs being
moderately correlated (Mn and Co, r=0.36; Cd and Co, r=0.33; As and Hg, r=0.32).
Spearman correlation coefficients for the same metal(loid)s across urine and blood matrices
are presented in the last column of Table 1. Most of the metal concentration in two matrices
were significantly correlated, with Co (r=0.51) and Cs (r=0.43) having the highest
coefficient followed by Hg (r=0.33) and As (r=0.27). Mn, Ni, Zn concentrations measured in
urine and blood were not correlated.
Ratio
Distribution of urine/blood ratios for 10 metals are presented in Figure 2. GM and median of
urine/blood ratios were <1 for Cu, Zn, Pb, Mn, and Hg, indicating generally higher
concentration measured in blood vs urine. Inversely, GM and median of urine/blood ratios
were >1 for As, Ni, Cs, and Co, indicating higher concentrations measured in urine vs blood.
Cd concentrations were similar in two matrices (median urine/blood ratio of 1).
Change in biomarkers across pregnancy (ICCs) and over time
SI Figure S1 and S2 show comparisons of urinary and blood concentration distributions for
each biomarker between study visits. SG-corrected urinary concentrations of metal(loid)s
were not significantly different between the three visits except for Co, Cs, Cu, Mo, and Zn
(p<0.05 for all). First visit concentrations were higher compared to later visits for Cs, Mo,
and Zn, while Co and Cu were higher at the third visit. Blood concentrations of Cs were
higher at the first visit, while blood concentrations of Cd, Co, Cu, Mn, and Zn were lower,
compared to the third visit.
ICCs for urine and blood metal(loid) concentrations and the urine/blood ratio are presented
in Table 2. Metals with a urine/blood ratio <1 (Cu, Zn, Pb, Mn, Hg) presented good to
excellent reliability in blood with ICCs ranging from 0.54-0.78. Among the four metals with
Ashrap et al. Page 7
Environ Res. Author manuscript; available in PMC 2021 April 01.
Author M
anuscriptA
uthor Manuscript
Author M
anuscriptA
uthor Manuscript

only urine measurements available, Sn had moderate reproducibility (ICC=0.55), whereas
Mo, Sb, and Ba had weak reproducibility (ranging from 0.15 to 0.19). Reproducibility varied
widely for the urine/blood ratio for each metal(loid), with ICCs ranging from 0.07 to 0.48.
Distributions of urinary and blood biomarker concentrations stratified by year are shown in
SI Figure S4 and S5. Results from linear trend tests indicated that the distributions of some
biomarkers changed slightly over the course of our study period. For example, median levels
of urine Ba, Cd, Cr, Cs, and blood Cs increased by 20-50% (P for trend<0.05) when
comparing earlier and later years in the study period; while urinary Mn, Pb, Sb, Sn, and
blood Ni and Pb were characterized by smaller, 20-30% decreases (P for trend<0.05).
Predictor selection
Variable selection analysis revealed several important predictors of urine and blood
metal(loid) levels. Considering the concentrations of metal(loid)s measured in two matrices
and reproducibility of different metal(loid)s in our analysis, we presented results for urinary
concentrations of As, Co, Cs, Mo, and Sb (urine/blood ratio>1) and blood concentrations of
Cu, Hg, Mn, Pb, and Zn (urine/blood ratio <1). Results from both urinary and blood
concentrations of Cd were included as the average urine/blood ratio was 1. No significant
predictors were found for either blood or urine Ba, Ni, Sn (data not shown). Here we
describe predictors identified by both univariable LMMs and multivariable LMMLasso,
while Figure 3 shows all the variables selected through either approach. The two statistical
approaches gave very similar effect estimates, therefore, Figure 3 presents effect estimates
(β) and confidence intervals (CIs) obtained from the univariable LMMs. GM of urinary and
blood metal(loid) concentrations in relation to different categories of demographic variables,
self-reported product use, dietary supplement intake, food consumption, and water use are
also shown in SI Table S4 and S5.
Urine—As Consuming fish 48 h prior to sample collection had the strongest relationship to
urinary As concentration, while “other hair product” use, perfume use, and pesticide storage
were negatively associated with As.
Cd We found strong positive associations between using a metal cistern to store water and
urine Cd concentration, there was a 0.04 ng/ml difference on Cd concentration between
women reporting the use of metal cistern and those who used plastic cistern or did not use
cistern. Weak but significant positive associations were identified between urinary Cd
concentration with age, parity, pre-pregnancy BMI, and use of perfume.
Co Smoking and consuming milk was associated with significantly higher urinary Co; self-
reported use of other hair product was negatively associated with Co.
Cs Consumption of milk, spinach, folic acid supplement and drinking bottled water (vs
public water) were positive predictors of higher Cs levels in urine.
Mo We found positive associations between self-reported folic acid, iron supplement, and
peanut butter consumption and urine Mo concentration, while fish consumption and drinking
filtered water were negatively associated with Mo concentration.
Ashrap et al. Page 8
Environ Res. Author manuscript; available in PMC 2021 April 01.
Author M
anuscriptA
uthor Manuscript
Author M
anuscriptA
uthor Manuscript

Sb Use of hair spray and consumption of folic acid were associated with higher Sb levels,
while education and use of cosmetics were associated with lower Sb levels.
Blood—Cd For Cd, smoking (ever, current vs never) was significantly associated with
blood levels among pregnant women in the study, and the GM concentration difference
between current smoker vs never smoker (0.13 ng/mL) was stronger than ever smoker vs
never smoker (0.02 ng/mL). Cd concentrations were higher for women who consumed meat,
tomatoes, or collards, and lower for women who consumed multi-vitamins, compared to
women who did not consume these items.
Cu Self-reported use of shaving cream and other hair product were important predictors of
lower Cu levels; There was a trend for increasing concentration of Cu with increasing pre-
pregnancy categories of BMI.
Hg Consuming fish, canned foods (e.g. canned tuna) and tomatoes were the strongest
predictors of blood Hg levels. Hg concentrations were also higher among women with >12
years of education.
Mn Mn concentrations were associated with parity, where concentrations among women
who had one or more children were significantly higher compared to women who had not
yet had children. Blood Mn concentrations were lower among women who reported using
shampoo and other hair products. Water treatment was also negatively associated with Mn
concentration.
Pb Using bottled water as main drinking source was identified as the most significant
predictor of lower Pb levels- participants who reported using bottled water as their main
drinking source had significantly lower concentrations of Pb (0.30 μg/dL) compared to
participants who drink public supply water (0.36 μg/dL). There were decreasing Pb
concentrations associated with higher education levels.
Zn Pre-pregnancy BMI and using other hair products were negatively associated with blood
Zn concentration.
Findings from the food frequency analysis—Our analysis of food frequency
questionnaire information and metal(loid) concentrations found a trend for increasing
concentrations of urinary As with increasing rice consumption frequency (p<0.05) (SI Table
S6). The geometric mean concentration of As was 2 fold higher among women who
consumed rice once per day or more compared to women who consumed rice 2-3 times per
month or less. Fish consumption frequency was negatively associated with urinary Cd and
Pb concentrations (SI Table S6). A similar trend was also observed for yogurt consumption
frequency and urinary Sb concentration. In line with the results from the main predictor
analysis above, there were positive linear trend relationships between meat consumption
frequency and blood Cd, and fish consumption frequency and blood As and Hg levels (SI
Table S7). Blood Cs levels also increased with increased fish consumption.
Ashrap et al. Page 9
Environ Res. Author manuscript; available in PMC 2021 April 01.
Author M
anuscriptA
uthor Manuscript
Author M
anuscriptA
uthor Manuscript

DISCUSSION
Our study provided much needed information on exposures to metal(loid)s among pregnant
women in Northern Puerto Rico. We quantified levels of toxic and essential metal(loid)s in
maternal urine and blood, characterized variability of levels across pregnancy, and
correlation between different metal(loid)s and matrices to better inform the use of
metal(loid) biomarkers in epidemiology studies. We also identified important predictors of
each metal(loid) in blood and urine which may suggest possible strategies and
considerations for reducing exposure.
Comparison with other studies
Table 3 provides an overview of reported metal(loid) concentrations in other studies of
pregnant women. Urinary and blood concentrations of some essential metals such as Co, Cu,
and Zn were within the range of what was reported in previous studies (Callan et al. 2013;
Fort et al. 2014; Hansen et al. 2011; Lewis et al. 2018; Rudge et al. 2009; Shirai et al. 2010).
The concentrations of Cs in urine and blood were lower in this study compared with other
studies of pregnant women in Australia and Spain (Fort et al. 2014; Hinwood et al. 2015).
Urinary Mn concentrations (GM=1.2 ng/mL) in this study exceeded those seen in Australia
(Callan et al. 2013) and Mexico (Lewis et al. 2018), while blood Mn concentrations
(GM=11.3 ng/mL) were comparable with those detected in other studies where the GM or
median concentrations ranged from 6.5 to 16.1 ng/mL (Callan et al. 2013; Fort et al. 2014;
Hansen et al. 2011; Nakayama et al. 2019).
Ba was only measured in urine and concentrations (GM=2.5 ng/mL) were lower in this
study compared with Mexican pregnant women (GM=4.0 ng/mL) (Lewis et al. 2018).The
levels of Mo and Ni present in the urine samples from Puerto Rican pregnant women were
similar to the levels reported in other studies (Callan et al. 2013; Fort et al. 2014; Lewis et al.
2018; Shirai et al. 2010). Studies of Sb and Sn among pregnant women have been much
more limited in number compared with other essential metals. The concentrations of urine
Sb in our study, GM=0.1 ng/mL, were lower than the levels reported among Spanish
pregnant women (Fort et al. 2014). Sn levels measured in urine (GM=2.1 ng/mL) were one
order of magnitude higher than the Japan study (Shirai et al. 2010), where the GM was 0.2
ng/mL; however, this comparison needs to be interpreted cautiously given that Sn was only
detected among 53% of the samples in the Japan study (Shirai et al. 2010).
The urinary As concentration reported in our study was comparable to other studies of
pregnant women while blood As concentrations were lower. The discrepancy between two
matrices may be attributable to the fact that As in blood is more susceptible to variation as
the half-life of inorganic As in blood is a few hours compared with a few days in urine (Hall
et al. 2006). Our study found that the GM blood Hg value among Puerto Rican pregnant
women was 1.2 ng/mL with 3 participants having levels exceeding 5.8 μg/L, U.S. EPA’s
current reference dose for blood mercury (USEPA 2007).
Pregnant women in this study had lower urine and blood concentrations of Cd and Pb,
compared to previous studies mentioned above. This is particularly significant where blood
Pb concentrations among this population, with GM of 0.33 μg/dL, is the lowest when
Ashrap et al. Page 10
Environ Res. Author manuscript; available in PMC 2021 April 01.
Author M
anuscriptA
uthor Manuscript
Author M
anuscriptA
uthor Manuscript

compared to women in NHANES (GM=0.64 μg/dL), and pregnant women in Australia
(median= 0.37 μg/dL) (Hinwood et al. 2013), Japan (GM=0.64 μg/dL) (Nakayama et al.
2019), Ohio, US (GM=0.7 μg/dL) (Kalloo et al. 2018), Norway (two studies: median=2.5
μg/dL and GM=0.75 μg/dL) (Birgisdottir et al. 2013; Hansen et al. 2011), and South Africa
(two studies: median=1.4 μg/dL and median= 2.3 μg/dL) (Mathee et al. 2014; Rudge et al.
2009). In epidemiological studies, higher Pb exposure may mask the effects of other
exposures (Sanders et al. 2015), therefore, having lower concentrations of Pb, this
population may provide an opportunity to study the health effects of other metal(loid)s/
exposures independent of Pb.
None of the blood samples in our study had Pb concentrations that exceeded the level of
concern set by CDC, a blood level of 5 μg/dL for pregnant women (Ettinger and Wengrovitz
2010). However, concerns have been raised that even at low levels, prenatal Pb exposure
may pose a toxic effect on fetal development (Anderson et al. 2016; Mushak et al. 1989;
Polanska et al. 2018; Silver et al. 2016; Takser et al. 2005; CM Taylor et al. 2017; Wu et al.
2017).
These differences in metal(loid) concentrations among pregnant women could be mainly due
to population differences, including different geographical and demographic environment,
life style and dietary behaviors. The impact of demographic, dietary, and product use
patterns during pregnancy on the variation of levels for metal(loid)s will be further discussed
in this paper.
Variability of metal(loid) exposures
Variability across study visits—Limited studies have measured and/or compared
metal(loid) concentrations at different times during pregnancy and mainly compared just a
few metal(loid)s measured in blood or serum. As mentioned above, urinary concentrations
of Co, Cs, Cu, Mo, and Zn among pregnant women in our study were statistically different
between three visits. These different trends in concentration may due to an actual increase/
decrease of metal(loid) concentrations in the body influenced by the change in fetal demand
and maternal nutrient supply (King 2000). Metabolic changes during pregnancy, such as the
change in glomerular filtration rate (Cheung and Lafayette 2013; Weaver et al. 2014) and
plasma volume expansion (Hytten and Paintin 1963) may also result in different filtration of
metal(loid)s from blood into urine throughout pregnancy.
Our study reported a significant increase in blood Cd, Co, Cu, Mn, and Zn as gestation
progresses. Similar increasing trends have been observed in previous studies considering
concentrations of Co, Cu, and Mn in blood or serum (Arbuckle et al. 2016; Izquierdo
Alvarez et al. 2007; Khoushabi et al. 2016; Li et al. 2019; Liu et al. 2010; Spencer 1999;
Tabrizi and Pakdel 2014). The increasing levels of these metal(loid)s during pregnancy may
be attributed to the increased intake and/or release of essential nutrients (Khayat et al. 2017;
Marangoni et al. 2016). For Cs, lower concentrations in the blood were observed during the
third visit which may be explained by increasing plasma volume during pregnancy (Hytten
and Paintin 1963). However, we would expect to see similar trends for all metals if the
difference is due to metabolic changes during pregnancy.
Ashrap et al. Page 11
Environ Res. Author manuscript; available in PMC 2021 April 01.
Author M
anuscriptA
uthor Manuscript
Author M
anuscriptA
uthor Manuscript
We also found that urine/blood ratio remained constant for most of the metal over the course
of pregnancy, except for Cd and Mn where the ratio was higher at the first visit and for Cu
which had a higher ratio at the third visit (SI Figure S3). These trends may reflect the
absolute concentration changes of the metals in either matrix (the results are consistent with
the single matrix results described above) and/or the different adjustments of toxicokinetics
(distribution, excretion) of those metals throughout pregnancy.
Correlation between metal(loid)s within urine and blood—Moderate to strong
correlations were observed between urinary Pb and Ba (r=0.47) and Ni and Ba (r=0.59)
(Figure 1). Lewis et al also reported a strong correlation between urinary Pb and Ba (r=0.57)
among Mexican pregnant women (Lewis et al. 2018). There were also a few blood
metal(loid)s pairs that were moderately correlated (Mn and Co, r=0.36; As and Hg, r=0.32;
Cd and Co, r=0.33) in our study (Figure 1). Similar correlations between maternal blood Mn
and Co, and As and Hg were reported among Norwegian pregnant women (Hansen et al.
2011). The correlation between As and Hg reflects the common source of exposures,
seafood, which is consistent with results from our predictor analysis, whereas the pattern of
correlations we observed between Pb and Ba, Ni and Ba, and Mn and Co concentrations
could be due to combined use in products, demographic factors, and personal behaviors.
Variability across matrices—Urine and blood are commonly used to measure
metal(loid)s in humans (Keil et al. 2011; Sani and Abdullahi 2017; Wang et al. 2014). For
most metal(loid)s examined in our study, weak to moderate correlations were observed
between concentrations measured in both matrices. Most studies use a single human
specimen (blood or urine) to determine exposure to various metal(loid)s. However, each
metal(loid) exhibits unique physiochemical properties and toxicokinetics, such as half-life,
storage, or elimination rate from the body. As such, the preference for either blood or urine
concentration as a better indicator for exposure to a given metal(loid) must be coordinated
with the predicted toxicokinetics of the metal(loid) involved, the time between exposure and
specimen collection, and the goals for a particular study (e.g. health outcome). For example,
since As is excreted relatively rapidly via urine, urinary concentration of As is used as an
indicator of recent exposure (Buchet et al. 1981; Kubota et al. 2002). In contrast, blood is the
preferred specimen for Pb because Pb has a long biological half-life, resulting in less
variability of blood concentrations over time (Barbosa et al. 2005). Blood is also the
preferred specimen to identify exposure to methyl-mercury, the most toxic form of Hg,
whereas urine excretion represents inorganic Hg exposure (Centers for Disease Control and
Prevention (CDC) 2014; Göthe et al. 1985; Yoshida 1985). For Cd, both urine and blood are
useful for detecting exposures, as blood Cd primarily reflects recent exposure and urine Cd
represents long-term exposure (Centers for Disease Control and Prevention (CDC) 2014;
Sanders et al. 2015).
Repeated measures of metal(loid) concentrations in both blood and urine samples enabled us
to characterize metal(loid) exposures in different biological matrices, their interrelation, and
variability during pregnancy, and select a better exposure indicator with higher
reproducibility and abundance for each metal for application in epidemiology studies of
pregnancy outcomes. Distributions of the ratio of urine/blood for non-essential metal(loid)s
Ashrap et al. Page 12
Environ Res. Author manuscript; available in PMC 2021 April 01.
Author M
anuscriptA
uthor Manuscript
Author M
anuscriptA
uthor Manuscript
and ICCs for two matrices are consistent with previous knowledge; 1) the absolute
concentrations of Pb and Hg were generally higher in blood than in urine (urine/ blood
ratios<1 for most samples) and blood samples had good to excellent reproducibility (ICC for
Pb=0.78, ICC for Hg=0.62); 2) concentrations of As were higher in urine (urine/blood ratio
>1 for most samples); 3) concentrations of Cd were similar in both matrices (mean urine/
blood ratio = 1). The concepts presented here for these non-essential metals can be applied
to other metals with similar ratio and reproducibility. It is evident from Figure 2 that, metals
with mean urine/blood ratio <1 (Cu, Zn, Mn, Hg, Pb) presented good to excellent reliability
for blood measurements with ICC ranging from 0.54-0.78, this is consistent with studies
indicating that blood Mn and Zn concentrations serve as a reasonable indicator of exposure
(Agency for Toxic Substances and Disease Registry (ATSDR) 2005; Myers et al. 2003;
Roels et al. 1992). The findings also indicate that repeated measurement of essential and
non-essential metal(loid)s during pregnancy was necessary, particularly for most urinary
biomarkers.
Predictors
Our predictor analysis revealed that some demographics, dietary factors, product use/water
use behaviors can affect the distribution of various metal(loid)s.
Demographics factors and food/ supplement consumption—Smoking was the
most significant predictor of blood Cd. We also found that the consumption of several food
items (meat, tomato, collard) were additional predictors of Cd exposure. These results were
somewhat expected given that diet and smoking are known sources of human Cd exposure
(Agency for Toxic Substances and Disease Registry (ATSDR) 2012). In this population, we
identified the consumption of fish as a significant predictor of As levels; rice consumption
frequency was also positively associated with As levels. These findings are consistent with
studies reporting increased exposure and possible health hazards associated with consuming
As contaminated rice (Das et al. 2004; Donohue and Abernathy 1999; Hassan et al. 2017;
Mahaffey et al. 1975; V Taylor et al. 2017). The forms of As found in rice are mostly
inorganic and far more toxic than the organic form found in the environment and food like
fish (Valko et al. 2005). Fish was also one of the main predictors of blood Hg levels along
with canned food and tomatoes. Fish and canned food (especially canned tuna) are food
groups known to be potentially high in Hg (Hughner et al. 2008; Mahaffey et al. 2008; Shim
et al. 2004). However, our finding on tomato consumption and blood Hg are contrary to
what was reported in previous studies where the consumption of tomato products and
tropical fruits were associated with lower blood Hg (Gagné et al. 2013; Passos et al. 2003;
Passos et al. 2007). The reported use of supplements during pregnancy, including folic acid
and iron supplements, were significant and positive predictors of urinary Cs, Mo, and Sb
concentrations. Cs and Mo are often in multivitamin and multi-mineral dietary supplements
(Blotsky and Figueroa 2014; Paradissis et al. 1999). It is also plausible that other specific
supplementation that wasn’t included in our questionnaires may contain those essential
metal(loid)s and women in our study may be consuming those supplementations along with
folic acid and iron supplements. Prenatal multivitamin use significantly decreased both
blood and urine levels of Cd among this population, and this observation is supported by
Ashrap et al. Page 13
Environ Res. Author manuscript; available in PMC 2021 April 01.
Author M
anuscriptA
uthor Manuscript
Author M
anuscriptA
uthor Manuscript

findings on the protective effect of vitamin E on heavy metal(loid)s absorption among
animals (Osfor et al. 2010; Sears 2013).
Personal care product use—For blood concentrations of metal(loid)s, self-reported use
of shaving cream and/or shampoo and/or other hair products were important predictors of
lower Cu, Hg, Mn, and Zn levels. This inverse association may due to a higher frequency of
washing behaviors (showering, face washing) which could help remove metals from the skin
and reduce continued exposure.
Water usage—While Pb concentrations in the study population were relatively low
overall, we found that those whose drink AAA public water have higher levels of blood Pb
compared to those who mostly drink from bottled water. According to a report published in
2017 by the Natural Resources Defense Council, drinking water violations in Puerto Rico
had the highest rate among all the U.S. jurisdictions with the presence of Pb and other
pollutants in the water coming out of the taps during 2005-2015 (Natural Resources Defense
Council 2017). Water treatment was inversely associated with blood Mn levels (among the
questionnaire answers from women in our study, most treatments are referring to filtration).
A study that assessed heavy metal(loid) concentrations in urban rivers of Puerto Rico found
that Mn was the only metal found to exceed maximum contaminant levels established by the
EPA for drinking water (US EPA: 5 μg/l) (Ortiz-Colon et al. 2016). It is plausible that
treatment of drinking water in homes may help reduce the levels of Mn in the water,
therefore reducing exposure. Participants in our study who reported using metal cisterns to
store water had elevated levels of urinary Cd. Various studies have found significantly higher
levels of Cd in collected tank water and suggested that the main source of Cd in the tank
water may be the corrosion of rooftop material since Cd is a common impurity in the Zn
coating (Chubaka et al. 2018; Magyar et al. 2008; Van Metre and Mahler 2003). These
findings suggest that proper and careful attention should be given to modifying household
environments and water treatment behaviors when developing metal(loid) exposure
remediation strategies.
Strengths and Limitation—To our knowledge, this is the first study to assess exposure to
multiple metal(loid)s among pregnant women in Puerto Rico. PROTECT, a large prospective
longitudinal cohort study in Puerto Rico, provides a unique opportunity to characterize
metal(loid) exposure in this population. The study design allows for repeated collection of
biological samples and questionnaire data to account for the varying levels of exposures
during pregnancy, and LMM incorporated this full richness and structure of the data across
pregnancy (Meeker et al. 2013). We measured a large panel of metal(loid)s in two biological
matrices, urine and blood, which helps to inform future epidemiological analyses because
different matrices may be more appropriate for assessing exposure to different metal(loid)s
(Fort et al. 2014). The study does have several limitations. We did not collect detailed
information regarding the amount of personal product use, and the collection of maternal
supplement use is not detailed as to specific ingredients and amount ingested. This may have
caused non-differential misclassification and attenuated our results toward the null in the
linear mixed models. Though our findings are possibly generalizable to the general pregnant
population in Puerto Rico, they may not be generalizable to other pregnant women
Ashrap et al. Page 14
Environ Res. Author manuscript; available in PMC 2021 April 01.
Author M
anuscriptA
uthor Manuscript
Author M
anuscriptA
uthor Manuscript

populations, considering that race/ethnicity, personal care product use, dietary patterns, and
toxicokinetics may be quite different compared to pregnant women in Puerto Rico.
Conclusion—In conclusion, we reported metal(loid)s exposure levels for 14 toxic and
essential trace metal(loid)s in urine and blood samples from 1,040 pregnant women in
Northern Puerto Rico. Exposure to many toxic and essential metal(loid)s are high among
these women compared to women of reproductive age from the general US population.
Blood concentrations of Cu, Zn, Mn, Hg, and Pb, and urinary concentrations of As, Ni, and
Co, were shown to reflect reliable biomarkers of exposure. For other metal(loid)s, repeated
samples are recommended for exposure assessment in epidemiology studies. We further
examined a variety of predictors of prenatal metal(loid) exposure and found significant
associations between potential predictors and biomarkers, including fish and rice
consumption (urinary As), fish and canned food (blood Hg), drinking public water (blood
Pb), smoking (blood Cd), and iron/folic acid supplement use (urinary Cs, Mo, and Sb).
Improved understanding of biomarkers, sources, and pathways of metal(loid)s exposure can
inform strategies to reduce exposure among Puerto Rico’s residents.
Supplementary Material
Refer to Web version on PubMed Central for supplementary material.
Acknowledgements
We would like to extend our gratitude to all PROTECT study participants and their families. The authors also thank the nurses and research staff who participated in cohort recruitment and follow up, as well as the Federally Qualified Health Centers (FQHC) in Puerto Rico that facilitated participant recruitment, including Morovis Community Health Center, Prymed in Ciales, Camuy Health Services, Inc. and the_Delta OBGyn Group in Manati, as well as the Manati Medical Center and the Metro Pavia Hospital in Arecibo.
Funding
This study was supported by the Superfund Research Program of the National Institute of Environmental Health Sciences (NIEHS), National Institutes of Health (NIH; grant number P42ES017198). Additional support was provided from NIEHS grant number P30ES017885 and the NIH Environmental influences on Child Health Outcomes (ECHO) program grant number UH3OD023251. ECHO is a nationwide research program supported by the NIH, Office of the Director to enhance child health.
REFERENCE
Agency for Toxic Substances and Disease Registry (ATSDR). 2005 Toxicological profile for zinc.
Agency for Toxic Substances and Disease Registry (ATSDR). 2012 Toxicological profile for cadmium.
Aker AM, Ferguson KK, Rosario ZY, Mukherjee B, Alshawabkeh AN, Cordero JF, et al. 2019 The associations between prenatal exposure to triclocarban, phenols and parabens with gestational age and birth weight in northern puerto rico. Environ Res 169:41–51. [PubMed: 30412856]
Anderson DW, Mettil W, Schneider JS. 2016 Effects of low level lead exposure on associative learning and memory in the rat: Influences of sex and developmental timing of exposure. Toxicol Lett 246:57–64. [PubMed: 26812500]
Arbuckle TE, Liang CL, Morisset AS, Fisher M, Weiler H, Cirtiu CM, et al. 2016 Maternal and fetal exposure to cadmium, lead, manganese and mercury: The mirec study. Chemosphere 163:270–282. [PubMed: 27540762]
Ashrap P, Watkins DJ, Calafat AM, Ye X, Rosario Z, Brown P, et al. 2018 Elevated concentrations of urinary triclocarban, phenol and paraben among pregnant women in northern puerto rico: Predictors and trends. Environ Int 121:990–1002. [PubMed: 30316544]
Ashrap et al. Page 15
Environ Res. Author manuscript; available in PMC 2021 April 01.
Author M
anuscriptA
uthor Manuscript
Author M
anuscriptA
uthor Manuscript

Barbosa F Jr., Tanus-Santos JE, Gerlach RF, Parsons PJ. 2005 A critical review of biomarkers used for monitoring human exposure to lead: Advantages, limitations, and future needs. Environ Health Perspect 113:1669–1674. [PubMed: 16330345]
Birgisdottir BE, Knutsen HK, Haugen M, Gjelstad IM, Jenssen MT, Ellingsen DG, et al. 2013 Essential and toxic element concentrations in blood and urine and their associations with diet: Results from a norwegian population study including high-consumers of seafood and game. Sci Total Environ 463–464:836–844.
Bloom MS, Parsons PJ, Steuerwald AJ, Schisterman EF, Browne RW, Kim K, et al. 2010 Toxic trace metals and human oocytes during in vitro fertilization (ivf). Reprod Toxicol 29:298–305. [PubMed: 20096775]
Blotsky RD, Figueroa R. 2014 Mineral, nutritional, cosmetic, pharmaceutical, and agricultural compositions and methods for producing the same.Google Patents.
Borowska S, Brzoska MM. 2015 Metals in cosmetics: Implications for human health. J Appl Toxicol 35:551–572. [PubMed: 25809475]
Buchet JP, Lauwerys R, Roels H. 1981 Comparison of the urinary excretion of arsenic metabolites after a single oral dose of sodium arsenite, monomethylarsonate, or dimethylarsinate in man. Int Arch Occup Environ Health 48:71–79. [PubMed: 6894292]
Callan AC, Hinwood AL, Ramalingam M, Boyce M, Heyworth J, McCafferty P, et al. 2013 Maternal exposure to metals--concentrations and predictors of exposure. Environ Res 126:111–117. [PubMed: 23896418]
Cantonwine DE, Cordero JF, Rivera-Gonzalez LO, Anzalota Del Toro LV, Ferguson KK, Mukherjee B, et al. 2014 Urinary phthalate metabolite concentrations among pregnant women in northern puerto rico: Distribution, temporal variability, and predictors. Environ Int 62:1–11. [PubMed: 24161445]
Carmichael SL, Herring AH, Sjodin A, Jones R, Needham L, Ma C, et al. 2010 Hypospadias and halogenated organic pollutant levels in maternal mid-pregnancy serum samples. Chemosphere 80:641–646. [PubMed: 20494400]
Caserta D, Graziano A, Lo Monte G, Bordi G, Moscarini M. 2013 Heavy metals and placental fetal-maternal barrier: A mini-review on the major concerns. Eur Rev Med Pharmacol Sci 17:2198–2206. [PubMed: 23893187]
Centers for Disease Control and Prevention (CDC). 2014 Laboratory procedure manual (cadmium, lead, manganese, mercury, and selenium).
Centers for Disease Control and Prevention (CDC). 2019 Fourth national report on human exposure to environmental chemicals updated tables.
Chen Z, Myers R, Wei T, Bind E, Kassim P, Wang G, et al. 2014 Placental transfer and concentrations of cadmium, mercury, lead, and selenium in mothers, newborns, and young children. J Expo Sci Environ Epidemiol 24:537–544. [PubMed: 24756102]
Cheung KL, Lafayette RA. 2013 Renal physiology of pregnancy. Adv Chronic Kidney Dis 20:209–214. [PubMed: 23928384]
Chubaka CE, Whiley H, Edwards JW, Ross KE. 2018 Lead, zinc, copper, and cadmium content of water from south australian rainwater tanks. Int J Environ Res Public Health 15.
Curwin BD, Hein MJ, Sanderson WT, Nishioka MG, Reynolds SJ, Ward EM, et al. 2005 Pesticide contamination inside farm and nonfarm homes. J Occup Environ Hyg 2:357–367. [PubMed: 16020099]
Das H, Mitra AK, Sengupta P, Hossain A, Islam F, Rabbani G. 2004 Arsenic concentrations in rice, vegetables, and fish in bangladesh: A preliminary study. Environment international 30:383–387. [PubMed: 14987870]
De Coster S, van Larebeke N. 2012 Endocrine-disrupting chemicals: Associated disorders and mechanisms of action. J Environ Public Health 2012:713696. [PubMed: 22991565]
Diamanti-Kandarakis E, Bourguignon JP, Giudice LC, Hauser R, Prins GS, Soto AM, et al. 2009 Endocrine-disrupting chemicals: An endocrine society scientific statement. Endocr Rev 30:293–342. [PubMed: 19502515]
Donohue JM, Abernathy CO. 1999 Exposure to inorganic arsenic from fish and shellfish In: Arsenic exposure and health effects iii:Elsevier, 89–98.
Ashrap et al. Page 16
Environ Res. Author manuscript; available in PMC 2021 April 01.
Author M
anuscriptA
uthor Manuscript
Author M
anuscriptA
uthor Manuscript

Dorgan JF, Brock JW, Rothman N, Needham LL, Miller R, Stephenson HE Jr., et al. 1999 Serum organochlorine pesticides and pcbs and breast cancer risk: Results from a prospective analysis (USA). Cancer Causes Control 10:1–11. [PubMed: 10334636]
Ettinger AS, Wengrovitz AM. 2010 Guidelines for the identification and management of lead exposure in pregnant and lactating women.
Fort M, Cosin-Tomas M, Grimalt JO, Querol X, Casas M, Sunyer J. 2014 Assessment of exposure to trace metals in a cohort of pregnant women from an urban center by urine analysis in the first and third trimesters of pregnancy. Environ Sci Pollut Res Int 21:9234–9241. [PubMed: 24710728]
Gagné D, Lauzière J, Blanchet R, Vézina C, Vaissière É, Ayotte P, et al. 2013 Consumption of tomato products is associated with lower blood mercury levels in inuit preschool children. Food and chemical toxicology 51:404–410. [PubMed: 23127601]
Gorman Ng M, MacCalman L, Semple S, van Tongeren M. 2017 Field measurements of inadvertent ingestion exposure to metals. Ann Work Expo Health 61:1097–1107. [PubMed: 29025087]
Göthe C-J, Langworth S, Carleson R, Tufvesson B. 1985 Biological monitoring of exposure to metallic mercury. Journal of Toxicology: Clinical Toxicology 23:381–389. [PubMed: 4057327]
Groll A, Tutz G. 2014 Variable selection for generalized linear mixed models by l 1-penalized estimation. Statistics and Computing 24:137–154.
Hall M, Chen Y, Ahsan H, Slavkovich V, van Geen A, Parvez F, et al. 2006 Blood arsenic as a biomarker of arsenic exposure: Results from a prospective study. Toxicology 225:225–233. [PubMed: 16860454]
Hankinson SE, Manson JE, Spiegelman D, Willett WC, Longcope C, Speizer FE. 1995 Reproducibility of plasma hormone levels in postmenopausal women over a 2–3-year period. Cancer Epidemiol Biomarkers Prev 4:649–654. [PubMed: 8547832]
Hansen S, Nieboer E, Sandanger TM, Wilsgaard T, Thomassen Y, Veyhe AS, et al. 2011 Changes in maternal blood concentrations of selected essential and toxic elements during and after pregnancy. J Environ Monit 13:2143–2152. [PubMed: 21738945]
Hassan FI, Niaz K, Khan F, Maqbool F, Abdollahi M. 2017 The relation between rice consumption, arsenic contamination, and prevalence of diabetes in south asia. EXCLI J 16:1132–1143. [PubMed: 29285009]
Hinwood AL, Callan AC, Ramalingam M, Boyce M, Heyworth J, McCafferty P, et al. 2013 Cadmium, lead and mercury exposure in non smoking pregnant women. Environ Res 126:118–124. [PubMed: 23890969]
Hinwood AL, Stasinska A, Callan AC, Heyworth J, Ramalingam M, Boyce M, et al. 2015 Maternal exposure to alkali, alkali earth, transition and other metals: Concentrations and predictors of exposure. Environ Pollut 204:256–263. [PubMed: 25984984]
Horning KJ, Caito SW, Tipps KG, Bowman AB, Aschner M. 2015 Manganese is essential for neuronal health. Annu Rev Nutr 35:71–108. [PubMed: 25974698]
Hughner ReS, Maher JK, Childs NM. 2008 Review of food policy and consumer issues of mercury in fish. Journal of the American College of Nutrition 27:185–194. [PubMed: 18689549]
Hytten FE, Paintin DB. 1963 Increase in plasma volume during normal pregnancy. J Obstet Gynaecol Br Emp 70:402–407. [PubMed: 13956023]
Izquierdo Alvarez S, Castanon SG, Ruata ML, Aragues EF, Terraz PB, Irazabal YG, et al. 2007 Updating of normal levels of copper, zinc and selenium in serum of pregnant women. J Trace Elem Med Biol 21 Suppl 1:49–52. [PubMed: 18039497]
Jaishankar M, Tseten T, Anbalagan N, Mathew BB, Beeregowda KN. 2014 Toxicity, mechanism and health effects of some heavy metals. Interdiscip Toxicol 7:60–72. [PubMed: 26109881]
Jan AT, Azam M, Siddiqui K, Ali A, Choi I, Haq QM. 2015 Heavy metals and human health: Mechanistic insight into toxicity and counter defense system of antioxidants. Int J Mol Sci 16:29592–29630. [PubMed: 26690422]
Kalloo G, Wellenius GA, McCandless L, Calafat AM, Sjodin A, Karagas M, et al. 2018 Profiles and predictors of environmental chemical mixture exposure among pregnant women: The health outcomes and measures of the environment study. Environ Sci Technol 52:10104–10113. [PubMed: 30088764]
Ashrap et al. Page 17
Environ Res. Author manuscript; available in PMC 2021 April 01.
Author M
anuscriptA
uthor Manuscript
Author M
anuscriptA
uthor Manuscript
Keil DE, Berger-Ritchie J, McMillin GA. 2011 Testing for toxic elements: A focus on arsenic, cadmium, lead, and mercury. Laboratory Medicine 42:735–742.
Khayat S, Fanaei H, Ghanbarzehi A. 2017 Minerals in pregnancy and lactation: A review article. J Clin Diagn Res 11:QE01–QE05.
Khoushabi F, Shadan MR, Miri A, Sharifi-Rad J. 2016 Determination of maternal serum zinc, iron, calcium and magnesium during pregnancy in pregnant women and umbilical cord blood and their association with outcome of pregnancy. Mater Sociomed 28:104–107. [PubMed: 27147914]
Kim SS, Meeker JD, Carroll R, Zhao S, Mourgas MJ, Richards MJ, et al. 2018 Urinary trace metals individually and in mixtures in association with preterm birth. Environ Int 121:582–590. [PubMed: 30300816]
King JC. 2000 Physiology of pregnancy and nutrient metabolism. The American journal of clinical nutrition 71:1218S–1225S. [PubMed: 10799394]
Kubota R, Kunito T, Tanabe S. 2002 Chemical speciation of arsenic in the livers of higher trophic marine animals. Mar Pollut Bull 45:218–223. [PubMed: 12398388]
Lewis RC, Meeker JD, Basu N, Gauthier AM, Cantoral A, Mercado-Garcia A, et al. 2018 Urinary metal concentrations among mothers and children in a mexico city birth cohort study. Int J Hyg Environ Health 221:609–615. [PubMed: 29703512]
Li ZJ, Liang CM, Xia X, Huang K, Yan SQ, Tao RW, et al. 2019 Association between maternal and umbilical cord serum cobalt concentration during pregnancy and the risk of preterm birth: The ma'anshan birth cohort (mabc) study. Chemosphere 218:487–492. [PubMed: 30497031]
Liu J, Yang H, Shi H, Shen C, Zhou W, Dai Q, et al. 2010 Blood copper, zinc, calcium, and magnesium levels during different duration of pregnancy in chinese. Biol Trace Elem Res 135:31–37. [PubMed: 19669713]
Magyar MI, Mitchell V, Ladson A, Diaper C. 2008 Lead and other heavy metals: Common contaminants of rainwater tanks in melbourne. Proceedings of Water Down Under 2008:409.
Mahaffey K, Corneliussen P, Jelinek C, Fiorino J. 1975 Heavy metal exposure from foods. Environmental health perspectives 12:63–69. [PubMed: 1227862]
Mahaffey KR, Clickner RP, Jeffries RA. 2008 Adult women’s blood mercury concentrations vary regionally in the united states: Association with patterns of fish consumption (nhanes 1999–2004). Environmental health perspectives 117:47–53. [PubMed: 19165386]
Marangoni F, Cetin I, Verduci E, Canzone G, Giovannini M, Scollo P, et al. 2016 Maternal diet and nutrient requirements in pregnancy and breastfeeding. An italian consensus document. Nutrients 8.
Martin S, Griswold W. 2009 Human health effects of heavy metals. Environmental Science and Technology briefs for citizens 15:1–6.
Mathee A, Naicker N, Kootbodien T, Mahuma T, Nkomo P, Naik I, et al. 2014 A crosssectional analytical study of geophagia practices and blood metal concentrations in pregnant women in johannesburg, south africa. S Afr Med J 104:568–573. [PubMed: 25213850]
Meeker JD, Cantonwine DE, Rivera-Gonzalez LO, Ferguson KK, Mukherjee B, Calafat AM, et al. 2013 Distribution, variability, and predictors of urinary concentrations of phenols and parabens among pregnant women in puerto rico. Environ Sci Technol 47:3439–3447. [PubMed: 23469879]
Mendiola J, Moreno JM, Roca M, Vergara-Juarez N, Martinez-Garcia MJ, Garcia-Sanchez A, et al. 2011 Relationships between heavy metal concentrations in three different body fluids and male reproductive parameters: A pilot study. Environ Health 10:6. [PubMed: 21247448]
Mushak P, Davis JM, Crocetti AF, Grant LD. 1989 Prenatal and postnatal effects of low-level lead exposure: Integrated summary of a report to the u.S. Congress on childhood lead poisoning. Environ Res 50:11–36. [PubMed: 2676508]
Myers JE, Thompson ML, Naik I, Theodorou P, Esswein E, Tassell H, et al. 2003 The utility of biological monitoring for manganese in ferroalloy smelter workers in south africa. Neurotoxicology 24:875–883. [PubMed: 14637382]
Nakayama SF, Iwai-Shimada M, Oguri T, Isobe T, Takeuchi A, Kobayashi Y, et al. 2019 Blood mercury, lead, cadmium, manganese and selenium levels in pregnant women and their determinants: The japan environment and children's study (jecs). J Expo Sci Environ Epidemiol.
Natural Resources Defense Council. 2017 Threats on tap: Drinking water violations in puerto rico.
Ashrap et al. Page 18
Environ Res. Author manuscript; available in PMC 2021 April 01.
Author M
anuscriptA
uthor Manuscript
Author M
anuscriptA
uthor Manuscript

Nordberg G, Sandström B, Becking G, Goyer R. 2001 Essentiality and toxicity of trace elements: Principles and methods for assessment of risk from human exposure to essential trace elements. The Journal of Trace Elements in Experimental Medicine: The Official Publication of the International Society for Trace Element Research in Humans 14:261–273.
O'Neal SL, Zheng W. 2015 Manganese toxicity upon overexposure: A decade in review. Curr Environ Health Rep 2:315–328. [PubMed: 26231508]
Ortiz-Colon AI, Pinero-Santiago LE, Rivera NM, Sosa MA. 2016 Assessment of concentrations of heavy metals and phthalates in two urban rivers of the northeast of puerto rico. J Environ Anal Toxicol 6.
Osfor M, Ibrahim H, Mohamed Y, Ahmed S, Abd El Azeem A, Hegazy A. 2010 Effect of alpha lipoic acid and vitamin e on heavy metals intoxication in male albino rats. J Am Sci 6:56–63.
Padilla I, Irizarry C, Steele K. 2011 Historical contamination of groundwater resources in the north coast karst aquifers of puerto rico. Rev Dimens 3:7–12. [PubMed: 24772197]
Paradissis GN, Levinson RS, Heeter G, Cuca RC, Vanek PP. 1999 Multi-vitamin and mineral supplements for women.Google Patents.
Passos CJ, Mergler D, Gaspar E, Morais S, Lucotte M, Larribe F, et al. 2003 Eating tropical fruit reduces mercury exposure from fish consumption in the brazilian amazon. Environmental Research 93:123–130. [PubMed: 12963396]
Passos CJS, Mergler D, Fillion M, Lemire M, Mertens F, Guimarães JRD, et al. 2007 Epidemiologic confirmation that fruit consumption influences mercury exposure in riparian communities in the brazilian amazon. Environmental Research 105:183–193. [PubMed: 17374370]
Polanska K, Hanke W, Pawlas N, Wesolowska E, Jankowska A, Jagodic M, et al. 2018 Sex- dependent impact of low-level lead exposure during prenatal period on child psychomotor functions. Int J Environ Res Public Health 15.
Punshon T, Li Z, Marsit CJ, Jackson BP, Baker ER, Karagas MR. 2016 Placental metal concentrations in relation to maternal and infant toenails in a u.S. Cohort. Environ Sci Technol 50:1587–1594. [PubMed: 26727403]
Rehman K, Fatima F, Waheed I, Akash MSH. 2018 Prevalence of exposure of heavy metals and their impact on health consequences. J Cell Biochem 119:157–184. [PubMed: 28643849]
Roels HA, Ghyselen P, Buchet JP, Ceulemans E, Lauwerys RR. 1992 Assessment of the permissible exposure level to manganese in workers exposed to manganese dioxide dust. Br J Ind Med 49:25–34. [PubMed: 1733453]
Rosner B 2015 Fundamentals of biostatistics:Nelson Education.
Rudge CV, Rollin HB, Nogueira CM, Thomassen Y, Rudge MC, Odland JO. 2009 The placenta as a barrier for toxic and essential elements in paired maternal and cord blood samples of south african delivering women. J Environ Monit 11:1322–1330. [PubMed: 20449220]
Sanders AP, Claus Henn B, Wright RO. 2015 Perinatal and childhood exposure to cadmium, manganese, and metal mixtures and effects on cognition and behavior: A review of recent literature. Curr Environ Health Rep 2:284–294. [PubMed: 26231505]
Sani A, Abdullahi IL. 2017 Evaluation of some heavy metals concentration in body fluids of metal workers in kano metropolis, nigeria. Toxicol Rep 4:72–76. [PubMed: 28959627]
Sears ME. 2013 Chelation: Harnessing and enhancing heavy metal detoxification—a review. The Scientific World Journal 2013.
Shim S, Dorworth L, Lasrado J, Santerre C. 2004 Mercury and fatty acids in canned tuna, salmon, and mackerel. Journal of Food Science 69:C681–C684.
Shirai S, Suzuki Y, Yoshinaga J, Mizumoto Y. 2010 Maternal exposure to low-level heavy metals during pregnancy and birth size. J Environ Sci Health A Tox Hazard Subst Environ Eng 45:1468–1474. [PubMed: 20694885]
Silver MK, Li X, Liu Y, Li M, Mai X, Kaciroti N, et al. 2016 Low-level prenatal lead exposure and infant sensory function. Environ Health 15:65. [PubMed: 27266277]
Singh R, Gautam N, Mishra A, Gupta R. 2011 Heavy metals and living systems: An overview. Indian J Pharmacol 43:246–253. [PubMed: 21713085]
Spencer A 1999 Whole blood manganese levels in pregnancy and the neonate. Nutrition 15:731–734. [PubMed: 10501283]
Ashrap et al. Page 19
Environ Res. Author manuscript; available in PMC 2021 April 01.
Author M
anuscriptA
uthor Manuscript
Author M
anuscriptA
uthor Manuscript

Tabrizi FM, Pakdel FG. 2014 Serum level of some minerals during three trimesters of pregnancy in iranian women and their newborns: A longitudinal study. Indian J Clin Biochem 29:174–180. [PubMed: 24757299]
Takser L, Mergler D, Lafond J. 2005 Very low level environmental exposure to lead and prolactin levels during pregnancy. Neurotoxicol Teratol 27:505–508. [PubMed: 15939210]
Taylor CM, Kordas K, Golding J, Emond AM. 2017 Effects of low-level prenatal lead exposure on child iq at 4 and 8 years in a uk birth cohort study. Neurotoxicology 62:162–169. [PubMed: 28687448]
Taylor V, Goodale B, Raab A, Schwerdtle T, Reimer K, Conklin S, et al. 2017 Human exposure to organic arsenic species from seafood. Sci Total Environ 580:266–282. [PubMed: 28024743]
USEPA. 2007 Organic mercury teach chemical summary.
Valko M, Morris H, Cronin MT. 2005 Metals, toxicity and oxidative stress. Curr Med Chem 12:1161–1208. [PubMed: 15892631]
Van Metre PC, Mahler BJ. 2003 The contribution of particles washed from rooftops to contaminant loading to urban streams. Chemosphere 52:1727–1741. [PubMed: 12871740]
Wang RY, Caldwell KL, Jones RL. 2014 Analytical considerations in the clinical laboratory assessment of metals. J Med Toxicol 10:232–239. [PubMed: 24515525]
Watkins DJ, Ferguson KK, Anzalota Del Toro LV, Alshawabkeh AN, Cordero JF, Meeker JD. 2015 Associations between urinary phenol and paraben concentrations and markers of oxidative stress and inflammation among pregnant women in puerto rico. Int J Hyg Environ Health 218:212–219. [PubMed: 25435060]
Weaver VM, Vargas GG, Silbergeld EK, Rothenberg SJ, Fadrowski JJ, Rubio-Andrade M, et al. 2014 Impact of urine concentration adjustment method on associations between urine metals and estimated glomerular filtration rates (egfr) in adolescents. Environ Res 132:226–232. [PubMed: 24815335]
Wu S, Hivert MF, Cardenas A, Zhong J, Rifas-Shiman SL, Agha G, et al. 2017 Exposure to low levels of lead in utero and umbilical cord blood DNA methylation in project viva: An epigenome-wide association study. Environ Health Perspect 125:087019. [PubMed: 28858830]
Yoshida M 1985 Relation of mercury exposure to elemental mercury levels in the urine and blood. Scandinavian journal of work, environment & health:33–37.
Ashrap et al. Page 20
Environ Res. Author manuscript; available in PMC 2021 April 01.
Author M
anuscriptA
uthor Manuscript
Author M
anuscriptA
uthor Manuscript

Highlights
• First study to assess exposure to multiple metal(loid)s among pregnant
women in Puerto Rico
• Concentration of most metals among pregnant women were higher than
women of same age in NHANES
• Reliable biomarkers of exposures identified by examining biomarkers over
time and between matrices.
• Exposure predictors: fish, rice-As, fish-Hg, public water-Pb, smoking-Cd,
supplement-Cs, Mo, and Sb.
Ashrap et al. Page 21
Environ Res. Author manuscript; available in PMC 2021 April 01.
Author M
anuscriptA
uthor Manuscript
Author M
anuscriptA
uthor Manuscript

Figure 1. Heat map of pairwise correlations between urine and blood GM concentrations among
pregnant women in the PROTECT studyab.a The correlation heat map was created using natural log-transformed urinary or blood
metal(loid) concentrations;b All urinary concentrations were SG-corrected.
Ashrap et al. Page 22
Environ Res. Author manuscript; available in PMC 2021 April 01.
Author M
anuscriptA
uthor Manuscript
Author M
anuscriptA
uthor Manuscript
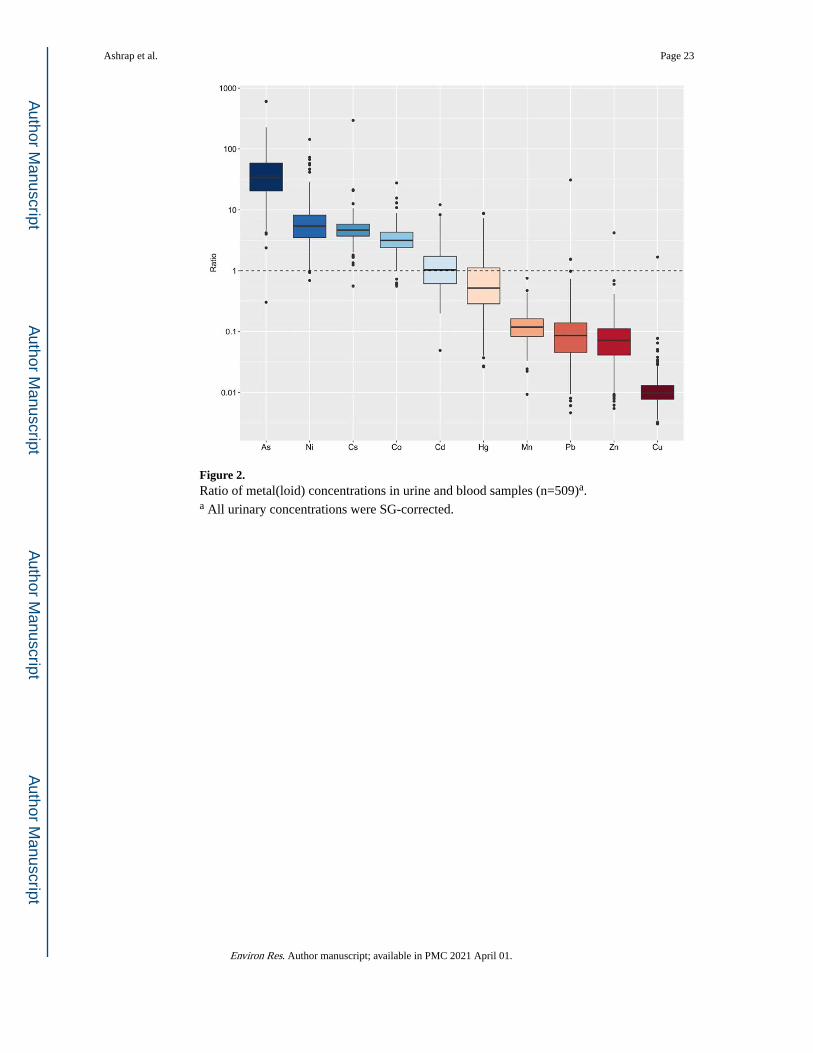
Figure 2. Ratio of metal(loid) concentrations in urine and blood samples (n=509)a.a All urinary concentrations were SG-corrected.
Ashrap et al. Page 23
Environ Res. Author manuscript; available in PMC 2021 April 01.
Author M
anuscriptA
uthor Manuscript
Author M
anuscriptA
uthor Manuscript

Figure 3. Beta and confidence intervals extracted from individual linear mixed models for metal(loid)
concentrations and potential predictorsab.
Δ Variables also selected as predictors of metal(loid) exposure from multivariable
LMMLasso models;a In this figure, covariates that were not associated with any metal(loid) concentrations in the
univariable and multivariable analysis were not included in the y-axis;b Drinking water source: bottle water (1) vs AAA public water (0).
Ashrap et al. Page 24
Environ Res. Author manuscript; available in PMC 2021 April 01.
Author M
anuscriptA
uthor Manuscript
Author M
anuscriptA
uthor Manuscript

Author M
anuscriptA
uthor Manuscript
Author M
anuscriptA
uthor Manuscript
Ashrap et al. Page 25
Table 1.
Urinary and blood concentration of metal(loid)s (ng/ml) in 1,040 pregnant women from Puerto Rico in 2011–
2017
Metal(loid)
Specimen N(Sample)
LOD
% >LOD
GM GSD 25% 50% 75% 95% rd
AsUrine
a 1285 0.3 100 10.9 2.5 6.1 10.8 19.0 46.4 0.27**
Bloodb 1183 0.3 48.9 0.34 1.8 0.21 0.21 0.48 0.99
BaUrine
a 1285 0.1 99.3 2.5 2.9 1.3 2.5 5.0 12.9
Bloodb
CdUrine
a 1285 0.06 74.5 0.12 2.3 0.06 0.12 0.20 0.58 0.25**
Bloodb 1183 0.1 60.9 0.12 1.7 0.07 0.12 0.16 0.27
CoUrine
a 1285 0.05 100 1.0 1.9 0.70 1.0 1.5 2.8 0.51**
Bloodb 1183 0.2 98.2 0.34 1.4 0.28 0.34 0.41 0.57
CsUrine
a 1285 0.01 100 4.9 1.7 3.7 5.3 7.1 10.7 0.43**
Bloodb 1183 0.04 99.9 1.1 1.4 0.94 1.2 1.4 1.9
CuUrine
a 1285 2.5 99.3 14.0 1.8 10.0 14.2 19.5 34.5 0.21**
Bloodb 1183 9 99.9 1552 1.3 1393 1562 1740 2096
HgUrine
a 1285 0.05 98.6 0.60 2.9 0.30 0.59 1.2 3.6 0.33**
Bloodb 1183 0.2 99.9 1.2 1.7 0.85 1.2 1.7 3.0
MnUrine
a 1285 0.08 100 1.2 1.6 0.95 1.2 1.6 2.3 0.01
Bloodb 1183 2 99.9 11.3 1.4 9.0 11.3 14.0 19.4
MoUrine
a 1285 0.3 100 58.9 2.0 38.9 62.9 92.2 166
Bloodb
NiUrine
a 1285 0.8 98.9 5.4 2.0 3.5 5.5 8.5 15.5 0.06
Bloodb 1183 0.5 96.4 1.0 1.6 0.81 1.0 1.3 2.2
PbUrine
a 1285 0.1 72.1 0.25 2.7 <LOD 0.27 0.51 1.2 0.17**
Bloodb 1183 0.02 99.9 3.3 1.6 2.5 3.3 4.3 6.4
SbUrine
a 1285 0.04 90 0.09 1.9 0.06 0.08 0.12 0.22
Bloodb
SnUrine
a 1285 0.1 100 2.1 3.0 1.0 1.9 4.0 14.0
Bloodb
ZnUrine
a 1285 2 100 266 2.5 155 300 498 947 0.07
Bloodb 1183 24 99.9 4682 1.3 4248 4752 5252 6055
aIncludes uncorrected urinary metal concentrations for up to 3 repeated samples per woman (n = 1285 samples)
Environ Res. Author manuscript; available in PMC 2021 April 01.
Author M
anuscriptA
uthor Manuscript
Author M
anuscriptA
uthor Manuscript
Ashrap et al. Page 26
bIncludes blood metal concentrations for up to 2 repeated samples per woman (n = 1183 samples)
cLOD, limit of detection; GM, geometric mean; GSD, geometric standard deviation
dSpearman correlation coefficient calculated for blood and urine metal concentrations
**P value for the Spearman test <0.01.
Environ Res. Author manuscript; available in PMC 2021 April 01.

Author M
anuscriptA
uthor Manuscript
Author M
anuscriptA
uthor Manuscript
Ashrap et al. Page 27
Table 2.
Intraclass correlation coefficients (ICCs) and 95% confidence for natural log-transformed urinary and blood
concentrations of biomarkers and ratio of urine and blood concentrations.
Urineab
Bloodc Urine/Blood
Ratiode
biomarker ICC (95% CI) ICC (95% CI) ICC (95% CI)
As 0.21 (0.15,0.29) 0.25 (0.17,0.36) 0.20 (0.08,0.42)
Ba 0.19 (0.13,0.28) - -
Cd 0.18 (0.12,0.26) 0.48 (0.41,0.56) 0.18 (0.07,0.39)
Co 0.27 (0.21,0.36) 0.16 (0.07,0.3) 0.07 (0.00,0.53)
Cs 0.31 (0.25,0.38) 0.77 (0.72,0.8) 0.40 (0.25,0.56)
Cu 0.21 (0.15,0.3) 0.68 (0.62,0.74) 0.22 (0.06,0.56)
Hg 0.51 (0.46,0.57) 0.62 (0.56,0.68) 0.43 (0.29,0.59)
Mn 0.13 (0.07,0.21) 0.54 (0.44,0.6) 0.31 (0.15,0.53)
Mo 0.15 (0.09,0.23) - -
Ni 0.13 (0.07,0.23) 0.13 (0.05,0.27) 0.22 (0.08,0.48)
Pb 0.08 (0.03,0.2) 0.78 (0.73,0.81) 0.22 (0.07,0.48)
Sb 0.17 (0.11,0.26) - -
Sn 0.55 (0.49,0.61) - -
Zn 0.39 (0.33,0.46) 0.75 (0.7,0.79) 0.48 (0.35,0.62)
aAmong 660 women who had urine samples available, 184 had data from all three visits, 257 had data from two visits, and 219 had data from one
visit
bspecific gravity corrected concentration
cAmong 842 women who had blood samples available, 341 had data from both visits, and 501 had data from one visit
dAmong 403 women who had both urine and blood samples available, 106 had data from both visits, and 297 had data from one visit
especific gravity corrected urinary concentration was used to calculate the ratio.
Environ Res. Author manuscript; available in PMC 2021 April 01.

Author M
anuscriptA
uthor Manuscript
Author M
anuscriptA
uthor Manuscript
Ashrap et al. Page 28
Tab
le 3
.
Uri
nary
and
blo
od m
etal
(loi
d) c
once
ntra
tions
am
ong
preg
nant
wom
en in
PR
OT
EC
T a
nd p
revi
ous
stud
iesa .
Uri
nary
Met
al(l
oid)
s Su
mm
ary
Ref
eren
ceC
ount
ry/
Reg
ion
Yea
rnb
As
Ba
Cd
Co
Cs
Cu
Hg
Mn
Mo
Ni
Pb
SbSn
Zn
Cor
r
ecti
onc
GM
d
/Med
ian
Uni
t
Pre
sent
stu
dyP
uert
o R
ico
2011
-201
712
8510
.92.
50.
121.
04.
914
.00.
601.
258
.95.
40.
250.
092.
126
6SG
GM
ng/m
L
Kal
loo
et a
l, 20
18O
hio,
US
2003
-200
638
95.
3-
0.20
--
-0.
60-
--
0.70
--
--
GM
ng/m
L
Lew
is e
t al 2
018
Mex
ico
1997
-200
421
213
.84.
00.
181.
2-
--
0.82
17.3
9.5
2.9
--
288
-G
Mng
/mL
Cal
lan
et a
l. 20
13A
ustr
alia
2008
-201
115
713
.2-
-1.
2-
10.4
-0.
53-
2.3
--
-39
6C
rtM
edia
nμg
/g
Hin
woo
d et
al,
2013
Aus
tral
ia20
08-2
011
157
--
0.78
--
-<
0.40
--
-0.
70-
--
Crt
Med
ian
μg/g
Hin
woo
d et
al,
2015
Aus
tral
ia20
08-2
011
157
--
--
8.3
--
--
--
--
-C
rtM
edia
nμg
/g
Bir
gisd
ottir
et a
l, 20
13N
orw
ay20
0318
479
.6-
0.16
--
-1.
2-
--
--
--
Crt
Med
ian
μg/g
Fort
et a
l, 20
14Sp
ain
(1st
trim
e )20
04-2
006
489
32.0
-0.
610.
458.
012
.0-
--
3.9
3.8
0.36
-25
6C
rtM
edia
nμg
/g
Spai
n (3
rd
trim
e )20
04-2
006
489
35.0
-0.
541.
36.
815
.0-
--
3.9
3.9
0.28
-29
0C
rtM
edia
nμg
/g
Shir
ai e
t al,
2010
Japa
n20
07-2
008
7876
.9-
0.77
--
12.8
--
79.0
-0.
48-
0.23
393
Crt
GM
μg/g
Blo
od M
etal
(loi
d)s
Sum
mar
y
Ref
eren
ceC
ount
ry/
Reg
ion
Yea
rnb
As
Ba
Cd
Co
Cs
Cu
Hg
Mn
Mo
Ni
Pbf
SbSn
Zn
Cor
r
ecti
onc
GM
d
/Med
ian
Uni
t
Pre
sent
stu
dyP
uert
o R
ico
2011
-201
711
830.
340.
120.
341.
115
521.
211
.31.
00.
3346
82-
GM
ng/m
L
Kal
loo
et a
l, 20
18O
hio,
US
2003
-200
638
9-
--
--
--
0.70
--
GM
ng/m
L
Cal
lan
et a
l. 20
13A
ustr
alia
2008
-201
117
21.
3-
0.28
-12
52-
6.5
<2.
0-
2330
-M
edia
nng
/mL
Hin
woo
d et
al,
2013
Aus
tral
ia20
08-2
011
172
-0.
38-
--
0.46
--
0.37
--
Med
ian
ng/m
L
Hin
woo
d et
al,
2015
Aus
tral
ia20
08-2
011
172
--
-1.
9-
--
--
--
Med
ian
ng/m
L
Bir
gisd
ottir
et a
l 20
13N
orw
ay20
0318
45.
90.
45-
--
4.0
--
2.5
--
Med
ian
ng/m
L
Han
sen
et a
l, 20
11N
orw
ay20
07-2
009
211
1.4
0.15
0.10
-16
501.
210
.7-
0.75
5110
-G
Mng
/mL
Mat
hee
et a
l, 20
14So
uth
Afr
ica
2010
307
8.0
0.20
--
-0.
60-
-1.
4-
-M
edia
nng
/mL
Rud
ge e
t al.
2009
Sout
h A
fric
anr
g62
0.57
0.15
0.60
-17
300.
6516
.8-
2.3
6290
-M
edia
nng
/mL
Nak
ayam
a et
al,
2019
Japa
n20
11-2
014
1799
-0.
71-
--
3.8
16.1
-0.
64-
-G
Mng
/mL
Environ Res. Author manuscript; available in PMC 2021 April 01.
Author M
anuscriptA
uthor Manuscript
Author M
anuscriptA
uthor Manuscript
Ashrap et al. Page 29a To
allo
w f
or c
ompa
riso
n on
sam
e sc
ale,
the
urin
e co
ncen
trat
ions
wer
e co
nver
ted
to n
g/m
L f
or u
nadj
uste
d ur
ine,
μg/
g fo
r cr
eatin
ine
adju
sted
uri
ne, a
nd b
lood
con
cent
ratio
ns w
ere
conv
erte
d to
ng/
mL
b Sam
ple
Size
c - N
o co
rrec
tion
appl
ied,
SG
cor
rect
ed f
or s
peci
fic
grav
ity C
rt c
orre
cted
for
cre
atin
ine
d GM
geo
met
ric
mea
n
e trim
trim
este
r
f the
unit
for
bloo
d Pb
con
cent
ratio
n is
μg/
dL
g nr n
ot r
epor
ted.
Environ Res. Author manuscript; available in PMC 2021 April 01.