Embed Size (px)
Citation preview
CDM SubhalosCDM Subhalos
P.NurmiP.Nurmi, P.Heinämäki, E. Saar, M. , P.Heinämäki, E. Saar, M. Einasto, J. Holopainen, V.J. Einasto, J. Holopainen, V.J.
Martinez, J. EinastoMartinez, J. Einasto
Subhalos in LCDM cosmological simulations: Subhalos in LCDM cosmological simulations: Masses and abundances, Masses and abundances,
astro-ph/0611941astro-ph/0611941
Dark matter cosmological simulations have had considerable Dark matter cosmological simulations have had considerable success in modeling large-scale-structure in the Universe: CMB success in modeling large-scale-structure in the Universe: CMB to present structures, abundance of massive galaxy clusters…to present structures, abundance of massive galaxy clusters…
More detail simulations shows that there are still a number of More detail simulations shows that there are still a number of
discrepancies on smaller scales:discrepancies on smaller scales: CDM predicts one-to-two orders of magnitude more satellite CDM predicts one-to-two orders of magnitude more satellite
galaxies (subhalos) orbiting their host halos..galaxies (subhalos) orbiting their host halos.. In simulations the density profiles of virialized galaxy scale CDM In simulations the density profiles of virialized galaxy scale CDM
halos are too steep with respect to what is inferred from rotation halos are too steep with respect to what is inferred from rotation curves of dwarf spiral and low surface brightness galaxies.curves of dwarf spiral and low surface brightness galaxies.
Probably mass is more smoothly distributed on smaller scales, Probably mass is more smoothly distributed on smaller scales,
baryonic physics causes small halos to remain starless? (Bullock baryonic physics causes small halos to remain starless? (Bullock et al. 2000,Somerville 2002, Springel et al. 2001). Galaxies and et al. 2000,Somerville 2002, Springel et al. 2001). Galaxies and suhalos represent different population (Gao et al. 2004)? suhalos represent different population (Gao et al. 2004)?
If predicted subhalos exist most of the satellites are completely If predicted subhalos exist most of the satellites are completely
(or almost completely) dark(or almost completely) dark
The predicted mini-halos are not observed Strong gravitational The predicted mini-halos are not observed Strong gravitational lensing (multiple quasar images and giant arc systems) provides lensing (multiple quasar images and giant arc systems) provides an unique way to study the dark matter content of galaxies. an unique way to study the dark matter content of galaxies.
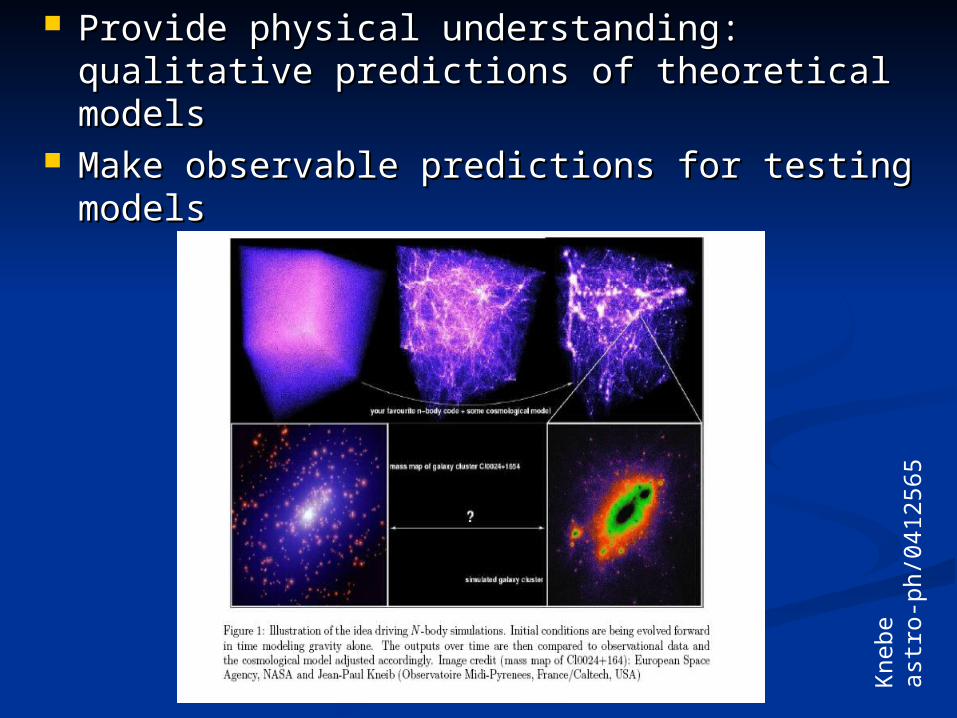
Provide physical understanding: qualitative Provide physical understanding: qualitative predictions of theoretical modelspredictions of theoretical models
Make observable predictions for testing Make observable predictions for testing modelsmodels
Kn
eb
e
ast
ro-p
h/0
412565
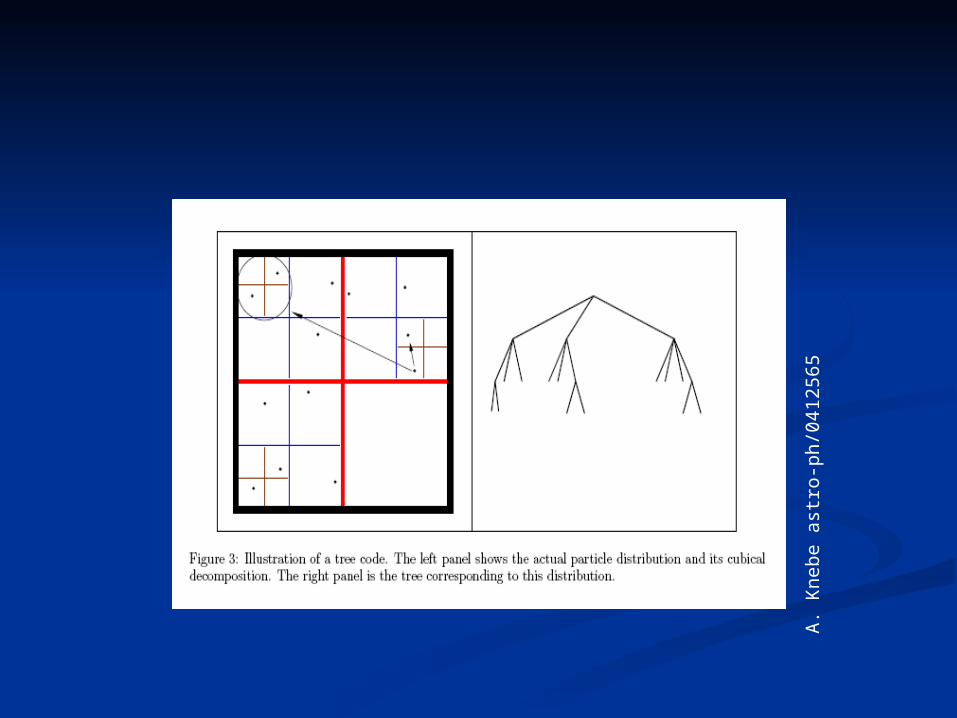
Different N-body codes are neededDifferent N-body codes are needed Numerical methods themselves are approximations: limitations in Numerical methods themselves are approximations: limitations in
resolution, physics, numerical errors, bugs… resolution, physics, numerical errors, bugs…
Different halo finding algorithms are Different halo finding algorithms are neededneeded
FOF, SKID, SO, DENMAX, BDM….FOF, SKID, SO, DENMAX, BDM….
Large enough volume, sufficient Large enough volume, sufficient mass resolutionmass resolution
mmpp=(L/N)=(L/N)3300cc
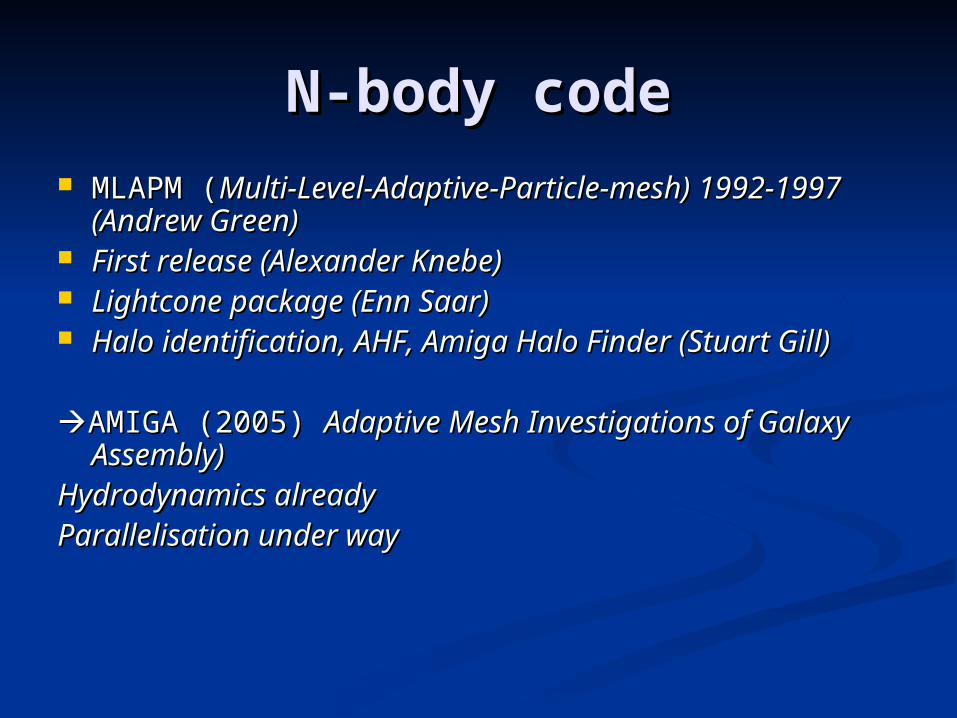
N-body codeN-body code MLAPM (MLAPM (Multi-Level-Adaptive-Particle-mesh) 1992-Multi-Level-Adaptive-Particle-mesh) 1992-
1997 (Andrew Green)1997 (Andrew Green) First release (Alexander Knebe)First release (Alexander Knebe) Lightcone package (Enn Saar)Lightcone package (Enn Saar) Halo identification, AHF, Amiga Halo Finder (Stuart Halo identification, AHF, Amiga Halo Finder (Stuart
Gill)Gill)
AMIGA (2005) AMIGA (2005) Adaptive Mesh Investigations of Adaptive Mesh Investigations of Galaxy Assembly)Galaxy Assembly)
Hydrodynamics alreadyHydrodynamics alreadyParallelisation under way Parallelisation under way
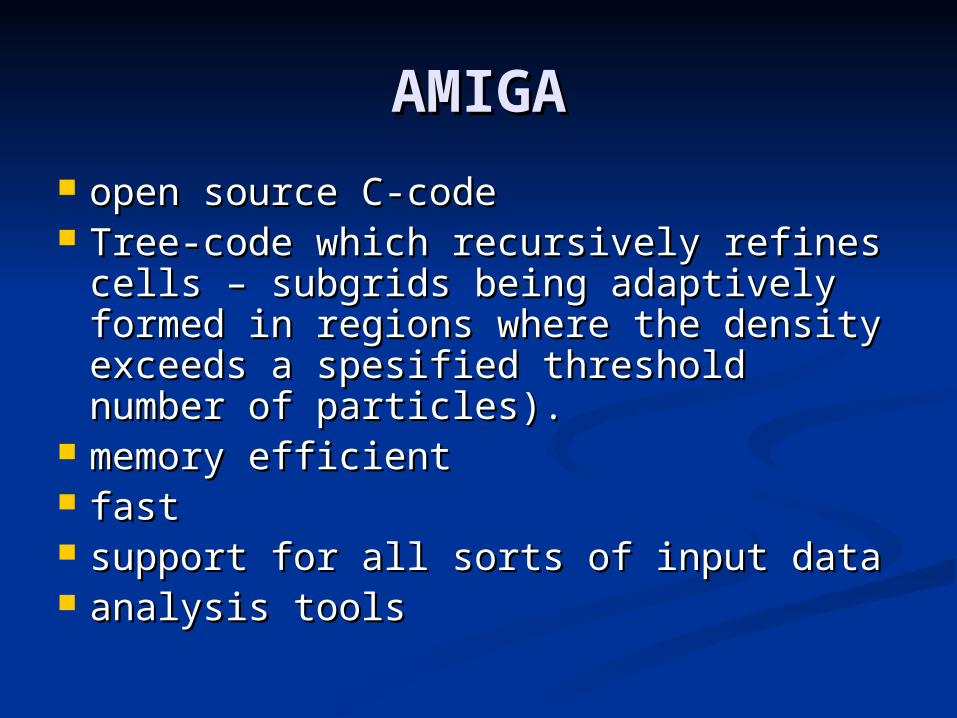
AMIGAAMIGA
open source C-codeopen source C-code Tree-code which recursively refines Tree-code which recursively refines
cells – subgrids being adaptively cells – subgrids being adaptively formed in regions where the density formed in regions where the density exceeds a spesified threshold number exceeds a spesified threshold number of particles).of particles).
memory efficientmemory efficient fastfast support for all sorts of input datasupport for all sorts of input data analysis toolsanalysis tools
A. K
neb
e a
stro
-ph
/04
1256
5
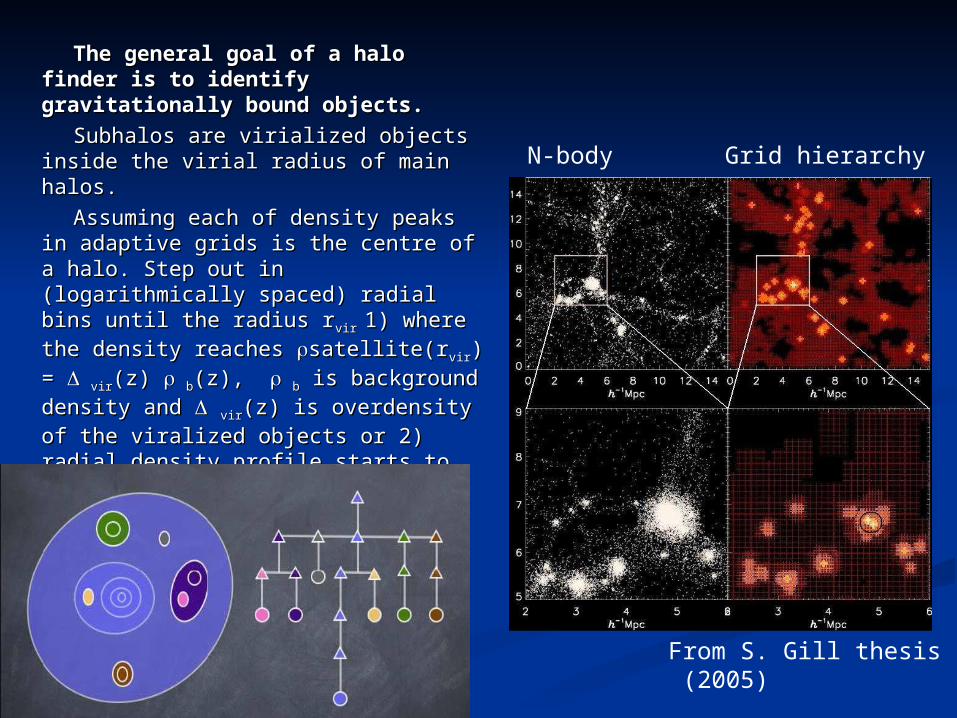
The general goal of a halo finder The general goal of a halo finder is to identify gravitationally is to identify gravitationally bound objects.bound objects.
Subhalos are virialized objects Subhalos are virialized objects inside the virial radius of main inside the virial radius of main halos.halos.
Assuming each of density peaks in Assuming each of density peaks in adaptive grids is the centre of a adaptive grids is the centre of a halo. Step out in (logarithmically halo. Step out in (logarithmically spaced) radial bins until the radius spaced) radial bins until the radius rrvir vir 1) where 1) where the density reaches the density reaches satellite(rsatellite(rvirvir) = ) = virvir(z) (z) bb(z), (z), bb is is background density and background density and virvir(z) is (z) is overdensity of the viralized objects overdensity of the viralized objects or 2) radial density profile starts to or 2) radial density profile starts to rise.rise.
Each branch of the grid tree represents a Each branch of the grid tree represents a single dark matter halo within the single dark matter halo within the simulationsimulation
From S. Gill thesis (2005)
N-body Grid hierarchy
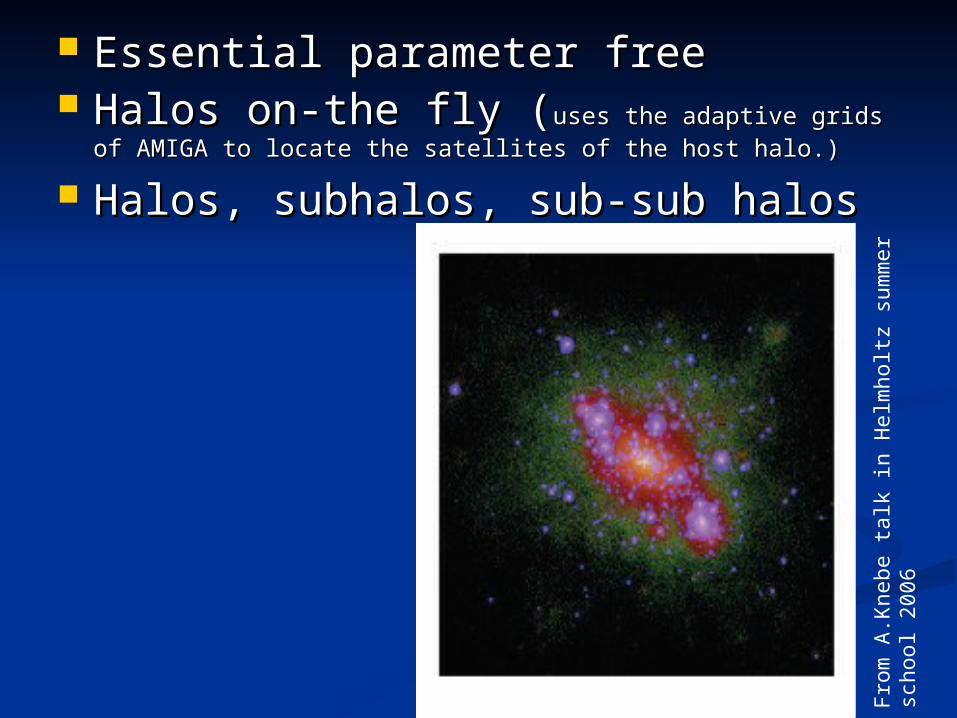
Essential parameter freeEssential parameter free Halos on-the fly (Halos on-the fly (uses the adaptive grids of AMIGA uses the adaptive grids of AMIGA
to locate the satellites of the host halo.)to locate the satellites of the host halo.)
Halos, subhalos, sub-sub halos Halos, subhalos, sub-sub halos
Fro
m A
.Kne
be ta
lk in
Hel
mho
ltz s
umm
er s
choo
l 200
6
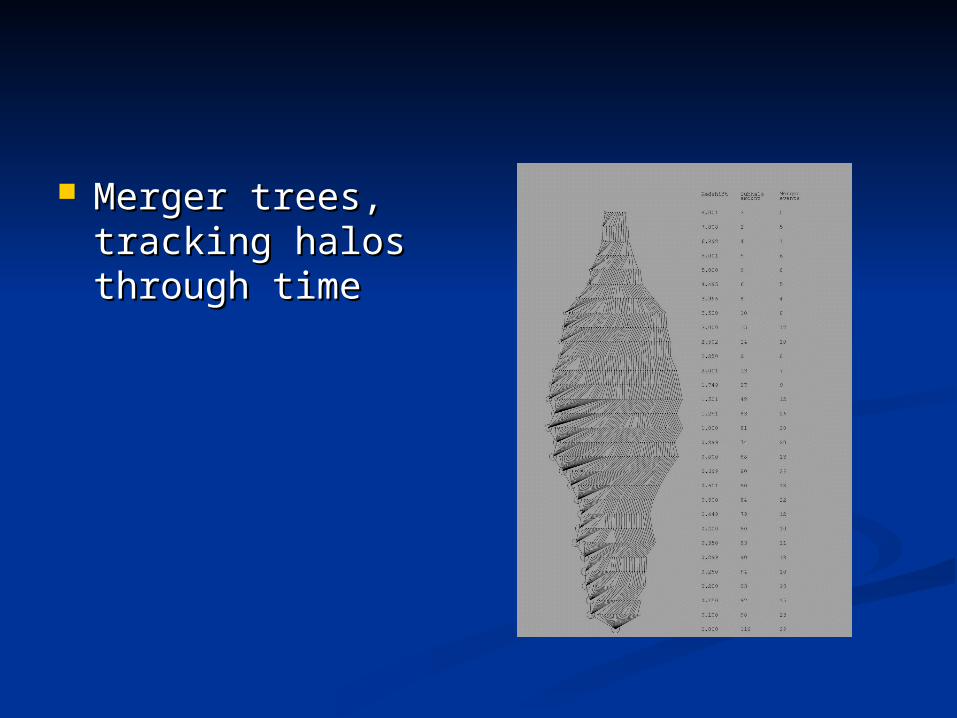
Merger trees, Merger trees, tracking halos tracking halos through timethrough time
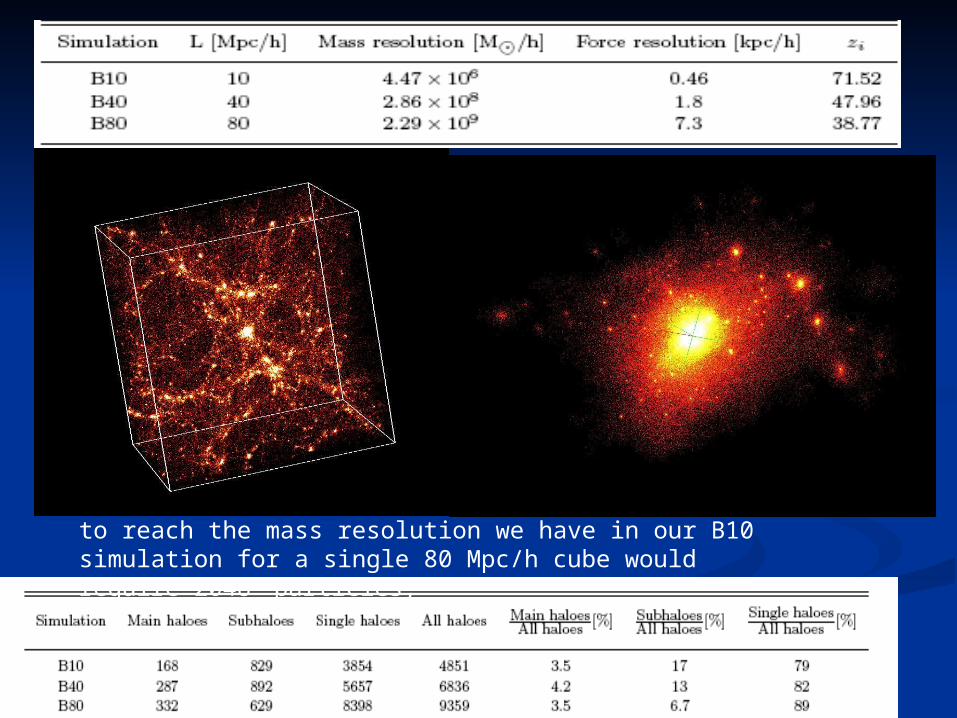
to reach the mass resolution we have in our B10 simulation for a single 80 Mpc/h cube would require 20483 particles,
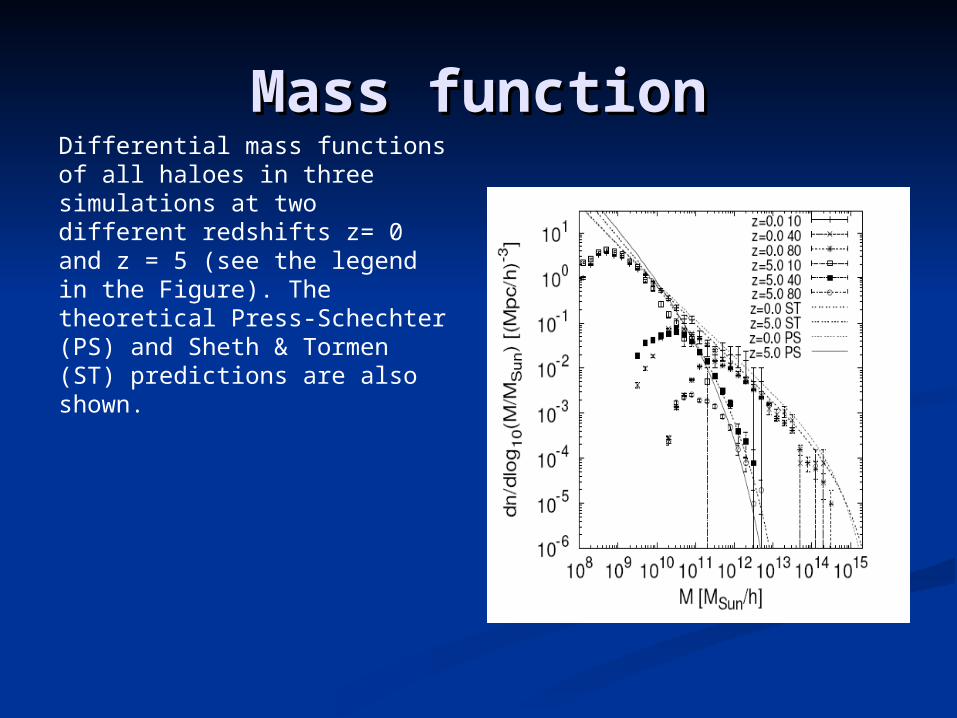
Mass functionMass functionDifferential mass functions of all haloes in three simulations at two different redshifts z= 0 and z = 5 (see the legend in the Figure). The theoretical Press-Schechter (PS) and Sheth & Tormen (ST) predictions are also shown.
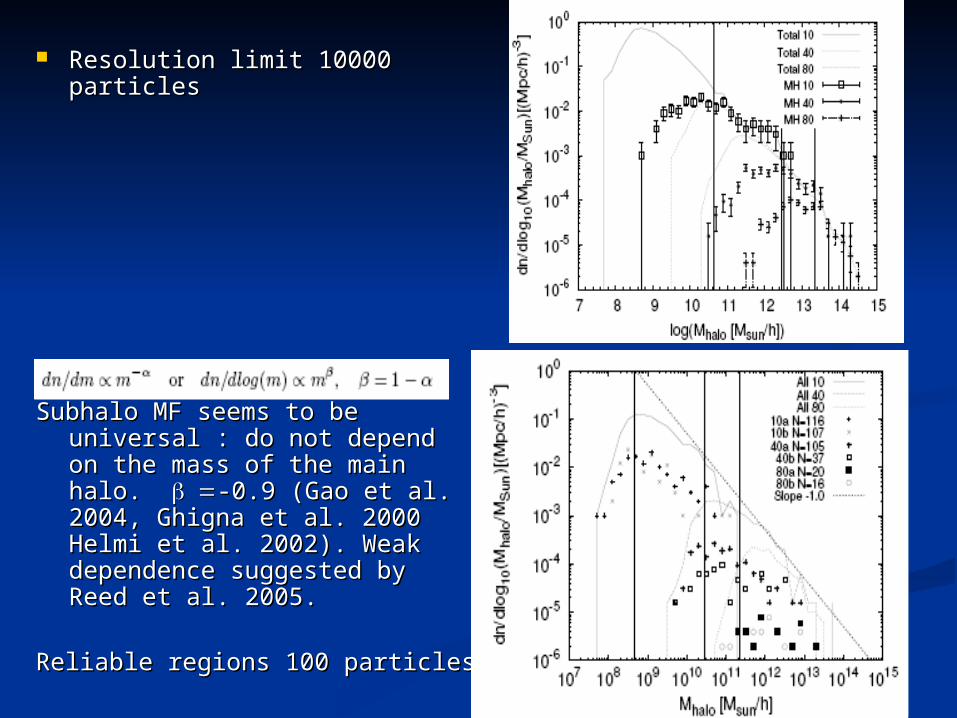
Resolution limit 10000 Resolution limit 10000 particlesparticles
Subhalo MF seems to be Subhalo MF seems to be universal : do not depend on universal : do not depend on the mass of the main halo. the mass of the main halo. -0.9 (Gao et al. 2004, -0.9 (Gao et al. 2004, Ghigna et al. 2000 Helmi et al. Ghigna et al. 2000 Helmi et al. 2002). Weak dependence 2002). Weak dependence suggested by Reed et al. suggested by Reed et al. 2005.2005.
Reliable regions 100 particlesReliable regions 100 particles
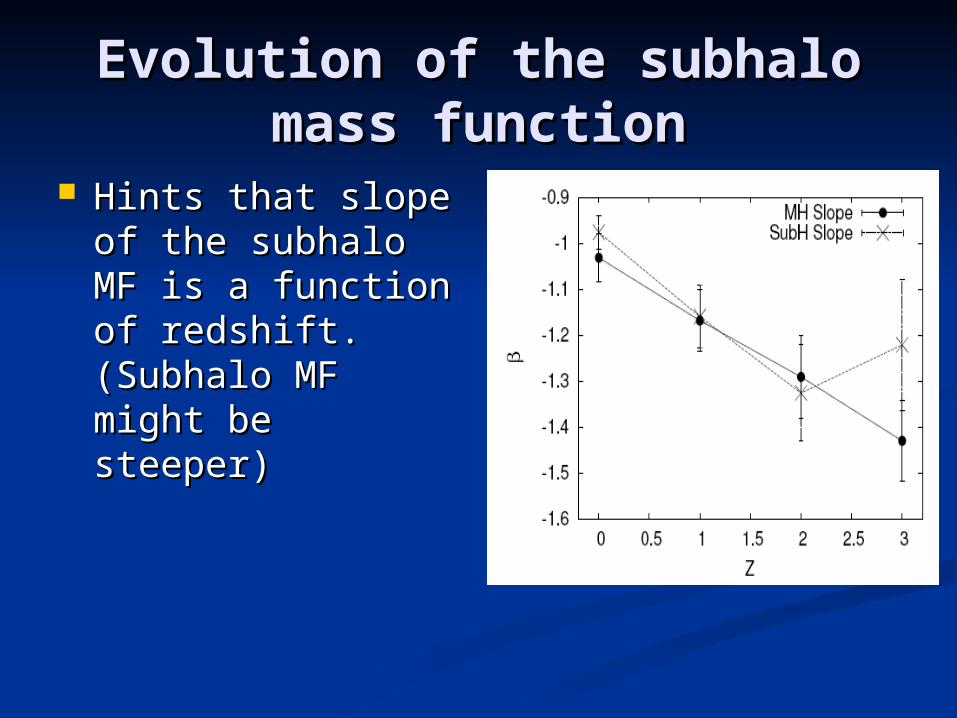
Evolution of the subhalo Evolution of the subhalo mass functionmass function
Hints that slope of Hints that slope of the subhalo MF is the subhalo MF is a function of a function of redshift. (Subhalo redshift. (Subhalo MF might be MF might be steeper)steeper)
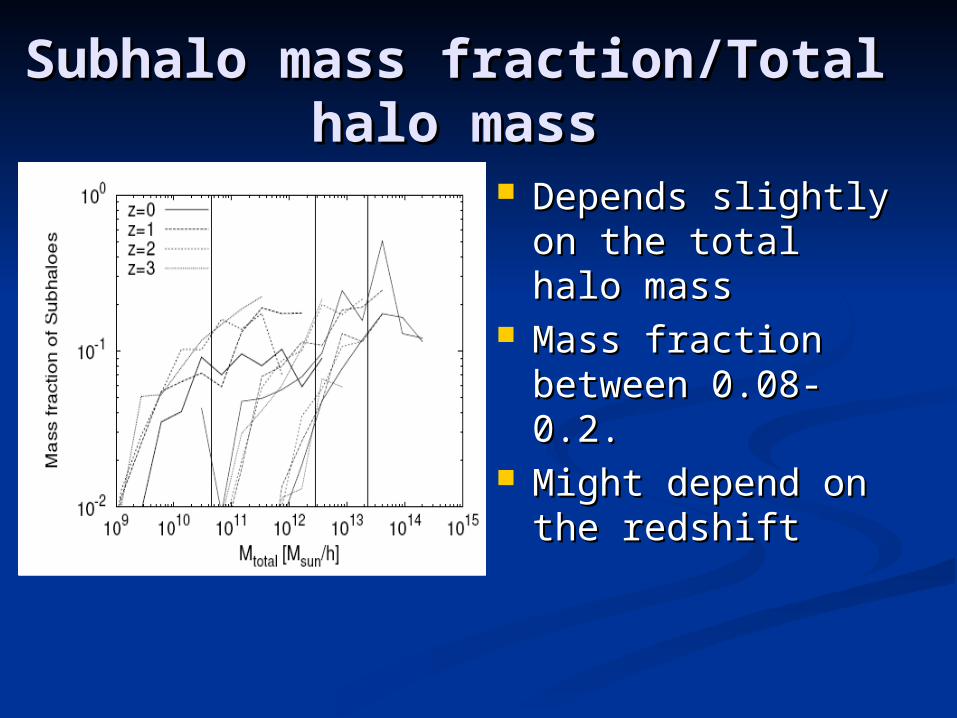
Subhalo mass fraction/Total Subhalo mass fraction/Total halo masshalo mass
Depends slightly Depends slightly on the total halo on the total halo massmass
Mass fraction Mass fraction between 0.08-0.2.between 0.08-0.2.
Might depend on Might depend on the redshift the redshift
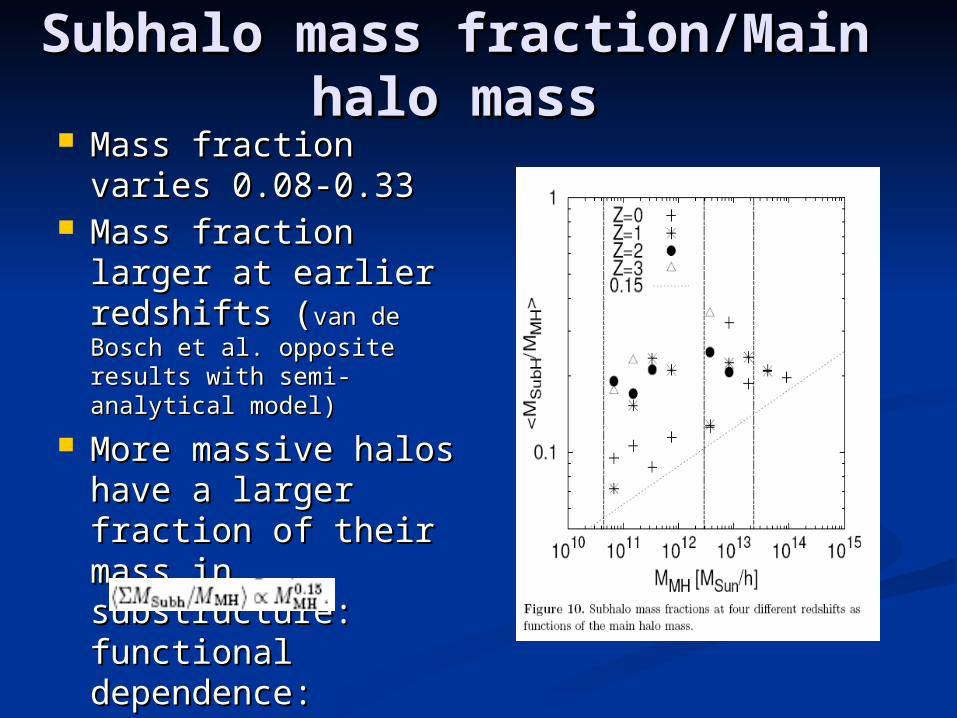
Subhalo mass fraction/Main Subhalo mass fraction/Main halo masshalo mass
Mass fraction varies Mass fraction varies 0.08-0.330.08-0.33
Mass fraction larger Mass fraction larger at earlier redshifts at earlier redshifts ((van de Bosch et al. van de Bosch et al. opposite results with semi-opposite results with semi-analytical model) analytical model)
More massive halos More massive halos have a larger have a larger fraction of their fraction of their mass in mass in substructure: substructure: functional functional dependence: dependence:
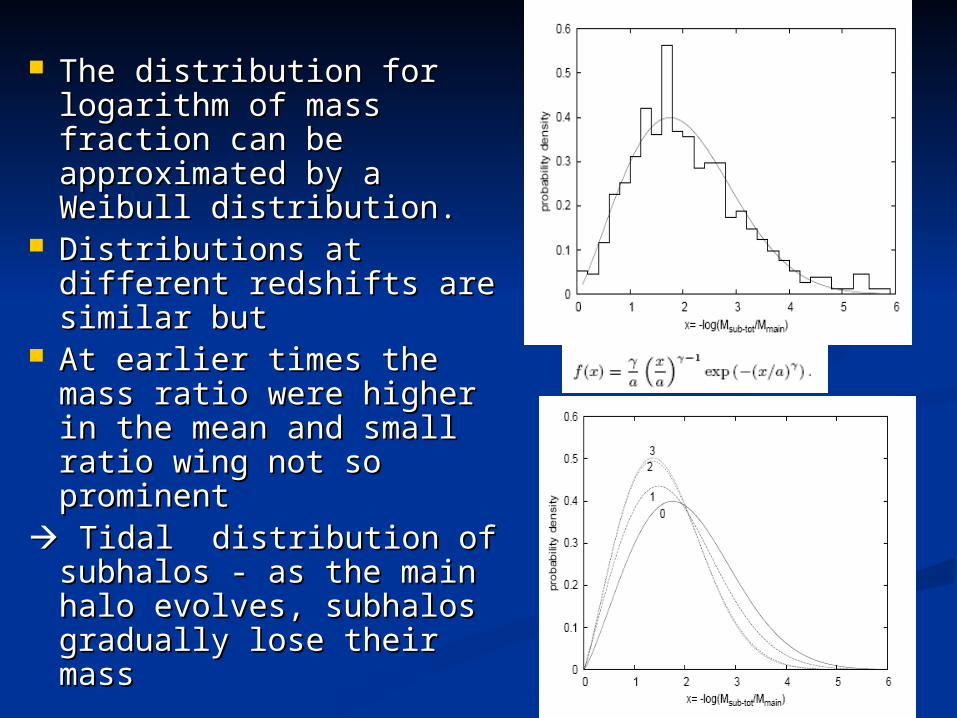
The distribution for The distribution for logarithm of mass logarithm of mass fraction can be fraction can be approximated by a approximated by a Weibull distribution. Weibull distribution.
Distributions at different Distributions at different redshifts are similar but redshifts are similar but
At earlier times the mass At earlier times the mass ratio were higher in the ratio were higher in the mean and small ratio mean and small ratio wing not so prominent wing not so prominent
Tidal distribution of Tidal distribution of subhalos - as the main subhalos - as the main halo evolves, subhalos halo evolves, subhalos gradually lose their gradually lose their mass mass
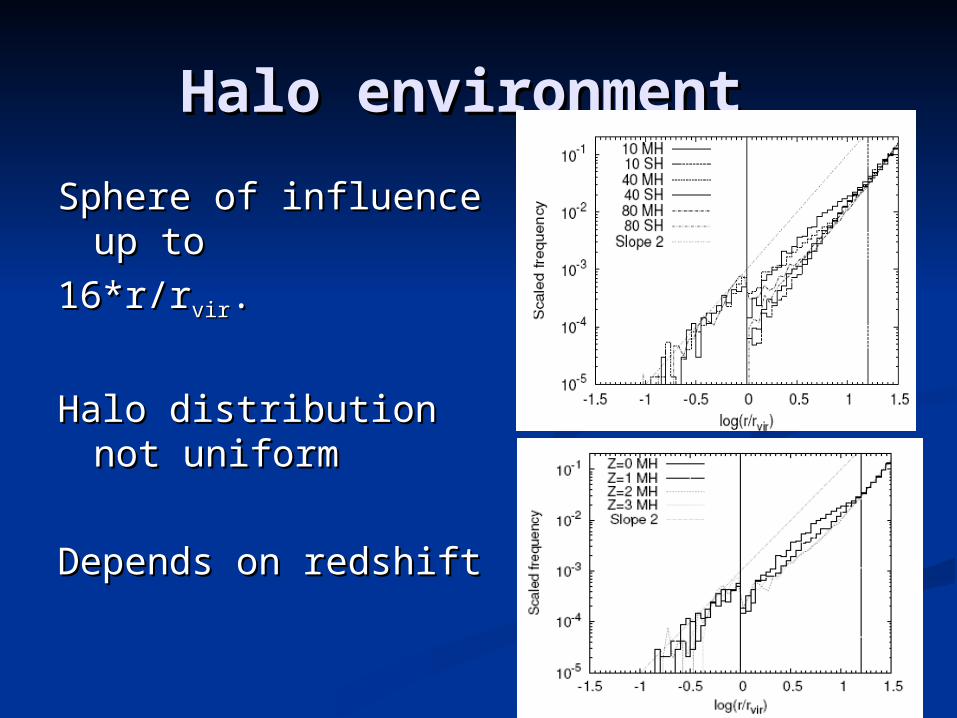
Halo environment Halo environment
Sphere of influence up Sphere of influence up to to
16*r/r16*r/rvirvir. .
Halo distribution not Halo distribution not uniformuniform
Depends on redshift Depends on redshift
Total mass fraction + subhalo MF + Total mass fraction + subhalo MF + spatial distribution can be used to spatial distribution can be used to find the radial mass density find the radial mass density distributions of subhalos, and the distributions of subhalos, and the surface mass densities necessary for surface mass densities necessary for gravitational lensing studies.gravitational lensing studies.
ConclusionsConclusions Number of N-body particles to reliably select a halo: about 100 Number of N-body particles to reliably select a halo: about 100
particles for subhalos, 10000 particles for main haloes harboring particles for subhalos, 10000 particles for main haloes harboring subhalos. subhalos.
Functional form of the mass function agrees well with earlier studies Functional form of the mass function agrees well with earlier studies Gao et al. 2004, Kravtsov et al. 2004 Gao et al. 2004, Kravtsov et al. 2004
The MF slope is same for main halos and subhalos. Slope is a function The MF slope is same for main halos and subhalos. Slope is a function of redshift.of redshift.
Subhalo mass fraction depends on the main halo mass – more massive Subhalo mass fraction depends on the main halo mass – more massive halos have larger mass fraction. Within the same main halo mass range, halos have larger mass fraction. Within the same main halo mass range, the subhalo mass fraction is larger at earlier epochs.the subhalo mass fraction is larger at earlier epochs.
The distribution for the logarithm of mass fraction can be approximated The distribution for the logarithm of mass fraction can be approximated by a Weibull distribution. There is a systematic change in the by a Weibull distribution. There is a systematic change in the distribution parameters as a function of redshift.distribution parameters as a function of redshift.
The number density of haloes surrounding main haloes drops quickly as The number density of haloes surrounding main haloes drops quickly as we move beyond the virial radius of the halo. However, the slope stays we move beyond the virial radius of the halo. However, the slope stays the same after that, up to distance about 3 *rvir. The sphere of the same after that, up to distance about 3 *rvir. The sphere of influence of a halo reaches out to the distance of 16 times of its virial influence of a halo reaches out to the distance of 16 times of its virial radius. Beyond this limit the number density of haloes is uniform.radius. Beyond this limit the number density of haloes is uniform.
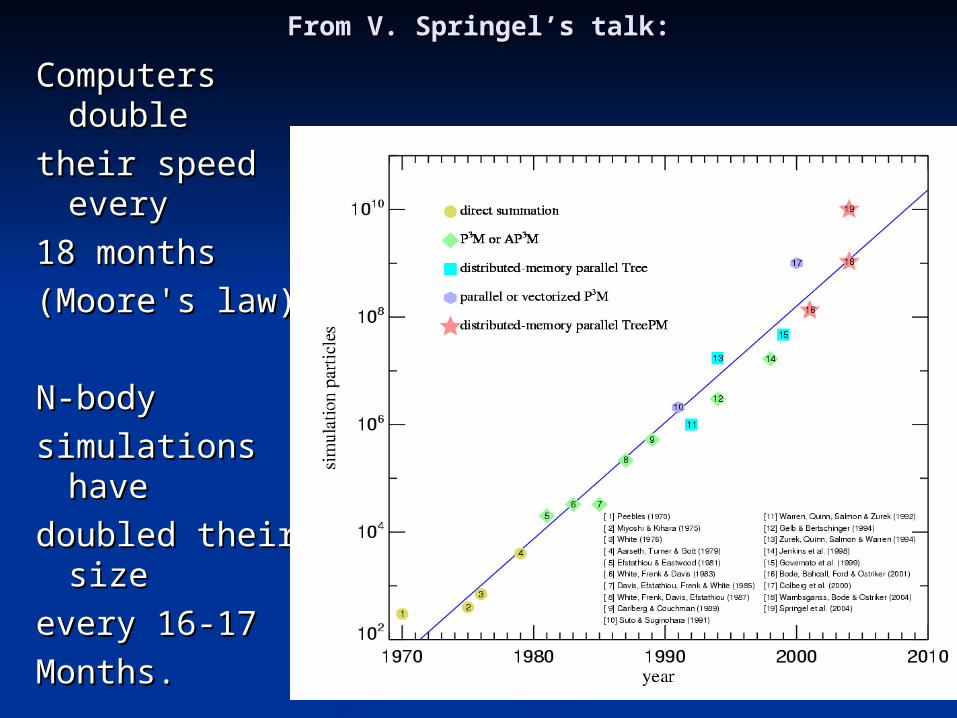
From V. Springel’s talk:From V. Springel’s talk:
Computers Computers doubledouble
their speed their speed everyevery
18 months18 months
(Moore's law)(Moore's law)
N-bodyN-body
simulations havesimulations have
doubled their doubled their sizesize
every 16-17every 16-17
Months.Months.