Embed Size (px)
Citation preview
rs+{ Bc+
UItI6TIG\-
BOOK OF INFORMATION20L7 - 2
qrro * qfrq erf,HOLIDAY DESTINATIONS IN INDIA
-
JT
ln
1500
lr--i
qran + 1r+..r er( HorAYrcaii^rcr6
F
1500 INDIA

CONTENTSHead/Table No.
General Information
1 India at a Glance
2 Postal Network at a Glance
3 Net State Domestic Product and Per Capita State Domestic Product
4 Poverty Line and Population Below Poverty Line
Mail Traffic
5 Mail Traffic at a Glance
6 Article-wise Mail Traffic
7 Article-wise Growth Rate in Mail Traffic
8 Article-wise Unregistered Postal Traffic
9 Article-wise Registered Postal Traffic
10 Traffic of Premium Product Services
11 Circle-wise Unregistered Traffic
12 Circle-wise Registered Traffic
13 Circle-wise Speed Posts and Express Parcel Posts
14 Metro Statistics
15 Outward Postal Traffic from India to Foreign Countries
16 Outward Postal Traffic from India to Nepal, Bhutan & Bangladesh
17 Inward Postal Traffic from Foreign Countries to India
18 Airmail (Domestic & Foreign) Traffic
19 International Speed Post Traffic (Outward)
20 Year-wise International Speed Post Traffic (Outward)
Rural Business
21 Number of Accounts maintained by Department Posts under MGNREGS
Financial Management
22 Revenue and Expenditure
23 Freight Charges Paid for conveyance of Mails
24 Review of Revenue Receipts
25 Foregin Exchange Earned on account of Terminal Dues for Letter Mail
26 Review of Circle-wise Revenue Receipts
27 Review of Expenditure
28 Percentage of items of Expenditure to Revenue earned
29 Percentage Break-up of Working Expenses
30 Review of Revenue Receipts of Premium Product Services
31 Philatelic Revenue
32 Inland Money Orders including Telegraphic Money Orders
33 Average Value of Inland Money Orders
34 Indian Postal Orders
35 Average Value of Indian Postal Orders
36 Funds allocated under Plan Scheme in the North-Eastern Region including Assam
and Sikkim during Annual Plan
37 Average Cost and Average Revenue in various Postal Articles
Financial Services
38 Post Offices performing Savings Bank/Savings Certificate Work
39 Agency Services - Savings Bank including Certificates
40 Number of Accounts under Post Office Savings Bank Business
41 Outstanding balance under Post Office Savings Bank Business
42 Number and Amount issued and discharged under Saving Certificates
43 Number of Accounts of Savings Schemes
44 Outstanding balance of Savings Schemes
45 Remuneration for Savings Bank & Savings Certificates
46 Remuneration on account of Savings Bank
47 Remuneration on account of Savings Certificates
Insurance
48 Postal Life Insurance
49 Rural Postal Life Insurance
50 Claims Settled in Postal Life Insurance and Rural Postal Life Insurance
51 Rate of Bonus on Postal Life Insurance and Rural Postal Life Insurance
Postal Network and Technology
52 Distribution of Post Offices
53 Distribution of Rural and Urban Post Offices
54 Year-wise Distribution of Rural and Urban Post Offices
55 Classified Function-wise distribution of Post Offices
56 Average Population and Average Area served by a Post Office in Country
57 Average Population served by a Post Office in Rural Area
58 Average Population served by a Post Office in Urban Area
59 Panchayat Sanchar Sewa Kendras
60 Mukhya Dak Ghar
61 Franchise Outlets, Intra Circle Hubs, Sorting Hubs and Automated Mail Processing Centres
62 Letter Boxes, Post Boxes and Post Bags
63 Postal and RMS Functional Units

64 Administrative Offices & Functional Units
65 Postal Network of North-Eastern Region at a glance
66 Computerisation of the Post Offices
Human Resources
67 Actual Staff Strength (Gazetted, Non-Gazetted and women employees)
68 Actual Staff Strength (Gazetted)
69 Actual Non-Gazetted Staff Strength of Important Categories
70 Non-Gazetted Actual Staff Statistics (Group-wise & Circle-Wise)
71 Distribution of manpower in different categories of Post Offices
72 Gramin Dak Sewaks
73 Year-wise Actual Staff Strength
74 Human Resources trained under Plan Scheme
75 Human Resources trained in Postal Academy and Postal Training Centres
Postal Complaints, Losses and Frauds
76 Number of Postal Complaints
77 Number of Complaints received, settled and pending
78 Article-wise number of Complaints received, settled and pending
79 Loss and Fraud Cases Registered
Miscellaneous
80 Philately
81 Departmental and Rental Buildings
82 Number of Dispensaries, Card Holders and Beneficiaries
83 Postal Rates (Inland)
Time Series Data
84 Number of Saving Bank Accounts
85 Mail Traffic
86 Number of Money Orders
87 Number of Post Offices
88 Revenue and Expenditure
89 Number of Policies under Postal Life Insurance
90 Number of Policies under Rural Postal Life Insurance
Appendix
Appendix-I Detail of Intra Circle Hubs
Appendix-II Detail of Sorting Hubs
Appendix-III Countries covered under International Speed Post Service
Appendix-IV Details of Postal Dispensaries
.

GENERAL INFORMATION

1 Total Area of the Country (in '000 Sq. Km.)* 3,287.26
2 Total Population of the Country in 2018 (in Lakh) @ 13,639.35
3 Total Rural Population of the Country in 2018 (in Lakhs) @ 9,029.53
4 Total Urban Population of the Country in 2018 (in Lakhs) @ 4,609.82
5 Total Population of the Country in 2011 (in Lakh) $ 12,101.93
6 Total Rural Population of the Country in 2011 (in Lakhs) $ 8,330.88
7 Total Urban Population of the Country in 2011 (in Lakhs) $ 3,771.05
8 Percentage of Rural Population in 2011 $ 68.84
9 Total Population of Males in 2011 (in Lakh) $ 6,237.24
10 Total Population of Females in 2011 (in Lakh) $ 5,864.69
11 Number of Females per 1,000 Males in 2011 $ 940
12 Estimated Birth Rate of the country in 2016 (per thousand population) # 20.40
13 Estimated Birth Rate in Rural Areas in 2016 (per thousand population) # 22.10
14 Estimated Birth Rate in Urban Areas in 2016 (per thousand population) # 17.00
15 Estimated Death Rate of the country in 2016 (per thousand population) # 6.40
16 Estimated Death Rate in Rural Areas in 2016 (per thousand population) # 6.90
17 Estimated Death Rate in Urban Areas in 2016 (per thousand population) # 5.40
18 Number of Towns in 2011 $ 7,935
19 Number of Villages in 2011 $ 6,40,867
20 Total number of Districts in the Country in 2011 $ 640
21 Total number of Sub-Districts in the Country in 2011 $ 5,924
22 Average Annual Exponential Growth rate of population (2001-2011) $ 1.64
23 Number of persons per sq. km. in 2011 $ 382
Total Literacy Rate (Person) in 2011 $ 74.04
Literacy Rate of Male in 2011 $ 82.14
Literacy Rate of Female in 2011 $ 65.46
$ As per Census of India 2011.
# As per National Health Profile 2018.
* As per Census of India 2011.
TABLE 1
INDIA AT A GLANCE
24
@ Estimated Pupulation.

1 Total number of Postal Circles 23
2 Total number of Postal Regions 54
3 Total number of Postal Divisions 446
4 Total number of Circle Stamp Depots 17
5 Total number of Postal Store Depots 46
6 Total number of RMS Divisions 69
7 Total number of Postal Training Centres 6
8 Total number of RMS Sorting Offices 385
9 Total number of RMS Record Offices 351
10 Total number of Post Offices in Country 1,55,531
11 Total number of Post Offices in Rural Areas 1,39,882
12 Total number of Post Offices in Urban Areas 15,649
13 Total number of General Post Offices 24
14 Total number of Head Post Offices 811
15 Total number of Sub Post Offices 24,746
16 Total number of Branch Post Offices 1,29,974
17 Total number of Delivery Post Offices 1,46,968
18 Total number of Night Post Offices 128
19 Total number of Mukhya Dak Ghars 512
20 Total number of Panchayat Sanchar Sewa Kendras 1,912
21 Total number of Franchise Outlets 2,131
22 Total number of Intra Circle Hubs 152
23 Total number of National Sorting Hubs 90
24 Total number of Automated Mail Processing Centres 2
25Total number of Countries covered under International Speed Post (Merchandise &
documents - both)76
26 Total number of Countries covered under International Speed Post (documents only) 24
27 Average number of Population served by a Post Office in Country $ 8,770
28 Average number of Population served by a Post Office in Rural Area $ 6,455
29 Average number of Population served by a Post Office in Urban Area $ 29,458
30 Average Area served by a Post Office (in Sq. Km.) 21.14
TABLE 2
POSTAL NETWORK AT A GLANCE
$ Estimated.
(As on 31.03.2018)

2011-12 2012-13 2013-14 2014-15 2015-16 2016-17 2017-18 2011-12 2012-13 2013-14 2014-15 2015-16 2016-17 2017-18
1. Andhra Pradesh # 339996 370196 413164 470934 544827 631249 734659 69000 74687 82870 93903 108002 124401 143935
2. Assam Circle 129354 142039 160442 172849 201309 225660 NA 41142 44599 49734 52895 60817 67303 NA
3. Bihar Circle 228497 261327 292143 315732 337987 391014 448584 21750 24487 26948 28671 30213 34409 38860
4. Chhattisgarh Circle 142273 159431 186050 197314 202299 228514 254925 55177 60849 69880 72936 73590 81808 89813
5. Delhi Circle 314650 357400 404841 448487 500524 557740 625795 185361 206590 229619 249589 273301 298832 328985
a. Gujarat 532809 634572 707456 804764 893997 1018190 NA 87481 102826 113139 127017 139254 156527 NA
b. D & N Haveli - - - - - - - - - - - - - -
c. Daman & Diu - - - - - - - - - - - - - -
7. Haryana Circle 271152 314353 363590 395890 438140 494090 NA 106085 121269 138300 148485 162034 180174 NA
8. Himachal Pradesh Circle 60536 69432 80129 87345 96851 107585 117191 87721 99730 114095 123299 135512 149028 160712
9. Jammu & Kashmir Circle 67274 72996 79692 81040 98427 106661 NA 53173 56828 61108 61213 73229 78163 NA
10. Jharkhand Circle 137383 160304 172030 200357 187479 216000 234052 41254 47360 50006 57301 52754 59799 63754
11. Karnataka Circle 554952 635924 746569 825782 950880 1050874 1205426 90263 102319 118829 130024 148110 161922 183737
a. Kerala 328021 371384 417265 460614 505496 561080 NA 97912 110314 123388 135537 148011 163475 NA
b. Lakshdweep - - - - - - - - - - -
13. Madhya Pradesh Circle 282371 333937 393115 429027 486155 589168 663000 38551 44931 52129 56069 62616 74787 82941
a. Maharashtra 1126595 1282180 1448768 1554800 1751276 1986806 2193973 99564 111980 125039 132611 147610 165491 180596
b. Goa 38009 34567 32043 43233 50354 56933 NA 259444 234354 215776 289185 334576 375550 NA
a. Arunachal Pradesh 10229 11617 13377 16495 17011 18433 21343 73068 81353 91809 110929 112212 119150 135165
b. Manipur 11501 12188 14440 16275 17493 18663 20635 39762 41230 47798 52717 55447 57888 62640
c. Meghalaya 18028 19653 20415 20697 22516 24346 26954 60013 64036 65118 64638 68836 72870 78976
d. Mizoram 6404 7375 8989 12067 13595 15568 15668 57654 65013 77581 103049 114055 128241 129057
e. Nagaland 10554 12318 14545 16104 17128 18926 NA 53010 61225 71510 78367 82466 90168 NA
f. Tripura 17419 19631 23329 26643 32476 35840 41755 47079 52434 61570 69474 83680 91266 105044
16. Orissa Circle 204226 233312 260977 274941 288619 329674 363335 48370 54703 60574 63173 65650 74234 80991
1. Punjab 239227 267116 297908 316745 350011 385810 427828 85577 94318 103831 108970 118858 129321 141552
2. Chandigarh 16930 19283 21825 22992 25122 27181 NA 159116 178549 199135 206760 222710 237599 NA
18. Rajasthan Circle 395331 446382 494236 551517 610934 665949 738849 57192 63658 69480 76429 83456 89678 98078
a. Tamil Nadu Circle 674478 768295 858870 957350 1057084 1139790 1279932 92984 104943 116236 128372 140441 150036 166934
b. Puducherry 15160 16984 19778 20143 24303 26714 29383 119649 130548 148147 146921 172727 184869 197999
20. Telangana 325139 364030 408282 456280 522994 600313 686034 91121 101007 112162 124104 140840 160062 181102
21. Uttar Pradesh Circle 645132 732995 833825 891798 1008179 1108017 1224672 32002 35812 40124 42267 47062 50942 55456
22. Uttarakhand Circle 101960 117041 131814 143789 158277 171342 191480 100305 113610 126247 135881 147592 157643 173820
a. West Bengal Circle 473205 539618 617470 651492 725992 802089 931313 51543 58195 65932 68876 75992 83126 95562
b. Sikkim 9742 10817 12203 13556 15743 17506 19444 158667 174183 194624 214148 245987 270572 297765
c. A & N Islands 3404 3793 4288 4915 5336 5897 NA 88177 96027 106401 119291 126445 136824 NA
All India 486351 554228 633961 669963 747071 825492 950757 298387 328405 366957 402315 448424 490522 393327
17. Punjab Circle
TABLE 3
NET STATE DOMESTIC PRODUCT AND PER CAPITA STATE DOMESTIC PRODUCT AT CURRENT PRICES (2011-12 SERIES) AS ON 28.02.2019
6. Gujarat Circle
12. Kerala Circle
14. Maharashtra Circle
15. North-Eastern Circle
Circle/State/
Union Territory
Net State Domestic Product (in crore) Per capita Net State Domestic Product (in Rs.)
19. Tamil Nadu Circle
23. West Bengal Circle
Note: 1. Owing to differences in methodology of compilation, data for different States / Union Territories are not strictly comparable.
2.# Estimates relate to bifurcated Andhra Pradesh; estimates for Telengana are given at serial no. 20
Source: MOSPI

No. of
Persons (in
Lakh)
% age of
Persons
No. of
Persons (in
Lakh)
% age of
Persons
No. of
Persons (in
Lakh)
% age of
Persons
1. Andhra Pradesh Circle 860 1009 61.80 10.96 16.98 5.81 78.78 9.20
2. Assam Circle 828 1008 92.06 33.89 9.21 20.49 101.27 31.98
3. Bihar Circle 778 923 320.40 34.06 37.75 31.23 358.15 33.74
4. Chhattisgarh Circle 738 849 88.90 44.61 15.22 24.75 104.11 39.93
5. Delhi Circle 1145 1134 0.50 12.92 16.46 9.84 16.96 9.91
6. Gujarat Circle - - 76.50 21.75 27.42 10.19 103.92 16.73
a. Gujarat 932 1152 75.35 21.54 26.88 10.14 102.23 16.63
b. D & N Haveli - - 1.15 62.59 0.28 15.38 1.43 39.31
c. Daman & Diu - - 0.00 0.00 0.26 12.62 0.26 9.86
7. Haryana Circle 1015 1169 19.42 11.64 9.41 10.28 28.83 11.16
8. Himachal Pradesh Circle 913 1064 5.29 8.48 0.30 4.33 5.59 8.06
9. Jammu & Kashmir Circle 891 988 10.73 11.54 2.53 7.20 13.27 10.35
10. Jharkhand Circle 748 974 104.09 40.84 20.24 24.83 124.33 36.96
11. Karnataka Circle 902 1089 92.80 24.53 36.96 15.25 129.76 20.91
12. Kerala Circle - - 15.48 9.14 8.48 4.96 23.97 7.04
a. Kerala 1018 987 15.48 9.14 8.46 4.97 23.95 7.05
b. Lakshadweep - - 0.00 0.00 0.02 3.44 0.02 2.77
13. Madhya Pradesh Circle 771 897 190.95 35.74 43.10 21.00 234.06 31.65
14. Maharashtra Circle - - 150.93 24.07 47.74 9.03 198.67 17.19
a. Maharashtra 967 1126 150.56 24.22 47.36 9.12 197.92 17.35
b. Goa 1090 1134 0.37 6.81 0.38 4.09 0.75 5.09
15. North East Circle - - 23.90 23.71 6.13 15.35 30.01 21.34
a. Arunachal Pradesh 930 1060 4.25 38.93 0.66 20.33 4.91 34.67
b. Manipur 1118 1170 7.45 38.80 2.78 32.59 10.22 36.89
c. Meghalaya 888 1154 3.04 12.53 0.57 9.26 3.61 11.87
d. Mizoram 1066 1155 1.91 35.43 0.37 6.36 2.27 20.40
e. Nagaland 1270 1302 2.76 19.93 1.00 16.48 3.76 18.88
f. Tripura 798 920 4.49 16.53 0.75 7.42 5.24 14.05
16. Orissa Circle 695 861 126.14 35.69 12.39 17.29 138.53 32.59
17. Punjab Circle - - 13.35 7.65 12.16 10.41 25.53 8.76
a. Punjab 1054 1155 13.35 7.66 9.82 9.24 23.18 8.26
b. Chandigarh 738 849 0.004 1.64 2.34 22.31 2.35 21.81
18. Rajasthan Circle 905 1002 84.19 16.05 18.73 10.69 102.92 14.71
19. Tamil Nadu Circle - - 59.92 15.84 23.95 6.53 83.87 11.25
a. Tamil Nadu 880 937 59.23 15.83 23.40 6.54 82.63 11.28
b. Puducherry 1301 1309 0.69 17.06 0.55 6.30 1.24 9.69
20. Uttar Pradesh Circle 768 941 479.35 30.40 118.84 26.06 598.19 29.43
21. Uttarakhand Circle 880 1082 8.25 11.62 3.35 10.48 11.60 11.26
22. West Bengal Circle - - 141.63 22.34 43.89 14.60 185.53 19.82
a. West Bengal 783 981 141.14 22.52 43.83 14.66 184.98 19.98
b. Sikkim 930 1226 0.45 9.85 0.06 3.66 0.51 8.19
c. A & N Islands - - 0.04 1.57 0.00 0.00 0.04 1.00
All India 816 1000 2166.58 25.70 531.25 13.70 2697.83 21.92
Source: NITI Ayog
Notes: (1) The statewise poverty line and number and percentage of Population below povert line in this table are based on
Tendulkar Methodology released by Press Note on Poverty Estimates, 2011-12 in July, 2014 by the NITI Ayog (then Planning
Commission). (2) Population as on 1st March, 2012 has been used for estimating number of persons below poverty line. (3)
Poverty line of Tamilnadu has been used for A & N Islands. (4) Urban Poverty line of Punjab has been used for both rural and urban
areas of Chandigarh. (5) Poverty line of Maharashtrais has been used for Dadra & Nagar Haveli. (6) Poverty line of Goa has been
used for Daman & Diu. (7) Poverty line of Kerala has been used for Lakshadweep.
Remark: The total population of a State or Union Territory was estimated by using the factors 'No. of population below poverty line'
and 'percentage of population below poverty line' of that State or Union Territory, then percentage below poverty line of a Circle
was calculated after aggregating the 'populations below poverty lines' and 'total populations' of the States and Union Territories
falling under jurisdiction of the concerned Circle.
TABLE 4
POVERTY LINE AND POPULATION BELOW POVERTY LINE IN 2011-12
$ Poverty Line has been computed as per Tendulkar Method on Mixed Reference Period (MRP).
Poverty Line
$
(Monthly Per
Capita)
(in `)UrbanRural
Circle/State/
UnionTerritory
Rural Urban Total
Population Below Poverty Line

MAILTRAFFIC

A. Unregistered Mail *
(1) Other than Postal Service 625.00 605.54 607.02 570.08 535.30 544.66 534.46 555.14 546.80 541.15
(2) Postal Service 9.27 9.11 8.74 7.79 6.33 6.13 6.25 6.35 5.86 26.54
Total Unregistered Mail (A) 634.27 614.65 615.76 577.87 541.63 550.79 540.71 561.49 552.66 567.69
B. Registered Mail
(1) Other than Postal Service 17.79 17.47 15.30 15.85 15.81 18.01 18.29 17.76 16.33 17.26
(2) Postal Service 2.03 2.11 2.49 3.26 2.12 2.07 2.19 2.07 2.01 2.06
Total Registered Mail (B) 19.82 19.58 17.79 19.11 17.93 20.08 20.48 19.83 18.34 19.32
(1) Speed Post 21.14 24.08 27.45 39.20 44.99 36.99 39.88 41.43 46.31 46.38
(2) Expreess Parcel Post 0.72 0.67 0.82 1.00 0.98 0.96 1.38 1.29 1.56 1.21
Total Premium Products Mail (C) 21.86 24.75 28.27 40.20 45.97 37.95 41.26 42.72 47.87 47.59
Total Mail Traffic (A+B+C) 675.95 658.98 661.82 637.18 605.53 608.82 602.45 624.04 618.87 634.60
TABLE 5
MAIL TRAFFIC AT A GLANCE
* Unregistered mail traffic has been estimated on the basis of two half yearly enumeration of Postal Articles conducted in the month of
August and February.
# Mail traffic of other premium products are included in unregistered mail traffic as other premium products (excluding speed post and
express parcel post) are already enumerated during the half yearly enumerations conducted for estimation of unregistered Postal Articles.
Note: The total figures shown in Table 5 and Table 6 may differ due to rounding off.
2010-11 2016-17 2017-18
C. Premium Products Mail #
2013-142009-10
Source: Postal Circles, BD & MD
(in Crore)
Item 2011-12 2015-162012-13 2014-152008-09

Article 2008-09 2009-10 2010-11 2011-12 2012-13 2013-14 2014-15 2015-16 2016-17 2017-18
1. Postcard * 154.54 156.41 146.85 134.56 114.54 113.67 194.58 104.71 99.89 106.23
Speed Post 21.14 24.08 27.45 39.20 44.99 36.99 39.87 41.43 46.31 46.38
Registered Letter 15.21 15.11 15.60 16.87 15.6629 17.5015 17.5822 16.91 15.46 16.67
Insured Letter 0.73 0.74 0.09 0.09 0.08 0.08 0.08 0.07 0.07 0.08
Value Payable Letter 0.29 0.32 0.30 0.28 0.35 0.48 0.43 0.52 0.21 0.22
Unregistered Letter # 336.61 317.23 316.44 299.32 288.84 296.17 206.92 311.47 310.81 312.61
Total Letter Mail 373.98 357.48 359.87 355.77 349.93 351.22 264.89 370.40 372.86 375.96
3. Registered Newspaper 51.00 48.69 50.76 50.68 47.83 49.01 49.14 50.25 48.28 48.00
Express Parcel Post 0.72 0.67 0.82 1.00 0.98 0.96 1.38 1.29 1.56 1.21
Registered Parcel 2.29 2.32 1.01 1.02 0.92 0.98 1.08 1.15 1.39 1.29
Insured Parcel 0.26 0.26 0.10 0.10 0.09 0.09 0.10 0.10 0.11 0.10
Value Payable Parcel 0.22 0.22 0.14 0.20 0.23 0.22 0.47 0.30 0.37 0.35
Unregistered Parcel 7.49 8.27 8.34 7.49 7.12 7.24 7.41 8.33 6.82 13.13
Total Parcel Mail 10.98 11.73 10.41 9.81 9.36 9.49 10.44 11.16 10.25 16.08
Registered Packet 0.59 0.42 0.34 0.36 0.39 0.47 0.51 0.56 0.51 0.41
Value Payable Packet 0.24 0.20 0.21 0.18 0.20 0.26 0.23 0.22 0.22 0.21
Unregistered Packet 84.63 84.05 93.38 85.82 83.29 84.70 82.67 86.75 86.86 87.72
Total Packet Mail 85.46 84.67 93.93 86.37 83.88 85.43 83.41 87.53 87.59 88.34
Grand Total (1 to 5) 675.96 658.98 661.82 637.18 605.54 608.83 602.45 624.04 618.87 634.61
5. Packet
Source: Postal Circles, BD & MD
* Include acknowledgements.# Also include letter cards.
Note: The total figures shown in Table 5 and Table 6 may differ due to rounding off.Note : The total figures show in Table 5 and Table 6 may differ due to rounding off.
4. Parcel
TABLE 6
ARTICLE-WISE MAIL TRAFFIC
(Registered, Unregistered and Premium Products)
(number in Crores)
2. Letters

(in Percentage)
Article 2008-09 2009-10 2010-11 2011-12 2012-13 2013-14 2014-15 2015-16 2016-17 2017-18
1. Postcard * 3.42 1.21 -6.12 -8.36 -14.88 -0.76 71.18 -46.19 -4.60 6.35
Speed Post 19.27 13.91 13.99 42.77 14.81 -17.80 7.81 3.90 11.78 0.15
Registered Letter -2.11 -0.64 3.20 8.20 -7.18 11.74 0.46 -3.85 -8.55 7.83
Insured Letter -0.99 1.26 -87.79 4.56 -15.62 -2.27 2.19 -5.80 -6.29 14.29
Value Payable Letter -0.34 11.86 -8.28 -4.75 24.94 36.24 -10.39 20.73 -59.66 4.76
Unregistered Letter # 1.31 -5.76 -0.25 -5.41 -3.50 2.54 -30.13 50.53 -0.21 0.58
Total Letter Mail 2.02 -4.41 0.67 -1.14 -1.64 0.37 -24.58 39.83 0.66 0.83
3. Registered Newspaper 2.22 -4.52 4.24 -0.17 -5.61 2.47 0.25 2.26 -3.91 -0.58
Express Parcel Post 12.39 -7.29 22.73 22.36 -2.04 -2.32 43.69 -6.66 20.93 -22.44
Registered Parcel 1.14 1.25 -56.52 1.01 -9.44 5.61 10.87 6.00 21.29 -7.19
Insured Parcel 0.39 -1.04 -61.61 4.38 -9.37 -0.22 3.88 5.61 8.16 -9.09
Value Payable Parcel -3.14 -0.64 -35.22 40.04 16.50 -2.91 112.30 -36.84 23.46 -5.41
Unregistered Parcel -3.73 10.38 0.90 -10.21 -4.88 1.57 2.36 12.41 -18.09 92.52
Total Parcel Mail -1.71 6.83 -11.26 -5.75 -4.68 1.44 10.02 6.92 -8.18 56.88
Registered Packet 45.89 -29.58 -17.36 4.29 7.34 22.42 7.85 9.46 -8.55 -19.61
Value Payable Packet -10.11 -17.28 7.51 -12.83 7.95 28.87 -11.16 -2.15 -1.57 -4.55
Unregistered Packet 6.11 -0.68 11.09 -8.09 -2.95 1.69 -2.40 4.93 0.13 0.99
Total Packet Mail 6.25 -0.93 10.94 -8.05 -2.88 1.85 -2.37 4.94 0.07 0.86
Grand Total (1 to 5) 2.81 -2.51 0.43 -3.72 -4.97 0.54 -1.05 3.58 -0.83 2.54
* Include acknowledgements.
# Also Include letter cards.
Source: Postal Circles, BD & MD
TABLE 7
ARTICLE-WISE GROWTH RATE IN MAIL TRAFFIC
(Registered, Unregistered and Premium Products)
2. Letter
4. Parcel
5. Packets

2014-15
over
2013-14
2015-16
over
2014-15
2016-17
over
2015-16
2017-18
over
2016-17
Letter 203.78 201.92 210.92 210.73 199.51 -0.91 4.46 -0.09 -5.32
Postcard 54.19 50.98 50.77 48.65 46.3 -5.92 -0.41 -4.18 -4.83
Printed Postcard 22.88 22.88 22.28 21.59 20.55 0.00 -2.62 -3.10 -4.82
Meghdoot Postcard 5.54 5.10 4.42 3.67 3.15 -7.94 -13.33 -16.97 -14.17
Competition Postcard 1.42 1.16 1.48 1.02 0.89 -18.31 27.59 -31.08 -12.75
Letter Card 87.45 89.95 95.44 95.28 89.65 2.86 6.10 -0.17 -5.91
Registered Newspaper
(Single+Bundle)49.01 49.14 50.24 48.28 48.00 0.27 2.24 -3.90 -0.58
Unregistered Packet (Printed
Book+ Periodical +Book Pattren
& S. Pack.)
84.33 82.29 86.32 86.52 86.68 -2.42 4.90 0.23 0.18
Unregistered Parcel 6.76 6.88 7.89 6.4 12.04 1.78 14.68 -18.88 88.13
Acknowledgement 29.30 24.16 25.38 24.66 34.38 -17.54 5.05 -2.84 39.42
Total (A) 544.66 534.46 555.14 546.80 541.15 -1.87 3.87 -1.50 -1.03
Letter 4.94 5.00 5.11 4.79 23.45 1.21 2.20 -6.26 389.56
Postcard/Acknowledgement 0.35 0.34 0.38 0.31 0.96 -2.86 11.76 -18.42 209.68
Packet 0.37 0.38 0.42 0.34 1.04 2.70 10.53 -19.05 205.88
Parcel 0.47 0.53 0.44 0.42 1.09 12.77 -16.98 -4.55 159.52
Total (B) 6.13 6.25 6.35 5.86 26.54 1.96 1.60 -7.72 352.90
Grand Total (A + B) 550.79 540.71 561.49 552.66 567.69 -1.83 3.84 -1.57 2.72
Remark: The total figures shown in Table 8 and Table 11 may differ due to rounding off.
(in Crore)
TABLE 8
ARTICLE-WISE UNREGISTERED POSTAL TRAFFIC
Note: Unregistered mail traffic has been estimated on the basis of two half yearly enumerations of Postal Articles conducted in the
month of August and February.
(B) Postal Service
2015-162013-14 2014-15 2016-17 2017-18Article
%age Decrease/increase
(A) Other than Postal Service

2014-15
over
2013-14
2015-16
over
2014-15
2016-17
over
2015-16
2017-18
over
2016-17
i. Insured Letter 543 569 534 499 549 4.79 -6.15 -6.55 10.02
ii. Insured Parcel 814 838 893 940 815 2.95 6.56 5.26 -13.30
iii. V. P. Letter 4812 4312 5206 2099 2181 -10.39 20.73 -59.68 3.91
iv. V. P. Parcel 2235 4745 2997 3709 3502 112.30 -36.84 23.76 -5.58
v. Registered Letter 155827 155539 150191 136953 148757 -0.18 -3.44 -8.81 8.62
vi. Registered Parcel 8557 9529 10051 11957 10626 11.36 5.48 18.96 -11.13
vii. Regd. Book Pattern & Sample Packet 886 853 978 871 965 -3.72 14.65 -10.94 10.79
viii. Regd. Packet containing Printed Books 1670 1523 1334 1662 1547 -8.80 -12.41 24.59 -6.92
ix. Regd. Packets containing Periodical 2159 2671 3163 2459 1591 23.71 18.42 -22.26 -35.30
x. V.P. Packet containing Book Pattern & Sample
Packets371
488 468 484 47131.54 -4.10 3.42 -2.69
xi. V.P. Packet containing Printed Books 1729 1291 1303 1229 1218 -25.33 0.93 -5.68 -0.90
xii. V.P. Packet containing Periodicals 471 505 464 467 428 7.22 -8.12 0.65 -8.35
Total (A) 180074 182863 177582 163329 172650 1.55 -2.89 -8.03 5.71
i. Insured Letter 233 224 213 205 218 -3.86 -4.91 -3.76 6.34
ii. Insured Parcel 113 125 124 135 158 10.62 -0.80 8.87 17.04
iii. Registered Letter 19188 20283 18863 17707 17933 5.71 -7.00 -6.13 1.28
iv. Registered Parcel 1194 1282 1409 1925 2283 7.37 9.91 36.62 18.60
v. Registered Book Pattern & Sample Packet 3 32 94 78 24 966.67 193.75 -17.02 -69.23
vi. Registered Packet containing Printed Books &
Periodicals6 16 8 11 23 166.67 -50.00 37.50 109.09
Total (B) 20737 21962 20711 20061 20639 5.91 -5.70 -3.14 2.88
Total Registered Mail (A + B) 200811 204825 198293 183390 193289 2.00 -3.19 -7.52 5.40
(in Thousand)
ARTICLE-WISE REGISTERED POSTAL TRAFFIC
TABLE 9
Source: Postal Circles
Analysis: The total traffic of registered articles during the year 2017-18 is 193289 thousand, which shows an increase by 5.40% over previous year.
(B) Postal Service
2013-14 2014-15 2015-16 2016-17 2017-18Article
%age Decrease/increase
(A) Other than Postal Service

2014-15
over
2013-14
2015-16
over
2014-15
2016-17
over 2015-
16
2017-18
over
2016-17
Speed Post 3698.61 3987.00 4143.00 4630.58 4638.25 7.80 3.91 11.77 0.17
Express Parcel Post 96.18 138.00 129.00 155.78 120.51 43.48 -6.52 20.76 -22.64
Business Post 18692.33 15922.00 14902.27 12986.89 13841.73 -14.82 -6.40 -12.85 6.58
Retail Post n.a. n.a. n.a. n.a. n.a. n.a. n.a. n.a. n.a.
Bill Mail 4882.61 3314.00 3013.00 2969.08 2084.53 -32.13 -9.08 -1.46 -29.79
e-Bill Post 218.00 186.00 201.00 179.05 152.20 -14.68 8.06 -10.92 -15.00
Direct Post n.a. n.a. n.a. n.a. n.a. n.a. n.a. n.a. n.a.
e Post 63.35 64.00 41.00 55.40 53.41 1.03 -35.94 35.12 -3.59
Logistics Post 1.26 1.00 2.00 0.93 5.02 -20.63 100.00 -53.50 439.78
Other n.a. n.a. n.a. n.a. n.a. n.a. n.a. n.a. n.a.
TOTAL 27652.34 23612.00 22431.27 20977.71 20895.65 -14.61 -5.00 -6.48 -0.39
n.a.: Not Available.
(in Lakh)
Source: BD & M Directorate
2013-14 2015-16
TABLE 10
TRAFFIC OF PREMIUM PRODUCT SERVICES
Note: The revenue figures of Business Product Services are available in Table 30.
Service 2014-15 2016-17 2017-18
%age Decrease/increase

Rural Urban Rural Urban Rural Urban
Andhra Pradesh 163952 304377 59453 126788 223405 431165 654570
Assam 23031 53196 1113 1470 24144 54666 78810
Bihar 27087 26521 709 345 27796 26866 54662
Chhatisgarh 18405 43087 321 460 18726 43547 62273
Delhi 4660 132900 5 137 4665 133037 137702
Gujarat 183061 412821 1764 2436 184825 415257 600082
Haryana 36705 62684 421 576 37126 63260 100386
Himachal Pradesh 20776 27020 236 229 21012 27249 48261
Jammu & Kashmir 15567 28478 346 474 15913 28952 44865
Jharkhand 13344 24049 97 358 13441 24407 37848
Karnataka 125760 316871 1102 1737 126862 318608 445470
Kerala 243921 179791 995 771 244916 180562 425478
Madhya Pradesh 53537 157387 628 1308 54165 158695 212860
Maharashtra 165140 771501 1601 2577 166741 774078 940819
North Eastern 22659 29615 694 643 23353 30258 53611
Orissa 33891 37614 819 698 34710 38312 73022
Punjab 53733 104679 897 1983 54630 106662 161292
Rajasthan 79334 138002 1563 1838 80897 139840 220737
Tamil Nadu 184415 363932 4788 26153 189203 390085 579288
TELANGANA 70995 152913 1056 1366 72051 154279 226330
Uttar Pradesh 139308 180397 3264 5477 142572 185874 328446
Uttrakhand 11563 30148 271 441 11834 30589 42423
West Bengal 42306 100445 2234 2729 44540 103174 147714
Total 1733150 3678428 84377 180994 1817527 3859422 5676949
Analysis: Out of total inland unregistered mail, 32.02% mails were delivered in rural areas, whereas, 67.98% mails
were delivered in urban areas. Only 4.67% of the total mails are delivered related to Postal Service.
CIRCLE-WISE UNREGISTERED TRAFFIC 2017-18
TABLE 11
Note: Unregistered mail traffic has been estimated on the basis of two half yearly enumerations of Postal Articles
conducted in the month of August and February.
Grand Total Circle
Other than Postal
ServicePostal Service Total
(in Thousand)

Circle Other than Postal Service Postal Service Total
Andhra Pradesh 6367 767 7134
Assam 4224 576 4800
Bihar 3940 791 4731
Chhatisgarh 1337 248 1585
Delhi 11673 261 11934
Gujarat 8496 1303 9799
Haryana 3513 357 3870
Himachal Pradesh 1998 170 2168
Jammu & Kashmir 651 147 798
Jharkhand 2992 294 3286
Karnataka 11354 1004 12358
Kerala 10761 640 11401
Madhya Pradesh 4970 896 5866
Maharashtra 19355 875 20230
North Eastern 1690 159 1849
Orissa 4595 701 5296
Punjab 5743 399 6142
Rajasthan 8792 1105 9897
Tamil Nadu 19408 1746 21154
Telangana 5654 484 6138
Uttar Pradesh 16375 2133 18508
Uttarakhand 2507 202 2709
West Bengal 16255 5381 21636
Total 172650 20639 193289
TABLE 12
CIRCLE -WISE REGISTERED TRAFFIC 2017-18
(in Thousands)
Source: Postal Circles
Analysis: Out of total inland registered mail during the year 2017-18, 10.68% mails related to
Postal Service.

Circle Speed Post Express Parcel Post TotalAndhra Pradesh 5237 157 5394
Assam 2412 0 2412
Bihar 4109 96 4205
Chhatisgarh 2465 28 2493
Delhi 58014 4351 62365
Gujarat 13849 285 14134
Haryana 11323 543 11866
Himachal Pradesh 1333 54 1387
Jammu & Kashmir 1257 39 1296
Jharkhand 3140 30 3170
Karnataka 60668 591 61259
Kerala 10173 1598 11771
Madhya Pradesh 9628 245 9873
Maharashtra 129144 465 129609
North Eastern 1173 1 1174
Orissa 6845 25 6870
Punjab 5987 58 6045
Rajasthan 7169 330 7499
Tamil Nadu 39708 568 40276
Telangana 9636 1258 10894
Uttar Pradesh 48448 497 48945
Uttarakhand 2296 150 2446
West Bengal 29175 683 29858
APS 638 0 638
Total 463827 12052 475879
TABLE 13
TRAFFIC OF SPEED POST AND EXPRESS PARCEL POST
(in Thousand)
Source: BD & M Directorate
Analysis: Out of total inland mail of speed post and Express Parcel Post during the year 2017-
18, speed post had a share of more than 97%.

Red Green BlueDelhi 163.15 1411391 1094 39 0 0 161
Mumbai 124.42 496519 1318 0 0 135 88
Kolkata 141.13 8764 965 22 2 0 107
Chennai 86.96 238307 2306 2 2 99 182
Bangalore 84.99 136247 1075 20 0 27 107
Hyderabad 77.49 27000 780 0 0 52 125
Number of
Post Offices
Segregating
Number of
Delivery
Post Offices
AVERAGE METRO MAIL PER DAY HANDLED IN METRO CITIES
Source: D (Mails) Section
TABLE 14
METRO STATISTICS IN 2017-18
City Population #
(in lakhs)
Average number of
Total Metro-Mail
handled per day
Number of Letter Boxes
14.11
4.97
0.09
2.381.36
0.27
0
2
4
6
8
10
12
14
16
Delhi Mumbai Kolkata Chennai Bangalore Hyderabad
2017-18
In L
akh
s

2014-15
over
2013-14
2015-16
over
2014-15
2016-17
over
2015-16
Letter 39751 38409 40650 40570 35660 -3.38 5.83 -0.20
Post Card 3321 3320 3242 3271 2840 -0.03 -2.35 0.89
Aerogramme 2529 2219 1953 1872 883 -12.26 -11.99 -4.15
All other Articles 19230 19203 18638 17900 17719 -0.14 -2.94 -3.96
Total(A) 64831 63151 64483 63613 57102 -2.59 2.11 -1.35
Letter 5058 4817 5226 5280 2586 -4.76 8.49 1.03
Post Card 534 583 517 434 149 9.24 -11.37 -16.05
Aerogramme NA NA NA NA 0 NA NA NA
All other Articles 8154 8291 8386 8173 3369 1.68 1.15 -2.54
Total(B) 13746 13691 14129 13887 6104 -0.40 3.20 -1.71
Letter 256 251 545 541 211 -2 117.34 -0.73
Post Card 0 0 1 0 3 N.A N.A NA
Aerogramme N.A N.A N.A NA 0 N.A N.A NA
All other Articles including Bulk Bag 75 88 84 71 116 17.26 -4.48 -15.48
Total(C) 331 339 630 612 330 2.34 85.98 -2.86
Total(A+B+C) 78908 77181 79242 78112 63536 -2.19 2.67 -1.43
Letter 3386 3688 4028 4627 1622 8.92 9.22 14.87
Post Card 125 79 70 60 51 -36.80 -11.39 -14.29
Aerogramme 303 250 210 157 45 -17.49 -16.00 -25.24
All other Articles 439 407 393 482 895 -7.29 -3.44 22.65
Total(D) 4253 4424 4701 5326 2613 4.02 6.26 13.30
Letter 423 374 271 198 138 -11.58 -27.54 -26.94
Post Card 26 13 19 17 12 -50.00 46.15 -10.53
Aerogramme NA NA NA NA 0 NA NA NA
All other Articles 120 81 113 108 69 -32.50 39.51 -4.42
Total(E) 569 468 403 323 219 -17.75 -13.89 -19.85
Letter 76
Post Card 6
Aerogramme 0
All other Articles including Bulk Bag 24
Total(F) 106
Total(D+E+F) 4822 4892 5104 5649 2938 1.45 4.33 10.68
NA: Not Applicable.
D. Registered Airmail Articles
2013-14
* Due to change in classification of countries, traffic for the year 2017-18 is from India to all countries except Nepal, Bhutan, Bangladesh and
Pakistan and not comparable with the estimated traffic for the previous years.
*Service for Registered SAL-mail Articles started in 2017-18
* 2017-18 is from India to All foreign countries excluding Nepal, Bhutan, Bangladesh and Pakistan
TABLE 15
OUTWARD POSTAL TRAFFIC FROM INDIA TO FOREIGN COUNTRIES
ALL COUNTRIES EXCLUDING NEPAL, BHUTAN & BANGLADESH
Source: Unregistered traffic - Estimated by enumeration; Registered traffic- Postal Circle.
(in Thousand)
B. Unregistered Surfacemail Articles
E. Registered Surfacemail Articles
2016-17 2017-18*
F. Registered SAL - mail Articles*
Article 2014-15 2015-16
%age Decrease/increase
A. Unregistered Airmail Articles
C. Unregistered SAL - mail Articles

2014-15
over
2013-14
2015-16
over 2014-
15
2016-17
over
2015-16
Letter 926 1332 961 933 1249 43.84 -27.85 -2.91
Post Card 68 65 73 65 52 -4.41 12.31 -10.96
Aerogramme 29 26 130 53 70 -11.65 407.40 -59.23
All other Articles 556 928 1466 1536 585 66.91 57.97 4.77
Total(A) 1579 2351 2630 2587 1956 48.87 11.89 -1.63
Letter 1917 1756 1242 816 667 -8.42 -29.25 -34.30
Post Card 169 171 123 102 79 1.46 -28.27 -17.07
Aerogramme NA NA NA NA 0 NA NA NA
All other Articles 1651 912 675 597 452 -44.74 -26.02 -11.56
Total(B) 3737 2839 2040 1515 1198 -24.02 -28.15 -25.74
Letter 0 1 0 0 133 NA NA NA
Post Card 0 0 0 0 13 NA NA NA
Aerogramme NA NA NA NA 0 NA NA NA
All other Articles 0 9 0 0 49 NA NA NA
Total(C) 0 10 0 0 195 NA NA NA
Total(A+B+C) 5316 5200 4670 4102 3349 -2.18 -10.19 -12.16
Letter 250 197 256 208 175 -21.20 29.95 -18.75
Post Card 31 23 30 21 36 -25.81 30.43 -30.00
Aerogramme 60 53 68 51 13 -11.67 28.30 -25.00
All other Articles 208 112 82 72 56 -46.15 -26.79 -12.20
Total(D) 549 385 436 352 280 -29.87 13.25 -19.27
Letter 115 69 68 65 69 -40.00 -1.45 -4.41
Post Card 13 10 9 8 4 -23.08 -10.00 -11.11
Aerogramme NA NA NA 0 NA NA NA
All other Articles 77 54 48 53 10 -29.87 -11.11 10.42
Total(E) 205 133 125 126 83 -35.12 -6.02 0.80
Letter 16
Post Card 2Aerogramme 0Aerogramme 0
All other Articles including Bulk Bag 3
Total(F) 21
Total(D+E+F) 754 518 561 478 384 -31.30 8.30 -14.80
NA: Not Applicable.
Articles 2014-15 2015-16
%age Decrease/increase
Source: Unregistered traffic - Estimated by enumeration; Registered traffic- Postal Circles.
* Due to change in classification of countries, traffic for the year 2017-18 is from India to Nepal, Bhutan, Bangladesh and Pakistan and not
comparable with the estimated traffic for the previous years.
*Service for Registered SAL-mail Articles started in 2017-18
F. Registered SAL - mail Articles
E. Registered Surfacemail Articles
D. Registered Airmail Articles
C. Unregistered SAL - mail Articles
B. Unregistered Surfacemail Articles
A. Unregistered Airmail Articles
TABLE 16
OUTWARD POSTAL TRAFFIC FROM INDIA TO NEPAL, BHUTAN & BANGLADESH
(in Thousand)
2013-14 2016-17 2017-18*

2014-15
over
2013-14
2015-16
over
2014-15
2016-17
over
2017-18
2017-18
over
2016-17
Letter 26847 28253 22021 22375 20665 5.24 -22.06 1.61 -7.64
Post Card 2054 2259 2557 2291 2308 9.98 13.19 -10.40 0.74
Aerogramme 71 69 162 121 65 -2.82 134.78 -25.31 -46.28
All other Articles 10470 10823 12602 15972 16019 3.37 16.44 26.74 0.29
Total(A) 39442 41404 37342 40759 39057 4.97 -9.81 9.15 -4.18
Letter 1029 1053 452 508 313 2.33 -57.08 12.39 -38.39
Post Card 38 39 23 17 10 2.63 -41.03 -26.09 -41.18
Aerogramme NA NA NA NA 0 NA NA NA NA
All other Articles 2422 1664 479 375 428 -31.30 -71.21 -21.71 14.13
Total(B) 3489 2756 954 900 751 -21.01 -65.38 -5.66 -16.56
Letter 2991 2674 2845 3300 3103 -10.60 6.39 15.99 -5.97
Post Card 1 1 1 0 13 0.00 0.00 -100.00
Aerogramme NA NA NA NA 0 NA NA NA NA
All other Articles 1628 1260 1848 3651 2633 -22.60 46.67 97.56 -27.88
Total(C) 4620 3935 4694 6951 5749 -14.83 19.29 48.08 -17.29
Total(A+B+C) 47551 48095 42990 48610 45557 1.14 -10.61 13.07 -6.28
Letter 3500 3648 3965 3888 1785 4.23 8.69 -1.94 -54.09
Post Card 120 103 115 77 65 -14.17 11.65 -33.04 -15.58
Aerogramme 393 309 260 213 78 -21.37 -15.86 -18.08 -63.38
All other Articles 547 530 487 775 2305 -3.11 -8.11 59.14 197.42
Total(D) 4560 4590 4827 4953 4233 0.66 5.16 2.61 -14.54
Letter 656 492 436 358 613 -25.00 -11.38 -17.89 71.23
Post Card 40 51 30 20 16 27.50 -41.18 -33.33 -20.00
Aerogramme NA NA NA NA 19 NA NA NA NA
All other Articles 432 184 146 111 64 -57.41 -20.65 -23.97 -42.34
Total(E) 1128 727 612 489 712 -35.55 -15.82 -20.10 45.60
Post Card 25
Aerogramme 4
Aerogramme 3
All other Articles including Bulk Bag 11
Total(F) 43
Total(D+E+F) 5688 5317 5439 5442 4988 -6.52 2.29 0.06 -8.34
NA: Not Applicable.
2016-17 2017-18
F. Registered SAL - mail Articles*
*Service for Registered SAL-mail Articles started in 2017-18
TABLE 17
INWARD POSTAL TRAFFIC FROM FOREIGN COUNTRIES TO INDIA
(in Thousand)
Source: Unregistered traffic - Estimated by enumeration; Registered traffic- Postal Circles.
B. Unregistered Surfacemail Articles
C. Unregistered SAL - mail Articles
%age Decrease/increase
Articles 2014-15 2015-16
A. Unregistered Airmail Articles
D. Registered Airmail Articles
E. Registered Surfacemail Articles
2013-14

(a) Domestic 324.25 676.37 284.83 386.04 513.84 108.60 -57.89 35.53 33.11
(b) Foreign
(in ward) 12.32 9.88 11.9716.42 17.83
-19.81 21.15 37.18 8.59
(outward) 15.06 14.09 16.4316.72 15.28
-6.44 16.61 1.77 -8.61
(a). Outward Parcels handled 330.28 396.43 384.42 395.43 425.23 20.03 -3.03 2.86 7.54
(b). Inward Parcels handled 275.49 227.78 255.69 304.36 322.18 -17.32 12.25 19.03 5.85
(c). Transit Parcels handled 1.00 1.00 1.00 1.00 1.00 0.00 0.00 0.00 0.00
(a).Air India 5774.99 11544.21 6201.52 9776.00 8147.85 177.45 -36.28 16.94 15.99
(b). Foreign Airlines 4186.00 5714.47 4866.86 3799.95 4513.27 36.51 -14.83 -21.92 18.77
(c). Private Airlines 5078.70 5790.80 8767.00 15211.20 15850.27 14.02 51.40 73.51 4.20
Total Amount Paid 15039.69 23049.48 19835.38 19011.15 20363.54 53.26 -13.94 -4.16 7.11
2013-14 2016-17 2017-18
TABLE 18
AIR MAIL - (DOMESTIC & FOREIGN) TRAFFIC
Source: DAA(Dak Air Account) Section and D (Mails) Section
2016-17
over
2014-15
2017-18
over
2016-17
%age Decrease/increase
2015-162014-15
over
2013-14
2015-16
over
2014-15
2014-15Item
1. Total weight of Air-Mail carried (in Lakh Kg.)
2. No. of Foreign Parcels (in Thousand)
3. Amount paid for carrying mail (in ` Lakh)

Month Mumbai Kolkata Chennai Delhi Total
April--2017 101127 5246 11254 60080 177707
May--2017 99856 3254 12546 85264 200920
June--2017 112548 5214 16548 74589 208899
July--2017 103258 6587 13258 86254 209357
August--2017 103562 9852 14785 79854 208053
September--2017 99967 5246 9856 78569 193638
October--2017 106523 4110 11254 81024 202911
November--2017 104542 5268 8255 88547 206612
December--2017 96743 4587 7543 79856 188729
January--2018 110254 3258 6325 94052 213889
February--2018 95208 3258 6548 88651 193665
March--2018 101013 3985 7458 88524 200980
Total 1234601 59865 125630 985264 2405360
Analysis: Out of total outward international speed post during 2017-18, 40.96% were sent from Delhi and
51.3% sent from Mumbai. Chennai and Kolkata had comparatively very small share in the total outward
international speed post during 2017-18.
Source : DAA (Dak Air Account) Section
TABLE 19
Note: The list of countries covered under International Speed Post Service is at Appendix-III.
INTERNATIONAL SPEED POST TRAFFIC
(In numbers)

MUMBAI 1143611 848914 1271649 1304767 1234601 -25.77 49.80 2.60 -5.38
KOLKATA 63886 67693 56182 58647 59865 5.96 -17.00 4.39 2.08
CHENNAI 254306 149893 116180 120903 125630 -41.06 -22.49 4.07 3.91
DELHI 642785 956315 979605 1013372 985264 48.78 2.44 3.45 -2.77
TOTAL 2104588 2022815 2423616 2497689 2405360 -3.89 19.81 3.06 -3.70
Source: DAA(Dak Air Account) Section
% age decrease/increase2014-2015
over 2013-
2014
2015-2016
over 2014-
2015
2016-2017
over 2015-
2016
2017-2018
over 2016-
2017
TABLE 20
In numbers
YEAR- WISE INTERNATIONAL SPEED POST TRAFFIC (OUTWARD)
CITY
2013-2014 2014-
2015
2015-
2016
2016-
2017
2017-
2018
0
200000
400000
600000
800000
1000000
1200000
1400000
2013-2014 2014-2015 2015-2016 2016-2017 2017-2018
Nu
mb
er
Year
International Speed Post Traffic (Outward)
MUMBAI
KOLKATA
CHENNAI
DELHI

RURAL BUSINESS

Andhra Pradesh 366344 1271540
Assam 81285 32826
Bihar 1866 3001
Chhattisgarh 1290284 278495
Delhi 26 996
Gujarat 392774 472202
Haryana 353356 367030
Himachal Pradesh 11965 256568
Jammu & Kashmir 71 34
Jharkhand 395014 26226
Karnataka 307612 443168
Kerala 77650 36164
Madhya Pradesh 550622 383197
Maharashtra 444656 340358
North Eastern 145 209
Orissa 268282 177023
Punjab 1311 657
Rajasthan 89650 9920
Tamil Nadu 9527 20838
Telangana 986273 2775138
Uttar Pradesh 60450 68772
Uttarakhand 1238 212
West Bengal 400497 280624
All India 6090898 7245198
NUMBER OF ACTIVE ACCOUNTS MAINTAINED BY DEPARTMENT OF
POSTS UNDER MGNREGS
(UPTO 31ST
MARCH) *
TABLE 21
Circle
Source: Rural Business Directorate
2016-17 2017-18

FINANCIAL MANAGEMENT

2014-15
over
2013-14
2015-16
over
2014-15
2016-17
over
2015-16
2017-18
over
2016-17
Revenue 10730.42 11635.98 12939.79 11511.00 12832.76 8.44 11.20 -11.04 11.48
Expenditure(Net) 16203.52 17894.58 18946.97 23480.95 25248.59 10.44 5.88 23.93 7.53
Net Deficit 5473.10 6258.60 6007.18 11969.95 12415.83 14.35 -4.02 99.26 3.73
Sale of Stamps 5.80 4.95 3.41 4.09 2.86 -14.66 -31.11 19.94 -30.07
Postage realised in Cash 29.91 27.85 26.80 31.36 32.21 -6.89 -3.77 17.01 2.71
Commission on M.Os. & IPOs. 5.65 5.52 3.59 2.47 1.78 -2.30 -34.96 -31.13 -28.01
Others 58.64 61.68 66.20 62.08 63.15 5.18 7.33 -6.23 1.73
TOTAL 100.00 100.00 100.00 100.00 100.00 0.00 0.00 0.00 0.00
General Admn. 5.81 5.83 5.68 5.39 5.42 0.34 -2.57 -5.11 0.50
Operation 63.21 62.54 62.78 57.51 54.86 -1.06 0.38 -8.39 -4.61
Agency Services 2.91 3.00 3.93 2.38 2.24 3.09 31.00 -39.44 -5.80
Others 28.07 28.63 27.61 34.72 37.48 2.00 -3.56 25.75 7.96
TOTAL 100.00 100.00 100.00 100.00 100.00 0.00 0.00 0.00 0.00
Revenue (%age Break-up)
Expenditure(%age breakup)
REVENUE AND EXPENDITURE
Source : Budget Section
TABLE 22
REVENUE AND EXPENDITURE
Item 2016-17
(in ` Crore)
2017-18
%age Decrease/increase
2013-14 2014-15 2015-16
10730421163598
12939791151100
1283276
16203521789458
1894697
2348095
2524859
0
500000
1000000
1500000
2000000
2500000
3000000
2013-14 2014-15 2015-16 2016-17 2017-18
Rs
(In
Lak
hs)
Year
Revenue Expenditure(Net)
General Admn.5.42%
Operation54.86%
Agency Services2.24%
Others37.48%
Percentage break-up of Expenditure during 2017-18
Sale of Stamps2.86%
Postage realised in Cash32.21%
Commission on M.Os. & IPOs.
1.78%
Others63.15%
Percentage break-up of Revenue during 2017-18
2013-14 2014-15 2015-16 2016-17 2017-18
2014-15
over
2013-14
2015-16
over
2014-15
2016-17
over
2015-16
2017-18
over
2016-17
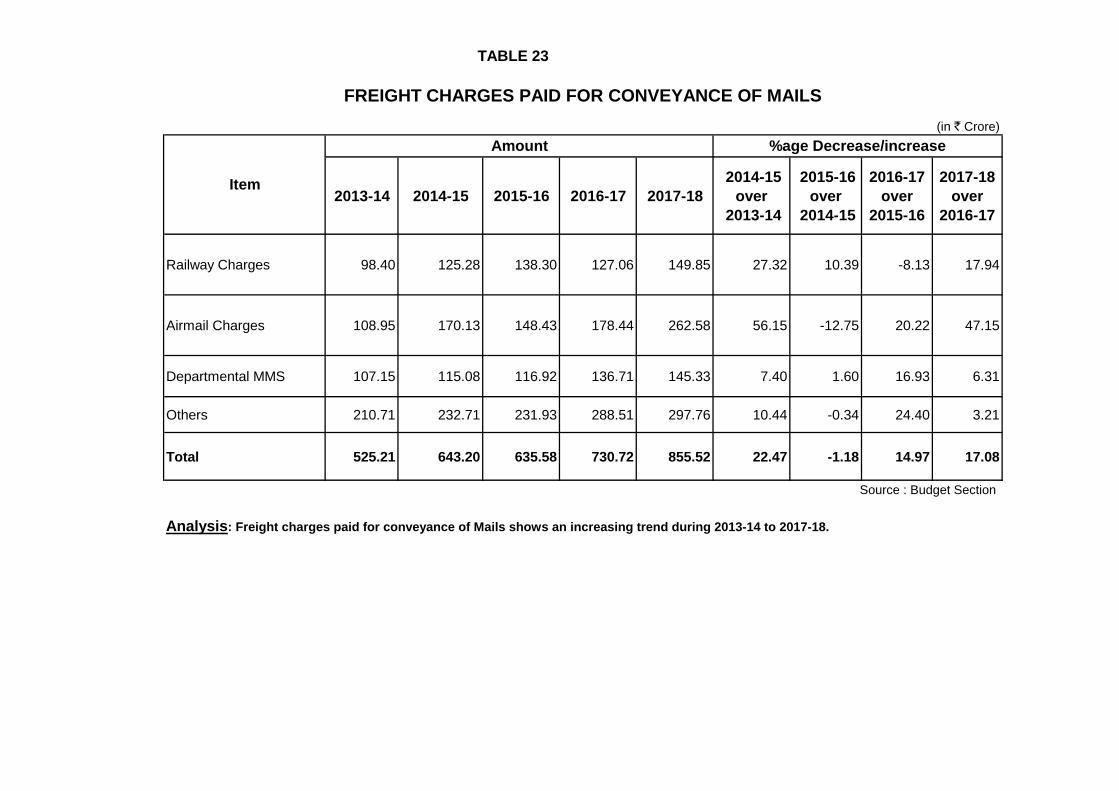
Railway Charges 98.40 125.28 138.30 127.06 149.85 27.32 10.39 -8.13 17.94
Airmail Charges 108.95 170.13 148.43 178.44 262.58 56.15 -12.75 20.22 47.15
Departmental MMS 107.15 115.08 116.92 136.71 145.33 7.40 1.60 16.93 6.31
Others 210.71 232.71 231.93 288.51 297.76 10.44 -0.34 24.40 3.21
Total 525.21 643.20 635.58 730.72 855.52 22.47 -1.18 14.97 17.08
Source : Budget Section
Analysis: Freight charges paid for conveyance of Mails shows an increasing trend during 2013-14 to 2017-18.
Amount
Item
TABLE 23
%age Decrease/increase
(in ` Crore)
FREIGHT CHARGES PAID FOR CONVEYANCE OF MAILS

2013-14 2014-15 2015-16 2016-17 2017-18
2014-15
over
2013-14
2015-16
over
2014-15
2016-17
over
2015-16
2017-18
over
2016-17
Sale of Stamps 622.67 552.12 477.82 519.41 434.86 -11.30 -13.50 8.7 -16.3
Postage realised in cash 3209.73 3264.17 3432.33 3561.37 3698.17 1.70 5.20 3.7 3.8
Net receipts from other postal
Admns.-146.28 -176.02 -220.77 -267.22 -192.03 20.30 25.40 21 -28.1
Receipts on account of
Money Orders, Indian Postal
Orders, etc.
6522.16 7312 8248.71 7370.45 8330.43 12.10 12.80 -10.6 13
Net Other Receipts 522.14 683.71 1001.70 326.99 561.33 30.90 46.51 -67.4 71.7
Total Gross Revenue 10730.42 11635.98 12939.79 11511.00 12832.76 8.44 11.20 -11 11.5
TABLE 24
REVIEW OF REVENUE RECEIPTS
Category
%age Decrease/increaseAmount (in Rs Crore)
Source: Book Section

IN SDRIN (Rs)
in LakhsIN SDR
IN (Rs)
in LakhsIN SDR
IN (Rs)
in Lakhs
2003 9868714 6133.89 9937720 6176.78 -69006 -42.89
2004 9418375 6106.80 10109283 6554.78 -690908 -447.98
2005 8862005 5896.70 10629048 7072.48 -1767043 -1175.78
2006 10666143 7022.98 13719565 9033.47 -3053422 -2010.49
2007 9860193 6527.47 13608456 9008.83 -3748263 -2481.36
2008 9207070 5938.91 12284563 7924.00 -3077493 -1985.09
2009 7290614 4798.85 7938599 5225.37 -647985 -426.52
2010 5800000 3817.69 9200000 6055.64 -3400000 -2237.95
2011 6248803 4427.90 7530879 5336.38 -1282076 -908.48
2012 6056721 5753.88 7898733 7503.80 -1842012 -1749.92
2013 5474856 5090.52 8678946 8069.68 -3204090 -2979.16
2014 4401830 4129.79 8203614 7696.63 -3801784 -3566.84
2015 5626581 5029.77 10301554 9208.88 -4674973 -4179.11
2016 8237427 7688.00 11293459 10540.21 -3056032 -2852.21
2017 9679071 9033.49 10908687 10181.09 -1229616 -1147.6Source : DAA Section
FOREIGN EXCHANGE
PAYMENT
NET RECEIPT (+)
NET PAYMENT (-)
TABLE-25
FOREIGN EXCHANGE EARNED ON ACCOUNT OF TERMINAL DUES FOR LETTER MAILCalender Year (Ist
January to 31st
December)FOREIGN EXCHANGE
RECEIPT

(in ` Lakh)
2013-14 2014-15 2015-16 2016-17 2017-18
2014-15
over
2013-14
2015-16
over
2014-15
2016-17
over
2015-16
2017-18
over
2016-17
Andhra Pradesh 97947.64 127121.77 140911.63 125226.79 91187.12 29.79 10.85 -11.13 -27.18
Assam 19742.69 21019.27 21739.24 19745.35 21853.92 6.47 3.43 -9.17 10.68
Bihar 51775.10 57281.46 65506.84 57361.55 63745.16 10.64 14.36 12.43 11.13
Chhattisgarh 12786.55 13934.11 16891.25 11600.67 22647.64 8.97 21.22 -31.32 95.23
Delhi 42585.42 33751.52 65104.33 36757.43 47154.27 -20.74 92.89 -43.54 28.29
Gujarat 53034.81 58011.83 65824.56 60721.79 60328.93 9.38 13.47 -7.75 -0.65
Haryana 21246.51 21411.63 24247.39 22790.44 25854.63 0.78 13.24 -6.01 13.45
Himachal Pradesh 12077.82 13590.93 15063.55 14230.88 14788.80 12.53 10.84 -5.53 3.92
Jammu & Kashmir 5589.53 5916.20 6742.04 5790.93 6210.25 5.84 13.96 -14.11 7.24
Jharkhand 18348.83 23004.36 30366.29 28580.31 29170.07 25.37 32.00 -5.88 2.06
Karnataka 77951.23 86873.94 97231.06 91496.12 96199.15 11.45 11.92 -5.90 5.14
Kerala 52420.63 55650.87 52036.14 48236.89 50989.13 6.16 -6.50 -7.30 5.71
Madhya Pradesh 51041.21 53230.20 59205.53 55892.05 58963.89 4.29 11.23 -5.60 5.5
Maharashtra 155649.10 153235.29 167580.53 158974.70 172194.24 -1.55 9.36 -5.14 8.32
North - East 6061.18 7316.72 7869.54 6649.67 7243.24 20.71 7.56 -15.50 8.93
Orissa 26693.45 32504.14 35926.36 32201.48 37977.18 21.77 10.53 -10.37 17.94
Punjab 23477.72 24600.02 27036.69 24969.21 25288.43 4.78 9.91 -7.65 1.28
Rajasthan 55197.29 62574.94 64471.07 52662.85 53386.64 13.37 3.03 -18.32 1.37
Tamil Nadu 106352.83 107789.39 106609.56 102352.76 118313.76 1.35 -1.09 -3.99 15.59
Telangana 0.00 0.00 0.00 0.00 61824.52 0.00 0.00 0.00 0
Uttar Pradesh 94526.10 102766.43 110463.74 107962.67 113679.21 8.72 7.49 -2.26 5.29
Uttarakhand 13807.44 15104.50 17852.66 16334.26 17951.40 9.39 18.19 -8.51 9.9
West Bengal 72056.95 83343.94 91818.89 76186.39 84926.28 15.66 10.17 -17.03 11.47
Base P.O 2671.58 3564.83 3479.76 -5624.79 1397.73 33.44 -2.39 -261.64 -124.85
Centrally Adjusted in
Head Quarter*0.00 0.00 0.00 0 0.00 0.00 0.00 0.00 0
All India 1073041.61 1163598.29 1293978.65 1151100.40 1283275.59 8.44 11.20 *-11.04 11.48
*Due to reduction of remuneration rate for SBCC products by Ministry of Finance during the year 2016-17
Source : Book Section
TABLE 26
REVIEW OF CIRCLE-WISE REVENUE RECEIPTS
Circle
%age Decrease/increaseAmount

CIRCLE-WISE REVENUE RECEIPTS
(Rs. Crore)
1252.2
7
19
7.4
5
573.6
2
116
.01
367.5
7
607.2
2
227.9
0
142.3
1
57.9
1
285.8
0
914.9
6
482.3
7 558.9
2
1589.7
5
66.5
0
322.0
1
249.6
9
526.6
3
10
23
.53
0.0
0
1079.6
3
163.3
4
761.8
6
911.8
7
21
8.5
4
63
7.4
5
226.4
8
471.5
4
603.2
9
258.5
5
147.8
9
62.1
0
291.7
0
961.9
9
50
9.8
9 589.6
4
1721.9
4
72.4
3
379.7
7
252.8
8
53
3.8
7
1183.1
4
618.2
5
1136.7
9
179.5
1
849.2
6
13.9
8
0
100
200
300
400
500
600
700
800
900
1000
1100
1200
1300
1400
1500
1600
1700
1800
Am
ou
nt
(` C
rore
)
2016-17 2017-18

2013-14 2014-15 2015-16 2016-17 2017-18
2014-15
over
2013-14
2015-16
over
2014-15
2016-17
over
2015-16
2017-18
over
2016-17
1
Pay & Allowances,
Contingencies Interim Relief &
Other Items
11274.46 12436.25 13155.39 15415.79 15745.18 10.30 5.80 17.20 2.10
2 Accounts & Audit 320.75 350.01 344.91 385.13 400.54 9.12 -1.50 11.60 4.00
3 Pensionery Charges 4443.17 5033.92 5408.20 7547.19 8511.33 13.30 7.44 39.60 12.80
4 Stamps, Postcards etc. 17.38 25.56 47.87 33.50 76.51 58.60 73.60 -30.00 128.40
5Stationery and Forms &
Printing etc.81.30 84.62 81.30 97.81 92.03 4.10 -3.92 20.30 -5.90
6 Maintenance of Assets 134.39 96.07 98.33 113.47 106.57 28.50 2.35 15.40 -6.10
7 Petty Works 0.00 0.00 0.00 0.00 0.00 0.00 0.00 0.00 0.00
8Conveyance of Mails-Payment
of Railways & Airmail Carriers525.26 528.12 518.67 594.01 712.13 0.50 -1.80 14.50 19.90
9 Total Expenditure 16796.71 18554.55 19654.67 24186.90 25644.29 10.50 5.90 23.10 6.00
10 Deduct Recoveries 593.19 661.98 707.70 730.90 770.25 11.60 6.91 3.30 5.40
11 Add Depreciation * 0.00 0.00 0.00 0.00 0.00 0.00 0.00 0.00 0.00
12 Grant in Aid to IPPB (+) 0.00 0.00 0.00 24.95 374.55 0.00 0.00 0.00 1401.20
13 Total Net Expenditure 16203.52 17892.57 18946.97 23480.95 25248.59 10.40 5.90 23.90 7.50
* No depreciation is charged as account is maintained on cash based accounting.
TABLE 27
(in ` Crore)
Source : Book Section
Sl.
No.Category
%age Decrease/increaseAmount
ACTUAL EXPENDITURE UNDER THE IMPORTANT CATEGORIES AND PERCENTAGE INCREASE/DECREASE OVER
PRECEDING YEAR
REVIEW OF EXPENDITURE

2013-14 2014-15 2015-16 2016-17 2017-18
1 Operative, Administrative, Staff Costs, etc. 105.1 106.9 101.7 133.9 122.7
2 Conveyance of Mails(Payment to Railways & Air Mail Carriers) 4.9 4.5 4.0 5.2 5.6
3 Stationery and Printing (including Stamps, Postcards, etc.) 0.9 1.0 1.0 1.1 1.3
4 Maintenance of assets 1.3 0.8 0.7 1 0.8
5 Petty Works 0.0 0.0 0.0 0 0
6 Pensionary Charges 41.4 43.2 41.8 65.6 66.3
7 Accounts & Audit Charges 3.0 3.0 2.7 3.3 3.1
8 Grant in Aid to IPPB 0.0 0.0 0.0 0 2.9
9 Depreciation 0.0 0.0 0.0 0 0
10 Deduct - Credits to working expenses 5.5 5.7 5.5 6.3 6
11 Net Working Expenses 151.0 153.8 146.4 203.8 196.7
12 Surplus(+) / Deficit(-) -51.0 -53.8 -46.4 -103.8 -96.7
100.0 100.0 100.0 100 100
2013-14 2014-15 2015-16 2016-17 2017-18
1 Operative, Administrative, Staff Costs, etc. 69.6 69.5 69.4 65.7 62.3
2 Conveyance of Mails(Payment to Railways & Air Mail Carriers) 3.2 3 2.7 2.5 2.8
3 Stationery and Printing (including Stamps, Postcards, etc.) 0.6 0.6 0.7 0.6 0.7
4 Maintenance of assets 0.8 0.5 0.5 0.5 0.4
5 Pensionary Charges 27.4 28.1 28.6 32.2 33.7
6 Accounts & Audit Charges 2 2 1.8 1.6 1.6
7 Grant in Aid to IPPB 0 0 0 0 1.5
8 Depreciation 0 0 0 0 0
9 Deduct - Credits to working expenses -3.6 -3.7 -3.7 -3.1 -3
100.0 100 100 100 100 Total
Source: Book Section
Source: Book Section
S.
No.Major Items of Working Expenses
Percentage to total Working Expenses
TABLE 29
PERCENTAGE BREAK-UP OF WORKING EXPENSES
S.
No.Items of Expenditure
Total
Percentage of Revenue
TABLE 28
PERCENTAGE OF ITEMS OF EXPENDITURE TO REVENUE EARNED

PERCENTAGE BREAK-UP OF WORKING EXPENSES DURING 2017-2018
62.3
2.8
0.7
0.4
33.7
1.61.5
-3
Operative, Administrative, StaffCosts, etc.
Conveyance of Mails(Payment toRailways & Air Mail Carriers)
Stationery and Printing (includingStamps, Postcards, etc.)
Maintenance of assets
Pensionary Charges
Accounts & Audit Charges
Grant in Aid to IPPB
Deduct - Credits to working expenses

2013-14 2014-15 2015-16 2016-17 2017-18
2014-15
over
2013-14
2015-16
over 2014-
15
2016-17
over 2015-
16
2017-18
over
2016-17
Spped Post 137221 149521 160525 178300 182980 8.96 7.36 11.07 2.62
Express Post 7763 11247 14900 15897 13853 44.88 32.48 6.69 -12.86
Business Post 102952 96254 73593 75252 74714 -6.51 -23.54 2.25 -0.71
Retail Post 7022 8436 7688 6768 10859 20.14 -8.87 -11.97 60.45
Media Post 419 321 454 1059 663 -23.39 41.43 133.26 -37.39
Bill Mail 10299 10357 9904 7716 5674 0.56 -4.37 -22.09 -26.46
e-Bill Post 3510 2575 3079 2634 2288 -26.64 19.57 -14.45 -13.14
Direct Post 254 232 239 289 212 -8.66 3.02 20.92 -26.64
e Post 347 413 289 163 478 19.02 -30.02 -43.60 193.25
RMFM 0 0 36611 44775 47713 N/A N/A 22.30 6.56
Logistics Post 1525 2443 1552 1631 1541 60.20 -36.47 5.09 -5.52
Greetings 19 11 0 0 0 -42.11 -100.00 0 0
Others 1024 985 1022 876 925 -3.81 3.76 -14.29 5.59
TOTAL 272355 282795 309856 335360 341900 3.83 9.57 8.23 1.95
YEAR
Source: BD& M Directorate
Note: The traffic figures of Business Product Services are available in Table 10.
n.a.: Not Available.
Analysis: Revenue from premium products shows an increasing trend during the period from 2013-14 to 2017-18. An
amount of ` 341900 crore was realised as the revenue from premium products during 2017-18, which shows an increase of
1.95 % over previous year.
India Post Overall Vs. Premium Products Revenue
TABLE 30
REVIEW OF REVENUE RECEIPTS OF PREMIUM PRODUCTS SERVICES
(in ` Lakh)
Services
Amount %age increase/decrease
1,0
7,3
04
1,1
6,3
60
1,2
9,3
98
1,1
5,1
10
1,2
8,3
28
27
23
5
28
28
0
30
98
6
33
53
6
34
19
0
0
20000
40000
60000
80000
100000
120000
140000
2013-14 2014-15 2015-16 2016-17 2017-18
Total Revenue Revenue BD

(in ` lakh)
Philatelic Products Revenue realised during 2017-18
Sale of Commemorative Postage Stamps 6196
Sale of Philately Ancillaries 3819
Sale of My Stamps 621
Total Philatelic Revenue 10636
(in Rs lakh)
TABLE 31
PHILATELIC REVENUE
Source: Philately Division
REVENUE OF PHILATELIC PRODUCTS DURING 2017-18
58.25%
35.91%
5.84%
Sale of Commemorative Postage Stamps
Sale of Philately Ancillaries
Sale of My Stamps

Number Value Commission
(in Lakh)
3.90 60.43 2.6
1.13 18.59 0.72
3.12 43.92 1.29
1.36 20.65 0.86
1.42 23.24 1.09
5.47 103.73 4.98
1.48 19.64 0.88
3.59 82.36 4.04
0.66 10.17 0.4
1.34 17.77 0.75
275.73 2593.73 125.27
397.87 890.45 43.6
1.54 34.63 1.62
14.76 218.65 10.16
0.74 13.77 0.47
1.48 29.27 1.21
6.55 31.86 1.35
13.69 129.02 6.04
27.34 209.84 9.74
5.88 94.20 3.54
0.62 18.36 0.62
6.86 72.46 3.42
0.03 3.78 0.21
776.58 4740.54 224.85
Himachal Pradesh
TABLE 32
Circle(in ` Crore)
INLAND MONEY ORDERS ISSUED DURING 2017-18
Andhra Pradesh
Assam
Bihar
Chhattisgarh
Delhi
Gujarat
Haryana
Uttar Pradesh
Jammu & Kashmir
Jharkhand
Karnataka
Kerala
Madhya Pradesh
Maharashtra
North Eastern
Orissa
Punjab
Rajasthan
Tamil Nadu
Uttarakhand
West Bengal
Base P.O.
Total
Source: Book Section.

Item 2013-14 2014-15 2015-16 2016-17 2017-18
2014-15
over
2013-14
2015-16
over
2014-15
2016-17
over
2015-16
2017-18
over
2016-17
Number issued (in Lakh) 1091.44 1352.02 1018.55 659.00 776.58 23.87 -24.66 -35.3 17.84
Value of I.M.O. Issued (in ` Crore) 12240.79 14180.37 11736.41 5987.12 4740.54 15.85 -17.23 -48.99 -20.82
Commission on IMOs (in ` Crore) 591.94 614.56 490.03 280.08 224.85 3.82 -20.26 -42.84 -19.73
Average Value of Money Orders (in `) 1121.53 1048.83 1152.27 908.52 610.44 -6.48 9.86 -21.15 -32.81
TABLE 33
Source : Book - II Section.
AVERAGE VALUE OF INLAND MONEY ORDERS
0
200
400
600
800
1000
1200
1400
2013-14 2014-15 2015-16 2016-17 2017-18
10
91
.44
135
2.0
2
101
8.5
5
65
9.0
0
776.5
8
(in
La
kh
)
YEAR
NUMBER OF INLAND MONEY ORDERS ISSUED

TOTAL
Source : Book - II Section
1.00
2.12
5.47
0.62
2.11
Kerala
Uttar Pradesh
Madhya Pradesh
Maharashtra
North - East
Orissa
Punjab
Rajasthan
Tamil Nadu
Karnataka 7.42
Gujarat
Haryana
Himachal Pradesh
0.06
2.91
2.48
West Bengal
Base P.O.
0.31
0.51
1.12
0.21
0.58
4.23
0.50
0.81
8.98
3.66
0.48
1.66
4.16
2.67
9.34
0.99
Jammu & Kashmir
Jharkhand
Uttarakhand
0.99
0.09
2.17
0.44
1.49
0.54
1.22
1.92
1.75
0.45
Chhatisgarh
Delhi
1.24
0.02
29.88
0.41
0.05
0.00
3.24
0.16
0.09
0.15
0.06
1.56
0.12
0.25
0.04
0.07
0.49
72.57
2.19
4.84
1.21
2.93
0.11
0.20
0.02
0.06
0.05
INDIAN POSTAL ORDERS SOLD DURING 2017-18
TABLE 34
0.12
0.19
0.23
0.04
Commission
(in ` Crore)
Value
(in ` Crore)
Numbers
(in Lakh)Circle
0.28
0.05
Assam
Bihar
3.43
2.65
3.87
3.08
Andhra Pradesh

2014-15
over
2013-14
2015-16
over 2014-
15
2016-17
over
2015-16
2017-18
over
2016-17
No. of IPOs Sold (in Lakh) 379.39 261.68 121.93 100.57 72.57 -31.03 -53.40 -17.52 -27.84
Value of IPOs Sold (in ` Lakh) 14139.47 9752.3 4283.28 4269.00 2988.00 -31.03 -56.08 -0.33 -30.01
Commission on IPOs (in ` Lakh) 1465.07 964.52 435.12 445.00 324.00 -34.17 -54.89 2.27 -27.19
Average Value of IPOs (in `) 37.27 37.27 35.13 42.45 41.17 0.00 -5.74 20.83 -3.00
YEAR
TABLE 35
AVERAGE VALUE OF INDIAN POSTAL ORDERS
2015-16
Source : Book - II Section
Item 2013-14 2014-15 2016-17 2017-18
%age Decrease/increase
AVERAGE VALUE OF INDIAN POSTAL ORDERS
0
50
100
150
200
250
300
350
400
2013-14 2014-15 2015-16 2016-17 2017-18
379.39
261.68
121.93100.57
72.57
In L
Akh

(Rs Crore)
Sl No. Plan Scheme/Activity Allocation of Funds (FG) Actual (Projected)
Postal Operations
1.1 Rural Business & Access to Postal Network 1.71 1.31
1.2 Mail Operations 6.01 4.59
1.3 Post Office Savings Bank Operations 0.50 0.40
1.4Postal Life Insurance Operations and
Promotion1.37 1.03
1.5 IT Induction & Modernisation 47.51 36.37
1.6
Business Promotion, Marketing Research and
Product Development (Including Setting up of
Aadhaar enrolment cum updation centre)
19.53 15.48
1.7 Philately Operations 0.75 0.57
1.7.1 Commemorative Postage Stamp printing 0.00 0.00
1.8 Quality of Service 0.01 0.01
Scheme Total 77.38 59.75
2 Human Resource Management 2.06 1.51
3 Estates Management 9.30 6.544 Setting up of India Post Payments Bank 0.00 0.00
Grand Total 88.74 67.80Source : CP Division
FUNDS ALLOCATED AND UTILISED UNDER PLAN SCHEME IN THE NORTH-
EASTERN REGION INCLUDING ASSAM AND SIKKIM DURING THE ANNUAL PLAN
2017-18
TABLE 36

Cost Revenue Cost Revenue Cost Revenue Cost Revenue Cost Revenue
Postcard 753.37 50.00 905.04 50.00 994.21 50.00 1215.76 50.00 1298.45 50.00
Printed Postcard 740.30 600.00 845.07 600.00 927.70 600.00 1174.45 600.00 1253.63 600.00
Competition Postcard 741.62 1000.00 846.67 1000.00 928.91 1000.00 1175.01 1000.00 1259.13 1000.00
Letter Card (Inland Letter) 748.39 250.00 885.39 250.00 968.84 250.00 1207.36 250.00 1270.80 250.00
Letter 826.19 924.94 1005.31 1396.98 1079.39 1059.00 1330.19 1291.41 1519.74 1582.78
Registered Newspaper - Single 913.45 41.00 1045.92 44.00 1222.59 47.00 1481.75 40.00 1547.41 202.00
Registered Newspaper - Bundle 1483.13 97.00 1705.59 90.00 1463.85 24.90 1786.85 24.00 1842.21 87.00
Book Post, Book Pattern & Sample Packets 806.15 685.65 1096.95 739.46 1218.77 802.25 1477.77 669.10 1564.69 819.15
Book Post - Printed Books 1312.18 272.37 1352.12 206.04 1510.55 230.63 2087.06 275.77 2461.72 375.77
Book Post - Other Periodicals 1263.57 1265.25 1471.22 1235.86 1933.01 1601.77 2152.57 1181.41 2199.18 778.88
Acknowledgement 691.87 300.00 778.04 300.00 856.54 300.00 1091.55 300.00 1156.72 300.00
Parcel 5197.52 3645.90 7137.00 4845.53 6764.62 4416.80 8923.75 4661.09 8466.38 4270.03
Registration 4253.73 1700.00 4838.93 1700.00 5426.26 1700.00 6899.59 1700.00 7297.07 1700.00
Speed Post 5249.67 3710.04 5884.67 3688.31 6735.27 3871.62 8522.37 3831.10 9120.21 3983.25
Value Payable Post 2465.90 352.40 3033.45 364.44 3729.07 356.58 4839.40 417.56 5092.70 416.69
Insurance 13805.84 4823.31 6201.24 5215.43 7264.44 5393.40 9269.56 10536.29 9771.85 4160.02
Money Order 8638.19 5464.86 10457.08 4677.65 8577.04 4012.12 19735.01 4250.30 19823.96 2895.66
Indian Postal Order 3159.99 393.20 3998.67 364.92 2632.70 375.85 9379.48 449.95 9034.85 446.72
2017-18
(in Paise)
Source : T&C Section
AVERAGE COST AND AVERAGE REVENUE IN VARIOUS POSTAL SERVICES
TABLE 37
2016-172013-14 2014-15 2015-16
Name of Service

AVERAGE COST AND AVERAGE REVENUE IN VARIOUS POSTAL SERVICES(in Paisa)
753.37
50.00
905.04
50.00
994.21
50.00
1,215.76
50.00
1,298.45
50.00
0
200
400
600
800
1000
1200
1400
Co
st
Re
ven
ue
Co
st
Re
ven
ue
Co
st
Re
ven
ue
Co
st
Re
ven
ue
Co
st
Re
ven
ue
2013-14 2014-15 2015-16 2016-17 2017-18
Post Card
740.30
600.00
845.07
600.00
927.70
600.00
1174.45
600.00
1253.63
600.00
0
200
400
600
800
1000
1200
1400
Co
st
Re
ven
ue
Co
st
Re
ven
ue
Co
st
Re
ven
ue
Co
st
Re
ven
ue
Co
st
Re
ven
ue
2013-14 2014-15 2015-16 2016-17 2017-18
Printed Postcard
741.62
1000.00
846.67
1000.00928.91
1000.00
1175.01
1000.00
1259.13
1000.00
0
200
400
600
800
1000
1200
1400
Co
st
Rev
enu
e
Co
st
Rev
enu
e
Co
st
Rev
enu
e
Co
st
Rev
enu
e
Co
st
Rev
enu
e
2013-14 2014-15 2015-16 2016-17 2017-18
Competition Postcard
748.39
250.00
885.39
250.00
968.84
250.00
1207.36
250.00
1270.80
250.00
0
200
400
600
800
1000
1200
1400
Co
st
Rev
enu
e
Co
st
Rev
enu
e
Co
st
Rev
enu
e
Co
st
Rev
enu
e
Co
st
Rev
enu
e
2013-14 2014-15 2015-16 2016-17 2017-18
Letter Card (Inland Letter)
826.19924.94
1005.31
1396.98
1079.39
1059.00
1330.19
1291.41
1519.74
1582.78
0
200
400
600
800
1000
1200
1400
1600
1800
Co
st
Re
ven
ue
Co
st
Re
ven
ue
Co
st
Re
ven
ue
Co
st
Re
ven
ue
Co
st
Re
ven
ue
2013-14 2014-15 2015-16 2016-17 2017-18
Letter
913.45
41.00
1045.92
44.00
1222.59
47.00
1481.75
40.00
1547.41
202.00
0
200
400
600
800
1000
1200
1400
1600
1800
Co
st
Rev
enu
e
Co
st
Rev
enu
e
Co
st
Rev
enu
e
Co
st
Rev
enu
e
Co
st
Rev
enu
e
2013-14 2014-15 2015-16 2016-17 2017-18
Registered Newspaper - Single

AVERAGE COST AND AVERAGE REVENUE IN VARIOUS POSTAL SERVICES AVERAGE COST AND AVERAGE REVENUE IN VARIOUS POSTAL SERVICES(in Paisa)
1483.13
97.00
1705.59
90.00
1463.85
24.90
1786.85
24.00
1842.21
87.00
0
200
400
600
800
1000
1200
1400
1600
1800
2000
Co
st
Rev
enu
e
Co
st
Rev
enu
e
Co
st
Rev
enu
e
Co
st
Rev
enu
e
Co
st
Rev
enu
e
2013-14 2014-15 2015-16 2016-17 2017-18
Registered Newspaper - Bundle
806.15
685.65
1096.95
739.46
1218.77
802.25
1477.77
669.10
1564.69
819.15
0
200
400
600
800
1000
1200
1400
1600
1800
Co
st
Rev
enu
e
Co
st
Rev
enu
e
Co
st
Rev
enu
e
Co
st
Rev
enu
e
Co
st
Rev
enu
e
2013-14 2014-15 2015-16 2016-17 2017-18
Book Post, Book Pattern & Sample Packets
1312.18
272.37
1352.12
206.04
1510.55
230.63
2087.06
275.77
2461.72
375.77
0
500
1000
1500
2000
2500
3000
Co
st
Rev
enu
e
Co
st
Rev
enu
e
Co
st
Rev
enu
e
Co
st
Rev
enu
e
Co
st
Rev
enu
e
2013-14 2014-15 2015-16 2016-17 2017-18
Book Post - Printed Books
1263.57
1265.25
1471.22
1235.86
1933.01
1601.77
2152.57
1181.41
2199.18
778.88
0
500
1000
1500
2000
2500
Co
st
Rev
enu
e
Co
st
Rev
enu
e
Co
st
Rev
enu
e
Co
st
Rev
enu
e
Co
st
Rev
enu
e
2013-14 2014-15 2015-16 2016-17 2017-18
Book Post - Other Periodicals
691.87
300.00
778.04
300.00
856.54
300.00
1091.55
300.00
1156.72
300.00
0
200
400
600
800
1000
1200
1400
Co
st
Rev
enu
e
Co
st
Rev
enu
e
Co
st
Rev
enu
e
Co
st
Rev
enu
e
Co
st
Rev
enu
e
2013-14 2014-15 2015-16 2016-17 2017-18
Acknowledgement
5197.52
3645.90
7137.00
4845.53
6764.62
4416.80
8923.75
4661.09
8466.38
4270.03
0
1000
2000
3000
4000
5000
6000
7000
8000
9000
10000
Co
st
Rev
enu
e
Co
st
Rev
enu
e
Co
st
Rev
enu
e
Co
st
Rev
enu
e
Co
st
Rev
enu
e
2013-14 2014-15 2015-16 2016-17 2017-18
Parcel

AVERAGE COST AND AVERAGE REVENUE IN VARIOUS POSTAL SERVICES AVERAGE COST AND AVERAGE REVENUE IN VARIOUS POSTAL SERVICES(in Paisa)
4253.73
1700.00
4838.93
1700.00
5426.26
1700.00
6899.59
1700.00
7297.07
1700.00
0
1000
2000
3000
4000
5000
6000
7000
8000
Co
st
Rev
enu
e
Co
st
Rev
enu
e
Co
st
Rev
enu
e
Co
st
Rev
enu
e
Co
st
Rev
enu
e
2013-14 2014-15 2015-16 2016-17 2017-18
Registration
5249.67
3710.04
5884.67
3688.31
6735.27
3871.62
8522.37
3831.10
9120.21
3983.25
0
1000
2000
3000
4000
5000
6000
7000
8000
9000
10000
Co
st
Rev
enu
e
Co
st
Rev
enu
e
Co
st
Rev
enu
e
Co
st
Rev
enu
e
Co
st
Rev
enu
e
2013-14 2014-15 2015-16 2016-17 2017-18
Speed Post
2465.90
352.40
3033.45
364.44
3729.07
356.58
4839.40
417.56
5092.70
416.69
0
1000
2000
3000
4000
5000
6000
Co
st
Rev
enu
e
Co
st
Rev
enu
e
Co
st
Rev
enu
e
Co
st
Rev
enu
e
Co
st
Rev
enu
e
2013-14 2014-15 2015-16 2016-17 2017-18
Value Payable Post
13805.84
4823.31
6201.24
5215.43
7264.44
5393.40
9269.56
10536.299771.85
4160.02
0
2000
4000
6000
8000
10000
12000
14000
16000
Co
st
Rev
enu
e
Co
st
Rev
enu
e
Co
st
Rev
enu
e
Co
st
Rev
enu
e
Co
st
Rev
enu
e
2013-14 2014-15 2015-16 2016-17 2017-18
Insurance
8638.19
5464.86
10457.08
4677.65
8577.04
4012.12
19735.01
4250.30
19823.96
2895.66
0
5000
10000
15000
20000
25000
Co
st
Rev
enu
e
Co
st
Rev
enu
e
Co
st
Rev
enu
e
Co
st
Rev
enu
e
Co
st
Rev
enu
e
2013-14 2014-15 2015-16 2016-17 2017-18
Money Order
3159.99
393.20
3998.67
364.92
2632.70
375.85
9379.48
449.95
9034.85
446.72
0
1000
2000
3000
4000
5000
6000
7000
8000
9000
10000
Co
st
Rev
enu
e
Co
st
Rev
enu
e
Co
st
Rev
enu
e
Co
st
Rev
enu
e
Co
st
Rev
enu
e
2013-14 2014-15 2015-16 2016-17 2017-18
Indian Postal Order

FINANCIAL SERVICES

(in Number)
Single Double
More
than 2
hands
Total
SOSingle Double
More
than 2
hands
Total SO
Depar
tment
al
GDS Total
Andhra Pradesh 10490 5 658 222 78 958 54 359 66 152 577 1594 0 8749 8749 0 146 146 8895 10489 1 0 1
Assam 4012 0 264 59 40 363 19 126 59 57 242 624 0 3252 3252 0 135 135 3387 4011 1 0 1
Bihar 9084 1 259 272 114 645 31 165 86 132 383 1060 0 7979 7979 0 45 45 8024 9084 0 0 0
Chhattisgarh 3187 0 65 20 5 90 11 129 60 61 250 351 0 2808 2808 0 28 28 2836 3187 0 0 0
Delhi 554 0 0 0 5 5 12 151 89 150 390 407 0 78 78 0 69 69 147 554 0 0 0
Gujarat 8948 0 279 246 114 639 33 132 141 345 618 1290 0 7508 7508 0 101 101 7609 8899 15 34 49
Haryana 2693 0 78 71 27 176 16 136 84 94 314 506 0 2139 2139 0 48 48 2187 2693 0 0 0
Himachal Pradesh 2792 3 173 125 50 348 15 38 21 45 104 470 0 2309 2309 0 11 11 2320 2790 0 2 2
Jammu & Kashmir 1699 0 65 19 5 89 9 79 49 41 169 267 0 1419 1419 0 13 13 1432 1699 0 0 0
Jharkhand 3460 0 140 74 22 236 13 91 58 65 214 463 0 2958 2958 0 37 37 2995 3458 2 0 2
Karnataka 9663 0 525 261 56 842 58 293 167 349 809 1709 0 7779 7779 0 172 172 7951 9660 3 0 3
Kerala 5064 5 291 413 237 941 47 168 158 190 516 1509 0 3212 3212 0 343 343 3555 5064 0 0 0
Madhya Pradesh 8280 0 269 56 2 327 43 277 179 194 650 1020 0 7146 7146 0 114 114 7260 8280 0 0 0
Maharashtra 12870 1 576 270 182 1028 60 300 202 614 1116 2205 0 10558 10558 0 94 94 10652 12857 11 2 13
North Eastern 2919 0 165 29 9 203 9 57 30 41 128 340 0 2486 2486 0 92 92 2578 2918 0 1 1
Orissa 8215 0 429 180 56 665 35 319 63 124 506 1206 1 6949 6950 0 59 59 7009 8215 0 0 0
Punjab 3870 0 172 145 15 332 22 92 139 185 416 770 0 3085 3085 0 15 15 3100 3870 0 0 0
Rajasthan 10311 1 495 192 40 727 46 244 151 164 559 1333 0 8951 8951 0 27 27 8978 10311 0 0 0
Tamil Nadu 12138 1 652 460 220 1332 93 711 205 490 1406 2832 0 8949 8949 0 355 355 9304 12136 2 0 2
Telangana 5811 1 355 51 17 423 35 205 69 110 384 843 0 4855 4855 0 113 113 4968 5811 0 0 0
Uttar Pradesh 17671 0 389 381 124 894 72 738 418 437 1593 2559 0 14852 14852 0 260 260 15112 17671 0 0 0
Uttarakhand 2723 0 94 66 37 197 13 87 35 62 184 394 0 2316 2316 0 13 13 2329 2723 0 0 0
West Bengal 9077 0 317 265 201 783 47 338 260 341 939 1769 0 7157 7157 0 151 151 7308 9077 0 0 0
Total 155531 18 6710 3877 1656 12243 793 5235 2789 4443 12467 25521 1 127494 127495 0 2441 2441 129936 155457 35 39 74
TABLE 38
Total
Depart-
mental &
GDS
Sub
Office
Rural Areas
Total
Depart-
mental
Branch
Office
Total
GDSTotal
Urban AreasRural Areas
Sub
Office
Branch
OfficeTotal
Post Offices exclussive of
Savings Bank and
Savings Certificates Work
Head
PO
Sub-Office
POST OFFICES PERFORMING SAVINGS BANK/SAVING CERTIFICATE WORK AS ON 31.03.2018
Post Offices performing Savings Bank and Savings Certificates Work
Gramin Dak Sewak (GDS)
Source: Planning Division for total number of POs, (2) Postal Circles
Head
PO
Sub-Office
Total
Number
of Post
Offices
Circle
Urban Areas
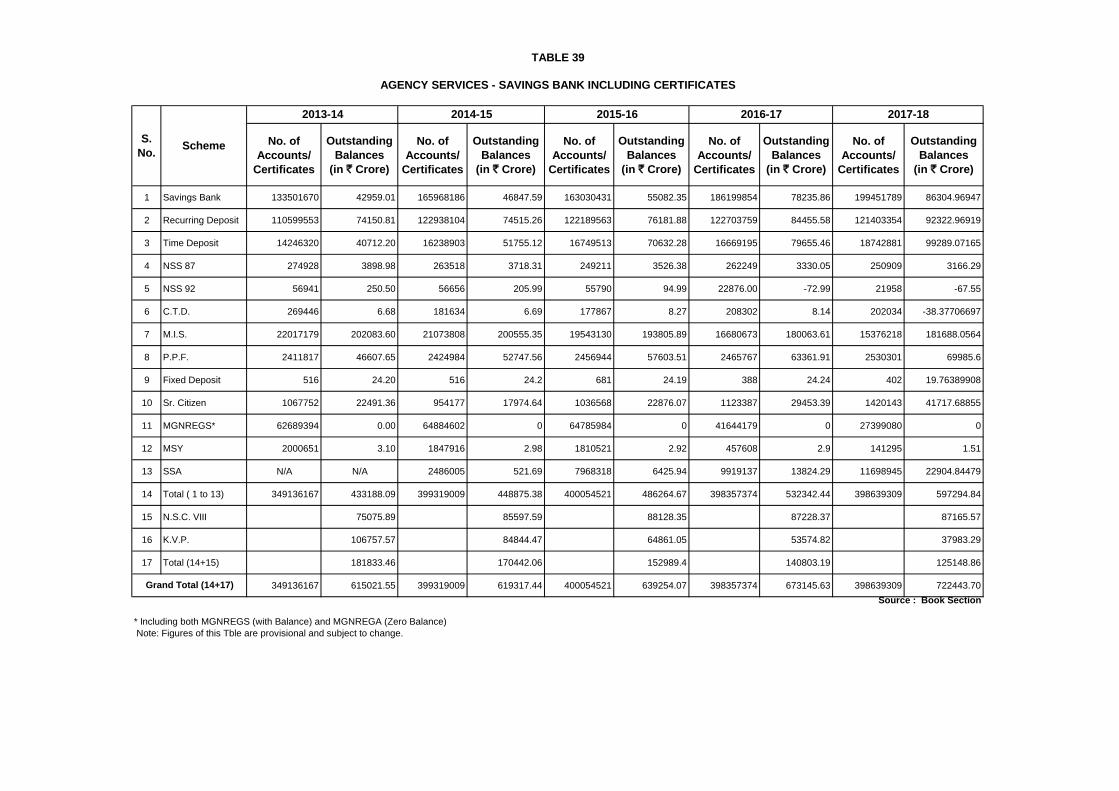
No. of
Accounts/
Certificates
Outstanding
Balances
(in ` Crore)
No. of
Accounts/
Certificates
Outstanding
Balances
(in ` Crore)
No. of
Accounts/
Certificates
Outstanding
Balances
(in ` Crore)
No. of
Accounts/
Certificates
Outstanding
Balances
(in ` Crore)
No. of
Accounts/
Certificates
Outstanding
Balances
(in ` Crore)
1 Savings Bank 133501670 42959.01 165968186 46847.59 163030431 55082.35 186199854 78235.86 199451789 86304.96947
2 Recurring Deposit 110599553 74150.81 122938104 74515.26 122189563 76181.88 122703759 84455.58 121403354 92322.96919
3 Time Deposit 14246320 40712.20 16238903 51755.12 16749513 70632.28 16669195 79655.46 18742881 99289.07165
4 NSS 87 274928 3898.98 263518 3718.31 249211 3526.38 262249 3330.05 250909 3166.29
5 NSS 92 56941 250.50 56656 205.99 55790 94.99 22876.00 -72.99 21958 -67.55
6 C.T.D. 269446 6.68 181634 6.69 177867 8.27 208302 8.14 202034 -38.37706697
7 M.I.S. 22017179 202083.60 21073808 200555.35 19543130 193805.89 16680673 180063.61 15376218 181688.0564
8 P.P.F. 2411817 46607.65 2424984 52747.56 2456944 57603.51 2465767 63361.91 2530301 69985.6
9 Fixed Deposit 516 24.20 516 24.2 681 24.19 388 24.24 402 19.76389908
10 Sr. Citizen 1067752 22491.36 954177 17974.64 1036568 22876.07 1123387 29453.39 1420143 41717.68855
11 MGNREGS* 62689394 0.00 64884602 0 64785984 0 41644179 0 27399080 0
12 MSY 2000651 3.10 1847916 2.98 1810521 2.92 457608 2.9 141295 1.51
13 SSA N/A N/A 2486005 521.69 7968318 6425.94 9919137 13824.29 11698945 22904.84479
14 Total ( 1 to 13) 349136167 433188.09 399319009 448875.38 400054521 486264.67 398357374 532342.44 398639309 597294.84
15 N.S.C. VIII 75075.89 85597.59 88128.35 87228.37 87165.57
16 K.V.P. 106757.57 84844.47 64861.05 53574.82 37983.29
17 Total (14+15) 181833.46 170442.06 152989.4 140803.19 125148.86
349136167 615021.55 399319009 619317.44 400054521 639254.07 398357374 673145.63 398639309 722443.70
AGENCY SERVICES - SAVINGS BANK INCLUDING CERTIFICATES
TABLE 39
* Including both MGNREGS (with Balance) and MGNREGA (Zero Balance)
Note: Figures of this Tble are provisional and subject to change.
SchemeS.
No.
Grand Total (14+17)
2013-14 2014-15 2015-16
Source : Book Section
2016-17 2017-18

(in Number)
Cash Transfer Cash Transfer
Andhra Pradesh 33932158 2798460 111616 1177337 155411 35509486
Assam 5619770 147683 3458 6251 4244 5760416
Bihar17473347 1052008 134767 450260 696 18209166
Chhatisgarh 205886 7536 20357 45403 70728 117648
Delhi 1060322 89355 20402 19758 103365 1046956
Gujarat 8895019 434137 158478 54089 1954776 7478769
Haryana 2813935 150073 2195 146582 71 2819550
Himachal Pradesh 2229390 291650 15 21105 -2 2499952
Jammu & Kashmir 1147481 37363 34 8074 0 1176804
Jharkhand 9900331 648518 48825 48559 825213 9723902
Karnataka 7287833 671383 22245 247624 160 7733677
Kerala 8552661 1149346 340567 315744 1453965 8272865
Madhya Pradesh 12181009 358939 1111677 96609 1137891 12417125
Maharashtra 1422571 131482 29818 3605 53324 1526942
North Eastern 7480992 348894 1343403 35206 479964 8658119
Orissa 3357758 267307 209738 288213 710935 2835655
Punjab 13216970 307625 566498 153086 2002224 11935783
Rajasthan 11630224 7679657 72005 37156 2702689 16642041
Tamil Nadu 15977487 919470 1046881 156822 1903461 15883555
Uttar Pradesh 14068394 610215 787906 93204 63613 15309698
Uttarankhand 3006404 86651 19568 4333 33159 3075131
West Bengal 6907083 198431 1022 48617 16706 7041213
Base P.O. 3681239 118666 475 22662 382 3777336
Total 192048264 18504849 6051950 3480299 13672975 199451789
Source : Book - II Section
TABLE 40
NUMBER OF ACCOUNTS UNDER POST OFFICE SAVINGS BANK BUSINESS DURING 2017-
18
CircleOpening
Balance
No. of Accounts
Opened by
No. of Accounts
Closed by Closing
Balance of
Accounts

CircleOpening
BalanceCredits Debits Closing Balance
Andhra Pradesh 2245.99 17301.39 18262.64 1284.74
Assam 2122.63 4686.15 4168.81 2639.97
Bihar 4295.53 14454.72 13788.14 4962.11
Chhatisgarh 180.12 380.48 441.46 119.14
Delhi 2889.29 7396.15 7069.80 3215.65
Gujarat 5304.33 18918.13 18594.40 5628.07
Haryana 2061.92 6853.20 6571.45 2343.67
Himachal Pradesh 2018.23 5384.18 4932.52 2469.89
Jammu & Kashmir 701.15 3575.96 3499.61 777.50
Jharkhand 3376.27 11233.61 14744.42 -134.53
Karnataka 1869.80 7039.09 6354.38 2554.51
Kerala 5790.28 18671.93 17201.58 7260.63
Madhya Pradesh 4991.77 7160.31 6501.44 5650.64
Maharashtra 838.30 1963.98 1785.61 1016.67
North Eastern 2706.57 7519.77 7031.28 3195.06
Orissa 3588.88 13602.05 13182.33 4008.59
Punjab 3036.89 7922.50 7655.01 3304.38
Rajasthan 4868.31 14990.27 12079.47 7779.11
Tamil Nadu 10965.09 31645.68 30878.24 11732.52
Uttar Pradesh 11151.03 43409.40 41860.18 12700.25
Uttarakhand 1218.58 2969.49 2824.85 1363.22
West Bengal -39.28 5015.24 4893.69 82.27
Base P.O. 2054.16 4682.40 4385.65 2350.91
Total 78235.86 256776.09 248706.97 86304.98
TABLE 41
OUTSTANDING BALANCE UNDER POST OFFICE SAVINGS BANK BUSINESS
DURING 2017-18
(in ` Crore)
Source : Book Section

Number Amount
(in ` Crore)Number
Amount
(in ` Crore)
Andhra Pradesh 0 1700.53 5371940 1145.35
Assam 161443 837.14 637293 723.05
Bihar 492192 2903.67 3030314 2572.70
Chhatisgarh 0 1519.54 946295 1255.98
Delhi 686512 4266.79 5420674 3872.31
Gujarat 0 992.66 908893 687.35
Haryana 61303 556.37 504198 333.00
Himachal Pradesh 109708 693.86 637707 504.09
Jammu & Kashmir 218539 1315.31 1164920 889.76
Jharkhand 93136 490.06 406568 282.63
Karnataka 558168 3532.99 4339348 3347.49
Kerala 183667 1016.69 2551597 1244.70
Madhya Pradesh 45579 310.21 222975 201.17
Maharashtra 203278 1513.86 1146497 894.74
North Eastern 0 1867.58 2665957 1627.54
Orissa 139200 925.09 919551 742.87
Punjab 166878 1223.37 993589 805.93
Rajasthan 1239229 8198.25 9947297 6657.25
Tamil Nadu 1424817 8994.49 9548313 7059.26
Uttar Pradesh 43797 -1263.78 314691 290.40
Uttarakhand 27149 1396.16 109896 1037.15
West Bengal 88678 617.95 891957 -309.15
Base P.O. 26 0.79 3756 2.91
Total 5943299 43690.59 52684226 35868.45
Source : Book Section
TABLE 42
Circle
ISSUED DISCHARGED
NUMBER AND AMOUNT ISSUED AND DISCHARGED UNDER
SAVING CERTIFICATES DURING 2017-18

(in Number)
CircleSavings
Bank
Recurring
Deposit
Monthly
Income
Scheme
Senior
Citizen
Time
Deposit
Public
Provident
Fund
Fixed
Deposit
National
Saving
Scheme
87
National
Saving
Scheme
92
Cumulative
Time
Deposits
Sukanya
Samridhi
Yojana
Mahila
Samridhi
Yojana
Total
Andhra Pradesh 22950171 12811125 477270 35840 709642 48105 0 3571 1169 0 596398 0 37633291
Assam 5760416 2151700 351415 6275 230084 43847 0 2184 309 1084 192861 0 8740175
Bihar 18209166 4460985 1445311 28591 2491512 53623 0 2299 202 688 479895 0 27172272
Chhatisgarh 1046956 569953 392631 75062 201195 217143 2 22046 929 7824 163853 0 2697594
Delhi 7478767 5650957 1280300 144965 1858500 203779 0 27028 211 5673 309120 0 16959300
Gujarat 2819446 1612103 336424 29387 837291 95707 0 10620 280 83879 265960 129679 6220776
Haryana 2499952 2114317 159074 8123 461513 27727 22 1275 80 4615 185510 0 5462208
Himachal Pradesh 1176804 223558 58254 2432 232802 8714 0 1413 44 5676 118668 0 1828365
Jammu & Kashmir 9723902 4835128 355111 119084 340319 115037 3 13169 2093 8294 1125971 0 16638111
Jharkhand 7733677 4747996 330439 28450 364363 23100 298 4984 2039 164 392467 0 13627977
Karnataka 8272865 16833032 1212561 188493 1156498 482268 0 63887 2067 15428 937812 0 29164911
Kerala 12417125 10471571 411624 35572 709310 58849 59 5894 386 10533 522125 0 24643048
Madhya Pradesh 1526942 705637 48226 4745 66726 6094 4 778 102 1447 72924 0 2433625
Maharashtra 8658119 4965363 348700 26468 594499 24314 14 4340 291 9103 417595 0 15048806
North-East 2835655 1867922 406442 58392 853436 164431 0 9692 576 1270 302998 0 6500814
Orissa 11935783 4192982 470681 43592 516293 201671 0 6609 534 3164 567590 0 17938899
Punjab 16642041 12222406 497685 151872 1477277 250118 0 15008 5119 6023 1511169 0 32778718
Rajasthan 15883555 15456681 1239452 60166 1934651 194310 0 13874 3401 23916 1252616 0 36062622
Tamilnadu 15309698 4844370 4661691 271344 2581116 144877 0 29229 0 0 696315 0 28538640
Uttar Pradesh 3075131 751997 76419 9636 90978 28668 0 1332 125 1303 349399 0 4384988
Uttarakhand 7041213 3772002 428666 25277 561018 40755 0 3437 0 2118 522872 0 12397358
West Bengal 3777336 1628709 139377 14766 324718 36266 0 2332 206 9741 286495 0 6219946
Telangana 117754 355389 22250 808 2641 18214 0 315 26 91 36100 0 553588
Base P.O. 12559315 4157471 226215 50803 146499 42684 0 5593 1769 0 392232 11616 17594197
Total 199451789 121403354 15376218 1420143 18742881 2530301 402 250909 21958 202034 11698945 141295 371240229
TABLE 43
Source: Book Section
NUMBER OF ACCOUNTS OF SAVINGS SCHEMES AS ON 31.03.2018

CircleSavings
Bank
Recurring
Deposit
Time
Deposit
Monthly
Income
Scheme
Senior
Citizen
National
Saving
Scheme 87
& 92
Cumulative
Time
Deposits
Fixed
Deposit
Sukanya
Samriddhi
Yojana
Public
Provident
Fund
Mahila
Samriddhi
Yojana
Total
Andhra Pradesh -953.85 55.57 632.00 15.12 470.57 -7.74 0.00 0.00 466.58 79.20 0.00 757.45
Assam 3215.65 2934.66 3705.70 6009.71 3292.97 231.22 -1.41 -1.25 628.22 11612.60 0.00 31628.08
Bihar 12700.25 5807.78 18243.71 45767.67 5629.56 -164.85 5.78 22.78 862.94 3934.41 0.00 92810.04
Chhatisgarh 2238.59 4189.67 4593.53 9431.22 2303.91 75.54 0.28 0.44 1994.87 1890.85 0.76 26719.65
Delhi 11732.51 12249.61 12490.67 16387.60 1677.87 97.97 -1.97 -1.87 2396.11 5200.56 0.00 62229.06
Gujarat 7779.11 5576.14 4124.07 9911.40 4012.00 243.39 -0.04 0.00 3111.83 3898.05 0.00 38655.95
Haryana 119.14 293.69 243.24 327.84 63.65 8.87 0.04 0.00 83.65 114.78 0.00 1254.89
Himachal Pradesh 4962.11 4361.22 8268.94 7253.94 216.49 1161.00 1.21 -0.06 635.12 992.29 0.00 27852.24
Jammu & Kashmir 2343.67 4007.03 3175.71 3264.82 1169.08 60.35 -5.54 0.00 1001.49 2706.84 0.00 17723.46
Jharkhand -134.53 4704.46 2323.92 5562.98 4428.06 210.57 2.23 -0.01 3039.21 4066.15 0.00 24203.05
Karnataka 5650.64 5048.76 1960.33 3723.04 1046.56 -2.54 -0.98 -0.25 657.09 1503.80 0.00 19586.43
Kerala 3195.06 3592.61 2625.98 3418.52 721.39 2.32 0.00 0.09 690.88 488.18 0.00 14735.02
Madhya Pradesh 3304.38 5791.31 3484.34 5235.58 1218.87 -43.82 1.19 0.00 844.36 4683.47 0.00 24519.69
Maharashtra 4008.59 4468.80 7142.34 5863.82 2011.91 186.84 -23.75 0.00 765.83 7662.84 0.00 32087.22
North-East 2639.97 2237.01 959.29 3161.38 271.43 -1.59 -22.55 0.00 235.83 789.17 0.34 10270.28
Orissa 2554.51 8103.52 914.94 2320.15 1176.40 44.07 -0.13 0.01 928.04 739.38 0.00 16780.88
Punjab 5628.07 2275.44 9093.34 13446.14 4302.50 -95.07 4.24 -0.12 593.81 7447.32 0.00 42695.69
Rajasthan 2469.89 3782.31 1755.60 2784.75 412.36 12.51 0.51 0.00 413.86 1193.87 0.00 12825.67
Tamilnadu 777.50 672.85 1610.69 834.30 204.78 -7.23 3.29 0.00 229.67 229.63 0.13 4555.60
Uttar Pradesh 7260.63 4622.55 6029.31 25972.51 5120.38 1103.61 0.87 -0.01 1998.55 8707.86 0.00 60816.25
Uttarakhand 1016.67 1310.54 681.14 1110.79 163.86 5.09 0.10 0.01 94.89 152.36 0.28 4535.72
West Bengal 1363.22 2338.48 1035.69 1761.96 513.32 34.93 -3.50 0.00 253.59 715.15 0.00 8012.83
Telangana 82.27 992.16 2359.83 5396.90 714.60 -28.05 1.77 0.00 462.14 258.48 0.00 10240.10
Base P.O. 2350.91 2906.79 1834.79 2725.90 575.17 -28.63 -0.01 0.00 516.31 918.36 0.00 11799.59
Total 86304.97 92322.97 99289.07 181688.06 41717.69 3098.74 -38.38 19.76 22904.84 69985.60 1.51 597294.84
TABLE 44
OUTSTANDING BALANCE OF SAVINGS SCHEMES (CIRCLE-WISE) AS AT 31.03.2018
Source : Book Section
(in ` Crore)

(in ` Crore))
Circle
Remuneration
on Savings
Bank including
PPF
Remuneration on
Savings Certificates
including IVP
Total
Remuneration
Andhra Pradesh 761.06 36.63 797.69
Assam 178.69 5.45 184.14
Bihar 555.84 24.02 579.86
Chhattisgarh 56.91 6.45 63.36
Delhi 349.62 41.64 391.25
Gujarat 126.45 6.20 132.65
Haryana 110.46 3.86 114.31
Himachal Pradesh 37.57 5.10 42.67
Jammu & Kashmir 355.04 9.43 364.47
Jharkhand 275.97 3.40 279.38
Karnataka 597.05 33.39 630.44
Kerala 472.59 18.65 491.24
Madhya Pradesh 50.17 1.83 52.00
Maharashtra 308.06 9.20 317.27
North-East 136.03 18.18 154.20
Orissa 367.91 7.22 375.12
Punjab 685.55 7.89 693.44
Rajasthan 751.78 76.27 828.05
Tamilnadu 584.00 74.81 658.81
Uttar Pradesh 173.57 2.44 176.02
Uttarakhand 254.57 0.93 255.50
West Bengal 130.86 6.69 137.54
Base 11.98 0.03 12.00
Telangana 355.90 25.33 381.23
Total 7687.63 425.01 8112.64
Source: Book Section
REMUNERATION FOR SAVING BANK/SAVINGS CERTIFICATE
WORK FOR 2017-18
TABLE 45

No. of live
Accounts
(in Lakh)
Rate of
Remuneration
(in `)
Total
Remuneration
(in ` Crore)
Total
Receipt
(Gross
Collection)
(in ` Crore)
Total
Payments
(in ` Crore)
Total amount
handled
(in ` Crore)
Total Net
Collection
(in ` Crore)
Total
Remuneration
as Percentage of
Gross Collection
Total
Remuneration
as Percentage of
Total Net
Collection
Total
Remuneration
as Percentage of
Total Amount
Handled
(A1) (A2)(A3) =
[(A1) x (A2)]/100(A4) (A5)
(A6) =
[(A4) + (A5)]
(A7) =
[(A4) - (A5)]
(B1) =
[(A3)/(A4) x 100)]
(B2) =
[(A3)/(A7) x 100)]
(B3) =
[(A3)/(A6) x 100)]
2013-14 3096.56 175.46 5433.22 186957.46 163851.76 350809.22 23105.70 2.91 114.10 1.56
*152.42 *26.61 *40.56
3303.35 190.37 6288.59 224434.63 208745.54 433180.17 15689.09 2.80 107.52 1.45
*196.27 *28.87 *56.66
3469.58 205.59 7133.11 328506.61 291118.84 619625.45 37387.77 2.17 112.84 1.15
*185.14 *31.17 *57.71
3562.56 191.68 6828.72 398351.49 352329.50 750680.99 46021.99 1.71 14.84 0.91
*239.94 *31.14 *74.72
3740.96 202.22 7564.97 444956.40 379999.30 824955.70 64957.10 1.70 11.65 0.92
*373.39 *32.85 *122.66
* Figures are related to Silent Accounts.
Source : Book Section
TABLE 46
Year
REMUNERATION (COMMISSION) ON ACCOUNT OF SAVINGS BANKS
2015-16
2014-15
2016-17
2017-18

No. of
Certificates
(in Lakh)
Rate of
Remuneration
(in `)
Total
Remuneration
(in ` Crore)
Total
Receipt
(Gross
Collection)
(in ` Crore)
Total
Payments
(in ` Crore)
Total amount
handled
(in ` Crore)
Total Net
Collection
(in ` Crore)
As Percentage
of Gross
Collection
As Percentage
of Net Collection
As Percentage
of Total Amount
Handled
(C1) (C2)(C3) =
[(C1) x (C2)]/100(C4) (C5)
(C6) =
[(C4) + (C5)]
(C7) =
[(C4) - (C5)]
(D1) =
[(C3)/(C4) x 100)]
(D2) =
[(C3)/(C7) x 100)]
(D3) =
[(C3)/(C6) x 100)]
2013-14 *59.95 441.49 20576.24 28205.08 48781.32 -7628.84 0.02 -5.79 0.91
**15.88
*65.05 464.01 23381.44 28229.18 51610.62 -4847.74 0.02 -9.57 0.90
**17.23
*70.25 593.06 39798.78 28967.04 68765.82 10831.74 0.01 5.48 0.86
**18.6
64.63 269.69 29006.18 24313.08 53319.26 4693.10 0.93 5.75 0.51
17.13
68.18 425.00 43609.59 35857.92 79467.51 7751.67 0.97 5.48 0.53
18.07
* Rate for NSC & KVP
** Rate for IVP
TABLE 47
REMUNERATION (COMMISSION) ON ACCOUNT OF SAVINGS CERTIFICATES
Year
713.462014-15
736.66
Source: Book Section
2015-16 844.32
2016-17
2017-18
417.36
623.42

INSURANCE

2014-15
over
2013-14
2015-16
over
2014-15
2016-17
over
2015-16
2017-18
over
2016-17
PLI Fund upto the year (in ` Crore)
32716.26 39536.33 46302.72 53688.44 61367.47 20.85 17.11 15.95 14.3
No. of Policies* upto the year 5406093 5242257 4930838 4680013 4359855 -3.03 -5.94 -5.09 -6.84
Value of Business upto the year (in
` Crore)102276.1 109106.9 109982.09 113084.81 116499.4 6.68 0.80 2.82 3.02
Premium during the year (in ` Crore)
5350.69 5963.45 6657.03 7233.89 7519.65 11.45 11.63 8.67 3.95
Expenses during the year (` Crore) 407.67 410.91 386.49 398.87 444.96 0.79 -5.94 3.2 11.56
Expenses Ratio (%) to Premium
Income (New Business)7.64 6.89 5.81 5.52 5.92 -9.82 -15.67 -0.29 0.4
No. of Policies Issued during the
year433182 324022 198606 213323 243654 -25.20 -38.71 7.41 14.22
Sum Assured during the year (in ` Crore)
16129.39 14276.92 9644.97 11096.68 13305.73 -11.49 -32.44 15.05 19.91
Average sum Assured per Policy
(in ` lakh)3.72 4.41 4.86 5.2 5.46 18.55 10.20 7 4.98
* Active Policies
2013-14 2015-162014-15
Source: PLI Directorate
2017-18
TABLE 48
POSTAL LIFE INSURANCE
Analysis: Amount of yearly premium under PLI shows an increasing trend and it increased from ` 5350.69 crore in 2013-14 to ` 7519.65
crore in 2017-18. Average sum assured per policy under PLI shows an increasing trend, which increased from ` 3.72 lakh in 2013-14 to `
5.46 lakh in 2017-18.
%age Growth
Item 2016-17
0
1000
2000
3000
4000
5000
6000
2013-14
2014-15
2015-16
2016-17
2017-18
5406.0
93
5242.2
57
4930.8
38
4680.0
13
4359.8
55
(in
Th
ou
san
d)
YEAR
NUMBER OF ACTIVE POLICIES UNDER PLI
5350.69
5963.45 6657.03
7233.89
7519.65
5000
5500
6000
6500
7000
7500
8000
2013-14 2014-15 2015-16 2016-17 2017-18
In C
rore
PREMIUM DURING THE YEAR


2014-15
over
2013-14
2015-16
over
2014-15
2016-17
over
2015-16
2017-18
over
2016-17
RPLI Fund upto the year
(in ` Crore)13352.01 15320.37 18113.78 20510.91 22835.38 14.74 18.23 13.23 11.33
Number of Policies* upto
the year 15014314 15245387 14915652 14684096 13661694 1.54 -2.16 -1.55 -6.96
Value of Business upto
the year (in ` Crore)79466.45 82822.26 81733.73 83983.47 8081139.00 4.22 -1.31 2.75 -3.78
Premium during the year
(in ` Crore)1960.24 1983.32 2012.17 2120.02 2184.52 1.18 1.45 5.36 3.04
Expenses during the
year (in ` Crore)275.92 334.81 273.05 272.32 279.43 21.34 -18.45 -0.27 2.61
Expenses Ratio (%) to
Premium Income14.13 16.89 13.59 12.86 12.80 19.53 -19.54 -0.73 0.06
No. of Policies Issued
during the year871462 477360 258225 375134 523899 -45.22 -45.91 45.27 39.66
Sum Assured during the
year (in ` Crore)6712.39 4652.35 2668.9 6850.46 7298.29 -30.69 -42.63 156.68 6.54
Average sum Assured
per Policy (in ` lakh)0.77 0.97 1.03 1.83 1.39 25.97 6.19 77.67 -24.04
* Active Policies
TABLE 49
RURAL POSTAL LIFE INSURANCE
% Growth during
New Business
2013-14 2014-15 2016-17 2017-182015-16Item
Analysis: Amount of yearly premium under RPLI shows an increasing trend and it increased from ` 1960.24 crore in 2013-14 to
` 2184.52 crore in 2017-18. Average sum assured per policy under RPLI shows an increasing trend, which increased from ` 0.77
lakhs in 2013-14 to ` 1.39 lakhs in 2017-18.
Source: PLI Directorate
0
2000
4000
6000
8000
10000
12000
14000
16000
2013-14 2014-15 2015-16 2016-17 2017-18
15014.3
15
24
5.4
14915.7
14
68
4.1
13
66
1.7
(in
Th
ou
san
d)
YEAR
NUMBER OF ACTIVE POLICIES UNDER RURAL POSTAL LIFE INSURANCE
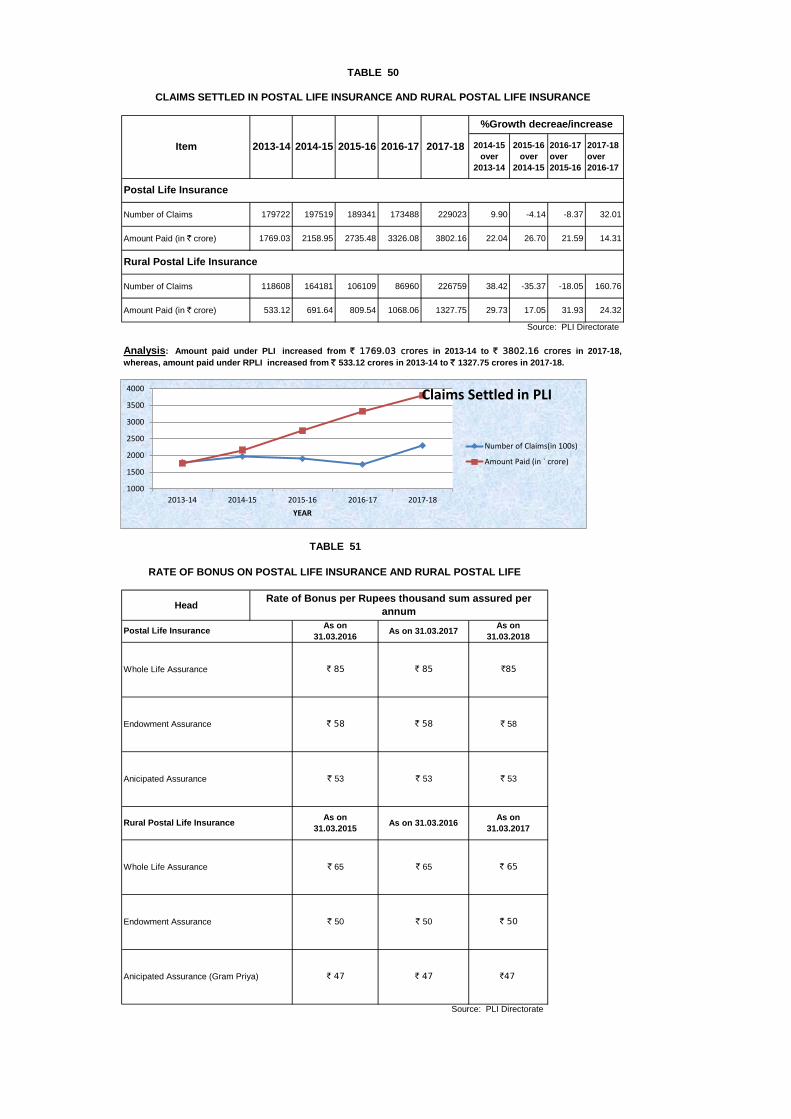
2014-15
over
2013-14
2015-16
over
2014-15
2016-17
over
2015-16
2017-18
over
2016-17
Number of Claims 179722 197519 189341 173488 229023 9.90 -4.14 -8.37 32.01
Amount Paid (in ` crore) 1769.03 2158.95 2735.48 3326.08 3802.16 22.04 26.70 21.59 14.31
Number of Claims 118608 164181 106109 86960 226759 38.42 -35.37 -18.05 160.76
Amount Paid (in ` crore) 533.12 691.64 809.54 1068.06 1327.75 29.73 17.05 31.93 24.32
Head
Endowment Assurance
Anicipated Assurance
Whole Life Assurance
As on 31.03.2017
Endowment Assurance
Postal Life Insurance
Whole Life Assurance
As on
31.03.2016
Source: PLI Directorate
` 53
` 65
` 50
` 47
As on 31.03.2016
` 53
` 65
Rural Postal Life Insurance
Anicipated Assurance (Gram Priya)
` 53
` 50
` 47
As on
31.03.2015
As on
31.03.2017
` 50
%Growth decreae/increase
`47
` 65
` 58
`85
` 58
` 85
` 58
` 85
CLAIMS SETTLED IN POSTAL LIFE INSURANCE AND RURAL POSTAL LIFE INSURANCE
TABLE 50
2016-17
As on
31.03.2018
Rural Postal Life Insurance
Source: PLI Directorate
RATE OF BONUS ON POSTAL LIFE INSURANCE AND RURAL POSTAL LIFE
TABLE 51
Analysis: Amount paid under PLI increased from ` 1769.03 crores in 2013-14 to ` 3802.16 crores in 2017-18,
whereas, amount paid under RPLI increased from ` 533.12 crores in 2013-14 to ` 1327.75 crores in 2017-18.
Item 2013-14 2014-15 2015-16
Rate of Bonus per Rupees thousand sum assured per
annum
Postal Life Insurance
2017-18
1000
1500
2000
2500
3000
3500
4000
2013-14 2014-15 2015-16 2016-17 2017-18
YEAR
Claims Settled in PLI
Number of Claims(in 100s)
Amount Paid (in ` crore)

POSTAL NETWORK
ANDTECHNOLOGY

(in Number)
Andhra Pradesh 59 1018 288 230 1536 1595 0 8895 8895 10490
Assam 19 391 118 97 606 625 0 3387 3387 4012
Bihar 32 464 340 224 1028 1060 0 8024 8024 9084
Chhatisgarh 11 194 80 66 340 351 0 2836 2836 3187
Delhi 12 151 89 155 395 407 0 147 147 554
Gujarat 33 440 377 455 1272 1305 0 7643 7643 8948
Haryana 16 209 162 119 490 506 0 2187 2187 2693
Himachal Pradesh 18 216 141 95 452 470 0 2322 2322 2792
Jammu & Kashmir 9 161 55 42 258 267 0 1432 1432 1699
Jharkhand 13 260 104 88 452 465 0 2995 2995 3460
Karnataka 58 819 429 406 1654 1712 0 7951 7951 9663
Kerala 52 455 581 421 1457 1509 0 3555 3555 5064
Madhya Pradesh 43 547 238 192 977 1020 0 7260 7260 8280
Maharashtra 61 876 474 805 2155 2216 0 10654 10654 12870
North - East 9 221 58 52 331 340 0 2579 2579 2919
Odisha 35 748 243 180 1171 1206 1 7008 7009 8215
Punjab 22 264 284 200 748 770 0 3100 3100 3870
Rajasthan 47 714 347 225 1286 1333 0 8978 8978 10311
Tamil Nadu 94 1363 665 712 2740 2834 0 9304 9304 12138
Telangana 36 560 120 127 807 843 0 4968 4968 5811
Uttarakhand 13 179 100 102 381 394 0 2329 2329 2723
Uttar Pradesh 72 1131 794 562 2487 2559 0 15112 15112 17671
West Bengal 47 651 522 549 1722 1769 0 7308 7308 9077
Total 811 12032 6609 6104 24745 25556 1 129974 129975 155531
Analysis: Out of 155531 Post Offices as on 31.03.2018, only 16.4% are Departmental Post Offices, and remaining are GDS Post Offices.
Out of 25556 Departmental Post Offices as 31.03.2018, only 3.2% are Head Post Offices, and remaining are Sub-Post Offices.
Circle
Departmental GDS
SOs
HPOs Single
Handed
Double
Handed
DISTRIBUTION OF POST OFFICES AS ON 31.03.2018
TABLE 52
More than
Two
Handed
Source: Planning Division
Total
number
of Post
Offices
SOs BOs TotalTotal
SOs
Total
Departmental
Post offices

YEAR
2013-14
2014-15
2015-16
2016-17
2017-18
139182
139222
138955
139067
139882
15700 15717 15955 15898 15649
0
10000
20000
30000
40000
50000
60000
70000
80000
90000
100000
110000
120000
130000
140000
150000
160000
170000
2013-14 2014-15 2015-16 2016-17 2017-18
Nu
mb
er
YEAR
NUMBER OF POST OFFICES
RURAL URBAN

(in Number)
Rural Urban Total Rural Urban Total Rural Urban Total Rural Urban Total Rural Urban Total Rural Urban Total Rural Urban Total
Andhra Pradesh 5 54 59 953 583 1536 958 637 1595 0 0 0 8749 146 8895 8749 146 8895 9707 783 10490
Assam 0 19 19 398 208 606 398 227 625 0 0 0 3338 49 3387 3338 49 3387 3736 276 4012
Bihar 1 31 32 645 383 1028 646 414 1060 0 0 0 7979 45 8024 7979 45 8024 8625 459 9084
Chhatisgarh 0 11 11 90 250 340 90 261 351 0 0 0 2808 28 2836 2808 28 2836 2898 289 3187
Delhi 0 12 12 5 390 395 5 402 407 0 0 0 78 69 147 78 69 147 83 471 554
Gujarat 0 33 33 646 626 1272 646 659 1305 0 0 0 7521 122 7643 7521 122 7643 8167 781 8948
Haryana 0 16 16 179 311 490 179 327 506 0 0 0 2139 48 2187 2139 48 2187 2318 375 2693
Himachal Pradesh 3 15 18 348 104 452 351 119 470 0 0 0 2310 12 2322 2310 12 2322 2661 131 2792
Jammu & Kashmir 0 9 9 89 169 258 89 178 267 0 0 0 1406 26 1432 1406 26 1432 1495 204 1699
Jharkhand 0 13 13 232 220 452 232 233 465 0 0 0 2958 37 2995 2958 37 2995 3190 270 3460
Karnataka 0 58 58 845 809 1654 845 867 1712 0 0 0 7779 172 7951 7779 172 7951 8624 1039 9663
Kerala 4 48 52 965 492 1457 969 540 1509 0 0 0 3212 343 3555 3212 343 3555 4181 883 5064
Madhya Pradesh 0 43 43 327 650 977 327 693 1020 0 0 0 7146 114 7260 7146 114 7260 7473 807 8280
Maharashtra 1 60 61 1026 1129 2155 1027 1189 2216 0 0 0 10557 97 10654 10557 97 10654 11584 1286 12870
North - East 0 9 9 190 141 331 190 150 340 0 0 0 2476 103 2579 2476 103 2579 2666 253 2919
Orissa 0 35 35 665 506 1171 665 541 1206 1 0 1 6949 59 7008 6950 59 7009 7615 600 8215
Punjab 0 22 22 332 416 748 332 438 770 0 0 0 3085 15 3100 3085 15 3100 3417 453 3870
Rajasthan 1 46 47 727 559 1286 728 605 1333 0 0 0 8951 27 8978 8951 27 8978 9679 632 10311
Tamil Nadu 1 93 94 1336 1404 2740 1337 1497 2834 0 0 0 8946 358 9304 8946 358 9304 10283 1855 12138
Telangana 2 34 36 423 384 807 425 418 843 0 0 0 4855 113 4968 4855 113 4968 5280 531 5811
Uttar Pradesh 0 72 72 901 1586 2487 901 1658 2559 0 0 0 14846 266 15112 14846 266 15112 15747 1924 17671
Uttarakhand 0 13 13 197 184 381 197 197 394 0 0 0 2316 13 2329 2316 13 2329 2513 210 2723
West Bengal 0 47 47 783 939 1722 783 986 1769 0 0 0 7157 151 7308 7157 151 7308 7940 1137 9077
Total 18 793 811 12302 12443 24745 12320 13236 25556 1 0 1 127561 2413 129974 127562 2413 129975 139882 15649 155531
Source: Planning Division
Head Post Office
Departmental Post Office
Total Sub Post Office Branch Post OfficeTotal Post Office
TABLE 53
DISTRIBUTION OF RURAL AND URBAN POST OFFICES AS ON 31.03.2018
CircleSub Post Office Total
Gramin Dak Sewak Post Office

(in Number)
Rural Urban Total Rural Urban Total Rural Urban Total Rural Urban Total Rural Urban Total Rural Urban Total Rural Urban Total
As on 31.03.2014 16 794 810 12186 12497 24683 12202 13291 25493 1 0 1 126979 2409 129388 126980 2409 129389 139182 15700 154882
As on 31.03.2015 16 794 810 12220 12530 24750 12236 13324 25560 1 0 1 126985 2393 129378 126986 2393 129379 139222 15717 154939
As on 31.03.2016 16 795 811 12162 12591 24753 12178 13386 25564 1 0 1 126776 2569 129345 126777 2569 129346 138955 15955 154910
As on 31.03.2017 17 793 810 12171 12604 24775 12188 13397 25585 1 0 1 126878 2501 129379 126879 2501 129380 139067 15898 154965
As on 31.03.2018 18 793 811 12302 12443 24745 12320 13236 25556 1 0 1 127561 2413 129974 127562 2413 129975 139882 15649 155531
Source: Planning Division
TABLE 54
YEAR-WISE DISTRIBUTION OF RURAL AND URBAN POST OFFICES
Circle
Departmental Post Office Gramin Dak Sewak Post OfficeTotal Post Office
Head Post Office Sub Post Office Total Sub Post Office Branch Post Office Total

(in Number)
4 3 2 1
times
a day
times
a day
times a
day
times a
day
Andhra Pradesh 10490 23 9984 506 9984 0 0 37 9947
Assam 4012 1 624 120 3891 0 0 0 3891
Bihar 9084 6 1058 239 8845 0 0 32 8813
Chhatisgarh 3187 2 349 87 3100 0 0 4 3096
Delhi 554 7 407 312 242 0 0 0 242
Gujarat 8948 9 6586 284 8652 0 0 2 8650
Haryana 2693 2 312 194 2499 0 0 0 2499
Himachal Pradesh 2792 0 2753 39 2753 0 0 0 2753
Jammu & Kashmir 1699 1 267 78 1627 0 0 9 1618
Jharkhand 3460 2 463 104 2995 0 0 13 2982
Karnataka 9663 1 7686 533 9130 0 0 134 8996
Kerala 5064 6 4802 262 4802 0 0 5 4797
Madhya Pradesh 8280 5 8280 297 7983 0 0 28 7955
Maharashtra 12870 8 8762 664 12204 0 0 81 12123
North - East 2919 1 498 41 2875 0 0 2 2873
Orissa 8215 4 1206 292 7923 0 0 0 7923
Punjab 3870 4 548 229 3641 0 0 1 3640
Rajasthan 10311 5 9964 347 9964 0 0 19 9945
Tamilnadu 12138 15 12138 1298 10840 0 0 113 10727
Telangana 5811 8 843 226 5585 0 2 21 5562
Uttar Pradesh 17671 12 2559 1069 16602 0 0 17 16585
Uttarakhand 2723 0 2723 104 2619 0 0 0 2619
West Bengal 9077 6 1132 865 8212 0 0 33 8179
Total 155531 128 83944 8190 146968 0 2 551 146415
TABLE 55
CLASSIFIED FUNCTION-WISE DISTRIBUTION OF POST OFFICES AS ON 31.03.2018
Circle
Night
Post
Offices
Analysis: As on 31.03.2018, throughout the country, there are 128 Night Post Offices, 83944 Post Offices with full range of services,
8190 Post Offices without delivery and 146968 Delivery Post Offices.
POs with
full range
of
services
POs
without
delivery
Delivery
Post
Offices
POs Making deliveries
Source: Postal Circles
Total Post Office

56
10 86
99
13
45
6
92
74
35
02
9
77
77 1
07
47
26
80
85
86 11
00
8
70
22
72
54 10
00
3
98
28
52
64
56
11 81
85
76
25
67
21
41
96
12
88
7
11
16
3
500
5500
10500
15500
20500
25500
30500
35500
40500
45500
Average number of Population served by a Post Office

CircleArea
(in sq. km.)
Population
as on 31.03.2018*
(in Lakh)
Number of Post
Offices #
(as on 31.03.2018)
Average number
of Population
served by a Post
Office
Average Area
served by a
Post Office
(in sq. km.)
Andhra Pradesh 275045 914.46 16301 5610 16.87
Assam 78438 349.01 4012 8699 19.55
Bihar 94163 1222.38 9084 13456 10.37
Chhatisgarh 135191 295.55 3187 9274 42.42
Delhi 1483 194.06 554 35029 2.68
Gujarat 196627 695.86 8948 7777 21.97
Haryana 44212 289.42 2693 10747 16.42
Himachal Pradesh 55673 74.83 2792 2680 19.94
Jammu & Kashmir 222236 145.87 1699 8586 130.80
Jharkhand 79714 380.88 3460 11008 23.04
Karnataka 191791 678.53 9663 7022 19.85
Kerala 38895 367.32 5064 7254 7.68
Madhya Pradesh 308245 828.21 8280 10003 37.23
Maharashtra 311415 1264.84 12870 9828 24.20
North-East 176657 153.65 2919 5264 60.52
Orissa 155707 460.93 8215 5611 18.95
Punjab 50476 316.76 3870 8185 13.04
Rajasthan 342239 786.21 10311 7625 33.19
Tamil Nadu 130537 815.82 12138 6721 10.75
Uttarakhand 53483 114.25 2723 4196 19.64
Uttar Pradesh 240928 2277.28 17671 12887 13.63
West Bengal 104097 1013.23 9077 11163 11.47
Total 3287263 13639.35 155531 8770 21.14
(i) The shortfall of 7 square km. area of Madhya Pradesh and 3 square km. area of Chhattisgarh is yet to be resolved by the Survey of India.
( ii ) Disputed area of 13 square km. between Pondicherry and Andhra Pradesh is neither included in Pondicherry nor in Andhra Pradesh.
The area figures of States and U.T's do not add up to area of India because :
*Estimation of the total population as on 31.3.2018 of a State or Union Territory was carried out by applying the Average Annual
Exponential Growth Rate between the total population reported by Census 2001 and Census 2011 of that State or Union Territory.
Then, Circle-wise Estimations of Population was derived by adding the estimated population figures of the States and Union Territories
falling under jurisdiction of concerned Circles.
TABLE 56
AVERAGE POPULATION AND AVERAGE AREA SERVED BY A POST OFFICE IN COUNTRY
# Source: Planning Division
** Source: Office of Registrar General of India, Ministry of Home Affairs

Circle
Rural Population
as on 31.03.2018 *
(in Lakh)
Number of Rural
Post Offices #
(as on 31.03.2018)
Average number of
Population served by a
Post Office in Rural Area
Andhra Pradesh 564.31 14987 3765
Assam 296.65 3736 7940
Bihar 1076.62 8625 12483
Chhatisgarh 219.5 2898 7574
Delhi 0.35 83 422
Gujarat 367.96 8167 4505
Haryana 174.61 2318 7533
Himachal Pradesh 67.2 2661 2525
Jammu & Kashmir 103.09 1495 6896
Jharkhand 284.12 3190 8907
Karnataka 391.64 8624 4541
Kerala 112.89 4181 2700
Madhya Pradesh 592.23 7473 7925
Maharashtra 662.99 11584 5723
North-East 102.15 2666 3832
Orissa 378 7615 4964
Punjab 182.21 3417 5332
Rajasthan 582.02 9679 6013
Tamil Nadu 391.77 10283 3810
Uttarakhand 75.56 2513 3007
Uttar Pradesh 1744.9 15747 11081
West Bengal 658.76 7940 8297
Total 9029.53 139882 6455
*Estimation of population as on 31.3.2018 was carried out by applying the Average Annual Exponential Growth
Rate between the population reported by Census 2001 and Census 2011. The estimation of the population was
carried out for Urban and total population of a State or an Union Territory and then estimation of rural
population of that State or Union Territory was derived by substracting urban estimated population from total
estimated population. Finally, Circle-wise Estimations of Population was derived by adding the estimated
population figures of the States and Union Territories falling under jurisdiction of concerned Circles.
TABLE 57
AVERAGE POPULATION SERVED BY A POST OFFICE IN RURAL AREA
# Source: Planning Division

Circle
Urban Population
as on 31.03.2018*
(in lakh )
Number of Urban
Post Offices #
(as on 31.03.2018)
Average number
Population served by a
Post Office in Urban Area
Andhra Pradesh 350.15 1314 26648
Assam 52.36 276 18971
Bihar 145.76 459 31756
Chhatisgarh 76.05 289 26315
Delhi 193.71 471 41127
Gujarat 327.9 781 41985
Haryana 114.81 375 30616
Himachal Pradesh 7.63 131 5824
Jammu & Kashmir 42.78 204 20971
Jharkhand 96.76 270 35837
Karnataka 286.89 1039 27612
Kerala 254.43 883 28814
Madhya Pradesh 235.98 807 29242
Maharashtra 601.85 1286 46800
North-East 51.5 253 20356
Orissa 82.93 600 13822
Punjab 134.55 453 29702
Rajasthan 204.19 632 32309
Tamil Nadu 424.05 1855 22860
Uttarakhand 38.69 210 18424
Uttar Pradesh 532.38 1924 27670
West Bengal 354.47 1137 31176
Total 4609.82 15649 29458
*Estimation of the urban population as on 31.3.2018 of a State or Union Territory was carried out by applying the
Average Annual Exponential Growth Rate between the urban population reported by Census 2001 and Census 2011
of that State or Union Territory. Then, Circle-wise Estimations of urban population was derived by adding the
estimated urban population figures of the States and Union Territories falling under jurisdiction of concerned
Circles.
# Source: Planning Division
TABLE 58
AVERAGE POPULATION SERVED BY A POST OFFICE IN URBAN AREA

2014-15
over
2013-14
2015-16
over
2014-15
2016-17
over
2015-16
2017-18
over
2016-17
Andhra Pradesh 38 32 18 16 12 -15.79 -43.75 -11.11 -25.00
Assam 69 40 25 23 23 -42.03 -37.50 -8.00 0.00
Bihar 1073 1073 679 647 647 0.00 -36.72 -4.71 0.00
Chhatisgarh 37 34 34 29 2 -8.11 0.00 -14.71 -93.10
Delhi 0 0 0 0 0 - - - -
Gujarat 4 4 4 4 4 0.00 0.00 0.00 0.00
Haryana 41 35 33 31 25 -14.63 -5.71 -6.06 -19.35
Himachal Pradesh 57 52 47 41 40 -8.77 -9.62 -12.77 -2.44
Jammu & Kashmir 21 21 20 20 20 0.00 -4.76 0.00 0.00
Jharkhand 88 88 88 82 79 0.00 0.00 -6.82 -3.66
Karnataka 4 4 4 4 4 0.00 0.00 0.00 0.00
Kerala 0 0 0 0 0 - - - -
Madhya Pradesh 155 136 132 111 102 -12.26 -2.94 -15.91 -8.11
Maharashtra 81 74 69 58 59 -8.64 -6.76 -15.94 1.72
North Eastern 18 18 18 18 18 0.00 0.00 0.00 0.00
Orissa 106 110 109 101 86 3.77 -0.91 -7.34 -14.85
Punjab 7 7 6 2 3 0.00 -14.29 -66.67 50.00
Rajasthan 22 21 19 13 3 -4.55 -9.52 -31.58 -76.92
Tamil Nadu 39 34 33 25 20 -12.82 -2.94 -24.24 -20.00
Telangana 0 0 11 5 4 - - -54.55 -20.00
Uttar Pradesh 889 827 794 780 722 -6.97 -3.99 -1.76 -7.44
Uttarkhand 42 42 37 33 33 0.00 -11.90 -10.81 0.00
West Bengal 4 6 6 6 6 50.00 0.00 0.00 0.00
Total 2795 2658 2186 2049 1912 -4.90 -17.76 -6.27 -6.69
PANCHAYAT SANCHAR SEWA KENDRAS
(AS ON 31st
MARCH)
TABLE 59
Source : Planning Division
2013-14 2014-15 2015-16
(in Number)
Circle 2016-17 2017-18
%age decrease/increase
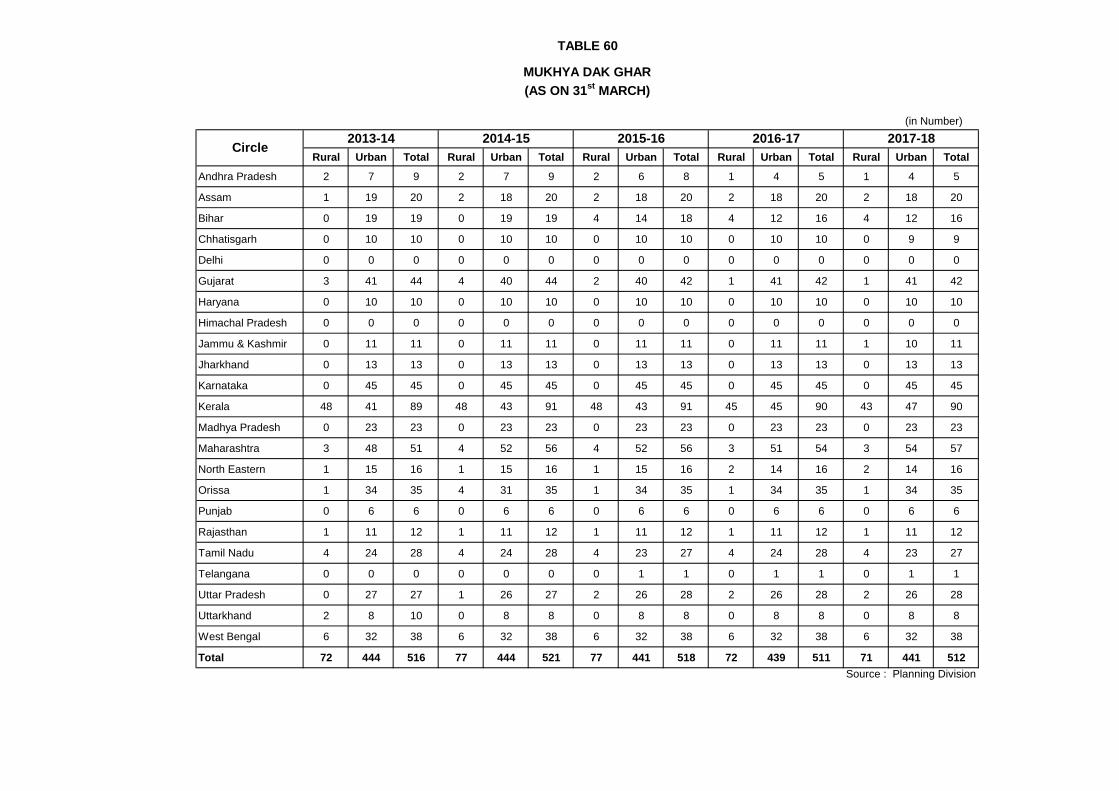
Rural Urban Total Rural Urban Total Rural Urban Total Rural Urban Total Rural Urban Total
Andhra Pradesh 2 7 9 2 7 9 2 6 8 1 4 5 1 4 5
Assam 1 19 20 2 18 20 2 18 20 2 18 20 2 18 20
Bihar 0 19 19 0 19 19 4 14 18 4 12 16 4 12 16
Chhatisgarh 0 10 10 0 10 10 0 10 10 0 10 10 0 9 9
Delhi 0 0 0 0 0 0 0 0 0 0 0 0 0 0 0
Gujarat 3 41 44 4 40 44 2 40 42 1 41 42 1 41 42
Haryana 0 10 10 0 10 10 0 10 10 0 10 10 0 10 10
Himachal Pradesh 0 0 0 0 0 0 0 0 0 0 0 0 0 0 0
Jammu & Kashmir 0 11 11 0 11 11 0 11 11 0 11 11 1 10 11
Jharkhand 0 13 13 0 13 13 0 13 13 0 13 13 0 13 13
Karnataka 0 45 45 0 45 45 0 45 45 0 45 45 0 45 45
Kerala 48 41 89 48 43 91 48 43 91 45 45 90 43 47 90
Madhya Pradesh 0 23 23 0 23 23 0 23 23 0 23 23 0 23 23
Maharashtra 3 48 51 4 52 56 4 52 56 3 51 54 3 54 57
North Eastern 1 15 16 1 15 16 1 15 16 2 14 16 2 14 16
Orissa 1 34 35 4 31 35 1 34 35 1 34 35 1 34 35
Punjab 0 6 6 0 6 6 0 6 6 0 6 6 0 6 6
Rajasthan 1 11 12 1 11 12 1 11 12 1 11 12 1 11 12
Tamil Nadu 4 24 28 4 24 28 4 23 27 4 24 28 4 23 27
Telangana 0 0 0 0 0 0 0 1 1 0 1 1 0 1 1
Uttar Pradesh 0 27 27 1 26 27 2 26 28 2 26 28 2 26 28
Uttarkhand 2 8 10 0 8 8 0 8 8 0 8 8 0 8 8
West Bengal 6 32 38 6 32 38 6 32 38 6 32 38 6 32 38
Total 72 444 516 77 444 521 77 441 518 72 439 511 71 441 512
TABLE 60
MUKHYA DAK GHAR
(AS ON 31st
MARCH)
2016-17 2017-182013-14
(in Number)
2015-16Circle
2014-15
Source : Planning Division


(in Number)
Andhra Pradesh 91 9 4 0
Assam 19 5 2 0
Bihar 149 3 4 0
Chhatisgarh 23 4 1 0
Delhi 194 0 1 1
Gujarat 44 13 4 0
Haryana 86 3 4 0
Himachal Pradesh 14 4 2 0
Jammu & Kashmir 21 0 2 0
Jharkhand 444 3 3 0
Karnataka 26 6 7 0
Kerala 0 3 5 0
Madhya Pradesh 82 9 4 0
Maharashtra 137 17 5 0
North Eastern 46 0 6 0
Orissa 99 7 3 0
Punjab 58 4 4 0
Rajasthan 70 10 3 0
Tamil Nadu 100 12 7 0
Telangana 54 4 2 0
Uttar Pradesh 274 18 10 0
Uttarkhand 62 6 1 0
West Bengal 38 10 4 1
A.P.S. 0 2 2 0
Total 2131 152 90 2
Source : Planning Division and Mail Management
Circle
TABLE 61
FRANCHISE OUTLETS, INTRA CIRCLE HUBS, SORTING HUBS AND AUTOMATED
MAIL PROCESSING CENTRES
(AS ON 31st
MARCH, 2018)
Franchise
Outlets
Intra Circle
Hubs
National
Sorting Hubs
Automated Mail
Processing Centres

(in Number)
Urban Rural Total
Andhra Pradesh 4233 24846 29079 533 54 1
Assam 1123 11370 12493 814 5 0
Bihar 3111 19472 22583 876 81 255
Chhatisgarh 2991 12219 15210 127 2 0
Delhi 1115 61 1176 495 20 7
Gujarat 4381 19764 24145 4592 71 186
Haryana 1250 5403 6653 378 0 0
Himachal Pradesh 685 5822 6507 207 2 0
Jammu & Kashmir 580 3755 4335 1717 96 0
Jharkhand 1028 8533 9561 301 2 0
Karnataka 5922 23951 29873 6166 39 60
Kerala 3463 11315 14778 4728 263 139
Madhya Pradesh 4287 34122 38409 442 116 2
Maharashtra 8242 36468 44710 6404 211 82
North - East 1098 4565 5663 3438 7 0
Orissa 2491 16909 19400 91 0 0
Punjab 2705 12044 14749 663 2 4
Rajasthan 3613 23690 27303 1360 30 0
Tamil Nadu 9427 30587 40014 3903 497 41
Telangana 2699 11580 14279 366 81 88
Uttarakhand 1794 9689 11483 442 26 14
Uttar Pradesh 6785 45224 52009 699 18 31
West Bengal 4416 22615 27031 4459 181 31
Total 77439 394004 471443 43201 1804 941
Source: Planning Division/Postal Circles
TABLE 62
LETTER BOXES, POST BOXES AND POST BAGS
(AS ON 31.03.2018)
Post
Boxes
cum Bags
rented to
public
Circle
Letter Boxes Post
Boxes
rented to
public
Post
Bags
rented to
public

(in Number)
CirclePostal
Divisions
RMS
Divisions
Postal
Store
Depots
Circle
Stamp
Depots
RMS
Sorting
Offices
RMS
Record
Offices
Andhra Pradesh 28 4 3 0 14 15
Assam 9 2 1 1 11 13
Bihar 22 4 2 1 17 17
Chhatisgarh 5 1 1 0 4 4
Delhi 6 3 1 1 9 3
Gujarat 26 3 3 1 19 19
Haryana 9 2 1 0 12 12
Himachal Pradesh 9 1 1 0 8 6
Jammu & Kashmir 6 1 1 1 2 2
Jharkhand 7 2 1 0 10 10
Karnataka 31 3 3 1 28 25
Kerala 24 3 3 1 25 21
Madhya Pradesh 20 3 1 1 10 11
Maharashtra 41 7 4 1 47 33
North Eastern 7 0 1 0 0 0
Orissa 18 3 2 1 19 20
Punjab 13 2 1 1 9 10
Rajasthan 24 3 3 1 16 18
Tamil Nadu 45 6 5 1 42 37
Telangana 16 2 1 1 13 9
Uttar Pradesh 44 7 4 2 41 37
Uttarkhand 7 1 1 0 3 3
West Bengal 29 6 2 1 26 26
Total 446 69 46 17 385 351
Source : PE-I Section and D (Mails)-Section
TABLE 63
POSTAL AND RMS FUNCTIONAL UNITS AS ON 31.03.2018

(in Number)
As on As on As on As on As on
31.03.2014 31.03.2015 31.03.2016 31.03.2017 31.03.2018
Postal Circles 22 22 22 23 23
Postal Regions 47 47 47 51 54
Postal Divisions 446 446 446 446 446
RMS Divisions 69 69 69 69 69
Postal Store Depots 46 46 46 46 46
Circle Stamp Depots 17 17 17 17 17
National Postal Academy (RANKPA) 1 1 1 1 1
Postal Training Centres 6 6 6 6 6
P & T Dispensaries 33 33 33 33 33
RMS Sorting Offices 421 411 429 391 385
RMS Record Offices 328 352 343 353 351
Offices & Units
Source: PE-I Section and D-Section
TABLE 64
ADMINISTRATIVE OFFICES AND FUNCTIONAL UNITS

(in Number)
Urban Rural Urban Rural Urban Rural Urban Rural Urban Rural Total
2013-14 19 0 217 390 0 0 136 3252 372 3642 4014
2014-15 19 0 211 396 0 0 135 3251 365 3647 4012
2015-16 19 0 221 385 0 0 141 3246 381 3631 4012
2016-17 19 0 221 385 0 0 141 3246 381 3631 4012
2017-18 19 0 208 398 0 0 49 3338 276 3736 4012
2013-14 1 0 24 24 0 0 4 248 29 272 301
2014-15 1 0 24 24 0 0 4 249 29 273 302
2015-16 1 0 26 22 0 0 4 248 31 270 301
2016-17 1 0 27 22 0 0 4 248 32 270 302
2017-18 1 0 22 27 0 0 6 246 29 273 302
2013-14 1 0 26 29 0 0 20 622 47 651 698
2014-15 1 0 26 29 0 0 21 623 48 652 700
2015-16 1 0 26 29 0 0 21 625 48 654 702
2016-17 1 0 27 28 0 0 11 634 39 662 701
2017-18 1 0 29 26 0 0 27 618 57 644 701
2013-14 2 0 27 37 0 0 1 424 30 461 491
2014-15 2 0 26 39 0 0 1 424 29 463 492
2015-16 2 0 28 38 0 0 2 421 32 459 491
2016-17 2 0 28 38 0 0 1 422 31 460 491
2017-18 2 0 23 43 0 0 1 422 26 465 491
2013-14 1 0 15 23 0 0 23 327 39 350 389
2014-15 1 0 15 23 0 0 23 327 39 350 389
2015-16 1 0 15 23 0 0 23 327 39 350 389
2016-17 1 0 15 23 0 0 23 327 39 350 389
2017-18 1 0 16 22 0 0 18 327 35 349 384
2013-14 1 0 16 25 0 0 9 277 35 302 337
2014-15 1 0 16 25 0 0 9 278 26 303 329
2015-16 1 0 18 23 0 0 12 276 31 299 330
2016-17 1 0 18 24 0 0 12 276 31 300 331
2017-18 1 0 16 26 0 0 11 276 28 302 330
2013-14 3 0 30 47 0 0 24 604 57 651 708
2014-15 3 0 30 49 0 0 24 602 57 651 708
2015-16 3 0 29 51 0 0 24 603 56 654 710
2016-17 3 0 31 50 0 0 23 604 57 654 711
2017-18 3 0 35 46 0 0 40 587 78 633 711
2013-14 1 0 11 11 0 0 0 186 12 197 209
2014-15 1 0 11 11 0 0 0 186 12 197 209
2015-16 1 0 11 11 0 0 0 186 12 197 209
2016-17 1 0 11 11 0 0 0 186 12 197 209
2017-18 1 0 11 11 0 0 0 186 12 197 209
2013-14 29 0 366 586 0 0 217 5940 612 6526 7138
2014-15 29 0 359 596 0 0 217 5940 605 6536 7141
2015-16 29 0 374 582 0 0 227 5932 630 6514 7144
2016-17 29 0 378 581 0 0 215 5943 622 6524 7146
2017-18 29 0 360 599 0 0 152 6000 541 6599 7140
TABLE 65
YearHead Office Sub Offices
Assam
Grand TotalName of
the State
GDS SO GDS BO
Meghalaya
Mizoram
Nagaland
Source: Planning Division
POSTAL NETWORK OF NORTH-EASTERN REGION AT A GLANCE
Arunachal
Pradesh
Total
Tripura
Sikkim
Manipur

2013-14 2014-15 2015-16 2016-17 2017-18
2014-15
over 2013-
14
2015-16
over
2014-15
2016-17
over
2015-16
2017-18
over
2016-17
Andhra Pradesh 2344 2344 1593 1595 1595 0.00 -32.04 0.13 0.00
Assam 632 632 625 625 624 0.00 -1.11 0.00 -0.16
Bihar 1043 1043 1055 1055 1060 0.00 1.15 0.00 0.47
Chhatisgarh 343 343 348 349 351 0.00 1.46 0.29 0.57
Delhi 393 393 407 407 397 0.00 3.56 0.00 -2.46
Gujarat 1329 1329 1344 1344 1270 0.00 1.13 0.00 -5.51
Haryana 490 490 501 504 506 0.00 2.24 0.60 0.40
Himachal Pradesh 462 462 468 469 470 0.00 1.30 0.21 0.21
Jammu & Kashmir 252 252 262 262 263 0.00 3.97 0.00 0.38
Jharkhand 455 455 459 463 465 0.00 0.88 0.87 0.43
Karnataka 1683 1683 1712 1714 1709 0.00 1.72 0.12 -0.29
Kerala 1508 1508 1508 1508 1509 0.00 0.00 0.00 0.07
Madhya Pradesh 1075 1075 1027 1021 1020 0.00 -4.47 -0.58 -0.10
Maharashtra 2220 2220 2217 2215 2214 0.00 -0.14 -0.09 -0.05
North Eastern 378 378 336 337 340 0.00 -11.11 0.30 0.89
Orissa 1192 1192 1201 1205 1206 0.00 0.76 0.33 0.08
Punjab 771 771 766 768 770 0.00 -0.65 0.26 0.26
Rajasthan 1334 1334 1340 1335 1333 0.00 0.45 -0.37 -0.15
Tamil Nadu 2578 2578 2607 2610 2607 0.00 1.12 0.12 -0.11
Telangana N/A N/A 850 850 842 N/A N/A 0.00 -0.94
Uttar Pradesh 2540 2540 2548 2553 2553 0.00 0.31 0.20 0.00
Uttarakhand 383 383 391 392 394 0.00 2.09 0.26 0.51
West Bengal 1740 1740 1766 1767 1769 0.00 1.49 0.06 0.11
Total 25145 25145 25331 25348 25267 0.00 0.74 0.07 -0.32
TABLE 66
COMPUTERISATION OF POST OFFICES
(upto 31st
March)
*Decrease in no. of Computerized Post Offices is due to closure/merger of Post Offices
Circle
%age decrease/increaseNumber of Post Offices Computerized
Sources: Technology Division

HUMAN RESOURCES

(in Number)
A B A BIndian Postal Service 407 407 359 359
Postal Service 684 684 611 611
Assistant Suprintendent 1614 1614 1651 1651
P & T Accts & Fin. Service 78 385 463 70 328 398
Central Sectt. Service 42 60 102 37 53 90
Civil Wing 28 158 186 34 154 188
Other General Central Service 64 47 111 71 36 107
Total 619 2948 3567 571 2833 3404
Group 'B' Non Gazetted 5628 5715
excluding
MTSMTS
excluding
MTSMTS
1. Postal Directorate 112 105 217 111 99 210
2. Post Offices including Circle Office,
Accounts, Stamp Depot, Canteen Staff. 130119 17599 147718 128263 17249 145512
3. Railway Mail Service 14131 9151 23282 13983 8812 22795
4. Mail Motor Service 1232 239 1471 1202 227 1429
5. Others( RLO, Disp., Store, Trg., Civil,
Printing Press)1437 1097 2534 1385 1027 2412
Total 147031 28191 175222 144944 27414 172358
Gramin Dak Sewaks 249000 237341
424222 409699
433417 418818
As on Group A Group B
Group B
(Non-
Gazetted)
Group C
excluding
MTS
Group C
MTS Total
31.03.2017 77 310 981 30001 3590 34959
TABLE 67
STAFF : ACTUAL STRENGTH
(INCLUDING THOSE ON DEPUTATION & TRAINING)
Gazetted and Non-Gazetted Group 'B'
GroupTotal Total
Group
Non-Gazetted Group 'C' and Gramin Dak Sewaks
DEPARTMENTAL
As on 31.03.2017 As on 31.03.2018
As on 31.03.2017
Category
As on 31.03.2018
Total (Non-Gazetted excluding Group 'B' Non Gazetted)
(GroupC+MTS+GDS)
Group 'C' Group 'C'
Total
Source: Staff Sections of Directorate/Postal Circles
Women Employees
Departmental
Grand Total (Departmental+GDS)
Total

Service Number of Staff Strength
Secretary (Posts), D.G Posts & Chairman, Postal Services Bord 1
Member, Postal Services Board 7
Senior Deputy Director General/Chief Postmaster General 27
Senior Administrative Grade 71
Junior Administrative Grade 52
Senior Time Scale 82
Junior Time Scale 102
Training Reserves (Probationers) 17
Postal Service Group 'B' 611
Assistant Suprintendent 1651
Senior Administrative Grade 13
Junior Administrative Grade 10
Senior Time Scale 20
Junior Time Scale 27
Senior Accounts Officer/Accounts Officer 196
Asstt. Accounts Officer 132
Director 4
Sr. Time Scale 16
Jr. Analyst 0
Section Officer 27
Sr. Principal Private Secretary 1
Principal Private Secretary 16
Private Secretary 26
Desk Officer 0
Chief Engineer 0
Group 'A' 34
Group 'B' 154
Other General Central Services 107
Total 3404
Source: Postal Circles/Directorate
TABLE 68
ACTUAL STAFF STRENGTH AS ON 31.03.2018 (GAZETTED)
(INCLUDING THOSE ON DEPUTATION & TRAINING OUTSIDE THE DEPARTMENT)
Indian Postal Service 'A'
Indian P & T Accounts and Finance Service
Central Secretariat Service
Civil Wing

Group 'B' (Non-Gazetted) Number of Staff Strength
1. Inspector of Post Offices
A. Complaints 200
B. Planning/RC 33
C. Speed Post 11
D. Business Development 9
E. RMS 136
F.Others 1015
2. Office Superintendent 49
3. HSG-I 712
4. HSG-II 849
5. Steno. Grade-I 170
6. Manager HSG-I 269
7. Jr. Accounts Officer 295
8. Others 1753
9. Directorate staff 214
Total 5715
Group 'C' excluding MTS Number of Staff Strength
1. LSG 7121
2. Potal Asstt. (Entry) 38836
3. Postal Asstt.(MACP-III) 11316
4. Postal Asstt. (MACP-II) 15145
5. Postal Asstt. (MACP-I) 12059
6. Sports Coach 5
7. Mail Oversear 2776
8. Cash Oversear 578
9. Head Postmen 411
10. Sorting Postmen 1518
11. Oversear Postmen 195
12. Postmen (Entry) 19537
13. Postmen (MACP-III) 3847
14. Postmen (MACP-II) 5395
15. Postmen (MACP-I) 5284
16. Sorting Compiler 391
17. Platform Inspector 4
18. Head Mail Guard 46
19. Mail Guard 820
20. Sorting Assistant (Entry) 5977
21. Sorting Assistant (MACP-III) 1925
22. Sorting Assistant (MACP-II) 2704
23. Sorting Assistant (MACP-I) 1602
24. PO & RMS Accountant 1196
25. PO & RMS Assistant Accountant 176
26 Assistant Manager 6
27. Store Officer 6
28. Technical Supervisor 10
29. Inspector of MMS & Head Clerk 4
30. Stenographer 251
31. Clerk including LSG/Office Asstt. 306
32. Driver Special Grade 59
33. Driver Grade III 292
34. Driver Grade-II 200
35. Driver Grade-I 317
36. Office Superintendent 4
37. Head Clerk 21
38. Junior Engineer 121
39. Draftsman 4
40. Driver 144
41. Architectural Asstt. 1
TABLE 69
ACTUAL NON-GAZETTED STAFF STREGNTH OF IMPORTANT CATEGORIES
AS ON 31.03.2018-CONTD.

Group 'C' excluding MTS Number of Staff Strength
42. Sr. Accountant 656
43. Junior Accountant 635
44. LDC 438
45. Sorter 11
46. Lab Technician 8
47. Medical Storekeeper 35
48. Office Assistant 769
49. Pharmacist 24
50. Nurse (Staff+Auxiliary) 10
51. Nursing Orderly 10
52. Nursing Midwife 6
53. Others 1621
54. Directorate 111
55. Total 144944
Group "C" MTS Number of Staff Strength
1. Packer (Entry) 1435
2. Packer (MACP-III) 210
3. Packer (MACP-II) 394
4. Packer (MACP-I) 341
5. Mail Peon (MACP-III) 391
6. Mail Peon (MACP-II) 220
7. Mail Peon (MACP-I) 160
8. Letter Box Peon (Entry) 132
9. Letter Box Peon (MACP-III) 35
10. Letter Box Peon (MACP-II) 37
11. Letter Box Peon (MACP-I) 57
12. Messenger 8
13. Orderly 108
14. Daftry (Entry) 7
15. Daftry( MACP-III) 8
16. Daftry( MACP-II) 6
17. Daftry( MACP-I) 6
18. Peon (Entry) 67
19. Peon (MACP-III) 9
20. Peon (MACP-II) 30
21. Peon (MACP-I) 23
22. Sweeper 201
23. Farash 70
24. Watermen 61
25. Chowkidar 419
26. Jamadar 135
27. Mailmen (Entry) 2175
28. Mailmen (MACP-III) 903
29. Mailmen (MACP-II) 1325
30. Mailmen (MACP-I) 718
31. Van Peon (Attendent) 194
32. Attendent in Rest House 28
33. Semi-skilled Tradesmen 23
34. Clelaner 71
35. Office Peon 91
36. Gatemen 27
37. Sewermen 74
38. Female Attendent 12
39. Group 'MTS' (Entry) 9394
40. Group 'MTS' (MACP-III) 1756
41. Group 'MTS' ( MACP-II) 3144
42. Group 'MTS' ( MACP-I) 2196
43. Others Group 'MTS' 614
44. Dirctorate 99
45. Total 27414
TABLE 69
ACTUAL NON-GAZETTED STAFF STREGNTH OF IMPORTANT CATEGORIES
AS ON 31.03.2018 -CONCD.
Source: Postal Circles

(in Number)
Andhra Pradesh 221 6881 902 8004 15637 23641
Assam 103 2880 691 3674 7741 11415
Bihar 326 5905 1414 7645 15027 22672
Chhatisgarh 76 1484 293 1853 4601 6454
Delhi 300 4762 1623 6685 140 6825
Gujarat 281 9519 1997 11797 13186 24983
Haryana 132 2700 631 3463 3734 7197
Himachal Pradesh 54 1785 349 2188 6089 8277
Jammu & Kashmir 57 896 220 1173 2447 3620
Jharkhand 54 2220 459 2733 6220 8953
Karnataka 255 10303 1420 11978 13841 25819
Kerala 120 8090 1153 9363 10033 19396
Madhya Pradesh 251 5346 891 6488 11511 17999
Maharashtra 260 18071 3725 22056 18893 40949
North Eastern 44 1103 192 1339 6188 7527
Orissa 534 5086 651 6271 13021 19292
Punjab 162 4398 1011 5571 5517 11088
Rajasthan 250 6021 1131 7402 12548 19950
Tamil nadu 613 15759 2449 18821 19638 38459
Telangana 234 4176 694 5104 8263 13367
Uttar Pradesh 479 13465 2658 16602 22951 39553
Uttarakhand 46 1583 294 1923 5383 7306
West Bengal 649 12400 2467 15516 14732 30248
Directorate 214 111 99 424 N/A 424
Total 5715 144944 27414 178073 237341 415414
Source: Postal Circles
Gramin
Dak
Sewaks
TABLE 70
CircleB
C
excluding MTS
NON-GAZETTED ACTUAL STAFF STATISTICS AS ON 31.03.2018
(GROUP-WISE & CIRCLE-WISE)
Group
TotalGrand
Total C
MTS

(in Number)
Gr.'A' Gr.'B'Gr.'B'
(NG)
Gr.'C'
excluding
MTS
Gr.'C'
MTSGr. 'A' Gr.'B'
Gr.'B'
(NG)
Gr.'C'
excluding
MTS
Gr.'C'
MTSGr.'A' Gr.'B'
Gr.'B'
(NG)
Gr.'C'
excluding
MTS
Gr.'C'
MTS
Andhra Pradesh 0 4 107 2574 241 0 0 37 3774 254 0 4 144 6348 495 6991
Assam 0 1 14 776 125 0 0 2 1424 152 0 1 16 2200 277 2494
Bihar 1 6 24 1263 122 0 0 7 2169 331 1 6 31 3432 453 3923
Chhatisgarh 0 4 19 336 64 0 0 4 743 113 0 4 23 1079 177 1283
Delhi 2 13 40 1251 301 3 15 50 2170 538 5 28 90 3421 839 4383
Gujarat 2 33 36 2349 435 0 4 16 6412 1150 2 37 52 8761 1585 10437
Haryana 0 3 20 869 148 0 0 7 1442 231 0 3 27 2311 379 2720
Himachal Pradesh 1 6 20 522 118 0 2 11 987 129 1 8 31 1509 247 1796
Jammu & Kashmir 3 15 48 350 52 0 0 1 420 124 3 15 49 770 176 1013
Jharkhand 1 6 8 684 48 0 3 0 882 163 1 9 8 1566 211 1795
Karnataka 4 6 88 2829 383 1 0 44 5960 521 5 6 132 8789 904 9836
Kerala 0 4 36 1655 305 0 0 6 5328 388 0 4 42 6983 693 7722
Madhya Pradesh 0 4 36 1933 299 0 0 9 2820 279 0 4 45 4753 578 5380
Maharashtra 1 45 55 4160 864 0 0 41 11297 1432 1 45 96 15457 2296 17895
North Eastern 0 2 1 483 72 0 0 0 870 137 0 2 1 1353 209 1565
Orissa 0 5 118 1236 235 0 0 130 2133 243 0 5 248 3369 478 4100
Punjab 0 6 15 1075 203 0 0 25 2737 532 0 6 40 3812 735 4593
Rajasthan 0 5 222 1822 297 0 0 183 3563 609 0 5 405 5385 906 6701
Tamilnadu 2 51 134 4497 567 0 0 62 8986 616 2 51 196 13483 1183 14915
Teangana 5 31 163 1200 195 0 2 11 2135 189 5 33 174 3335 384 3931
Uttar Pradesh 2 19 209 4159 713 0 0 22 5983 804 2 19 231 10142 1517 11911
Uttarakhand 0 1 9 570 86 0 0 13 913 162 0 1 22 1483 248 1754
West Bengal 0 16 12 3501 512 0 0 77 6200 815 0 16 89 9701 1327 11133
Total 24 286 1434 40094 6385 4 26 758 79348 9912 28 312 2192 119442 16297 138271
N.G. : Non-Gazetted
Source: Staff Sections of the Directorate/Postal Circles
TABLE 71
DISTRIBUTION OF MANPOWER IN DIFFERENT CATEGORIES OF POST OFFICES AS ON 31.03.2018
Circle
Head Offices TotalSub Office
Grand
Total

(in Number)
Sub-
Postmaster
Branch
Postmaster
Deliverer
Stamp
VendorPackers
Carrier
ManTotal
Andhra Pradesh 129 7428 3678 33 1323 2463 583 15637
Assam 0 2779 3080 24 356 1502 0 7741
Bihar 0 7026 5136 56 307 2048 454 15027
Chhatisgarh 0 2347 666 12 117 1459 0 4601
Delhi 0 59 30 9 33 9 0 140
Gujarat 22 6502 4713 43 719 1049 138 13186
Haryana 0 1867 1025 9 319 512 2 3734
Himachal Pradesh 0 2149 2632 12 298 993 5 6089
Jammu & Kashmir 2 1242 434 12 43 547 167 2447
Jharkhand 0 2420 2291 26 148 1333 2 6220
Karnataka 0 6506 4578 30 1694 942 91 13841
Kerala 0 3108 5098 64 1102 617 44 10033
Madhya Pradesh 0 6161 2204 14 195 2890 47 11511
Maharashtra 0 9573 6760 34 1195 1315 16 18893
North Eastern 0 2190 1900 11 217 1870 0 6188
Orissa 1 5566 3860 191 821 2493 89 13021
Punjab 15 2609 1666 7 301 913 6 5517
Rajasthan 28 7370 2334 30 382 2396 8 12548
Tamil Nadu 0 8044 8336 85 2014 1031 128 19638
Telangana 0 4090 1426 10 410 2242 85 8263
Uttar Pradesh 0 9811 8707 162 1019 3234 18 22951
Uttaranchal 0 1895 2121 5 226 1136 0 5383
West Bengal 155 4750 5407 108 1075 3182 55 14732
Total 352 105492 78082 987 14314 36176 1938 237341
TABLE 72
Circle
Number of Gramin Dak Sevak
Source: Postal Circles
GRAMIN DAK SEVAK AS ON 31.03.2018
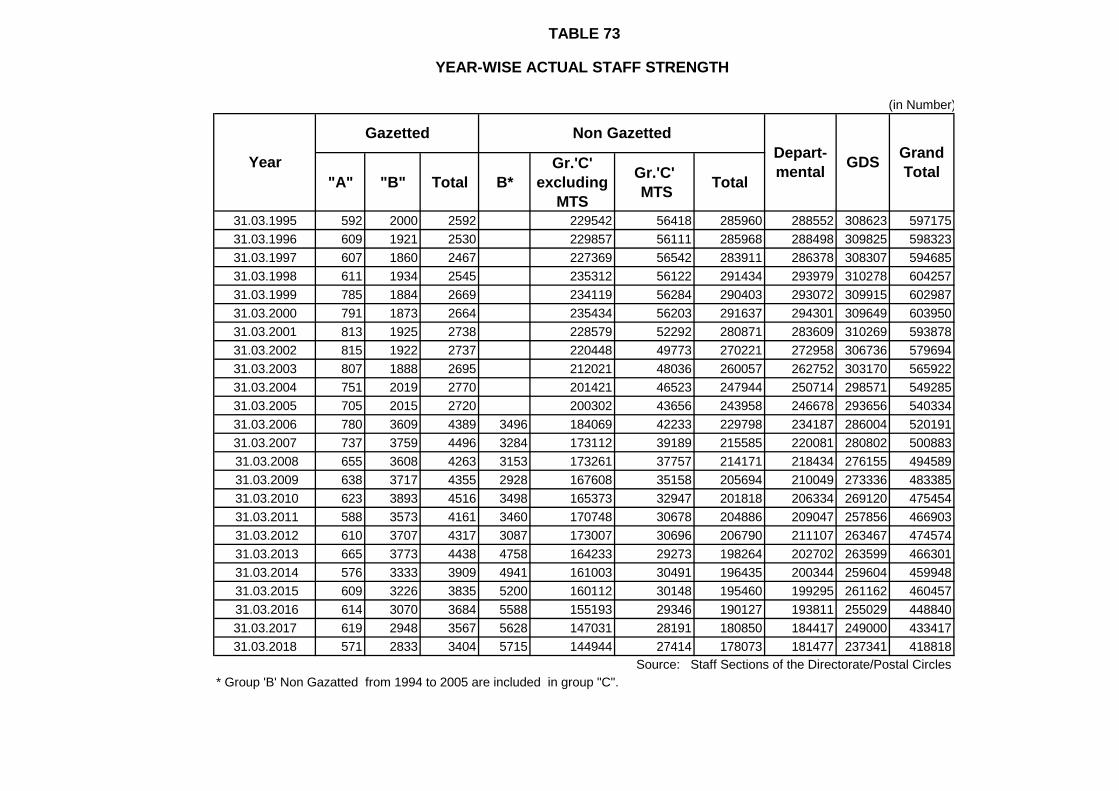
(in Number)
"A" "B" Total B*
Gr.'C'
excluding
MTS
Gr.'C'
MTSTotal
31.03.1995 592 2000 2592 229542 56418 285960 288552 308623 597175
31.03.1996 609 1921 2530 229857 56111 285968 288498 309825 598323
31.03.1997 607 1860 2467 227369 56542 283911 286378 308307 594685
31.03.1998 611 1934 2545 235312 56122 291434 293979 310278 604257
31.03.1999 785 1884 2669 234119 56284 290403 293072 309915 602987
31.03.2000 791 1873 2664 235434 56203 291637 294301 309649 603950
31.03.2001 813 1925 2738 228579 52292 280871 283609 310269 593878
31.03.2002 815 1922 2737 220448 49773 270221 272958 306736 579694
31.03.2003 807 1888 2695 212021 48036 260057 262752 303170 565922
31.03.2004 751 2019 2770 201421 46523 247944 250714 298571 549285
31.03.2005 705 2015 2720 200302 43656 243958 246678 293656 540334
31.03.2006 780 3609 4389 3496 184069 42233 229798 234187 286004 520191
31.03.2007 737 3759 4496 3284 173112 39189 215585 220081 280802 500883
31.03.2008 655 3608 4263 3153 173261 37757 214171 218434 276155 494589
31.03.2009 638 3717 4355 2928 167608 35158 205694 210049 273336 483385
31.03.2010 623 3893 4516 3498 165373 32947 201818 206334 269120 475454
31.03.2011 588 3573 4161 3460 170748 30678 204886 209047 257856 466903
31.03.2012 610 3707 4317 3087 173007 30696 206790 211107 263467 474574
31.03.2013 665 3773 4438 4758 164233 29273 198264 202702 263599 466301
31.03.2014 576 3333 3909 4941 161003 30491 196435 200344 259604 459948
31.03.2015 609 3226 3835 5200 160112 30148 195460 199295 261162 460457
31.03.2016 614 3070 3684 5588 155193 29346 190127 193811 255029 448840
31.03.2017 619 2948 3567 5628 147031 28191 180850 184417 249000 433417
31.03.2018 571 2833 3404 5715 144944 27414 178073 181477 237341 418818
* Group 'B' Non Gazatted from 1994 to 2005 are included in group "C".
TABLE 73
Source: Staff Sections of the Directorate/Postal Circles
Year
Gazetted
YEAR-WISE ACTUAL STAFF STRENGTH
Non Gazetted
Depart-
mentalGDS
Grand
Total

YEAR-WISE ACTUAL STAFF STRENGTH
Nu
mb
er
Year
29
85
71
29
36
56
28
60
04
28
08
02
27
61
55
27
33
36
26
91
20
25
78
56
26
34
67
26
35
99
25
96
04
26
11
62
25
50
29
24
90
00
23
73
41
24
79
44
24
39
58
22
97
98
21
55
85
21
41
71
20
56
94
20
18
18
20
48
86
20
67
90
19
82
64
19
64
35
19
54
60
19
01
27
18
08
50
17
80
73
27
70
27
20
43
89
44
96
42
63
43
55
45
16
41
61
43
17
44
38
39
09
38
35
36
84
35
67
34
04
0
100000
200000
300000
400000
500000
600000
2003-04 2004-05 2005-06 2006-07 2007-08 2008-09 2009-10 2010-11 2011-12 2012-13 2013-14 2014-15 2015-16 2016-17 2017-18
Extra-Departmental Departmental-Non-Gazetted Departmental…

2013-14 2014-15 2015-16 2016-17 2017-18
2014-15
over
2013-14
2015-16
over
2014-15
2016-17
over
2015-16
2017-18
over
2016-17
1 404 54 178 156 777 -86.63 -55.94 188.89 336.52
2 91 117 667 568 477 28.57 632.97 385.47 -28.49
3 236 851 1530 2973 1340 260.59 548.31 249.35 -12.42
4 20830 51098 56134 53371 72962 145.31 214.24 4.45 29.98
5 18818 10804 7083 11707 9938 -42.59 -62.36 8.36 40.31
6 26617 27549 14698 32397 21605 3.50 -44.78 17.60 46.99
7 1519 1287 282 256 232 -15.27 -81.44 -80.11 -17.73
68515 91760 80572 101428 107331 33.93 17.60 10.54 33.21
TABLE 74
HUMAN RESOURCES TRAINED UNDER PLAN SCHEME
Development Programme for
Accounts OfficersDevelopment Programme for
Inspectors and Assistant
Superintendent Posts
Training of Trainers
Development Programme for
Operative/ Supervisory Staff *
%age decrease/increase
(in Number)
Activity Sl.
No.
Number of Officials Trained
Source: Training Division
Development Programme for Gramin
Dak Sevaks
Total
Management Programme for Group A
and B Officers
Development Programme for Mail
Overseers/ Postmen/ MTS
* include IT Modernization related training programmes/workshops of differrent categories.

Induction
Trainings (Non-
Plan)
In-service/IT
modernizatio
ns Trainings
1 RAKNPA, Ghaziabad 153 724
2 PTC, Darbhanga 709 585
3 PTC, Guwahati 54 909
4 PTC, Madurai 803 606
5 PTC, Mysore 851 5216
6 PTC, Saharanpur 829 2590
7 PTC, Vadodara 256 553
8 WTCs (in 23 Circles) 85268
3655 96451
TABLE 75
HUMAN RESOURCES TRAINED IN POSTAL ACADEMY AND POSTAL TRAINING CENTRES
Sl.
No.
Name of
Training Institution
Total
Source: Training Division
386
189
88223
105161
355
2170
4475
4125
2595
Induction
Trainings (Non-
Plan)
2016-17
No. of officials trained during 2016-17 and 2017-18
2017-18
In-service/IT
modernizations
Trainings
124
318
17
781
751
881
1843
2268

POSTAL COMPLAINTSAND
LOSS & FRAUD

1 Unregistered Mails 535 8558 9093 8720 373
2 Speed Post 25379 966318 991697 960431 31266
3 Registered letters 14799 342952 357751 346687 11064
4 Insured letters 117 1800 1917 1748 169
5 Unregistered parcels 849 7538 8387 7922 465
6 Registered parcels 10038 128878 138916 134697 4219
7 Insured parcels 406 5631 6037 5652 385
8 Express Parcel and Business Parcel COD 37191 554993 592184 554436 37748
9 VPL/VPPs 9226 147078 156304 149113 7191
10 Foreign Mails 1439 26704 28143 27003 1140
11 Money Orders 2408 43080 45488 42547 2941
12 SB & Certificates 2125 21789 23914 22308 1606
13 MGNREGA 51 1212 1263 1097 166
14 Miscellaneous 9895 77219 87114 81179 5935
15 Total 114458 2333750 2448208 2343540 104668
TABLE 76
SERVICE-WISE COMPLAINTS RECEIVED AND SETTLED DURING THE YEAR 2017-18
Services
Source: PG Section
OB Received Total Settled Pending

(in Number)
Below 3
months
3 - 6
months
6 - 12
months
Over 12
monthsTotal
Andhra Pradesh 1972 34133 36105 34726 1282 55 42 0 1379
Assam 538 72637 73175 72021 1131 23 0 0 1154
Bihar 2003 28332 30335 28833 1468 31 3 0 1502
Chhatisgarh 2088 32355 34443 33085 1260 69 12 17 1358
Delhi 9186 287659 296845 292663 3844 305 30 3 4182
Gujarat 5987 98219 104206 101097 2965 121 16 7 3109
Haryana 4533 77070 81603 79748 1824 31 0 0 1855
Himachal Pradesh 433 12506 12939 12681 248 10 0 0 258
Jammu & Kashmir 226 6384 6610 5271 578 334 102 325 1339
Jharkhand 1142 10641 11783 11592 153 38 0 0 191
Karnataka 2540 542141 544681 527991 16462 189 35 4 16690
Kerala 1497 57186 58683 55653 2756 260 12 2 3030
Madhya Pradesh 2992 109036 112028 106180 5211 494 102 41 5848
Maharashtra 7277 203914 211191 202587 8166 322 107 9 8604
North-East 9581 37834 47415 33216 9580 3026 1407 186 14199
Orissa 1997 44070 46067 44638 1330 91 8 0 1429
Punjab 1051 71042 72093 70802 1254 35 2 0 1291
Rajasthan 2321 94161 96482 92927 3304 227 22 2 3555
Tamilnadu 4119 164928 169047 164338 4447 200 42 20 4709
Telangana 30557 75170 105727 101906 1848 707 621 645 3821
Uttar Pradesh 2687 158907 161594 155011 6212 348 23 0 6583
Uttarankhand 424 8645 9069 8454 564 51 0 0 615
West Bengal 19241 106634 125875 107938 15849 1488 525 75 17937
Army Postal Service 66 146 212 182 21 4 3 2 30
Total 114458 2333750 2448208 2343540 91757 8459 3114 1338 104668
Pending Complaints
Circle
TABLE 77
NUMBER OF COMPLAINTS RECEIVED, SETTLED AND PENDING DURING 2017-18
Source : PG Section
Opening
BalanceReceived Total Settled
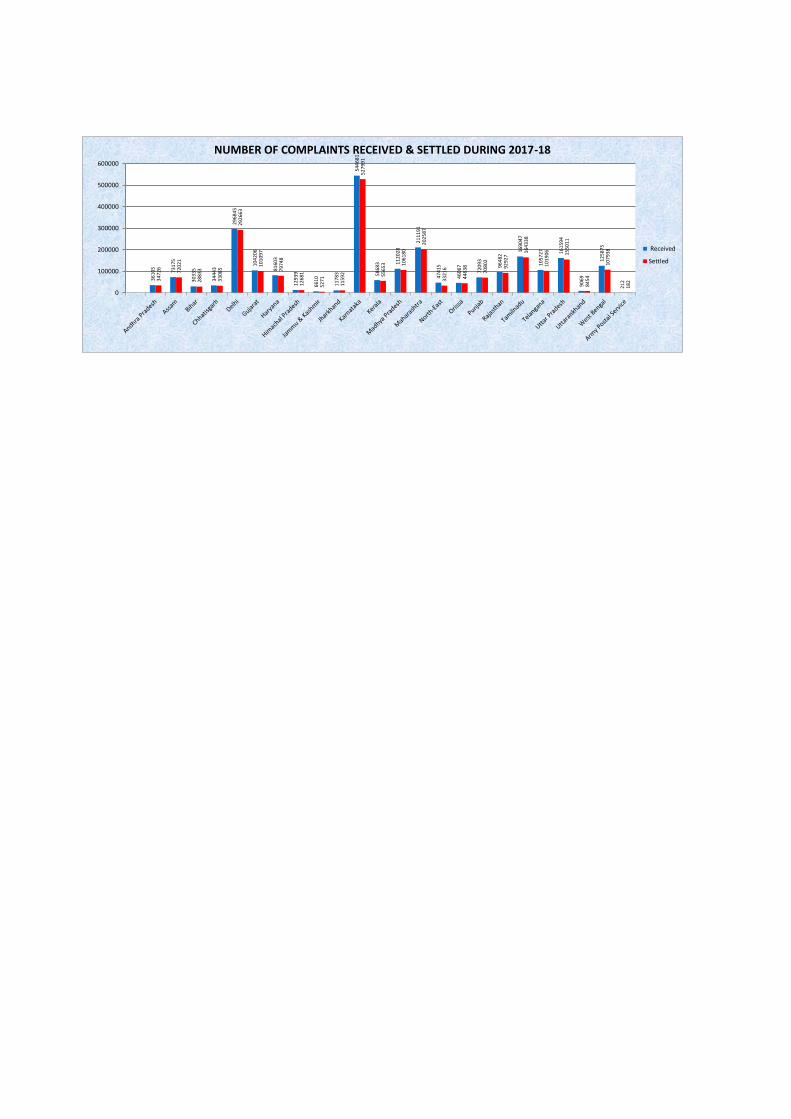
36
10
5
73
17
5
30
33
5
34
44
3
29
68
45
10
42
06
81
60
3
12
93
9
66
10
11
78
3
54
46
81
58
68
3 11
20
28
21
11
91
47
41
5
46
06
7
72
09
3
96
48
2
16
90
47
10
57
27 16
15
94
90
69
12
58
75
21
234
72
6
72
02
1
28
83
3
33
08
5
29
26
63
10
10
97
79
74
8
12
68
1
52
71
11
59
2
52
79
91
55
65
3 10
61
80
20
25
87
33
21
6
44
63
8
70
80
2
92
92
7
16
43
38
10
19
06
15
50
11
84
54
10
79
38
18
2
0
100000
200000
300000
400000
500000
600000
NUMBER OF COMPLAINTS RECEIVED & SETTLED DURING 2017-18
Received
Settled

(in Number)
Opening
BalanceReceived Settled Pending
Opening
BalanceReceived Settled Pending
Andhra Pradesh 167 9849 9719 297 86 2146 2183 49
APS Directorate 27 50 61 16 7 50 51 6
Assam 45 5499 5467 77 15 3405 3373 47
Bihar 189 2484 2546 127 76 2650 2638 88
Chhatisgarh 76 2457 2490 43 33 1256 1225 64
Delhi 1072 35046 35296 822 505 33277 33701 81
Gujarat 677 17542 17963 256 463 5167 5459 171
Haryana 82 3785 3736 131 80 1522 1535 67
Himachal Pradesh 13 1333 1334 12 18 580 587 11
Jammu & Kashmir 16 297 258 55 34 453 317 170
Jharkhand 120 1021 1131 10 89 417 485 21
Karnataka 286 31648 31382 552 206 7175 7184 197
Kerala 228 5830 5811 247 71 1187 1209 49
Madhya Pradesh 429 13939 13243 1125 125 5829 5801 153
Maharashtra 1169 70773 70439 1503 405 13597 13487 515
North-East 137 1617 1136 618 228 1165 1025 368
Orissa 159 4422 4436 145 49 719 733 35
PLI Directorate
Punjab 198 8084 8091 191 114 7289 7238 165
Rajasthan 324 21586 21547 363 96 4039 3970 165
Tamilnadu 1461 49697 49570 1588 337 19765 19696 406
Telangana 4976 16628 21118 486 5748 8894 14293 349
Uttar Pradesh 291 21558 21271 578 153 8814 8534 433
Uttarankhand 101 2641 2625 117 75 718 705 88
West Bengal 2673 16966 17765 1874 1431 4395 4920 906
TOTAL 14916 344752 348435 11233 10444 134509 140349 4604
TABLE 78
ARTICLE-WISE NUMBER OF COMPLAINTS RECEIVED, SETTLED AND PENDING DURING 2017-18 -
CONTD.
Circle
Registered and Insured letters Registerd and Insured Parcels

(in Number)
Opening
BalanceReceived Settled Pending
Opening
BalanceReceived Settled Pending
Andhra Pradesh 154 1805 1769 190 30 719 698 51
APS Directorate 2 0 2 0 11 21 27 5
Assam 21 3591 3486 126 17 455 452 20
Bihar 287 2138 1960 465 120 1327 1413 34
Chhatisgarh 219 2421 2551 89 12 565 561 16
Delhi 875 5761 6140 496 90 2049 2075 64
Gujarat 295 8049 7905 439 41 2010 1885 166
Haryana 1149 16224 16818 555 28 660 655 33
Himachal Pradesh 54 1410 1432 32 8 189 190 7
Jammu & Kashmir 47 847 789 105 0 29 21 8
Jharkhand 14 365 330 49 74 556 613 17
Karnataka 334 4085 4316 103 47 1605 1618 34
Kerala 29 657 657 29 30 646 624 52
Madhya Pradesh 71 3083 2748 406 77 2696 2345 428
Maharashtra 0 4092 3863 229 107 7474 7215 366
North-East 230 5919 5739 410 26 383 134 275
Orissa 210 19321 19341 190 96 1235 1307 24
PLI Directorate
Punjab 154 10894 10724 324 60 1452 1467 45
Rajasthan 307 7610 7631 286 40 1477 1443 74
Tamilnadu 332 12641 12538 435 74 3567 3477 164
Telangana 1257 2705 3879 83 39 732 721 50
Uttar Pradesh 672 23184 23181 675 194 5039 5021 212
Uttarankhand 95 1118 1099 114 7 892 875 24
West Bengal 2418 9158 10215 1361 1180 7302 7710 772
TOTAL 9226 147078 149113 7191 2408 43080 42547 2941
V.P.P. / V.P.L. Money Order
TABLE 78
Source : PG Section
ARTICLE-WISE NUMBER OF COMPLAINTS RECEIVED, SETTLED AND PENDING DURING 2017-18 -
CONTD.
Circle

(in Number)
Opening
BalanceReceived Settled Pending
Opening
BalanceReceived Settled Pending
Andhra Pradesh 165 6644 6329 480 5 242 235 12
APS Directorate 9 25 31 3 0 0 0 0
Assam 149 29641 29249 541 3 24 27 0
Bihar 689 8691 9022 358 0 15 10 5
Chhatisgarh 550 13323 13378 495 1 34 33 2
Delhi 2079 88413 89707 785 65 6426 6432 59
Gujarat 2044 31523 32943 624 77 1084 1100 61
Haryana 1567 24319 25513 373 30 414 421 23
Himachal Pradesh 138 3263 3356 45 5 52 52 5
Jammu & Kashmir 25 3434 3013 446 0 0 0 0
Jharkhand 219 4323 4537 5 2 29 31 0
Karnataka 603 480531 465860 15274 55 1442 1489 8
Kerala 316 8049 8164 201 18 705 682 41
Madhya Pradesh 513 21149 20022 1640 7 107 112 2
Maharashtra 1097 47278 46679 1696 379 3908 4110 177
North-East 2302 9304 9524 2082 0 22 22 0
Orissa 260 9031 8920 371 15 99 114 0
PLI Directorate
Punjab 248 31162 31117 293 79 2466 2427 118
Rajasthan 320 20907 20666 561 213 3161 3271 103
Tamilnadu 722 41574 41397 899 89 3846 3843 92
Telangana 8408 22443 29872 979 29 221 250 0
Uttar Pradesh 563 43684 42899 1348 21 282 274 29
Uttarankhand 116 2905 2887 134 39 218 224 33
West Bengal 2277 14702 15346 1633 307 1907 1844 370
TOTAL 25379 966318 960431 31266 1439 26704 27003 1140
ARTICLE-WISE NUMBER OF COMPLAINTS RECEIVED, SETTLED AND PENDING DURING 2017-18 -
CONTD.
Circle
Speed Post (with COD & Without COD) Foreign Mail
Source : PG Section
TABLE 78

(in Number)
Opening
BalanceReceived Settled Pending
Opening
BalanceReceived Settled Pending
Andhra Pradesh 331 2769 3066 34 991 7761 8608 144
APS Directorate 0 0 0 0 0 0 0 0
Assam 229 11435 11473 191 55 18279 18184 150
Bihar 140 2922 2958 104 187 4472 4485 174
Chhatisgarh 764 6223 6662 325 422 5770 5884 308
Delhi 2286 77323 79245 364 1833 31119 31902 1050
Gujarat 472 9623 9273 822 1742 20528 21716 554
Haryana 958 10395 11042 311 589 18658 18949 298
Himachal Pradesh 96 2978 2978 96 101 2630 2688 43
Jammu & Kashmir 51 756 517 290 34 412 228 218
Jharkhand 21 600 619 2 509 513 988 34
Karnataka 412 6042 6202 252 440 7877 8105 212
Kerala 231 26474 25125 1580 356 11172 10924 604
Madhya Pradesh 1363 46126 46294 1195 310 9869 9805 374
Maharashtra 118 4000 3974 144 0 25195 22450 2745
North-East 3434 8369 6418 5385 3204 10889 9067 5026
Orissa 441 4808 4955 294 748 4113 4506 355
PLI Directorate
Punjab 28 1561 1557 32 65 2797 2788 74
Rajasthan 513 20648 19941 1220 470 12422 12174 718
Tamilnadu 238 12650 12630 258 801 15668 15756 713
Telangana 6007 12937 17601 1343 3597 7972 11151 418
Uttar Pradesh 340 14321 13738 923 268 30166 28886 1548
Uttarankhand 6 1065 1003 68 46 508 468 86
West Bengal 513 11702 8104 4111 1431 10476 9349 2558
TOTAL 18992 295727 295375 19344 18199 259266 259061 18404
Source : PG Section
ARTICLE-WISE NUMBER OF COMPLAINTS RECEIVED, SETTLED AND PENDING DURING 2017-18 -CONCLD.
Circle
Express Parcel (with COD & Without Business Parcel (with COD without
TABLE 78

2013-14 2014-15 2015-16 2016-17 2017-18
2014-15
over
2013-14
2015-16
over
2014-15
2016-17
over
2015-16
2017-18
over
2016-17
Regd. & VP 46 50 30 40 28 8.70 -40.00 33.33 -30.00
Insured Letters & Parcels 6 1 1 2 3 -83.33 0.00 100.00 50.00
Money Orders 147 151 113 82 49 2.72 -25.17 -27.43 -40.24
SB/CTD/RD/TD 585 567 668 651 602 -3.08 17.81 -2.54 -7.53
NSC 17 21 10 19 3 23.53 -52.38 90.00 -84.21
Cash Stamps 183 211 249 220 176 15.30 18.01 -11.65 -20.00
Miscellaneous 256 246 223 166 179 -3.91 -9.35 -25.56 7.83
Total 1240 1247 1294 1180 1040 0.56 3.77 -8.81 -11.86
TABLE 79
LOSS & FRAUD CASES REGISTERED
Source: Investigation Section
Analysis: Loss & fraud cases registered shows an increasing trend during the period from 2013-14 to 2015-16. During 2016-17 and 2017-18
there was, however, decreasing trend and the cases registered were 1180 and 1040 respectively.
Item
%age decrease/increaseNumber of Loss & Fraud Cases
(in Number)

OTHER MISCELLANEOUS
STATISTICS
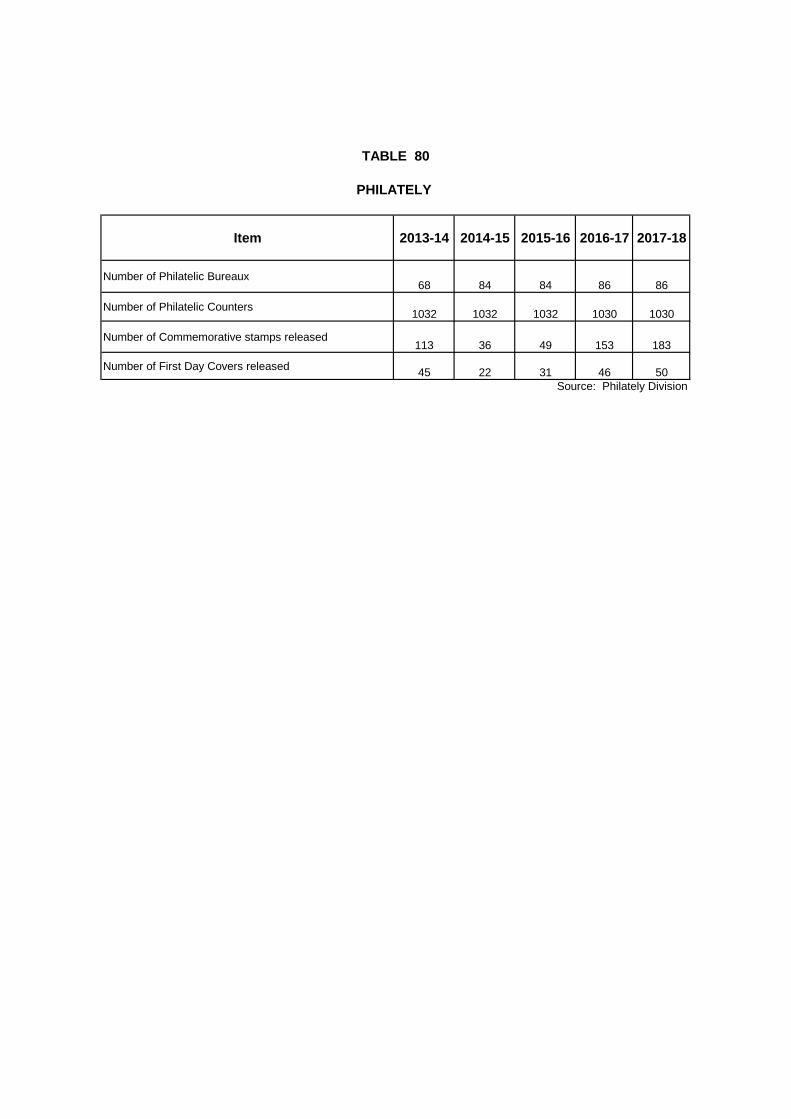
Item 2013-14 2014-15 2015-16 2016-17 2017-18
Number of Philatelic Bureaux68 84 84 86 86
Number of Philatelic Counters1032 1032 1032 1030 1030
Number of Commemorative stamps released113 36 49 153 183
Number of First Day Covers released45 22 31 46 50
Source: Philately Division
TABLE 80
PHILATELY

Postal
Railway
Service
Other
units Postal
Railway
Service
Other
units Postal
Railway
Service
Other
units Deptt.
Rented
building
Rent-
free
building
s
Andhra Pradesh 167 5 3 1353 26 7 73 0 4 175 1386 77
Telangana 148 10 1 635 12 0 67 5 0 159 647 72
Assam 161 8 0 441 13 0 23 6 0 169 454 29
Bihar 177 2 7 775 21 0 100 0 0 186 796 100
Chhattisgarh 43 0 2 285 4 1 23 0 0 45 290 23
Delhi 122 2 5 142 7 0 42 2 0 129 149 44
Gujarat 255 2 10 1020 18 3 29 0 0 267 1041 29
Daman & Dadra
Nagarhaveli (U/T)3 0 0 3 0 0 0 0 0 3 3 0
Diu(U/T) 0 0 0 4 0 0 0 0 0 0 4 0
Haryana 77 7 1 356 5 0 67 0 0 85 361 67
Himachal Pradesh 77 1 5 374 6 3 21 0 0 83 383 21
Jharkhand 66 2 0 341 17 1 54 0 0 68 359 54
Jammu & Kashmir 33 1 1 200 0 1 24 0 0 35 201 24
Karnataka 405 11 6 1257 8 6 71 0 0 422 1271 71
Kerala including
Lakshadweep251 4 3 1210 21 15 47 0 0 258 1246 47
Madhya Pradesh 190 1 3 734 8 1 97 1 0 194 743 98
Maharashtra 361 7 12 1657 40 8 100 9 0 380 1705 109
Goa 15 0 1 80 0 0 9 0 0 16 80 9
Meghalaya 19 0 2 35 0 0 14 0 0 21 35 14
Mizoram 13 0 0 23 0 0 3 0 0 13 23 3
Manipur 8 0 0 45 0 0 3 0 0 8 45 3
Nagaland 10 0 0 26 0 0 6 0 0 10 26 6
Arunachal pradesh 23 0 0 12 0 0 14 0 0 23 12 14
Tripura 22 0 0 49 0 0 12 0 0 22 49 12
Orissa 145 7 73 956 15 0 96 0 0 225 971 96
Punjab 138 1 5 528 12 1 100 0 0 144 541 100
Chandigarh 30 0 0 46 0 0 16 0 0 30 46 16
Rajasthan 343 15 1 856 26 0 138 2 0 359 882 140
Tamil Nadu 283 7 5 2214 32 8 84 0 0 295 2254 84
Pondicherry 7 0 0 21 0 0 1 0 0 7 21 1
Uttar Pradesh 310 11 3 2015 43 1 216 0 0 324 2059 216
Uttarakhand 51 0 0 300 0 0 43 0 0 51 300 43
West Bengal 210 10 38 1358 9 21 110 9 1 258 1388 120
Sikkim 6 0 0 12 0 0 5 0 0 6 12 5
A&N Islands 10 0 0 7 3 0 5 2 0 10 10 7
TOTAL 4179 114 187 19370 346 77 1713 36 5 4480 19793 1754
G/TOTAL
TABLE 81
Circle
Departmental buildings Rented buildings Rent-Free buildings TOTAL
DEPARTMENTAL AND RENTAL BUILDINGS AS 31.03.2018
4480 19793 1754 26027
Note:(i) In case 2 or more offices are functioning in a common building, it is treated as 'one number of building' only.
(ii) All the administrative Offices and other offices like CO/RO/DAP/PSD/CSD & MMS Units other than Post Offices/RMS offices
shown under "Other Units"
Source: Building Section

2013-14 2015-16 2017-18 2013-14 2015-16 2017-18
Andhra Pradesh 5 3090 2978 3010 8755 9367 9713
Assam 2 552 524 461 1605 1527 1244
Bihar 4 2145 1818 2240 11472 8032 11572
Chhatisgarh 1 659 659 772 1825 18258 1853
Gujarat 1 1971 1503 2544 4285 5240 3785
Haryana 1 1001 1005 998 3445 3416 3546
Jammu & Kashmir 0 0 0 0 0 0 0
Jharkhand 1 355 298 289 1414 1389 1297
Madhya Pradesh 0 0 0 0 0 0
Maharashtra 0 0 0 0 0 0 0
North-East 0 0 0 0 0 0 0
Orissa 2 1063 1031 1061 3366 3994 3684
Punjab 2 1897 1931 1782 5470 5702 5328
Rajasthan 3 2293 2366 2194 7480 7661 5986
Tamilnadu 2 1724 1623 1429 4377 3743 3620
Uttar Pradesh 7 19807 6918 6654 32601 31681 34217
Uttaranchal 0 0 0 0 0 0 0
West Bengal 2 1421 1222 1385 4380 3966 4111
Total 33 37978 23876 24819 90475 103976 89956
TABLE 82
NUMBER OF DISPENSARIES, CARD HOLDERS AND BENEFICIARIES
(AS ON 31st
MARCH 2018)
Source: Medical Section
Number of
Dispensaries
2017-18
Circle
Number of Card Holders Number of Beneficiaries

Name of Postal Article Tariff
Ordinary Card 50 Paise
Printed Card ` 6
2 Competition Postcard ` 10
3 Letter Card ` 2.50
For a weight not exceeding 20 grams ` 5
For every additional 20 grams or fraction thereof ` 5
5 Registered Envelope ` 22.5
For the first 50 grams ` 4
For every additional 50 grams or fraction thereof ` 3
Upto 100 grams ` 1
For every additional 100 grams or part thereof ` 1
Upto 100 grams ` 2
For every additional 100 grams or part thereof ` 3
Upto 100 grams ` 4
For every additional 100 grams or part thereof ` 5
Upto 100 grams ` 8
For every additional 100 grams or part thereof ` 9
For a weight not exceeding 500 grams ` 19
For every additional 500 grams or fraction thereof ` 16
For a weight not exceeding 50 grams 25 Paise
For a weight exceeding 50 grams but not exceeding 100 grams 50 Paise
For every additional 100 grams or part thereof, exceeding 100 grams 20 Paise
For a weight not exceeding 100 grams 50 Paise
For every additional 100 grams or part thereof, exceeding 100 grams 20 Paise
Fee for registration ` 17
Concessional registration fee for V.P.P. containing Printed Books ` 2.50
Fee for each acknowledgement ` 3
For every sum of ` 20 or fraction thereof ` 1
TABLE 83
1
Post Card
4
Unregistered Envelope
6
Book Pattern and Sample Packets
POSTAL RATES (INLAND) -CONTD.
7
Book Packets Containing Printed Books
8
Book Packet containing Periodicals
(i) Value of Periodical from ` 1 to ` 20
(ii) Value of Periodical from ` 21 to ` 50
(iii) Value of Periodical from ` 51and above
9
Parcels
10
For Registered NewsPaper
I. Single Copy
II. In case of more than one copy of the same issue of a registered newspaper being carried in the same
packet
11
Registration
12Acknowledgements
13Money Orders
(RATES OPERATIVE W.E.F. 01.06.2002 AND SUPPLIMENTARY POSTAL SERVICE W.E.F. 01.02.2002)

Commission on each IPO
Upto ` 10 ` 1Upto ` 20 ` 2Upto ` 30 ` 3Upto ` 40 ` 4Upto ` 50 ` 5Upto ` 100 ` 10
Insurance Fee upto ` 200 ` 10
For every additional `100 or fraction thereof in excess of ` 200 ` 6
Upto ` 20 ` 2Between ` 20 to ` 50 ` 3Above ` 50 ` 5
17 V.P. Inquiry Fee ` 1
Postal identity cards
Application fee ` 20
Processing fee ` 250
Total ` 270
19 Business reply permit fee (handling charges per article) ` 1
Warehousing Charges on VP articles for detention beyond 7 days
For Parcels(per day) ` 3
For other articles(per day) ` 2
For 3 articles or less ` 3
I. For Packets (other than letters, postcards & parcels) upto 50 grams ` 2
For every additional 50 grams or fraction thereof ` 1
II. Parcels for first 50 grams ` 2
For every additional 50 grams `1
i. Late Fee Charge for unregistered articles (per article) ` 2
ii. Late Fee Charge for registered articles (per article) ` 3
iii. Special Additional Late Fee Charge (per article) ` 3
24Fee for obtaining copy of original receipt signed by addressee (for
regd. per article)` 2
25Supplementary charge for issue of a foreign money order telegraphed under
Rule 172 of Indian Post Office Rules (per foreign money order)` 2
26 Fee for recall of Postal articles (per article) ` 6
(i). If rented for full financial year ` 150
(ii). For three calender months or part thereof, if rented for a period of less than a
full financial year` 50
(b). Post Box and Bag combined together with the same or different number
(i). If rented for full financial year ` 250
(ii). For three calender months or part thereof, if rented for a period of less than a
full financial year` 80
28 Money Order Form 25 Paise
* Certificate of Posting has been discontinued since 23.02.2011.
(RATES OPERATIVE W.E.F. 01.06.2002 AND SUPPLIMENTARY POSTAL SERVICE W.E.F. 01.02.2002)
Indian Postal Orders
15
Insurance
16
V.P. Fee
18
TABLE 83
POSTAL RATES (INLAND) -CONCLD.
Source: Costing & Rates Section
27
Rent for Boxes/Bags
(a). Post Boxes or Bags if taken separately
20
21Certificate of Posting *
22
Airmail Fee
23
Late Fee
14

TIME SERIES DATA OF IMPORTANT
POSTAL STATISTICS

(in Lakh)
Year 1959-60 1964-65 1970-71 1974-75 1979-80 1984-85 1989-90 1994-95 1999-00 2008-09 2009-10 2010-11 2011-12 2012-13 2013-14 2014-15 2015-16 2016-17 2017-18
Number of Accounts84.46 120.98 205.83 277.96 289.24 413.4 475.7 475.11 590.66 780.47 885.65 964.77 1158.25 1253.23 1253.23 1335.02 1659.68 1862.01 1970.37
TABLE 84
NUMBER OF SAVINGS BANK ACCOUNTS
0
200
400
600
800
1000
1200
1400
1600
1800
2000
84.4
6
120
.98
205.8
3
277
.96
289
.24
413
.4
475.7
475.1
1
590.6
6
780
.47
885.6
5
964
.77
1158.2
5
125
3.2
3
125
3.2
3
1335.0
2
1659.6
8
1862.0
1
197
0.3
7
Nu
mb
er
of
Sa
vin
g B
an
k A
cc
ou
nts
(in
La
kh
)
Year

(in Crore)
Year 1989-90 1994-95 1999-00 2009-10 2010-11 2011-12 2012-13 2013-14 2014-15 2015-16 2016-17 2017-18
Unregistered Mail 1421.6 1328.6 1550.6 614.65 615.76 577.87 541.63 550.79 540.71 561.49 552.66 567.69
Registered Mail 29.1 32.2 27.6 19.58 17.79 19.11 17.93 20.08 20.48 19.83 18.34 19.32
Speed and
Express Parcel Posts0.3 1.3 3.1 24.75 28.27 40.2 45.98 37.95 41.26 42.72 47.87 47.59
*The figures of Speed & Express Parcel Posts upto 1999-00 are inclusive of Indian Money Orders.
Source: Annual Repots/ Book of Information/ Statistical Digest
TABLE 85
MAIL TRAFFIC
0
200
400
600
800
1000
1200
1400
1600
1422
1329 1
551
615
616
578
542
55
1
541
561
553
56
8
2932
28
20 1819
18 20 20 20 18 19
0.31
3
25 2840
46 38 41 43 4848
Ma
il T
raff
ic (
in C
rore
)
Year
Speed andExpress Parcel Posts
Registered Mail Unregistered Mail

(in Lakh)
Year 1989-90 1994-95 1999-00 2009-10 2010-11 2011-12 2012-13 2013-14 2014-15 2015-16 2016-17 2017-18
Number of Money Orders 1109.0 1018.7 1137.3 813.5 577.1 698.7 871.1 1091.4 1352.0 1018.5 659 776.58
Source: Annual Repots/ Book of Information
TABLE 86
NUMBER OF MONEY ORDERS
0
200
400
600
800
1000
1200
1400
1989-90 1994-95 1999-00 2009-10 2010-11 2011-12 2012-13 2013-14 2014-15 2015-16 2016-17 2017-18
11
09
.0
10
18
.7
11
37
.3
81
3.5
57
7.1
69
8.7 87
1.1 10
91
.4 13
52
.0
10
18
.5
65
9
77
6.5
8
Nu
mb
er
of
Mo
ney O
rde
rs (
in L
ak
h)
Year

1954-55 1959-60 1964-65 1970-71 1974-75 1979-80 1984-85 1989-90 1994-95 1999-00 2009-10 2O10-11 2O11-12 2O12-13 2O13-14 2O14-15 2O15-16 2016-17 2017-18
Rural 30239 41860 55577 66445 105713 122839 129589 130987 136082 138149 139182 139040 139086 139164 139182 139222 138955 139067 139882
Urban 5466 6234 7148 8145 11509 14160 15286 16249 16710 16402 15797 15826 15736 15692 15700 15717 15955 15898 15649
Number of
post offices
(total)
35705 48094 62725 74590 117222 136999 144875 147236 152792 154551 154979 154866 154822 154856 154882 154939 154910 154965 155531
Source: Annual Repots/ Book of Information
TABLE 87
NUMBER OF POST OFFICES
(in Number)
0
20000
40000
60000
80000
100000
120000
140000
160000
180000
30
23
9
41
86
0
55
57
7
66
44
5
10
57
13
12
28
39
12
95
89
13
09
87
13
60
82
13
81
49
13
91
82
13
90
40
13
90
86
13
91
64
13
91
82
13
92
22
13
89
55
13
90
67
13
98
82
54
66 6
23
4
71
48 8
14
5
11
50
9
14
16
0
15
28
6
16
24
9
16
71
0
16
40
2
15
79
7
15
82
6
15
73
6
15
69
2
15
70
0
15
71
7
15
95
5
15
89
8
15
64
9
Nu
mb
er
of
Po
st O
ffic
es
Year
Urban Rural

(Rs Crore)
Year 1984-85 1989-90 1994-95 1999-00 2009-10 2010-11 2011-12 2012-13 2013-14 2014-15 2015-16 2016-17 2017-18
Revenue 444.41 702.59 1170.41 2020.12 6266.70 6962.33 7899.35 9366.50 10730.42 11635.98 12939.79 11511.00 12832.76
Expenditure 568.66 965.58 1522.22 3615.94 12908.00 13307.91 13705.27 14792.38 16203.52 17894.58 18946.97 23480.95 25248.59Source: Annual Repots/ Book of Information
TABLE 88
REVENUE AND EXPENDITURE
444.4 702.6 1170.42020.1
6266.7 6962.37899.4
9366.510730.4
11636.012939.8
11511.012832.8
568.7 965.61522.2
3615.9
12908.0
13307.9 13705.314792.4 16203.5
17894.6
18947.0
23481.0
25248.6
0
5000
10000
15000
20000
25000
30000
Am
ou
nt
(Rs
Cro
re)
Year
Revenue Expenditure

(in Lakh)
Year 1954-55 1959-60 1964-65 1970-71 1974-75 1979-80 1984-85 1989-90 1994-95 1999-00 2009-10 2010-11 2011-12 2012-13 2013-14 2014-15 2015-16 2016-17 2017-18
Number of Postal
Life Insurance
Policies
1.29 1.55 1.78 2.34 3.40 7.32 11.56 16.21 20.93 24.52 42.83 46.86 50.06 52.19 54.06 52.42 49.31 46.8 43.6
Source: Annual Repots/ Book of Information
TABLE 89
POSTAL LIFE INSURANCE (NUMBER OF POLICIES)
0
10
20
30
40
50
60
1.2
9
1.5
5
1.7
8
2.3
4
3.4
0
7.3
2 11
.56 16
.21 2
0.9
3 24
.52
42
.83 46
.86 50
.06
52
.19
54
.06
52
.42
49
.31
46
.8
43
.6
Year
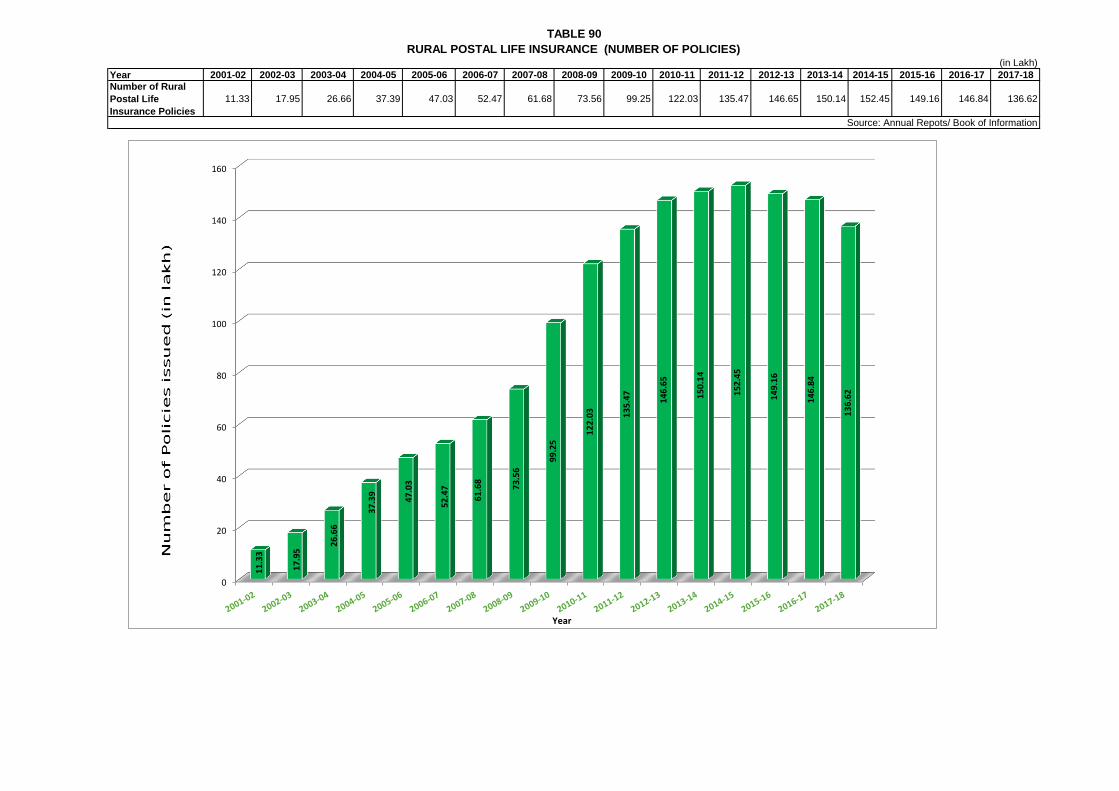
(in Lakh)
Year 2001-02 2002-03 2003-04 2004-05 2005-06 2006-07 2007-08 2008-09 2009-10 2010-11 2011-12 2012-13 2013-14 2014-15 2015-16 2016-17 2017-18
Number of Rural
Postal Life
Insurance Policies
11.33 17.95 26.66 37.39 47.03 52.47 61.68 73.56 99.25 122.03 135.47 146.65 150.14 152.45 149.16 146.84 136.62
Source: Annual Repots/ Book of Information
TABLE 90
RURAL POSTAL LIFE INSURANCE (NUMBER OF POLICIES)
0
20
40
60
80
100
120
140
160
11
.33
17
.95
26
.66
37
.39
47
.03
52
.47
61
.68
73
.56
99
.25
12
2.0
3 13
5.4
7
14
6.6
5
15
0.1
4
15
2.4
5
14
9.1
6
14
6.8
4
13
6.6
2
Year

Circle Cities having Sorting HubsAndhra Pradesh
Rajahmundry, Anantapur, Guntur, Eluru, Nellore , Cuddapah, Ongole,Srikakulam, Viziangram
AssamJorhat, Silchar, Tinsukia, Tezpur, Nagaon
BiharKiul, Chhapra, Bhagalpur
ChhatisgarhBilaspur, Jagdalpur, Durg, Raigarh
Delhi -
Gujrat
Bharuch, Bhavnagar, Godhara, Himatnagar, Jamnagar, Junagadh, Mehsana, Anand,
Bhuj, Valsad, Surender Nagar, Palanpur, Dhola
HaryanaHisar, Rewari, Faridabad
Himachal PradeshMandi, Kangra, Solan, Hamirpur
Jammu & Kashmir -
JharkhandDaltonganj, B. Deoghar, Hazaribagh Road
KarnatakaRaichur, Bagalkot, Kumta, Bijapur, Tumkur, Hospet
Kerala Palakkad, Kottayam, Tiruvalla
Madhya PradeshChhindwara, Sagar, Guna, Khandwa, Ujjain, Itarasi, Balaghat, Satna, Ratlam
Maharashtra
Nashik Road, Bhusawal, Dhule, Ratnagiri, Kolhapur, Satara, Ahmednagar, Solapur, Amravati, Akola,
Chandrapur, Parbhani, Miraj, Panvel, Gondia, Malkapur, Yeotmal
North Eastern
OrissaCuttack, Balasore, Rourkela, Jeypore, Balangir, Dhenkanal, Jajpur Road
PunjabFerozepur, Hoshiarpur, Bhatinda, Patiala
RajasthanUdaipur, Bikaner, Kota, Sikar, Alwar, Falna, Bhilwara, Sriganganagar, Bharatpur, Swai Madhopur
Tamil Nadu
Erode, Karaikudi, Thanjavur, Tirupur, Virudhunagar, Vridhachalam, Mayiladuturai, Tuticorin
Jolarpettai, Nagercoil, Chengelput, Villupuram
Telangana Nizamabad, Khammam, Karim Nagar, Nalgonda
Uttar Pradesh
Aligarh, Mau, Kasganj RMS, Etawah, Jhansi, Gonda, Meerut, Muzaffarnagar, Saharanpur, Shahjahanpur
Faizabad, Raibareilly, Kheri, Banda, Basti, Mirzapur, Farrukhabad, Jaunpur
Uttarkhand
Haridwar, Rudrapur, Rudraprayag, Almora, Pithoragarh, Pauri
West Bengal Bankura, Berhampore, Portblair, Purulia, Ranaghat, Sainthia, Sealdah, Malda, Asansol, Howrah
A.P.S -
Appendix-I
DETAIL OF INTRA CIRCLE HUBS IN 2017-18

Circle
Andhra Pradesh
Assam
Bihar
Chhatisgarh
Delhi
Gujrat
Haryana
Himachal Pradesh
Jammu & Kashmir
Jharkhand
Karnataka
Kerala
Madhya Pradesh
Maharashtra
North Eastern
Orissa
Punjab
Rajasthan
Tamil Nadu
Telangana
Uttar Pradesh
Uttarkhand
West Bengal
A.P.S
Appendix-II
DETAIL OF NATIONAL SORTING HUBS IN 2017-18
Amritsar, Chandigarh, Jalandhar, Ludhiana
Ajmer, Jaipur, Jodhpur
Raipur
Delhi
Kannur, Kochi, Kozhikkode, Thrissur, Trivandrum
Ahmedabad, Rajkot, Surat, Vadodara
Ambala, Gurgaon, Karnal, Rohtak
Shimla, Pathankot
Jammu, Srinagar
Dhanbad, Jamshedpur, Ranchi
Cities having Sorting Hubs
Kurnool, Tirupathi, Vijayawada, Visakhapatnam
Guwahati, Dibrugarh
Gaya, Muzaffarpur, Patna, Barauni
Bangalore, Belgavi, Arsikere, Kalaburgi, Hubli-Dharwad, Mangalore, Mysore
Burdwan, Kharagpur, Kolkata, Siliguri
1 CBPO, 2 CBPO
Bhopal, Gwalior, Indore, Jabalpur
Aurangabad, Mumbai, Nagpur, Panaji, Pune
Imphal, Agartala, Aizawl, Itanagar, Dimapur, Shillong
Bhubaneswar, Berhampur, Sambalpur
Agra, Allahabad, Bareilly, Ghaziabad, Gorakhpur, Kanpur, Lucknow, Moradabad, Noida, Varanasi
Dehradun
Chennai, Coimbatore, Madurai, Salem, Trichy, Vellore, Tirunelveli
Hyderabad, Warangal

1 Afghanistan 39 Korea (Republic)
2 Australia 40 Latvia
3 Austria 41 Macao
4 Bahrain 42 Malawi
5 Bangladesh 43 Malaysia
6 Barbados 44 Mauritius
7 Belarus 45 Mongolia
8 Bermuda 46 Morocco
9 Bhutan 47 Namibia
10 Botswana 48 Nauru
11 Brunei Darussalam 49 Nepal
12 Bulgaria 50 Netherlands
13 Cambodia 51 New Zealand
14 Canada 52 Norway
15 Cayman Islands 53 Oman
16 China (People’s Republic) 54 Pakistan
17 Cuba 55 Philippines
18 Cyprus 56 Poland
19 Egypt 57 Portugal
20 Eritrea 58 Qatar
21 Estonia 59 Romania
22 Ethiopia 60 Russian Federation
23 Fiji 61 Senegal
24 Finland 62 Singapore
25 France 63 South Africa
26 Georgia 64 Spain
27 Germany 65 Sudan
28 Ghana 66 Switzerland
29 Greece 67 Taiwan
30 Hong Kong 68 Tanzania
31 Hungary 69 Thailand
32 Iceland 70 Turkey
33 Ireland 71 Uganda
34 Israel 72 Ukraine
35 Italy 73 United Arab Emirates
36 Japan 74 United Kingdom (United Kingdom of
Great Britain and Northern Ireland)
37 Jordan 75 United States of America
38 Kenya 76 Vietnam
1 Argentina 13 Maldives
2 Belgium 14 Mexico
3 Cape Verde 15 Niger
4 Democratic Republic of Congo
(Zaire)
16 Nigeria
5 Denmark 17 Panama
6 El Salvador 18 Papua New Guinea
7 Guyana 19 Rwanda
8 Indonesia 20 Saudi Arabia
9 Iran 21 Sri Lanka
10 Iraq 22 Sweden
11 Kuwait 23 Tunisia
12 Luxembourg 24 YemenSource : DA Section
Appendix-III
COUNTRIES COVERED UNDER INTERNATIONAL SPEED POST SERVICE
Merchandise and Documents : As on 25.10.2018
FOR DOCUMENTS ONLY
FOR DOCUMENTS AND MERCHANDISE

Circle Cities
Andhra Pradesh Guntur, Rajamundry,Nellore,Vijaywada,Visakhapattnam
Assam Dibrugarh, Silchar
Bihar Chhapra, Darbhanga, Gaya, Muzaffarpur
Chhattisgarh Raipur
Delhi -
Gujarat Vadodara
Haryana Ambala
Himachal Pradesh -
Jammu & Kashmir -
Jharkhand Dhanbad
Karnataka -
Kerala -
Madhya Pradesh -
Maharashtra -
North Eastern -
Orissa Berahampur, Cuttack
Punjab Amritsar, Jalandhar
Rajasthan Ajmer, Jodhpur, Kota
Tamil Nadu Tiruchirappali, Triunelvelli
Uttar Pradesh Agra, Aligarh, Bareily, Gorakhpur, Moradabad, Saharanpur, Varanasi
Uttarakhand -
West Bengal Siliguri, Jalpaiguri
Appendix-IV
DETAIL OF POSTAL DISPENSARIES
Source: Medical Section

Department of PostsMinistry of Communications
Government of India

![icar.gov.inINDIAN COUNCIL OF AGRICULTURAL RESEARC]hI KRISHI BHAWAN: NEW, DELHI F. No. GAC-21-7 12017-CDN / IY Dated 17 lloremU er,20l7 ENDORSEMENT Cabinet Secretariat, Govt. of India,](https://img.pdfslide.us/doc/110x75/5ed3c346dc1b3f24ef09b3a8/icargovin-indian-council-of-agricultural-researchi-krishi-bhawan-new-delhi.jpg)