Embed Size (px)
Citation preview
The Prospective Cardiovascular Münster (PROCAM) Study (also knownas the Münster Heart Study) was initiated in 1978 by the Institute ofArteriosclerosis Research at the University of Münster. In several waves ofrecruitment, precisely 50.000 participants aged between 16 and 65 yearswere recruited from among the employees of 84 large companies and thepublic service in Münster and the northern Ruhr area, the area shaded onthe slide. All participants are in continuing long term follow-up for heartdisease, stroke and mortality.
© Assmann Foundation for Prevention 1
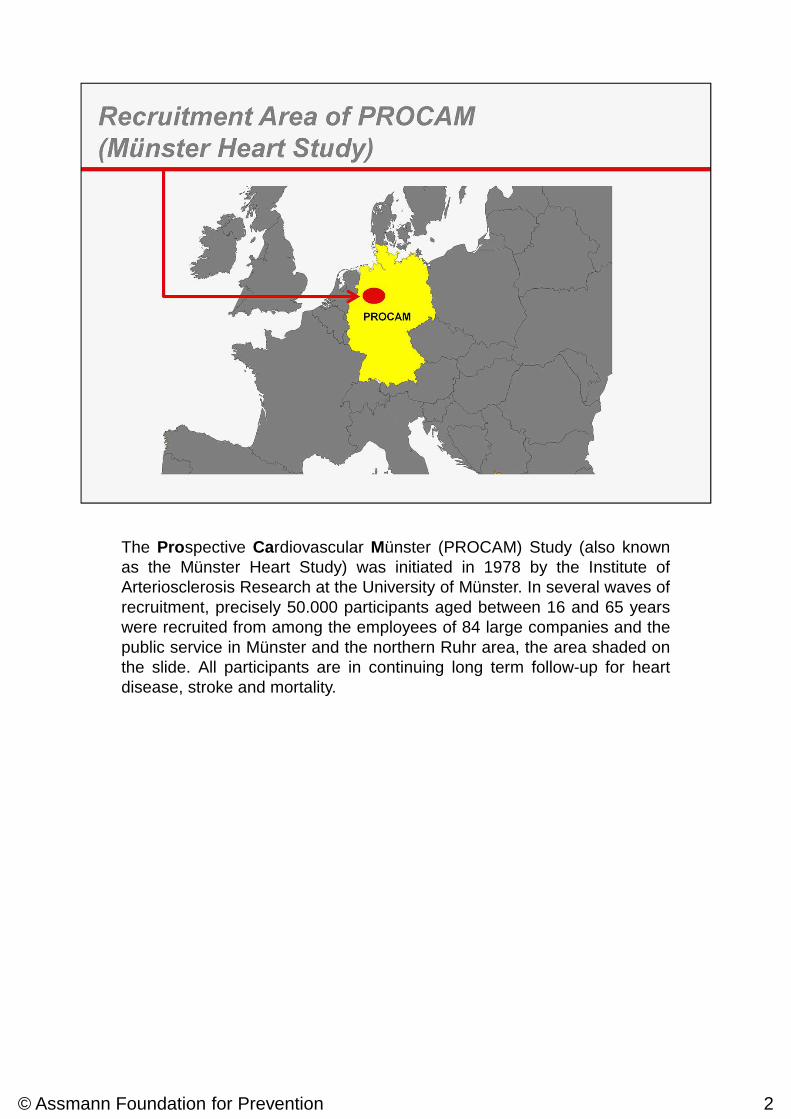
The Prospective Cardiovascular Münster (PROCAM) Study (also knownas the Münster Heart Study) was initiated in 1978 by the Institute ofArteriosclerosis Research at the University of Münster. In several waves ofrecruitment, precisely 50.000 participants aged between 16 and 65 yearswere recruited from among the employees of 84 large companies and thepublic service in Münster and the northern Ruhr area, the area shaded onthe slide. All participants are in continuing long term follow-up for heartdisease, stroke and mortality.
© Assmann Foundation for Prevention 2
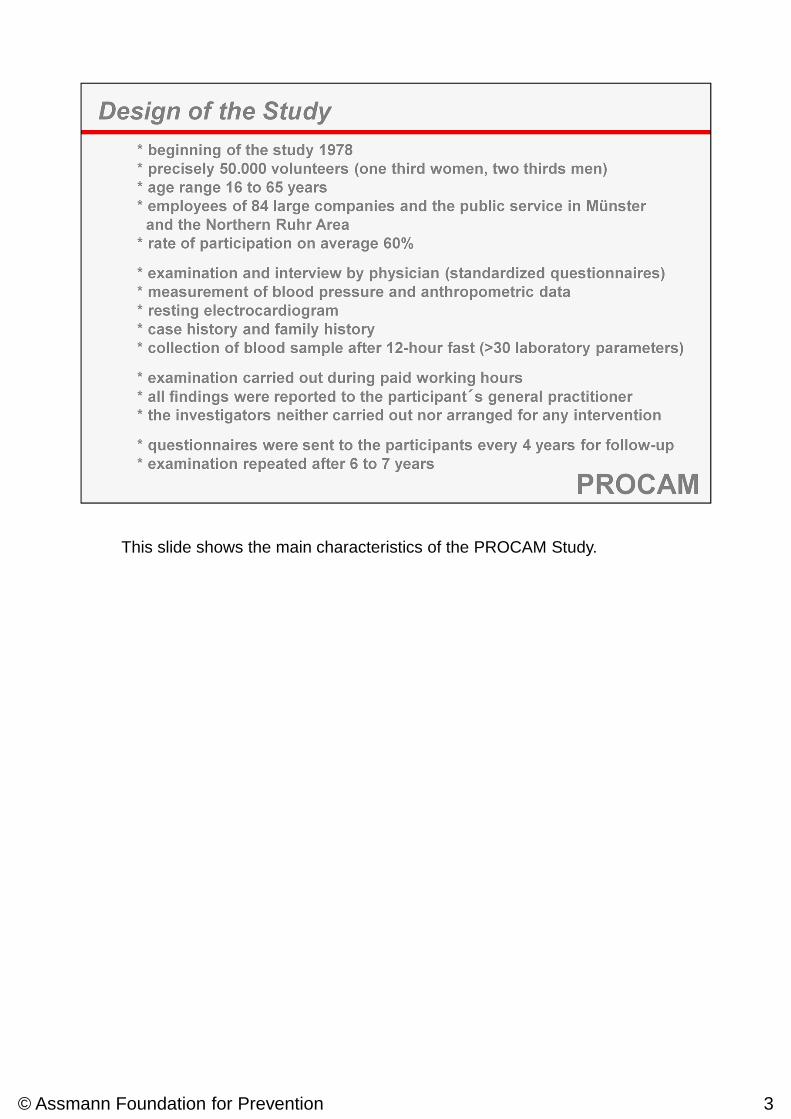
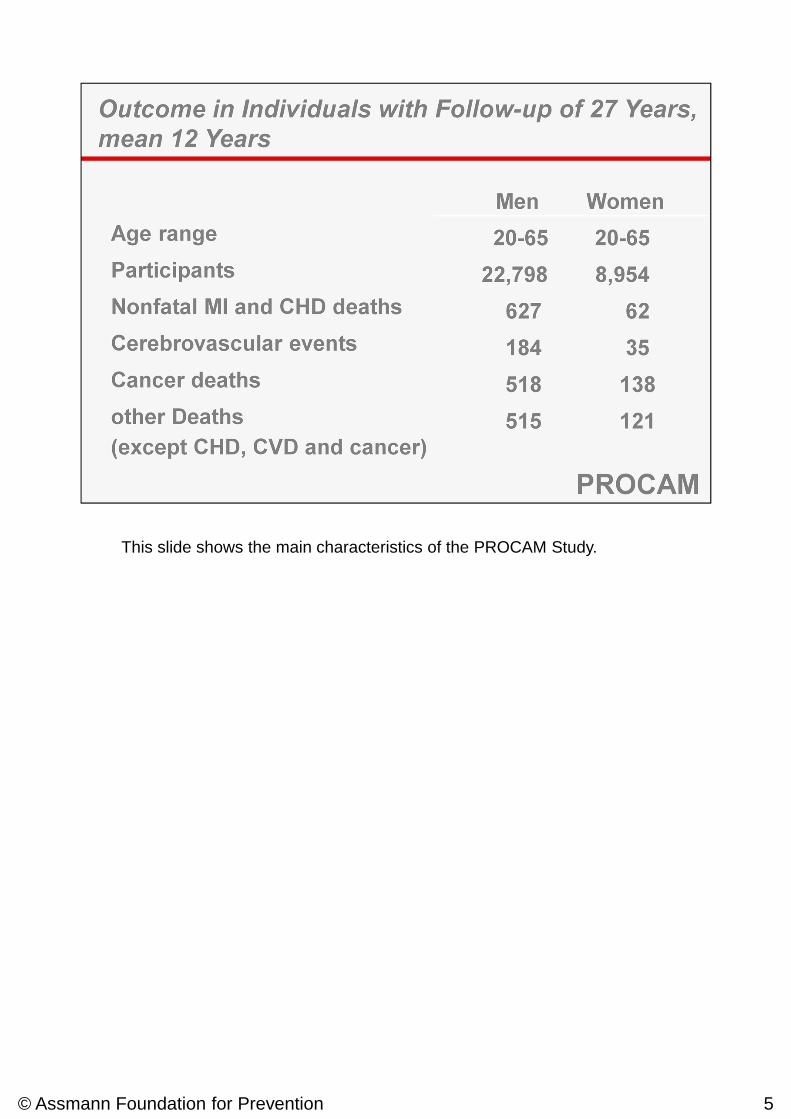
This slide shows the main characteristics of the PROCAM Study.
© Assmann Foundation for Prevention 3
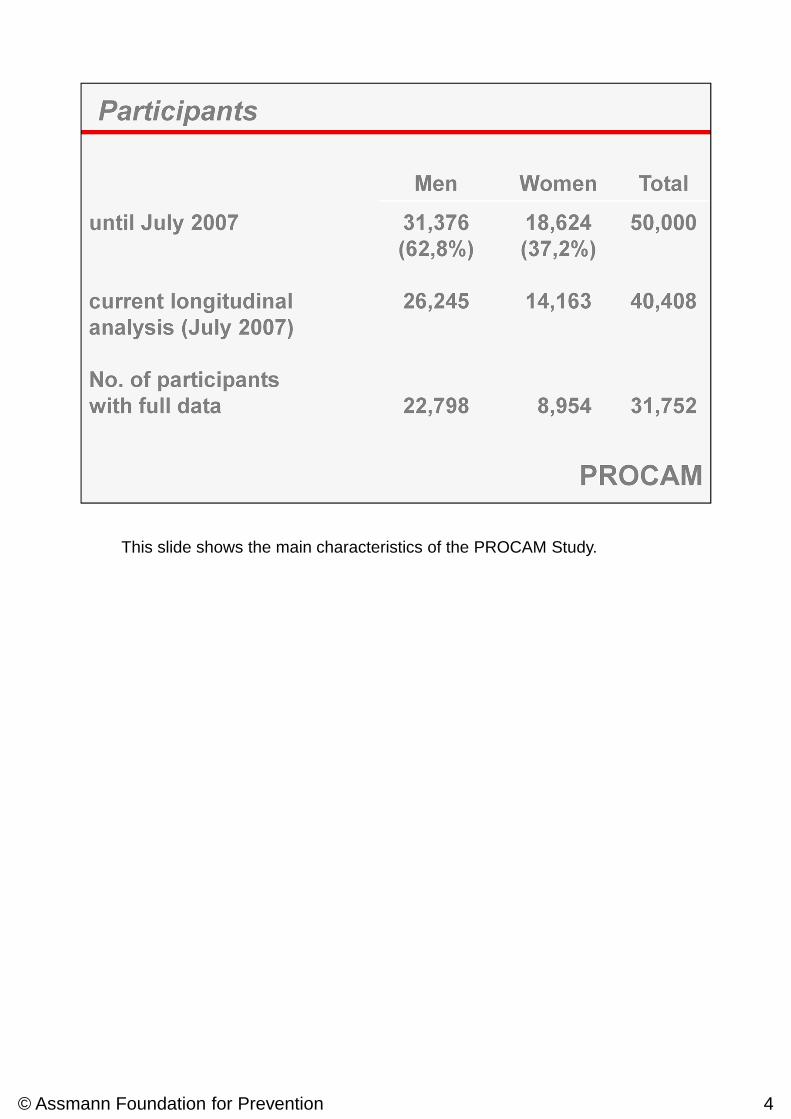
This slide shows the main characteristics of the PROCAM Study.
© Assmann Foundation for Prevention 4
This slide shows the main characteristics of the PROCAM Study.
© Assmann Foundation for Prevention 5
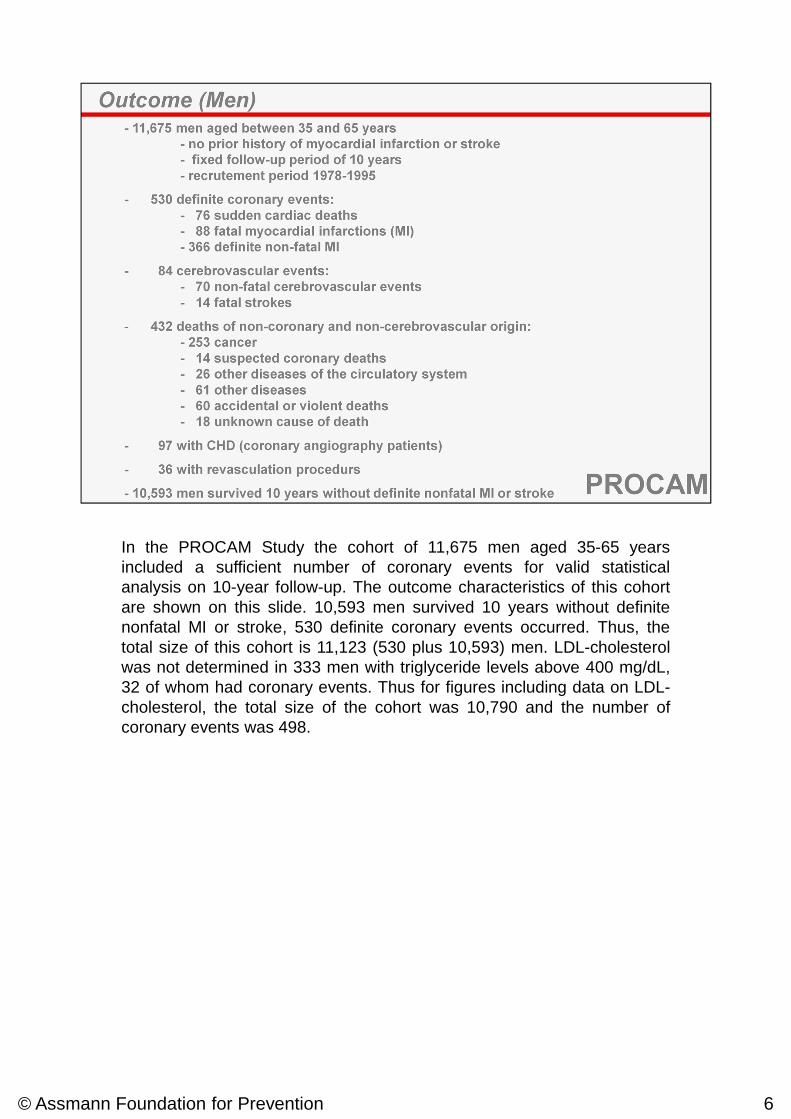
In the PROCAM Study the cohort of 11,675 men aged 35-65 yearsincluded a sufficient number of coronary events for valid statisticalanalysis on 10-year follow-up. The outcome characteristics of this cohortare shown on this slide. 10,593 men survived 10 years without definitenonfatal MI or stroke, 530 definite coronary events occurred. Thus, thetotal size of this cohort is 11,123 (530 plus 10,593) men. LDL-cholesterolwas not determined in 333 men with triglyceride levels above 400 mg/dL,32 of whom had coronary events. Thus for figures including data on LDL-cholesterol, the total size of the cohort was 10,790 and the number ofcoronary events was 498.
© Assmann Foundation for Prevention 6
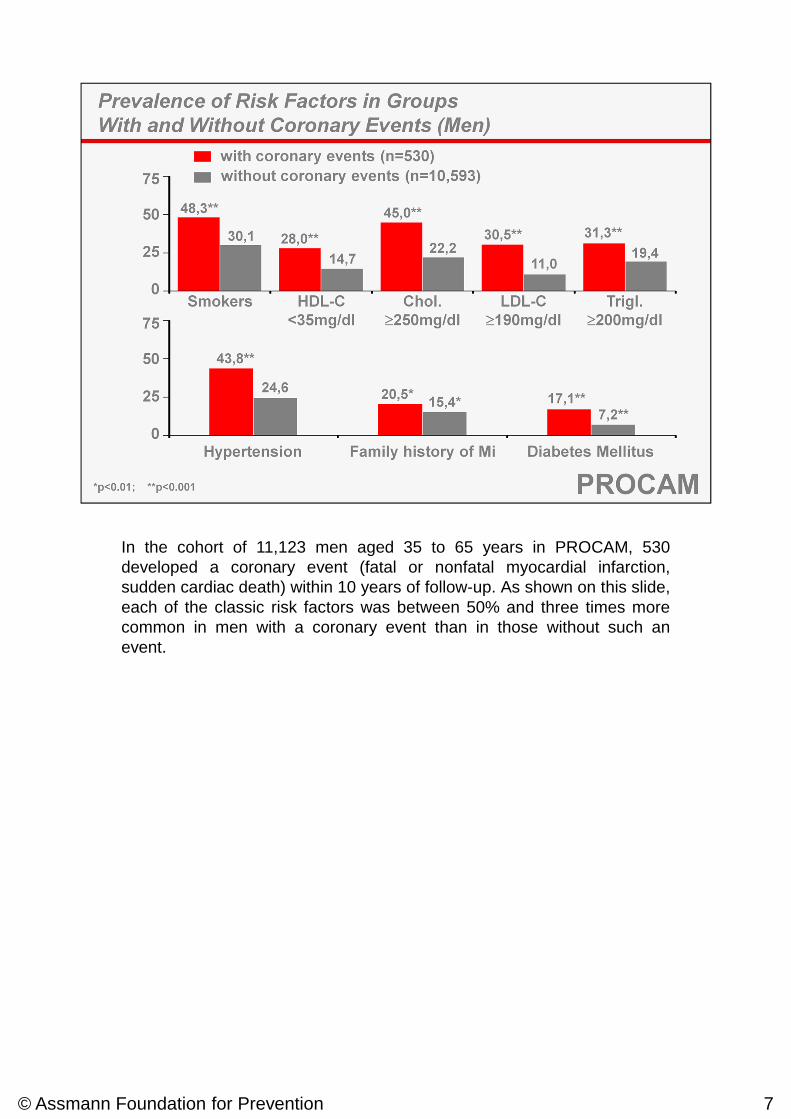
In the cohort of 11,123 men aged 35 to 65 years in PROCAM, 530developed a coronary event (fatal or nonfatal myocardial infarction,sudden cardiac death) within 10 years of follow-up. As shown on this slide,each of the classic risk factors was between 50% and three times morecommon in men with a coronary event than in those without such anevent.
© Assmann Foundation for Prevention 7
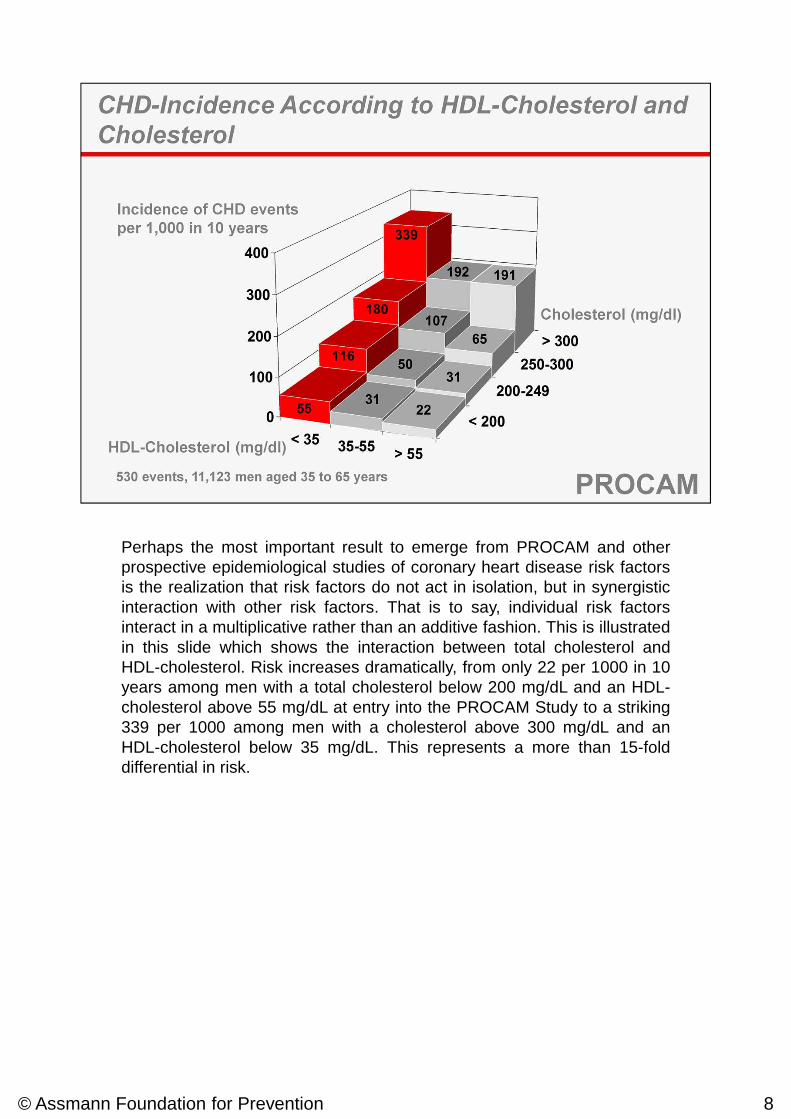
Perhaps the most important result to emerge from PROCAM and otherprospective epidemiological studies of coronary heart disease risk factorsis the realization that risk factors do not act in isolation, but in synergisticinteraction with other risk factors. That is to say, individual risk factorsinteract in a multiplicative rather than an additive fashion. This is illustratedin this slide which shows the interaction between total cholesterol andHDL-cholesterol. Risk increases dramatically, from only 22 per 1000 in 10years among men with a total cholesterol below 200 mg/dL and an HDL-cholesterol above 55 mg/dL at entry into the PROCAM Study to a striking339 per 1000 among men with a cholesterol above 300 mg/dL and anHDL-cholesterol below 35 mg/dL. This represents a more than 15-folddifferential in risk.
© Assmann Foundation for Prevention 8
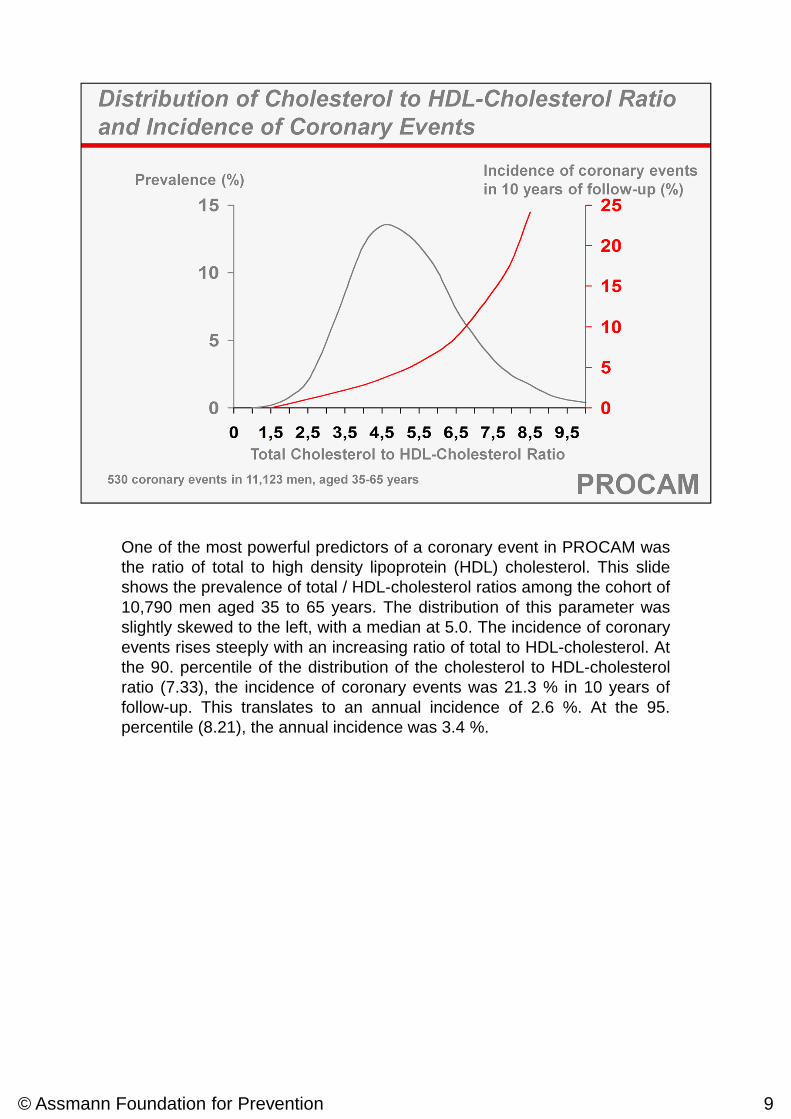
One of the most powerful predictors of a coronary event in PROCAM wasthe ratio of total to high density lipoprotein (HDL) cholesterol. This slideshows the prevalence of total / HDL-cholesterol ratios among the cohort of10,790 men aged 35 to 65 years. The distribution of this parameter wasslightly skewed to the left, with a median at 5.0. The incidence of coronaryevents rises steeply with an increasing ratio of total to HDL-cholesterol. Atthe 90. percentile of the distribution of the cholesterol to HDL-cholesterolratio (7.33), the incidence of coronary events was 21.3 % in 10 years offollow-up. This translates to an annual incidence of 2.6 %. At the 95.percentile (8.21), the annual incidence was 3.4 %.
© Assmann Foundation for Prevention 9
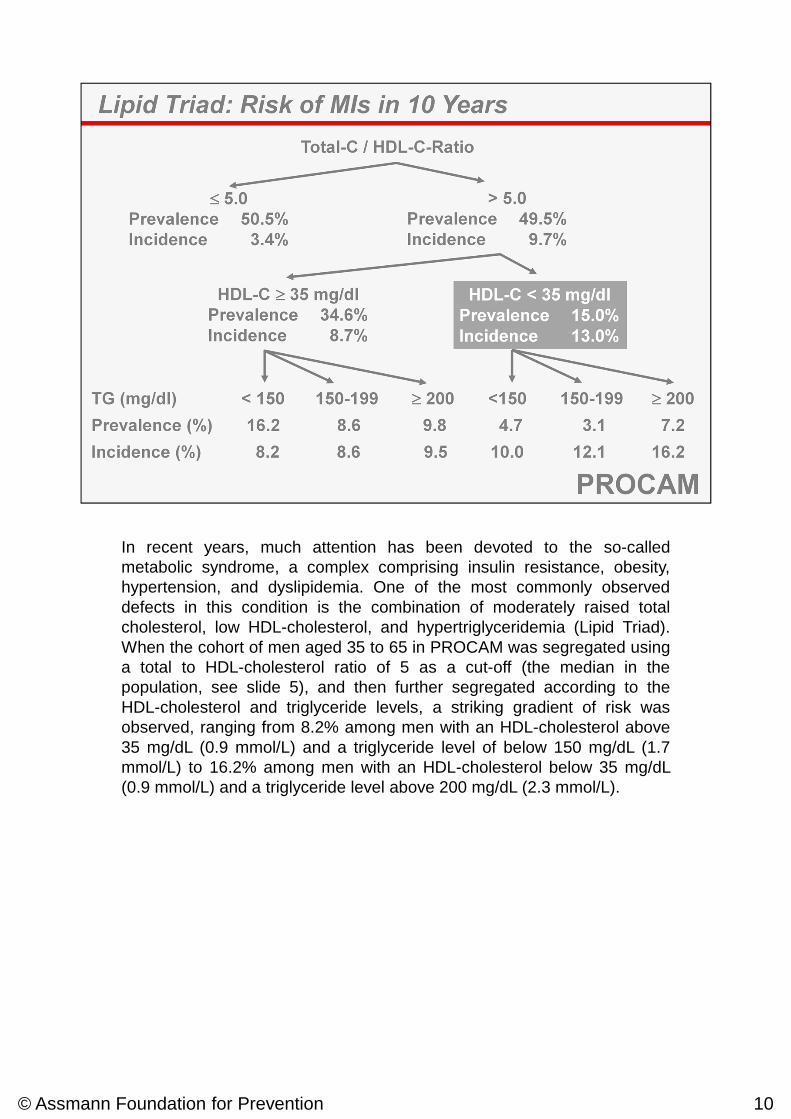
In recent years, much attention has been devoted to the so-calledmetabolic syndrome, a complex comprising insulin resistance, obesity,hypertension, and dyslipidemia. One of the most commonly observeddefects in this condition is the combination of moderately raised totalcholesterol, low HDL-cholesterol, and hypertriglyceridemia (Lipid Triad).When the cohort of men aged 35 to 65 in PROCAM was segregated usinga total to HDL-cholesterol ratio of 5 as a cut-off (the median in thepopulation, see slide 5), and then further segregated according to theHDL-cholesterol and triglyceride levels, a striking gradient of risk wasobserved, ranging from 8.2% among men with an HDL-cholesterol above35 mg/dL (0.9 mmol/L) and a triglyceride level of below 150 mg/dL (1.7mmol/L) to 16.2% among men with an HDL-cholesterol below 35 mg/dL(0.9 mmol/L) and a triglyceride level above 200 mg/dL (2.3 mmol/L).
© Assmann Foundation for Prevention 10
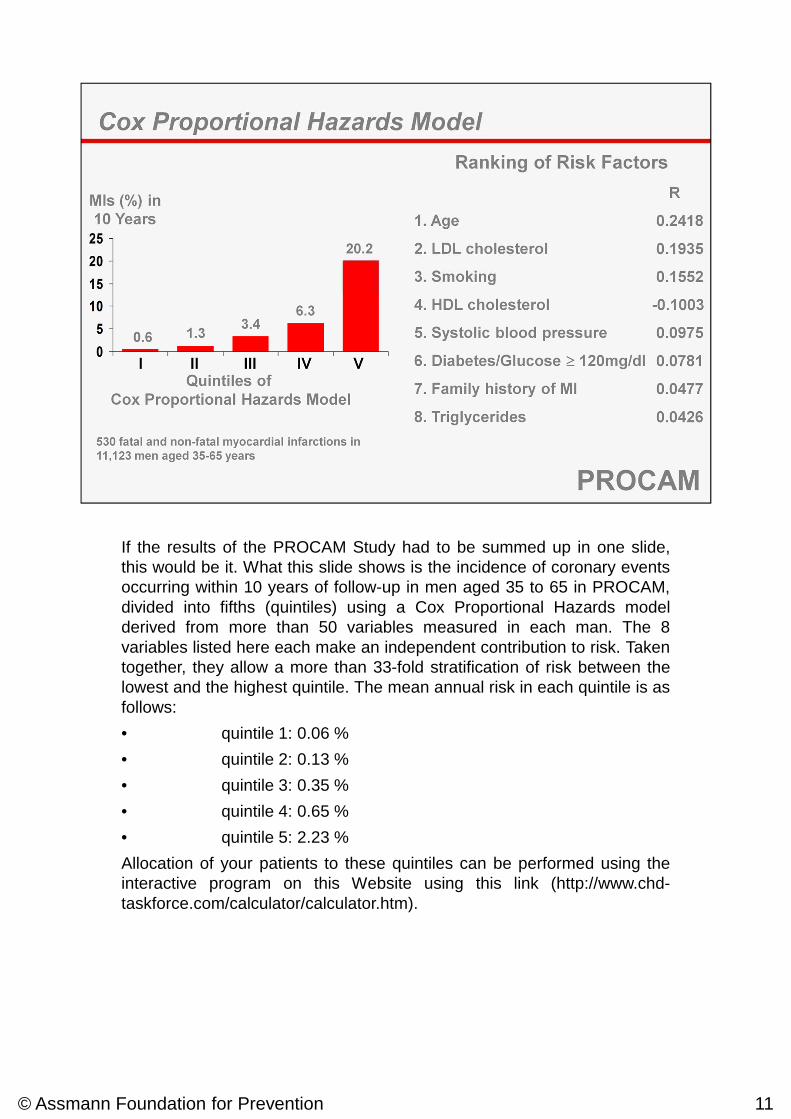
If the results of the PROCAM Study had to be summed up in one slide,this would be it. What this slide shows is the incidence of coronary eventsoccurring within 10 years of follow-up in men aged 35 to 65 in PROCAM,divided into fifths (quintiles) using a Cox Proportional Hazards modelderived from more than 50 variables measured in each man. The 8variables listed here each make an independent contribution to risk. Takentogether, they allow a more than 33-fold stratification of risk between thelowest and the highest quintile. The mean annual risk in each quintile is asfollows:
• quintile 1: 0.06 %
• quintile 2: 0.13 %
• quintile 3: 0.35 %
• quintile 4: 0.65 %
• quintile 5: 2.23 %
Allocation of your patients to these quintiles can be performed using theinteractive program on this Website using this link (http://www.chd-taskforce.com/calculator/calculator.htm).
© Assmann Foundation for Prevention 11
© Assmann Foundation for Prevention 12
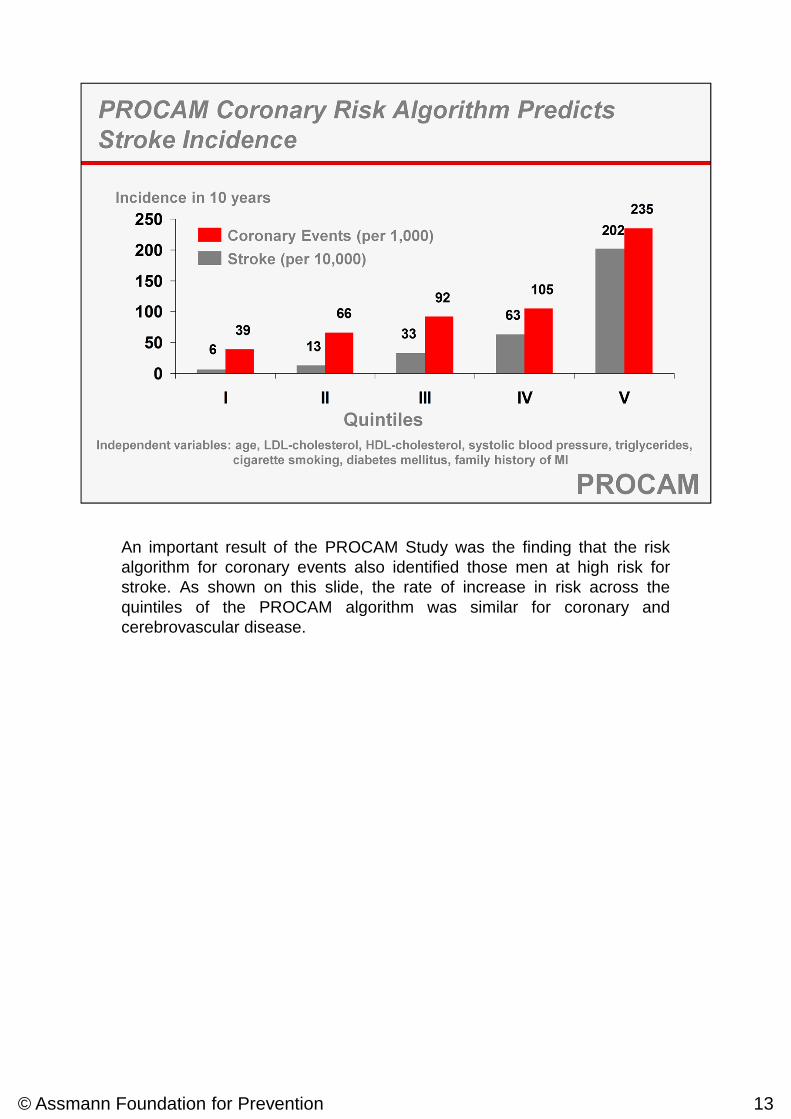
An important result of the PROCAM Study was the finding that the riskalgorithm for coronary events also identified those men at high risk forstroke. As shown on this slide, the rate of increase in risk across thequintiles of the PROCAM algorithm was similar for coronary andcerebrovascular disease.
© Assmann Foundation for Prevention 13
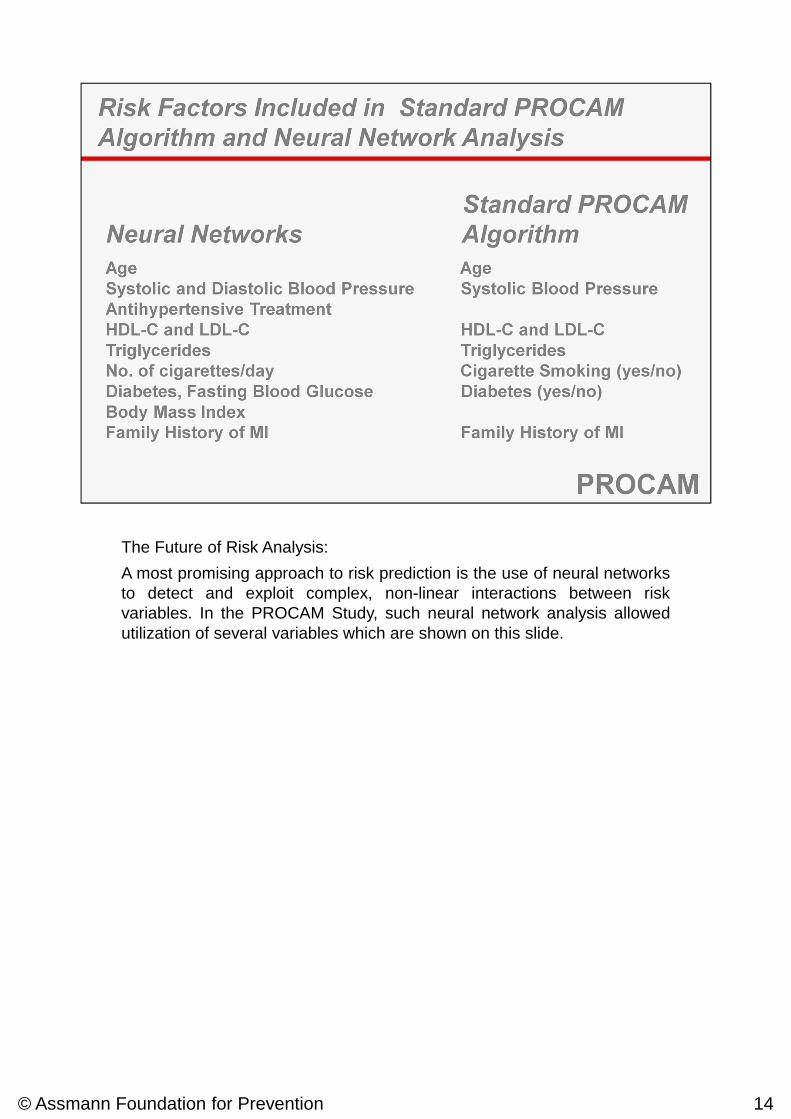
The Future of Risk Analysis:
A most promising approach to risk prediction is the use of neural networksto detect and exploit complex, non-linear interactions between riskvariables. In the PROCAM Study, such neural network analysis allowedutilization of several variables which are shown on this slide.
© Assmann Foundation for Prevention 14
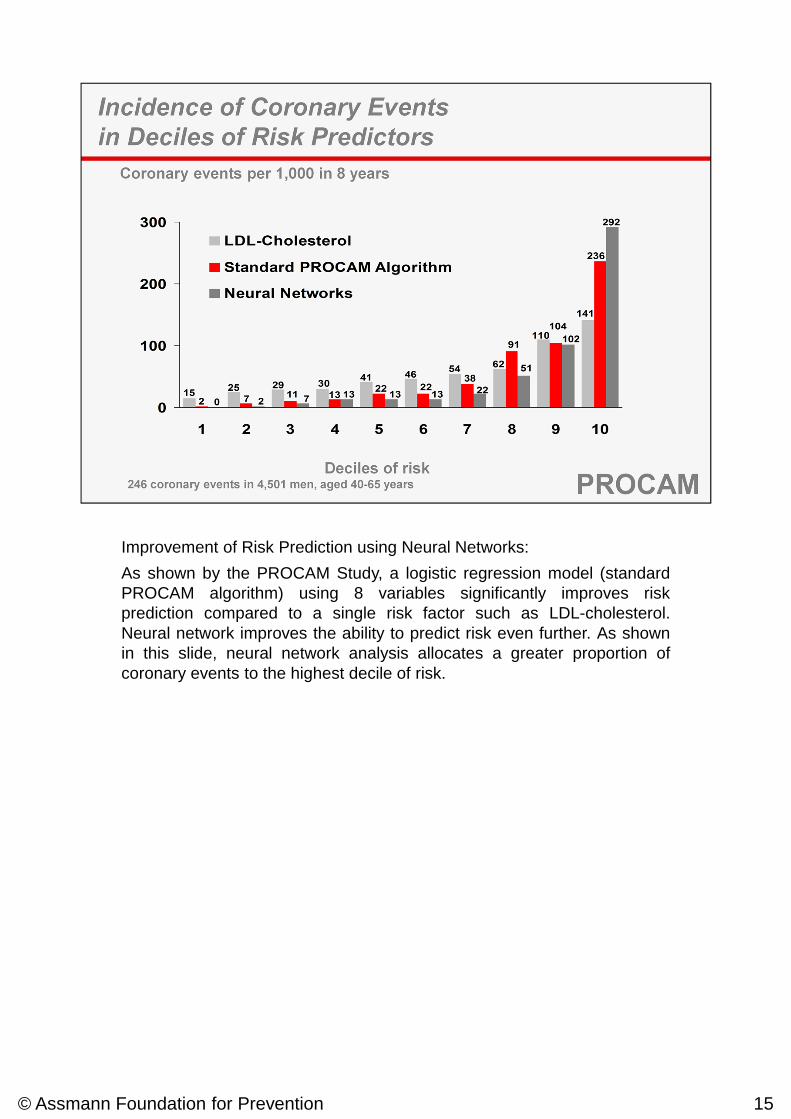
Improvement of Risk Prediction using Neural Networks:
As shown by the PROCAM Study, a logistic regression model (standardPROCAM algorithm) using 8 variables significantly improves riskprediction compared to a single risk factor such as LDL-cholesterol.Neural network improves the ability to predict risk even further. As shownin this slide, neural network analysis allocates a greater proportion ofcoronary events to the highest decile of risk.
© Assmann Foundation for Prevention 15

Perhaps the best measure of the performance of a predictive function isthe area under receiver operated characteristics (ROC)-curves. A testwhich perfectly discriminates between affected and non-affectedindividuals passes through the top left hand corner of the graph (areaunder curve 100%). A test with no discriminatory power follows the dashedline shown on this slide (area under curve 50%) The better a test, themore the ROC-curve deviates from this line. As can be seen on this slidethe area under the ROC-curve is significantly greater with neural networkanalysis compared to the standard PROCAM algorithm or single riskfactors.
© Assmann Foundation for Prevention 16