Embed Size (px)
Citation preview

�
ARTIS REIT
2015 FINANCIAL REPORT PROPERTIES OF SUCCESS


TABLE OF CONTENTS
ARTIS REAL ESTATE INVESTMENT TRUST 3 2015 FINANCIAL REPORT
TABLE OF CONTENTS
MANAGEMENT'S DISCUSSION AND ANALYSIS
OVERVIEW 4 ANALYSIS OF FINANCIAL POSITION 27
Primary Objective 4 Assets 28
Portfolio Summary 6 Liabilities 30
2015 ANNUAL HIGHLIGHTS 9 Unitholders' Equity 31
Portfolio Growth 9 LIQUIDITY AND CAPITAL RESOURCES 31
Financing Activities 9 Contractual Obligations 32
Distributions 10 SUMMARIZED QUARTERLY INFORMATION 33
SELECTED FINANCIAL INFORMATION 10 RELATED PARTY TRANSACTIONS 35
ANALYSIS OF OPERATING RESULTS 11 OUTSTANDING UNIT DATA 35
Revenue and Property NOI 12 OUTLOOK 35
Same Property NOI Analysis 13 Subsequent Events 36
Property NOI by Asset Class 14 RISKS AND UNCERTAINTIES 36
Property NOI by Geographical Region 14 Real Estate Ownership 36
Portfolio Occupancy 15 Interest Rate and Debt Financing 36
Portfolio Leasing Activity and Lease Expiries 16 Credit Risk and Tenant Concentration 37
Corporate Expenses 23 Lease Rollover Risk 37
Interest Expense 23 Tax Risk 38
Fair Value (Loss) Gain on Investment Properties 23 Foreign Currency Risk 38
Foreign Currency Translation Loss 23 Other Risks 38
Loss on Financial Instruments 23 CRITICAL ACCOUNTING ESTIMATES 38
Other Comprehensive Income 24 CHANGES IN ACCOUNTING POLICIES 39
Income Tax 24 CONTROLS AND PROCEDURES
Funds from Operations 24 Internal Controls over Financial Reporting
Adjusted Funds from Operations 26 Disclosure Controls and Procedures
CONSOLIDATED FINANCIAL STATEMENTS
MANAGEMENT'S RESPONSIBILITY FOR FINANCIAL STATEMENTS 40
AUDITOR'S REPORT 41
CONSOLIDATED BALANCE SHEETS 42
CONSOLIDATED STATEMENT OF OPERATIONS 43
CONSOLIDATED STATEMENT OF UNITHOLDERS EQUITY 44
CONSOLIDATED STATEMENT OF CASH FLOWS 45
NOTES TO CONSOLIDATED FINANCIAL STATEMENTS 46
39
39
39

MANAGEMENT'S DISCUSSION AND ANALYSIS(In thousands of Canadian dollars, unless otherwise noted)
2015 FINANCIAL REPORT 4 ARTIS REAL ESTATE INVESTMENT TRUST
The following management's discussion and analysis (“MD&A”) of the financial condition and results of operations of Artis Real Estate Investment Trust (“Artis" or the "REIT”) should be read in conjunction with the REIT’s audited annual consolidated financial statements for the years ended December 31, 2015 and 2014, and the notes thereto. This MD&A has been prepared taking into account material transactions and events up to and including February 29, 2016. Additional information about Artis, including the REIT’s most recent Annual Information Form, has been filed with applicable Canadian securities regulatory authorities and is available at www.sedar.com or on our website at www.artisreit.com.
The REIT has properties included in its investment in joint ventures accounted for using the equity method. This MD&A is prepared including Artis' ownership of all its properties on a proportionate share basis ("Proportionate Share"). Management is of the view that presentation on a proportionate share basis is representative of Artis' performance, financial position and other operating metrics. Artis provides a reconciliation to its consolidated financial statements in the Analysis of Operating Results and Analysis of Financial Position sections of this MD&A. All figures presented are on a proportionate share basis except where otherwise noted. Refer to the Proportionate Share commentary under the Notice with Respect to Non-GAAP Measures below.
FORWARD-LOOKING DISCLAIMER
This MD&A contains forward-looking statements. For this purpose, any statements contained herein that are not statements of historical fact may be deemed to be forward-looking statements. Particularly, statements regarding the REIT's future operating results, performance and achievements are forward-looking statements. Without limiting the foregoing, the words “expects”, “anticipates”, “intends”, “estimates”, “projects”, and similar expressions are intended to identify forward-looking statements.
Artis is subject to significant risks and uncertainties which may cause the actual results, performance or achievements of the REIT to be materially different from any future results, performance or achievements expressed or implied in these forward-looking statements. Such risk factors include, but are not limited to, risks associated with real property ownership, availability of cash flow, general uninsured losses, future property acquisitions and dispositions, environmental matters, tax related matters, debt financing, unitholder liability, potential conflicts of interest, potential dilution, reliance on key personnel, changes in legislation and changes in the tax treatment of trusts. Artis cannot assure investors that actual results will be consistent with any forward-looking statements and Artis assumes no obligation to update or revise such forward-looking statements to reflect actual events or new circumstances. All forward-looking statements contained in this MD&A are qualified by this cautionary statement.
NOTICE WITH RESPECT TO NON-GAAP MEASURES
Property Net Operating Income (“Property NOI”), Funds from Operations (“FFO”), Adjusted Funds from Operations ("AFFO") and Proportionate Share are non-GAAP measures commonly used by Canadian real estate investment trusts as an indicator of financial performance. "GAAP" means the generally accepted accounting principles described by the CPA Canada Handbook - Accounting, which are applicable as at the date on which any calculation using GAAP is to be made. As a publicly accountable enterprise, Artis applies the International Financial Reporting Standards (“IFRS”), as issued by the International Accounting Standards Board ("IASB").
Artis calculates Property NOI as revenues less property operating expenses such as utilities, repairs and maintenance and realty taxes. Property NOI does not include charges for interest and amortization. Management considers Property NOI to be a valuable measure for evaluating the operating performance of the REIT's properties.
Artis calculates FFO substantially in accordance with the guidelines set out by the Real Property Association of Canada (“REALpac”), as issued in April 2014. These guidelines include certain additional adjustments to FFO under IFRS from the previous definition of FFO. Management considers FFO to be a valuable measure for evaluating the REIT’s operating performance in achieving its objectives.
Artis calculates AFFO based on FFO for the period, net of allowances for normalized capital expenditures and leasing costs and excluding straight-line rent adjustments and unit-based compensation expense.
Artis accounts for its joint ventures using the equity method in its consolidated financial statements in accordance with IFRS. Proportionate Share includes Artis' interest in joint ventures based on its percentage of ownership in addition to the amounts per its consolidated financial statements.
Property NOI, FFO, AFFO and Proportionate Share are not measures defined under IFRS. Property NOI, FFO and AFFO and Proportionate Share are not intended to represent operating profits for the period, or from a property, nor should any of these measures be viewed as an alternative to net income, cash flow from operating activities or other measures of financial performance calculated in accordance with IFRS. Readers should be further cautioned that Property NOI, FFO, AFFO and Proportionate Share as calculated by Artis may not be comparable to similar measures presented by other issuers.
OVERVIEW
Artis is one of the largest diversified commercial real estate investment trusts in Canada and is an unincorporated closed-end real estate investment trust, created under, and governed by, the laws of the Province of Manitoba. The REIT was created pursuant to the Declaration of Trust dated November 8, 2004, as most recently amended and restated on August 2, 2012 (the "Declaration of Trust").
Certain of the REIT’s securities are listed on the Toronto Stock Exchange (the "TSX”). The REIT's trust units ("units") trade under the symbol AX.UN, the REIT's preferred units trade under the symbols AX.PR.A, AX.PR.U, AX.PR.E, AX.PR.G and the REIT’s Series F and Series G convertible debentures trade under the symbols AX.DB.F and AX.DB.U, respectively. As at February 29, 2016, there were 139,314,614 units, 2,316,000 options, 13,650,000 preferred units, 372,068 restricted units, and 19,519 deferred units of Artis outstanding (refer to the Outstanding Unit Data section for further details).
PRIMARY OBJECTIVE
Artis’ primary objective is to provide a stable, reliable and tax efficient monthly cash distribution as well as long-term appreciation in the value of Artis’ units through the accumulation and effective management of a quality portfolio of commercial real estate.
Since its inception, Artis has provided a steady stream of monthly cash distributions to its unitholders. The amount distributed annually is currently $1.08 per unit and is set by the Trustees in accordance with the Declaration of Trust.
Artis’ management utilizes several key strategies to meet this primary objective, which are executed with consideration given to current economic and market factors:
• Strategic Asset Ownership. Artis’ portfolio of office, retail and industrial real estate is strategically and diversely located in select primary and secondary markets in Canada and the United States (U.S.). Artis' management conducts ongoing analysis of the performance of its assets and the relevant economic fundamentals of its target markets, identifying opportunities to make accretive acquisitions, develop new generation real estate and dispose of assets that are not aligned with its long-term strategy.
• Prudent Financial Management. Artis has a long-term conservative approach to financial management, characterized by diligent management of its balance sheet, and prudent management of financial metrics, such as debt ratios, interest coverage ratios, payout ratios, and per unit metrics. Artis minimizes its risk related to interest rates by utilizing various sources of capital, and staggering debt maturities. Ample access to cash is required to fulfill distribution obligations and for ongoing operations, which includes re-investing in the portfolio, making accretive acquisitions and funding development projects.

MANAGEMENT'S DISCUSSION AND ANALYSIS(In thousands of Canadian dollars, unless otherwise noted)
ARTIS REAL ESTATE INVESTMENT TRUST 5 2015 FINANCIAL REPORT
• Disciplined Growth. Artis’ management strives to extract maximum value from its portfolio through effective management of assets, including leasing initiatives that focus on maintaining strong occupancy levels and realizing the gain between in-place rental rates and market rental rates. Artis’ management creates value through strategic asset redevelopment and property intensification initiatives, and through new development projects. New developments provide Artis an opportunity to build and own new generation real estate, and are considered in circumstances where the return on a development project is higher than that of acquiring an existing property.
2015 OVERVIEW
The economic environment over the last year has been challenging due to volatility in emerging markets and various global factors impacting the price of oil and other commodities. These challenges have impacted the cost of raising capital through the issuance of new trust units. Additionally, acquisition prices for commercial real estate in many of Artis’ Canadian target markets have been competitive, resulting in fewer opportunities to acquire quality real estate in Canada. These factors have provided an opportunity for management to recycle capital by disposing of non-core assets and redeploying the funds into new accretive opportunities. This has been a successful initiative for the REIT in 2015. During the year, Artis sold two non-core Canadian retail assets to owner-occupiers, and disposed of four office properties (two in Canada and two in the U.S.) at attractive capitalization rates. The proceeds from these dispositions were effectively redeployed to the acquisition of two high quality office buildings in the U.S., and to capitalize on a unique opportunity to acquire a 75% interest in a long-term leased portfolio of properties in Western Canada. Management is pleased with the results of this capital recycling program in 2015, and feels that these changes have improved the growth potential and overall quality of Artis' portfolio.
Given the impact that oil prices have had on the Alberta economy, Artis is anticipating challenges for its assets located in Alberta, particularly its Calgary office portfolio, for the foreseeable future. Management expects that in time, if oil prices continue to remain soft, the challenging environment will begin to impact other Alberta asset classes as well. In the meantime, management continues to monitor the Calgary office portfolio closely, as these assets face the most challenging operating environment of any of Artis’ segments. Management is proactive in new leasing and tenant retention initiatives, and is focused on minimizing risk wherever possible.
Conversely, due to the historically strong correlation between oil prices and the exchange rate relationship between the Canadian and US dollar, as oil prices have declined the US dollar has strengthened. This has proved beneficial for Artis, as 29.7% of Artis' Property NOI in the fourth quarter of 2015 was generated from its U.S. assets. Due to the strength of these markets and the success of these assets, the Board of Trustees has decided to increase Artis' U.S. target weighting to 35.0% of total Property NOI, to be met over time through disciplined expansion that will include both property acquisitions and new developments.
During 2015, Artis increased its unsecured revolving credit facilities to an aggregate amount of $300,000. The credit facilities provide Artis access to a flexible source of capital at a low interest rate.
Corporate Sustainability Progress
Artis is committed to improving the energy efficiency of its properties and reducing its environmental footprint. Artis has made significant advances in corporate sustainability and now has 20 properties with a LEED certification, 51 properties with a Building Owners and Managers Association (BOMA) Building Environmental Standards (BEST) certification, and 22 properties with an Energy Star certification. Corporate sustainability will continue to be a high priority for Artis in the future.

MANAGEMENT'S DISCUSSION AND ANALYSIS(In thousands of Canadian dollars, unless otherwise noted)
2015 FINANCIAL REPORT 6 ARTIS REAL ESTATE INVESTMENT TRUST
PORTFOLIO SUMMARY
At December 31, 2015, the REIT’s portfolio was comprised of 252 commercial properties totaling approximately 26.2 million square feet (S.F.) of gross leasable area (“GLA”).
Diversification by Geographical Region
Diversification by Asset Class

MANAGEMENT'S DISCUSSION AND ANALYSIS(In thousands of Canadian dollars, unless otherwise noted)
ARTIS REAL ESTATE INVESTMENT TRUST 7 2015 FINANCIAL REPORT
Portfolio by Asset Class as at December 31, 2015 (in 000's of S.F.) (1)
Asset Class City Province / StateNumber ofProperties
Owned Shareof GLA
% of PortfolioGLA
%Occupied
%Committed (2)
Canadian Portfolio:
Industrial Airdrie AB 1 28 0.1% 63.4% 63.4%
Calgary AB 9 670 2.6% 96.2% 96.2%
Greater Edmonton Area AB 11 1,281 4.9% 94.9% 94.9%
Greater Toronto Area ON 30 2,499 9.5% 93.1% 95.5%
Greater Vancouver Area BC 2 98 0.4% 100.0% 100.0%
Red Deer AB 1 126 0.5% 100.0% 100.0%
Regina SK 2 143 0.5% 100.0% 100.0%
Saskatoon SK 5 326 1.2% 100.0% 100.0%
Winnipeg MB 29 1,742 6.7% 86.0% 91.8%
Industrial total 90 6,913 26.4% 92.5% 94.8%
Office Calgary AB 20 2,538 9.7% 83.0% 91.7%
Greater Edmonton Area AB 1 48 0.2% 91.7% 91.7%
Greater Toronto Area ON 7 1,085 4.1% 87.1% 88.5%
Greater Vancouver Area BC 3 462 1.8% 91.4% 92.8%
Nanaimo BC 2 68 0.3% 100.0% 100.0%
Ottawa ON 2 287 1.1% 100.0% 100.0%
Red Deer AB 1 148 0.6% 74.5% 76.1%
Saskatoon SK 1 64 0.2% 100.0% 100.0%
Winnipeg MB 10 1,517 5.8% 88.9% 89.2%
Office total 47 6,217 23.8% 86.8% 90.8%
Retail Calgary AB 7 531 2.0% 96.0% 96.3%
Cranbrook BC 1 288 1.1% 97.4% 97.4%
Edson AB 1 20 0.1% 100.0% 100.0%
Estevan SK 2 174 0.7% 93.5% 93.5%
Fort McMurray AB 8 194 0.7% 96.7% 97.4%
Grande Prairie AB 5 361 1.4% 96.6% 96.6%
Greater Edmonton Area AB 6 504 1.9% 92.2% 98.4%
Greater Vancouver Area BC 1 165 0.6% 94.8% 94.8%
Lethbridge AB 1 53 0.2% 97.9% 100.0%
Medicine Hat AB 1 162 0.6% 100.0% 100.0%
Nanaimo BC 3 74 0.3% 50.8% 52.4%
Regina SK 8 533 2.0% 97.6% 97.6%
Saskatoon SK 3 219 0.8% 99.1% 100.0%
Westbank / West Kelowna BC 3 433 1.7% 99.6% 99.6%
Whistler BC 1 30 0.1% 97.1% 97.1%
Winnipeg MB 6 651 2.5% 98.1% 98.1%
Retail total 57 4,392 16.7% 96.0% 96.9%
Total Canadian portfolio 194 17,522 66.9% 91.4% 93.9%
U.S. Portfolio:
Industrial Greater Phoenix Area AZ 1 99 0.4% 100.0% 100.0%
Twin Cities Area MN 31 4,664 17.8% 95.5% 96.0%
Industrial total 32 4,763 18.2% 95.6% 96.0%
Office Greater Denver Area CO 4 634 2.4% 95.4% 96.9%
Greater Phoenix Area AZ 6 1002 3.8% 99.6% 99.6%
New Hartford NY 1 123 0.5% 100.0% 100.0%
Twin Cities Area MN 5 1,337 5.1% 92.2% 93.6%
Office total 16 3,096 11.8% 95.6% 96.5%
Retail Twin Cities Area MN 7 298 1.1% 97.7% 97.7%
Total U.S. portfolio 55 8,157 31.1% 95.7% 96.3%
Total Canadian and U.S. portfolio 249 25,679 98.0% 92.7% 94.7%
(1) Excluding properties held for redevelopment.
(2) Percentage committed is based on occupancy at December 31, 2015 plus commitments on vacant space.

MANAGEMENT'S DISCUSSION AND ANALYSIS(In thousands of Canadian dollars, unless otherwise noted)
2015 FINANCIAL REPORT 8 ARTIS REAL ESTATE INVESTMENT TRUST
Properties Held for Redevelopment (in 000's of S.F.)
Asset Class CityProvince /State
Number ofProperties
OwnedShare of
GLA
% ofPortfolio
GLA Property%
Occupied (1)
Industrial Twin Cities Area MN 1 120 0.5% Crosstown North 0.0%
Industrial Twin Cities Area MN 1 208 0.8% Northpoint Industrial Building 37.8%
Total properties held for redevelopment 2 328 1.3% 24.0%
(1) Percentage committed is based on occupancy at December 31, 2015 plus commitments on vacant space.
Crosstown North, an industrial building in the Twin Cities Area, Minnesota, is a cross-dock distribution facility originally designed to accommodate a single tenant. Artis anticipates that significant redevelopment work will be required to retrofit this property into a multi-use building. Artis continues to review development plans for this property, which is currently being marketed for lease.
Northpoint Industrial Building, an industrial property in the Twin Cities Area, Minnesota, was vacated by a large tenant, providing Artis with an opportunity to redevelop and reconfigure this older generation property to accommodate a single tenant or multiple tenants. Architectural plans and preliminary work to prepare the building for redevelopment is underway.
New Developments in Process (in 000's of S.F.)
Asset Class CityProvince /State
Number ofProperties
Owned Share of
GLA (1)
% ofPortfolio
GLA Property%
Completed %
Committed (2)
Industrial Greater Phoenix Area AZ 1 187 0.7% Park Lucero Phase I 100.0% 23.5%
Industrial Houston TX — — — Park 8Ninety Phase I 15.0% —%
Total new developments in process 1 187 0.7%
(1) Owned share of GLA includes only properties where construction is 100% completed.
(2) Percentage committed is based on occupancy at December 31, 2015 plus commitments on vacant space.
Artis has a 90% ownership interest (in the form of a joint venture arrangement) in Park Lucero, an industrial development on a 48 acre parcel of land in the Greater Phoenix Area, Arizona. This development will be completed in multiple phases. The first phase is complete and consists of three industrial buildings totaling 208,000 square feet. Planning is underway for phases two and three of this development, which are expected to comprise approximately 200,000 square feet each. The entire project is expected to total 608,000 square feet when complete.
Artis owns a 127 acre parcel of development land called Park 8Ninety located in the Southwest industrial submarket in Houston, Texas, which is expected to be developed in several phases into 1,800,000 square feet of new generation industrial buildings. Artis has a 95% ownership interest in Phase I of this project, which is expected to comprise three buildings totaling approximately 330,000 square feet when complete. Construction of Phase I commenced in Q4-15.
New Development Initiatives
Artis owns a 12 acre parcel of land in Winnipeg, Manitoba called Linden Ridge Shopping Centre II, which is located adjacent to Linden Ridge Shopping Centre, a retail property also owned by Artis. A land lease has been negotiated with a national tenant for nine acres at the site. Artis has the potential to develop an additional 35,000 square feet on the remaining three acres at the property.
Artis owns a 10 acre parcel of land for future development in the Greater Denver Area, Colorado. The first phase of this multi-phase project is expected to include the development of a 120,000 square foot Class A office building. The site, which can accommodate a total development of 320,000 square feet, is located on the I-25 with immediate connectivity to the light rail transit system and is adjacent to the DirecTV Building, an office asset owned by Artis.
Artis has a 90% ownership interest (in the form of a joint venture arrangement) in an office development project located along the I-10 on the west side of Houston, Texas. This project is expected to be developed in several phases, totaling approximately 1,600,000 square feet, with the first phase anticipated to comprise approximately 300,000 square feet. The commencement date for the construction of this project has not been determined at this time.
Completed Redevelopments
During Q2-15, Artis completed an extensive redevelopment of 1595 Buffalo Place, an industrial building in Winnipeg, Manitoba. This redevelopment included demolition of approximately 38,000 square feet of older generation space, and construction of new generation warehouse space in its place with higher ceilings and improved loading. Extensive renovation of the exterior of the entire building was also completed.
During Q2-15, Artis completed an extensive redevelopment of Pleasant Valley Landing, a retail building in Nanaimo, British Columbia. Pleasant Valley Landing was an older generation building that was originally leased to two tenants. After the tenants vacated, Artis demolished the building and constructed a state-of-the-art new generation multi-tenant retail property with improved parking in its place.
During Q2-15, Artis completed the redevelopment of 201 Westcreek Boulevard, an industrial property in the Greater Toronto Area, Ontario. The property, which was designed to accommodate a single tenant, was extensively redeveloped and was reconfigured to accommodate multiple tenants. 201 Westcreek Boulevard was 100% leased prior to commencement of this redevelopment project.
During Q4-15, Artis completed the redevelopment of Inkster Business Centre, an industrial property in Winnipeg, Manitoba. This building, which was an older generation industrial property, was extensively redeveloped and was reconfigured from a single tenant to a multi-tenant property.
Completed New Developments
Construction of Centrepoint, an approximately 104,000 square foot office building with an ancillary 400 stall parkade in Winnipeg, Manitoba was completed in Q2-15. This property is in a prime location in downtown Winnipeg, adjacent to the MTS Centre. Artis owns a 50% interest in this joint venture arrangement.
Construction of a 5,700 square foot retail building at 2190 McGillivray Boulevard in Winnipeg, Manitoba was completed in Q4-15. The building is 100% leased to a local restaurant, The Original Pancake House, pursuant to a long-term lease which commenced in Q4-15.

MANAGEMENT'S DISCUSSION AND ANALYSIS(In thousands of Canadian dollars, unless otherwise noted)
ARTIS REAL ESTATE INVESTMENT TRUST 9 2015 FINANCIAL REPORT
2015 ANNUAL HIGHLIGHTS
PORTFOLIO GROWTH
Artis acquired 10 commercial properties, completed two development projects and disposed of six commercial properties during 2015.
Office Retail Industrial Total
Number ofProperties
S.F.(000's) (1)
Number ofProperties
S.F.(000's) (1)
Number ofProperties
S.F.(000's) (1)
Number ofProperties
S.F.(000's) (1)
Portfolio properties at December 31, 2014 64 9,233 66 4,739 116 11,761 246 25,733
Acquisitions 2 488 — — 8 243 10 731
New developments 1 52 — 6 1 187 2 245
Dispositions (4) (460) (2) (55) — — (6) (515)
Portfolio properties at December 31, 2015 63 9,313 64 4,690 125 12,191 252 26,194
(1) Based on owned share of total leasable area.
Property Acquisitions
PropertyPropertyCount
AcquisitionDate Location
AssetClass
OwnedShare of
GLAPurchase
PriceCapitalization
Rate
The Point at Inverness (1) 1 March 26, 2015 Greater Denver Area, CO Office 93,592 US$ 19,500 6.30%
Graham Portfolio (2) 8 July 23, 2015 Various cities in BC, AB & SK Industrial 243,105 74,034 6.40%
Canadian Pacific Plaza 1 November 3, 2015 Twin Cities Area, MN Office 393,902 US68,550 7.50%
(1) Artis acquired a 50% interest in this joint venture.
(2) Artis acquired a 75% interest in this joint venture.
The above properties were acquired at a weighted-average capitalization rate of 6.85%. Artis' interest in these properties includes mortgage debt in the amount of $37,017 and US$49,500, with a weighted-average interest rate of 3.58% and 4.83%, respectively.
In 2015, Artis acquired office development land in the Greater Denver Area, Colorado for US$7,577. The purchase price for this land was settled with cash on hand.
Property Dispositions
Property Disposition Date Location Asset Class Sale PriceCapitalization
Rate
Moose Jaw Sobeys (1) June 18, 2015 Moose Jaw, SK Retail $ 5,300 n/a (2)
1045 Howe Street June 24, 2015 Greater Vancouver Area, BC Office 47,500 2.95%
605 Waterford Park October 9, 2015 Twin Cities Area, MN Office US31,500 6.79%
Willingdon Green November 2, 2015 Greater Vancouver Area, BC Office 16,685 5.53%
Gateway II November 30, 2015 Grande Prairie, AB Retail 2,700 n/a (2)
Mosaic Office Building December 30, 2015 Tampa, FL Office US25,263 6.00%
(1) Artis received a lease termination payment prior to the sale of this property.
(2) This property was vacant at the time of disposition, and was sold to an owner-occupier.
During 2015, Artis repaid $17,164 and US$11,442 of mortgage debt related to the disposition of the above properties.
FINANCING ACTIVITIES
Short Form Base Shelf Prospectus
On July 17, 2014, the REIT issued a new short form base shelf prospectus. The REIT may from time to time during the 25-month period that this short form base shelf prospectus is valid, offer and issue the following securities up to a maximum of $2,000,000 of initial offering price: (i) trust units of the REIT; (ii) preferred trust units, which may be issuable in series; (iii) debt securities, which may consist of debentures, notes or other types of debt and may be issuable in series; (iv) unit purchase warrants; and (v) subscription receipts to purchase trust securities. As at December 31, 2015, the REIT has issued senior unsecured debentures under one offering in the amount of $75,000 under this short form base shelf prospectus.
Unsecured Revolving Term Credit Facilities
During 2015, Artis increased the unsecured revolving term credit facilities to an aggregate amount of $300,000 and extended their maturity date to December 15, 2018. In 2015, Artis drew on these credit facilities in the amount of $225,000.
Debt Financing and Repayments
In 2015, Artis repaid 19 maturing mortgages in the amount of $170,490. Artis refinanced 10 maturing mortgages, and obtained new mortgage financing on one previously unencumbered property, net of financing costs, for a total of $20,536. In 2015, Artis drew on development loans in the amount of $12,077.

MANAGEMENT'S DISCUSSION AND ANALYSIS(In thousands of Canadian dollars, unless otherwise noted)
2015 FINANCIAL REPORT 10 ARTIS REAL ESTATE INVESTMENT TRUST
DISTRIBUTIONS
Artis declared distributions of $167,144 to unitholders in 2015, of which $31,916 was paid by way of distribution reinvestment, pursuant to Artis' Distribution Reinvestment and Unit Purchase Plan ("DRIP").
SELECTED FINANCIAL INFORMATION
Year endedDecember 31, %
Change
Year endedDecember 31,
000's, except per unit amounts 2015 2014 Change 2013
Revenue $ 552,502 $ 508,639 $ 43,863 8.6 % $ 467,035
Property NOI 341,952 317,382 24,570 7.7 % 298,939
Net (loss) income (175,699) 197,886 (373,585) (188.8)% 191,155
Basic (loss) income per common unit (1.41) 1.36 (2.77) (203.7)% 1.45
Diluted (loss) income per common unit (1.41) 1.33 (2.74) (206.0)% 1.41
Distributions to common unitholders $ 148,709 $ 143,668 $ 5,041 3.5 % $ 132,454
Distributions per common unit 1.08 1.08 — — % 1.08
FFO $ 215,881 $ 193,461 $ 22,420 11.6 % $ 183,467
FFO per unit 1.53 1.42 0.11 7.7 % 1.46
FFO after adjustments (1) 210,564 193,285 17,279 8.9 % 176,983
FFO per unit after adjustments (1) 1.49 1.42 0.07 4.9 % 1.41
FFO payout ratio after adjustments (1) 72.5% 76.1% (3.6)% 76.6%
AFFO $ 186,450 $ 164,761 $ 21,689 13.2 % $ 156,761
AFFO per unit 1.34 1.23 0.11 8.9 % 1.26
AFFO after adjustments (1) 180,321 164,585 15,736 9.6 % 150,277
AFFO per unit after adjustments (1) 1.30 1.23 0.07 5.7 % 1.21
AFFO payout ratio after adjustments (1) 83.1% 87.8% (4.7)% 89.3%
(1) Calculated after adjustments for lease terminations and non-recurring other income.
Acquisitions during 2014 and 2015, lease termination income and the impact of foreign exchange have contributed to the increase in revenues, Property NOI, FFO and AFFO in 2015.
December 31,2015
December 31,2014
%Change
December 31,2013
Consolidated financial statements debt to GBV:
Secured mortgages and loans to GBV 39.9% 41.3% (1.4)% 45.4%
Total long-term debt and bank indebtedness to GBV 51.4% 48.4% 3.0 % 49.0%
Proportionate Share debt to GBV:
Secured mortgages and loans to GBV 41.2% 41.9% (0.7)% 45.7%
Total long-term debt and bank indebtedness to GBV 52.4% 48.9% 3.5 % 49.3%
Total assets $ 5,651,280 $ 5,546,000 1.9 % $ 5,076,474
Total non-current financial liabilities 2,227,769 2,305,588 (3.4)% 2,218,683
Artis' total long-term debt and bank indebtedness to GBV ratio at December 31, 2015 increased 3.5% from December 31, 2014 primarily due to the fair value loss on investment properties recorded in 2015, of which a substantial portion relates to the Calgary office market.

MANAGEMENT'S DISCUSSION AND ANALYSIS(In thousands of Canadian dollars, unless otherwise noted)
ARTIS REAL ESTATE INVESTMENT TRUST 11 2015 FINANCIAL REPORT
ANALYSIS OF OPERATING RESULTS
The following tables provide a reconciliation of the consolidated statements of operations as prepared in accordance with IFRS in the REIT's consolidated financial statements to its Proportionate Share:
Three months ended December 31,
2015 2014
Perconsolidated
financialstatements Adjustment (1)
TotalProportionate
Share
Perconsolidated
financialstatements Adjustment (1)
TotalProportionate
Share
Revenue $ 136,829 $ 6,044 $ 142,873 $ 131,584 $ 2,295 $ 133,879
Expenses:
Property operating 33,456 1,702 35,158 32,515 794 33,309
Realty taxes 21,180 1,202 22,382 19,274 206 19,480
54,636 2,904 57,540 51,789 1,000 52,789
Net operating income 82,193 3,140 85,333 79,795 1,295 81,090
Other income (expenses):
Corporate expenses (3,089) — (3,089) (2,682) — (2,682)
Interest expense (27,591) (1,093) (28,684) (27,668) (331) (27,999)
Interest income 286 2 288 442 — 442
Net loss from investments in joint ventures (4,987) 4,987 — (4,104) 4,104 —
Fair value (loss) gain on investment properties (245,022) (7,036) (252,058) 19,248 (5,068) 14,180
Foreign currency translation gain (loss) 410 — 410 (4,295) — (4,295)
Transaction costs (521) — (521) (844) — (844)
Gain (loss) on financial instruments 2,426 — 2,426 (3,281) — (3,281)
Net (loss) income (195,895) — (195,895) 56,611 — 56,611
Other comprehensive income that may bereclassified to net (loss) income in subsequentperiods:
Unrealized foreign currency translation gain 27,422 — 27,422 25,466 — 25,466
Other comprehensive income that will not bereclassified to net (loss) income in subsequentperiods:
Unrealized gain from remeasurements ofnet pension obligation 1 — 1 — — —
27,423 — 27,423 25,466 — 25,466
Total comprehensive (loss) income $ (168,472) $ — $ (168,472) $ 82,077 $ — $ 82,077
(1) Adjustment to reflect investments in joint ventures on a proportionate share basis.

MANAGEMENT'S DISCUSSION AND ANALYSIS(In thousands of Canadian dollars, unless otherwise noted)
2015 FINANCIAL REPORT 12 ARTIS REAL ESTATE INVESTMENT TRUST
Year ended December 31,
2015 2014
Perconsolidated
financialstatements Adjustment (1)
TotalProportionate
Share
Perconsolidated
financialstatements Adjustment (1)
TotalProportionate
Share
Revenue $ 535,574 $ 16,928 $ 552,502 $ 500,558 $ 8,081 $ 508,639
Expenses:
Property operating 120,188 4,916 125,104 112,997 2,715 115,712
Realty taxes 82,990 2,456 85,446 74,713 832 75,545
203,178 7,372 210,550 187,710 3,547 191,257
Net operating income 332,396 9,556 341,952 312,848 4,534 317,382
Other income (expenses):
Corporate expenses (11,510) — (11,510) (10,261) (10,261)
Interest expense (110,482) (2,982) (113,464) (108,546) (1,166) (109,712)
Interest income 1,319 2 1,321 1,818 — 1,818
Net income (loss) from investments in jointventures 297 (297) — (3,987) 3,987 —
Fair value (loss) gain on investment properties (365,626) (6,279) (371,905) 38,831 (7,355) 31,476
Foreign currency translation loss (16,413) — (16,413) (21,890) — (21,890)
Transaction costs (2,136) — (2,136) (2,490) — (2,490)
Loss on financial instruments (3,544) — (3,544) (8,437) — (8,437)
Net (loss) income (175,699) — (175,699) 197,886 — 197,886
Other comprehensive income that may bereclassified to net (loss) income in subsequentperiods:
Unrealized foreign currency translation gain 147,727 — 147,727 66,844 — 66,844
Other comprehensive income that will not bereclassified to net (loss) income in subsequentperiods:
Unrealized gain from remeasurements ofnet pension obligation 2 — 2 — — —
147,729 — 147,729 66,844 — 66,844
Total comprehensive (loss) income $ (27,970) $ — $ (27,970) $ 264,730 $ — $ 264,730
(1) Adjustment to reflect investments in joint ventures on a proportionate share basis.
REVENUE AND PROPERTY NOI
Three months endedDecember 31,
% Change
Year endedDecember 31,
% Change2015 2014 Change 2015 2014 Change
Revenue:
Basic rent, parking and other revenue $ 94,258 $ 88,853 $ 5,405 $ 375,590 $ 344,799 $ 30,791
Operating cost and realty tax recoveries 50,909 46,474 4,435 182,928 169,419 13,509
Amortization of tenant inducements (3,694) (2,753) (941) (14,008) (10,572) (3,436)
Straight-line rent adjustments 1,227 1,232 (5) 3,499 4,817 (1,318)
Lease termination income 173 73 100 4,493 176 4,317
142,873 133,879 8,994 6.7% 552,502 508,639 43,863 8.6%
Expenses:
Property operating 35,158 33,309 1,849 125,104 115,712 9,392
Realty taxes 22,382 19,480 2,902 85,446 75,545 9,901
57,540 52,789 4,751 9.0% 210,550 191,257 19,293 10.1%
Property NOI $ 85,333 $ 81,090 $ 4,243 5.2% $ 341,952 $ 317,382 $ 24,570 7.7%
Basic rent, parking, other revenue, operating cost and realty tax recoveries are revenues earned from tenants primarily related to lease agreements.
Artis accounts for tenant inducements by amortizing the cost over the term of the tenant's lease.
Artis accounts for rent step-ups by straight-lining the incremental increases over the entire non-cancelable lease term.
Lease termination income relates to payments received from tenants where the REIT and the tenant agreed to terminate a lease prior to the contractual expiry date. Lease termination income is common in the real estate industry, however, it is unpredictable and period-over-period changes are not indicative of trends.

MANAGEMENT'S DISCUSSION AND ANALYSIS(In thousands of Canadian dollars, unless otherwise noted)
ARTIS REAL ESTATE INVESTMENT TRUST 13 2015 FINANCIAL REPORT
Property operating expenses include costs related to interior and exterior maintenance, HVAC, insurance, utilities and property management expenses.
In 2015, Artis received non-recurring income from a settlement relating to an access restriction at a previously disposed retail property in British Columbia.
SAME PROPERTY NOI ANALYSIS
Same property comparison includes only stabilized investment properties owned on January 1, 2014, and excludes properties disposed of subsequent to January 1, 2014 and those held for redevelopment.
Three months endedDecember 31,
% Change
Year endedDecember 31,
% Change2015 2014 Change 2015 2014 Change
Revenue $ 130,568 $ 125,654 $ 510,651 $ 491,511
Property operating expenses 53,050 50,138 199,154 188,832
Property NOI 77,518 75,516 $ 2,002 2.7% 311,497 302,679 $ 8,818 2.9%
Add (deduct) non-cash revenue adjustments:
Amortization of tenant inducements 3,482 2,617 13,494 10,300
Straight-line rent adjustment (856) (1,096) (2,542) (4,541)
Property NOI less non-cash revenue adjustments $ 80,144 $ 77,037 $ 3,107 4.0% $ 322,449 $ 308,438 $ 14,011 4.5%
Lease termination income related to significant tenants of $1,478 (Q4-15 - $62) in 2015, compared to $nil (Q4-14 - $nil) in 2014, has been excluded from revenue for purposes of the same property income calculation. The portion that covers lost revenue due to vacancy has been added back to income for the purposes of the same property income calculation.
Same Property NOI by Asset Class
Three months endedDecember 31,
% Change
Year endedDecember 31,
% Change2015 2014 Change 2015 2014 Change
Retail $ 20,052 $ 18,891 $ 1,161 6.1 % $ 77,582 $ 74,595 $ 2,987 4.0%
Office 39,576 40,009 (433) (1.1)% 166,943 162,916 4,027 2.5%
Industrial 20,516 18,137 2,379 13.1 % 77,924 70,927 6,997 9.9%
Total $ 80,144 $ 77,037 $ 3,107 4.0 % $ 322,449 $ 308,438 $ 14,011 4.5%
Same Property NOI by Geographical Region
Three months endedDecember 31,
% Change
Year endedDecember 31,
% Change2015 2014 Change 2015 2014 Change
Alberta $ 28,284 $ 29,697 $ (1,413) (4.8)% $ 117,962 $ 119,080 $ (1,118) (0.9)%
British Columbia 5,828 5,704 124 2.2 % 24,451 23,863 588 2.5 %
Manitoba 10,305 10,067 238 2.4 % 41,000 40,454 546 1.3 %
Ontario 9,041 8,908 133 1.5 % 35,708 36,797 (1,089) (3.0)%
Saskatchewan 4,963 4,469 494 11.1 % 18,512 17,603 909 5.2 %
Minnesota 12,245 10,088 2,157 21.4 % 46,719 38,841 7,878 20.3 %
U.S. - Other 9,478 8,104 1,374 17.0 % 38,097 31,800 6,297 19.8 %
Total $ 80,144 $ 77,037 $ 3,107 4.0 % $ 322,449 $ 308,438 $ 14,011 4.5 %
Artis’ Calgary office portfolio decreased $2,491 (Q4-15 - $1,556), or 4.2% (Q4-15 - 10.7%) in 2015. Approximately $2,395 (Q4-15 - $1,912) of this decrease can be attributed to the vacating of AMEC Americas Ltd. Their space has been leased to a new tenant commencing in 2016.
Same Property NOI by Country
Three months endedDecember 31,
% Change
Year endedDecember 31,
% Change2015 2014 Change 2015 2014 Change
Canada $ 58,421 $ 58,845 $ (424) (0.7)% $ 237,633 $ 237,797 $ (164) (0.1)%
U.S. 21,723 18,192 3,531 19.4 % 84,816 70,641 14,175 20.1 %
Total $ 80,144 $ 77,037 $ 3,107 4.0 % $ 322,449 $ 308,438 $ 14,011 4.5 %
Artis’ U.S. portfolio achieved an increase in 2015 of US$2,392 (Q4-15 - US$251), or 3.7% (Q4-15 - 1.6%) before the impact of foreign exchange.

MANAGEMENT'S DISCUSSION AND ANALYSIS(In thousands of Canadian dollars, unless otherwise noted)
2015 FINANCIAL REPORT 14 ARTIS REAL ESTATE INVESTMENT TRUST
Same Property Occupancy Comparisons
As at December 31,Geographical Region 2015 2014
Alberta 89.9% 95.9%
British Columbia 94.0% 93.8%
Manitoba 89.2% 87.8%
Ontario 91.9% 92.3%
Saskatchewan 98.8% 92.6%
Minnesota 95.8% 95.9%
U.S. - Other 99.0% 96.4%
Total 92.8% 93.7%
As at December 31,Asset Class 2015 2014
Retail 96.2% 95.0%
Office 89.9% 94.6%
Industrial 93.7% 92.6%
Total 92.8% 93.7%
PROPERTY NOI BY ASSET CLASS
In 2015, revenues and Property NOI increased for all segments in comparison to 2014. The growth is primarily attributable to acquisitions during 2014 and 2015 and the impact of foreign exchange. In Q4-15, Property NOI decreased for the office segment primarily due to the bankruptcy of a large tenant at Concorde Corporate Centre, an expiring lease at Heritage Square and the dispositions of 1045 Howe Street, Willingdon Green and 605 Waterford Park. All of the vacated space at Heritage Square has been leased to a new tenant commencing in 2016.
Three months ended December 31,
2015 2014
Retail Office Industrial Retail Office Industrial
Revenue $ 32,003 $ 77,034 $ 33,793 $ 30,658 $ 74,623 $ 28,565
Property operating expenses and realty taxes 10,841 34,657 12,042 10,490 31,998 10,301
Property NOI $ 21,162 $ 42,377 $ 21,751 $ 20,168 $ 42,625 $ 18,264
Share of Property NOI 24.8% 49.7% 25.5% 24.9% 52.6% 22.5%
Year ended December 31,
2015 2014
Retail Office Industrial Retail Office Industrial
Revenue $ 128,302 $ 299,996 $ 124,028 $ 113,534 $ 282,687 $ 112,164
Property operating expenses and realty taxes 41,144 125,714 43,692 36,864 115,977 38,416
Property NOI $ 87,158 $ 174,282 $ 80,336 $ 76,670 $ 166,710 $ 73,748
Share of Property NOI 25.5% 51.0% 23.5% 24.2% 52.5% 23.3%
PROPERTY NOI BY GEOGRAPHICAL REGION
In 2015, revenues and Property NOI increased in Alberta, British Columbia, Manitoba, Saskatchewan, Minnesota and U.S. - Other in comparison to 2014. The growth is primarily attributable to acquisitions during 2014 and 2015 and the impact of foreign exchange. In 2015, Property NOI decreased in Ontario primarily due to the bankruptcy of a large tenant at Concorde Corporate Centre. In Q4-15, Property NOI decreased in Alberta primarily due to an expiring lease at Heritage Square and in British Columbia primarily due to the dispositions of 1045 Howe Street and Willingdon Green in 2015. All of the vacated space at Heritage Square has been leased to a new tenant commencing in 2016.
Three months ended December 31, 2015
Canada U.S.
AB BC MB ON SK MN Other
Revenue $ 46,648 $ 9,135 $ 20,301 $ 15,515 $ 8,403 $ 26,044 $ 16,784Property operating expenses and realty taxes 17,155 3,488 10,121 6,507 2,741 11,467 6,061
Property NOI $ 29,493 $ 5,647 $ 10,180 $ 9,008 $ 5,662 $ 14,577 $ 10,723
Share of Property NOI 34.6% 6.6% 11.9% 10.6% 6.6% 17.1% 12.6%

MANAGEMENT'S DISCUSSION AND ANALYSIS(In thousands of Canadian dollars, unless otherwise noted)
ARTIS REAL ESTATE INVESTMENT TRUST 15 2015 FINANCIAL REPORT
Three months ended December 31, 2014
Canada U.S.
AB BC MB ON SK MN Other
Revenue $ 46,988 $ 10,301 $ 19,363 $ 16,089 $ 7,010 $ 21,021 $ 13,074Property operating expenses and realty taxes 15,743 4,301 9,457 7,114 2,458 9,381 4,335
Property NOI $ 31,245 $ 6,000 $ 9,906 $ 8,975 $ 4,552 $ 11,640 $ 8,739
Share of Property NOI 38.5% 7.4% 12.2% 11.1% 5.6% 14.4% 10.8%
Year ended December 31, 2015
Canada U.S.
AB BC MB ON SK MN Other
Revenue $ 186,093 $ 41,020 $ 74,186 $ 60,977 $ 32,677 $ 94,963 $ 62,410Property operating expenses and realty taxes 63,701 14,960 33,556 25,835 9,690 41,484 21,324
Property NOI $ 122,392 $ 26,060 $ 40,630 $ 35,142 $ 22,987 $ 53,479 $ 41,086
Share of Property NOI 35.9% 7.6% 11.9% 10.3% 6.7% 15.6% 12.0%
Year ended December 31, 2014
Canada U.S.
AB BC MB ON SK MN Other
Revenue $ 180,163 $ 40,573 $ 71,232 $ 62,657 $ 26,559 $ 76,469 $ 50,732Property operating expenses and realty taxes 58,459 15,218 32,853 24,754 8,912 33,588 17,473
Property NOI $ 121,704 $ 25,355 $ 38,379 $ 37,903 $ 17,647 $ 42,881 $ 33,259
Share of Property NOI 38.3% 8.0% 12.1% 12.0% 5.6% 13.5% 10.5%
PORTFOLIO OCCUPANCY
Occupancy levels impact the REIT’s revenues and Property NOI. Occupancy and commitments at December 31, 2015 (excluding properties held for redevelopment and new developments in process), and the previous four periods, are as follows:
Occupancy Report by Asset Class
Q4-15 % Committed (1) Q4-15 Q3-15 Q2-15 Q1-15 Q4-14
Retail 97.0% 96.1% 94.5% 94.5% 95.1% 95.9%
Office 92.7% 89.7% 90.9% 93.0% 93.7% 93.9%
Industrial 95.3% 93.8% 94.2% 94.2% 95.5% 94.7%
Total portfolio 94.7% 92.7% 93.1% 93.8% 94.7% 94.6%
(1) Percentage committed is based on occupancy at December 31, 2015 plus commitments on vacant space.
Occupancy Report by Geographical Region
Q4-15 % Committed (1) Q4-15 Q3-15 Q2-15 Q1-15 Q4-14
Canada:
Alberta 94.1% 90.2% 90.6% 94.0% 94.6% 95.7%
British Columbia 94.6% 94.1% 95.0% 94.5% 96.8% 97.1%
Manitoba 91.9% 89.1% 90.2% 90.2% 93.1% 93.5%
Ontario 93.8% 91.9% 93.6% 92.7% 95.1% 95.7%
Saskatchewan 98.4% 98.2% 94.8% 94.3% 94.0% 93.1%
U.S.:
Minnesota 95.5% 94.9% 94.5% 94.7% 94.6% 92.7%
Other 98.7% 98.2% 98.3% 98.3% 96.5% 96.5%
Total portfolio 94.7% 92.7% 93.1% 93.8% 94.7% 94.6%
(1) Percentage committed is based on occupancy at December 31, 2015 plus commitments on vacant space.

MANAGEMENT'S DISCUSSION AND ANALYSIS(In thousands of Canadian dollars, unless otherwise noted)
2015 FINANCIAL REPORT 16 ARTIS REAL ESTATE INVESTMENT TRUST
PORTFOLIO LEASING ACTIVITY AND LEASE EXPIRIES
Renewal Summary
Three months endedDecember 31,
Year endedDecember 31,
2015 2014 2015 2014
Leasable area renewed 675,856 507,277 2,301,433 1,554,819
Increase in weighted-average rental rate (0.1)% 7.2% 3.7% 4.2%
The percentage change on renewal activity is calculated by comparing the rental rate in place at the end of the expiring term to the rental rate in place at the commencement of the new term. In many cases, leases are negotiated or renewed such that there are contractual rent escalations over the course of the new lease term. In these cases, the average rent over the new term will be higher than the rate at commencement, which is not reflected in the above table results.
Lease Expiries by Asset Class (in S.F.) (1)
CurrentVacancy
Monthly Tenants (2) 2016 2017 2018 2019
2020& later Total
Office - uncommitted 680,269 69,836 695,796 988,195 971,852 1,134,148 4,303,164 8,843,260
Office - committed 276,377 — 148,137 10,117 19,564 7,454 8,037 469,686
Total office 956,646 69,836 843,933 998,312 991,416 1,141,602 4,311,201 9,312,946
Retail - uncommitted 141,586 35,446 304,250 383,771 557,233 424,635 2,397,287 4,244,208
Retail - committed 40,009 — 256,534 115,188 5,800 6,259 22,124 445,914
Total retail 181,595 35,446 560,784 498,959 563,033 430,894 2,419,411 4,690,122
Industrial - uncommitted 938,495 109,567 1,884,427 1,790,349 1,156,918 975,802 4,289,595 11,145,153
Industrial - committed 197,632 — 614,558 172,320 — — 60,984 1,045,494
Total industrial 1,136,127 109,567 2,498,985 1,962,669 1,156,918 975,802 4,350,579 12,190,647
Total - uncommitted 1,760,350 214,849 2,884,473 3,162,315 2,686,003 2,534,585 10,990,046 24,232,621
Total - committed 514,018 — 1,019,229 297,625 25,364 13,713 91,145 1,961,094
Total portfolio 2,274,368 214,849 3,903,702 3,459,940 2,711,367 2,548,298 11,081,191 26,193,715
(1) Based on owned share of total leasable area.
(2) Includes holdovers and renewals where term has not been negotiated.
In-Place Rents
In-place rents reflect the weighted-average net annual rental rate per square foot as at December 31, 2015 for the leasable area expiring in the year indicated. In-place rents do not reflect either the average rate over the term of the lease or the rate in place in the year of expiry.
Market Rents
Market rents are estimates and are shown as a net annual rate per square foot. Artis reviews market rents across the portfolio on an on-going basis. Market rent estimates are based on management's best estimate for each leasable space and may take into consideration the property manager's revenue budget, recent leasing activity, current prospects, future commitments or publicly available market information. Rates applied in future expiry years (with the exception of certain segments of the Alberta market) do not allow for the impact of inflation, nor do they attempt to factor in anticipated higher (or lower) than normal periods of demand or market rent inflation due to specific market conditions.
MANAGEMENT'S DISCUSSION AND ANALYSIS(In thousands of Canadian dollars, unless otherwise noted)
ARTIS REAL ESTATE INVESTMENT TRUST 17 2015 FINANCIAL REPORT
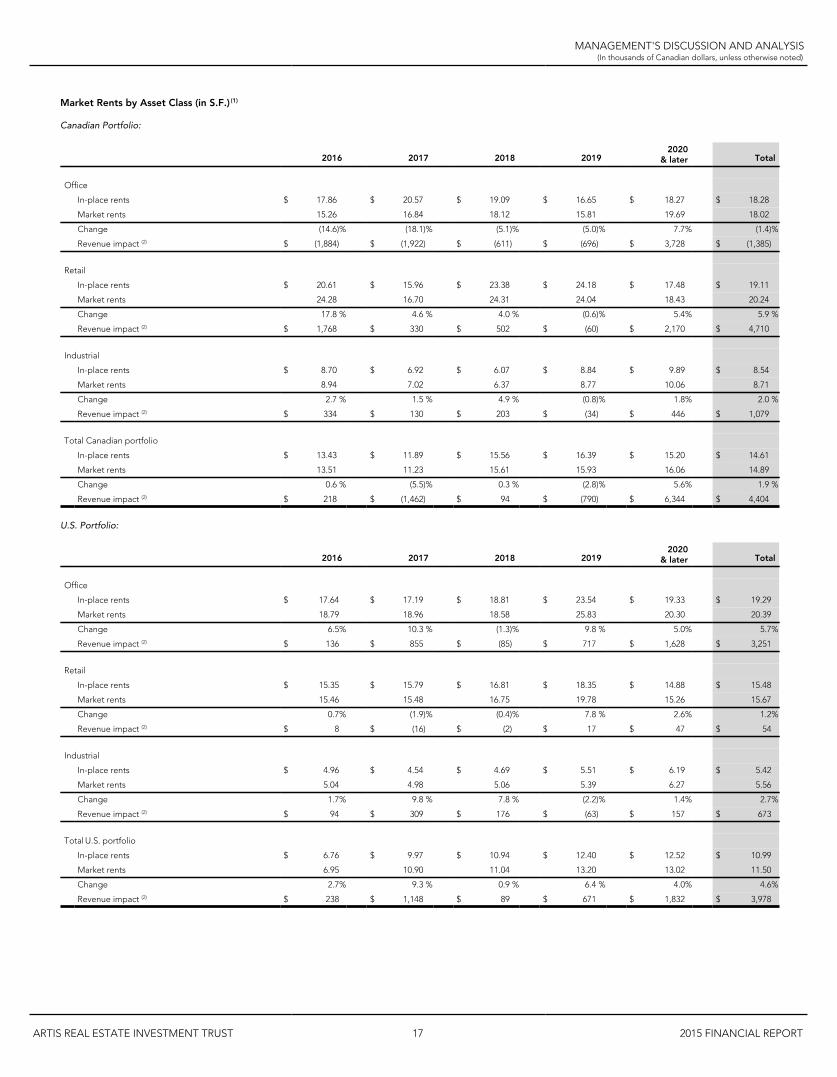
Market Rents by Asset Class (in S.F.) (1)
Canadian Portfolio:
2016 2017 2018 20192020
& later Total
Office
In-place rents $ 17.86 $ 20.57 $ 19.09 $ 16.65 $ 18.27 $ 18.28
Market rents 15.26 16.84 18.12 15.81 19.69 18.02
Change (14.6)% (18.1)% (5.1)% (5.0)% 7.7% (1.4)%
Revenue impact (2) $ (1,884) $ (1,922) $ (611) $ (696) $ 3,728 $ (1,385)
Retail
In-place rents $ 20.61 $ 15.96 $ 23.38 $ 24.18 $ 17.48 $ 19.11
Market rents 24.28 16.70 24.31 24.04 18.43 20.24
Change 17.8 % 4.6 % 4.0 % (0.6)% 5.4% 5.9 %
Revenue impact (2) $ 1,768 $ 330 $ 502 $ (60) $ 2,170 $ 4,710
Industrial
In-place rents $ 8.70 $ 6.92 $ 6.07 $ 8.84 $ 9.89 $ 8.54
Market rents 8.94 7.02 6.37 8.77 10.06 8.71
Change 2.7 % 1.5 % 4.9 % (0.8)% 1.8% 2.0 %
Revenue impact (2) $ 334 $ 130 $ 203 $ (34) $ 446 $ 1,079
Total Canadian portfolio
In-place rents $ 13.43 $ 11.89 $ 15.56 $ 16.39 $ 15.20 $ 14.61
Market rents 13.51 11.23 15.61 15.93 16.06 14.89
Change 0.6 % (5.5)% 0.3 % (2.8)% 5.6% 1.9 %
Revenue impact (2) $ 218 $ (1,462) $ 94 $ (790) $ 6,344 $ 4,404
U.S. Portfolio:
2016 2017 2018 20192020
& later Total
Office
In-place rents $ 17.64 $ 17.19 $ 18.81 $ 23.54 $ 19.33 $ 19.29
Market rents 18.79 18.96 18.58 25.83 20.30 20.39
Change 6.5% 10.3 % (1.3)% 9.8 % 5.0% 5.7%
Revenue impact (2) $ 136 $ 855 $ (85) $ 717 $ 1,628 $ 3,251
Retail
In-place rents $ 15.35 $ 15.79 $ 16.81 $ 18.35 $ 14.88 $ 15.48
Market rents 15.46 15.48 16.75 19.78 15.26 15.67
Change 0.7% (1.9)% (0.4)% 7.8 % 2.6% 1.2%
Revenue impact (2) $ 8 $ (16) $ (2) $ 17 $ 47 $ 54
Industrial
In-place rents $ 4.96 $ 4.54 $ 4.69 $ 5.51 $ 6.19 $ 5.42
Market rents 5.04 4.98 5.06 5.39 6.27 5.56
Change 1.7% 9.8 % 7.8 % (2.2)% 1.4% 2.7%
Revenue impact (2) $ 94 $ 309 $ 176 $ (63) $ 157 $ 673
Total U.S. portfolio
In-place rents $ 6.76 $ 9.97 $ 10.94 $ 12.40 $ 12.52 $ 10.99
Market rents 6.95 10.90 11.04 13.20 13.02 11.50
Change 2.7% 9.3 % 0.9 % 6.4 % 4.0% 4.6%
Revenue impact (2) $ 238 $ 1,148 $ 89 $ 671 $ 1,832 $ 3,978

MANAGEMENT'S DISCUSSION AND ANALYSIS(In thousands of Canadian dollars, unless otherwise noted)
2015 FINANCIAL REPORT 18 ARTIS REAL ESTATE INVESTMENT TRUST
Total Canadian and U.S. Portfolio:
2016 2017 2018 20192020
& later Total
Office
In-place rents $ 17.83 $ 18.93 $ 18.99 $ 18.53 $ 18.68 $ 18.64
Market rents 15.75 17.86 18.29 18.55 19.92 18.87
Change (11.6)% (5.6)% (3.7)% 0.1 % 6.6% 1.2%
Revenue impact (2) $ (1,748) $ (1,067) $ (696) $ 21 $ 5,356 $ 1,866
Retail
In-place rents $ 19.87 $ 15.94 $ 23.08 $ 24.02 $ 17.35 $ 18.87
Market rents 23.04 16.57 23.97 23.92 18.27 19.94
Change 15.9 % 3.9 % 3.9 % (0.4)% 5.3% 5.6%
Revenue impact (2) $ 1,776 $ 314 $ 500 $ (43) $ 2,217 $ 4,764
Industrial
In-place rents $ 7.07 $ 6.07 $ 5.50 $ 7.08 $ 8.32 $ 7.22
Market rents 7.24 6.30 5.83 6.98 8.45 7.38
Change 2.4 % 3.7 % 6.0 % (1.4)% 1.7% 2.2%
Revenue impact (2) $ 428 $ 439 $ 379 $ (97) $ 603 $ 1,752
Total Canadian and U.S. portfolio
In-place rents $ 11.23 $ 11.21 $ 14.08 $ 15.08 $ 14.32 $ 13.41
Market rents 11.35 11.11 14.15 15.03 15.06 13.77
Change 1.0 % (0.8)% 0.5 % (0.3)% 5.2% 2.6%
Revenue impact (2) $ 456 $ (314) $ 183 $ (119) $ 8,176 $ 8,382
(1) Based on owned share of total leasable area.
(2) This impact is based on the difference between the in-place rents and the market rents for the period in Canadian and US dollars. This excludes the impact of any straight-line rent adjustments on revenues.
Market rents at December 31, 2015 are estimated to be 2.6% above in-place rents across the portfolio compared to 3.7% at September 30, 2015 and 5.5% at December 31, 2014. Today's market rents for the 2016 and 2017 lease expiries are estimated to be 1.0% above and 0.8% below in-place rents, respectively. Market rents for the office portfolio in certain years are estimated to be below in-place rents due to the impact of the Calgary office segment. The retail portfolio is expected to be the strongest contributor to incremental rental revenue over the long-term.

MANAGEMENT'S DISCUSSION AND ANALYSIS(In thousands of Canadian dollars, unless otherwise noted)
ARTIS REAL ESTATE INVESTMENT TRUST 19 2015 FINANCIAL REPORT
Lease Expiries by Geographical Region (in S.F.) (1)
CurrentVacancy
Monthly Tenants (2) 2016 2017 2018 2019
2020& later Total
AB - uncommitted 396,138 65,753 878,987 532,160 733,838 768,834 2,817,630 6,193,340
AB - committed 258,436 — 196,966 13,764 — — 2,218 471,384
Total Alberta 654,574 65,753 1,075,953 545,924 733,838 768,834 2,819,848 6,664,724
BC - uncommitted 87,703 12,903 101,580 89,517 118,066 236,824 814,474 1,461,067
BC - committed 7,340 — 28,082 106,393 1,533 6,259 8,037 157,644
Total British Columbia 95,043 12,903 129,662 195,910 119,599 243,083 822,511 1,618,711
MB - uncommitted 318,096 44,082 442,064 476,159 595,813 184,016 1,566,438 3,626,668
MB - committed 106,942 — 102,471 1,800 2,095 7,454 62,052 282,814
Total Manitoba 425,038 44,082 544,535 477,959 597,908 191,470 1,628,490 3,909,482
ON - uncommitted 238,078 44,507 361,944 648,757 202,399 426,846 1,443,609 3,366,140
ON - committed 73,999 — 408,970 8,424 12,633 — — 504,026
Total Ontario 312,077 44,507 770,914 657,181 215,032 426,846 1,443,609 3,870,166
SK - uncommitted 24,029 10,274 55,949 343,071 174,119 78,481 702,633 1,388,556
SK - committed 2,025 — 39,944 5,275 4,267 — 18,838 70,349
Total Saskatchewan 26,054 10,274 95,893 348,346 178,386 78,481 721,471 1,458,905
MN - uncommitted 529,801 35,372 997,198 747,599 691,082 594,439 2,590,037 6,185,528
MN - committed 39,826 — 235,154 161,969 4,836 — — 441,785
Total Minnesota 569,627 35,372 1,232,352 909,568 695,918 594,439 2,590,037 6,627,313
U.S. - Other - uncommitted 166,505 1,958 46,751 325,052 170,686 245,145 1,055,225 2,011,322
U.S. - Other - committed 25,450 — 7,642 — — — — 33,092
Total U.S. - Other 191,955 1,958 54,393 325,052 170,686 245,145 1,055,225 2,044,414
Total - uncommitted 1,760,350 214,849 2,884,473 3,162,315 2,686,003 2,534,585 10,990,046 24,232,621
Total - committed 514,018 — 1,019,229 297,625 25,364 13,713 91,145 1,961,094
Total portfolio 2,274,368 214,849 3,903,702 3,459,940 2,711,367 2,548,298 11,081,191 26,193,715
(1) Based on owned share of total leasable area.
(2) Includes holdovers and renewals where term has not been negotiated.

MANAGEMENT'S DISCUSSION AND ANALYSIS(In thousands of Canadian dollars, unless otherwise noted)
2015 FINANCIAL REPORT 20 ARTIS REAL ESTATE INVESTMENT TRUST
Market Rents by Geographical Region (in S.F.) (1)
2016 2017 2018 20192020
& later Total
Alberta
In-place rents $ 17.84 $ 20.37 $ 20.41 $ 19.87 $ 17.59 $ 18.54
Market rents 17.33 16.74 19.77 18.56 19.39 18.71
Change (2.8)% (17.8)% (3.2)% (6.6)% 10.2 % 0.9 %
Revenue impact (2) $ (542) $ (1,985) $ (476) $ (1,012) $ 5,059 $ 1,044
British Columbia
In-place rents $ 19.33 $ 11.71 $ 25.68 $ 18.45 $ 12.79 $ 15.14
Market rents 20.13 11.81 25.60 19.01 13.33 15.60
Change 4.1 % 0.9 % (0.3)% 3.0 % 4.2 % 3.0 %
Revenue impact (2) $ 103 $ 20 $ (10) $ 136 $ 445 $ 694
Manitoba
In-place rents $ 10.26 $ 11.04 $ 8.12 $ 10.36 $ 15.19 $ 12.33
Market rents 11.23 11.66 8.98 10.61 15.67 12.97
Change 9.5 % 5.7 % 10.6 % 2.4 % 3.2 % 5.1 %
Revenue impact (2) $ 528 $ 298 $ 513 $ 48 $ 785 $ 2,172
Ontario
In-place rents $ 7.84 $ 6.75 $ 10.40 $ 11.00 $ 11.87 $ 9.83
Market rents 7.74 6.79 10.73 11.06 11.60 9.73
Change (1.4)% 0.6 % 3.2 % 0.5 % (2.3)% (1.0)%
Revenue impact (2) $ (83) $ 27 $ 71 $ 25 $ (397) $ (357)
Saskatchewan
In-place rents $ 18.93 $ 9.57 $ 19.96 $ 19.97 $ 15.31 $ 14.99
Market rents 21.14 10.09 19.94 20.13 15.94 15.59
Change 11.7 % 5.3 % (0.1)% 0.8 % 4.1 % 4.0 %
Revenue impact (2) $ 212 $ 178 $ (4) $ 13 $ 452 $ 851
Minnesota
In-place rents $ 6.11 $ 6.51 $ 9.35 $ 7.00 $ 8.69 $ 7.74
Market rents 6.18 7.19 9.35 6.94 8.81 7.91
Change 1.1 % 10.5 % — % (0.8)% 1.4 % 2.1 %
Revenue impact (2) $ 86 $ 620 $ 3 $ (35) $ 314 $ 988
U.S. - Other
In-place rents $ 21.61 $ 19.66 $ 17.41 $ 25.47 $ 21.92 $ 21.57
Market rents 24.40 21.29 17.92 28.36 23.36 23.19
Change 12.9 % 8.3 % 2.9 % 11.3 % 6.6 % 7.5 %
Revenue impact (2) $ 152 $ 528 $ 86 $ 706 $ 1,518 $ 2,990
Total portfolio
In-place rents $ 11.23 $ 11.21 $ 14.08 $ 15.08 $ 14.32 $ 13.41
Market rents 11.35 11.11 14.15 15.03 15.06 13.77
Change 1.0 % (0.8)% 0.5 % (0.3)% 5.2 % 2.6 %
Revenue impact (2) $ 456 $ (314) $ 183 $ (119) $ 8,176 $ 8,382
(1) Based on owned share of total leasable area.
(2) This impact is based on the difference between the in-place rents and the market rents for the period in Canadian and US dollars. This excludes the impact of any straight-line rent adjustments on revenues.
Artis' real estate is diversified across five Canadian provinces and five U.S. states, and across the office, retail and industrial asset classes. At December 31, 2015, the five largest segments of the REIT’s portfolio (by Property NOI) are Calgary office, Twin Cities Area industrial, Greater Phoenix Area office, Twin Cities Area office and Winnipeg office.The Calgary office segment represents 14.7% of the Q4-15 Property NOI and 9.7% of the overall portfolio by GLA. 41.3% of the Calgary office GLA is located downtown, 22.6% is beltline and 36.1% is suburban. Overall direct vacancy in the Calgary office market, as reported by CBRE, was 10.9% at December 31, 2015, compared to 9.1% at September 30, 2015. At December 31, 2015, the Calgary office segment of Artis’ portfolio was 83.0% occupied, compared to 86.1% at September 30, 2015. Approximately 8% of this vacancy can be attributed to the vacating of AMEC Americas Ltd.; however, all of the space vacated by AMEC Americas Ltd. has been leased to a new tenant pursuant to a lease commencing in 2016. During 2016, 313,270 square feet comes up for renewal, which represents 1.2% of the total portfolio GLA; 12.2% had been renewed or committed to new leases at December 31, 2015. Approximately 39.5% of the Calgary office GLA expires in 2020 or later. Artis’ largest 10 Calgary office tenants by GLA (including a new tenant at Heritage Square with a lease scheduled to commence in 2016) lease nearly half of Artis’ Calgary office space with a weighted-average lease term of 5.8 years. The average size of Artis' Calgary office tenants is approximately 9,400 square feet.

MANAGEMENT'S DISCUSSION AND ANALYSIS(In thousands of Canadian dollars, unless otherwise noted)
ARTIS REAL ESTATE INVESTMENT TRUST 21 2015 FINANCIAL REPORT
Lease Expiries for Calgary Office Segment (in S.F.) (1):
CurrentVacancy
Monthly Tenants (2) 2016 2017 2018 2019
2020& later Total
Downtown - uncommitted 144,362 12,420 194,386 205,283 128,691 133,958 189,868 1,008,968
Downtown - committed 2,921 — 36,735 — — — — 39,656
Total downtown 147,283 12,420 231,121 205,283 128,691 133,958 189,868 1,048,624
Beltline - uncommitted 23,539 102 43,185 5,613 109,555 41,930 347,799 571,723
Beltline - committed 2,800 — — — — — — 2,800
Total beltline 26,339 102 43,185 5,613 109,555 41,930 347,799 574,523
Suburban - uncommitted 43,073 8,337 37,408 55,090 43,525 47,568 464,204 699,205
Suburban - committed 214,106 — 1,556 — — — — 215,662
Total suburban 257,179 8,337 38,964 55,090 43,525 47,568 464,204 914,867
Total - uncommitted 210,974 20,859 274,979 265,986 281,771 223,456 1,001,871 2,279,896
Total - committed 219,827 — 38,291 — — — — 258,118
Total Calgary office 430,801 20,859 313,270 265,986 281,771 223,456 1,001,871 2,538,014
(1) Based on owned share of total leasable area.
(2) Includes holdovers and renewals where term has not been negotiated.
Lease Expiries for the Office Segment excluding Calgary (in S.F.) (1):
CurrentVacancy
Monthly Tenants (2) 2016 2017 2018 2019
2020& later Total
Other - uncommitted 469,295 48,977 420,817 722,209 690,081 910,692 3,301,293 6,563,364
Other - committed 56,550 — 109,846 10,117 19,564 7,454 8,037 211,568
Total other office 525,845 48,977 530,663 732,326 709,645 918,146 3,309,330 6,774,932
(1) Based on owned share of total leasable area.
(2) Includes holdovers and renewals where term has not been negotiated.

MANAGEMENT'S DISCUSSION AND ANALYSIS(In thousands of Canadian dollars, unless otherwise noted)
2015 FINANCIAL REPORT 22 ARTIS REAL ESTATE INVESTMENT TRUST
Market Rents for Calgary Office Segment (in S.F.) (1):
The market rents reported in the below table are reflective of management’s estimates for today’s market rent rates. They do not allow for the impact of inflation. The Calgary office market rents for the next 24 months are revised on an on-going basis to reflect management’s estimate of the impact of the recent decline in oil prices on the Calgary office market.
2016 2017 2018 20192020
& later Total
Downtown
In-place rents $ 24.17 $ 26.13 $ 21.13 $ 23.26 $ 22.98 $ 23.79
Market rents 15.31 15.95 18.58 19.95 23.92 18.47
Change (36.7)% (39.0)% (12.1)% (14.2)% 4.1% (22.4)%
Revenue impact (2) $ (2,047) $ (2,091) $ (329) $ (443) $ 179 $ (4,731)
Beltline
In-place rents $ 27.12 $ 25.50 $ 27.79 $ 33.67 $ 14.89 $ 19.97
Market rents 20.67 22.00 22.68 25.65 22.80 22.82
Change (23.8)% (13.7)% (18.4)% (23.8)% 53.2% 14.2 %
Revenue impact (2) $ (279) $ (20) $ (559) $ (336) $ 2,752 $ 1,558
Suburban
In-place rents $ 16.27 $ 16.21 $ 17.66 $ 18.60 $ 23.18 $ 21.47
Market rents 14.65 15.70 17.25 19.20 23.92 21.87
Change (10.0)% (3.2)% (2.3)% 3.2 % 3.2% 1.9 %
Revenue impact (2) $ (63) $ (28) $ (18) $ 28 $ 342 $ 261
Total Calgary Office
In-place rents $ 23.60 $ 24.07 $ 23.18 $ 24.22 $ 20.26 $ 22.07
Market rents 15.97 16.02 19.97 20.86 23.53 20.67
Change (32.3)% (33.4)% (13.9)% (13.9)% 16.1% (6.3)%
Revenue impact (2) $ (2,389) $ (2,139) $ (906) $ (751) $ 3,273 $ (2,912)
(1) Based on owned share of total leasable area.
(2) This impact is based on the difference between the in-place rents and the market rents for the period. This excludes the impact of any straight-line rent adjustments on revenues.
Market Rents for the Office Segment excluding Calgary (in S.F.) (1):
2016 2017 2018 20192020
& later Total
Other office
In-place rents $ 14.42 $ 17.07 $ 17.32 $ 17.15 $ 18.20 $ 17.49
Market rents 15.63 18.53 17.62 17.99 18.83 18.26
Change 8.4% 8.6% 1.7% 4.9% 3.5% 4.4%
Revenue impact (2) $ 641 $ 1,072 $ 210 $ 772 $ 2,083 $ 4,778
(1) Based on owned share of total leasable area.
(2) This impact is based on the difference between the in-place rents and the market rents for the period in Canadian and US dollars. This excludes the impact of any straight-line rent adjustments on revenues.
The Twin Cities Area industrial segment represents 8.7% of the Q4-15 Property NOI and 19.1% of the overall portfolio by GLA. Direct vacancy in this industrial market, as reported by CBRE, changed from 5.5% at September 30, 2015 to 5.6% at December 31, 2015, with 1,036,124 square feet of positive absorption reported for the quarter. As per CBRE, this was the 22nd consecutive quarter of positive absorption for this market. The average asking market lease rate was $5.52 per square foot, increased from $5.19 per square foot at September 30, 2015. Occupancy in this segment of the portfolio, excluding properties held for redevelopment, was 95.5% at December 31, 2015, compared to 95.6% at September 30, 2015. During 2016, 1,089,102 square feet comes up for renewal, which represents 4.2% of the total portfolio GLA; commitments were in place for 13.4% of the expiring space at December 31, 2015.
The Greater Phoenix Area office segment represents 6.9% of the Q4-15 Property NOI and 3.8% of the overall portfolio by GLA. The average asking market lease rate was $22.90 per square foot at December 31, 2015, increased from $22.48 per square foot at September 30, 2015. Overall direct vacancy in the Greater Phoenix Area office market, as reported by CBRE, was 19.3% at December 31, 2015, down from 20.0% at September 30, 2015. Occupancy in this segment of the portfolio was 99.6% at December 31, 2015, unchanged from 99.6% at September 30, 2015. There are no leases expiring in Artis' Greater Phoenix Area office portfolio in 2016.
The Twin Cities Area office segment represents 6.8% of the Q4-15 Property NOI and 5.1% of the overall portfolio by GLA. Overall direct vacancy in this office market, as reported by CBRE, was 15.5% at December 31, 2015, up slightly from 15.0% at September 30, 2015. At December 31, 2015, the Twin Cities Area office segment of Artis’ portfolio was 92.2% occupied, increased from 88.8% at September 30, 2015. During the remainder of 2016, 64,749 square feet comes up for renewal, which represents 0.2% of the total portfolio GLA; 17.1% had been renewed or committed to new leases at December 31, 2015. Approximately 55.9% of the Twin Cities Area office GLA expires in 2020 or later.

MANAGEMENT'S DISCUSSION AND ANALYSIS(In thousands of Canadian dollars, unless otherwise noted)
ARTIS REAL ESTATE INVESTMENT TRUST 23 2015 FINANCIAL REPORT
The Winnipeg office segment represents 6.5% of the Q4-15 Property NOI and 5.8% of the overall portfolio by GLA. Artis' office properties are located in the downtown Winnipeg area, with several buildings at or adjacent to the intersection of Portage and Main. Overall direct vacancy in the Winnipeg office market, as reported by CBRE, was 11.1% at December 31, 2015, compared to Capital Commercial Real Estate's report of 10.5% vacancy at September 30, 2015. At December 31, 2015, the Winnipeg office segment of Artis' portfolio was 88.9% occupied, compared to 91.2% at September 30, 2015. During 2016, 164,269 square feet comes up for renewal, which represents 0.6% of the total portfolio GLA; 12.1% had been renewed or committed to new leases at December 31, 2015. Approximately 57.2% of the Winnipeg office GLA expires in 2020 or later.
CORPORATE EXPENSES
Three months endedDecember 31,
% Change
Year endedDecember 31,
% Change2015 2014 Change 2015 2014 Change
Accounting, legal and consulting $ 488 $ 589 $ (101) (17.1)% $ 2,120 $ 1,669 $ 451 27.0 %
Public company costs 404 391 13 3.3 % 1,444 1,537 (93) (6.1)%
Unit-based compensation 618 378 240 63.5 % 1,760 1,640 120 7.3 %
Salaries and benefits 986 784 202 25.8 % 3,629 3,125 504 16.1 %
Depreciation 196 146 50 34.2 % 755 575 180 31.3 %
General and administrative 397 394 3 0.8 % 1,802 1,715 87 5.1 %
Total corporate expenses $ 3,089 $ 2,682 $ 407 15.2 % $ 11,510 $ 10,261 $ 1,249 12.2 %
Corporate expenses in 2015 were $11,510 (Q4-15 - $3,089), or 2.1% (Q4-15 - 2.2%) of total revenues compared to $10,261 (Q4-14 - $2,682), or 2.0% (Q4-14 - 2.0%) of total revenues in 2014.
INTEREST EXPENSE
Three months endedDecember 31,
% Change
Year endedDecember 31,
% Change2015 2014 Change 2015 2014 Change
Mortgages and other loans (1) $ 20,739 $ 22,701 $ (1,962) $ 85,151 $ 92,163 $ (7,012)
Debentures (1) 4,386 4,413 (27) 17,453 14,491 2,962
Other (1) 1,447 61 1,386 4,076 534 3,542
26,572 27,175 (603) (2.2)% 106,680 107,188 (508) (0.5)%
Foreign exchange 2,112 824 1,288 6,784 2,524 4,260
Total interest expense $ 28,684 $ 27,999 $ 685 2.4 % $ 113,464 $ 109,712 $ 3,752 3.4 %
(1) Amounts shown are in Canadian and US dollars.
Interest expense on mortgages and other loans has decreased primarily due to the repayment of maturing mortgages in 2014 and 2015. Interest expense on debentures has increased due to the Series A senior unsecured debentures issued in 2014. The majority of other interest expense relates to the unsecured revolving term credit facilities. Financing costs on mortgages, other loans and debentures are netted against the related debt, and amortized on an effective interest basis over the expected term of the debt.
The REIT’s weighted-average effective rate at December 31, 2015 on mortgages and other loans secured by properties was 3.93%, decreased from 4.16% at December 31, 2014. The weighted-average nominal interest rate on mortgages and other loans secured by properties at December 31, 2015 decreased to 3.86% from 4.02% at December 31, 2014.
The REIT's interest coverage ratio, defined as total revenues less property operating expenses, realty taxes and corporate expenses divided by interest expense, is 2.92 times for the year ended December 31, 2015 (Q4-15 - 2.88 times) compared to 2.82 times for the year ended December 31, 2014 (Q4-14 - 2.82 times).
FAIR VALUE (LOSS) GAIN ON INVESTMENT PROPERTIES
The changes in fair value of investment properties, year-over-year, are recognized as fair value gains and losses in the statement of operations. Fair values of the investment properties are determined through either the discounted cash flow method or the overall capitalization method which are generally accepted appraisal methodologies. External valuations are performed quarterly on a rotational basis over a four year cycle. In 2015, the fair value loss on investment properties was $371,905 (Q4-15 - loss of $252,058) compared to a gain of $31,476 (Q4-14 - gain of $14,180) in 2014. Fair value changes in individual properties result from changes in the projected income and cash flow projections of those properties, as well as from changes in capitalization rates and discount rates applied. The fair value loss in 2015 was largely the result of the economic downturn in Alberta and continued downward pressure on market rents, most notably in the Calgary office segment. As reported by CBRE, capitalization rates for Class A and B Calgary office assets increased by an average of 50 basis points from December 31, 2014 to December 31, 2015, and net asking rents in the Calgary downtown office segment decreased by almost $7 per square foot from December 31, 2014 to December 31, 2015.
FOREIGN CURRENCY TRANSLATION LOSS
In 2015, Artis held cash, deposits and the Series G debentures in US dollars. These assets and liabilities are translated into Canadian dollars at the exchange rate in effect at the balance sheet date. This resulted in a foreign currency translation loss of $16,413 (Q4-15 - gain of $410) in 2015, compared to a loss of $21,890 (Q4-14 - loss of $4,295) in 2014. The foreign currency translation loss in 2015 is primarily due to the strengthening of the US dollar and its effect on the net liability position of the REIT's assets and liabilities denominated in US dollars.
LOSS ON FINANCIAL INSTRUMENTS
Artis holds a number of interest rate swaps to effectively lock the interest rate on a portion of floating rate debt. The REIT recorded an unrealized loss on the fair value adjustment of the interest rate swaps outstanding of $3,544 (Q4-15 - gain of $2,426) in 2015, compared to an unrealized loss of $8,558 (Q4-14 - loss of $3,330) in 2014. The REIT anticipates holding the mortgages and interest rate swap contracts until maturity.

MANAGEMENT'S DISCUSSION AND ANALYSIS(In thousands of Canadian dollars, unless otherwise noted)
2015 FINANCIAL REPORT 24 ARTIS REAL ESTATE INVESTMENT TRUST
OTHER COMPREHENSIVE INCOME
Other comprehensive income includes the unrealized foreign currency translation gain in 2015 of $147,727 (Q4-15 - gain of $27,422) compared to a gain of $66,844 (Q4-14 - gain of $25,466) in 2014. Foreign currency translation gains and losses relate to the REIT's net investment in foreign operations in the U.S.
INCOME TAX
The REIT currently qualifies as a mutual fund trust and a real estate investment trust (“REIT”) for Canadian income tax purposes. Under current tax legislation, income distributed annually by the REIT to unitholders is a deduction in the calculation of its taxable income. As the REIT intends to distribute all of its taxable income to its unitholders, the REIT does not record a provision for current Canadian income taxes.
The REIT's U.S. subsidiaries are REITs for U.S. income tax purposes. The subsidiaries intend to distribute all of their U.S. taxable income to Canada and are entitled to deduct such distributions for U.S. income tax purposes. As a result, the REIT does not record a provision for current U.S. income taxes. The U.S. subsidiaries are subject to a 30% to 35% withholding tax on distributions to Canada. Any withholding taxes paid are recorded with the related distributions.
FUNDS FROM OPERATIONS ("FFO")
Consistent with the application of National Policy 41-201 Income Trusts and Other Indirect Offerings, Artis reconciles FFO to cash flows from operating activities, in addition to net (loss) income.
Reconciliation of Cash Flows from Operations to FFO
The following table reconciles cash flow from operations as found in the REIT's consolidated financial statements to FFO:
Three months endedDecember 31,
% Change
Year endedDecember 31,
% Change000's, except per unit amounts 2015 2014 2015 2014
Cash flow from operations $ 47,556 $ 54,008 $ 220,601 $ 204,705
Add (deduct):
Depreciation of property and equipment (196) (146) (755) (575)
Amortization of above-and below-market mortgages, net 474 419 1,603 1,787
Straight-line rent adjustment 1,011 1,199 2,970 4,677
Adjustment for investments in joint ventures 822 894 4,564 3,132
Realized foreign currency translation (gain) loss (579) (289) 3,569 13,825
Unrealized foreign currency gain (loss) from U.S. operations 2,827 (2,815) 1,019 (11,963)
Unit-based compensation expense (618) (378) (1,760) (1,640)
Accretion on liability component of debentures 191 166 720 475
Amortization of financing costs included in interest (762) (770) (3,077) (3,018)
Other long-term employee benefits (498) (844) (1,702) (844)
Transaction costs on acquisitions 521 844 2,136 2,490
Changes in non-cash operating items 6,793 1,316 2,419 (3,252)
Incremental leasing costs 579 472 2,009 1,324
Preferred unit distributions (4,682) (4,461) (18,435) (17,662)
FFO $ 53,439 $ 49,615 7.7% $ 215,881 $ 193,461 11.6%
Add (deduct):
Lease termination income received from tenants (173) (73) (4,493) (176)
Non-recurring other income (1) — — (1,636) —
Straight-line rent reversals due to lease terminations — — 812 —
FFO after adjustments $ 53,266 $ 49,542 7.5% $ 210,564 $ 193,285 8.9%
FFO per unit:
Basic $ 0.39 $ 0.36 8.3% $ 1.57 $ 1.46 7.5%
Diluted 0.38 0.36 5.6% 1.53 1.42 7.7%
FFO per unit after adjustments:
Basic $ 0.38 $ 0.36 5.6% $ 1.53 $ 1.46 4.8%
Diluted 0.38 0.36 5.6% 1.49 1.42 4.9%
Weighted-average number of common units outstanding:
Basic 138,566 136,055 137,601 132,554
Diluted (2) 149,089 146,600 148,082 143,116
(1) Income received from a settlement relating to an access restriction at a previously disposed property.
(2) Options, convertible debentures, restricted units and deferred units are factored into the diluted weighted-average calculation used for FFO, to the extent that their impact is dilutive.
In 2015, FFO after adjustments has increased due to acquisitions during 2014 and 2015, and the impact of foreign exchange.

MANAGEMENT'S DISCUSSION AND ANALYSIS(In thousands of Canadian dollars, unless otherwise noted)
ARTIS REAL ESTATE INVESTMENT TRUST 25 2015 FINANCIAL REPORT
The following is a reconciliation of the weighted-average number of basic common units to diluted common units and FFO to diluted FFO:
Diluted Common Units Reconciliation Diluted FFO ReconciliationThree months ended
December 31,Three months ended
December 31,
2015 2014 2015 2014
Basic units 138,566 136,055 FFO $ 53,439 $ 49,615
Add: Add:
Options (1) — 110 Options (1) — —
Debentures (1) 10,200 10,200 Debentures (1) 2,861 2,640
Restricted units (1) 310 233 Restricted units (1) (73) (55)
Deferred units (1) 13 2 Deferred units (1) 5 (2)
Diluted units 149,089 146,600 Diluted FFO $ 56,232 $ 52,198
(1) All convertible debenture series, restricted units and deferred units are dilutive in Q4-15. All in-the-money options, convertible debenture series, restricted units and deferred units are dilutive in Q4-14.
Diluted Common Units Reconciliation Diluted FFO ReconciliationYear ended
December 31,Year ended
December 31,
2015 2014 2015 2014
Basic units 137,601 132,554 FFO $ 215,881 $ 193,461
Add: Add:
Options (1) — 145 Options (1) — —
Debentures (1) 10,200 10,200 Debentures (1) 11,098 10,333
Restricted units (1) 274 217 Restricted units (1) (350) (51)
Deferred units (1) 7 — Deferred units (1) (2) (2)
Diluted units 148,082 143,116 Diluted FFO $ 226,627 $ 203,741
(1) All convertible debenture series, restricted units and deferred units are dilutive in 2015. All in-the-money options, convertible debenture series, restricted units and deferred units are dilutive in 2014.
Reconciliation of Net (Loss) Income to FFO
Three months endedDecember 31,
% Change
Year endedDecember 31,
% Change2015 2014 2015 2014
Net (loss) income $ (195,895) $ 56,611 $ (175,699) $ 197,886
Add (deduct):
Tenant inducements amortized to revenue 3,694 2,753 14,008 10,572
Fair value loss (gain) on investment properties 252,058 (14,180) 371,905 (31,476)
Foreign currency translation (gain) loss (410) 4,295 16,413 21,890
Transaction costs on acquisitions 521 844 2,136 2,490
Unrealized (gain) loss on financial instruments (2,426) 3,281 3,544 8,437
Incremental leasing costs 579 472 2,009 1,324
Preferred unit distributions (4,682) (4,461) (18,435) (17,662)
FFO $ 53,439 $ 49,615 7.7% $ 215,881 $ 193,461 11.6%
Add (deduct):
Lease termination income received from tenants (173) (73) (4,493) (176)
Non-recurring other income (1) — — (1,636) —
Straight-line rent reversals due to lease terminations — — 812 —
FFO after adjustments $ 53,266 $ 49,542 7.5% $ 210,564 $ 193,285 8.9%
(1) Income received from a settlement relating to an access restriction at a previously disposed property.

MANAGEMENT'S DISCUSSION AND ANALYSIS(In thousands of Canadian dollars, unless otherwise noted)
2015 FINANCIAL REPORT 26 ARTIS REAL ESTATE INVESTMENT TRUST
ADJUSTED FUNDS FROM OPERATIONS ("AFFO")
Artis calculates AFFO based on FFO for the period, net of allowances for normalized capital expenditures and leasing costs and excluding straight-line rent adjustments and unit-based compensation expense.
Actual capital expenditures, which are neither revenue enhancing nor recoverable from tenants in future periods, are by nature variable and unpredictable. The allowance applied in the calculation of AFFO reflects management's best estimate of a reasonable annual capital expenditure on a long-term basis, based on the asset class mix and age and quality of the Artis portfolio properties.
Actual leasing costs, which include tenant improvements that are not capital in nature, tenant allowances and commissions, are also variable in nature. Leasing costs will fluctuate depending on the square footage of leases rolling over, in-place rates at expiry, tenant retention and local market conditions in a given year. The allowance applied in the calculation of AFFO reflects management's estimate of normalized leasing costs over the long-term, based on the asset class mix, tenant mix and conditions in Artis' target markets.
Reconciliation of FFO to AFFO
Three months endedDecember 31,
% Change
Year endedDecember 31,
% Change000's, except per unit amounts 2015 2014 2015 2014
FFO $ 53,439 $ 49,615 $ 215,881 $ 193,461
Add (deduct):
Capital expenditures reserve (1,432) (1,344) (5,539) (5,105)
Leasing costs reserve (5,727) (5,373) (22,153) (20,418)
Straight-line rent adjustments (1,227) (1,232) (3,499) (4,817)
Unit-based compensation 618 378 1,760 1,640
AFFO $ 45,671 $ 42,044 8.6% $ 186,450 $ 164,761 13.2%
Deduct:
Lease termination income received from tenants (173) (73) (4,493) (176)
Non-recurring other income (1) — — (1,636) —
AFFO after adjustments $ 45,498 $ 41,971 8.4% $ 180,321 $ 164,585 9.6%
AFFO per unit:
Basic $ 0.33 $ 0.31 6.5% $ 1.36 $ 1.24 9.7%
Diluted 0.33 0.31 6.5% 1.34 1.23 8.9%
AFFO per unit after adjustments:
Basic $ 0.33 $ 0.31 6.5% $ 1.31 $ 1.24 5.6%
Diluted 0.33 0.31 6.5% 1.30 1.23 5.7%
Weighted-average number of common units outstanding:
Basic 138,566 136,055 137,601 132,554
Diluted (2) 148,766 146,255 147,801 142,754
(1) Income received from a settlement relating to an access restriction at a previously disposed property.
(2) Options, convertible debentures, restricted units and deferred units are factored into the diluted weighted-average calculation used for FFO, to the extent that their impact is dilutive.
In 2015, AFFO has increased due to acquisitions during 2014 and 2015 and the impact of foreign exchange.

MANAGEMENT'S DISCUSSION AND ANALYSIS(In thousands of Canadian dollars, unless otherwise noted)
ARTIS REAL ESTATE INVESTMENT TRUST 27 2015 FINANCIAL REPORT
ANALYSIS OF FINANCIAL POSITION
The following tables provide a reconciliation of the consolidated balance sheets as prepared in accordance with IFRS in the REIT's consolidated financial statements to its Proportionate Share.
December 31, 2015 December 31, 2014
Perconsolidated
financialstatements Adjustment (1)
TotalProportionate
Share
Perconsolidated
financialstatements Adjustment (1)
TotalProportionate
Share
ASSETS
Non-current assets:
Investment properties $ 5,078,021 $ 246,144 $ 5,324,165 $ 5,201,489 $ 87,746 $ 5,289,235
Investment properties under development 26,892 61,465 88,357 81,682 72,262 153,944
Investments in joint ventures 173,066 (173,066) — 98,072 (98,072) —
Property and equipment 3,586 — 3,586 3,405 — 3,405
Notes receivable 15,776 — 15,776 18,239 — 18,239
5,297,341 134,543 5,431,884 5,402,887 61,936 5,464,823
Current assets:
Investment properties held for sale 115,504 — 115,504 — — —
Deposits on investment properties 50 — 50 50 — 50
Prepaid expenses and other assets 7,872 351 8,223 6,671 230 6,901
Notes receivable 2,744 — 2,744 2,509 — 2,509
Accounts receivable and other receivables 11,757 1,069 12,826 10,955 620 11,575
Cash held in trust 8,605 — 8,605 5,973 1,337 7,310
Cash and cash equivalents 66,449 4,995 71,444 49,807 3,025 52,832
212,981 6,415 219,396 75,965 5,212 81,177
$ 5,510,322 $ 140,958 $ 5,651,280 $ 5,478,852 $ 67,148 $ 5,546,000
LIABILITIES AND UNITHOLDERS' EQUITY
Non-current liabilities:
Mortgages and loans payable $ 1,703,553 $ 112,535 $ 1,816,088 $ 1,868,857 $ 46,487 $ 1,915,344
Senior unsecured debentures 199,631 — 199,631 199,527 — 199,527
Convertible debentures 209,140 — 209,140 189,573 — 189,573
Other long-term liabilities 2,910 — 2,910 1,144 — 1,144
2,115,234 112,535 2,227,769 2,259,101 46,487 2,305,588
Current liabilities:
Mortgages and loans payable 494,766 19,663 514,429 393,197 15,116 408,313
Security deposits and prepaid rent 32,049 1,424 33,473 30,546 497 31,043
Accounts payable and other liabilities 75,512 7,336 82,848 66,703 5,048 71,751
Bank indebtedness 225,000 — 225,000 300 — 300
827,327 28,423 855,750 490,746 20,661 511,407
2,942,561 140,958 3,083,519 2,749,847 67,148 2,816,995
Unitholders' equity 2,567,761 — 2,567,761 2,729,005 — 2,729,005
$ 5,510,322 $ 140,958 $ 5,651,280 $ 5,478,852 $ 67,148 $ 5,546,000
(1) Adjustment to reflect investments in joint ventures on a proportionate share basis.

MANAGEMENT'S DISCUSSION AND ANALYSIS(In thousands of Canadian dollars, unless otherwise noted)
2015 FINANCIAL REPORT 28 ARTIS REAL ESTATE INVESTMENT TRUST
ASSETS
December 31,2015
December 31,2014 Change
Non-current assets:
Investment properties and investment properties under development $ 5,412,522 $ 5,443,179 $ (30,657)
Other non-current assets 19,362 21,644 (2,282)
Current assets:
Investment properties held for sale 115,504 — 115,504
Other current assets 23,843 21,035 2,808
Cash, cash equivalents and cash held in trust 80,049 60,142 19,907
$ 5,651,280 $ 5,546,000 $ 105,280
Investment Properties, Investment Properties Under Development and Investment Properties Held for Sale
The change in investment properties, investment properties under development and investment properties held for sale is a result of the following:
Investmentproperties
Investmentproperties under
development
Investmentproperties held
for sale Total
Balance, December 31, 2014 $ 5,289,235 $ 153,944 $ — $ 5,443,179
Additions:
Acquisitions 203,788 — — 203,788
Capital expenditures 26,115 54,407 54 80,576
Leasing commissions 13,221 361 973 14,555
Dispositions (52,977) — (86,310) (139,287)
Reclassification of investment properties under development 130,504 (130,504) — —
Reclassification of investment properties held for sale (193,327) — 193,327 —
Foreign currency translation gain 257,073 12,595 4,987 274,655
Straight-line rent adjustment 3,359 30 110 3,499
Tenant inducement additions, net of amortization 13,915 (63) 5,114 18,966
Fair value loss (366,741) (2,413) (2,751) (371,905)
Balance, December 31, 2015 $ 5,324,165 $ 88,357 $ 115,504 $ 5,528,026
Acquisitions:
The results of operations for the acquired properties are included in the REIT's accounts from the date of acquisition. Artis funded these acquisitions from cash on hand and from the proceeds of new or assumed mortgage financing.
Three months endedDecember 31,
% Change
Year endedDecember 31,
% Change2015 2014 Change 2015 2014 Change
Cash consideration $ 32,437 $ 54,932 $ (22,495) (41.0)% $ 92,146 $ 191,920 $ (99,774) (52.0)%
Long-term debt, including acquired above- andbelow-market mortgages, net of financing costs 62,436 20,159 42,277 209.7 % 111,642 71,655 39,987 55.8 %
Total $ 94,873 $ 75,091 $ 19,782 26.3 % $ 203,788 $ 263,575 $ (59,787) (22.7)%
Capital expenditures:
Investment properties include certain capital expenditures related to sustaining building improvements not related to a specific lease or tenancy. Revenue enhancing capital expenditures include new and (re)development costs and building improvements that increase the revenue generating potential of the property. In 2015, non-revenue enhancing capital expenditures primarily relate to parking lot, elevator modernization, HVAC, interior and exterior upgrades. Recoverable capital expenditures are recoverable from tenants in future periods.
Three months endedDecember 31,
% Change
Year endedDecember 31,
% Change2015 2014 Change 2015 2014 Change
Revenue enhancing $ 17,942 $ 14,021 $ 3,921 28.0 % $ 56,951 $ 42,156 $ 14,795 35.1 %
Recoverable from tenants 3,843 5,296 (1,453) (27.4)% 14,916 10,620 4,296 40.5 %
Non-recoverable 1,339 2,656 (1,317) (49.6)% 8,709 9,589 (880) (9.2)%
Total capital expenditures $ 23,124 $ 21,973 $ 1,151 5.2 % $ 80,576 $ 62,365 $ 18,211 29.2 %

MANAGEMENT'S DISCUSSION AND ANALYSIS(In thousands of Canadian dollars, unless otherwise noted)
ARTIS REAL ESTATE INVESTMENT TRUST 29 2015 FINANCIAL REPORT
Leasing costs:
Tenant inducements include costs incurred to improve the space that primarily benefit the tenant, as well as allowances paid to tenants. Leasing commissions are fees primarily paid to brokers. In 2015, leasing activity was higher resulting in increased tenant inducements and lease commissions. The REIT paid tenant inducements of $6,822 and leasing commissions of $1,200 related to the PMC Sierra, Inc. renewal that commenced October 1, 2015 for 12 years.
Three months endedDecember 31,
% Change
Year endedDecember 31,
% Change2015 2014 Change 2015 2014 Change
Tenant inducements $ 11,558 $ 5,953 $ 5,605 94.2 % $ 32,974 $ 20,846 $ 12,128 58.2%
Leasing commissions 2,945 3,379 (434) (12.8)% 14,555 9,817 4,738 48.3%
Total $ 14,503 $ 9,332 $ 5,171 55.4 % $ 47,529 $ 30,663 $ 16,866 55.0%
Dispositions:
During 2015, Artis sold two retail and two office properties in Canada and two office properties in the U.S. for an aggregate sales price of $150,745. The sales proceeds, net of costs of $11,636 and related debt of $32,999, were $106,110.
Completed new and (re)development properties:
In 2015, Artis completed the (re)development of one office, two retail and four industrial properties as discussed in the Portfolio Summary section.
Investment properties held for sale:
At December 31, 2015, the REIT had one retail and one office property with an aggregate fair value of $115,504 classified as held for sale. These properties were listed for sale with an external broker.
Foreign currency translation gain:
In 2015, the foreign currency translation gain on investment properties was $274,655 (Q4-15 - $56,208) due to the change in the year end US dollar to Canadian dollar exchange rate from 1.1601 at December 31, 2014 to 1.3840 at December 31, 2015.
Fair value (loss) gain on investment properties:
In 2015, the REIT recorded a loss on the fair value of investment properties of $371,905 (Q4-15 - loss of $252,058), compared to a gain of $31,476 (Q4-14 - gain of $14,180) in 2014. From December 31, 2014 to December 31, 2015, the REIT reflected approximately 23 basis points of expansion in the weighted-average capitalization rates across the portfolio. In comparison, from December 31, 2013 to December 31, 2014, the REIT reflected approximately 6 basis points of compression in the weighted-average capitalization rates across the portfolio.
The fair value loss for 2015 is primarily attributed to capitalization rate expansion and lowered expected market rents in the Calgary office market driven by oil price volatility. The fair value gain for 2014 was primarily attributed to capitalization rate compression in the REIT's U.S. portfolio.
Artis determines the fair value of investment properties based upon either the discounted cash flow method or the overall capitalization method, which are generally accepted appraisal methodologies. Capitalization rates are estimated using market surveys, available appraisals and market comparables. Under the overall capitalization method, year one income is stabilized and capitalized at a rate deemed appropriate for each investment property. Individual properties were valued using capitalization rates in the range of 4.50% to 8.75%. Additional information on the average capitalization rates and ranges used for the portfolio properties, assuming all properties were valued using an overall capitalization method, broken out by asset class and country are set out in the table below.
December 31, 2015 December 31, 2014
Maximum MinimumWeighted-
average Maximum MinimumWeighted-
average
Office:
U.S. 8.25% 5.75% 6.52% 8.50% 6.00% 6.80%
Canada 8.75% 5.25% 6.71% 8.00% 5.25% 6.18%
Total office 8.75% 5.25% 6.65% 8.50% 5.25% 6.34%
Industrial:
U.S. 8.00% 6.00% 6.92% 8.00% 6.00% 6.88%
Canada 7.75% 4.50% 6.47% 7.75% 4.50% 6.33%
Total industrial 8.00% 4.50% 6.61% 8.00% 4.50% 6.50%
Retail:
U.S. 8.75% 6.00% 6.81% 8.75% 6.00% 7.12%
Canada 8.50% 5.50% 6.43% 8.25% 5.50% 6.24%
Total retail 8.75% 5.50% 6.45% 8.75% 5.50% 6.29%
Total:
U.S. portfolio 8.75% 5.75% 6.67% 8.75% 6.00% 6.84%
Canadian portfolio 8.75% 4.50% 6.56% 8.25% 4.50% 6.23%
Total portfolio 8.75% 4.50% 6.59% 8.75% 4.50% 6.36%

MANAGEMENT'S DISCUSSION AND ANALYSIS(In thousands of Canadian dollars, unless otherwise noted)
2015 FINANCIAL REPORT 30 ARTIS REAL ESTATE INVESTMENT TRUST
Notes Receivable
In conjunction with the 2007 acquisition of TransAlta Place, the REIT acquired a note receivable in the amount of $31,000. The note bears interest at 5.89% per annum and is repayable in varying blended monthly installments of principal and interest. The note is transferable at the option of the REIT and matures in May 2023. The balance outstanding on all notes receivable at December 31, 2015 is $18,520 compared to $20,748 at December 31, 2014.
Cash and Cash Equivalents
At December 31, 2015, the REIT had $71,444 of cash and cash equivalents on hand, compared to $52,832 at December 31, 2014. The balance is anticipated to be invested in investment properties in subsequent periods, used for working capital purposes or for debt repayment. All of the REIT's cash and cash equivalents are held in current accounts and/or bank guaranteed investment certificates.
LIABILITIES
December 31, 2015
December 31, 2014 Change
Non-current liabilities:
Mortgages and loans payable $ 1,816,088 $ 1,915,344 $ (99,256)
Senior unsecured debentures 199,631 199,527 104
Convertible debentures 209,140 189,573 19,567
Other non-current liabilities 2,910 1,144 1,766
Current liabilities:
Current portion of mortgages and loans payable 514,429 408,313 106,116
Other current liabilities 116,321 102,794 13,527
Bank indebtedness 225,000 300 224,700
$ 3,083,519 $ 2,816,995 $ 266,524
Under the terms of the REIT’s Declaration of Trust, the total indebtedness of the REIT (excluding indebtedness related to the convertible debentures) is limited to 70% of gross book value (“GBV”). GBV is calculated as the consolidated net book value of the consolidated assets of the REIT, adding back the amount of accumulated depreciation of property and equipment as disclosed in the balance sheet and notes thereto.
Artis' secured mortgages and loans to GBV ratio at December 31, 2015 was 41.2%, decreased from 41.9% at December 31, 2014.
December 31,2015
December 31,2014 Change
GBV $ 5,653,827 $ 5,547,792 $ 106,035
Secured mortgages and loans 2,330,517 2,323,657 6,860
Secured mortgages and loans to GBV 41.2% 41.9% (0.7)%
Preferred shares liability $ 365 $ 300 $ 65
Carrying value of debentures 408,771 389,100 19,671
Bank indebtedness 225,000 300 224,700
Total long-term debt and bank indebtedness $ 2,964,653 $ 2,713,357 $ 251,296
Total long-term debt and bank indebtedness to GBV 52.4% 48.9% 3.5 %
Long-term debt is comprised of mortgages and other loans related to properties as well as the carrying value of senior unsecured debentures and convertible debentures issued by the REIT.
Artis' unencumbered assets to unsecured debt ratio was 2.5 times at December 31, 2015, compared to 3.3 at December 31, 2014.
December 31, 2015
December 31, 2014 Change
Unencumbered assets $ 1,059,792 $ 664,792 $ 395,000
Senior unsecured debentures 199,631 199,527 104
Unsecured credit facilities 225,000 — 225,000
Total unsecured debt $ 424,631 $ 199,527 $ 225,104
Unencumbered assets to unsecured debt 2.5 3.3 (0.8)
Mortgages and Loans Payable
Mortgage financing:
Artis finances acquisitions in part through the arrangement or assumption of mortgage financing and consequently, the majority of the REIT’s investment properties are pledged as security under mortgages and other loans. In 2015, $60,984 (Q4-15 - $15,394) of principal repayments were made compared to $59,292 (Q4-14 - $15,000) in 2014.

MANAGEMENT'S DISCUSSION AND ANALYSIS(In thousands of Canadian dollars, unless otherwise noted)
ARTIS REAL ESTATE INVESTMENT TRUST 31 2015 FINANCIAL REPORT
In 2015, Artis repaid 19 maturing mortgages in the amount of $170,490. Artis refinanced 10 maturing mortgages and obtained new mortgage financing on one previously unencumbered property, net of financing costs, for a total of $20,536. The weighted-average interest rate on these 11 mortgages was 2.67% and the weighted-average term to maturity was 3.7 years. In 2015, Artis drew on development loans in the amount of $12,077.
The weighted-average term to maturity on all mortgages and loans payable at December 31, 2015 was 3.8 years, compared to 3.9 years at December 31, 2014.
Unhedged variable rate mortgage debt:
Management believes that a percentage of variable rate debt is prudent in managing a portfolio of debt. At various times, management feels that 5% to 15% of the portfolio could be held in variable rate instruments and provide the benefit of lower interest rates, while keeping the overall risk at a moderate level. All of the REIT's variable rate mortgage debt is term debt and cannot be called on demand. The REIT has the ability to refinance, or use interest rate swaps, at any given point without incurring penalties.
At December 31, 2015, the REIT is a party to $342,758 of unhedged variable rate mortgage debt compared to $258,909 at December 31, 2014. This increase is primarily due to the renewal of a previously hedged mortgage and draws on two construction loans in the aggregate amount of $46,275 that now bears interest at a variable rate, the maturity of two swaps on previously hedged mortgages of $27,540 and the effect of foreign exchange of $46,810, which is partially offset by the repayment of two mortgages of $29,434 and principal repayments during the year of $7,342. The unhedged variable rate mortgage debt is 11.6% of total debt including bank indebtedness at December 31, 2015 compared to 9.5% at December 31, 2014.
Senior Unsecured Debentures
Artis has one series of senior unsecured debentures outstanding, as follows:
December 31, 2015 December 31, 2014
Issued Maturity Interest rate Carrying value Face value Carrying value Face value
Series A 27-Mar-14 27-Mar-19 3.753% $ 199,631 $ 200,000 $ 199,527 $ 200,000
10-Sept-14
Convertible Debentures
Artis has two series of convertible debentures outstanding, as follows:
December 31, 2015 December 31, 2014
Issued Maturity Interest rate Carrying value Face value Carrying value Face value
Series F 22-Apr-10 30-June-20 6.00% $ 85,336 $ 86,170 $ 85,180 $ 86,170
Series G 21-Apr-11 30-June-18 5.75% 123,804 121,792 104,393 102,089
$ 209,140 $ 207,962 $ 189,573 $ 188,259
The carrying value of convertible debentures has increased by $19,567 from December 31, 2014. This increase is primarily due to foreign exchange on the Series G debentures.
Other Current Liabilities
Included in other current liabilities are accounts payable and accrued liabilities, security deposits and prepaid rent, as well as accrued distributions payable to unitholders of $13,161, of which $12,498 was subsequently paid on January 15, 2016 and the remainder was paid on February 1, 2016. At December 31, 2015, there was $225,000 drawn on the REIT's unsecured revolving term credit facilities. Amounts drawn on the facilities bear interest at prime plus 0.70% or at the bankers' acceptance rate plus 1.70%.
UNITHOLDERS' EQUITY
Unitholders’ equity decreased overall by $161,244 between December 31, 2014 and December 31, 2015. The decrease was primarily due to a net loss for the period of $175,699and distributions made to unitholders of $167,452. This decrease was partially offset by an unrealized foreign currency translation gain included in other comprehensive income of $147,727 and the issuance of units for $33,922.
LIQUIDITY AND CAPITAL RESOURCES
Cash flow from operations represents the primary source of funds for distributions to unitholders and principal repayments on mortgages and loans.
DISTRIBUTIONS
The Trustees determine the level of cash distributions based on the level of cash flow from operations before working capital changes, less actual and planned capital expenditures.
During the year, distributions are based on estimates of full year cash flow and capital spending; thus distributions may be adjusted as these estimates change. It is expected that normal seasonal fluctuations in working capital will be funded from cash resources. In addition, the distributions declared include a component funded by the DRIP.

MANAGEMENT'S DISCUSSION AND ANALYSIS(In thousands of Canadian dollars, unless otherwise noted)
2015 FINANCIAL REPORT 32 ARTIS REAL ESTATE INVESTMENT TRUST
The following amounts are presented consistent with Artis' consolidated financial statements:
Three months endedDecember 31,
Year endedDecember 31,
Year endedDecember 31,
Year endedDecember 31,
2015 2015 2014 2013
Cash flow from operations $ 47,556 $ 220,601 $ 204,705 $ 194,507
Net (loss) income (195,895) (175,699) 197,886 191,155
Distributions declared 42,119 167,144 161,330 146,459
Excess of cash flow from operations over distributions declared 5,437 53,457 43,375 48,048
(Shortfall) excess of net (loss) income over distributions declared (238,014) (342,843) 36,556 44,696
Artis' primary objective is to provide stable, reliable and tax efficient monthly cash distributions. Cash flow from operations has exceeded distributions declared for the past 14 consecutive quarters. The shortfall in 2015 of $342,843 (Q4-15 - $238,014) is primarily due to the non-cash impact of fair value losses on investment properties, foreign currency translation and financial instruments.
Artis paid $31,916 (Q4-15 - $7,504) of the $167,144 (Q4-15 - $42,119) distributions declared to unitholders in 2015 through the issuance of units under the DRIP.
CAPITAL RESOURCES
At December 31, 2015, Artis had $71,444 of cash and cash equivalents on hand. Management anticipates that the cash on hand will be invested in investment properties in subsequent periods, used for working capital purposes or for debt repayment.
The REIT has two unsecured revolving term credit facilities in the aggregate amount of $300,000, which can be utilized for general corporate and working capital purposes, short term financing of investment property acquisitions and the issuance of letters of credit. At December 31, 2015, the REIT had $225,000 drawn on the facilities.
At December 31, 2015, the REIT has 58 unencumbered properties and 7 unencumbered parcels of development land, representing a fair value of $1,059,792.
Artis is not in default or arrears on any of its obligations, including distributions to unitholders, interest or principal payments on debt or any debt covenants at December 31, 2015.
The REIT’s management expects to meet all of its short-term obligations and capital commitments with respect to properties through funds generated from operations, from the proceeds of mortgage refinancing, drawing on unsecured credit facilities, from the issuance of new debentures or units, and cash on hand.
CONTRACTUAL OBLIGATIONS
Total Less than 1 year 1 - 3 years 4 - 5 yearsAfter
5 years
Bank indebtedness $ 225,000 $ 225,000 $ — $ — $ —
Accounts payable and other liabilities 82,848 82,848 — — —
Convertible debentures (1) 207,962 — 121,792 86,170 —
Senior unsecured debentures (1) 200,000 — — 200,000 —
Mortgages and loans payable 2,329,547 498,949 796,702 419,028 614,868
Total $ 3,045,357 $ 806,797 $ 918,494 $ 705,198 $ 614,868
(1) It is assumed that none of the debentures are converted or redeemed prior to maturity and that they are paid out in cash on maturity.
The REIT's schedule of mortgage maturities is as follows:
Year ended December 31, Debt maturities % of total principal
Scheduled principalrepayments on non-
matured debtTotal annual principal
repayments
Weighted-average nominal interest rate on balance due at
maturity
2016 $ 442,023 21.8% $ 56,926 $ 498,949 3.79%
2017 547,933 27.1% 45,325 593,258 4.21%
2018 169,133 8.4% 34,311 203,444 3.62%
2019 156,487 7.7% 32,573 189,060 3.37%
2020 203,215 10.0% 26,753 229,968 3.37%
2021 & later 505,784 25.0% 109,084 614,868 3.86%
Total $ 2,024,575 100.0% $ 304,972 $ 2,329,547 3.83%
Weighted-average term to maturity in years 3.8

MANAGEMENT'S DISCUSSION AND ANALYSIS(In thousands of Canadian dollars, unless otherwise noted)
ARTIS REAL ESTATE INVESTMENT TRUST 33 2015 FINANCIAL REPORT
SUMMARIZED QUARTERLY INFORMATION
$000's, except per unit amounts Q4-15 Q3-15 Q2-15 Q1-15 Q4-14 Q3-14 Q2-14 Q1-14
Revenue $ 142,873 $ 140,254 $ 134,629 $ 134,746 $ 133,879 $ 127,583 $ 121,983 $ 125,194
Expenses:
Property operating 35,158 32,160 28,336 29,450 33,309 28,457 25,507 28,439
Realty taxes 22,382 21,667 20,633 20,764 19,480 19,268 18,220 18,577
Property operating expenses 57,540 53,827 48,969 50,214 52,789 47,725 43,727 47,016
Net operating income 85,333 86,427 85,660 84,532 81,090 79,858 78,256 78,178
Other income (expenses):
Corporate expenses (3,089) (2,728) (2,831) (2,862) (2,682) (2,467) (2,582) (2,530)
Interest expense (28,684) (28,365) (28,148) (28,267) (27,999) (27,265) (27,645) (26,803)
Interest income 288 335 335 363 442 464 521 391
Fair value (loss) gain on investment properties (252,058) (64,343) (5,252) (50,252) 14,180 10,363 17,516 (10,583)
Foreign currency translation gain (loss) 410 (9,913) 3,637 (10,547) (4,295) (4,834) (8,406) (4,355)
Transaction costs (521) (1,248) 68 (435) (844) (162) (1,396) (88)
Gain (loss) on financial instruments 2,426 (3,612) 3,271 (5,629) (3,281) 860 (2,792) (3,224)
Net (loss) income (195,895) (23,447) 56,740 (13,097) 56,611 56,817 53,472 30,986
Other comprehensive income (loss):
Unrealized foreign currency translation gain (loss) 27,422 65,039 (14,853) 70,119 25,466 32,513 (9,637) 18,502
Unrealized gain (loss) from remeasurements of netpension obligation 1 — 43 (42) — — — —
27,423 65,039 (14,810) 70,077 25,466 32,513 (9,637) 18,502
Total comprehensive (loss) income $ (168,472) $ 41,592 $ 41,930 $ 56,980 $ 82,077 $ 89,330 $ 43,835 $ 49,488
Net (loss) income per unit attributable to commonunitholders:
Basic $ (1.45) $ (0.20) $ 0.38 $ (0.13) $ 0.38 $ 0.39 $ 0.37 $ 0.21
Diluted (1.45) (0.20) 0.37 (0.13) 0.37 0.38 0.36 0.21
Secured mortgages and loans to GBV 41.2% 40.2% 39.9% 41.4% 41.9% 41.9% 43.3% 44.4%
The quarterly trend for revenues and Property NOI has been impacted by acquisition and disposition activity, the impact of foreign exchange and lease termination income. Net (loss) income and per unit amounts are also impacted by the fair value gains and losses on investment properties.

MANAGEMENT'S DISCUSSION AND ANALYSIS(In thousands of Canadian dollars, unless otherwise noted)
2015 FINANCIAL REPORT 34 ARTIS REAL ESTATE INVESTMENT TRUST
Reconciliation of Net (Loss) Income to FFO
000's, except per unit amounts Q4-15 Q3-15 Q2-15 Q1-15 Q4-14 Q3-14 Q2-14 Q1-14
Net (loss) income $ (195,895) $ (23,447) $ 56,740 $ (13,097) $ 56,611 $ 56,817 $ 53,472 $ 30,986
Add (deduct):
Tenant inducements amortized into revenue 3,694 3,693 3,466 3,155 2,753 2,776 2,571 2,472
Fair value loss (gain) on investment properties 252,058 64,343 5,251 50,253 (14,180) (10,363) (17,516) 10,583
Foreign currency translation (gain) loss (410) 9,913 (3,637) 10,547 4,295 4,834 8,406 4,355
Transaction costs on acquisitions 521 1,248 (68) 435 844 162 1,396 88
Unrealized (gain) loss on financial instruments (2,426) 3,612 (3,271) 5,629 3,281 (860) 2,792 3,224
Incremental leasing costs 579 442 544 444 472 246 275 331
Preferred unit distributions (4,682) (4,638) (4,547) (4,568) (4,461) (4,423) (4,370) (4,408)
FFO $ 53,439 $ 55,166 $ 54,478 $ 52,798 $ 49,615 $ 49,189 $ 47,026 $ 47,631
Add (deduct):
Lease termination income received from tenants (173) (170) (3,340) (810) (73) (21) (82) —
Non-recurring other income (1) — (1,636) — — — — — —
Straight-line rent reversals due to lease terminations — — 812 — — — — —
FFO after adjustments $ 53,266 $ 53,360 $ 51,950 $ 51,988 $ 49,542 $ 49,168 $ 46,944 $ 47,631
FFO per unit:
Basic $ 0.39 $ 0.40 $ 0.40 $ 0.39 $ 0.36 $ 0.36 $ 0.36 $ 0.37
Diluted 0.38 0.39 0.39 0.38 0.36 0.35 0.35 0.36
FFO per unit after adjustments:
Basic $ 0.38 $ 0.39 $ 0.38 $ 0.38 $ 0.36 $ 0.36 $ 0.36 $ 0.37
Diluted 0.38 0.38 0.37 0.37 0.36 0.35 0.35 0.36
Weighted-average number of common units outstanding:
Basic 138,566 137,919 137,275 136,618 136,055 135,563 131,098 127,369
Diluted (2) 149,089 148,455 147,799 147,192 146,600 146,245 141,773 138,034
(1) Income received from a settlement relating to an access restriction at a previously disposed property.
(2) Options, convertible debentures, restricted units and deferred units are factored into the diluted weighted-average calculation, to the extent that their impact is dilutive.
FFO and per unit results are impacted by acquisition and disposition activity, foreign exchange and by lease termination income received from tenants during the period.
Reconciliation of FFO to AFFO
000's, except per unit amounts Q4-15 Q3-15 Q2-15 Q1-15 Q4-14 Q3-14 Q2-14 Q1-14
FFO after adjustments $ 53,266 $ 53,360 $ 51,950 $ 51,988 $ 49,542 $ 49,168 $ 46,944 $ 47,631
Add (deduct):
Capital expenditures reserve (1,432) (1,406) (1,350) (1,351) (1,344) (1,280) (1,225) (1,256)
Leasing costs reserve (5,727) (5,623) (5,399) (5,404) (5,373) (5,121) (4,901) (5,023)
Straight-line rent adjustments (1,227) (1,231) (905) (948) (1,232) (1,062) (1,165) (1,358)
Unit-based compensation 618 302 298 542 378 403 386 473
AFFO after adjustments $ 45,498 $ 45,402 $ 44,594 $ 44,827 $ 41,971 $ 42,108 $ 40,039 $ 40,467
AFFO per unit after adjustments:
Basic $ 0.33 $ 0.33 $ 0.32 $ 0.33 $ 0.31 $ 0.31 $ 0.31 $ 0.32
Diluted 0.33 0.33 0.32 0.32 0.31 0.31 0.30 0.31
Weighted-average number of common units outstanding:
Basic 138,566 137,919 137,275 136,618 136,055 135,563 131,098 127,369
Diluted (1) 148,766 148,119 147,475 146,819 146,255 145,848 141,383 137,654
(1) Convertible debentures are factored into the diluted weighted-average calculation, to the extent that their impact is dilutive.
Adjusted AFFO and per unit results are impacted by acquisition and disposition activity and foreign exchange during the period.

MANAGEMENT'S DISCUSSION AND ANALYSIS(In thousands of Canadian dollars, unless otherwise noted)
ARTIS REAL ESTATE INVESTMENT TRUST 35 2015 FINANCIAL REPORT
RELATED PARTY TRANSACTIONS
Three months endedDecember 31,
Year endedDecember 31,
2015 2014 2015 2014
Property management fees $ 82 $ 82 $ 328 $ 331
Capitalized leasing commissions fees 5 17 93 96
Capitalized project management fees — 1 — 15
Capitalized building improvements 1,736 3,039 7,887 7,881
Capitalized development projects 6,666 4,071 15,552 13,263
Capitalized office furniture and fixtures 240 344 580 758
Capitalized tenant inducements 524 1 1,288 498
Realty tax assessment consulting fees 36 19 1,312 385
Rental revenues (72) (42) (227) (168)
The REIT incurred property management fees, leasing commission fees and project management fees under property management agreements with Marwest Management Canada Ltd. (''Marwest Management''), a company related to certain trustees and officers of the REIT, for three properties owned by the REIT. The amount payable at December 31, 2015 is $44 (December 31, 2014, $29).
The REIT incurred costs for building improvements, development projects and tenant inducements paid to Marwest Construction Ltd. (''Marwest Construction'') and Marwest Development Corporation, companies related to certain trustees and officers of the REIT. The amount payable at December 31, 2015 is $1,724 (December 31, 2014, $3,253).
The REIT incurred costs for office furniture and fixtures paid to Marwest Construction. The amount payable at December 31, 2015 is $nil (December 31, 2014, $45).
The REIT incurred costs for realty tax assessment consulting paid to Fairtax Realty Advocates, a company under control of close family members of key management personnel. The amount payable at December 31, 2015 is $194 (December 31, 2014, $nil).
The REIT collects office rents from Marwest Management and Fairtax Realty Advocates.
These transactions are in the normal course of operations and are measured at the exchange amount, which is the amount of consideration established and agreed to by the related parties.
OUTSTANDING UNIT DATA
The balance of units outstanding as of February 29, 2016 is as follows:
Units outstanding at December 31, 2015 138,864,486
Units issued (DRIP) 450,128
Units outstanding at February 29, 2016 139,314,614
The balance of options outstanding as of February 29, 2016 is as follows:
Options outstanding
Optionsexercisable
$14.10 options, issued June 17, 2011 811,500 811,500
$16.36 options, issued April 13, 2012 1,504,500 1,128,375
2,316,000 1,939,875
The balance of restricted units outstanding as of February 29, 2016 is 372,068. None of these restricted units have vested.
The balance of deferred units outstanding as of February 29, 2016 is 19,519. All of these deferred units have vested, but are not yet redeemable.
As of February 29, 2016, the balance of Series A preferred units outstanding is 3,450,000, the balance of Series C preferred units outstanding is 3,000,000, the balance of Series E preferred units outstanding is 4,000,000 and the balance of Series G preferred units outstanding is 3,200,000.
OUTLOOK
Artis continues to target high quality office, retail and industrial assets in primary and secondary markets in British Columbia, Alberta, Saskatchewan, Manitoba, Ontario and select markets in the U.S.
The Scotiabank Global Forecast Update dated February 1, 2016 predicts that real GDP in Canada grew 1.2% in 2015. GDP growth in 2015 for British Columbia, Manitoba and Ontario is estimated to have been 2.3%, 2.2% and 2.3% respectively, which are well above the Canadian average of 1.2%. In 2016, GDP growth for these provinces is forecast to be 2.2% in British Columbia, 2.0% in Manitoba and 2.2% in Ontario, well above the 2016 national forecast of 1.1%. GDP for Saskatchewan and Alberta in 2016 are forecast to contract by 0.3% and 1.9%, respectively. Scotiabank has revised their projections to reflect the impact of lower oil prices; however, they are predicting that this impact will be mitigated with the introduction of significant federal fiscal stimulus from mid-2016 to mid-2017.

MANAGEMENT'S DISCUSSION AND ANALYSIS(In thousands of Canadian dollars, unless otherwise noted)
2015 FINANCIAL REPORT 36 ARTIS REAL ESTATE INVESTMENT TRUST
Artis is closely monitoring its exposure to markets that are affected by lower oil prices. According to the CBRE Q4 2015 Canadian Cap Rate Survey, Calgary office capitalization rates remained unchanged quarter-over-quarter; however, the sector, particularly downtown properties, continues to be most affected by the downturn in energy prices. The report also shows some capitalization rate expansion for certain classes of Edmonton office and industrial properties. Looking ahead as it relates to Artis' assets, management expects that if the downturn in the commodity cycle continues, there may be some further capitalization rate expansion in related markets, which will likely affect certain assets. Until there is positive visibility on commodity prices and relevant economic fundamentals, Artis anticipates occupancy and rents in Alberta will be impacted, and are monitoring these markets closely.
With respect to capitalization rates in the remainder of Artis' target markets, management does not anticipate any significant changes, but given the amount of capital seeking to invest in commercial real estate, the bias toward capitalization rate compression should continue. Artis will continue to selectively pursue accretive acquisition opportunities in its target markets in Canada and the U.S. in 2016, and when prudent, invest in high-yield development opportunities in those markets.
The above-mentioned Scotiabank Global Forecast Update predicts U.S. Real GDP grew 2.4% in 2015 and forecasts a growth rate of 2.2% in 2016. Management continues to monitor key economic indicators in Artis' target U.S. markets, including year-over-year unemployment rates which have shown a trend of healthy decline in all of Artis' U.S. target markets (according to the United States Department of Labor), and decreased nationally from 5.6% to 5.0% year-over-year. Given the recovery of the U.S. economy resulting in the strengthening of the US dollar, healthy GDP growth expectations, and decline in unemployment rates, management anticipates there is further growth potential that will be realized in 2016 and beyond.
Artis continues to maintain its Investment Grade Credit Rating, BBB(low) with a Stable trend, from DBRS Limited. DBRS Limited has also assigned a rating of Pfd-3(low) with a Stable trend to Artis’ preferred units. Management anticipates, with this Investment Grade Credit Rating, the debt and equity markets will be receptive to new financing during 2016. Management further predicts that interest rates will remain low in the short-to-medium term, with long-term interest rate increases coming at a slow, methodical pace and well-communicated by the central banks. Management expects to maintain between 5% and 15% unhedged floating rate debt as a percentage of total debt.
Despite the impact of the recent decline in commodity prices and the impact this has had on certain markets, management anticipates that overall real estate fundamentals in Canada and the U.S. will remain stable in 2016, and that Artis’ properties will perform in line with the moderate growth expectations within its target markets. Artis will continue to focus on organic growth and value creation opportunities by seeking to extract maximum value from its portfolio, selective redevelopment and repositioning of well-located assets in primary markets through property improvement projects, expansion of existing portfolio properties, and new construction opportunities.
SUBSEQUENT EVENTS
As at December 31, 2015, Artis had $71,444 of cash and cash equivalents on hand and $75,000 available on its revolving term credit facilities. Subsequent to December 31, 2015, the following transactions took place:
• The REIT financed two previously unencumbered retail properties and one previously unencumbered office property, receiving mortgage proceeds of $37,800. These mortgages bear interest at a weighted-average interest rate of 2.81% and have a weighted-average term to maturity of 3.2 years.
• The REIT converted $168,500 drawn on its revolving term credit facility to US dollars and applied a cross-currency interest rate swap to this balance to reduce the effective interest rate.
• The REIT repaid $25,000 on its revolving term credit facility.
• The REIT declared a monthly cash distribution of $0.09 per unit for the months of January and February 2016.
• The REIT declared a quarterly cash distribution of $0.3125 per Series G preferred unit for the quarter ending January 31, 2016.
RISKS AND UNCERTAINTIES
REAL ESTATE OWNERSHIP
All real property investments are subject to elements of risk. General economic conditions, local real estate markets, supply and demand for leased premises, competition from other available premises and various other factors affect such investments. The REIT's properties are located in five Canadian provinces and five U.S. states, with a significant majority of its properties, measured by GLA, located in the province of Alberta and in the state of Minnesota. As a result, our properties are impacted by factors specifically affecting their respective real estate markets. These factors may differ from those affecting the real estate markets in other regions of Canada and the U.S.
INTEREST RATE AND DEBT FINANCING
Artis will be subject to the risks associated with debt financing. There can be no assurance that Artis will be able to refinance its existing indebtedness on terms that are as or more favourable to Artis as the terms of existing indebtedness. The inability to replace financing of debt on maturity would have an adverse impact on the financial condition and results of Artis.
Management seeks to mitigate this risk in a variety of ways. First, management considers structuring the timing of the renewal of significant tenant leases on properties in relation to the time at which mortgage indebtedness on such property becomes due for refinancing. Second, management seeks to secure financing from a variety of lenders on a property by property basis. Third, mortgage terms are, where practical, structured such that the exposure in any one year to financing risks is balanced.
Artis is also subject to interest rate risk associated with the REIT's revolving term credit facilities, mortgages and debentures payable due to the expected requirement to refinance such debts in the year of maturity. The REIT minimizes the risk by restricting debt to 70% of gross book value and by carefully monitoring the amount of variable rate debt. 69.5%of the REIT's mortgages and loans payable bear interest at fixed rates, and a further 15.8% of the REIT's mortgages and loans payable bear interest at variable rates with interest rate swaps in place. At December 31, 2015, the REIT is a party to $935,648 of variable rate debt, including bank indebtedness (December 31, 2014, $654,169). At December 31, 2015, the REIT had entered into interest rate swaps to hedge the interest rate risk associated with $367,890 of variable rate debt (December 31, 2014, $394,960). The REIT has the ability to place interest rate swaps on top of variable rate debt at any time in order to effectively fix the interest rate.
The REIT’s ratio of secured mortgages and loans to GBV was 41.2%, down from 41.9% at December 31, 2014. The REIT's ratio of total long-term debt and bank indebtedness to GBV was 52.4%, compared to 48.9% at December 31, 2014. Approximately 21.8% of Artis’ maturing mortgage debt comes up for renewal in 2016, and 27.1% in 2017. Management is in discussion with various lenders with respect to the renewal or refinancing of the 2016 mortgage maturities.

MANAGEMENT'S DISCUSSION AND ANALYSIS(In thousands of Canadian dollars, unless otherwise noted)
ARTIS REAL ESTATE INVESTMENT TRUST 37 2015 FINANCIAL REPORT
CREDIT RISK AND TENANT CONCENTRATION
Artis is exposed to risks relating to tenants that may be unable to pay their contracted rents. Management mitigates this risk by seeking to acquire properties across several asset classes and geographical regions. As well, management seeks to acquire properties with strong tenant covenants in place. Artis' portfolio includes 2,226 tenant leases with a weighted-average term to maturity of 4.2 years. Approximately 59.3% of the REIT’s gross revenue is derived from national or government tenants. As indicated below, the largest tenant by gross revenue is Manitoba Telecom Services Inc. which is one of Canada's leading national communication companies providing voice services, internet and data services, and television. Manitoba Telecom Services Inc. is a TSX listed entity with 2015 annual revenues in excess of $1 billion. The second largest tenant by gross revenue is Graham Group Ltd., a construction solutions provider with revenues exceeding $2 billion annually. Graham Group Ltd. provides general contracting, design-build, construction management and public-private partnership (P3) services in the commercial, industrial, infrastructure, earthworks and masonry sectors, and has offices throughout North America with over 1,300 employees.
Top Twenty Tenants by Gross Revenue (1)
Tenant% of Total Gross
Revenue (2)Owned Share of GLA
(in 000's of S.F.) % of Total GLAWeighted-Average
Remaining Lease Term
MTS Inc. 1.9% 322 1.3% 7.2
Graham Group Ltd. 1.5% 243 0.9% 18.6
DirecTV, LLC 1.3% 257 1.0% 9.5
Stantec Consulting Ltd. 1.1% 129 0.5% 7.6
Shoppers Drug Mart 1.1% 164 0.6% 7.4
Bellatrix Exploration Ltd. 1.0% 94 0.4% 8.1
TransAlta Corporation 1.0% 336 1.3% 7.4
Telvent Canada Ltd. 1.0% 98 0.4% 7.7
TD Canada Trust 1.0% 134 0.5% 4.5
CB Richard Ellis, Inc. 0.9% 119 0.5% 2.8
Home Depot 0.9% 163 0.6% 6.5
IHS Global Canada Limited 0.9% 78 0.3% 3.0
Canada Institute for Health Info. 0.8% 92 0.4% 9.7
Sobeys 0.8% 198 0.8% 4.1
Fairview Health Services 0.7% 179 0.7% 7.7
Birchcliff Energy 0.7% 59 0.2% 1.9
Bell Canada 0.7% 80 0.3% 0.6
3M Canada Company 0.7% 319 1.2% 4.3
Cara Operations Limited 0.7% 100 0.4% 13.0
PMC - Sierra, Inc. 0.7% 124 0.5% 11.8
Total 19.4% 3,288 12.8% 7.6
(1) Excluding properties held for redevelopment.
(2) Total gross revenue is in Canadian and US dollars.
Government Tenants by Gross Revenue (1)
Tenant% of Total Gross
Revenue (2)Owned Share of GLA
(in 000's of S.F.) % of Total GLAWeighted-Average
Remaining Lease Term
Federal Government 3.3% 505 2.0% 8.6
Provincial Government 2.8% 438 1.7% 3.3
Civic or Municipal Government 0.5% 131 0.5% 11.5
Total 6.6% 1,074 4.2% 6.8
Weighted-average term to maturity (entire portfolio) 4.2
(1) Excluding properties held for redevelopment.
(2) Total gross revenue is in Canadian and US dollars.
LEASE ROLLOVER RISK
The value of investment properties and the stability of cash flows derived from those properties is dependent upon the level of occupancy and lease rates in those properties. Upon expiry of any lease, there is no assurance that a lease will be renewed on favourable terms, or at all; nor is there any assurance that a tenant can be replaced. A contraction in the Canadian or U.S. economy would negatively impact demand for space in office, retail and industrial properties, consequently increasing the risk that leases expiring in the near term will not be renewed.

MANAGEMENT'S DISCUSSION AND ANALYSIS(In thousands of Canadian dollars, unless otherwise noted)
2015 FINANCIAL REPORT 38 ARTIS REAL ESTATE INVESTMENT TRUST
Details of the portfolio's expiry schedule is as follows:
Canada U.S.
Expiry Year AB BC MB SK ONCalgary
Office Only MN Other Total
2016 4.1% 0.5% 2.1% 0.4% 2.9% 1.2% 4.7% 0.2% 14.9%
2017 2.1% 0.7% 1.8% 1.4% 2.5% 1.0% 3.3% 1.2% 13.0%
2018 2.8% 0.5% 2.3% 0.7% 0.8% 1.1% 2.5% 0.7% 10.3%
2019 2.9% 0.9% 0.7% 0.3% 1.6% 0.8% 2.3% 1.0% 9.7%
2020 2.0% 0.4% 1.7% 0.2% 2.6% 0.2% 2.7% 0.7% 10.3%
2021 1.5% 0.1% 1.5% 0.2% 0.1% 0.9% 2.4% 0.7% 6.5%
2022 & later 7.2% 2.7% 3.0% 2.3% 2.9% 2.8% 4.7% 2.5% 25.3%
Month-to-month 0.3% —% 0.2% —% 0.2% 0.1% 0.1% —% 0.8%
Vacant 2.5% 0.4% 1.6% 0.1% 1.2% 1.6% 1.3% 0.1% 7.2%
New development/ redevelopment —% —% —% —% —% —% 1.3% 0.7% 2.0%
Total 25.4% 6.2% 14.9% 5.6% 14.8% 9.7% 25.3% 7.8% 100.0%
Artis' real estate is diversified across five Canadian provinces and five U.S. states, and across the office, retail and industrial asset classes. By city and asset class, the five largest segments of the REIT’s portfolio (by Property NOI) are Calgary office, Twin Cities Area industrial, Greater Phoenix Area office, Twin Cities Area office and Winnipeg office.
TAX RISK
The Tax Act contains the SIFT Rules, which are applicable to publicly traded income trusts unless the trust satisfies the REIT Exception. The REIT Exception to the SIFT Rules is comprised of a number of technical tests and the determination as to whether the REIT qualifies for the REIT Exception in any particular taxation year can only be made with certainty at the end of the taxation year. Management believes that the REIT has met the requirements of the REIT Exception in each taxation year since 2009 and that it has met the REIT Exception throughout the year ended December 31, 2014 and the year ended December 31, 2015. There can be no assurances, however, that the REIT will continue to be able to satisfy the REIT Exception in the future such that the REIT will not be subject to the tax imposed by the SIFT Rules.
The Tax Act also contains restrictions relating to the activities and the investments permitted by a mutual fund trust. Closed-end trusts must also comply with a number of technical tests relating to its investments and income. No assurance can be given that the REIT will be able to continue to comply with these restrictions at all times.
The REIT operates in the United States through two U.S. REITs, which are capitalized by the REIT by way of equity, debt in the form of notes owed to the REIT and preferred shares. If the Internal Revenue Service or a court were to determine that the notes and related interest should be treated differently for tax purposes, this may adversely affect the REIT's ability to flow income from the U.S. to Canada.
FOREIGN CURRENCY RISK
The REIT owns properties located in the U.S., and therefore, the REIT is subject to foreign currency fluctuations that may impact its financial position and results. In order to mitigate a portion of this risk, the REIT's debt on U.S. properties as well as the Series G debentures are held in US dollars to act as a natural hedge. The REIT's Series C preferred units are also denominated in US dollars.
OTHER RISKS
In addition to the specific risks identified above, the REIT is subject to a variety of other risks, including, but not limited to, risks posed by the illiquidity of real property investments, risk of general uninsured losses, as well as potential risks arising from environmental matters.
The REIT may also be subject to risks arising from land leases for properties in which the REIT has an interest, public market risks, unitholder liability risks, risks pertaining to the availability of cash flow, risks related to fluctuations in cash distributions, changes in legislation and risks relating to the REIT's reliance on key personnel. A summary of additional risks applicable to the REIT are set forth in Artis' most recent Annual Information Form.
CRITICAL ACCOUNTING ESTIMATES
Artis REIT’s management believes that the policies below are those most subject to estimation and judgment by management.
VALUATION OF INVESTMENT PROPERTIES
Investment properties include properties held to earn rental income and properties that are being constructed or developed for future use as investment properties. Investment properties are measured at fair value with any changes therein recognized in net income or loss for the period. Artis determines the fair value of investment properties based upon either the discounted cash flow method or the overall capitalization method. Under the discounted cash flow method, expected future cash flows for each investment property were discounted, generally over a term of approximately 10 years, using weighted-average rates of approximately 7.55% at December 31, 2014 and 7.68% at December 31, 2015. Expected future cash flows for each investment property have been based upon, but not limited to, rental income from current leases, budgeted and actual expenses, and assumptions about rental income from future leases. Under the overall capitalization method, year one income was stabilized and capped at weighted-average capitalization rates of approximately 6.36% at December 31, 2014 and 6.59% at December 31, 2015.
Investment properties under development include initial acquisition costs, other direct costs and borrowing costs during the period of development. The REIT considers practical completion to have occurred when all the activities necessary to prepare the qualifying asset for its intended use or sale are complete.
VALUATION OF DEFERRED TAX ASSETS AND LIABILITIES
The REIT currently qualifies as a mutual fund trust for Canadian income tax purposes. On June 22, 2007, new legislation relating to, among other things, the federal income taxation of a specified investment flow-through trust or partnership (a "SIFT") was enacted (the "SIFT Rules"). The REIT has reviewed the SIFT Rules and has assessed their interpretation and application to the REIT's assets and revenues. While there are uncertainties in the interpretation and application of the SIFT Rules, the REIT believes it has met the REIT conditions throughout the year ended December 31, 2014 and the year ended December 31, 2015.

MANAGEMENT'S DISCUSSION AND ANALYSIS(In thousands of Canadian dollars, unless otherwise noted)
ARTIS REAL ESTATE INVESTMENT TRUST 39 2015 FINANCIAL REPORT
ALLOCATION OF CONVERTIBLE DEBENTURES
Artis REIT has issued convertible debentures, which are a compound financial instrument. The proceeds of these issues are allocated between their liability and equity components. The discount rate applied in the allocation is determined by management.
CHANGES IN ACCOUNTING POLICIES
New or Revised Accounting Standards Adopted During the Year
The REIT adopted the narrow scope amendments to IFRS for Annual Improvements 2010 - 2012 Cycle, Annual Improvements 2011 - 2013 Cycle and IAS 19 – Employee Benefitseffective January 1, 2015. The adoption of these narrow scope amendments did not have a material impact on the consolidated financial statements.
Future Changes in Accounting Policies
In May 2014, the IASB amended IFRS 11 – Joint Arrangements. The amendment clarifies the accounting for acquisitions of interests in joint operations, and is effective for annual periods beginning on or after January 1, 2016. The REIT does not expect that this amendment will result in a material impact to the consolidated financial statements.
The IASB issued IFRS 15 – Revenue from Contracts with Customers (“IFRS 15”) in May 2014. IFRS 15 provides a single, principles based five-step model to be applied to the recognition of revenue from contracts with customers. IFRS 15 replaces IAS 11 – Construction Contracts, IAS 18 – Revenue, IFRIC 13 – Customer Loyalty Programmes, IFRIC 15 – Agreements for the Construction of Real Estate and SIC 31 – Revenue - Barter Transactions Involving Advertising Services. IFRS 15 is effective for annual periods beginning on or after January 1, 2018. The REIT is currently evaluating the impact of this new standard.
In May 2014, the IASB amended IAS 16 – Property, Plant and Equipment. The amendment clarifies acceptable methods of depreciation and amortization, and is effective for annual periods beginning on or after January 1, 2016. The REIT does not expect that this amendment will result in a material impact to the consolidated financial statements.
A revised version of IFRS 9 – Financial Instruments ("IFRS 9") was issued by the IASB in July 2014 and will replace IAS 39 – Financial Instruments: Recognition and Measurement ("IAS 39"). IFRS 9 establishes principles for the recognition, classification and measurement of financial assets and liabilities. IFRS 9 sets out a single approach to determine whether a financial asset is measured at amortized cost or fair value, replacing the multiple classification options in IAS 39. This approach is based on how an entity manages its financial instruments and the contractual cash flow characteristics of its financial assets. IFRS 9 retains most of the IAS 39 requirements for financial liabilities. The most significant change is when an entity elects to measure a financial liability at fair value, gains or losses due to changes in the credit risk of the instrument must be recognized in other comprehensive income. IFRS 9 is effective for annual periods beginning on or after January 1, 2018. The REIT is currently evaluating the impact of this new standard.
In December 2014, the IASB amended IAS 1 – Presentation of Financial Statements. The amendments were done under the IASB's Disclosure Initiative to improve presentation and disclosure requirements, and are effective for annual periods beginning on or after January 1, 2016. The REIT is currently evaluating the impact of these amendments.
The IASB issued IFRS 16 – Leases ("IFRS 16") in January 2016 which replaces IAS 17 - Leases and IFRIC 4 - Determining whether an Arrangement contains a Lease. The most significant change introduced by IFRS 16 is a single lessee accounting model, bringing leases on-balance sheet for lessees. IFRS 16 is effective for annual periods beginning on or after January 1, 2019. The REIT is currently evaluating the impact of this new standard.
CONTROLS AND PROCEDURES
INTERNAL CONTROLS OVER FINANCIAL REPORTING
The REIT’s internal control over financial reporting is designed to provide reasonable assurance regarding the reliability of financial reporting and the preparation of financial statements for external purposes in accordance with IFRS. Management is responsible for establishing and maintaining adequate internal controls over financial reporting.
All control systems have inherent limitations, and evaluation of a control system cannot provide absolute assurance that all control issues have been detected, including risks of misstatement due to error or fraud. As a growing enterprise, management anticipates that the REIT will be continually evolving and enhancing its systems of controls and procedures.
The Chief Executive Officer and Chief Financial Officer evaluated, or caused to be evaluated, the effective design of the REIT’s internal controls over financial reporting (as defined in NI 52-109). Based on this evaluation, the CEO and CFO have concluded that, as at December 31, 2015, the design of our internal control over financial reporting was effective in providing reasonable assurance regarding the reliability of financial reporting and the preparation of financial statements in accordance with IFRS. No material weaknesses in our internal control over financial reporting were identified.
DISCLOSURE CONTROLS AND PROCEDURES
The REIT's disclosure controls and procedures are designed to provide reasonable assurance that information required to be disclosed by the REIT is recorded, processed, summarized and reported within the time periods specified under Canadian securities laws, and include controls and procedures that are designed to ensure that information is accumulated and communicated to management, including the Chief Executive Officer and Chief Financial Officer, to allow timely decisions regarding required disclosure.
As of December 31, 2015, an evaluation was carried out, under the supervision of and with the participation of management, including the Chief Executive Officer and Chief Financial Officer, of the effectiveness of the REIT's disclosure controls and procedures (as defined in NI 52-109). Based on the evaluation, the Chief Executive Officer and Chief Financial Officer have concluded that the REIT's disclosure controls and procedures were effective for the year ended December 31, 2015.

MANAGEMENT'S RESPONSIBILITY FOR FINANCIAL STATEMENTS
2015 FINANCIAL REPORT 40 ARTIS REAL ESTATE INVESTMENT TRUST
Management’s Responsibility for Financial Statements
The management of Artis Real Estate Investment Trust is responsible for the preparation and integrity of the consolidated financial statements contained in the annual report. These consolidated financial statements have been prepared in accordance with Canadian generally accepted accounting principles and necessarily include some amounts that are based on management’s best estimate and judgment. Management has determined such amounts on a reasonable basis and considers that the consolidated financial statements present fairly the financial position of the REIT, the results of its operations and its cash flows. Management has also prepared financial information presented elsewhere in this annual report and has ensured that it is consistent with that in the consolidated financial statements. To fulfill its responsibility, management maintains internal accounting controls and systems and establishes policies and procedures to ensure the reliability of financial information and to safeguard assets.
The Board of Trustees is responsible for ensuring that management fulfills its responsibilities for financial reporting and internal control. The Board of Trustees carries out this responsibility principally through its Audit Committee, composed entirely of outside and unrelated trustees. The Audit Committee meets regularly with management of the REIT and with the independent auditors. The consolidated financial statements have been reviewed and approved by the Board of Trustees on the recommendation of its Audit Committee.
The REIT’s independent auditor, Deloitte, LLP, has been appointed by the unitholders to audit the consolidated financial statements and express an opinion thereon.
“Armin Martens” “Jim Green”
Armin Martens, P.Eng., MBA Jim Green, CAPresident and Chief Executive Officer Chief Financial OfficerFebruary 29, 2016 February 29, 2016

AUDITOR'S REPORT
ARTIS REAL ESTATE INVESTMENT TRUST 41 2015 FINANCIAL REPORT
Deloitte LLP360 Main StreetSuite 2300Winnipeg MB R3C 3Z3Canada
Tel: 204-942-0051Fax: 204-947-9390www.deloitte.ca
INDEPENDENT AUDITOR’S REPORT
To the Unitholders of Artis Real Estate Investment Trust
We have audited the accompanying consolidated financial statements of Artis Real Estate Investment Trust, which comprise the consolidated balance sheets as at December 31, 2015 and December 31, 2014, and the consolidatedstatements of operations, the consolidated statements of changes in unitholders’ equity and the consolidated statements of cash flows for the years then ended, and a summary of the significant accounting policies and other explanatory information.
Management's responsibility for the consolidated financial statements
Management is responsible for the preparation and fair presentation of these consolidated financial statements in accordance with International Financial Reporting Standards, and for such internal control as Management determines is necessary to enable the preparation of consolidated financial statements that are free from material misstatement, whether due to fraud or error.
Auditor's responsibility
Our responsibility is to express an opinion on these consolidated financial statements based on our audits. We conducted our audits in accordance with Canadian generally accepted auditing standards. Those standards require that we comply with ethical requirements and plan and perform the audit to obtain reasonable assurance about whether the consolidated financial statements are free from material misstatement.
An audit involves performing procedures to obtain audit evidence about the amounts and disclosures in the consolidated financial statements. The procedures selected depend on the auditor's judgment, including the assessment of the risks of material misstatement of the consolidated financial statements, whether due to fraud or error. In making those risk assessments, the auditor considers internal control relevant to the entity's preparation and fair presentation of the consolidated financial statements in order to design audit procedures that are appropriate in the circumstances, but not for the purpose of expressing an opinion on the effectiveness of the entity's internal control. An audit also includes evaluating the appropriateness of accounting policies used and the reasonableness of accounting estimates made by Management, as well as evaluating the overall presentation of the consolidated financial statements.
We believe that the audit evidence we have obtained in our audits is sufficient and appropriate to provide a basis for our audit opinion.
Opinion
In our opinion, the consolidated financial statements present fairly, in all material respects, the financial position of Artis Real Estate Investment Trust as at December 31, 2015 and December 31, 2014, and its financial performance and its cash flows for the years then ended in accordance with International Financial Reporting Standards.
Chartered Accountants
February 29, 2016Winnipeg, Manitoba

CONSOLIDATED FINANCIAL STATEMENTS(In thousands of Canadian dollars, unless otherwise noted)
2015 FINANCIAL REPORT 42 ARTIS REAL ESTATE INVESTMENT TRUST
CONSOLIDATED BALANCE SHEETS
NoteDecember 31,
2015December 31,
2014
ASSETS
Non-current assets:
Investment properties 4 $ 5,078,021 $ 5,201,489
Investment properties under development 4 26,892 81,682
Investments in joint ventures 22 173,066 98,072
Property and equipment 5 3,586 3,405
Notes receivable 6 15,776 18,239
5,297,341 5,402,887
Current assets:
Investment properties held for sale 4 115,504 —
Deposits on investment properties 50 50
Prepaid expenses and other assets 7 7,872 6,671
Notes receivable 6 2,744 2,509
Accounts receivable and other receivables 8 11,757 10,955
Cash held in trust 8,605 5,973
Cash and cash equivalents 66,449 49,807
212,981 75,965
$ 5,510,322 $ 5,478,852
LIABILITIES AND UNITHOLDERS' EQUITY
Non-current liabilities:
Mortgages and loans payable 9 $ 1,703,553 $ 1,868,857
Senior unsecured debentures 10 199,631 199,527
Convertible debentures 11 209,140 189,573
Other long-term liabilities 2,910 1,144
2,115,234 2,259,101
Current liabilities:
Mortgages and loans payable 9 494,766 393,197
Security deposits and prepaid rent 32,049 30,546
Accounts payable and other liabilities 12 75,512 66,703
Bank indebtedness 13 225,000 300
827,327 490,746
2,942,561 2,749,847
Unitholders' equity 2,567,761 2,729,005
Commitments, contingencies and guarantees 24
Subsequent events 27
$ 5,510,322 $ 5,478,852
See accompanying notes to consolidated financial statements.

CONSOLIDATED FINANCIAL STATEMENTS(In thousands of Canadian dollars, unless otherwise noted)
ARTIS REAL ESTATE INVESTMENT TRUST 43 2015 FINANCIAL REPORT
CONSOLIDATED STATEMENT OF OPERATIONS(In thousands of Canadian dollars, except unit and per unit amounts)
Year endedDecember 31,
Note 2015 2014
Revenue $ 535,574 $ 500,558
Expenses:
Property operating 120,188 112,997
Realty taxes 82,990 74,713
203,178 187,710
Net operating income 332,396 312,848
Other income (expenses):
Corporate expenses (11,510) (10,261)
Interest expense (110,482) (108,546)
Interest income 1,319 1,818
Net income (loss) from investments in joint ventures 22 297 (3,987)
Fair value (loss) gain on investment properties 4 (365,626) 38,831
Foreign currency translation loss (16,413) (21,890)
Transaction costs (2,136) (2,490)
Loss on financial instruments 17 (3,544) (8,437)
Net (loss) income (175,699) 197,886
Other comprehensive income that may be reclassified to net (loss) income in subsequent periods:
Unrealized foreign currency translation gain 147,727 66,844
Other comprehensive income that will not be reclassified to net (loss) income in subsequent periods:
Unrealized gain from remeasurements of net pension obligation 2 —
147,729 66,844
Total comprehensive (loss) income $ (27,970) $ 264,730
Basic (loss) income per unit attributable to common unitholders 14 (d) $ (1.41) $ 1.36
Diluted (loss) income per unit attributable to common unitholders 14 (d) $ (1.41) $ 1.33
Weighted-average number of common units outstanding:
Basic 14 (d) 137,600,613 132,553,521
Diluted 14 (d) 137,600,613 143,115,933
See accompanying notes to consolidated financial statements.

CONSOLIDATED FINANCIAL STATEMENTS(In thousands of Canadian dollars, unless otherwise noted)
2015 FINANCIAL REPORT 44 ARTIS REAL ESTATE INVESTMENT TRUST
CONSOLIDATED STATEMENTS OF CHANGES IN UNITHOLDERS' EQUITY
Commonunits capital
contributions(note 14 (a)(ii))
Equitycomponent of
convertibledebentures
Retainedearnings
Accumulatedother
comprehensive income
Contributedsurplus
Total commonequity
Totalpreferred
equity Total
Unitholders' equity, December 31, 2013 $ 1,638,219 $ 11,154 $ 478,718 $ 25,317 $ 5,216 $ 2,158,624 $ 325,623 $ 2,484,247
Changes for the year:
Issuance of units, net of issue costs 142,455 — — — (600) 141,855 — 141,855
Unit-based compensation (note 19 (c)(i)) — — — — 609 609 — 609
Redemption of convertibledebentures — (131) — — — (131) — (131)
Net income — — 197,886 — — 197,886 — 197,886
Other comprehensive income — — — 66,844 — 66,844 — 66,844
Distributions — — (162,305) — — (162,305) — (162,305)
Unitholders' equity, December 31, 2014 1,780,674 11,023 514,299 92,161 5,225 2,403,382 325,623 2,729,005
Changes for the year:
Issuance of units, net of issue costs 34,397 — — — (475) 33,922 — 33,922
Unit-based compensation (note 19 (c)(i)) — — — — 256 256 — 256
Net loss — — (175,699) — — (175,699) — (175,699)
Other comprehensive income — — — 147,729 — 147,729 — 147,729
Distributions — — (167,452) — — (167,452) — (167,452)
Unitholders' equity, December 31, 2015 $ 1,815,071 $ 11,023 $ 171,148 $ 239,890 $ 5,006 $ 2,242,138 $ 325,623 $ 2,567,761
See accompanying notes to consolidated financial statements.

CONSOLIDATED FINANCIAL STATEMENTS(In thousands of Canadian dollars, unless otherwise noted)
ARTIS REAL ESTATE INVESTMENT TRUST 45 2015 FINANCIAL REPORT
CONSOLIDATED STATEMENTS OF CASH FLOWS
Year ended December 31,
Note 2015 2014
Cash provided by (used in):
Operating activities:
Net (loss) income $ (175,699) $ 197,886
Distributions from joint ventures 2,587 396
Adjustments for non-cash items:
Fair value loss (gain) on investment properties 4 365,626 (38,831)
Depreciation of property and equipment 755 575
Net (income) loss from investments in joint ventures 22 (297) 3,987
Tenant inducements amortized to revenue 13,433 10,412
Amortization of above- and below-market mortgages, net (1,603) (1,787)
Accretion on liability component of debentures (720) (475)
Straight-line rent adjustment 4 (2,970) (4,677)
Unrealized foreign currency translation loss 11,825 20,028
Loss on financial instruments 17 3,544 8,437
Unit-based compensation expense 19 1,760 1,640
Amortization of financing costs included in interest expense 3,077 3,018
Other long-term employee benefits 19 1,702 844
Changes in non-cash operating items 18 (2,419) 3,252
220,601 204,705
Investing activities:
Acquisitions of investment properties, net of related debt 3 (42,586) (141,205)
Proceeds from dispositions of investment properties, net of costs and related debt 3 106,110 18,096
Additions to investment properties 4 (24,765) (21,522)
Additions to investment properties under development 4 (33,297) (21,178)
Additions to joint ventures 22 (57,559) (52,993)
Additions to tenant inducements (31,023) (19,738)
Additions to leasing commissions 4 (13,958) (9,386)
Notes receivable principal repayments 2,388 2,937
Additions to property and equipment (936) (1,108)
Change in deposits on investment properties — 50
Change in cash held in trust (1,182) (165)
(96,808) (246,212)
Financing activities:
Issuance of common units, net of issue costs 33,922 141,855
Issuance of senior unsecured debentures, net of financing costs — 199,421
Repayment of convertible debentures — (4,000)
Change in bank indebtedness 224,700 300
Distributions paid on common units (148,784) (143,801)
Distributions paid on preferred units (18,435) (17,662)
Mortgages and loans principal repayments (59,580) (58,603)
Repayment of mortgages and loans payable (170,490) (113,506)
Advance of mortgages and loans payable, net of financing costs 20,536 37,139
Issuance of preferred shares, net of costs — 211
(118,131) 41,354
Foreign exchange gain on cash held in foreign currency 10,980 1,738
Increase in cash and cash equivalents 16,642 1,585
Cash and cash equivalents at beginning of year 49,807 48,222
Cash and cash equivalents at end of year $ 66,449 $ 49,807
Supplemental cash flow information:
Interest paid $ 113,097 $ 107,047
Interest received 1,321 1,817
See accompanying notes to consolidated financial statements.

CONSOLIDATED FINANCIAL STATEMENTS(In thousands of Canadian dollars, unless otherwise noted)
2015 FINANCIAL REPORT 46 ARTIS REAL ESTATE INVESTMENT TRUST
NOTES TO CONSOLIDATED FINANCIAL STATEMENTSYears ended December 31, 2015 and 2014
Note 1. Organization
Artis Real Estate Investment Trust (the "REIT") is an unincorporated closed-end real estate investment trust created under, and governed by, the laws of the Province of Manitoba. The REIT was created pursuant to the Declaration of Trust dated November 8, 2004, as most recently amended and restated on August 2, 2012 (the "Declaration of Trust"). The purpose of the REIT is to directly, or indirectly, own, manage, lease and (where appropriate) develop retail, industrial and office properties in Canada and the United States (the "U.S."). The registered office of the REIT is 360 Main Street, Suite 300, Winnipeg, Manitoba, R3C 3Z3.
The Declaration of Trust provides that the REIT may make cash distributions to unitholders of the REIT. The amount distributed annually (currently $1.08 per common unit, $1.3125 per Series A preferred unit, US$1.3125 per Series C preferred unit, $1.1875 per Series E preferred unit and $1.25 per Series G preferred unit) is set by the Board of Trustees.
Note 2. Significant accounting policies
(a) Statement of compliance:
The consolidated financial statements have been prepared in accordance with International Financial Reporting Standards ("IFRS") as issued by the International Accounting Standards Board ("IASB").
(b) Basis of presentation and measurement:
The consolidated financial statements are prepared on a going concern basis and have been presented in Canadian dollars rounded to the nearest thousand unless otherwise indicated. The accounting policies set out below have been applied consistently to all periods presented in the consolidated financial statements. Standards issued but not yet effective for the current accounting year are described in note 2 (s).
The consolidated financial statements are prepared on the historical cost basis with the exception of investment properties, derivative financial instruments and the cash-settled unit-based payments liabilities, which are measured at fair value.
(c) Principles of consolidation:
The consolidated financial statements include the accounts of the REIT and entities controlled by the REIT and its subsidiaries (including joint arrangements). Control is achieved when the REIT has power over the entity, is exposed, or has rights, to variable returns from its involvement with the entity, and has the ability to use its power to affect those returns. The REIT reassesses whether or not it controls an entity if facts and circumstances indicate that there are changes to one or more of the three elements of control.
All intercompany assets and liabilities, equity, revenue, expenses and cash flows relating to transactions between entities within the REIT are eliminated in full on consolidation.
(d) Translation of foreign currencies:
The consolidated financial statements are presented in Canadian dollars, which is the functional currency of the REIT.
Assets and liabilities of foreign operations are translated at the rate of exchange in effect at the balance sheet date. Revenue and expense items are translated at the average exchange rate for the period. Gains or losses on translation are included in other comprehensive income as foreign currency translation gains or losses. When there is a reduction in the net investment as a result of dilution or sale, or reduction in the equity of the foreign operation as a result of a capital transaction, amounts previously recognized in accumulated other comprehensive income are reclassified into net income.
For assets, liabilities, revenues and expenses that do not form part of the net investment in foreign operations, foreign currency translation gains or losses are included in net income. Monetary assets and liabilities are translated at the rate of exchange in effect at the balance sheet date. Non-monetary assets and liabilities are translated at historical exchange rates. Revenue and expense items are translated at the rate in effect at the date of the transaction.
(e) Financial instruments:
Initially, all financial assets and liabilities are recorded on the consolidated balance sheet at fair value. Subsequent measurement is determined by the classification of each financial asset and liability. All financial assets are classified as one of: (a) at fair value through profit or loss; (b) held-to-maturity; (c) loans and receivables; or (d) available-for-sale. Debt and equity instruments are classified as either financial liabilities or as equity in accordance with the substance of the contractual arrangement. All financial liabilities are classified as either: (a) at fair value through profit or loss; or (b) other liabilities. Financial assets and liabilities classified as at fair value through profit or loss are measured at fair value, with gains and losses recognized in net income. Financial instruments classified as held-to-maturity, loans and receivables, and other liabilities are measured at amortized cost. Available-for-sale financial assets are measured at fair value, with unrealized gains and losses recognized in other comprehensive income.
The REIT designated its notes receivables, accounts receivable and other receivables, cash held in trust and cash and cash equivalents as loans and receivables; its mortgages and loans payable, senior unsecured debentures, the liability component of its convertible debentures, preferred shares liability, accounts payable and other liabilities and bank indebtedness as other liabilities. All derivative instruments, including embedded derivatives, are classified as at fair value through profit or loss and are recorded on the consolidated balance sheet at fair value. The REIT does not hold any financial instruments classified as held-to-maturity or available-for-sale.
Transaction costs that are directly attributable to the acquisition or issuance of financial assets or liabilities, with the exception of those classified as at fair value through profit or loss, are accounted for as part of the respective asset or liability's carrying value at inception and amortized over the expected life of the financial instrument using the effective interest method. Transaction costs directly attributable to the acquisition or issuance of financial assets or liabilities classified as at fair value through profit or loss are recognized immediately in net income.
Financial assets, other than those classified as at fair value through profit or loss, are assessed for indicators of impairment at the end of each reporting period. Financial assets are considered to be impaired when there is objective evidence that, as a result of one or more events that occurred after the initial recognition of the financial asset, the estimated future cash flows of the asset have been affected.
(f) Investment properties:
Investment properties include properties held to earn rental income and properties that are being constructed or developed for future use as investment properties. Investment properties are measured at fair value with any changes therein recognized in profit or loss for the period.

CONSOLIDATED FINANCIAL STATEMENTS(In thousands of Canadian dollars, unless otherwise noted)
ARTIS REAL ESTATE INVESTMENT TRUST 47 2015 FINANCIAL REPORT
Investment properties are classified as investment properties under development once construction at the property has commenced. Investment properties under development include initial acquisition costs and other direct costs during the period of development. Borrowing costs associated with direct expenditures on properties under development are capitalized from the commencement of the construction until the date of practical completion. The REIT considers practical completion to have occurred when all the activities necessary to prepare the qualifying asset for its intended use or sale are complete.
A property acquisition is accounted for as a business combination using the acquisition method if the assets acquired and liabilities assumed constitute a business, and the REIT obtains control of the business. The cost of a business combination is measured as the fair value of the assets given up, equity instruments issued and liabilities assumed at the acquisition date. Identifiable assets acquired and liabilities and contingent liabilities assumed in a business combination are measured initially at fair value at the date of acquisition. The REIT recognizes assets or liabilities, if any, resulting from a contingent consideration arrangement at their acquisition date fair value and such amounts form part of the cost of the business combination. Changes in the fair value of contingent consideration arrangements that qualify as measurement period adjustments, adjustments arising from additional information obtained about an acquisition within one year of its date, are adjusted retrospectively. All other changes in fair value are recognized in profit or loss for the period.
Leasing commissions and straight-line rent receivable are included in the carrying amount of investment properties.
Payments to tenants under lease obligations are included in the carrying amount of investment properties. Payments that are determined to primarily benefit the tenant are treated as tenant inducements that reduce revenue. Tenant inducements are amortized on a straight-line basis over the term of the lease.
Investment properties held under operating leases are recognized in the REIT's consolidated balance sheet at fair value.
(g) Property and equipment:
Office furniture and fixtures and office equipment and software are carried at cost less accumulated depreciation, and are depreciated on a straight-line basis over their useful life which is estimated to be five years. The estimated useful life, residual values and depreciation method are reviewed at each year end, with the effect of any changes in estimates accounted for on a prospective basis.
(h) Assets held for sale and discontinued operations:
Non-current assets, or disposal groups comprising assets and liabilities, are categorized as held for sale at the point in time when the asset or disposal group is available for immediate sale, management has committed to a plan to sell and is actively locating a buyer at a sales price that is reasonable in relation to the current fair value of the asset, and the sale is highly probable and expected to be completed within a one-year period. Investment properties measured under the fair value model and held for sale continue to be measured by the guidelines of IAS 40 - Investment Property. All other assets held for sale are stated at the lower of their carrying amount and fair value less selling costs. An asset that is subsequently reclassified as held and in use, with the exception of an investment property measured under the fair value model, is measured at the lower of its recoverable amount and the carrying amount that would have been recognized had the asset never been classified as held for sale.
The results of operations associated with disposal groups sold or classified as held for sale are reported separately as profit or loss from discontinued operations.
A discontinued operation is a component of the REIT's business that represents a separate major line of business or geographical area of operations that has been disposed of or is held for sale. Classification as a discontinued operation occurs upon disposal or when the operation meets the criteria to be classified as held for sale, if earlier. When an operation is classified as a discontinued operation, the comparative statement of comprehensive income is re-presented as if the operation had been discontinued from the start of the comparative period.
(i) Cash held in trust:
Cash held in trust consists of cash held by financial institutions with restrictions pursuant to several mortgage agreements.
(j) Cash and cash equivalents:
Cash and cash equivalents consist of cash with financial institutions and include short-term investments with maturities of three months or less.
(k) Provisions:
A provision is recognized if, as a result of a past event, the REIT has a present legal or constructive obligation that can be estimated reliably, and it is probable that an outflow of economic benefits will be required to settle the obligation. The amount recognized as a provision is determined by discounting the expected future cash flows at a rate that reflects current market assessments of the time value of money and the risks specific to the liability. Provisions are remeasured at each balance sheet date using the current discount rate. The increase in the provision due to passage of time is recognized as interest expense.
Present obligations arising under onerous contracts are recognized and measured as provisions. An onerous contract is considered to exist where the REIT has a contract under which the unavoidable costs of meeting the obligations under the contract exceed the economic benefits expected to be received from the contract.
(l) Revenue recognition:
The REIT has retained substantially all of the risks and benefits of ownership of its investment properties and therefore accounts for leases with its tenants as operating leases. Rental revenue from investment properties includes all amounts earned from tenants related to lease agreements, including base rent, realty tax and operating cost recoveries and other incidental income. The total amount of contractual base rent in lease agreements is accounted for on a straight-line basis over the term of the respective leases; a straight-line rent receivable, which is included in the carrying amount of investment properties, is recorded for the difference between the rental revenue recorded and the contractual rent received. Realty tax and operating cost recoveries are accrued and recognized as revenue in the period that the recoverable costs are incurred and become chargeable to tenants.
(m) Joint arrangements:
Joint arrangements are arrangements where the owning parties have joint control. Joint control is the contractually agreed sharing of control of an arrangement, which exists only when decisions about the relevant activities require unanimous consent of the parties sharing control. The REIT accounts for its joint arrangements as either joint ventures or joint operations.
A joint venture is an arrangement where the REIT jointly owns an investment property with another party and has rights to the net assets of the arrangement. Joint ventures are accounted for using the equity method. The investment in the joint venture is initially measured at cost at the date of acquisition and adjusted thereafter for the REIT's share of changes in its net assets, less any identified impairment loss. The REIT's share of the profit or loss from its investments in joint ventures is recognized in profit or loss for the period.

CONSOLIDATED FINANCIAL STATEMENTS(In thousands of Canadian dollars, unless otherwise noted)
2015 FINANCIAL REPORT 48 ARTIS REAL ESTATE INVESTMENT TRUST
A joint operation is an arrangement where the REIT jointly owns an investment property with another party and has rights to the assets, and obligations for the liabilities, relating to the arrangement. The REIT accounts for joint operations by recording its proportionate share of their assets, liabilities, revenues, expenses and cash flows in its consolidated financial statements.
(n) Earnings per unit:
Basic earnings per REIT unit is computed by dividing net income for the year attributable to common unitholders by the weighted-average common units outstanding during the reporting period. Diluted earnings per unit is calculated based on the weighted-average number of common units outstanding during the period, plus the effect of dilutive unit equivalents. The diluted per unit amounts for unit-based compensation are calculated using the treasury stock method, as if all the unit equivalents where the average market price exceeds the issue price had been exercised at the beginning of the reporting period, or the date of issue, as the case may be, and that the funds obtained thereby were used to purchase units of the REIT at the average trading price of the common units during the period. The dilution impact of convertible debentures is calculated using the if-converted method, whereby conversion is not assumed for the purposes of computing diluted earnings per unit if the effect is anti-dilutive.
(o) Unit-based compensation:
The REIT may issue unit-based awards to trustees, officers, employees and consultants. For cash-settled unit-based payment transactions, a liability is recognized and remeasured to fair value at each reporting date and at settlement date. Any change in the fair value of the liability is recognized as compensation expense for the period.
For equity-settled unit-based payment transactions, the REIT measures compensation expense using the fair value at the grant date, recognized over the vesting period.
(p) Long-term employee benefits:
The cost of the REIT's defined benefit pension plans are accrued based on estimates, using actuarial techniques, of the amount of benefits employees have earned in return for their services in the current and prior periods. The present value of the defined benefit liability and current service cost is determined by discounting the estimated benefits using the projected unit credit method to determine the fair value of the plan assets and total actuarial gains and losses and the proportion thereof which will be recognized. The fair value of the plan assets is based on current market values. The present value of the defined benefit liability is based on the discount rate determined by reference to the yield of high quality corporate bonds of similar currency, having terms of maturity which align closely with the period of maturity of the liability.
Liabilities recognized in respect of other long-term employee benefits are measured at the present value of the estimated future cash outflows expected to be made by the REIT in respect of services provided by employees up to the reporting date.
(q) Use of estimates and judgments:
The preparation of the consolidated financial statements requires management to make estimates, assumptions and judgments that affect the reported amounts of assets and liabilities, the disclosure of contingent assets and liabilities at the date of the financial statements and the reported amounts of revenues and expenses during the period. Actual results could differ from those estimates.
The estimates and underlying assumptions are reviewed on an ongoing basis. Revisions to accounting estimates are recognized in the period in which the estimates are revised and in any future periods affected.
Information about critical judgments in applying accounting policies that have the most significant effect on the amounts reported in the consolidated financial statements are as follows:
- Accounting for business combinations - The REIT's accounting policy relating to business combinations is described in note 2 (f). Judgment is applied in determining whether property acquisitions constitute the purchase of a business or the purchase of assets.
- Accounting for tenant inducements - The REIT's accounting policy relating to tenant inducements is described in note 2 (f). The REIT makes judgments with respect to whether tenant inducements provided in connection with a lease enhance the value of the leased property which determines whether such amounts are treated as capital expenditures.
- Capitalized cost of investment properties under development - The REIT's accounting policy relating to investment properties under development is described in note 2 (f). Judgment is applied in identifying the point at which practical completion of the investment property under development occurs.
- Classification of leases - The REIT's accounting policy for revenue recognition is described in note 2 (l). The REIT makes judgments in determining whether certain leases are operating or finance leases. The REIT determined that all of its leases are operating leases.
- Classification of joint arrangements - The REIT's accounting policy relating to joint arrangements is described in note 2 (m) and note 22. Judgment is applied in determining whether joint arrangements constitute a joint venture or a joint operation.
Information about assumptions and estimation uncertainties that are critical to the determination of the amounts reported in the consolidated financial statements are as follows:
- Valuation of investment properties - The fair value of investment properties represents an estimate of the price that would be agreed upon between knowledgeable, willing parties in an arm's length transaction. The critical estimates and assumptions underlying the valuation of investment properties are described in note 4.
- Valuation of deferred tax liabilities and assets - The critical estimates and assumptions underlying the valuation of deferred tax liabilities and assets are described in note 21.
- Allowance for doubtful accounts - The critical estimates and assumptions underlying the value of the allowance for doubtful accounts are described in note 26 (a)(ii).
- Fair value of financial instruments - The fair value of financial instruments is estimated as the amount for which an instrument could be exchanged, or liability settled, between knowledgeable, willing parties in an arm's length transaction. The critical estimates and assumptions underlying the fair value of financial instruments are described in note 26 (b).
- Allocation of convertible debentures between liability and equity components - The critical estimates and assumptions underlying the allocation of convertible debentures are described in note 11.
(r) New or revised accounting standards adopted during the year:
The REIT adopted the narrow scope amendments to IFRS for Annual Improvements 2010 - 2012 Cycle, Annual Improvements 2011 - 2013 Cycle and IAS 19 – Employee Benefitseffective January 1, 2015. The adoption of these narrow scope amendments did not have a material impact on the consolidated financial statements.

CONSOLIDATED FINANCIAL STATEMENTS(In thousands of Canadian dollars, unless otherwise noted)
ARTIS REAL ESTATE INVESTMENT TRUST 49 2015 FINANCIAL REPORT
(s) Future changes in accounting policies:
In May 2014, the IASB amended IFRS 11 – Joint Arrangements. The amendment clarifies the accounting for acquisitions of interests in joint operations, and is effective for annual periods beginning on or after January 1, 2016. The REIT does not expect that this amendment will result in a material impact to the consolidated financial statements.
The IASB issued IFRS 15 – Revenue from Contracts with Customers (“IFRS 15”) in May 2014. IFRS 15 provides a single, principles based five-step model to be applied to the recognition of revenue from contracts with customers. IFRS 15 replaces IAS 11 – Construction Contracts, IAS 18 – Revenue, IFRIC 13 – Customer Loyalty Programmes, IFRIC 15 – Agreements for the Construction of Real Estate and SIC 31 – Revenue - Barter Transactions Involving Advertising Services. IFRS 15 is effective for annual periods beginning on or after January 1, 2018. The REIT is currently evaluating the impact of this new standard.
In May 2014, the IASB amended IAS 16 – Property, Plant and Equipment. The amendment clarifies acceptable methods of depreciation and amortization, and is effective for annual periods beginning on or after January 1, 2016. The REIT does not expect that this amendment will result in a material impact to the consolidated financial statements.
A revised version of IFRS 9 – Financial Instruments ("IFRS 9") was issued by the IASB in July 2014 and will replace IAS 39 – Financial Instruments: Recognition and Measurement ("IAS 39"). IFRS 9 establishes principles for the recognition, classification and measurement of financial assets and liabilities. IFRS 9 sets out a single approach to determine whether a financial asset is measured at amortized cost or fair value, replacing the multiple classification options in IAS 39. This approach is based on how an entity manages its financial instruments and the contractual cash flow characteristics of its financial assets. IFRS 9 retains most of the IAS 39 requirements for financial liabilities. The most significant change is when an entity elects to measure a financial liability at fair value, gains or losses due to changes in the credit risk of the instrument must be recognized in other comprehensive income. IFRS 9 is effective for annual periods beginning on or after January 1, 2018. The REIT is currently evaluating the impact of this new standard.
In December 2014, the IASB amended IAS 1 – Presentation of Financial Statements. The amendments were done under the IASB's Disclosure Initiative to improve presentation and disclosure requirements, and are effective for annual periods beginning on or after January 1, 2016. The REIT is currently evaluating the impact of these amendments.
The IASB issued IFRS 16 – Leases ("IFRS 16") in January 2016 which replaces IAS 17 - Leases and IFRIC 4 - Determining whether an Arrangement contains a Lease. The most significant change introduced by IFRS 16 is a single lessee accounting model, bringing leases on-balance sheet for lessees. IFRS 16 is effective for annual periods beginning on or after January 1, 2019. The REIT is currently evaluating the impact of this new standard.
Note 3. Acquisitions and dispositions of investment properties
Acquisitions:
The REIT acquired the following properties during the year ended December 31, 2015:
PropertyPropertycount Location Acquisition date Asset class
The Point at Inverness (1) 1 Greater Denver Area, CO March 26, 2015 Office
Graham Portfolio (2) 8 Various cities in BC, AB & SK July 23, 2015 Industrial
Canadian Pacific Plaza 1 Twin Cities Area, MN November 3, 2015 Office
(1) The REIT acquired a 50% interest in this joint venture (see note 22).
(2) The REIT acquired a 75% interest in this joint venture (see note 22).
The REIT acquired the following parcel of development land during the year ended December 31, 2015:
Property Location Acquisition date Asset class
Inverness Drive West Greater Denver Area, CO August 12, 2015 Office
The REIT acquired the following properties during the year ended December 31, 2014:
PropertyPropertycount Location Acquisition date Asset class
Hudson's Bay Centre (1) 1 Greater Denver Area, CO April 15, 2014 Office
Estevan Shoppers Mall 1 Estevan, SK May 1, 2014 Retail
601 Tower at Carlson 1 Twin Cities Area, MN June 11, 2014 Office
Crosstown North Business Center II & VI 2 Twin Cities Area, MN June 16, 2014 Industrial
Shoppes of St. Vital 1 Winnipeg, MB September 9, 2014 Retail
Crowfoot Village 1 Calgary, AB November 17, 2014 Retail
Cargill R&D 1 Twin Cities Area, MN December 16, 2014 Industrial
Union Crossings II 1 Twin Cities Area, MN December 31, 2014 Retail
(1) The REIT acquired a 50% interest in this joint venture.
The REIT acquired the following parcels of development land during the year ended December 31, 2014:
Property Location Acquisition date Asset class
Park Lucero (1) Greater Phoenix Area, AZ March 7, 2014 Industrial
Corridor Park (1) Houston, TX June 17, 2014 Office
Park 8Ninety Houston, TX September 18, 2014 Industrial
Stampede Station II Calgary, AB October 8, 2014 Office
801 Carlson Twin Cities Area, MN October 20, 2014 Office
Union Crossings III Twin Cities Area, MN December 31, 2014 Retail
(1) The REIT acquired a 90% interest in this joint venture.

CONSOLIDATED FINANCIAL STATEMENTS(In thousands of Canadian dollars, unless otherwise noted)
2015 FINANCIAL REPORT 50 ARTIS REAL ESTATE INVESTMENT TRUST
These acquisitions have been accounted for using the acquisition method, with the results of operations included in the REIT's accounts from the date of acquisition. The net assets acquired, excluding the acquisition of joint ventures, were as follows:
Year endedDecember 31,
2015 2014
Investment properties (note 4) $ 105,022 $ 201,588
Long-term debt, including acquired above- and below-market mortgages, net of financing costs (62,436) (60,383)
Cash consideration $ 42,586 $ 141,205
Transaction costs expensed $ 553 $ 2,077
Dispositions:
The REIT disposed of the following properties during the year ended December 31, 2015:
Property Location Disposition date Asset class
Moose Jaw Sobeys Moose Jaw, SK June 18, 2015 Retail
1045 Howe Street Greater Vancouver Area, BC June 24, 2015 Office
605 Waterford Park Twin Cities Area, MN October 9, 2015 Office
Willingdon Green Greater Vancouver Area, BC November 2, 2015 Office
Gateway II Grande Prairie, AB November 30, 2015 Retail
Mosaic Office Building Tampa, FL December 30, 2015 Office
The proceeds from the sale of the above properties, net of costs and related debt, were $106,110. The assets and liabilities associated with the properties were derecognized.The REIT disposed of the following properties during the year ended December 31, 2014:
Property Location Disposition date Asset class
15 Blair Drive Greater Toronto Area, ON March 31, 2014 Industrial
King Edward Centre Greater Vancouver Area, BC May 22, 2014 Retail
Shady Oak Twin Cities Area, MN December 1, 2014 Industrial
The proceeds from the sale of the above properties, net of costs and related debt, were $18,096. The assets and liabilities associated with these properties were derecognized.
Note 4. Investment properties, investment properties under development and investment properties held for sale
Year endedDecember 31, 2015
Investment propertiesunder development
Investment propertiesheld for sale
Balance, beginning of year $ 5,201,489 $ 81,682 $ —
Additions:
Acquisitions (note 3) 105,022 — —
Capital expenditures 24,711 33,297 54
Leasing commissions 12,651 334 973
Dispositions (52,977) — (86,310)
Reclassification of investment properties under development 90,496 (90,496) —
Reclassification of investment properties held for sale (193,327) — 193,327
Foreign currency translation gain 236,214 3,356 4,987
Straight-line rent adjustment 2,830 30 110
Tenant inducement additions, net of amortization 12,575 (99) 5,114
Fair value loss (361,663) (1,212) (2,751)
Balance, end of year $ 5,078,021 $ 26,892 $ 115,504

CONSOLIDATED FINANCIAL STATEMENTS(In thousands of Canadian dollars, unless otherwise noted)
ARTIS REAL ESTATE INVESTMENT TRUST 51 2015 FINANCIAL REPORT
Year endedDecember 31, 2014
Investment propertiesunder development
Balance, beginning of year $ 4,851,877 $ 47,281
Additions:
Acquisitions (note 3) 187,028 14,560
Capital expenditures 21,522 21,178
Leasing commissions 8,240 1,146
Dispositions (20,407) —
Reclassification of investment properties under development 2,338 (2,338)
Foreign currency translation gain 97,707 1,089
Straight-line rent adjustment 4,655 22
Tenant inducement additions, net of amortization 8,816 510
Contingent consideration adjustment (884) —
Fair value gain (loss) 40,597 (1,766)
Balance, end of year $ 5,201,489 $ 81,682
During the year ended December 31, 2015, the REIT reclassified three industrial properties and two retail properties from investment properties under development to investment properties.
The REIT reclassified one office property and one retail property to investment properties held for sale that were listed with an external broker at December 31, 2015. These properties have an aggregate mortgage payable balance of $51,900 at December 31, 2015.
At December 31, 2015, included in investment properties is $33,939 (December 31, 2014, $30,587) of net straight-line rent receivables arising from the recognition of rental income on a straight-line basis over the lease term in accordance with IAS 17 - Leases.
Investment properties include properties held under operating leases with an aggregate fair value of $93,575 at December 31, 2015 (December 31, 2014, $93,275).
At December 31, 2015, investment properties with a fair value of $4,203,603 (December 31, 2014, $4,653,391) are pledged as security under mortgage agreements.
External valuations are performed quarterly on a rotational basis over a four year cycle. For the year ended December 31, 2015, 63 investment properties of the total portfolio of 252 properties at December 31, 2015 (25.0%) were appraised by qualified external valuation professionals. For the year ended December 31, 2014, 61 investment properties of the total portfolio of 246 properties at December 31, 2014 (24.8%) were appraised by qualified external valuation professionals. The REIT uses similar assumptions and valuation techniques in its internal valuations as used by the external valuation professionals.
The REIT determined the fair value of investment properties based upon either the discounted cash flow method or the overall capitalization method, which are generally accepted appraisal methodologies. There were no changes to the REIT's internal valuation methodology during the years ended December 31, 2015 and 2014.
Under the discounted cash flow method, expected future cash flows are discounted using an appropriate rate based on the risk of the property. Expected future cash flows for each investment property are based upon, but not limited to, rental income from current leases, budgeted and actual expenses, and assumptions about rental income from future leases. The REIT uses leasing history, market reports, tenant profiles and building assessments, among other things, in determining the most appropriate assumptions. Discount and capitalization rates are estimated using market surveys, available appraisals and market comparables. Under the overall capitalization method, year one net income is stabilized and capitalized at a rate appropriate for each investment property. The stabilized net income incorporates allowances for vacancy, management fees and structural repair reserves. The resulting capitalized value is further adjusted, where appropriate, for costs to stabilize the net income and non-recoverable capital expenditures.
A change in the discount or capitalization rates used could have a material impact on the fair value of the REIT's investment properties. When discount or capitalization rates compress, the estimated fair values of investment properties increase. When discount or capitalization rates expand, the estimated fair values of investment properties decrease.A change in estimated future rental income and expenses could have a material impact on the fair value of the REIT's investment properties. Estimated rental income and expenses are affected by, but not limited to, changes in rent and expense growth and occupancy rates.
Under the fair value hierarchy, the fair value of the REIT's investment properties is considered a Level 3, as described in note 26 (b).

CONSOLIDATED FINANCIAL STATEMENTS(In thousands of Canadian dollars, unless otherwise noted)
2015 FINANCIAL REPORT 52 ARTIS REAL ESTATE INVESTMENT TRUST
The REIT has used the following rates and investment horizons in estimating the fair value of investment properties:
December 31, 2015 December 31, 2014
Maximum MinimumWeighted-
average Maximum MinimumWeighted-
average
Western Canada:
Discount rate 9.50% 6.25% 7.66% 8.75% 6.25% 7.26%
Terminal capitalization rate 9.00% 4.50% 6.94% 8.00% 4.50% 6.41%
Capitalization rate 8.75% 4.50% 6.76% 7.50% 4.50% 6.14%
Investment horizon (years) 12.0 9.0 10.2 17.0 10.0 10.7
Central Canada:
Discount rate 9.00% 6.25% 7.71% 9.00% 7.25% 7.76%
Terminal capitalization rate 8.50% 5.75% 6.59% 8.50% 6.00% 6.68%
Capitalization rate 8.25% 5.75% 6.38% 8.25% 5.75% 6.42%
Investment horizon (years) 12.0 10.0 10.2 13.0 10.0 10.2
Eastern Canada:
Discount rate 7.75% 6.50% 7.21% 7.75% 6.75% 7.28%
Terminal capitalization rate 7.00% 5.50% 6.43% 7.00% 5.75% 6.55%
Capitalization rate 6.75% 5.50% 6.28% 7.00% 5.50% 6.30%
Investment horizon (years) 12.0 10.0 10.4 14.0 10.0 10.6
U.S.:
Discount rate 9.50% 7.00% 7.95% 9.50% 7.00% 8.15%
Terminal capitalization rate 9.00% 5.75% 6.98% 9.00% 6.00% 7.13%
Capitalization rate 8.75% 5.75% 6.71% 8.75% 6.00% 6.88%
Investment horizon (years) 20.0 10.0 11.3 20.0 9.0 11.2
Overall:
Discount rate 9.50% 6.25% 7.68% 9.50% 6.25% 7.55%
Terminal capitalization rate 9.00% 4.50% 6.81% 9.00% 4.50% 6.63%
Capitalization rate 8.75% 4.50% 6.60% 8.75% 4.50% 6.37%
Investment horizon (years) 20.0 9.0 10.5 20.0 9.0 10.7
The above information represents the REIT’s entire portfolio of investment properties, excluding properties included in the REIT's investments in joint ventures.
The following sensitivity table outlines the impact of a 0.25% change in the weighted-average capitalization rate on investment properties at December 31, 2015:
Change to fair value if capitalization rate increases by 0.25%
Change to fair value if capitalization rate decreases by 0.25%
Western Canada $ (73,675) $ 79,555
Central Canada (38,582) 41,765
Eastern Canada (23,174) 25,113
U.S. (39,789) 42,938
$ (175,220) $ 189,371
Note 5. Property and equipment
December 31, 2015
December 31, 2014
Office furniture and fixtures $ 4,903 $ 4,045
Office equipment and software 1,230 1,152
Accumulated depreciation (2,547) (1,792)
$ 3,586 $ 3,405

CONSOLIDATED FINANCIAL STATEMENTS(In thousands of Canadian dollars, unless otherwise noted)
ARTIS REAL ESTATE INVESTMENT TRUST 53 2015 FINANCIAL REPORT
Note 6. Notes receivable
December 31, 2015
December 31, 2014
Note receivable from tenant maturing in May 2023, bearing interest at 5.89% per annum, repayable in varying blendedmonthly installments of principal and interest. A default under the terms of the note constitutes a default of the lease ofthe tenant. $ 16,873 $ 18,672
Other notes receivable 1,647 2,076
18,520 20,748
Current portion 2,744 2,509
Non-current portion $ 15,776 $ 18,239
Note 7. Prepaid expenses and other assets
December 31,2015
December 31, 2014
Prepaid insurance $ 2,915 $ 2,667
Prepaid realty taxes 1,308 1,717
Prepaid acquisition, disposition and development costs 1,601 378
Derivative instruments swaps (note 26 (b)) — 172
Other prepaid expenses 2,048 1,737
$ 7,872 $ 6,671
Note 8. Accounts receivable and other receivables
December 31, 2015
December 31, 2014
Rents receivable (note 26 (a)(ii)) $ 6,513 $ 5,072
Allowance for doubtful accounts (note 26 (a)(ii)) (630) (627)
Accrued recovery income 3,159 3,518
Other amounts receivable 2,715 2,992
$ 11,757 $ 10,955
Note 9. Mortgages and loans payable
December 31, 2015
December 31, 2014
Mortgages and loans payable $ 2,196,837 $ 2,267,285
Net above- and below-market mortgage adjustments 8,977 3,186
Financing costs (7,495) (8,417)
2,198,319 2,262,054
Current portion 494,766 393,197
Non-current portion $ 1,703,553 $ 1,868,857
The majority of the REIT's assets have been pledged as security under mortgages and other security agreements. 69.0% of the REIT's mortgages and loans payable bear interest at fixed rates, and a further 16.7% of the REIT's mortgages and loans payable bear interest at variable rates with interest rate swaps in place. The weighted-average effective rate on all mortgages and loans payable is 3.96% and the weighted-average nominal rate is 3.89% at December 31, 2015 (December 31, 2014, 4.18% and 4.04%, respectively). Maturity dates range from January 1, 2016 to February 14, 2032.
The REIT's mortgage providers have various financial covenants. The REIT monitors these covenants, which are primarily debt service coverage ratios, and was in compliance with these requirements at December 31, 2015.
Note 10. Senior unsecured debentures
On March 27, 2014, under the June 15, 2012 short form base shelf prospectus, the REIT issued 3.753% Series A senior unsecured debentures at par for gross proceeds of $125,000. On September 10, 2014, under the July 17, 2014 short form base shelf prospectus, the REIT issued additional 3.753% Series A senior unsecured debentures at a price of $101.24 with a face value of $75,000, for gross proceeds of $75,932. Interest is payable semi-annually on March 27 and September 27. The REIT may redeem the debentures at any time on a minimum of 30 days notice, in whole or in part, at a price equal to the greater of (i) the price of the debentures calculated to provide a yield to maturity equal to the then Government of Canada bond yield plus 0.50% and (ii) par, together in each case with accrued and unpaid interest to the date fixed for redemption.

CONSOLIDATED FINANCIAL STATEMENTS(In thousands of Canadian dollars, unless otherwise noted)
2015 FINANCIAL REPORT 54 ARTIS REAL ESTATE INVESTMENT TRUST
In accordance with the Series A senior unsecured debenture supplemental indenture, the REIT must maintain a consolidated EBITDA to consolidated interest expense ratio of not less than 1.65, consolidated indebtedness to aggregate assets of not more than 65% and minimum adjusted unitholders' equity of $300,000. As at December 31, 2015, the REIT was in compliance with these requirements.
Interest expense on the senior unsecured debentures is determined by applying an effective rate of 3.82% to the outstanding liability balance. The difference between actual cash interest payments and interest expense recorded on the senior unsecured debentures is accreted to the liability.
Particulars of the REIT's outstanding senior unsecured debentures are as follows:
Senior unsecured debenture issue Issue date Maturity date Interest rate
Series A March 27, 2014, September 10, 2014 March 27, 2019 3.753%
Face valueUnamortized
accretion
Unamortizedfinancing
costs Carrying valueCurrentportion
Non-currentportion
December 31, 2015 $ 200,000 $ 678 $ (1,047) $ 199,631 $ — $ 199,631
December 31, 2014 200,000 872 (1,345) 199,527 — 199,527
During the year ended December 31, 2015, accretion to the liability of $194 and financing cost amortization of $298 were recorded (2014, $59 and $165, respectively).
Note 11. Convertible debentures
In conjunction with the purchase of the Fort McMurray portfolio effective November 30, 2007, the REIT issued a Series D convertible redeemable 5.00% debenture totaling $20,000. On January 15, 2014, the REIT redeemed $2,500 of the Series D convertible debentures for cash. On December 1, 2014, the REIT redeemed the remaining balance of the Series D convertible debentures of $1,500 for cash.
In conjunction with the prospectus that closed on April 22, 2010, the REIT issued Series F convertible redeemable 6.00% debentures totaling $86,250. Interest is paid semi-annually on June 30 and December 31. The convertible debentures are convertible into units of the REIT by the holder at any time prior to maturity, being June 30, 2020, at a price of $15.50 per unit. On or after March 31, 2014, but prior to March 31, 2016, the Series F debentures will be redeemable, in whole or in part, at a price equal to the principal amount plus accrued interest, at Artis’ option on a minimum of 30 days notice, provided that the weighted-average trading price of the units is not less than 125% of the conversion price. On and after March 31, 2016, the Series F convertible debentures will be redeemable, in whole or in part, at a price equal to the principal amount plus accrued interest, at Artis’ option on a minimum of 30 days notice. None of the Series F convertible debentures were converted into units of the REIT in fiscal 2015 and 2014.
In conjunction with the prospectus that closed on April 21, 2011, the REIT issued Series G convertible redeemable 5.75% debentures totaling US$88,000. Interest is paid semi-annually on June 30 and December 31. The convertible debentures are convertible into units of the REIT by the holder at any time prior to maturity, being June 30, 2018, at a price of US$18.96 per unit. On or after June 30, 2014, but prior to June 30, 2016, the Series G debentures will be redeemable, in whole or in part, at a price equal to the principal amount plus accrued interest, at Artis’ option on a minimum of 30 days notice, provided that the weighted-average trading price of the units is not less than 125% of the conversion price. On and after June 30, 2016, the Series G convertible debentures will be redeemable, in whole or in part, at a price equal to the principal amount plus accrued interest, at Artis’ option on a minimum of 30 days notice. The debentures rank pari passu with the convertible debentures issued on April 22, 2010. None of the Series G convertible debentures were converted into units of the REIT in fiscal 2015 or 2014.
The REIT's convertible debentures are classified as compound financial instruments. The fair values of the convertible debentures were estimated in whole and separated into liability and equity components when the convertible debentures were reclassified from financial liabilities on August 2, 2012, when the REIT amended its Declaration of Trust to become a closed-end trust. The fair value of each convertible debentures series was estimated using the market price of the debentures, or if no market price existed, an estimate based on the present value of future interest and principal payments due under the terms of the convertible debenture using a discount rate for similar debt instruments. The Series F convertible debentures were separated into liability and equity components based on the estimated fair value of the liability component. The fair value of the liability component was estimated based on the present value of future interest and principal payments due under the terms of the convertible debenture using a discount rate for similar debt instruments without a conversion feature. The value assigned to the equity component is the residual of the fair value of the liability component and the fair value of the whole financial instrument. Interest expense on the Series F convertible debentures is determined by applying an effective interest rate of 6.25% to the outstanding liability component. The difference between actual cash interest payments and interest expense recorded on the convertible debentures is accreted to the liability component.The fair value of the Series G convertible debentures in whole was recorded as a liability with no value assigned to equity as these convertible debentures are denominated in US dollars with no fixed conversion rate to Canadian dollars. Interest expense on the Series G convertible debentures is determined by applying an effective rate of 5.04% to the outstanding liability balance. The difference between actual cash interest payments and interest expense recorded on the convertible debentures is accreted to the liability.
Particulars of the REIT's outstanding convertible debentures are as follows:
Convertible redeemable debenture issue Issue date Maturity date Interest rate
Series F April 22, 2010 June 30, 2020 6.00%
Series G April 21, 2011 June 30, 2018 5.75%
Convertible redeemabledebenture issue Face value
Equityportion
Liabilityportion Accretion
Carryingvalue
Currentportion
Non-currentportion
Series F $ 86,170 $ 11,023 $ 84,841 $ 495 $ 85,336 $ — $ 85,336
Series G 121,792 — 126,176 (2,372) 123,804 — 123,804
December 31, 2015 $ 207,962 $ 11,023 $ 211,017 $ (1,877) $ 209,140 $ — $ 209,140
December 31, 2014 188,259 11,023 190,605 (1,032) 189,573 — 189,573
During the year ended December 31, 2015, accretion of $526 reduced the carrying value of the liability component (2014, $416).

CONSOLIDATED FINANCIAL STATEMENTS(In thousands of Canadian dollars, unless otherwise noted)
ARTIS REAL ESTATE INVESTMENT TRUST 55 2015 FINANCIAL REPORT
Note 12. Accounts payable and other liabilities
December 31, 2015
December 31, 2014
Accounts payable and accrued liabilities $ 31,332 $ 28,309
Distributions payable 13,161 12,929
Accrued interest 8,820 8,985
Accrued realty taxes 3,978 3,415
Tenant installments payable 4,244 3,631
Derivative instruments swaps (note 26 (b)) 10,811 6,852
Cash-settled unit-based payments liability 2,126 1,354
Other amounts payable 1,040 1,228
$ 75,512 $ 66,703
Note 13. Bank indebtedness
On December 17, 2014, the REIT entered into two unsecured revolving term credit facilities in the aggregate amount of $125,000, which can be utilized for general corporate and working capital purposes, short term financing of investment property acquisitions and the issuance of letters of credit. The REIT can draw on the facilities in Canadian or US dollars. On May 20, 2015, the aggregate amount of the unsecured revolving term credit facilities was increased to $200,000. On September 25, 2015, the aggregate amount was further increased to $300,000. The credit facilities mature on December 15, 2018. Amounts drawn on the facilities bear interest at prime plus 0.70% or at the bankers' acceptance rate plus 1.70%. At December 31, 2015, the REIT had $225,000 drawn on the facilities.
For purposes of the credit facilities, the REIT must maintain a consolidated indebtedness to consolidated gross book value ratio of not more than 65%, a consolidated secured indebtedness to consolidated gross book value ratio of not more than 50%, a minimum consolidated EBITDA to debt service ratio of 1.4, a minimum unitholders' equity of not less than the sum of $1,700,000 and 75% of net proceeds received in connection with any equity offerings made after the date of the credit facilities agreement, a minimum unencumbered property assets value to consolidated unsecured indebtedness ratio of 1.4, and a minimum consolidated EBITDA to consolidated interest expense ratio of 1.65. As at December 31, 2015, the REIT was in compliance with these requirements.
Note 14. Unitholders' equity
(a) Common units:
(i) Authorized:
In accordance with the Declaration of Trust, the REIT may issue an unlimited number of common units, with each unit representing an equal undivided interest in any distributions from the REIT, and in the net assets in the event of termination or wind-up of the REIT. All units are of the same class with equal rights and restrictions.
(ii) Issued and outstanding:
Number of units Amount
Balance at December 31, 2013 126,938,476 $ 1,638,219
Public offerings, net of issue costs of $5,028 7,147,250 110,043
Options and restricted units exercised 200,164 2,986
Distribution Reinvestment and Unit Purchase Plan 1,678,573 24,957
At-the-market equity financing 320,000 4,469
Balance at December 31, 2014 136,284,463 1,780,674
Options and restricted units exercised 181,703 2,845
Distribution Reinvestment and Unit Purchase Plan 2,398,320 31,552
Balance at December 31, 2015 138,864,486 $ 1,815,071
The REIT has a Distribution Reinvestment and Unit Purchase Plan which allows unitholders the option to elect to receive all or a portion of their regular monthly distributions in additional REIT units.
(iii) Normal course issuer bid:
On December 14, 2015, the REIT announced that the Toronto Stock Exchange (the "Exchange") had approved the renewal of its normal course issuer bid. Under the renewed bid, the REIT will have the ability to purchase for cancellation up to a maximum of 13,735,036 units, representing 10% of the REIT's public float of 137,350,360 units on December 4, 2015. Purchases will be made at market prices through the facilities of the Exchange. This bid will remain in effect until the earlier of December 16, 2016, or the date on which the REIT has purchased the maximum number of units permitted under the bid. During the years ended December 31, 2015 and 2014, the REIT did not acquire units through the normal course issuer bid.
(iv) At-the-market equity financing:
The REIT has entered into an Equity Distribution Agreement dated September 17, 2010, as most recently amended and restated on September 15, 2014, with an exclusive agent for the issuance and sale, from time to time, until August 17, 2016 of up to 4,980,000 units of the REIT by way of "at-the-market distributions". The timing of any sale of units and the number of units actually sold during such period are at the discretion of the REIT. Sales of units, if any, pursuant to the Equity Distribution Agreement will be made in transactions that are deemed to be "at-the-market distributions", including sales made directly on the Exchange. No units were issued pursuant to this arrangement in fiscal 2015. On January 31, 2014, 320,000 units were issued.

CONSOLIDATED FINANCIAL STATEMENTS(In thousands of Canadian dollars, unless otherwise noted)
2015 FINANCIAL REPORT 56 ARTIS REAL ESTATE INVESTMENT TRUST
(b) Preferred units:
In accordance with the Declaration of Trust, the REIT may issue an unlimited number of preferred units.
(i) Series A:
On August 2 and 10, 2012, the REIT issued a total of 3,450,000 Cumulative Rate Reset Preferred Trust Units, Series A (the "Series A Units") for aggregate gross proceeds of $86,250. The Series A Units pay a cumulative distribution yield of 5.25% per annum, payable quarterly, as and when declared by the Board of Trustees of the REIT, for the initial five-year period ending September 30, 2017. The distribution rate will be reset on September 30, 2017 and every five years thereafter at a rate equal to the sum of the then five-year Government of Canada bond yield and 4.06%.
The REIT may redeem the Series A Units on September 30, 2017 and on September 30 every five years thereafter. The holders of Series A Units have the right to reclassify their Series A Units to Preferred Units, Series B (the "Series B Units"), subject to certain conditions, on September 30, 2017 and on September 30 every five years thereafter. The Series B Units pay floating rate cumulative preferential distributions on a quarterly basis, at the discretion of the Board of Trustees. The holders of Series B Units have the right to reclassify their Series B Units to Series A Units on September 30, 2022 and on September 30 every five years thereafter.
(ii) Series C:
On September 18, 2012, the REIT issued 3,000,000 Cumulative Rate Reset Preferred Trust Units, Series C (the "Series C Units") for aggregate gross proceeds of US$75,000. The Series C Units pay a fixed cumulative distribution yield of 5.25% per annum, payable quarterly, as and when declared by the Board of Trustees of the REIT, for the initial approximately five and a half-year period ending March 31, 2018. The distribution rate will be reset on March 31, 2018 and every five years thereafter at a rate equal to the sum of the then five-year United States Government bond yield and 4.46%.
The REIT may redeem the Series C Units on March 31, 2018 and on March 31 every five years thereafter. The holders of Series C Units have the right to reclassify their Series C Units to Preferred Units, Series D ("the Series D Units"), subject to certain conditions, on March 31, 2018 and on March 31 every five years thereafter. The Series D Units pay floating rate cumulative preferential distributions on a quarterly basis, at the discretion of the Board of Trustees. The holders of Series D Units have the right to reclassify their Series D Units to Series C Units on March 31, 2023 and on March 31 every five years thereafter.
(iii) Series E:
On March 21, 2013, the REIT issued 4,000,000 Cumulative Rate Reset Preferred Trust Units, Series E (the "Series E Units") for aggregate gross proceeds of $100,000. The Series E Units pay a cumulative distribution yield of 4.75% per annum, payable quarterly, as and when declared by the Board of Trustees of the REIT, for the initial period ending September 30, 2018. The distribution rate will be reset on September 30, 2018 and every five years thereafter at a rate equal to the sum of the then five-year Government of Canada bond yield and 3.30%.
The REIT may redeem the Series E Units on September 30, 2018 and on September 30 every five years thereafter. The holders of Series E Units have the right to reclassify their Series E Units to Preferred Units, Series F (the "Series F Units"), subject to certain conditions, on September 30, 2018 and on September 30 every five years thereafter. The Series F Units pay floating rate cumulative preferential distributions on a quarterly basis, at the discretion of the Board of Trustees. The holders of Series F Units have the right to reclassify their Series F Units to Series E Units on September 30, 2023 and on September 30 every five years thereafter.
(iv) Series G:
On July 29, 2013, the REIT issued 3,200,000 Cumulative Rate Reset Preferred Trust Units, Series G (the "Series G Units") for aggregate gross proceeds of $80,000. This included 200,000 Series G Units issued pursuant to the partial exercise of the Underwriters' option. The Series G Units pay a cumulative distribution yield of 5.00% per annum, payable quarterly, as and when declared by the Board of Trustees of the REIT, for the initial period ending July 31, 2019. The distribution rate will be reset on July 31, 2019 and every five years thereafter at a rate equal to the sum of the then five-year Government of Canada bond yield and 3.13%.
The REIT may redeem the Series G Units on July 31, 2019 and on July 31 every five years thereafter. The holders of Series G Units have the right to reclassify their Series G Units to Preferred Units, Series H (the "Series H Units"), subject to certain conditions, on July 31, 2019 and on July 31 every five years thereafter. The Series H Units pay floating rate cumulative preferential distributions on a quarterly basis, at the discretion of the Board of Trustees. The holders of Series H Units have the right to reclassify their Series H Units to Series G Units on July 31, 2024 and on July 31 every five years thereafter.
The Series A Units, Series C Units, Series E Units and Series G Units rank equally with each other and with the outstanding Series B Units, Series D Units, Series F Units and Series H Units into which they may be reclassified, and rank in priority to the trust units.
(c) Short form base shelf prospectus:
On July 17, 2014, the REIT issued a short form base shelf prospectus. The REIT may from time to time during the 25-month period that this short form base shelf prospectus is valid, offer and issue the following securities up to a maximum of $2,000,000 of initial offering price: (i) trust units of the REIT; (ii) preferred trust units, which may be issuable in series; (iii) debt securities, which may consist of debentures, notes or other types of debt and may be issuable in series; (iv) unit purchase warrants; and (v) subscription receipts to purchase trust securities. As at December 31, 2015, the REIT has issued senior unsecured debentures under one offering in the amount of $75,000 under this short form base shelf prospectus.

CONSOLIDATED FINANCIAL STATEMENTS(In thousands of Canadian dollars, unless otherwise noted)
ARTIS REAL ESTATE INVESTMENT TRUST 57 2015 FINANCIAL REPORT
(d) Weighted-average common units:
Year endedDecember 31,
2015 2014
Net (loss) income $ (175,699) $ 197,886
Adjustment for distributions to preferred unitholders (note 15) (18,435) (17,662)
Net (loss) income attributable to common unitholders (194,134) 180,224
Adjustment for convertible debentures — 10,333
Adjustment for restricted units — (51)
Adjustment for deferred units — (2)
Diluted net (loss) income attributable to common unitholders $ (194,134) $ 190,504
The weighted-average number of common units outstanding was as follows:
Basic common units 137,600,613 132,553,521
Effect of dilutive securities:
Unit options — 144,975
Convertible debentures — 10,200,277
Restricted units — 216,721
Deferred units — 439
Diluted common units 137,600,613 143,115,933
Net (loss) income per unit attributable to common unitholders:
Basic $ (1.41) $ 1.36
Diluted $ (1.41) $ 1.33
The computation of diluted net (loss) income per unit attributable to common unitholders includes unit options, convertible debentures, restricted units and deferred units when these instruments are dilutive. For the year ended December 31, 2015, all these instruments are anti-dilutive. For the year ended December 31, 2014, out-of-the-money options are the only anti-dilutive instrument.
Note 15. Distributions to unitholders
Total distributions declared to unitholders are as follows:
Year endedDecember 31, 2015
Year endedDecember 31, 2014
Total distributions Distributions per unit Total distributions Distributions per unit
Common unitholders $ 148,709 $ 1.08 $ 143,668 $ 1.08
Preferred unitholders - Series A 4,528 1.31 4,528 1.31
Preferred unitholders - Series C 5,157 1.72 4,384 1.46
Preferred unitholders - Series E 4,750 1.19 4,750 1.19
Preferred unitholders - Series G 4,000 1.25 4,000 1.25
Note 16. Revenue
The REIT leases industrial, retail and office properties to tenants under operating leases.
Minimum rental commitments on non-cancellable tenant operating leases over their remaining terms are as follows:
December 31, 2015
December 31, 2014
Not later than one year $ 342,430 $ 321,426
Later than one year and not later than five years 981,797 901,866
Later than five years 727,252 620,300
$ 2,051,479 $ 1,843,592

CONSOLIDATED FINANCIAL STATEMENTS(In thousands of Canadian dollars, unless otherwise noted)
2015 FINANCIAL REPORT 58 ARTIS REAL ESTATE INVESTMENT TRUST
Note 17. Loss on financial instruments
Year endedDecember 31,
2015 2014
Realized gain on convertible debentures $ — $ 121
Unrealized loss on interest rate swaps (3,544) (8,558)
$ (3,544) $ (8,437)
Note 18. Changes in non-cash operating items
Year endedDecember 31,
2015 2014
Prepaid expenses and other assets $ (1,551) $ (293)
Accounts receivable and other receivables (314) (907)
Security deposits and prepaid rent (21) 4,062
Accounts payable and other liabilities (533) 390
$ (2,419) $ 3,252
Note 19. Employee benefits
(a) Short-term employee benefits:
Year endedDecember 31,
2015 2014
Trustees $ 664 $ 734
Key management personnel 3,650 4,231
Other employees 14,489 12,115
$ 18,803 $ 17,080
Short-term employee benefits include salaries, bonuses and other short-term benefits. Key management personnel are those persons having authority and responsibility for planning, directing and controlling the activities of the REIT, directly or indirectly.
(b) Long-term employee benefits:
(i) Defined benefit pension plans:
The REIT has defined benefit plans providing pension benefits to certain key management personnel. The ultimate retirement benefit is defined by a formula that provides a unit of benefit for each year of service. Employer contributions are not specified or defined within the plan text; they are based on the result of actuarial valuations which determine the level of funding required to meet the total obligation as estimated at the time of valuation. The REIT uses December 31 as a measurement date for accounting purposes for its defined benefit pension plans.
The amounts included in the consolidated balance sheets in respect of the employee benefit plans are as follows:
Year endedDecember 31,
2015 2014
Accrued defined benefit obligation $ 5,259 $ 4,104
Fair value of plan assets 5,293 4,325
Funded status (34) (221)
Assets not recognized due to asset ceiling 34 221
Net liability arising from defined benefit obligation $ — $ —
The net expense for the defined benefit plans for the year ended December 31, 2015 is $1,121 (2014, $1,189) and is included in corporate expenses.
(ii) Other long-term employee benefits:
The REIT has an obligation for future retirement payments to certain key management personnel upon completion of a defined service period. The REIT has recorded an expense of $1,702 related to these benefits for the year ended December 31, 2015 (2014, $844), which is included in corporate expenses.

CONSOLIDATED FINANCIAL STATEMENTS(In thousands of Canadian dollars, unless otherwise noted)
ARTIS REAL ESTATE INVESTMENT TRUST 59 2015 FINANCIAL REPORT
(c) Unit-based compensation:
Year endedDecember 31,
2015 2014
Trustees $ 266 $ 139
Key management personnel 968 1,137
Other employees 526 364
$ 1,760 $ 1,640
Under the REIT’s equity incentive plan, there may be grants of unit options, restricted units, deferred units or installment units, which are subject to certain restrictions. Under this incentive plan, the total number of units reserved for issuance may not exceed 8,500,000 units, of which a maximum of 4,000,000 units are reserved for the issuance of unit options.
(i) Unit options:
Unit-based compensation expense related to unit options outstanding under the equity incentive plan for the year ended December 31, 2015 amounted to $256 (2014, $609). These unit options vest equally over a four-year period from the grant date.
A summary of the REIT's unit options outstanding are as follows:
Year endedDecember 31, 2015
Year endedDecember 31, 2014
UnitsWeighted- average
exercise price UnitsWeighted- average
exercise price
Balance, beginning of year 2,863,250 $ 15.17 3,365,213 $ 15.03
Exercised (359,000) 13.29 (199,713) 12.62
Expired (188,250) 13.81 (302,250) 15.34
Balance, end of year 2,316,000 $ 15.57 2,863,250 $ 15.17
Options exercisable at end of year 1,939,875 1,868,250
The weighted-average unit price at the date of exercise for unit options exercised during the year ended December 31, 2015 was $14.27 (2014, $15.80).
Options outstanding at December 31, 2015 consist of the following:
Exercise price Number outstandingWeighted-average remaining
contractual lifeOptions outstanding weighted-
average exercise price Number exercisable
$ 14.10 811,500 0.50 years $ 14.10 811,500
16.36 1,504,500 1.25 years 16.36 1,128,375
2,316,000 $ 15.57 1,939,875
(ii) Restricted units:
Unit-based compensation expense related to restricted units outstanding under the equity incentive plan for the year ended December 31, 2015 amounted to $1,281 (2014, $1,006). Restricted units vest on and after the third anniversary of the date of grant. The restricted units accrue additional restricted units during the vesting period, and are credited when the restricted units vest. Each restricted unit is valued at the closing price of the REIT's common units on the balance sheet date.
A summary of the REIT's restricted units outstanding are as follows:
Year endedDecember 31, 2015
Year endedDecember 31, 2014
Units Units
Balance, beginning of year 276,484 203,957
Granted 125,550 75,300
Accrued 23,914 15,016
Exercised (50,394) (1,586)
Expired (6,947) (16,203)
Balance, end of year 368,607 276,484
Restricted units vested at end of year 965 —

CONSOLIDATED FINANCIAL STATEMENTS(In thousands of Canadian dollars, unless otherwise noted)
2015 FINANCIAL REPORT 60 ARTIS REAL ESTATE INVESTMENT TRUST
(iii) Deferred units:
Unit-based compensation expense related to deferred units outstanding under the equity incentive plan for the year ended December 31, 2015 amounted to $223 (2014, $25). Deferred units can only be granted to trustees of the REIT and vest immediately. Deferred units are redeemable within a specified time frame after a trustee ceases to be a trustee. The deferred units accrue additional deferred units after the grant date. Each deferred unit is valued at the closing price of the REIT's common units on the balance sheet date.
Year endedDecember 31, 2015
Year endedDecember 31, 2014
Units Units
Balance, beginning of year 1,744 —
Granted 10,300 1,723
Accrued 487 21
Balance, end of year 12,531 1,744
Deferred units vested at end of year 12,531 1,744
At December 31, 2015, no installment units have been granted under the REIT’s equity incentive plan.
Note 20. Related party transactions
The REIT may issue unit-based awards to trustees, officers, employees and consultants (note 19).
Other related party transactions are outlined as follows:
Year endedDecember 31,
2015 2014
Property management fees $ 328 $ 331
Capitalized leasing commissions fees 93 96
Capitalized project management fees — 15
Capitalized building improvements 7,887 7,881
Capitalized development projects 15,552 13,263
Capitalized office furniture and fixtures 580 758
Capitalized tenant inducements 1,288 498
Realty tax assessment consulting fees 1,312 385
Rental revenues (227) (168)
The REIT incurred property management fees, leasing commission fees and project management fees under property management agreements with Marwest Management Canada Ltd. (''Marwest Management''), a company related to certain trustees and officers of the REIT, for three properties owned by the REIT. The amount payable at December 31, 2015 is $44 (December 31, 2014, $29).
The REIT incurred costs for building improvements, development projects and tenant inducements paid to Marwest Construction Ltd. (''Marwest Construction'') and Marwest Development Corporation, companies related to certain trustees and officers of the REIT. The amount payable at December 31, 2015 is $1,724 (December 31, 2014, $3,253).
The REIT incurred costs for office furniture and fixtures paid to Marwest Construction. The amount payable at December 31, 2015 is $nil (December 31, 2014, $45).
The REIT incurred costs for realty tax assessment consulting paid to Fairtax Realty Advocates, a company under control of close family members of key management personnel. The amount payable at December 31, 2015 is $194 (December 31, 2014, $nil).
The REIT collects office rents from Marwest Management and Fairtax Realty Advocates.
These transactions are in the normal course of operations and are measured at the exchange amount, which is the amount of consideration established and agreed to by the related parties.

CONSOLIDATED FINANCIAL STATEMENTS(In thousands of Canadian dollars, unless otherwise noted)
ARTIS REAL ESTATE INVESTMENT TRUST 61 2015 FINANCIAL REPORT
Subsidiaries of the REIT, including joint arrangements and excluding bare trustees, are outlined as follows:
Ownership interest
Name of entity CountryDecember 31,
2015December 31,
2014
Artis General Partner Ltd. Canada 100% 100%
AX L.P. Canada 100% 100%
Artis Property Management General Partner Ltd. Canada 100% 100%
AX Property Management L.P. Canada 100% 100%
Winnipeg Square Leaseco, Inc. Canada 100% 100%
AR GL General Partner Ltd. Canada 75% —%
AR GL L.P. Canada 75% —%
AX Longboat G.P. Inc. Canada 50% 50%
AX Longboat L.P. Canada 50% 50%
Artis US Holdings, Inc. U.S. 100% 100%
Artis US Holdings II GP, Inc. U.S. 100% 100%
Artis US Holdings II, LLC U.S. 100% 100%
Artis US Holdings II L.P. U.S. 100% 100%
Park 8Ninety Phase I, LP U.S. 95% —%
Artis Core Park West Land, Ltd. U.S. 90% 90%
Park Lucero I L.P. U.S. 90% 90%
Park Lucero II L.P. U.S. 90% 90%
Artis HRA 1700 Broadway GP, LLC U.S. 50% 50%
Artis HRA 1700 Broadway L.P. U.S. 50% 50%
Artis HRA Hudsons Bay GP, LLC U.S. 50% 50%
Artis HRA Hudsons Bay L.P. U.S. 50% 50%
ARTIS HRA Inverness Point GP, LLC U.S. 50% —%
ARTIS HRA Inverness Point, LP U.S. 50% —%
Note 21. Income taxes
The REIT currently qualifies as a mutual fund trust and a real estate investment trust (“REIT”) for Canadian income tax purposes. Under current tax legislation, income distributed annually by the REIT to unitholders is a deduction in the calculation of its taxable income. As the REIT intends to distribute all of its taxable income to its unitholders, the REIT does not record a provision for current Canadian income taxes.
The REIT's U.S. subsidiaries are REITs for U.S. income tax purposes. The subsidiaries intend to distribute all of their U.S. taxable income to Canada and are entitled to deduct such distributions for U.S. income tax purposes. As a result, the REIT does not record a provision for current U.S. income taxes. The U.S. subsidiaries are subject to a 30% to 35% withholding tax on distributions to Canada. Any withholding taxes paid are recorded with the related distributions.
The Income Tax Act (Canada) contains legislations affecting the tax treatment of a specified investment flow-through (“SIFT”) trust or partnership (the “SIFT Rules”). A SIFT includes a publicly-listed or traded partnership or trust, such as an income trust.
Under the SIFT Rules, certain distributions from a SIFT are not deductible in computing a SIFT’s taxable income, and a SIFT is subject to tax on such distributions at a rate that is substantially equivalent to the general tax rate applicable to a Canadian corporation. However, distributions paid by a SIFT as returns of capital should generally not be subject to tax.
The SIFT Rules do not apply to a REIT that meets prescribed conditions relating to the nature of its assets and revenue (the “REIT Conditions”). The REIT has reviewed the SIFT Rules and has assessed their interpretation and application to the REIT’s assets and revenues. While there are uncertainties in the interpretation and application of the SIFT Rules, the REIT believes that it has met the REIT Conditions throughout the years ended December 31, 2015 and December 31, 2014. As a result, the REIT does not recognize any deferred income tax assets or liabilities for income tax purposes.

CONSOLIDATED FINANCIAL STATEMENTS(In thousands of Canadian dollars, unless otherwise noted)
2015 FINANCIAL REPORT 62 ARTIS REAL ESTATE INVESTMENT TRUST
Note 22. Joint arrangements
The REIT had interests in the following joint arrangements:
Ownership interest
Property Principal purpose Type of arrangementDecember 31,
2015December 31,
2014
Park 8Ninety I Investment property Joint venture 95% —%
Corridor Park Investment property Joint venture 90% 90%
Park Lucero I Investment property Joint venture 90% 90%
Park Lucero II Investment property Joint venture 90% 90%
1700 Broadway Investment property Joint venture 50% 50%
Centrepoint Investment property Joint venture 50% 50%
Hudson's Bay Centre Investment property Joint venture 50% 50%
The Point at Inverness Investment property Joint venture 50% —%
Graham Portfolio Investment property Joint venture 75% —%
Centre 70 Building Investment property Joint operation 85% 85%
Whistler Hilton Retail Plaza Investment property Joint operation 85% 85%
Westbank Hub Centre North Investment property Joint operation 75% 75%
Westbank Hub Shopping Centre Investment property Joint operation 75% 75%
Cliveden Building Investment property Joint operation 50% 50%
Kincaid Building Investment property Joint operation 50% 50%
The REIT has assessed the above investment properties as joint arrangements as decisions about the relevant activities require unanimous consent of the parties sharing control. The REIT has determined the type of arrangement based upon the ownership structure of each individual investment property.
During the year ended December 31, 2015, the REIT entered into three joint venture arrangements. Park 8Ninety I is an industrial property in Houston, Texas. The Point at Inverness is an office property in the Greater Denver Area, Colorado. The Graham Portfolio is a group of industrial properties in British Columbia, Alberta and Saskatchewan. The REIT contributed $56,477 to these joint venture arrangements, inclusive of transaction costs of $1,583, which were expensed during the year ended December 31, 2015.
The REIT also contributed $2,665 during the year ended December 31, 2015 to the Park Lucero I, Park Lucero II, Corridor Park, Hudson's Bay Centre and Centrepoint joint venture arrangements.
The REIT is contingently liable for the obligations of certain joint arrangements. As at December 31, 2015, the co-owners' share of mortgage liabilities is $118,080 (December 31, 2014, $82,376). Management believes that the assets available from its joint arrangements are sufficient for the purpose of satisfying such obligations.
Summarized financial information of the REIT's share in its joint venture arrangements is as follows:
December 31, 2015
December 31, 2014
Non-current assets:
Investment properties $ 246,144 $ 87,746
Investment properties under development 61,465 72,262
Current assets:
Prepaid expenses and other assets 351 230
Accounts receivable and other receivables 1,069 620
Cash held in trust — 1,337
Cash and cash equivalents 4,995 3,025
314,024 165,220
Non-current liabilities:
Mortgages and loans payable 112,535 46,487
Current liabilities:
Mortgages and loans payable 19,663 15,116
Security deposits and prepaid rent 1,424 497
Accounts payable and other liabilities 7,336 5,048
140,958 67,148
Investments in joint ventures $ 173,066 $ 98,072

CONSOLIDATED FINANCIAL STATEMENTS(In thousands of Canadian dollars, unless otherwise noted)
ARTIS REAL ESTATE INVESTMENT TRUST 63 2015 FINANCIAL REPORT
Year endedDecember 31,
2015 2014
Revenue $ 16,928 $ 8,081
Expenses:
Property operating 4,916 2,715
Realty taxes 2,456 832
7,372 3,547
Net operating income 9,556 4,534
Other income (expenses):
Interest expense (2,982) (1,166)
Interest income 2 —
Fair value loss on investment properties (6,279) (7,355)
Net income (loss) from investments in joint ventures $ 297 $ (3,987)
Note 23. Segmented information
The REIT owns and operates various properties located in Canada and the U.S. These properties are managed by and reported internally on the basis of geographical regions. In the current year due to the growth in joint venture investments and on the basis of results reviewed by the Chief Operating Decision Maker, segmented information has been reflected where joint ventures have been presented using the proportionate share method. Prior period figures have been adjusted to conform to the current year’s method of presentation. Western Canada includes British Columbia and Alberta; Central Canada includes Saskatchewan and Manitoba; and Eastern Canada includes Ontario. REIT expenses, as well as interest relating to debentures, have not been allocated to the segments.
Year ended December 31, 2015
Western Canada Central Canada Eastern Canada U.S. REITJoint venture
adjustment Total
Revenue $ 227,113 $ 106,863 $ 60,977 $ 157,373 $ 176 $ (16,928) $ 535,574
Expenses:
Property operating 47,541 27,911 15,333 34,319 — (4,916) 120,188
Realty taxes 31,120 15,335 10,502 28,489 — (2,456) 82,990
78,661 43,246 25,835 62,808 — (7,372) 203,178
Net operating income 148,452 63,617 35,142 94,565 176 (9,556) 332,396
Other income (expenses):
Corporate expenses — — — — (11,510) — (11,510)
Interest expense (37,804) (16,600) (11,123) (25,114) (22,823) 2,982 (110,482)
Interest income 1,094 37 37 45 108 (2) 1,319
Net income from investments in jointventures — — — — — 297 297
Fair value (loss) gain on investmentproperties (370,570) (1,049) (2,316) 2,030 — 6,279 (365,626)
Foreign currency translation loss — — — — (16,413) — (16,413)
Transaction costs (1,103) (157) — (876) — — (2,136)
Loss on financial instruments — — — — (3,544) — (3,544)
Net (loss) income $ (259,931) $ 45,848 $ 21,740 $ 70,650 $ (54,006) $ — $ (175,699)
Acquisition of investment properties $ 54,772 $ 19,262 $ — $ 129,754 $ — $ (98,766) $ 105,022
Additions to investment properties andinvestment properties underdevelopment 14,945 25,784 8,352 31,540 — (22,559) 58,062
Additions to tenant inducements 14,276 4,759 3,008 10,931 — (1,951) 31,023
Additions to leasing commissions 4,539 2,650 1,529 5,837 — (597) 13,958
December 31, 2015
Western Canada Central Canada Eastern Canada U.S. REITJoint venture
adjustment Total
Total assets $ 2,124,465 $ 1,075,915 $ 607,600 $ 1,802,299 $ 41,001 $ (140,958) $ 5,510,322
Total liabilities 913,406 393,655 256,991 852,604 666,863 (140,958) 2,942,561

CONSOLIDATED FINANCIAL STATEMENTS(In thousands of Canadian dollars, unless otherwise noted)
2015 FINANCIAL REPORT 64 ARTIS REAL ESTATE INVESTMENT TRUST
Year ended December 31, 2014
Western Canada Central Canada Eastern Canada U.S. REITJoint venture
adjustment Total
Revenue $ 220,736 $ 97,791 $ 62,657 $ 127,201 $ 254 $ (8,081) $ 500,558
Expenses:
Property operating 45,181 27,158 14,796 28,577 — (2,715) 112,997
Realty taxes 28,496 14,607 9,958 22,484 — (832) 74,713
73,677 41,765 24,754 51,061 — (3,547) 187,710
Net operating income 147,059 56,026 37,903 76,140 254 (4,534) 312,848
Other income (expenses):
Corporate expenses — — — — (10,261) — (10,261)
Interest expense (43,063) (17,564) (12,043) (21,535) (15,507) 1,166 (108,546)
Interest income 1,237 49 36 55 441 — 1,818
Net loss from investments in joint ventures — — — — — (3,987) (3,987)
Fair value gain (loss) on investmentproperties 5,423 13,192 (7,535) 20,396 — 7,355 38,831
Foreign currency translation loss — — — — (21,890) — (21,890)
Transaction costs (311) (564) — (1,615) — — (2,490)
Loss on financial instruments — — — — (8,437) — (8,437)
Net income (loss) $ 110,345 $ 51,139 $ 18,361 $ 73,441 $ (55,400) $ — $ 197,886
Acquisitions of investment properties $ 47,935 $ 22,525 $ — $ 193,115 $ — $ (61,987) $ 201,588
Additions to investment properties andinvestment properties underdevelopment 12,554 31,236 2,997 14,913 — (19,000) 42,700
Additions to tenant inducements 10,846 2,695 530 6,775 — (1,108) 19,738
Additions to leasing commissions 3,171 964 2,449 3,233 — (431) 9,386
December 31, 2014
Western Canada Central Canada Eastern Canada U.S. REITJoint venture
adjustment Total
Total assets $ 2,479,177 $ 1,033,901 $ 596,876 $ 1,409,116 $ 26,930 $ (67,148) $ 5,478,852
Total liabilities 1,045,129 401,746 282,158 673,186 414,776 (67,148) 2,749,847
Note 24.Commitments, contingencies and guarantees
(a) Letters of credit:
As of December 31, 2015, the REIT had issued letters of credit in the amount of $844 (December 31, 2014, $821).
(b) Contingencies:
The REIT performs an assessment of legal and tax proceedings and claims which have occurred or could occur as a result of ongoing operations of the trust. Based on the information available, the outcomes of these contingent liabilities are uncertain and do not satisfy the requirements to be recognized in the consolidated financial statements as liabilities.
(c) Guarantees:
AX L.P. has guaranteed certain debt assumed by purchasers in connection with the disposition of two properties. These guarantees will remain until the debt is modified, refinanced or extinguished. Credit risk arises in the event that the purchasers default on repayment of their debt since it is guaranteed by the REIT. This credit risk is mitigated as the REIT has recourse under these guarantees in the event of default by the purchasers, in which case the REIT would have a claim against the underlying properties. The estimated amount of debt subject to the guarantees at December 31, 2015 is $9,337 (December 31, 2014, $5,262), with an estimated weighted-average remaining term of 1.3 years (December 31, 2014, 2.9 years). No liabilities in excess of the fair value of the guarantees has been recognized in these consolidated financial statements as the estimated fair value of the borrowers' interests in the underlying properties is greater than the mortgages payable for which the REIT provided the guarantees.
Note 25. Capital management
The REIT's objectives when managing capital are to safeguard the ability to continue as a going concern, and to generate sufficient returns to provide unitholders with stable cash distributions. The REIT defines capital as mortgages and loans payable, senior unsecured debentures, convertible debentures, bank indebtedness and unitholders' equity.
The REIT's Declaration of Trust permits the REIT to incur indebtedness, provided that after giving effect to incurring or assuming any indebtedness (as defined in the Declaration of Trust), the amount of such indebtedness of the REIT is not more than 70% of the gross book value of the REIT's total assets. Gross book value as defined in the Declaration of Trust includes the consolidated book value of the assets of the REIT, plus the amount of accumulated depreciation and amortization recorded in the books and records of the REIT, plus the amount of any deferred tax liability arising out of any indirect acquisitions, calculated in accordance with generally accepted accounting principles. As at December 31, 2015, the ratio of such indebtedness to gross book value was 47.6% (December 31, 2014, 44.9%), which complies with the requirement in the Declaration of Trust and is consistent with the REIT's objectives.

CONSOLIDATED FINANCIAL STATEMENTS(In thousands of Canadian dollars, unless otherwise noted)
ARTIS REAL ESTATE INVESTMENT TRUST 65 2015 FINANCIAL REPORT
The total managed capital for the REIT is summarized below:
NoteDecember 31,
2015December 31,
2014
Mortgages and loans payable 9 $ 2,198,319 $ 2,262,054
Senior unsecured debentures 10 199,631 199,527
Convertible debentures 11 209,140 189,573
Bank indebtedness 13 225,000 300
Total debt 2,832,090 2,651,454
Unitholders' equity 2,567,761 2,729,005
$ 5,399,851 $ 5,380,459
Note 26. Risk management and fair values
(a) Risk management:
In the normal course of business, the REIT is exposed to a number of risks that can affect its operating performance. The most significant of these risks, and the actions taken to manage them, are as follows:
(i) Market risk:
(a) Interest rate risk:
The REIT is exposed to interest rate risk on its borrowings. It minimizes the risk by restricting debt to 70% of the gross book value of the REIT's total assets and by monitoring the amount of variable rate debt. The REIT has the majority of its mortgage payable and debentures in fixed rate terms. In addition, management considers the weighted-average term to maturity of long-term debt relative to the remaining average lease terms. At December 31, 2015, the REIT is a party to $905,819 of variable rate debt, including bank indebtedness (December 31, 2014, $637,842). At December 31, 2015, the REIT had entered into interest rate swaps to hedge the interest rate risk associated with $367,889 of variable rate debt (December 31, 2014, $394,960).
The following table outlines the impact on interest expense of a 100 basis point increase or decrease in interest rates on the REIT's variable rate debt and fixed rate debt maturing within one year:
Impact on interest expense
Variable rate debt $ 4,299
Fixed rate debt due within one year 3,488
$ 7,787
(b) Foreign currency risk:
The REIT owns properties located in the U.S., and therefore, the REIT is subject to foreign currency fluctuations that may impact its financial position and results. In order to mitigate this risk, the REIT's debt on U.S. properties as well as the Series G convertible debentures are held in US dollars to act as a natural hedge. The REIT's Series C Units are also denominated in US dollars.
A $0.10 weakening in the US dollar against the average Canadian dollar exchange rate of 1.2835 for the year ended December 31, 2015, and the year end exchange rate of 1.3840 at December 31, 2015 would have increased net income by approximately $3,204 for the year ended December 31, 2015. A $0.10 weakening in the US dollar against the Canadian dollar would have decreased other comprehensive income by approximately $64,845 for the year ended December 31, 2015. Conversely, a $0.10 strengthening in the US dollar against the Canadian dollar would have had an equal but opposite effect. This analysis assumes that all variables, in particular interest rates, remain constant.
(c) Other price risk:
The REIT periodically enters into derivative transactions in regards to non-financial items, primarily natural gas and electrical contracts, to manage the price risk arising from fluctuations in these commodities.
(ii) Credit risk:
The REIT's maximum exposure to credit risk is equivalent to the carrying value of each class of financial asset as separately presented in cash and cash equivalents, cash held in trust, accounts receivable and other receivables, deposits on investment properties and notes receivable.
The REIT is exposed to credit risk as an owner of real estate in that tenants may become unable to pay the contracted rents. Management mitigates this risk by carrying out appropriate credit checks and related due diligence on the significant tenants. The REIT's properties are diversified across the industrial, retail and office asset classes, and geographically diversified with properties owned across five Canadian provinces and five U.S. states. Included in property operating expenses is an impairment loss on accounts receivable and other receivables of $1,008 during the year ended December 31, 2015 (2014, $861). The credit quality of the accounts receivable and other receivables amount is considered adequate.

CONSOLIDATED FINANCIAL STATEMENTS(In thousands of Canadian dollars, unless otherwise noted)
2015 FINANCIAL REPORT 66 ARTIS REAL ESTATE INVESTMENT TRUST
December 31, 2015
December 31,2014
Past due 0 - 30 days $ 4,877 $ 2,964
Past due 31 - 90 days 413 424
Past due more than 91 days 1,223 1,684
6,513 5,072
Allowance for doubtful accounts (630) (627)
$ 5,883 $ 4,445
The REIT is also exposed to credit risk as a holder of notes receivable. Management mitigates this risk by carrying out credit checks and related due diligence on the borrowers.
(iii) Liquidity risk:
Liquidity risk is the risk that the REIT will not be able to meet its financial obligations as they come due. The REIT manages liquidity by maintaining adequate cash and by having appropriate lines of credit available. In addition, the REIT continuously monitors and reviews both actual and forecasted cash flows.
The following are the estimated maturities of the REIT's financial liabilities at December 31, 2015 including bank indebtedness, accounts payable and other liabilities, convertible debentures, senior unsecured debentures and mortgages and loans payable. All debentures are disclosed at their face value.
Total Less than 1 year 1 - 3 years 4 - 5 years After 5 years
Bank indebtedness $ 225,000 $ 225,000 $ — $ — $ —
Accounts payable and other liabilities (1) 82,848 82,848 — — —
Convertible debentures 207,962 — 121,792 86,170 —
Senior unsecured debentures 200,000 — — 200,000 —
Mortgages and loans payable (1) 2,329,547 498,949 796,702 419,028 614,868
$ 3,045,357 $ 806,797 $ 918,494 $ 705,198 $ 614,868
(1) This includes balances included in the REIT's investments in joint ventures.
(b) Fair values:
The REIT uses a three-level hierarchy that reflects the significance of the inputs used in making fair value measurements of its financial instruments and its investment properties. Level 1 of the fair value hierarchy uses quoted market prices in active markets for identical assets or liabilities to determine the fair value of assets and liabilities. Level 2 includes valuations using inputs other than quoted prices that are observable for the asset or liability, either directly or indirectly. Level 3 valuations are based on inputs for the asset or liability that are not based on observable market data.
There were no transfers of assets or liabilities between hierarchy levels during the years ended December 31, 2015 and 2014.
December 31, 2015 December 31, 2014
Fair valuehierarchy Carrying value Fair value Carrying value Fair value
Assets:
Investment properties Level 3 $ 5,078,021 $ 5,078,021 $ 5,201,489 $ 5,201,489
Investment properties under development Level 3 26,892 26,892 81,682 81,682
Notes receivable Level 2 18,520 20,236 20,748 22,277
Investment properties held for sale Level 3 115,504 115,504 — —
Mortgage interest rate swaps Level 2 — — 172 172
5,238,937 5,240,653 5,304,091 5,305,620
Liabilities:
Mortgages and loans payable Level 2 2,198,319 2,255,055 2,262,054 2,312,929
Senior unsecured debentures Level 2 199,631 206,783 199,527 202,750
Convertible debentures Level 1 209,140 208,817 189,573 193,827
Mortgage interest rate swaps Level 2 10,811 10,811 6,852 6,852
2,617,901 2,681,466 2,658,006 2,716,358
$ 2,621,036 $ 2,559,187 $ 2,646,085 $ 2,589,262
The fair value of the REIT's accounts receivable and other receivables, cash held in trust, cash and cash equivalents, accounts payable and other liabilities and bank indebtedness approximate their carrying amounts due to the relatively short periods to maturity of these financial instruments.
The fair values of notes receivable, mortgage interest rate swaps, mortgages and loans payable and senior unsecured debentures have been determined by discounting the cash flows of these financial instruments using period end market rates for instruments of similar terms and credit risks.

CONSOLIDATED FINANCIAL STATEMENTS(In thousands of Canadian dollars, unless otherwise noted)
ARTIS REAL ESTATE INVESTMENT TRUST 67 2015 FINANCIAL REPORT
The fair value of the convertible debentures is based on the market price of the debentures.
The REIT entered into interest rate swaps on a number of mortgages. The swaps are not designated in a hedge relationship. An unrealized loss of $3,544 was recorded for the year ended December 31, 2015 (2014, loss of $8,558) in relation to the fair value of these interest rate swaps.
Note 27. Subsequent events
The following events occurred subsequent to December 31, 2015:
• The REIT financed two previously unencumbered retail properties and one previously unencumbered office property, receiving mortgage proceeds of $37,800. These mortgages bear interest at a weighted-average interest rate of 2.81% and have a weighted-average term to maturity of 3.2 years.
• The REIT converted $168,500 drawn on its revolving term credit facility to US dollars and applied a cross-currency interest rate swap to this balance to reduce the effective interest rate.
• The REIT repaid $25,000 on its revolving term credit facility.
• The REIT declared a monthly cash distribution of $0.09 per unit for the months of January and February 2016.
• The REIT declared a quarterly cash distribution of $0.3125 per Series G preferred unit for the quarter ending January 31, 2016.
Note 28. Comparative figures
Certain 2014 comparative figures have been reclassified to conform with the financial statement presentation adopted in 2015.
Note 29. Approval of financial statements
The consolidated financial statements were approved by the Board of Trustees and authorized for issue on February 29, 2016.