Embed Size (px)
Citation preview
ARTICLEdoi:10.1038/nature14561
Competitive binding of antagonisticpeptides fine-tunes stomatal patterningJin Suk Lee1,2, Marketa Hnilova3, Michal Maes2, Ya-Chen Lisa Lin1,2, Aarthi Putarjunan2, Soon-Ki Han1,2,Julian Avila1,2 & Keiko U. Torii1,2
During development, cells interpret complex and often conflicting signals to make optimal decisions. Plant stomata, thecellular interface between a plant and the atmosphere, develop according to positional cues, which include a family ofsecreted peptides called epidermal patterning factors (EPFs). How these signalling peptides orchestrate patternformation at a molecular level remains unclear. Here we report in Arabidopsis that Stomagen (also called EPF-LIKE9)peptide, which promotes stomatal development, requires ERECTA (ER)-family receptor kinases and interferes with theinhibition of stomatal development by the EPIDERMAL PATTERNING FACTOR 2 (EPF2)–ER module. Both EPF2 andStomagen directly bind to ER and its co-receptor TOO MANY MOUTHS. Stomagen peptide competitively replaced EPF2binding to ER. Furthermore, application of EPF2, but not Stomagen, elicited rapid phosphorylation of downstreamsignalling components in vivo. Our findings demonstrate how a plant receptor agonist and antagonist defineinhibitory and inductive cues to fine-tune tissue patterning on the plant epidermis.
Development and pattern formation of multicellular organisms rely ondiffusible signals that instruct cells to adopt a specific fate for optimalfunction, and hence organismal fitness. Often such signals are encodedby multiple gene families, which raises the question of how a given cellorchestrates the decision-making process. For instance, a family ofsecreted signals, such as FGFs, are used in an iterative manner tospecify multiple, diverse developmental processes in animals1. Whilepeptide signalling has recently emerged as a critical regulator of plantdevelopment2, how specific members of plant peptide families shareand distribute functions remains unclear. Patterning of stomata—valves on the plant epidermis that mediate carbon dioxide acquisitionand water control—relies on cell–cell communication, which specifiesa subset of seemingly uniform protodermal cells to acquire stomatalprogenitor fate. Two secreted cysteine-rich peptides, EPF1 and EPF2,are expressed in later and earlier stages of stomatal precursors, respect-ively, and are perceived by the cell-surface receptors, ER-familyleucine-rich repeat receptor kinases (LRR-RKs)—ER, ER-LIKE1(ERL1) and ERL2—to inhibit stomatal development3–7. The recep-tor-like protein TOO MANY MOUTHS (TMM) modulates the sig-nalling strengths of ER-family receptor kinases in a region-specificmanner6,8. Genetic evidence suggests that the signals are mediatedvia a mitogen-activated protein kinase (MAPK) cascade, which even-tually downregulates the transcription factor responsible for initiatingstomatal lineage via direct phosphorylation9–12.
Recently, EPF-LIKE9 (EPFL9) peptide, also known as Stomagen, wasidentified as a positive regulator of stomatal development, a role oppos-ite to EPF1 and EPF2 (refs 13–17). Structural modelling of the EPF/EPFL-family peptides using the NMR-solved structure of Stomagenpredicts that they all adopt related structures16. This raises the questionof how can structurally related peptides confer completely oppositedevelopmental responses. The molecular mechanism for Stomagenaction remains unknown.
Stomagen acts downstream of the ER familyTo place Stomagen into a genetic framework of the core stomatal sig-nalling pathway, we first examined the effects of induced STOMAGEN
overexpression (iSTOMAGEN) on er erl1 erl2 triple mutant phenotypesby an oestradiol-induction system or co-suppression by artificialmicroRNA (STOMAGEN-ami) (Fig. 1 and Extended Data Figs 1–4).As previously reported13,14, ectopic iSTOMAGEN expression resulted inan increase in stomatal density (number of stomata per mm2), stomatalindex (percentage of stomata per total number of stomatal and non-stomatal epidermal cells) and severe stomatal clustering in wild-typecotyledon epidermis (Fig. 1a, b, k and Extended Data Figs 1–3). Incontrast, iSTOMAGEN had no effect on stomatal density, stomatalindex, or stomatal clusters in er erl1 erl2 cotyledons, just like in tmm(Fig. 1 and Extended Data Fig. 3)13,14, suggesting that STOMAGEN andthe ER family act in the same pathway.
As reported, STOMAGEN-ami lines markedly reduced stomataldevelopment in wild-type cotyledons (Fig. 1a, c, j and ExtendedData Fig. 4)13. In contrast, STOMAGEN-ami had no effect on stomataldensity, stomatal index, and stomatal clustering phenotype of ererl1 erl2 cotyledons, just like tmm (Fig. 1 and Extended Data Fig. 4).Thus, ER-family receptor kinases are required for the hypermorphicand hypomorphic effects of Stomagen. The epistasis of er erl1 erl2stomatal cluster phenotype over the phenotype of STOMAGEN-amiplaces the ER family downstream of STOMAGEN, consistent with themolecular identity of their gene products as receptor kinases and asecreted peptide.
Genetic dissection of Stomagen actionTo dissect the role of Stomagen on the TMM and ER module, wecomprehensively investigated the effects of iSTOMAGEN on stomataldifferentiation in tmm hypocotyls with additional er-family muta-tions (Fig. 2 and Extended Data Fig. 5). In hypocotyls, TMM andER family have opposite functions: tmm hypocotyls lack stomata18,whereas er erl1 erl2 hypocotyls produce stomatal clusters19. Whiletmm is epistatic to er single mutation in hypocotyls, consecutiveloss of ER-family genes reverts stomatal development in a dosage-dependent manner, with er erl1 erl2 being epistatic to tmm (ref. 7).iSTOMAGEN does not confer stomatal differentiation in tmm
1Howard Hughes Medical Institute, University of Washington, Seattle, Washington 98195, USA. 2Department of Biology, University of Washington, Seattle, Washington 98195, USA. 3Department ofMaterials Science and Engineering, University of Washington, Seattle, Washington 98195, USA.
0 0 M O N T H 2 0 1 5 | V O L 0 0 0 | N A T U R E | 1
G2015 Macmillan Publishers Limited. All rights reserved
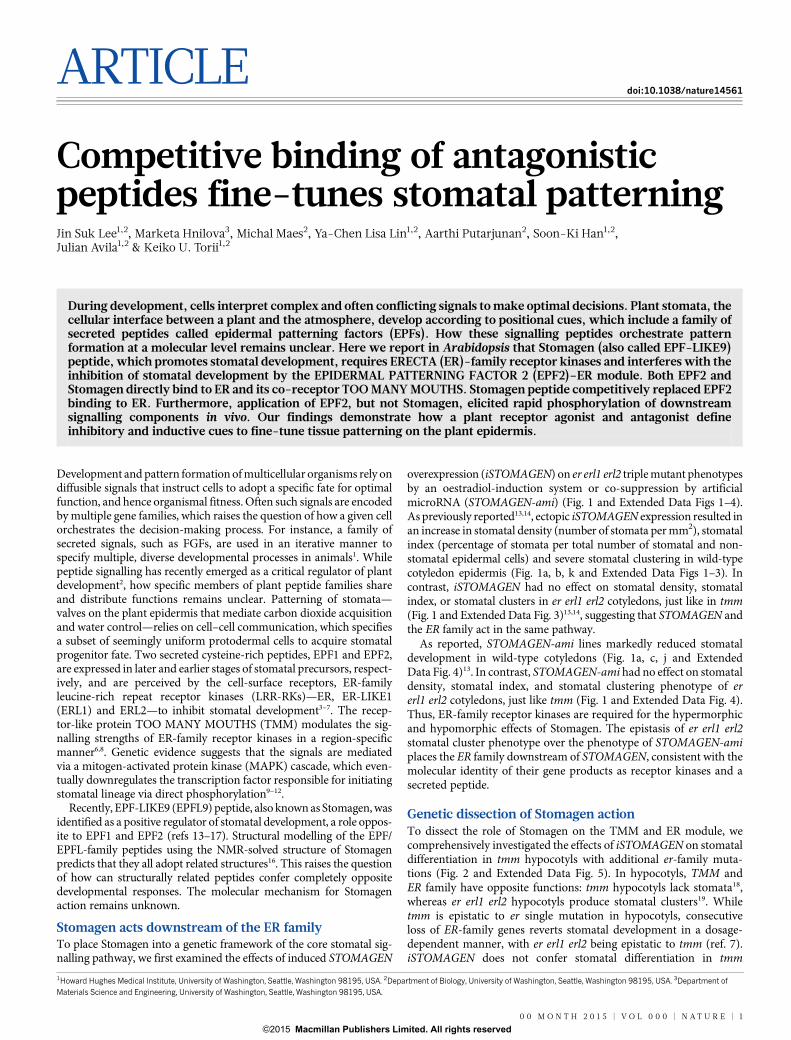
hypocotyls13. However, in some instances arrested stomatal precursorcells (stomatal-lineage ground cells (SLGCs)) were observed, indi-cating that, in the absence of TMM, iSTOMAGEN could initiatestomatal development in hypocotyls (Fig. 2a, b and Extended DataFig. 5c, d). Additional er-family mutations exaggerated this effect; thatis, iSTOMAGEN in tmm er and tmm erl2 hypocotyls, both of whichlack stomata, resulted in SLGC clusters (Fig. 2c, d and Extended DataFig. 5e–h). iSTOMAGEN triggered stomatal cluster formation in tmmerl1, tmm erl1 erl2 and tmm er erl1 mutant hypocotyls, while intensi-fying stomatal entry divisions in tmm er erl2 hypocotyls (Fig. 2e, f andExtended Data Fig. 5i–p). Different effects of iSTOMAGEN on thehigher-order mutants lacking ER (for example, tmm er and tmm ererl2) compared with those lacking ERL1 (for example, tmm erl1 andtmm erl1 erl2) reflect the overlapping yet unique roles of ER and ERL1
in stomatal development6. Finally, iSTOMAGEN failed to enhance thesevere stomatal clustering phenotype in tmm er erl1 erl2 mutants(Fig. 2g, h and Extended Data Fig. 5q, r). Quantitative analysis ofstomatal index and SLGC index (the percentage of SLGCs in totalepidermal cells) supports these findings (Extended Data Fig. 5s, t).Together, the results suggest that in the hypocotyls, where TMM andER-family act antagonistically, Stomagen primarily acts via all threeER-family receptor kinases.
Among the ER family, ER primarily perceives EPF2 to restrictinitiation of stomatal cell lineages, while ERL1 primarily perceivesEPF1 to orient stomatal spacing and prevent guard cell differenti-ation6. As such, epf2 increases SLGCs, whereas epf1 violates stomatalspacing3–5. Neither epf2 nor epf1 confers severe stomatal clusteringphenotype like iSTOMAGEN, since only a subset of ER-family-mediated pathways has been compromised6. We delineated the roleof Stomagen in each of these steps. We first examined whether EPF1,EPF2 and STOMAGEN transcripts are under feedback regulation,which may complicate the genetic analyses. EPF1 and EPF2 transcriptlevels were slightly upregulated by iSTOMAGEN, and conversely,slightly downregulated by STOMAGEN-ami (Extended Data Fig.2c, d). However, the endogenous STOMAGEN transcript levels areunaffected by epf1, epf2, or epf1 epf2 (Extended Data Fig. 2d). Thus,altered expression of EPF1 and EPF2 by STOMAGEN misregulationprobably reflects the numbers of stomatal-lineage cells13,14.
EPF2–ER or EPF1–ERL1 signalling pathways with iSTOMAGENresulted in severe stomatal clusters, indicating that excessiveStomagen promotes stomatal differentiation when either pathway iscompromised (Extended Data Fig. 3). These genetic data supportthe notion that Stomagen, when ectopically overexpressed, canbind to all ER-family receptor kinases and inhibit signal transduc-tion. Indeed, co-immunoprecipitation experiments using Nicotianabenthamiana microsomal fraction expressing green fluorescent pro-tein (GFP)-fused ectodomains of ER, ERL1, ERL2 or TMM incubated
iSTOMAGENer erl1 erl2
iSTOMAGENtmm
iSTOMAGEN
er erl1 erl2
STOMAGEN-ami
tmmSTOMAGEN-ami
STOMAGEN-ami
WT
er erl1 erl2
tmm
a b
d e
g h i
c
f
j
30
50
70
90
k
Sto
mata
l in
dex (%
)
20
40
60
80
***
NS
NS
Sto
mata
l in
dex (%
)
WT WTtmm er erl1 erl2
– – –– ami ami ami iSTOM – iSTOM – iSTOM
***NS
NS
tmm er erl1 erl2
Figure 1 | Complete loss of ER-family genes confers insensitivity toSTOMAGEN overexpression and co-suppression. a–i, Representativeconfocal images of cotyledon abaxial epidermis from 10-day-old light-grownseedlings of wild type (a–c), tmm (d–f) and er erl1 erl2 (g–i), with inducedSTOMAGEN overexpression (iSTOMAGEN; b, e, h) or STOMAGEN-amiconstruct (c, f, i). Uninduced controls show no effects (see Extended DataFigs 1–3). Images were taken under the same magnification. Scale bar, 30 mm.n 5 13 (a); n 5 18 (b); n 5 26 (c); n 5 16 (d); n 5 24 (e); n 5 26 (f); n 5 16(g); n 5 24 (h); n 5 12 (i). j, Stomatal index. 2, control; ami, STOMAGEN-ami.Box, mean; bars, s.e.m. ***P , 0.005 (Wilcoxon rank sum test). NS, notsignificant (P 5 0.653 for tmm; P 5 0.539 for er erl1 erl2). n 5 8 for eachgenotype. k, Stomatal index. 2, uninduced; iSTOM, induced. Box, mean; bars,s.e.m. ***P , 0.005 (Wilcoxon rank sum test). NS, not significant (P 5 0.114for tmm; P 5 0.688 for er erl1 erl2). No induction, n 5 16; iSTOM, n 5 14;tmm no induction, tmm iSTOM, er erl1 erl2, er erl1 erl2 iSTOM, n 5 15 foreach genotype. For the total numbers of stomata counted, see legends forExtended Data Figs 3 and 4.
tmm erl1 erl2iSTOMAGEN
tmm erl1 erl2
d
tmm eriSTOMAGEN
c
tmm er
fe
tmm tmm iSTOMAGEN
a b
tmm er erl1 erl2 tmm er erl1 erl2iSTOMAGEN
hg
No induction No induction
No induction No induction
Figure 2 | STOMAGEN overexpression on stomatal development in tmmhypocotyl epidermis with combinatorial loss-of-function in ER-familygenes. a–h, Representative confocal microscopy images of hypocotylepidermis from 10-day-old light-grown transgenic Est::STOMAGEN(oestradiol-induced STOMAGEN) seedlings of tmm (a, b); tmm er (c, d); tmmerl1 erl2 (e, f); and tmm er erl1 erl2 (g, h). A control, uninduced phenotype(a, c, e, g) and iSTOMAGEN phenotype (b, d, f, h) is shown. iSTOMAGENresults in arrested stomatal precursor cells (asterisk) and stomatal-lineageground cells (SLGCs (bracket)) in tmm hypocotyls (b). Additional er mutationexaggerated this effect (d), while additional erl1 erl2 mutations increasedstomata (f). Images were taken under the same magnification. Scale bar, 30 mm.n 5 20 (a); n 5 20 (b); n 5 19 (c); n 5 22 (d); n 5 17 (e); n 5 20 (f); n 5 20(g), n 5 20 (h). For a complete set of higher-order mutant phenotypes andquantitative data, see Extended Data Fig. 5.
2 | N A T U R E | V O L 0 0 0 | 0 0 M O N T H 2 0 1 5
RESEARCH ARTICLE
G2015 Macmillan Publishers Limited. All rights reserved
with synthetic Stomagen peptides demonstrated that Stomagenassociates with all ER-family receptor kinases and TMM (ExtendedData Fig. 6a).
Unlike overexpression, Stomagen co-suppression imposed differ-ent effects on EPF2–ER and EPF1–ERL1 signalling pathways.STOMAGEN-ami suppressed the stomatal-pairing phenotype ofepf1 and dominant-negative, kinases-deleted ERL1 (ERL1(DK)) erl1(Extended Data Fig. 4g–j, m). In contrast, STOMAGEN-ami exhibitedcomplex interactions with epf2 and dominant-negative ER (ER(DK))er, reducing numbers of stomata but not that of SLGCs (ExtendedData Fig. 4c–f, k–n). This supports the idea that Stomagen counteractsEPF2 for ER-mediated stomatal initiation13,14,16. This also suggeststhat, in the absence of both EPF2 and STOMAGEN, the default ERpathway is not activated while the later ERL-mediated pathwayremains capable of repressing the differentiation of mature stomata.
Competitive binding of EPF2 and StomagenA series of genetic analyses leads to the possibility that Stomagenantagonizes EPF2’s action via direct binding to ER. To address this,we produced bioactive Stomagen and predicted mature EPF2(mEPF2) peptides (Extended Data Figs 7 and 8). Subsequently, theirdirect binding to ER as well as to TMM was tested using previously
established quartz crystal microbalance (QCM) biosensor platforms(Fig. 3a, b and Extended Data Fig. 9)6. Briefly, we immobilized puri-fied GFP-fused receptors or control GFP from N. benthamiana ongold surfaces of QCM chips via anti-GFP antibody and then intro-duced the bioactive Stomagen or mEPF2 peptide solutions. Thepeptide–receptor binding was recorded as a function of frequencychange (see Methods)6. Both Stomagen and mEPF2 exhibited sat-urable binding to the ER ectodomain fused to GFP (ER(DK)–GFP)with similar dissociation constants at a nanomolar range (Fig. 3a, band Extended Data Fig. 9). Additionally, Stomagen and mEPF2bound to TMM with high affinity (Fig. 3a, b). No significant bindingof Stomagen or mEPF2 to control GFP was detected (Fig. 3a, b andExtended Data Fig. 9). To address the specificity of peptide–receptorinteractions, two control peptides were subjected to the QCM analysisusing ER(DK)–GFP-functionalized chips: (1) non-folding, inactivemutant Stomagen, in which six cysteines were substituted with serines(Extended Data Fig. 8g)16; and (2) LURE2, an unrelated cysteine-richpeptide, which acts as a pollen-tube attractant20. Neither mutantStomagen nor LURE2 exhibited binding above the background level(Fig. 3c). Consistently, LURE2 did not associate with ER, TMM, or aninnate immunity receptor FLS2 (refs 21, 22) fused with GFP expressedin N. benthamiana in co-immunoprecipitation assays (Extended Data
Stomagen_6C→S
Stomagen
a b c
Blank 0.1 1 10 100
0
0.2
0.4
0.6
0.8
1.0
Bin
din
g (%
of
bla
nk)
IC50 = 454 nM
ER(ΔK)–GFP
ER(ΔK)–GFP
mEPF2–MYC–His
Stomagen
IP: anti-GFP
WB: anti-GFP
IP: anti-GFP
WB: anti-MYC
IP: anti-GFP
WB: anti-Stomagen
Input
WB: anti-GFP
mEPF2
Stomagen 0 0.4 2 7.8 23.4
1 1 1 1 1 (μM)
(μM)
d e
Stomagen (μM)
(μM)(μM)
f
mEPF2Stomagen
0 10 0
10.4
12
15
0
20
40
60
80
100
120
140
160
0 50 100 150 0
20
40
60
80
100
0 20 40 60 80 100
ΔF (H
z)
ΔF (H
z)
Stomagen (nM)
TMM
GFP
ERECTA
ERECTA
TMM
GFP
Kd (nM) Kd (nM)
Kd (nM)
ERECTA ERECTATMM TMM
Stomagen 44 ± 21 33 ± 5 mEPF2 59 ± 11 68 ± 16
0
20
40
60
80
100
0 100 200
Ligand concentration (nM)
LURE2
Stomagen
6C→S
ERECTA
279 ± 60
514 ± 162
LURE2
Stomagen_6C→S
Δf
(Hz)
mEPF2 (nM)
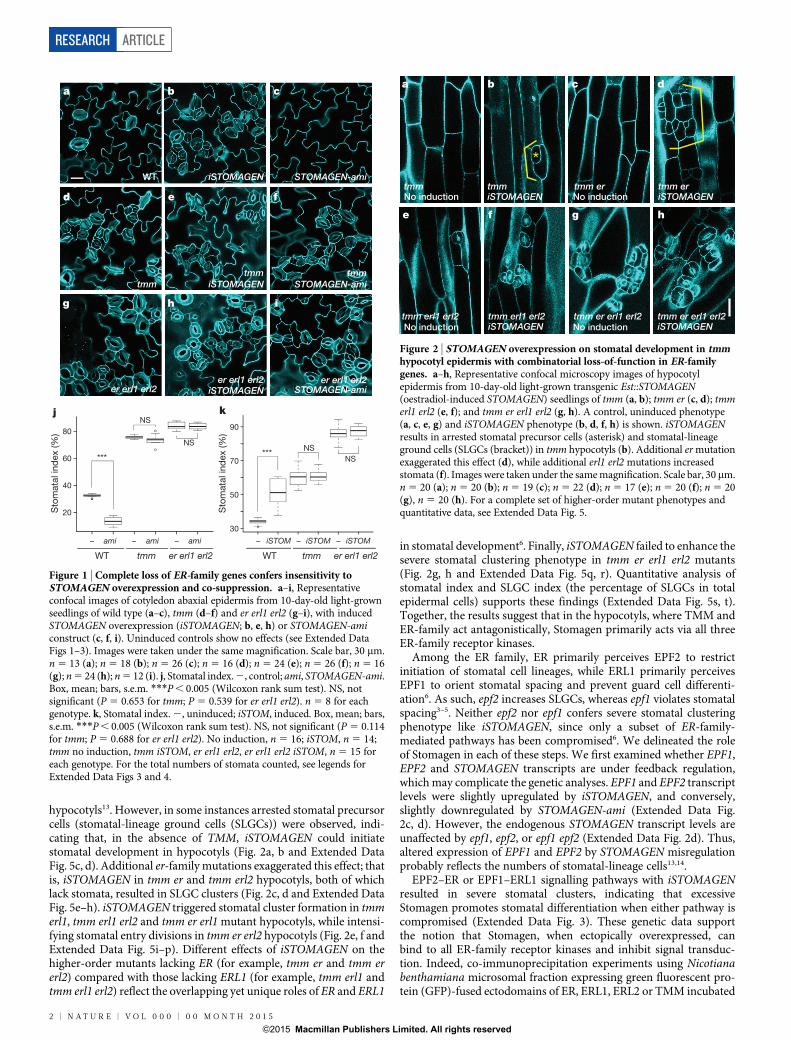
Figure 3 | Direct and competitive binding of Stomagen and EPF2 peptidesto ER. a–c, QCM analysis for direct binding. a, b, The averages of experimentalfrequency shift values recorded from two to four independent experimentsfor Stomagen (a) or mEPF2 (b) onto biosensor chips functionalized withER(DK)–GFP (red), TMM–GFP (blue) and GFP alone (grey) and fitted to theLangmuir adsorption model using least square regression. Error bars indicates.d. Stomagen–ER, n 5 3; Stomagen–TMM, n 5 2; Stomagen–GFP, n 5 3;mEPF2–ER, n 5 2; mEPF2–TMM, n 5 3; mEPF2–GFP, n 5 2. c, The averageexperimental frequency shift values recorded for LURE2 (dark grey) andmutant Stomagen (light grey) on ER(DK)–GFP. To calculate the dissociationconstant (Kd) values, the ligand concentrations were increased to 1 mM toobtain fitted curves. See Extended Data Fig. 9 for raw recording data. Inactivemutant Stomagen, in which six cysteines were substituted with serines(Stomagen_C6RS)–ER, n 5 3; LURE2–ER, n 5 2. Error bars indicate s.d.Right insets: wild-type cotyledon epidermis treated with 2.5 mM mutant or
bioactive Stomagen. Scale bars, 30 mm. n 5 8 for each treatment. For a–c, eachexperimental point in independent binding experiment (referred to as ‘n 5 1’)is generated from multi-point raw data (10–20 points) with average and s.d.values. d, Competitive binding. Microsomal fractions expressing ER(DK)–GFPwere incubated with 1 mM of bioactive mEPF2 with increasing concentrationsof bioactive Stomagen and subjected to immunoprecipitation. The mEPF2–MYC–His blot was re-probed with anti-Stomagen antibody. Asterisk indicatesmost likely isomer. e, Quantitative analysis of competition from fourbiological replicates. Error bars, s.e.m. The IC50 value is substantially higherthan the Kd values for Stomagen–ER or mEPF2–ER, presumably owing to theimmunoblot-based quantification. f, Wild-type cotyledon epidermis treatedwith mEPF2 alone or simultaneously co-treated with mEPF2 and increasingconcentrations of Stomagen for 5 days. n 5 3 for each treatment. Images weretaken under the same magnification. Scale bar, 50 mM.
0 0 M O N T H 2 0 1 5 | V O L 0 0 0 | N A T U R E | 3
ARTICLE RESEARCH
G2015 Macmillan Publishers Limited. All rights reserved
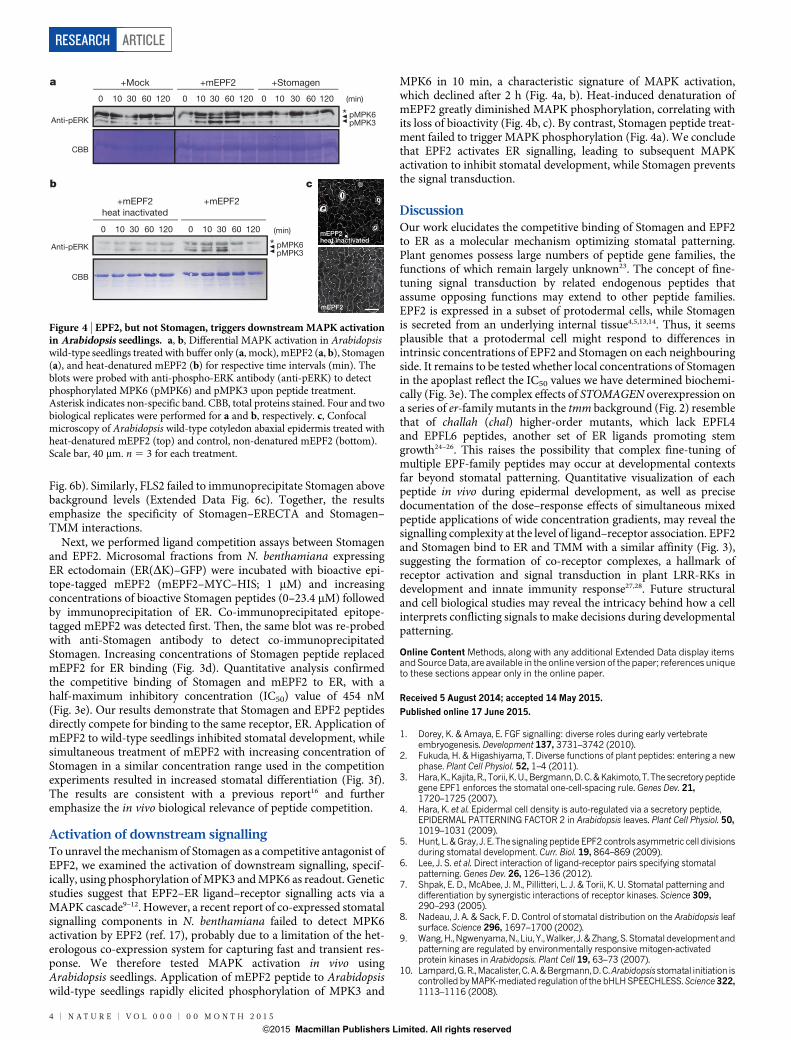
Fig. 6b). Similarly, FLS2 failed to immunoprecipitate Stomagen abovebackground levels (Extended Data Fig. 6c). Together, the resultsemphasize the specificity of Stomagen–ERECTA and Stomagen–TMM interactions.
Next, we performed ligand competition assays between Stomagenand EPF2. Microsomal fractions from N. benthamiana expressingER ectodomain (ER(DK)–GFP) were incubated with bioactive epi-tope-tagged mEPF2 (mEPF2–MYC–HIS; 1 mM) and increasingconcentrations of bioactive Stomagen peptides (0–23.4 mM) followedby immunoprecipitation of ER. Co-immunoprecipitated epitope-tagged mEPF2 was detected first. Then, the same blot was re-probedwith anti-Stomagen antibody to detect co-immunoprecipitatedStomagen. Increasing concentrations of Stomagen peptide replacedmEPF2 for ER binding (Fig. 3d). Quantitative analysis confirmedthe competitive binding of Stomagen and mEPF2 to ER, with ahalf-maximum inhibitory concentration (IC50) value of 454 nM(Fig. 3e). Our results demonstrate that Stomagen and EPF2 peptidesdirectly compete for binding to the same receptor, ER. Application ofmEPF2 to wild-type seedlings inhibited stomatal development, whilesimultaneous treatment of mEPF2 with increasing concentration ofStomagen in a similar concentration range used in the competitionexperiments resulted in increased stomatal differentiation (Fig. 3f).The results are consistent with a previous report16 and furtheremphasize the in vivo biological relevance of peptide competition.
Activation of downstream signallingTo unravel the mechanism of Stomagen as a competitive antagonist ofEPF2, we examined the activation of downstream signalling, specif-ically, using phosphorylation of MPK3 and MPK6 as readout. Geneticstudies suggest that EPF2–ER ligand–receptor signalling acts via aMAPK cascade9–12. However, a recent report of co-expressed stomatalsignalling components in N. benthamiana failed to detect MPK6activation by EPF2 (ref. 17), probably due to a limitation of the het-erologous co-expression system for capturing fast and transient res-ponse. We therefore tested MAPK activation in vivo usingArabidopsis seedlings. Application of mEPF2 peptide to Arabidopsiswild-type seedlings rapidly elicited phosphorylation of MPK3 and
MPK6 in 10 min, a characteristic signature of MAPK activation,which declined after 2 h (Fig. 4a, b). Heat-induced denaturation ofmEPF2 greatly diminished MAPK phosphorylation, correlating withits loss of bioactivity (Fig. 4b, c). By contrast, Stomagen peptide treat-ment failed to trigger MAPK phosphorylation (Fig. 4a). We concludethat EPF2 activates ER signalling, leading to subsequent MAPKactivation to inhibit stomatal development, while Stomagen preventsthe signal transduction.
DiscussionOur work elucidates the competitive binding of Stomagen and EPF2to ER as a molecular mechanism optimizing stomatal patterning.Plant genomes possess large numbers of peptide gene families, thefunctions of which remain largely unknown23. The concept of fine-tuning signal transduction by related endogenous peptides thatassume opposing functions may extend to other peptide families.EPF2 is expressed in a subset of protodermal cells, while Stomagenis secreted from an underlying internal tissue4,5,13,14. Thus, it seemsplausible that a protodermal cell might respond to differences inintrinsic concentrations of EPF2 and Stomagen on each neighbouringside. It remains to be tested whether local concentrations of Stomagenin the apoplast reflect the IC50 values we have determined biochemi-cally (Fig. 3e). The complex effects of STOMAGEN overexpression ona series of er-family mutants in the tmm background (Fig. 2) resemblethat of challah (chal) higher-order mutants, which lack EPFL4and EPFL6 peptides, another set of ER ligands promoting stemgrowth24–26. This raises the possibility that complex fine-tuning ofmultiple EPF-family peptides may occur at developmental contextsfar beyond stomatal patterning. Quantitative visualization of eachpeptide in vivo during epidermal development, as well as precisedocumentation of the dose–response effects of simultaneous mixedpeptide applications of wide concentration gradients, may reveal thesignalling complexity at the level of ligand–receptor association. EPF2and Stomagen bind to ER and TMM with a similar affinity (Fig. 3),suggesting the formation of co-receptor complexes, a hallmark ofreceptor activation and signal transduction in plant LRR-RKs indevelopment and innate immunity response27,28. Future structuraland cell biological studies may reveal the intricacy behind how a cellinterprets conflicting signals to make decisions during developmentalpatterning.
Online Content Methods, along with any additional Extended Data display itemsandSourceData, are available in the online version of the paper; references uniqueto these sections appear only in the online paper.
Received 5 August 2014; accepted 14 May 2015.
Published online 17 June 2015.
1. Dorey, K. & Amaya, E. FGF signalling: diverse roles during early vertebrateembryogenesis. Development 137, 3731–3742 (2010).
2. Fukuda, H. & Higashiyama, T. Diverse functions of plant peptides: entering a newphase. Plant Cell Physiol. 52, 1–4 (2011).
3. Hara, K., Kajita, R., Torii, K.U., Bergmann, D.C.& Kakimoto, T. The secretory peptidegene EPF1 enforces the stomatal one-cell-spacing rule. Genes Dev. 21,1720–1725 (2007).
4. Hara, K. et al. Epidermal cell density is auto-regulated via a secretory peptide,EPIDERMAL PATTERNING FACTOR 2 in Arabidopsis leaves. Plant Cell Physiol. 50,1019–1031 (2009).
5. Hunt, L. & Gray, J. E. The signaling peptide EPF2 controls asymmetric cell divisionsduring stomatal development. Curr. Biol. 19, 864–869 (2009).
6. Lee, J. S. et al. Direct interaction of ligand-receptor pairs specifying stomatalpatterning. Genes Dev. 26, 126–136 (2012).
7. Shpak, E. D., McAbee, J. M., Pillitteri, L. J. & Torii, K. U. Stomatal patterning anddifferentiation by synergistic interactions of receptor kinases. Science 309,290–293 (2005).
8. Nadeau, J. A. & Sack, F. D. Control of stomatal distribution on the Arabidopsis leafsurface. Science 296, 1697–1700 (2002).
9. Wang, H., Ngwenyama, N., Liu, Y.,Walker, J. & Zhang, S. Stomatal development andpatterning are regulated by environmentally responsive mitogen-activatedprotein kinases in Arabidopsis. Plant Cell 19, 63–73 (2007).
10. Lampard,G.R., Macalister,C. A.& Bergmann,D.C.Arabidopsis stomatal initiation iscontrolled by MAPK-mediated regulation of the bHLH SPEECHLESS. Science 322,1113–1116 (2008).
CBB
pMPK6pMPK3
+mEPF2 +Stomagen
(min)0 10 30 60 120
0 10 30 60 120 0 10 30 60 120
0 10 30 60 120 0 10 30 60 120
+Mock
Anti-pERK
CBB
Anti-pERK
a
+mEPF2+mEPF2
heat inactivated
pMPK6pMPK3
(min)
b
mEPF2
mEPF2 heat inactivated
c
Figure 4 | EPF2, but not Stomagen, triggers downstream MAPK activationin Arabidopsis seedlings. a, b, Differential MAPK activation in Arabidopsiswild-type seedlings treated with buffer only (a, mock), mEPF2 (a, b), Stomagen(a), and heat-denatured mEPF2 (b) for respective time intervals (min). Theblots were probed with anti-phospho-ERK antibody (anti-pERK) to detectphosphorylated MPK6 (pMPK6) and pMPK3 upon peptide treatment.Asterisk indicates non-specific band. CBB, total proteins stained. Four and twobiological replicates were performed for a and b, respectively. c, Confocalmicroscopy of Arabidopsis wild-type cotyledon abaxial epidermis treated withheat-denatured mEPF2 (top) and control, non-denatured mEPF2 (bottom).Scale bar, 40 mm. n 5 3 for each treatment.
4 | N A T U R E | V O L 0 0 0 | 0 0 M O N T H 2 0 1 5
RESEARCH ARTICLE
G2015 Macmillan Publishers Limited. All rights reserved
11. Bemis, S. M., Lee, J. S., Shpak, E. D. & Torii, K. U. Regulation of floral patterning andorgan identity by Arabidopsis ERECTA-family receptor kinase genes. J. Exp. Bot. 64,5323–5333 (2013).
12. Bergmann, D. C., Lukowitz, W. & Somerville, C. R. Stomatal development andpattern controlled by a MAPKK kinase. Science 304, 1494–1497 (2004).
13. Sugano, S. S. et al. Stomagen positively regulates stomatal density in Arabidopsis.Nature 463, 241–244 (2010).
14. Kondo, T. et al. Stomatal density is controlled by a mesophyll-derived signalingmolecule. Plant Cell Physiol. 51, 1–8 (2010).
15. Hunt, L.,Bailey,K. J.&Gray, J. E. ThesignallingpeptideEPFL9 isa positive regulatorof stomatal development. New Phytol. 186, 609–614 (2010).
16. Ohki, S., Takeuchi, M. & Mori, M. The NMR structure of stomagen reveals the basisof stomatal density regulation by plant peptide hormones. Nat. Commun. 2, 512(2011).
17. Jewaria, P. K.et al. Differential effects of the peptidesStomagen, EPF1andEPF2 onactivation of MAP kinase MPK6 and the SPCH protein level. Plant Cell Physiol. 54,1253–1262 (2013).
18. Geisler, M., Yang, M. & Sack, F. D. Divergent regulation of stomatal initiation andpatterning in organ and suborgan regions of the Arabidopsis mutants too manymouths and four lips. Planta 205, 522–530 (1998).
19. Pillitteri, L. J., Bogenschutz, N. L. & Torii, K. U. The bHLH protein, MUTE, controlsdifferentiation of stomata and the hydathode pore inArabidopsis. Plant Cell Physiol.49, 934–943 (2008).
20. Okuda, S. et al. Defensin-like polypeptide LUREs are pollen tube attractantssecreted from synergid cells. Nature 458, 357–361 (2009).
21. Gomez-Gomez, L. & Boller, T. FLS2: An LRR receptor-like kinase involved in theperception of the bacterial elicitor flagellin in Arabidopsis. Mol. Cell 5, 1003–1011(2000).
22. Zipfel, C. et al. Bacterial disease resistance in Arabidopsis through flagellinperception. Nature 428, 764–767 (2004).
23. Hanada, K. et al. Small open reading frames associated with morphogenesis arehidden in plant genomes. Proc. Natl Acad. Sci. USA 110, 2395–2400 (2013).
24. Abrash, E. B. & Bergmann, D. C. Regional specification of stomatal production bythe putative ligand CHALLAH. Development 137, 447–455 (2010).
25. Abrash, E. B., Davies, K. A. & Bergmann, D. C. Generation of signaling specificity inArabidopsis by spatially restricted buffering of ligand-receptor interactions. PlantCell 23, 2864–2879 (2011).
26. Uchida, N. et al. Regulation of inflorescence architecture by intertissue layerligand-receptor communication between. Proc. Natl Acad. Sci. USA 109,6337–6342 (2012).
27. Santiago, J., Henzler, C. & Hothorn, M. Molecular mechanism for plant steroidreceptor activation by somatic embryogenesis co-receptor kinases. Science 341,889–892 (2013).
28. Sun, Y. et al. Structural basis for flg22-induced activation of the Arabidopsis FLS2–BAK1 immune complex. Science 342, 624–628 (2013).
Supplementary Information is available in the online version of the paper.
Acknowledgements We thank I. Hara-Nishimura for STOMAGEN-ami lines andanti-Stomagen antibody; K. Peterson for iSTOMAGEN construct and transgenic lines;M. Kanaoka and N. Kamiya for LURE2 peptides; D. Baulcombe for p19 plasmid;C. Tamerler and M. Sarikaya for use of the HPLC, QCM and MALDI-ToF equipment;A. Hofstetter for technical assistance; and J. McAbee, K. Peterson, T. Imaizumi,B. Wakimoto, S. Di Rubbo and R. Horst for comments. K.U.T. is an HHMI-GBMFInvestigator and an Endowed Distinguished Professor of Biology; J.S.L. was an NSERCPostdoctoral Fellow. Y.-C.L.L. was a Mary Gates Undergraduate Research Fellow of theUniversity of Washington.
Author Contributions J.S.L. and K.U.T. conceived the project. J.S.L., M.H., M.M., J.A. andY.-C.L.L. purified peptidesandperformed ligand2receptor binding and bioassays. J.S.Land S.-K.H. performed RT–PCR. J.S.L. and A.P. performed MAPK assays. J.S.L. andY.-C.L.L. performed quantitative analysis of stomatal phenotypes. K.U.T. constructedSTOMAGEN cDNA plasmid. K.U.T., J.S.L., M.H., M.M., Y.-C.L.L., A.P. and S.-K.H. analysedthe data. K.U.T. wrote the manuscript with inputs from all co-authors.
Author Information Reprints and permissions information is available atwww.nature.com/reprints. The authors declare no competing financial interests.Readers are welcome to comment on the online version of the paper. Correspondenceand requests for materials should be addressed to K.U.T. ([email protected]).
0 0 M O N T H 2 0 1 5 | V O L 0 0 0 | N A T U R E | 5
ARTICLE RESEARCH
G2015 Macmillan Publishers Limited. All rights reserved
METHODSNo statistical methods were used to predetermine sample size.Plant materials and growth conditions. The Arabidopsis accession Columbia(Col) was used as wild type. All plants used in this study are in the Col back-ground. The following mutants and transgenic plant lines were reported prev-iously: er-105, erl1-2, erl2-1 and their higher order mutants7; tmm-1 (ref. 8); epf1,epf2, epf1 epf2 and tmm-KO (refs 3, 4); ER(DK) in er-105, ERL1(DK) in erl1-2 (ref. 6);and STOMAGEN-ami line (line 12; a gift from I. Hara-Nishimura)13. TheSTOMAGEN-ami lines were introduced into various mutant or transgenic back-grounds via genetic crosses. Plants were grown as described previously29. Forphenotypic analysis, seedlings were grown on 0.5 Murashige and Skoog (MS)media containing 13 Gamborg Vitamin (Sigma), 0.75% Bacto Agar, and 1% w/vsucrose under continuous light condition at 50 mmol s21 m22 (light intensitymeasured by LI-250A; LI-COR).Plasmid construction and transgenic plants generation. pKUT608 (pENTR-STOMAGEN) and pKMP127 (Est::STOMAGEN) were generated. See ExtendedData Table 1 for plasmid and primer sequence information. TransgenicArabidopsis plants were generated by the floral dip method30. Multiple transgeniclines per construct were subjected to phenotypic characterization and represent-ative lines (three lines if lines were established, and 12–14 lines if T1 lines wereused) were used for quantitative analyses. The Est::STOMAGEN lines were intro-duced into various mutants or transgenic backgrounds via genetic crosses.Chemical induction of transgene. Transgenic Arabidopsis seedlings carryingEst::STOMAGEN was germinated on 0.5 MS medium supplemented with 10 mMoestradiol (Sigma). Induction of STOMAGEN gene expression (iSTOMAGEN) wasconfirmed by RT–PCR (see Extended Data Fig. 2). The induction was furtherconfirmed by observing the epidermal phenotypes of cotyledons and hypocotylsusing a confocal microscope.RT–PCR analysis. RNA extraction, cDNA synthesis and RT–PCR were per-formed as previously described31. For a list of primers, see Extended Data Table 1.Histology, microscopy and image analysis. Confocal microscopy images weretaken using either Zeiss LSM700 operated by Zen2009 (Zeiss) describedpreviously6 or Leica SP5-WLL operated by LAS AF (Leica). Cell outlines werevisualized with either propidium iodide (PI: Molecular Probes) or FM4-64(Invitrogen) and observed using the HyD detector with excitation 515 nm, emis-sion 623–642 nm. The images were false coloured using Photoshop CS6 (Adobe).Clearing of seedlings by chloral hydrate and observation using differential inter-ference contrast (DIC) microscope was performed as described previously32. Forhistological analysis, seedlings were stained with toluidine blue-O (TBO: Sigma)as follows. Briefly, samples were placed in 9:1 v/v ethanol to acetic acid overnight,rehydrated through reduced ethanol series to deionized water, then stained with0.5% TBO for 3 min. Seedlings were immediately rinsed with deionized water andsubsequently mounted in 15% v/v glycerol. For bright-field and DIC microscopy,images were taken under Olympus BX51 equipped with DP73 digital cameraoperated by CellSens Standard software (Olympus).Quantitative analysis of epidermis. Abaxial cotyledons from 10-day-old seed-lings of respected genotypes were subjected to TBO staining or DIC microscopy.The central regions overlying the distal vascular loop were imaged and numbersof epidermal cells, stomata and their cluster size were quantified. For each geno-type, sample size of 14–16 was used and over 1,000 epidermal cells were countedto provide statistical robustness. For cotyledons of Est::STOMAGEN lines, indi-vidual T1 seedlings were subjected to analysis. For hypocotyls, three represent-ative T2 Est::STOMAGEN lines were analysed. For each seedling, a representativeimage was taken at the exact location to minimize the variance. Specific numbersof stomata are listed for each genotype in corresponding figure legends. Statisticalanalysis (Wilcoxon rank sum test) was performed using R version 3.0.3 forstomatal density, stomatal index and SLGC index. P values are indicated in eachfigure legend.Transient protein expression in Nicotiana benthamiana. Agrobacterium tume-faciens strain GV3101 was transformed with expression clones and grown in yeastextract and beef medium supplemented with relevant antibiotics. Bacterial cul-tures were precipitated and resuspended in infiltration medium (10 mM MgCl2,10 mM MES (pH 5.6) and 150 mM acetosyringone). Culture densities wereadjusted to an OD600 of 1.0, and the cells were incubated at room temperaturefor 4 h before infiltration. Equal volumes of cultures carrying different constructswere mixed. To enhance transient expression in tobacco, the silencing suppressorp19 (a gift from D. Baulcombe) was co-infiltrated33. The bacterial suspensionswere infiltrated into young but fully expanded leaves of N. benthamiana plants.After infiltration, plants were cultivated at 25 uC and collected for further bio-chemical assays after 48–72 h.Peptide expression, purification and refolding. Recombinant mEPF2 peptidewas prepared as reported previously6 and the mature Stomagen peptide, either
wild-type or non-refolding mutant version in which all six cysteines were sub-stituted by serines, were chemically synthesized (Invitrogen and BioSynthesis).The Stomagen peptide was dissolved in 20 mM Tris-HCl, pH 8.8, and 50 mMNaCl and refolded (Mini dialysis kit, MWCO:1,000, GE Healthcare) for 3 d at4 uC using glutathione (reduced and oxidized forms; Wako) and L-arginine ethylester dihydrochloride (Sigma). The peptides were further dialysed three timesagainst 50 mM Tris-HCl, pH 8.0 for 1.5 d to remove glutathione. For non-foldingmutant Stomagen, chemically synthesized peptides were dissolved in 50 mMTris-HCl, pH 8.0. The resulting mEPF2, Stomagen and mutant Stomagen pep-tides were fractionated using C18 column (Gemini) by HPLC (Waters DeltaPrep 3000 HPLC) as previously described to determine the purity of each pep-tide6. The separated peaks were collected, and each peak was identified byMALDI-TOF mass spectrometry on an Autoflex II mass spectrometer in positiveion mode (Bruker Daltonics) using 2:1 a-cyano-4-hydroxycinnamic acid and 2,5-dihydroxy-benzoic acid matrix. The collected HPLC-purified mEPF2 andStomagen peptide peaks were freeze-dried, then re-dissolved to appropriate con-centration. Quantification of the active populations of peptides was determinedusing NanoDrop8000 (Thermo Scientific) using the following molar extinctioncoefficients: Stomagen, 5,960; EPF2, 6,460; LURE2, 23,950 mol21 cm21. Forbioassays, freeze-dried peptides were re-dissolved to appropriate concentrationin MS medium. For subsequent biochemical assays, the amounts of bioactivepeptides were calculated from this quantification.Peptide bioassays. Refolded recombinant mEPF2 and Stomagen peptides inbuffer were applied to 1-day-old Arabidopsis plants that had germinated on0.5 MS medium. After 5 d of further incubation in 0.5 MS liquid medium contain-ing each peptide (2.5–5 mM concentration), stomatal phenotypes of abaxial coty-ledon epidermis were determined by inspection with a confocal microscope asdescribed previously6.Immunoprecipitation, protein gel electrophoresis and immunoblots. Forimmunoprecipitation and co-immunoprecipitation assays, N. benthamianaleaves expressing CaMV35S::ERDK–GFP, CaMV35S::FLS2(DK)–GFP, CaMV35S::TMM–GFP, CaMV35S::GFP, or empty vector were subjected to protein prepara-tion (microsomal fraction enrichment for all except soluble GFP). Co-incubationwith Stomagen (1 mM) or LURE2 peptides (1 mM) and immunoprecipitationprocedure are described in the Ligand Competition Assays section below.Immunoprecipitation using either anti-GFP (Abcam ab290) antibodies and pro-tein gel immunoblot (western blot) analysis using anti-GFP (Invitrogen C163),anti-Flag (Sigma-Aldrich M2), anti-His (Qiagen anti-His5 34660), and anti-Stomagen (a gift from I. Hara-Nishimura)13 antibodies were performed asdescribed previously6. As secondary antibodies, either goat anti-mouse (GEHealthcare NA931) or anti-rabbit IgG horseradish peroxidase-linked antibodies(Sigma A6154) were used at a dilution of 1:50,000. The protein blots were visua-lized using SuperSignal West Femto Maximum Sensitivity Substrate (ThermoScientific).Quartz crystal microbalance. QCM measurements were performed using QCM-Z500 (KSV Instruments) and commercially available AT-cut polished QCMcrystals with a fundamental resonant frequency of 4.95 MHz (InternationalCrystal Manufacturing Co.) as reported previously6. The QCM crystal chips werepre-treated with anti-GFP antibody (Abcam ab290) to functionalize the chipsurface. Subsequently, GFP-tagged receptors or GFP expressed in N. benthami-ana and extracted as a microsomal fraction (for ER(DK)–GFP and TMM–GFP)or a total fraction (GFP) were immobilized onto a QCM sensor chip via anti-GFPantibody linkage. The chips were washed with a phosphate buffer extensively.After establishing a stable baseline using phosphate buffer solution, purifiedbioactive mEPF2 or Stomagen peptides in the phosphate buffer was added step-wise to the QCM chamber. The frequency change for QCM was monitored untilno further change was observed, indicating equilibrium. All experiments wereperformed at 4 uC in stop-flow mode. The peptide–receptor binding was quan-tified via QCM by measuring the frequency shifts, DF, at several peptide concen-trations. To determine the dissociation constant (Kd) of each peptide–receptorpair, the experimental frequency shift values were fitted to the Langmuir adsorp-tion model: 2DF 5 DFmaxC/(C 1 Kd), where DFmax is the frequency shift whenthe binding is saturated and C is the concentration of the bulk solution, using aleast squares regression.Ligand competition assays. N. benthamiana leaves expressing CaMV35S::ER(DK)–GFP were ground in liquid nitrogen and homogenized in extractionbuffer (100 mM Tris-HCl pH 8.8, 150 mM NaCl, 1 mM EDTA, 20% glycerol,20 mM NaF, 1 mM PMSF, 1:1,000 Complete protease inhibitor cocktail (RocheApplied Science)). The slurry was centrifuged at 10,000g for 15 min at 4 uC. Thesupernatant was sonicated on ice and then centrifuged at 100,000g for 30 min at4 uC to give a pellet of the microsomal fractions. The pellet was resuspendedin membrane solubilization buffer (100 mM Tris-HCl at pH 7.3, 150 mMNaCl, 1 mM EDTA, 10% glycerol, 1% Triton X-100, 20 mM NaF, 1 mM
RESEARCH ARTICLE
G2015 Macmillan Publishers Limited. All rights reserved
PMSF, 1:1,000 Complete protease inhibitor cocktail) to release membrane pro-teins. The solution was sonicated on ice and centrifuged again at 100,000g for 30min at 4 uC. The supernatant was incubated with Protein-G-coupled magneticbeads (Dynabeads Protein G, Invitrogen) that captured anti-GFP (ab290; Abcam)antibody at 4 uC for 2 h with gentle agitation. Then, the beads were washed fourtimes with 500 ml of phosphate buffer (pH 7.4). The immunoprecipitates weresuspended in 500 ml of binding buffer (50 mM MES-KOH, pH 5.5 with 100 mMsucrose) containing 1 mM mEPF2–MYC–HIS peptide in the absence or presenceof different concentration of unlabelled bioactive Stomagen peptide and thenincubated at 4 uC for 1 h with gentle agitation. The reaction mixture was washedfour times with 500 ml of phosphate buffer (pH 7.4) to separate bound and freemEPF2–MYC–His peptide, and precipitated proteins were eluted with 23 SDSsample buffer at 80 uC for 5 min. Either total membrane or immunoprecipitatedproteins were separated on a SDS–PAGE gel and transferred to PDVF membrane(Millipore) for immunoblot analysis using monoclonal anti-GFP (C163, 1:1,000,Invitrogen), anti-MYC (ab32, 1:1,000, abcam) or anti-Stomagen antibodies (1:5,000, a gift from I. Hara-Nishimura)13 as primary antibodies. As secondaryantibodies, either goat anti-mouse or rabbit IgG horseradish peroxidase-linkedantibodies (GE Healthcare NA931; Sigma A6154) were used at a dilution of1:50,000. Co-immunoprecipitated mEPF2 was detected first. Then, the same blotwas re-probed with anti-Stomagen antibody to detect Stomagen.
Four biological replicates were performed and subjected to quantification ofthe IC50 values as the following. Band intensities on western blots were quantifiedusing IMAGEJ (http://rsb.info.nih.gov/ij/index.html). Pixel values were mea-sured on equal-sized areas and normalized against the bands detectingsame immunoprecipitates by monoclonal anti-GFP antibody. The intensityvalues shown in the paper are the ratios relative to the references, and valueswere analysed by nonlinear regression analysis using OriginLab version 6(OriginLab) to calculate the IC50 value.
MAPK phosphorylation assays. 12-day-old Arabidopsis seedlings were grownfor 5 days on 0.5 MS media plates and then transferred to 0.5 MS liquid media in a12-well cluster plate (Falcon 3047). Seedlings were treated with buffer only,mEPF2 (2.5 mM), or with Stomagen (5 mM) at room temperature before beingpooled for harvest. For heat denaturation of mEPF2, the peptide solution wastreated at 95 uC for 2 h before MAPK phosphorylation assays and bioassays. Plantmaterials were ground in liquid nitrogen, and then extracted with buffer (100 mMHEPES, pH 7.5, 5 mM EDTA, 5 mM EGTA, 2 mM DTT, 10 mM Na3VO4, 10 mMNaF, 50 mM b-glycerolphosphate, 1 mM PMSF, 1 tablet per 50 ml extractionbuffer of proteinase inhibitor mixture, 10% glycerol, 7.5% (w/v) PVPP). Aftercentrifugation at 13,000 r.p.m. for 30 min, the protein concentration was deter-mined using a Bradford assay (Bio-Rad). Immunoblot analysis was performedusing anti-phospho-ERK (1:2,000, Cell Signaling) antibody as primary antibody,and peroxidase-conjugated goat anti-rabbit IgG (1:15,000, Sigma) as secondaryantibody.
29. Shpak, E. D., Lakeman, M. B. & Torii, K. U. Dominant-negative receptor uncoversredundancy in the Arabidopsis ERECTA leucin-rich repeat receptor-like kinasesignaling pathway that regulates organ shape. Plant Cell 15, 1095–1110 (2003).
30. Clough, S. J. & Bent, A. F. Floral dip: a simplified method for Agrobacterium-mediated transformation of Arabidopsis thaliana. Plant J. 16, 735–743 (1998).
31. Pillitteri, L. J., Peterson,K.M., Horst,R. J.&Torii, K.U.Molecular profiling of stomatalmeristemoids reveals new component of asymmetric cell division andcommonalities among stem cell populations in Arabidopsis. Plant Cell 23,3260–3275 (2011).
32. Pillitteri, L. J., Sloan, D. B., Bogenschutz, N. L. & Torii, K. U. Termination ofasymmetric cell division and differentiation of stomata. Nature 445, 501–505(2007).
33. Voinnet,O., Rivas, S., Mestre, P.& Baulcombe, D.An enhanced transient expressionsystem in plants based on suppression of gene silencing by the p19 protein oftomato bushy stunt virus. Plant J. 33, 949–956 (2003).
ARTICLE RESEARCH
G2015 Macmillan Publishers Limited. All rights reserved
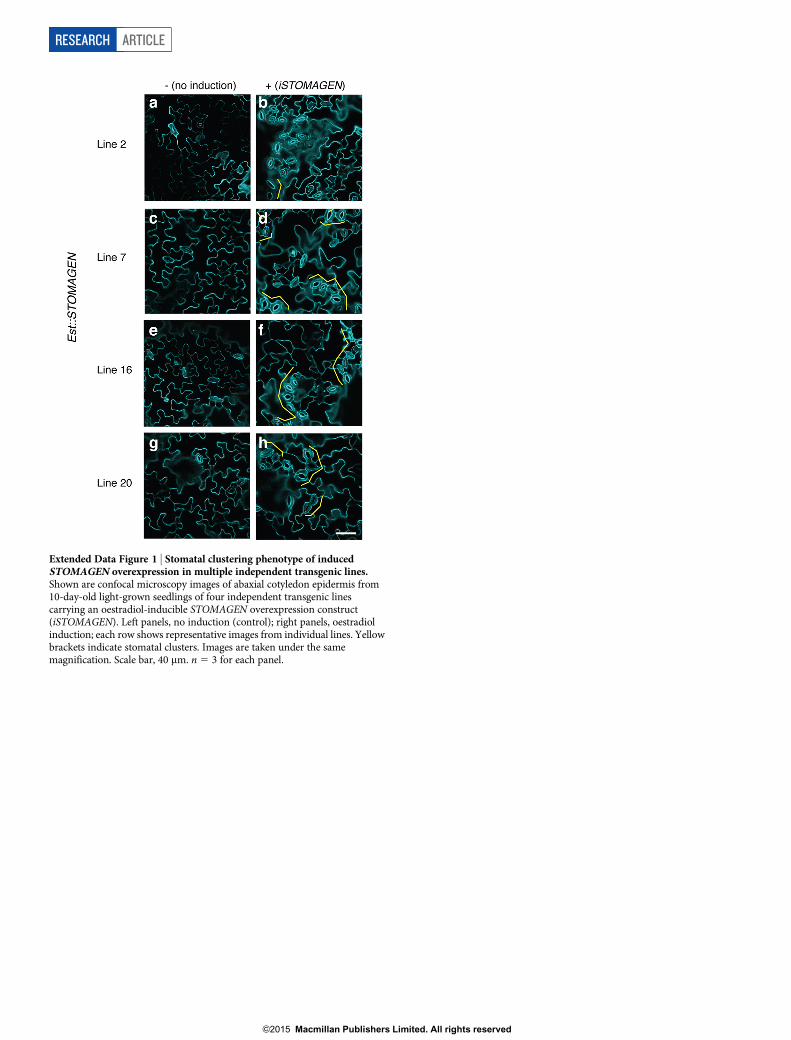
Extended Data Figure 1 | Stomatal clustering phenotype of inducedSTOMAGEN overexpression in multiple independent transgenic lines.Shown are confocal microscopy images of abaxial cotyledon epidermis from10-day-old light-grown seedlings of four independent transgenic linescarrying an oestradiol-inducible STOMAGEN overexpression construct(iSTOMAGEN). Left panels, no induction (control); right panels, oestradiolinduction; each row shows representative images from individual lines. Yellowbrackets indicate stomatal clusters. Images are taken under the samemagnification. Scale bar, 40 mm. n 5 3 for each panel.
RESEARCH ARTICLE
G2015 Macmillan Publishers Limited. All rights reserved
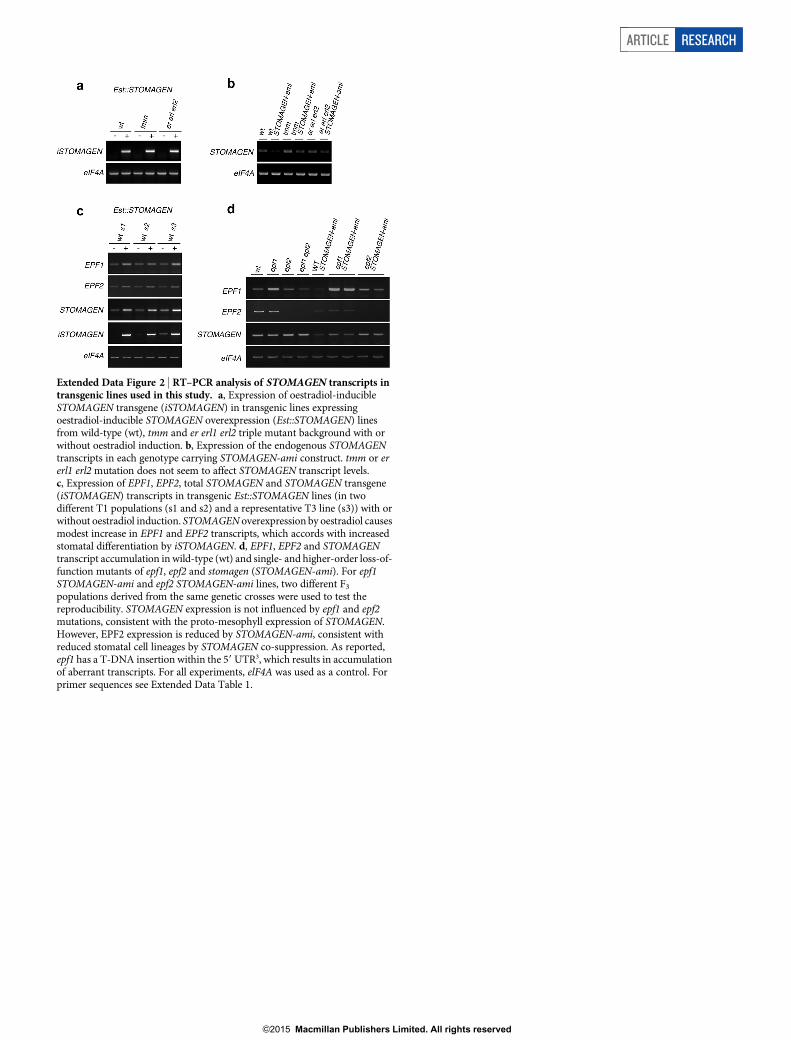
Extended Data Figure 2 | RT–PCR analysis of STOMAGEN transcripts intransgenic lines used in this study. a, Expression of oestradiol-inducibleSTOMAGEN transgene (iSTOMAGEN) in transgenic lines expressingoestradiol-inducible STOMAGEN overexpression (Est::STOMAGEN) linesfrom wild-type (wt), tmm and er erl1 erl2 triple mutant background with orwithout oestradiol induction. b, Expression of the endogenous STOMAGENtranscripts in each genotype carrying STOMAGEN-ami construct. tmm or ererl1 erl2 mutation does not seem to affect STOMAGEN transcript levels.c, Expression of EPF1, EPF2, total STOMAGEN and STOMAGEN transgene(iSTOMAGEN) transcripts in transgenic Est::STOMAGEN lines (in twodifferent T1 populations (s1 and s2) and a representative T3 line (s3)) with orwithout oestradiol induction. STOMAGEN overexpression by oestradiol causesmodest increase in EPF1 and EPF2 transcripts, which accords with increasedstomatal differentiation by iSTOMAGEN. d, EPF1, EPF2 and STOMAGENtranscript accumulation in wild-type (wt) and single- and higher-order loss-of-function mutants of epf1, epf2 and stomagen (STOMAGEN-ami). For epf1STOMAGEN-ami and epf2 STOMAGEN-ami lines, two different F3
populations derived from the same genetic crosses were used to test thereproducibility. STOMAGEN expression is not influenced by epf1 and epf2mutations, consistent with the proto-mesophyll expression of STOMAGEN.However, EPF2 expression is reduced by STOMAGEN-ami, consistent withreduced stomatal cell lineages by STOMAGEN co-suppression. As reported,epf1 has a T-DNA insertion within the 59 UTR3, which results in accumulationof aberrant transcripts. For all experiments, elF4A was used as a control. Forprimer sequences see Extended Data Table 1.
ARTICLE RESEARCH
G2015 Macmillan Publishers Limited. All rights reserved
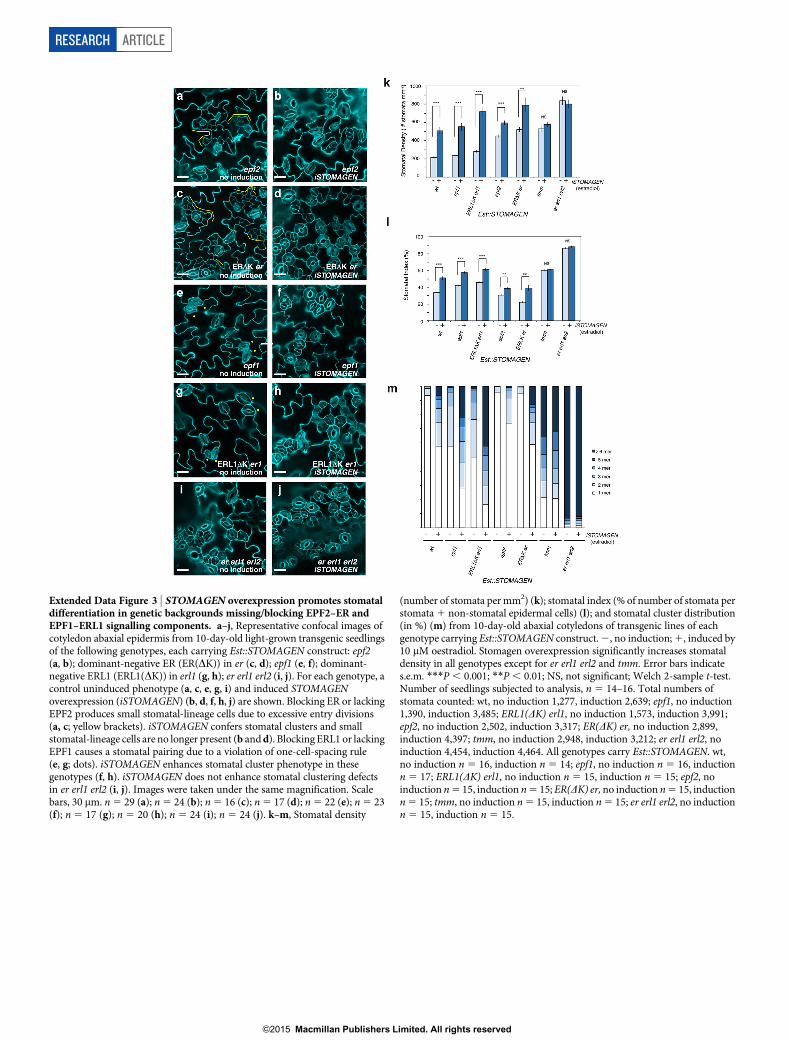
Extended Data Figure 3 | STOMAGEN overexpression promotes stomataldifferentiation in genetic backgrounds missing/blocking EPF2–ER andEPF1–ERL1 signalling components. a–j, Representative confocal images ofcotyledon abaxial epidermis from 10-day-old light-grown transgenic seedlingsof the following genotypes, each carrying Est::STOMAGEN construct: epf2(a, b); dominant-negative ER (ER(DK)) in er (c, d); epf1 (e, f); dominant-negative ERL1 (ERL1(DK)) in erl1 (g, h); er erl1 erl2 (i, j). For each genotype, acontrol uninduced phenotype (a, c, e, g, i) and induced STOMAGENoverexpression (iSTOMAGEN) (b, d, f, h, j) are shown. Blocking ER or lackingEPF2 produces small stomatal-lineage cells due to excessive entry divisions(a, c; yellow brackets). iSTOMAGEN confers stomatal clusters and smallstomatal-lineage cells are no longer present (b and d). Blocking ERL1 or lackingEPF1 causes a stomatal pairing due to a violation of one-cell-spacing rule(e, g; dots). iSTOMAGEN enhances stomatal cluster phenotype in thesegenotypes (f, h). iSTOMAGEN does not enhance stomatal clustering defectsin er erl1 erl2 (i, j). Images were taken under the same magnification. Scalebars, 30 mm. n 5 29 (a); n 5 24 (b); n 5 16 (c); n 5 17 (d); n 5 22 (e); n 5 23(f); n 5 17 (g); n 5 20 (h); n 5 24 (i); n 5 24 (j). k–m, Stomatal density
(number of stomata per mm2) (k); stomatal index (% of number of stomata perstomata 1 non-stomatal epidermal cells) (l); and stomatal cluster distribution(in %) (m) from 10-day-old abaxial cotyledons of transgenic lines of eachgenotype carrying Est::STOMAGEN construct. 2, no induction; 1, induced by10 mM oestradiol. Stomagen overexpression significantly increases stomataldensity in all genotypes except for er erl1 erl2 and tmm. Error bars indicates.e.m. ***P , 0.001; **P , 0.01; NS, not significant; Welch 2-sample t-test.Number of seedlings subjected to analysis, n 5 14–16. Total numbers ofstomata counted: wt, no induction 1,277, induction 2,639; epf1, no induction1,390, induction 3,485; ERL1(DK) erl1, no induction 1,573, induction 3,991;epf2, no induction 2,502, induction 3,317; ER(DK) er, no induction 2,899,induction 4,397; tmm, no induction 2,948, induction 3,212; er erl1 erl2, noinduction 4,454, induction 4,464. All genotypes carry Est::STOMAGEN. wt,no induction n 5 16, induction n 5 14; epf1, no induction n 5 16, inductionn 5 17; ERL1(DK) erl1, no induction n 5 15, induction n 5 15; epf2, noinduction n 5 15, induction n 5 15; ER(DK) er, no induction n 5 15, inductionn 5 15; tmm, no induction n 5 15, induction n 5 15; er erl1 erl2, no inductionn 5 15, induction n 5 15.
RESEARCH ARTICLE
G2015 Macmillan Publishers Limited. All rights reserved
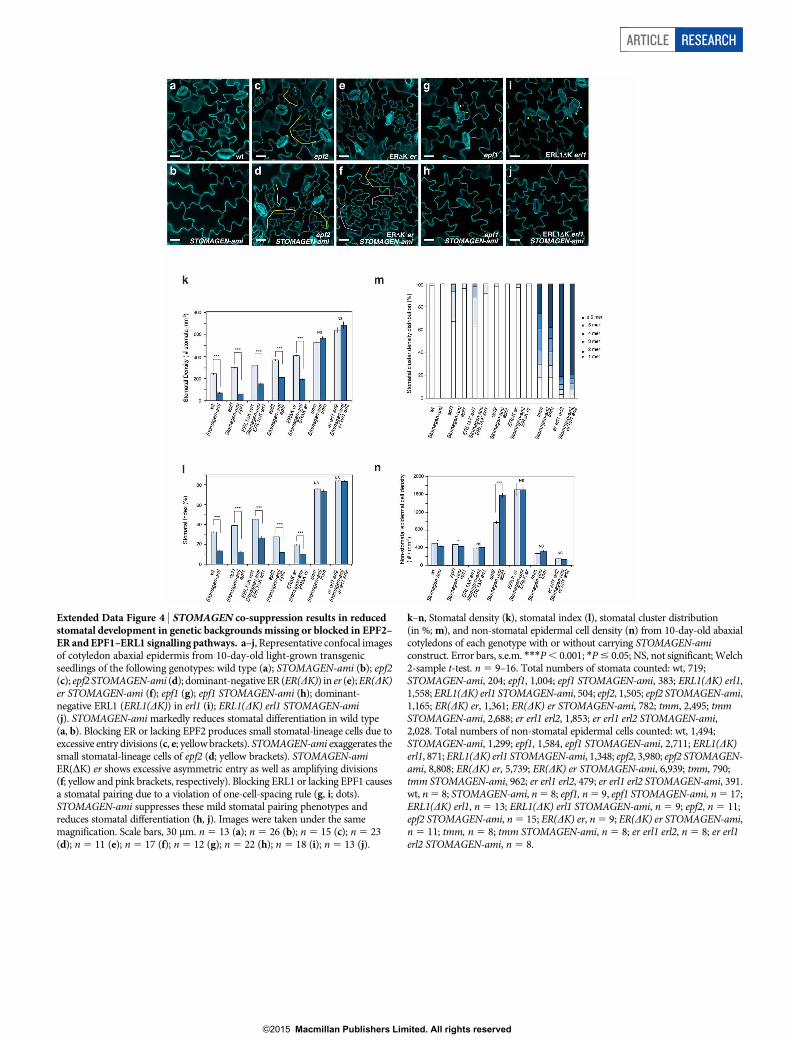
Extended Data Figure 4 | STOMAGEN co-suppression results in reducedstomatal development in genetic backgrounds missing or blocked in EPF2–ER and EPF1–ERL1 signalling pathways. a–j, Representative confocal imagesof cotyledon abaxial epidermis from 10-day-old light-grown transgenicseedlings of the following genotypes: wild type (a); STOMAGEN-ami (b); epf2(c); epf2 STOMAGEN-ami (d); dominant-negative ER (ER(DK)) in er (e); ER(DK)er STOMAGEN-ami (f); epf1 (g); epf1 STOMAGEN-ami (h); dominant-negative ERL1 (ERL1(DK)) in erl1 (i); ERL1(DK) erl1 STOMAGEN-ami(j). STOMAGEN-ami markedly reduces stomatal differentiation in wild type(a, b). Blocking ER or lacking EPF2 produces small stomatal-lineage cells due toexcessive entry divisions (c, e; yellow brackets). STOMAGEN-ami exaggerates thesmall stomatal-lineage cells of epf2 (d; yellow brackets). STOMAGEN-amiER(DK) er shows excessive asymmetric entry as well as amplifying divisions(f; yellow and pink brackets, respectively). Blocking ERL1 or lacking EPF1 causesa stomatal pairing due to a violation of one-cell-spacing rule (g, i; dots).STOMAGEN-ami suppresses these mild stomatal pairing phenotypes andreduces stomatal differentiation (h, j). Images were taken under the samemagnification. Scale bars, 30 mm. n 5 13 (a); n 5 26 (b); n 5 15 (c); n 5 23(d); n 5 11 (e); n 5 17 (f); n 5 12 (g); n 5 22 (h); n 5 18 (i); n 5 13 (j).
k–n, Stomatal density (k), stomatal index (l), stomatal cluster distribution(in %; m), and non-stomatal epidermal cell density (n) from 10-day-old abaxialcotyledons of each genotype with or without carrying STOMAGEN-amiconstruct. Error bars, s.e.m. ***P , 0.001; *P # 0.05; NS, not significant; Welch2-sample t-test. n 5 9–16. Total numbers of stomata counted: wt, 719;STOMAGEN-ami, 204; epf1, 1,004; epf1 STOMAGEN-ami, 383; ERL1(DK) erl1,1,558; ERL1(DK) erl1 STOMAGEN-ami, 504; epf2, 1,505; epf2 STOMAGEN-ami,1,165; ER(DK) er, 1,361; ER(DK) er STOMAGEN-ami, 782; tmm, 2,495; tmmSTOMAGEN-ami, 2,688; er erl1 erl2, 1,853; er erl1 erl2 STOMAGEN-ami,2,028. Total numbers of non-stomatal epidermal cells counted: wt, 1,494;STOMAGEN-ami, 1,299; epf1, 1,584, epf1 STOMAGEN-ami, 2,711; ERL1(DK)erl1, 871; ERL1(DK) erl1 STOMAGEN-ami, 1,348; epf2, 3,980; epf2 STOMAGEN-ami, 8,808; ER(DK) er, 5,739; ER(DK) er STOMAGEN-ami, 6,939; tmm, 790;tmm STOMAGEN-ami, 962; er erl1 erl2, 479; er erl1 erl2 STOMAGEN-ami, 391.wt, n 5 8; STOMAGEN-ami, n 5 8; epf1, n 5 9, epf1 STOMAGEN-ami, n 5 17;ERL1(DK) erl1, n 5 13; ERL1(DK) erl1 STOMAGEN-ami, n 5 9; epf2, n 5 11;epf2 STOMAGEN-ami, n 5 15; ER(DK) er, n 5 9; ER(DK) er STOMAGEN-ami,n 5 11; tmm, n 5 8; tmm STOMAGEN-ami, n 5 8; er erl1 erl2, n 5 8; er erl1erl2 STOMAGEN-ami, n 5 8.
ARTICLE RESEARCH
G2015 Macmillan Publishers Limited. All rights reserved
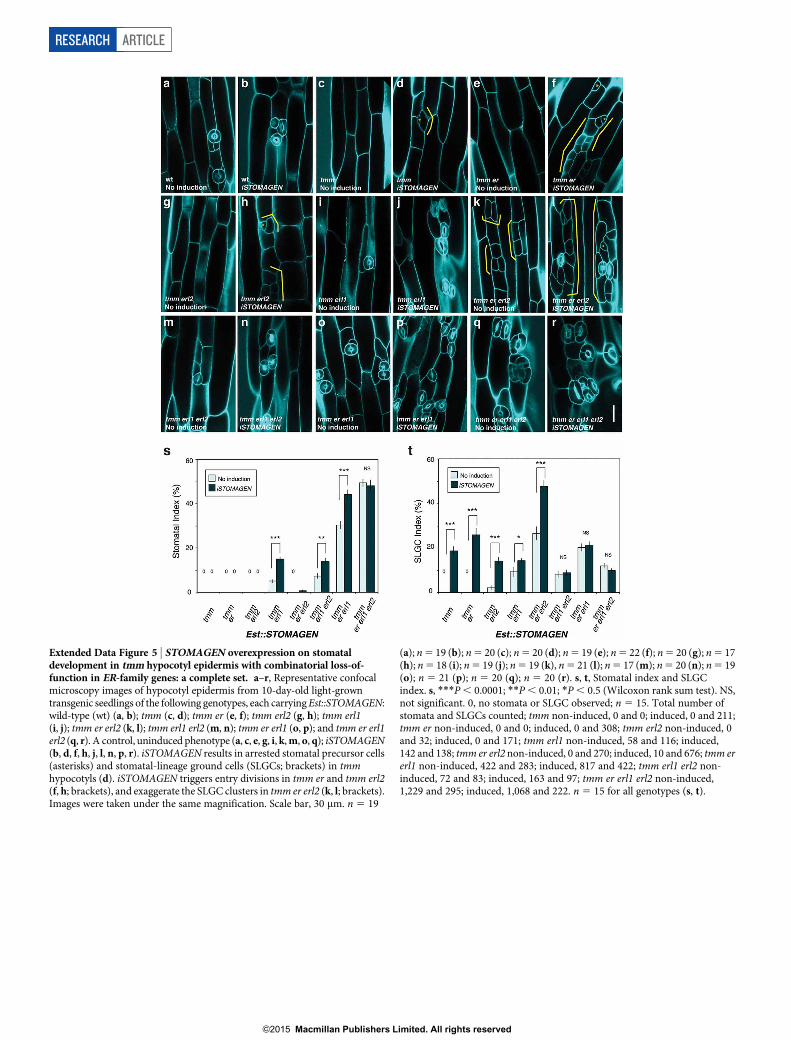
Extended Data Figure 5 | STOMAGEN overexpression on stomataldevelopment in tmm hypocotyl epidermis with combinatorial loss-of-function in ER-family genes: a complete set. a–r, Representative confocalmicroscopy images of hypocotyl epidermis from 10-day-old light-growntransgenic seedlings of the following genotypes, each carrying Est::STOMAGEN:wild-type (wt) (a, b); tmm (c, d); tmm er (e, f); tmm erl2 (g, h); tmm erl1(i, j); tmm er erl2 (k, l); tmm erl1 erl2 (m, n); tmm er erl1 (o, p); and tmm er erl1erl2 (q, r). A control, uninduced phenotype (a, c, e, g, i, k, m, o, q); iSTOMAGEN(b, d, f, h, j, l, n, p, r). iSTOMAGEN results in arrested stomatal precursor cells(asterisks) and stomatal-lineage ground cells (SLGCs; brackets) in tmmhypocotyls (d). iSTOMAGEN triggers entry divisions in tmm er and tmm erl2(f, h; brackets), and exaggerate the SLGC clusters in tmm er erl2 (k, l; brackets).Images were taken under the same magnification. Scale bar, 30 mm. n 5 19
(a); n 5 19 (b); n 5 20 (c); n 5 20 (d); n 5 19 (e); n 5 22 (f); n 5 20 (g); n 5 17(h); n 5 18 (i); n 5 19 (j); n 5 19 (k), n 5 21 (l); n 5 17 (m); n 5 20 (n); n 5 19(o); n 5 21 (p); n 5 20 (q); n 5 20 (r). s, t, Stomatal index and SLGCindex. s, ***P , 0.0001; **P , 0.01; *P , 0.5 (Wilcoxon rank sum test). NS,not significant. 0, no stomata or SLGC observed; n 5 15. Total number ofstomata and SLGCs counted; tmm non-induced, 0 and 0; induced, 0 and 211;tmm er non-induced, 0 and 0; induced, 0 and 308; tmm erl2 non-induced, 0and 32; induced, 0 and 171; tmm erl1 non-induced, 58 and 116; induced,142 and 138; tmm er erl2 non-induced, 0 and 270; induced, 10 and 676; tmm ererl1 non-induced, 422 and 283; induced, 817 and 422; tmm erl1 erl2 non-induced, 72 and 83; induced, 163 and 97; tmm er erl1 erl2 non-induced,1,229 and 295; induced, 1,068 and 222. n 5 15 for all genotypes (s, t).
RESEARCH ARTICLE
G2015 Macmillan Publishers Limited. All rights reserved
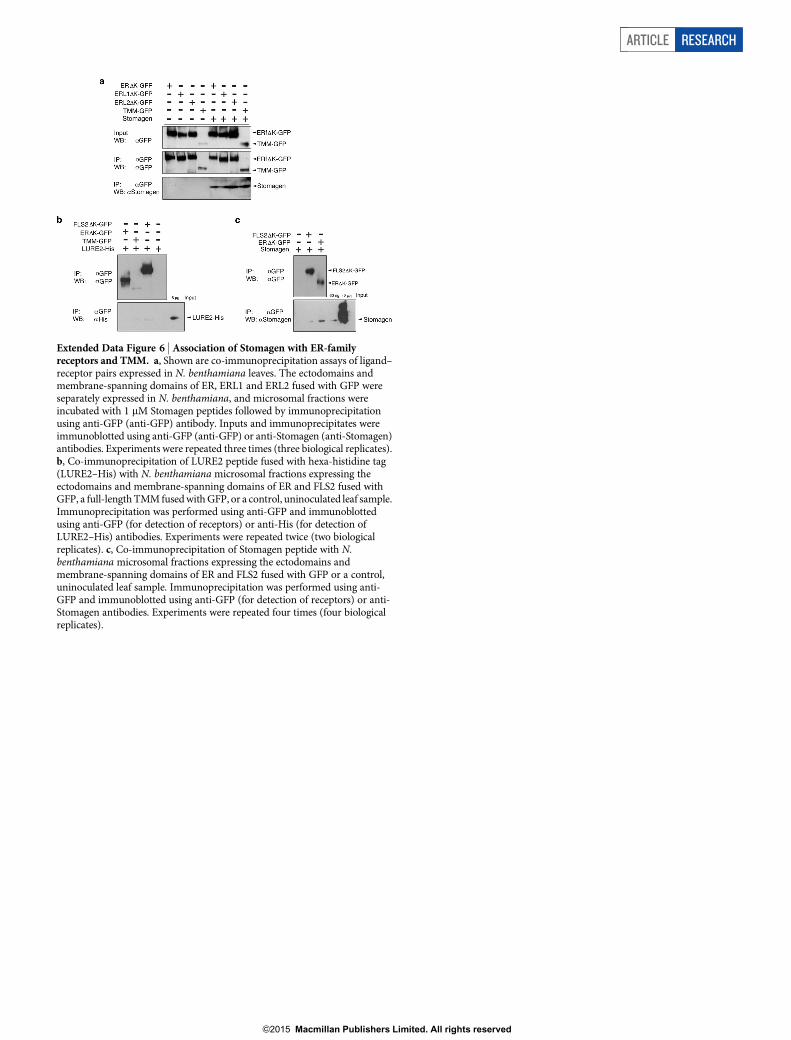
Extended Data Figure 6 | Association of Stomagen with ER-familyreceptors and TMM. a, Shown are co-immunoprecipitation assays of ligand–receptor pairs expressed in N. benthamiana leaves. The ectodomains andmembrane-spanning domains of ER, ERL1 and ERL2 fused with GFP wereseparately expressed in N. benthamiana, and microsomal fractions wereincubated with 1 mM Stomagen peptides followed by immunoprecipitationusing anti-GFP (anti-GFP) antibody. Inputs and immunoprecipitates wereimmunoblotted using anti-GFP (anti-GFP) or anti-Stomagen (anti-Stomagen)antibodies. Experiments were repeated three times (three biological replicates).b, Co-immunoprecipitation of LURE2 peptide fused with hexa-histidine tag(LURE2–His) with N. benthamiana microsomal fractions expressing theectodomains and membrane-spanning domains of ER and FLS2 fused withGFP, a full-length TMM fused with GFP, or a control, uninoculated leaf sample.Immunoprecipitation was performed using anti-GFP and immunoblottedusing anti-GFP (for detection of receptors) or anti-His (for detection ofLURE2–His) antibodies. Experiments were repeated twice (two biologicalreplicates). c, Co-immunoprecipitation of Stomagen peptide with N.benthamiana microsomal fractions expressing the ectodomains andmembrane-spanning domains of ER and FLS2 fused with GFP or a control,uninoculated leaf sample. Immunoprecipitation was performed using anti-GFP and immunoblotted using anti-GFP (for detection of receptors) or anti-Stomagen antibodies. Experiments were repeated four times (four biologicalreplicates).
ARTICLE RESEARCH
G2015 Macmillan Publishers Limited. All rights reserved
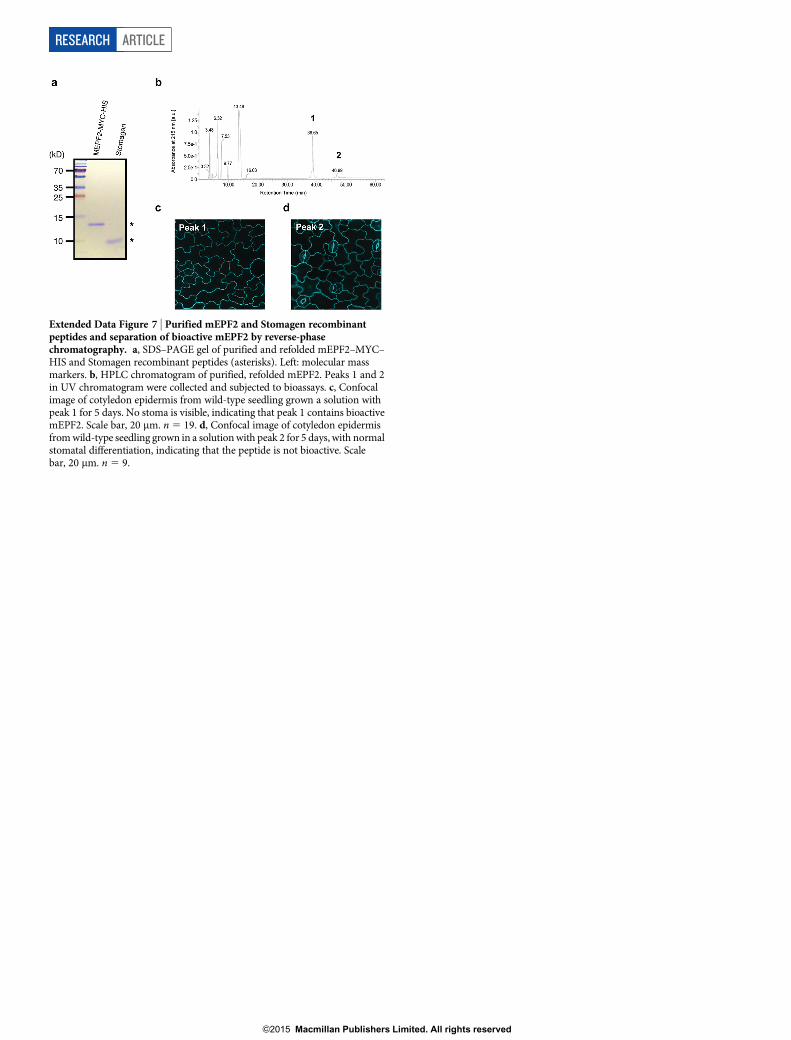
Extended Data Figure 7 | Purified mEPF2 and Stomagen recombinantpeptides and separation of bioactive mEPF2 by reverse-phasechromatography. a, SDS–PAGE gel of purified and refolded mEPF2–MYC–HIS and Stomagen recombinant peptides (asterisks). Left: molecular massmarkers. b, HPLC chromatogram of purified, refolded mEPF2. Peaks 1 and 2in UV chromatogram were collected and subjected to bioassays. c, Confocalimage of cotyledon epidermis from wild-type seedling grown a solution withpeak 1 for 5 days. No stoma is visible, indicating that peak 1 contains bioactivemEPF2. Scale bar, 20 mm. n 5 19. d, Confocal image of cotyledon epidermisfrom wild-type seedling grown in a solution with peak 2 for 5 days, with normalstomatal differentiation, indicating that the peptide is not bioactive. Scalebar, 20 mm. n 5 9.
RESEARCH ARTICLE
G2015 Macmillan Publishers Limited. All rights reserved
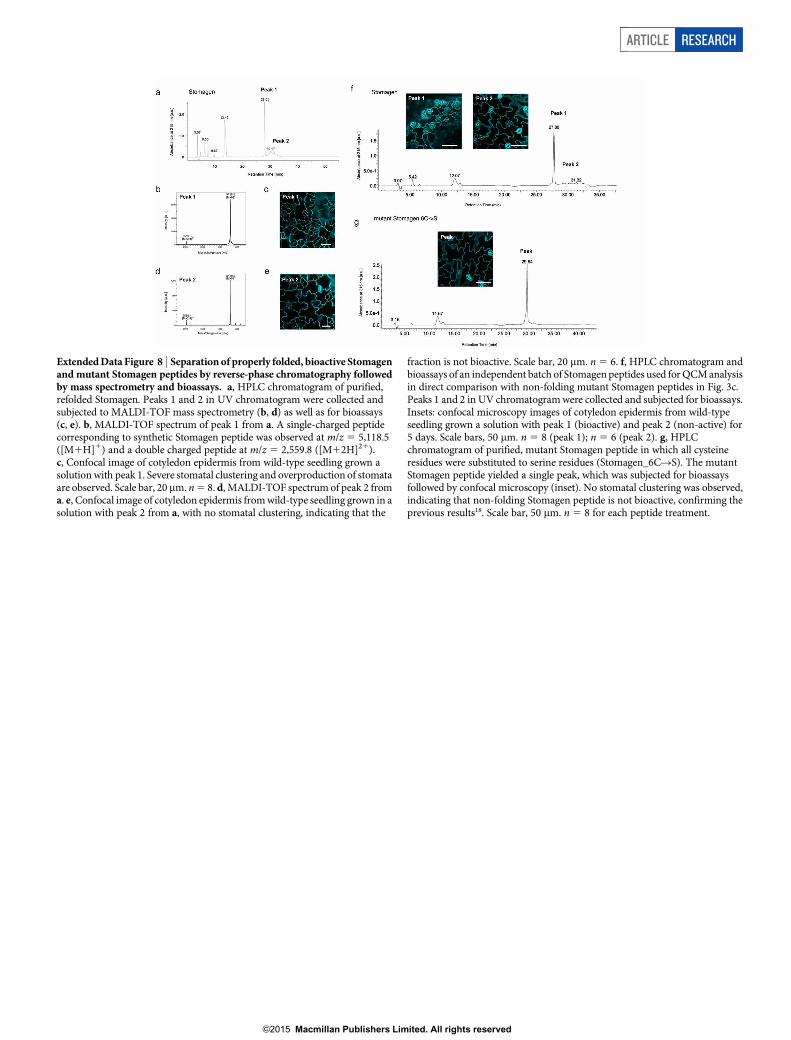
Extended Data Figure 8 | Separation of properly folded, bioactive Stomagenand mutant Stomagen peptides by reverse-phase chromatography followedby mass spectrometry and bioassays. a, HPLC chromatogram of purified,refolded Stomagen. Peaks 1 and 2 in UV chromatogram were collected andsubjected to MALDI-TOF mass spectrometry (b, d) as well as for bioassays(c, e). b, MALDI-TOF spectrum of peak 1 from a. A single-charged peptidecorresponding to synthetic Stomagen peptide was observed at m/z 5 5,118.5([M1H]1) and a double charged peptide at m/z 5 2,559.8 ([M12H]21).c, Confocal image of cotyledon epidermis from wild-type seedling grown asolution with peak 1. Severe stomatal clustering and overproduction of stomataare observed. Scale bar, 20 mm. n 5 8. d, MALDI-TOF spectrum of peak 2 froma. e, Confocal image of cotyledon epidermis from wild-type seedling grown in asolution with peak 2 from a, with no stomatal clustering, indicating that the
fraction is not bioactive. Scale bar, 20 mm. n 5 6. f, HPLC chromatogram andbioassays of an independent batch of Stomagen peptides used for QCM analysisin direct comparison with non-folding mutant Stomagen peptides in Fig. 3c.Peaks 1 and 2 in UV chromatogram were collected and subjected for bioassays.Insets: confocal microscopy images of cotyledon epidermis from wild-typeseedling grown a solution with peak 1 (bioactive) and peak 2 (non-active) for5 days. Scale bars, 50 mm. n 5 8 (peak 1); n 5 6 (peak 2). g, HPLCchromatogram of purified, mutant Stomagen peptide in which all cysteineresidues were substituted to serine residues (Stomagen_6CRS). The mutantStomagen peptide yielded a single peak, which was subjected for bioassaysfollowed by confocal microscopy (inset). No stomatal clustering was observed,indicating that non-folding Stomagen peptide is not bioactive, confirming theprevious results18. Scale bar, 50 mm. n 5 8 for each peptide treatment.
ARTICLE RESEARCH
G2015 Macmillan Publishers Limited. All rights reserved
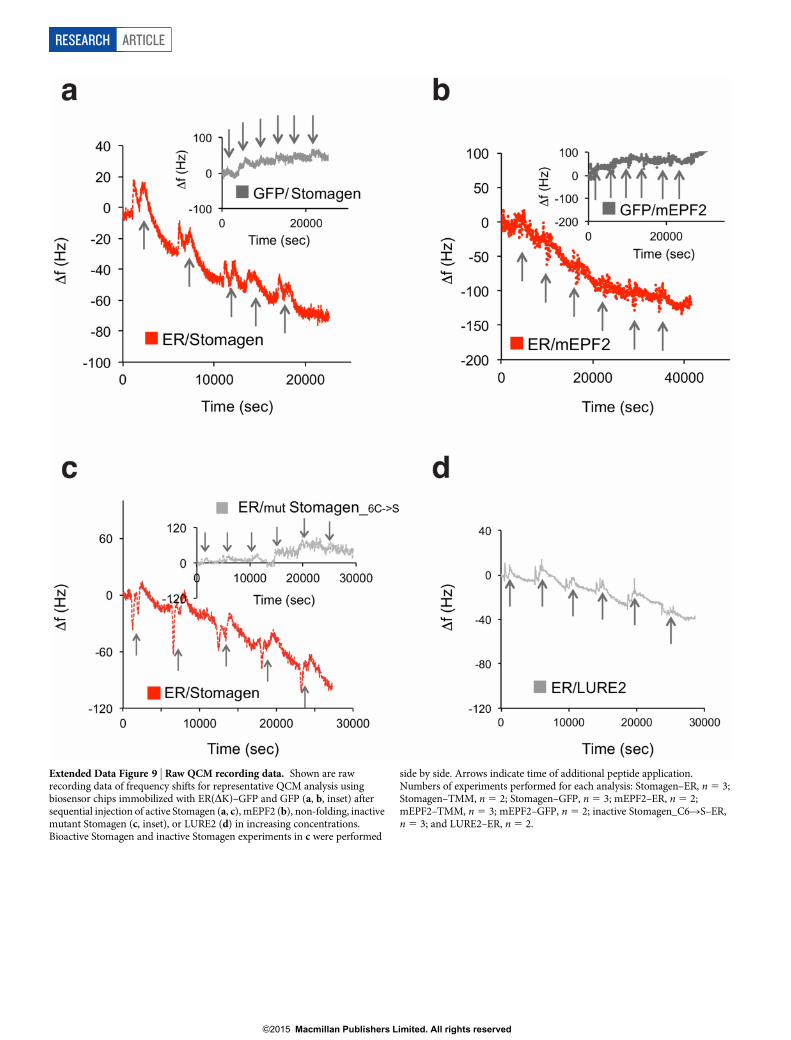
Extended Data Figure 9 | Raw QCM recording data. Shown are rawrecording data of frequency shifts for representative QCM analysis usingbiosensor chips immobilized with ER(DK)–GFP and GFP (a, b, inset) aftersequential injection of active Stomagen (a, c), mEPF2 (b), non-folding, inactivemutant Stomagen (c, inset), or LURE2 (d) in increasing concentrations.Bioactive Stomagen and inactive Stomagen experiments in c were performed
side by side. Arrows indicate time of additional peptide application.Numbers of experiments performed for each analysis: Stomagen–ER, n 5 3;Stomagen–TMM, n 5 2; Stomagen–GFP, n 5 3; mEPF2–ER, n 5 2;mEPF2–TMM, n 5 3; mEPF2–GFP, n 5 2; inactive Stomagen_C6RS–ER,n 5 3; and LURE2–ER, n 5 2.
RESEARCH ARTICLE
G2015 Macmillan Publishers Limited. All rights reserved
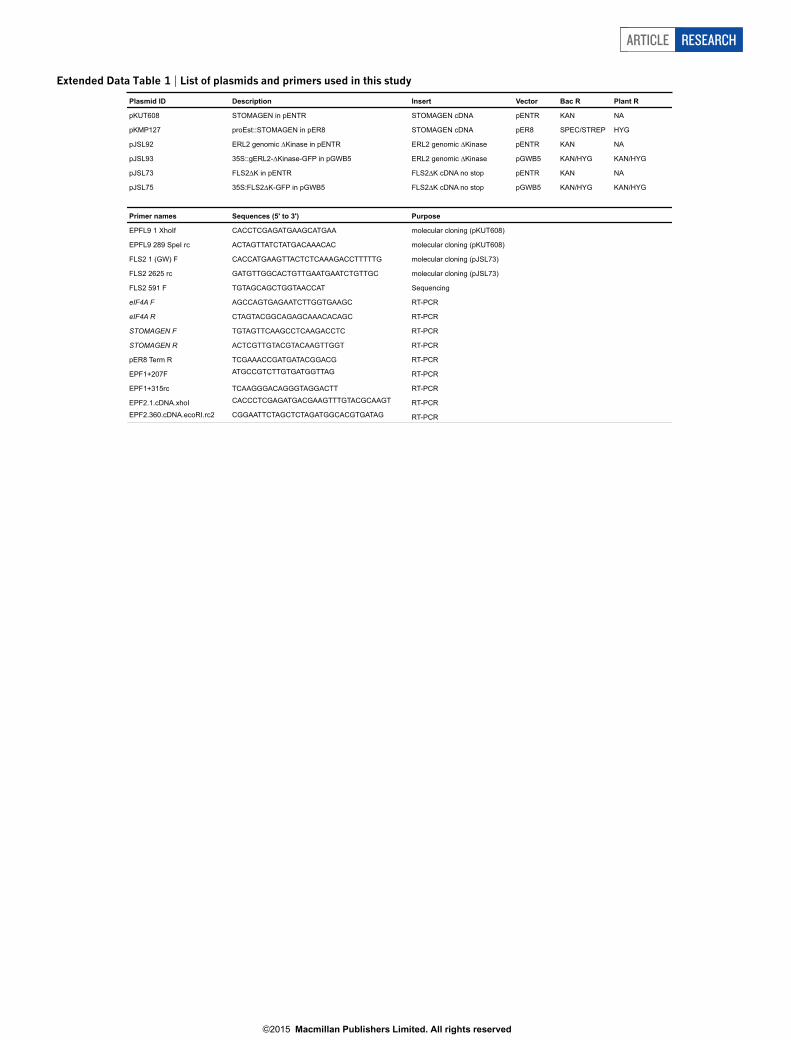
Extended Data Table 1 | List of plasmids and primers used in this study
Plasmid ID Description Insert Vector Bac R Plant R
pKUT608 STOMAGEN in pENTR STOMAGEN cDNA pENTR KAN NA
pKMP127 proEst::STOMAGEN in pER8 STOMAGEN cDNA pER8 SPEC/STREP HYG
pJSL92 ERL2 genomic Kinase in pENTR ERL2 genomic Kinase pENTR KAN NA
pJSL93 35S::gERL2- Kinase-GFP in pGWB5 ERL2 genomic Kinase pGWB5 KAN/HYG KAN/HYG
pJSL73 FLS2 K in pENTR FLS2 K cDNA no stop pENTR KAN NA
pJSL75 35S:FLS2 K-GFP in pGWB5 FLS2 K cDNA no stop pGWB5 KAN/HYG KAN/HYG
Primer names Sequences (5' to 3') Purpose
EPFL9 1 XhoIf CACCTCGAGATGAAGCATGAA molecular cloning (pKUT608)
EPFL9 289 SpeI rc ACTAGTTATCTATGACAAACAC molecular cloning (pKUT608)
FLS2 1 (GW) F CACCATGAAGTTACTCTCAAAGACCTTTTTG molecular cloning (pJSL73)
FLS2 2625 rc GATGTTGGCACTGTTGAATGAATCTGTTGC molecular cloning (pJSL73)
FLS2 591 F TGTAGCAGCTGGTAACCAT Sequencing
eIF4A F AGCCAGTGAGAATCTTGGTGAAGC RT-PCR
eIF4A R CTAGTACGGCAGAGCAAACACAGC RT-PCR
STOMAGEN F TGTAGTTCAAGCCTCAAGACCTC RT-PCR
STOMAGEN R ACTCGTTGTACGTACAAGTTGGT RT-PCR
pER8 Term R TCGAAACCGATGATACGGACG RT-PCR
EPF1+207F ATGCCGTCTTGTGATGGTTAG RT-PCR
EPF1+315rc TCAAGGGACAGGGTAGGACTT RT-PCR
EPF2.1.cDNA.xhoI CACCCTCGAGATGACGAAGTTTGTACGCAAGT RT-PCREPF2.360.cDNA.ecoRI.rc2 CGGAATTCTAGCTCTAGATGGCACGTGATAG RT-PCR
ARTICLE RESEARCH
G2015 Macmillan Publishers Limited. All rights reserved


![Review Article Physiological Implications of Hydrogen ...downloads.hindawi.com/journals/omcl/2015/397502.pdf · oxide (NO) during ethylene-induced stomatal closure [ ]. However, the](https://img.pdfslide.us/doc/110x75/601ecbb10ea61746707bd3c0/review-article-physiological-implications-of-hydrogen-oxide-no-during-ethylene-induced.jpg)


![Stomatal Defense a Decade Later1[OPEN] - Plant Physiology · Update on Stomatal Defense Stomatal Defense a Decade Later1[OPEN] Maeli Melotto*, Li Zhang, Paula R. Oblessuc, and Sheng](https://img.pdfslide.us/doc/110x75/5eddc0a3ad6a402d6668efaa/stomatal-defense-a-decade-later1open-plant-update-on-stomatal-defense-stomatal.jpg)