Embed Size (px)
Citation preview
MORGAN STANLEY INDIA COMPANY PRIVATE LIMITED+
Sameer Baisiwala, CFA+91 22 6118-2214
Vaibhav Dusad+91 22 6118-2215
Biocon Ltd ( BION.NS, BIOS IN )
India Healthcare / India
Stock RatingStock Rating OverweightOverweightIndustry ViewIndustry View In-LineIn-LinePrice target Rs622.00Up/downside to price target (%) 26Shr price, close (Apr 4, 2016) Rs492.0052-Week Range Rs544.55-395.30Sh out, dil, curr (mn) 200Mkt cap, curr (mn) Rs98,400EV, curr (mn) Rs98,750Avg daily trading value (mn) Rs270
Fiscal Year Ending 03/15 03/16e 03/17e 03/18e
ModelWare EPS (Rs) 19.62 22.10 24.79 29.63Prior ModelWare EPS(Rs)
- 22.10 24.79 29.64
Consensus EPS (Rs)§ 19.74 22.42 25.60 30.30Revenue, net (Rs mn) 30,898 35,054 40,176 46,939EBITDA (Rs mn) 6,958 7,872 8,799 10,308ModelWare net inc (Rsmn)
3,923 4,420 4,958 5,926
P/E 23.9 21.9 19.8 16.6P/BV 2.9 2.7 2.5 2.3RNOA (%) 13.1 10.4 10.0 10.9ROE (%) 13.0 13.5 13.8 15.1EV/EBITDA 13.5 12.6 11.6 9.8Div yld (%) 1.1 1.0 1.4 1.6FCF yld ratio (%) (6.7) (2.1) (1.6) 0.2Leverage (EOP) (%) (4.2) 1.4 4.2 1.8Unless otherwise noted, all m etrics are based on Morgan Stanley ModelWare fram ework§ = Consensus data is provided by Thom son Reuters Estim atese = Morgan Stanley Research estim ates
Industry ViewIn-Line
Stock RatingOverweight
Price TargetRs622.00
Biocon LtdBiocon LtdApril 5, 2016
Asia Insight: Ushering in the Decade ofBiosimilars; Upgrade to OW
2016 could be a turning point for BIOS. Four potential productfilings each in the US and EU would add credibility to its pipeline andbring market recognition. EM monetization is under way, but the USand EU opportunities will take at least two years. Our Rs622 PT is 21xour F18 EPS estimates.
What's Changed?What's Changed? FromFrom ToTo
Biocon LtdBiocon LtdRating Underweight OverweightPrice Target Rs459.00 Rs622.00
When should markets start paying for its pipeline? Now, in our view –Although the global biosimilar story has more questions than answers at thispoint, these will be addressed by market forces, regulators and courts in theyears to come. In the meantime, we see BIOS as a strong re-rating story giventhat markets have hardly priced in its biosimilar pipeline (19.8x F17e EPS,which is mostly its non-biosimilar base business). We have a detailed valuationcase study in this report – Celltrion (up ten-fold in seven years to a US$10bnmarket cap on a 40-50x P/E) – and compared it to BIOS, with a current marketcap of US$1.4bn. The comparison is relevant to assessing when markets startto discount the bio-similar pipeline.
Value in the pipeline – Our analysis suggests that each of the four leadcompounds of BIOS (and its partner Mylan) ranks among a handful ofcompounds with a good chance of a US and EU launch in the first wave ofmarket formation over the next four to five years (filings in 2016). These areglargine, trastuzumab, pegfilgrastim, and adalimumab. By 2020, we estimateUS$244mn (and growing) revenues (BIOS's share), which, at 30% margins,implies a doubling of current profits. Plus, BIOS has a follow-on pipeline ofanother five products in early stages which together give growth visibility overthe longer term.
How about risks? There are several to biosimilar upside, but not much tostock price, we believe, since the growing base business should support thecurrent stock price. Plus, BIOS has several opportunities for success, in ourview,with multiple biosimilar products and multiple geographies. Nonetheless,key risks to our thesis include regulatory setbacks (three out of four Phase 3trials are non-US), legal delays, innovator strategies (for example, shifts to new,improved products), and market challenges.
Morgan Stanley does and seeks to do business withcompanies covered in Morgan Stanley Research. As a result,investors should be aware that the firm may have a conflictof interest that could affect the objectivity of MorganStanley Research. Investors should consider MorganStanley Research as only a single factor in making theirinvestment decision.For analyst certification and other important disclosures,For analyst certification and other important disclosures,refer to the Disclosure Section, located at the end of thisrefer to the Disclosure Section, located at the end of thisreport.report.+ = An alysts emp loyed by n on -U .S. a ff ilia tes are n o t reg istered w ith F INRA, mayn o t be associated person s o f th e member an d may n o t be su b ject to NASD/NYSErestriction s on commu n ication s w ith a su b ject compan y, pu b lic appearan ces an dtrad in g secu rities h eld by a research an alyst accou n t.
| April 5, 2016Biocon Ltd
1
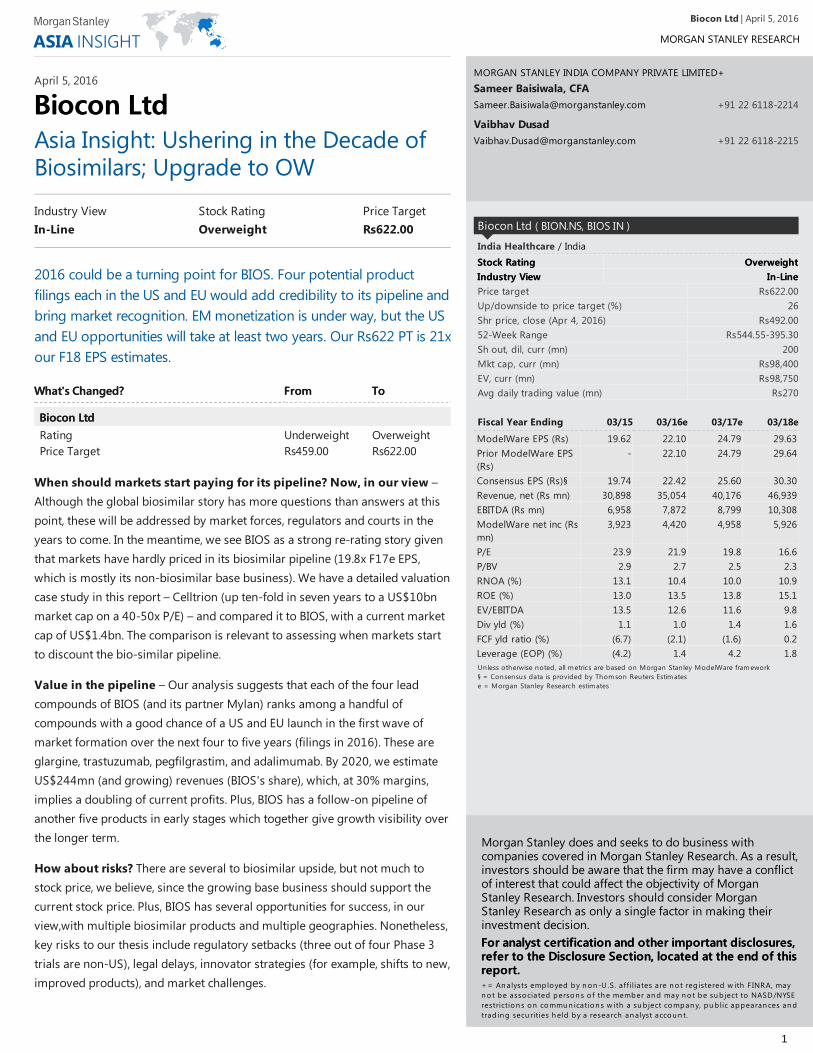
Price Target Rs 622 Base-case scenario, P/E multiple.
Bull Rs759Sum of the parts
Biosimilars monetization in DM/EM markets: Stronger basebusiness (Rs31/share), clinical progression of five follow-onbiosimilars to Phase 3 trials (Rs44/share), monetization of globalbiosimilars in EU/US (Rs62/share), which could enrich valuations.
Base Rs 622P/E multiple
US/EU biosimilar filings and gradual base business ramp-up:15.2% sales growth for the base business and 11.7% earningsgrowth during F2015-17e. We apply a P/E of 21x to our FY18 EPSestimate of Rs29.6.
Bear Rs434Sum of the parts
Commoditization of base business: Setback in core business(Rs62/share), clinical trials setback (Rs44/share) and regulatorydelay/commercialization challenges for biosimilars in the EU/US(Rs83/share).
Investment ThesisInvestment Thesis
Unlocking value in its global biosimilar pipeline anda steadily growing base business should presentvalue in the stock, trading at 19.8x F17e EPS,implying a 15-20% discount to the sector.
Longer term, Biocon is positioning itself as a keybiotech player in both the biosimilar andproprietary segments – human insulin,trastuzumab, glargine, and adalimumab arenearing Phase 3 completion.
We rate the shares OW relative to our coveragebecause of Bios's differentiated underlyingbiosimilars business and no pending FDA issues.
Key Value DriversKey Value Drivers
Acceptance of Bios's BLA filings
EU/EM approval and launch of glargine,trastusumab and pegGCSF
Indication extrapolation for adalimumab in EU/EM
Positive US FDA review/acceptance of trastuzumabfilings for early breast cancer
Potential CatalystsPotential Catalysts
Global biosimilar filings – glargine, trastuzumab,peg-GCSF, adalimumab
Favorable court outcome for peg GCSF biosimilarsfilers – Sandoz and Apotex versus Amgen
Drug filings, approvals and commercialization –Malaysia facility for EM/DM
Clinical progress of early stage biosimilarcandidates (etanercept, bevacizumab, filgrastim)and insulins (lispro, aspart, Rh) to Phase 3 trials
US FDA approval (indication extrapolation) forinfliximab (Celltrion)
Base business progress – US ANDA filings,Syngene ramp-up
Risks to Achieving Price TargetRisks to Achieving Price Target
Delay in launch of four key biosimilars in US/EUdue to regulatory or legal challenges
Innovator switching the patients to new brands oralternative therapies
Higher-than-expected competition in developedand emerging markets
No indication extrapolation for adalimumab ortrastusumab in DM/EM markets
Low utilization of Malaysian facility
Risk RewardRisk Reward
US/EM biosimilars filings to be the key re-rating driver
Sou rce: Th omson Reu ters, Morgan Stan ley Research .
Exhibit 1:Exhibit 1: Bear to Bull Case
Sou rce: Th omson Reu ters, Morgan Stan ley Research scen ario s.
| April 5, 2016Biocon Ltd
2

| April 5, 2016Biocon Ltd
3
FinancialsFinancials
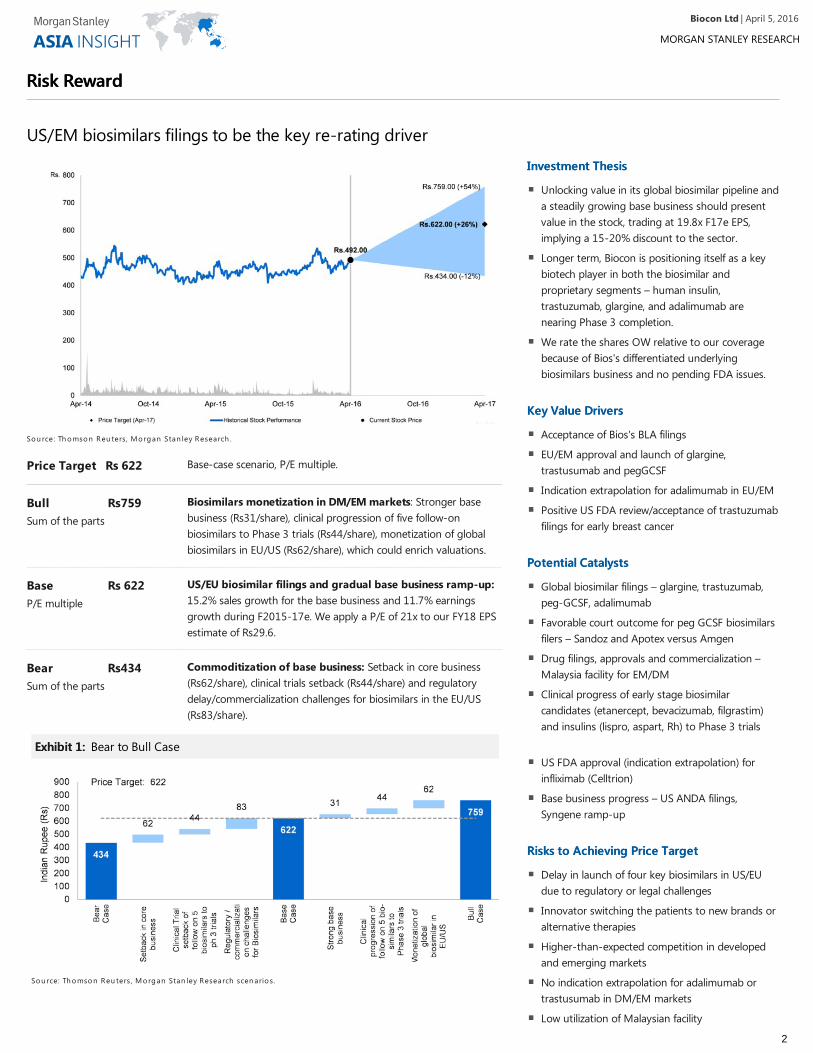
Exhibit 2:Exhibit 2: Financials
Sou rce: Compan y data , Morgan Stan ley Research estimates
| April 5, 2016Biocon Ltd
4
Investment ThesisInvestment Thesis
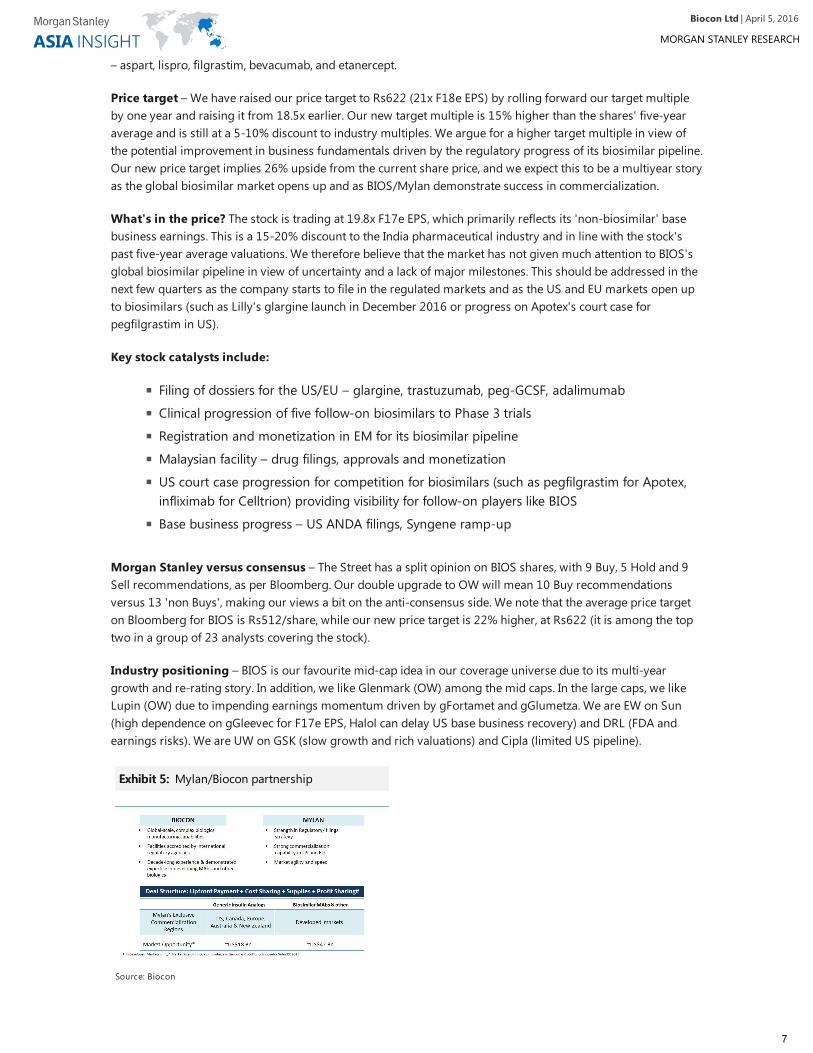
Biocon's current business profile – BIOS's current business includes bio-pharmaceuticals (statins, immuno-suppressants, etcetera), branded formulations in India, contract research (73% owned listed subsidiary, Syngene– US$1.2bn market cap), and some biosimilar business in emerging markets (insulin, glargine, etcetera). Thecompany's nine-month annualized sales for F16 are Rs35bn with a net profit of Rs4.3bn. We estimate low- tomid-teens growth for Biocon's base business over the next couple of years. In addition, it is developing a globalbiosimilar pipeline in partnership with Mylan (covered by David Risinger).
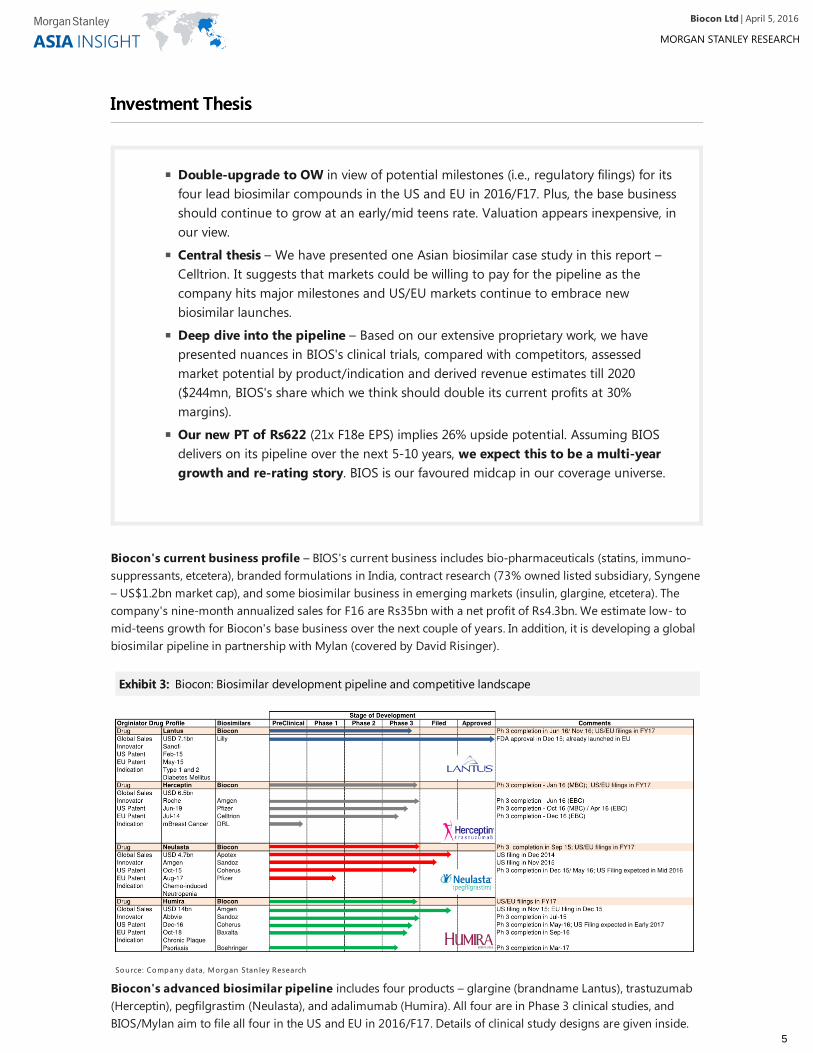
Biocon's advanced biosimilar pipeline includes four products – glargine (brandname Lantus), trastuzumab(Herceptin), pegfilgrastim (Neulasta), and adalimumab (Humira). All four are in Phase 3 clinical studies, andBIOS/Mylan aim to file all four in the US and EU in 2016/F17. Details of clinical study designs are given inside.
Double-upgrade to OW in view of potential milestones (i.e., regulatory filings) for itsfour lead biosimilar compounds in the US and EU in 2016/F17. Plus, the base businessshould continue to grow at an early/mid teens rate. Valuation appears inexpensive, inour view.
Central thesis – We have presented one Asian biosimilar case study in this report –Celltrion. It suggests that markets could be willing to pay for the pipeline as thecompany hits major milestones and US/EU markets continue to embrace newbiosimilar launches.
Deep dive into the pipeline – Based on our extensive proprietary work, we havepresented nuances in BIOS's clinical trials, compared with competitors, assessedmarket potential by product/indication and derived revenue estimates till 2020($244mn, BIOS's share which we think should double its current profits at 30%margins).
Our new PT of Rs622 (21x F18e EPS) implies 26% upside potential. Assuming BIOSdelivers on its pipeline over the next 5-10 years, we expect this to be a multi-yeargrowth and re-rating story. BIOS is our favoured midcap in our coverage universe.
Exhibit 3:Exhibit 3: Biocon: Biosimilar development pipeline and competitive landscape
Sou rce: Compan y data , Morgan Stan ley Research
| April 5, 2016Biocon Ltd
5
We note that they have done Phase 3 in the US only for glargine, while the others are being done in the EU andemerging markets (though Phase 1 for a few have been done in the US). We also note that a couple ofcompetitors are also following the same trials strategy. The tie-up with Mylan is on a cost- and sales- (royalty)sharing basis. We have assumed a one-third share for Biocon in the US/EU markets, while it retains full upsidefrom EM launches.
Competitive positioning of pipeline – Please see ExhibitExhibit33We have compared Biocon's Phase 3 progress withother competing players. Overall, we believe that BIOS/Mylan should be among the first wave of launches in theUS and EU markets for these products, implying reasonable economics. Also, the competitive intensity doesn’tappear too high, with three competing products for glargine (including BIOS), five for trastuzumab, four forpegfilgrastim, and seven for adalimumab. EU launches can start in 2018 (subject to patent/SPC expiries) givenlimited legal barriers. We expect US launches will get delayed in view of potential patent court cases, 180-daypatent dance, 30 months NDA (new drug application) stay, etc. We assume US launches from 2019 onwards.
What's the bottom line? We detail our product and market assumptions and estimates later in the report. Ingeneral, we assume 65-70% price erosion and up to 10% market share in the two or three years after launch foreach of these products in the US/EU markets. This is based on a few recent instances of biosimilar launches inEU/EMs with 20-60% erosion (such as infliximab, glargine, filgrastim). Plus, this takes into account thatBIOS/Mylan would likely be the third to fifth launch in most of these products (trastu could be earlier).
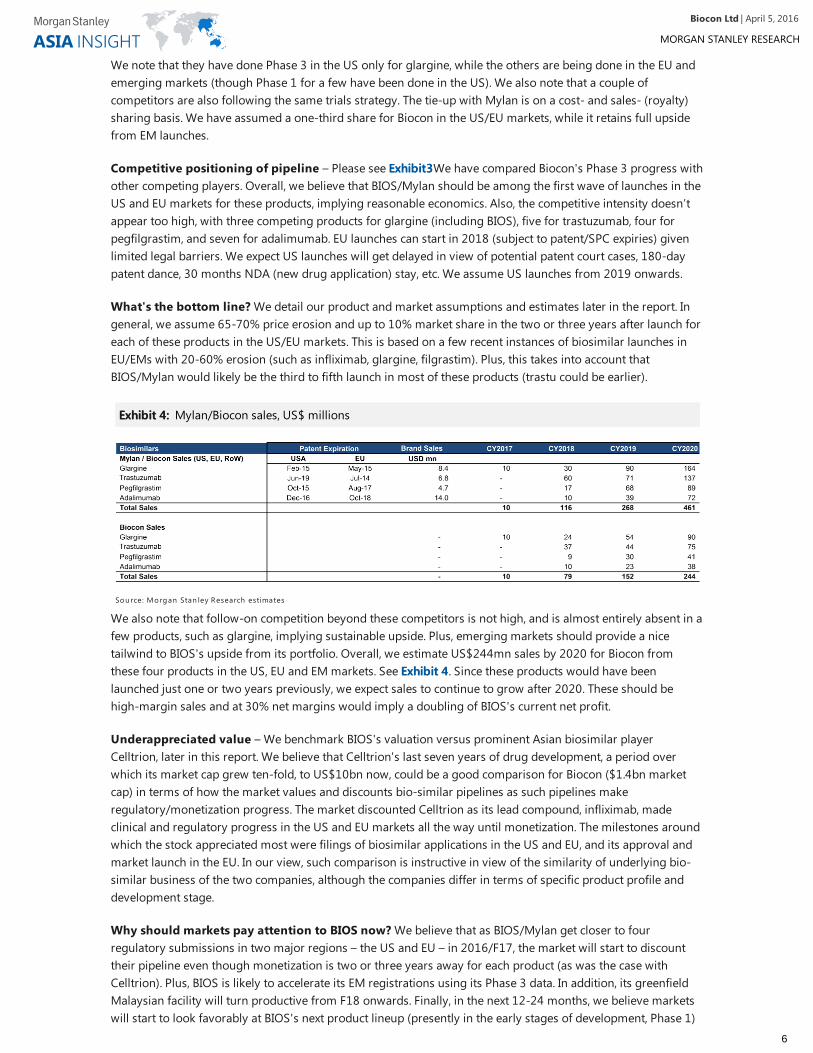
We also note that follow-on competition beyond these competitors is not high, and is almost entirely absent in afew products, such as glargine, implying sustainable upside. Plus, emerging markets should provide a nicetailwind to BIOS's upside from its portfolio. Overall, we estimate US$244mn sales by 2020 for Biocon fromthese four products in the US, EU and EM markets. See Exhibit 4Exhibit 4. Since these products would have beenlaunched just one or two years previously, we expect sales to continue to grow after 2020. These should behigh-margin sales and at 30% net margins would imply a doubling of BIOS's current net profit.
Underappreciated value – We benchmark BIOS's valuation versus prominent Asian biosimilar playerCelltrion, later in this report. We believe that Celltrion's last seven years of drug development, a period overwhich its market cap grew ten-fold, to US$10bn now, could be a good comparison for Biocon ($1.4bn marketcap) in terms of how the market values and discounts bio-similar pipelines as such pipelines makeregulatory/monetization progress. The market discounted Celltrion as its lead compound, infliximab, madeclinical and regulatory progress in the US and EU markets all the way until monetization. The milestones aroundwhich the stock appreciated most were filings of biosimilar applications in the US and EU, and its approval andmarket launch in the EU. In our view, such comparison is instructive in view of the similarity of underlying bio-similar business of the two companies, although the companies differ in terms of specific product profile anddevelopment stage.
Why should markets pay attention to BIOS now? We believe that as BIOS/Mylan get closer to fourregulatory submissions in two major regions – the US and EU – in 2016/F17, the market will start to discounttheir pipeline even though monetization is two or three years away for each product (as was the case withCelltrion). Plus, BIOS is likely to accelerate its EM registrations using its Phase 3 data. In addition, its greenfieldMalaysian facility will turn productive from F18 onwards. Finally, in the next 12-24 months, we believe marketswill start to look favorably at BIOS's next product lineup (presently in the early stages of development, Phase 1)
Exhibit 4:Exhibit 4: Mylan/Biocon sales, US$ millions
Sou rce: Morgan Stan ley Research estimates
| April 5, 2016Biocon Ltd
6
– aspart, lispro, filgrastim, bevacumab, and etanercept.
Price target – We have raised our price target to Rs622 (21x F18e EPS) by rolling forward our target multipleby one year and raising it from 18.5x earlier. Our new target multiple is 15% higher than the shares' five-yearaverage and is still at a 5-10% discount to industry multiples. We argue for a higher target multiple in view ofthe potential improvement in business fundamentals driven by the regulatory progress of its biosimilar pipeline.Our new price target implies 26% upside from the current share price, and we expect this to be a multiyear storyas the global biosimilar market opens up and as BIOS/Mylan demonstrate success in commercialization.
What's in the price? The stock is trading at 19.8x F17e EPS, which primarily reflects its 'non-biosimilar' basebusiness earnings. This is a 15-20% discount to the India pharmaceutical industry and in line with the stock'spast five-year average valuations. We therefore believe that the market has not given much attention to BIOS'sglobal biosimilar pipeline in view of uncertainty and a lack of major milestones. This should be addressed in thenext few quarters as the company starts to file in the regulated markets and as the US and EU markets open upto biosimilars (such as Lilly's glargine launch in December 2016 or progress on Apotex's court case forpegfilgrastim in US).
Key stock catalysts include:
Morgan Stanley versus consensus – The Street has a split opinion on BIOS shares, with 9 Buy, 5 Hold and 9Sell recommendations, as per Bloomberg. Our double upgrade to OW will mean 10 Buy recommendationsversus 13 'non Buys', making our views a bit on the anti-consensus side. We note that the average price targeton Bloomberg for BIOS is Rs512/share, while our new price target is 22% higher, at Rs622 (it is among the toptwo in a group of 23 analysts covering the stock).
Industry positioning – BIOS is our favourite mid-cap idea in our coverage universe due to its multi-yeargrowth and re-rating story. In addition, we like Glenmark (OW) among the mid caps. In the large caps, we likeLupin (OW) due to impending earnings momentum driven by gFortamet and gGlumetza. We are EW on Sun(high dependence on gGleevec for F17e EPS, Halol can delay US base business recovery) and DRL (FDA andearnings risks). We are UW on GSK (slow growth and rich valuations) and Cipla (limited US pipeline).
Filing of dossiers for the US/EU – glargine, trastuzumab, peg-GCSF, adalimumab
Clinical progression of five follow-on biosimilars to Phase 3 trials
Registration and monetization in EM for its biosimilar pipeline
Malaysian facility – drug filings, approvals and monetization
US court case progression for competition for biosimilars (such as pegfilgrastim for Apotex,infliximab for Celltrion) providing visibility for follow-on players like BIOS
Base business progress – US ANDA filings, Syngene ramp-up
Exhibit 5:Exhibit 5: Mylan/Biocon partnership
Source: Biocon
| April 5, 2016Biocon Ltd
7
Central Debate – Central Debate – When Will the Market Start Paying for Biocon's GlobalWhen Will the Market Start Paying for Biocon's GlobalBiosimilar Pipeline?Biosimilar Pipeline?
Case studyCase study
Biocon has been investing in its global biosimilar pipeline for the past few years. However, so far themarket has valued the company for its base business comprising APIs (statins, insulin, immuno-suppressants),contract research (73.5% owned listed subsidiary, Syngene), and domestic branded formulations. The stockcurrently trades at 19.8x F17e EPS (a 15% discount to the industry), which primarily reflects base businessearnings.
Why have the markets not paid attention to BIOS's global biosimilar pipeline? We believe it is for thefollowing reasons:
1) So far, BIOS has been in the investing phase in terms of research spend on global trials and capex for itsglargine facility in Malaysia. No major milestone has been announced by the company
2) It has had limited success in commercialization of its biosimilar assets, predominantly in less lucrative EMs.Developed-market monetization is still at least two to three years away
3) Major milestones, such as dossier submissions, approvals, patent challenge court cases, and launches, havenot been achieved for any of its four leading biosimilar assets
4) The US/EU biosimilar ecosystem has been uncertain up until recently in terms of regulatory approvals, patentestate and intellectual property court cases, substitutability, indication extrapolation, etcetera.
What is different now? We believe that BIOS will transition from the development stage (2008-15) for its leadcompounds to the advanced regulatory and monetization stage over the next five years (2016-20). This is animportant transition and is the one, we believe, that will be valued by investors as BIOS hits major milestones.We expect 2016 to be the transformational year for BIOS, if it succeeds in filing four dossiers in the US and EUmarkets each. We cite the following key developments which should change perceptions about BIOS and spurthe market to start paying for its pipeline.
1) Both BIOS and Mylan have highlighted potential US and EU filings for all four lead compounds in F17/2016.This will also be accompanied by filings in several EMs.
2) Clinicaltrials.gov indicate completion of Phase 3 studies for glargine, trastuzumab, peg GCSF, andadalimumab in June/November 2016, January 2016 , Sep 2015 and 2016/17 – all of which are consistent withmanagement expectations of C16/F17 filing timelines. Though we note that it is doing US-based studies only forglargine, the rest all are global (ex US) Phase 3 trials.
3) Several precedents will be set by other companies in their run-up to biosimilar monetization, providing clarityfor the evolution of BIOS's pipeline. In particular, we cite the potential glargine launch in the US by Lilly inDecember 2016 (settled with Sanofi), pending US approval for Celltrion's infliximab, and the progression of theApotex court case for peg-GCSF in the US (see following sections with details on each assets).
4) BIOS commissioning of its US$200m greenfield glargine facility in Malaysia and its qualification by severalglobal regulatory agencies in F2016-17.
5) Validation of BIOS's pipeline in view of its partnership with Mylan and their matching guidance on regulatoryprogress.
Celltrion Case Study – We detail below a case study on Celltrion, Korea– to illustrate how markets have valued
| April 5, 2016Biocon Ltd
8
this company as its global biosimilar pipeline made regulatory progress over the past few years. We note thatthere are several differences between the two – Celltrion and Biocon – in terms of products under development,regulatory progress achieved, competitive dynamics, business plan, commercial upside, et cetera. However, inour view, the broader comparison between the two is relevant and apt for the purpose of identifying inflectionpoints and benchmarking BIOS.
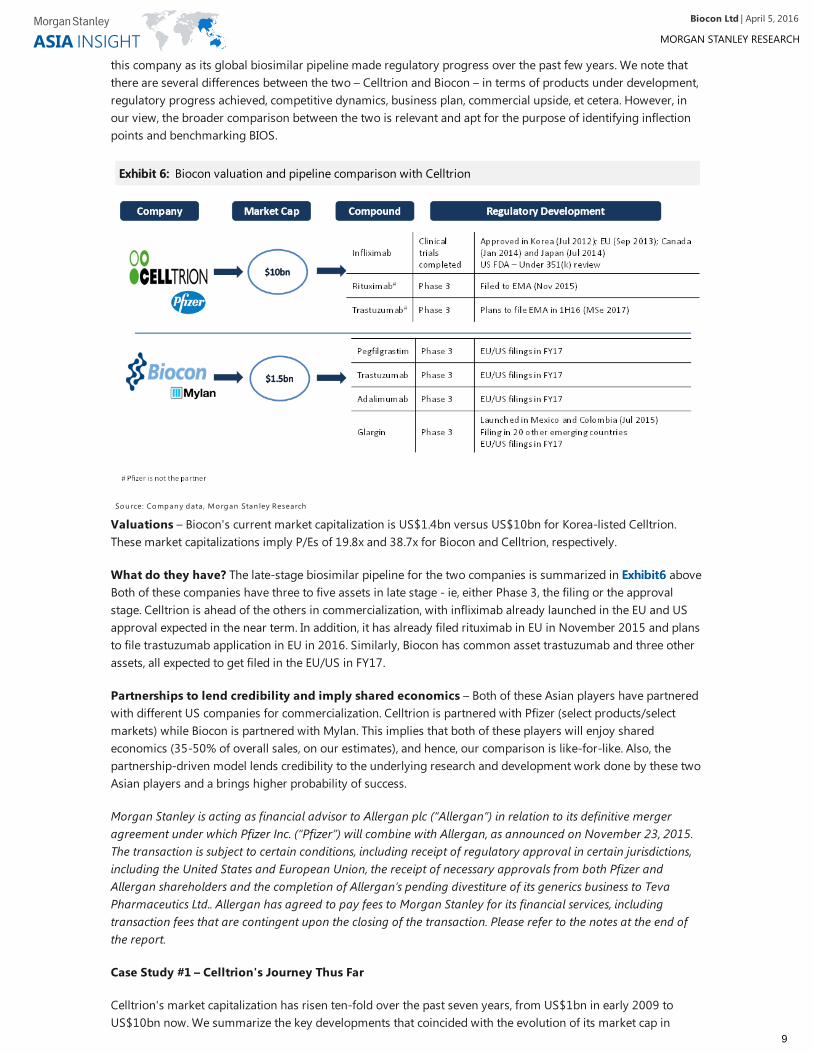
Valuations – Biocon's current market capitalization is US$1.4bn versus US$10bn for Korea-listed Celltrion.These market capitalizations imply P/Es of 19.8x and 38.7x for Biocon and Celltrion, respectively.
What do they have? The late-stage biosimilar pipeline for the two companies is summarized in ExhibitExhibit66 aboveBoth of these companies have three to five assets in late stage - ie, either Phase 3, the filing or the approvalstage. Celltrion is ahead of the others in commercialization, with infliximab already launched in the EU and USapproval expected in the near term. In addition, it has already filed rituximab in EU in November 2015 and plansto file trastuzumab application in EU in 2016. Similarly, Biocon has common asset trastuzumab and three otherassets, all expected to get filed in the EU/US in FY17.
Partnerships to lend credibility and imply shared economics – Both of these Asian players have partneredwith different US companies for commercialization. Celltrion is partnered with Pfizer (select products/selectmarkets) while Biocon is partnered with Mylan. This implies that both of these players will enjoy sharedeconomics (35-50% of overall sales, on our estimates), and hence, our comparison is like-for-like. Also, thepartnership-driven model lends credibility to the underlying research and development work done by these twoAsian players and a brings higher probability of success.
Morgan Stanley is acting as financial advisor to Allergan plc (“Allergan”) in relation to its definitive mergeragreement under which Pfizer Inc. (“Pfizer”) will combine with Allergan, as announced on November 23, 2015.The transaction is subject to certain conditions, including receipt of regulatory approval in certain jurisdictions,including the United States and European Union, the receipt of necessary approvals from both Pfizer andAllergan shareholders and the completion of Allergan’s pending divestiture of its generics business to TevaPharmaceutics Ltd.. Allergan has agreed to pay fees to Morgan Stanley for its financial services, includingtransaction fees that are contingent upon the closing of the transaction. Please refer to the notes at the end ofthe report.
Case Study #1 – Celltrion's Journey Thus Far
Celltrion's market capitalization has risen ten-fold over the past seven years, from US$1bn in early 2009 toUS$10bn now. We summarize the key developments that coincided with the evolution of its market cap in
Exhibit 6:Exhibit 6: Biocon valuation and pipeline comparison with Celltrion
Sou rce: Compan y data , Morgan Stan ley Research
| April 5, 2016Biocon Ltd
9
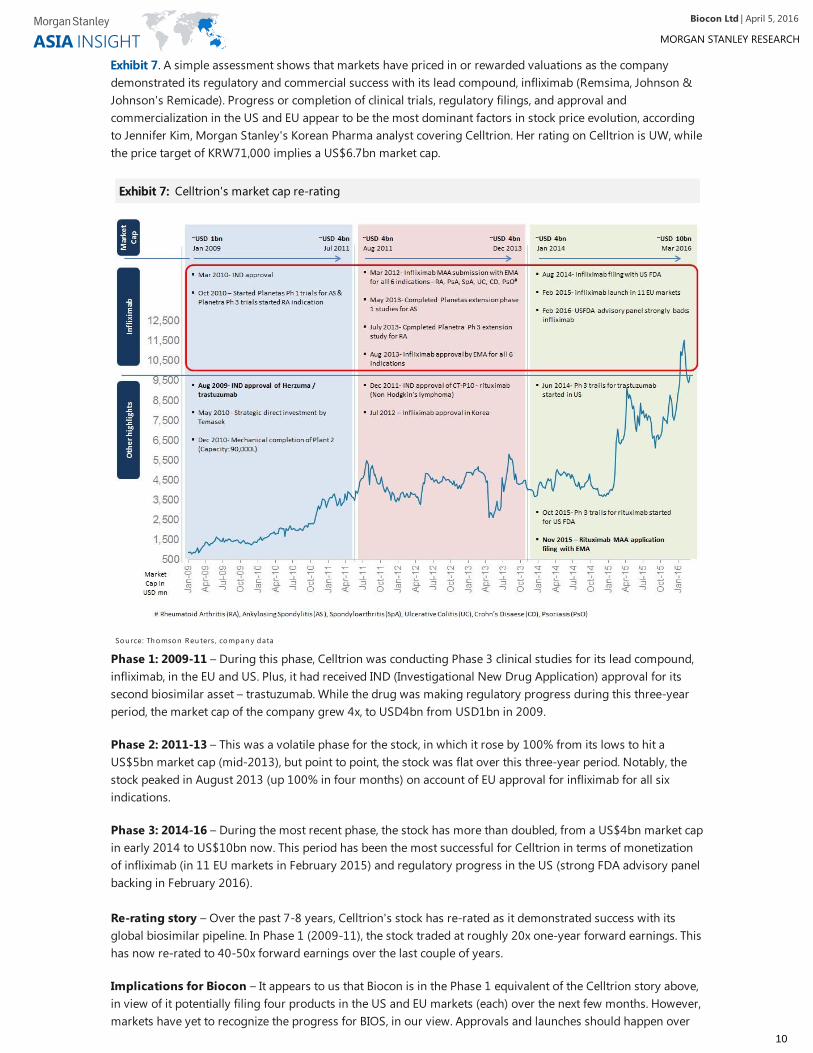
Exhibit 7Exhibit 7. A simple assessment shows that markets have priced in or rewarded valuations as the companydemonstrated its regulatory and commercial success with its lead compound, infliximab (Remsima, Johnson &Johnson's Remicade). Progress or completion of clinical trials, regulatory filings, and approval andcommercialization in the US and EU appear to be the most dominant factors in stock price evolution, accordingto Jennifer Kim, Morgan Stanley's Korean Pharma analyst covering Celltrion. Her rating on Celltrion is UW, whilethe price target of KRW71,000 implies a US$6.7bn market cap.
Phase 1: 2009-11 – During this phase, Celltrion was conducting Phase 3 clinical studies for its lead compound,infliximab, in the EU and US. Plus, it had received IND (Investigational New Drug Application) approval for itssecond biosimilar asset – trastuzumab. While the drug was making regulatory progress during this three-yearperiod, the market cap of the company grew 4x, to USD4bn from USD1bn in 2009.
Phase 2: 2011-13 – This was a volatile phase for the stock, in which it rose by 100% from its lows to hit aUS$5bn market cap (mid-2013), but point to point, the stock was flat over this three-year period. Notably, thestock peaked in August 2013 (up 100% in four months) on account of EU approval for infliximab for all sixindications.
Phase 3: 2014-16 – During the most recent phase, the stock has more than doubled, from a US$4bn market capin early 2014 to US$10bn now. This period has been the most successful for Celltrion in terms of monetizationof infliximab (in 11 EU markets in February 2015) and regulatory progress in the US (strong FDA advisory panelbacking in February 2016).
Re-rating story – Over the past 7-8 years, Celltrion's stock has re-rated as it demonstrated success with itsglobal biosimilar pipeline. In Phase 1 (2009-11), the stock traded at roughly 20x one-year forward earnings. Thishas now re-rated to 40-50x forward earnings over the last couple of years.
Implications for Biocon – It appears to us that Biocon is in the Phase 1 equivalent of the Celltrion story above,in view of it potentially filing four products in the US and EU markets (each) over the next few months. However,markets have yet to recognize the progress for BIOS, in our view. Approvals and launches should happen over
Exhibit 7:Exhibit 7: Celltrion's market cap re-rating
Sou rce: Th omson Reu ters, compan y data
| April 5, 2016Biocon Ltd
10
the next 2-4 years, we estimate. Biocon is presently valued at a US$1.4bn market capitalization versus roughlyUS$4bn for Celltrion during Phase 2 above.
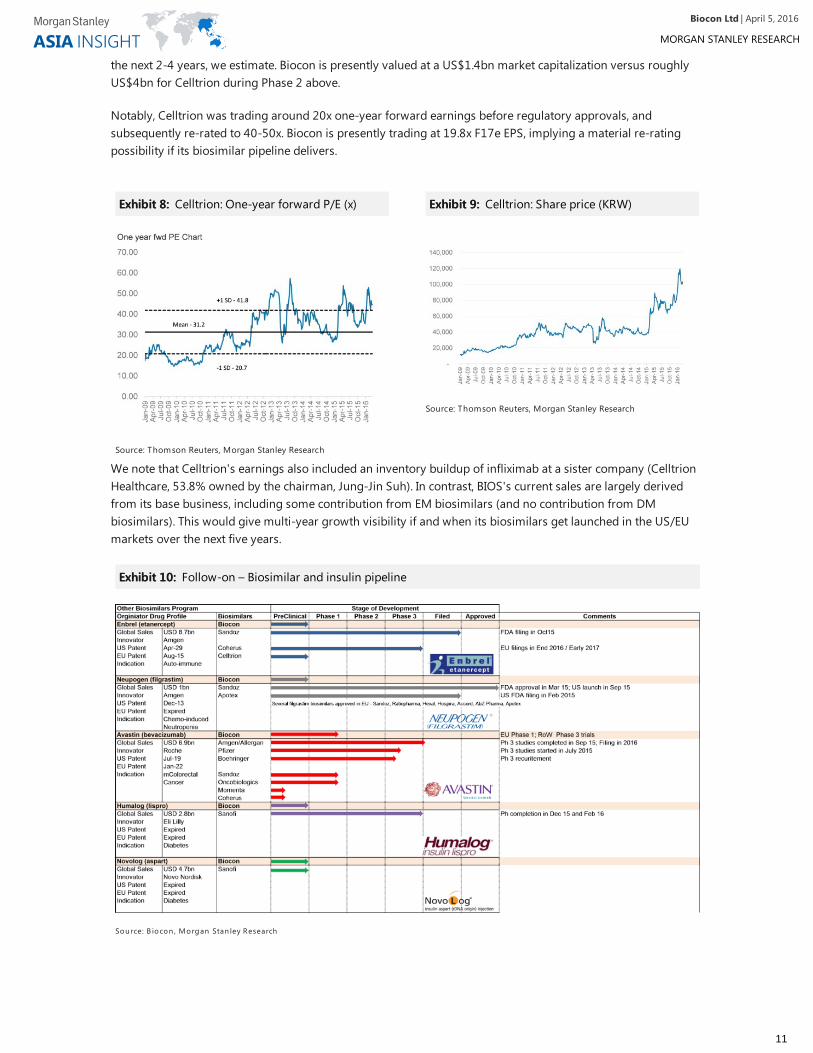
Notably, Celltrion was trading around 20x one-year forward earnings before regulatory approvals, andsubsequently re-rated to 40-50x. Biocon is presently trading at 19.8x F17e EPS, implying a material re-ratingpossibility if its biosimilar pipeline delivers.
We note that Celltrion's earnings also included an inventory buildup of infliximab at a sister company (CelltrionHealthcare, 53.8% owned by the chairman, Jung-Jin Suh). In contrast, BIOS's current sales are largely derivedfrom its base business, including some contribution from EM biosimilars (and no contribution from DMbiosimilars). This would give multi-year growth visibility if and when its biosimilars get launched in the US/EUmarkets over the next five years.
Exhibit 8:Exhibit 8: Celltrion: One-year forward P/E (x)
Source: Thomson Reuters, Morgan Stanley Research
Exhibit 9:Exhibit 9: Celltrion: Share price (KRW)
Source: Thomson Reuters, Morgan Stanley Research
Exhibit 10:Exhibit 10: Follow-on – Biosimilar and insulin pipeline
Sou rce: B iocon , Morgan Stan ley Research
| April 5, 2016Biocon Ltd
11
Deep Dive into the Pipeline Deep Dive into the Pipeline #1 – Glargine#1 – Glargine
Introduction – We believe that BIOS's global biosimilar pipeline is not well contextualized by the Street, and istherefore not well understood by investors. Economics for each product are nuanced by launch timing,competitive dynamics, sales by indication, patent expiration/estate, etcetera for each of the two key markets –the US and EU. In this section, we have detailed each of the four leading assets of BIOS and assessed thecommercial upside over next five years till 2020.
Asset #1 – Glargine
Drug profile – Lantus (insulin glargine) is a long-acting basal insulin analogue (human insulin), given oncedaily to help control blood sugar levels of those with type 1 and 2 diabetes. The product was developed bySanofi. It comes in two forms: Solostar pen and vial.
Patent expiry – Lantus's compound patent expired in August 2014 and pediatric exclusivity expired in February2015 in the US, whereas the compound patent expired in November 2009 in the EU and Japan. A patent termextension in Japan expired in November 2014. The supplementary protection certificate (SPC) for Lantusincluding pediatric extension in major EU countries expired in May 2015. Sanofi also has patents protecting theLantus formulations and devices that are currently under litigation and which expire on varying dates between2023 and 2028.
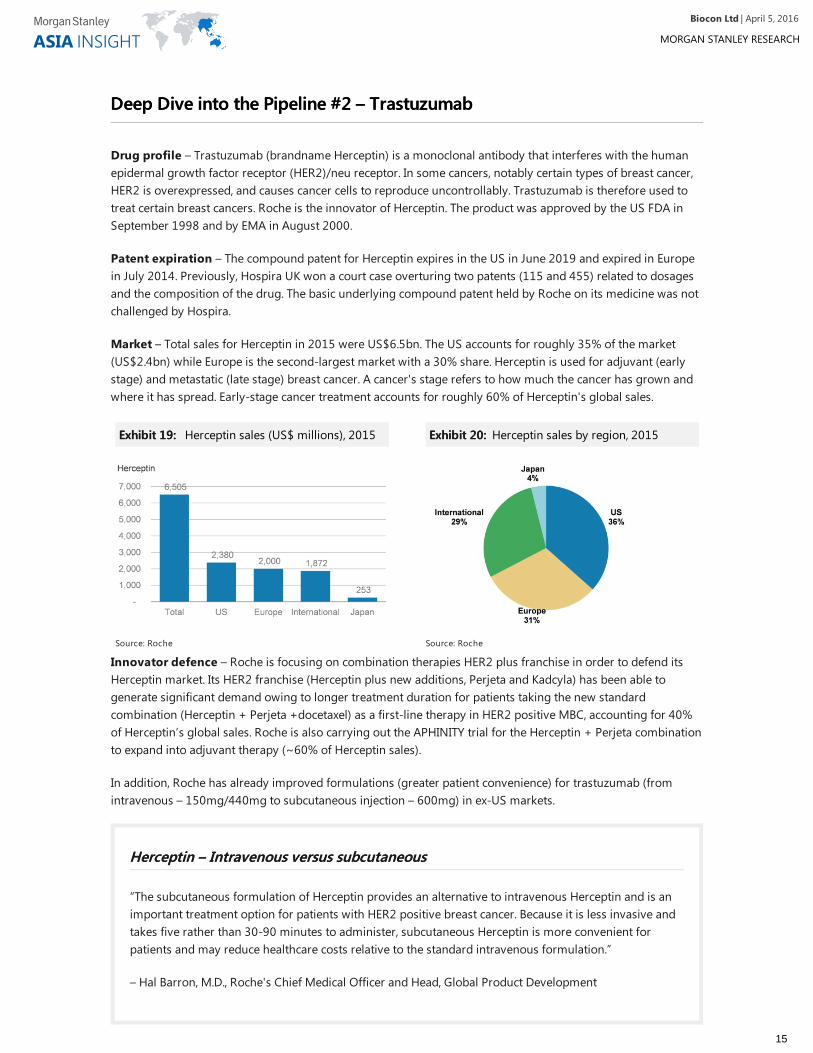
Market potential – Lantus generated estimated global sales of US$7.1 bn ($ 4.5 bn in US) in net sales globallyfor Sanofi in 2015. The leading countries which contributed to Lantus sales were the US, France, China, andGermany. The total market for basal insulin is around US$13.2bn in the US, of which Lantus has a 50-60% shareby volume. As per Sanofi's 20 F filings, the Lantus market in the US is assumed to be flat to slightly growing till2019.
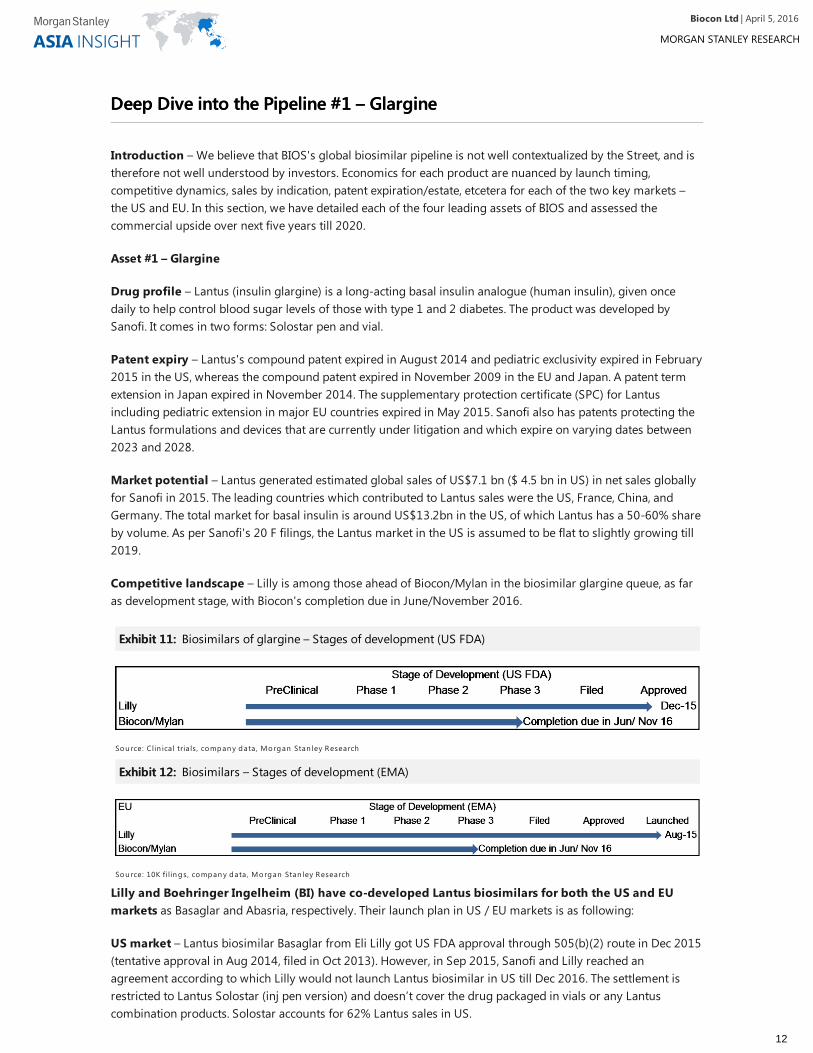
Competitive landscape – Lilly is among those ahead of Biocon/Mylan in the biosimilar glargine queue, as faras development stage, with Biocon's completion due in June/November 2016.
Lilly and Boehringer Ingelheim (BI) have co-developed Lantus biosimilars for both the US and EUmarkets as Basaglar and Abasria, respectively. Their launch plan in US / EU markets is as following:
US market – Lantus biosimilar Basaglar from Eli Lilly got US FDA approval through 505(b)(2) route in Dec 2015(tentative approval in Aug 2014, filed in Oct 2013). However, in Sep 2015, Sanofi and Lilly reached anagreement according to which Lilly would not launch Lantus biosimilar in US till Dec 2016. The settlement isrestricted to Lantus Solostar (inj pen version) and doesn’t cover the drug packaged in vials or any Lantuscombination products. Solostar accounts for 62% Lantus sales in US.
Exhibit 11:Exhibit 11: Biosimilars of glargine – Stages of development (US FDA)
Sou rce: Clin ica l tria ls , compan y data , Morgan Stan ley Research
Exhibit 12:Exhibit 12: Biosimilars – Stages of development (EMA)
Sou rce: 10K f ilin gs, compan y data , Morgan Stan ley Research
| April 5, 2016Biocon Ltd
12
EU markets – Lilly / BI got approval for Lantus biosimilar Abasaglar from the EU in Sep 2014 (filed with EMA inJuly 2013). Beginning in 2015, Lilly introduced Abasaglar in some of the key markets such as Czech Republic,Slovakia, and Estonia, followed by the UK in August 2015, at around a 15-20% price discount to the innovator.
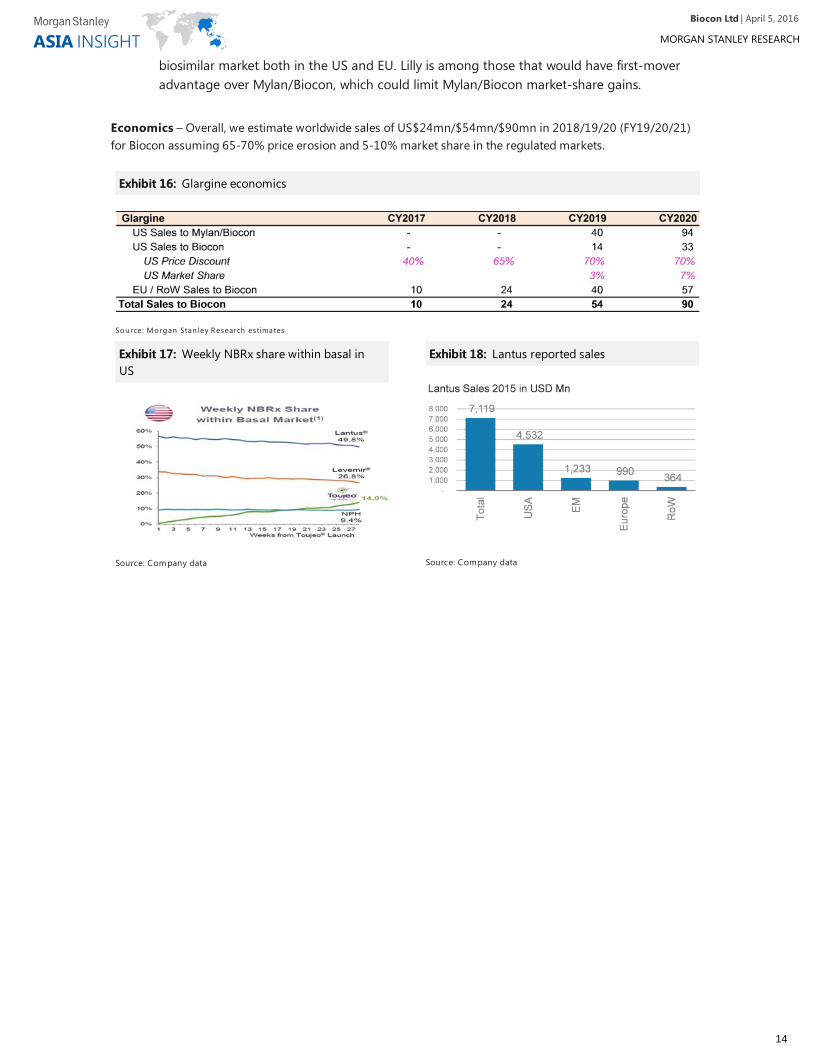
Biocon and Mylan insulin glargine biosimilar development plan – Mylan/Biocon started two Phase 3non-inferiority studies for insulin glargine in August 2014 and one Phase 3 extension study in December 2015in the US. Each of these trials are listed in Europe as well with similar start dates. The non-inferiority studies areexpected to be completed by June 2016 and an extension study by November 2016.
EM/RoW insulin biosimilar progress – LILY/BI received Japanese regulatory approval for their insulinglargine product in January 2015. Subsequently, in May 2015, Australia's Pharmaceutical Benefits AdvisoryCommittee (PBAC) gave positive recommendations to Lilly's biosimilar glargine, Basaglar. In addition, PBAC saidthat it will consider marking the biosimilar as equivalent (i.e. flagging). Biocon launched insulin glargine in theColombian and Mexican markets in July 2015. Before that, in 2009, it launched Basalog – long-lasting basalinsulin glargine in India. In addition Biocon has registered glargine in 20 emerging markets. Recently, BIOSannounced the approval of its glargine in Japan. Indian generic drugmaker Lupin has entered into a strategicdistribution agreement with LG Life Sciences (South Korea) to launch insulin glargine (Basugine).
Key challenges that Mylan/Biocon may face:
Exhibit 13:Exhibit 13: Abasaglar pen from Lilly
Source: Company Presentation
Exhibit 14:Exhibit 14: Lilly / BI LY2963016 Studies
Source: Clinicaltrials, Morgan Stanley Research
Exhibit 15:Exhibit 15: Biocon/Mylan Phase 3 Trials
Sou rce: Clin ica ltria ls , Morgan Stan ley Research
Patent litigation barrier – 30 months stay post litigation (delayed launch) may arise ifBiocon/Mylan go through the 505(b)(2) route (like the Lilly case). If they plan to file the under351(k), they may need to give 180 days notice to innovator after product approval.
Market conversion from Lantus to Toujeo – Sanofi launched Toujeo (a new formulation ofinsulin glargine) in the US at the end of March 2015 at a price level similar to Lantus. The aimis to shift Lantus market to Toujeo before entry of biosimilars
Marketing challenges – Lilly is among innovators with strong marketing teams versus Mylanwhich is a specialty company with limited marketing experience (especially in diabetes). Theimpact can be meaningful if the FDA doesn't give interchangeability status.
Third in the queue – Biocon/Mylan are tracking to be the third players in the insulin
| April 5, 2016Biocon Ltd
13
Economics – Overall, we estimate worldwide sales of US$24mn/$54mn/$90mn in 2018/19/20 (FY19/20/21)for Biocon assuming 65-70% price erosion and 5-10% market share in the regulated markets.
biosimilar market both in the US and EU. Lilly is among those that would have first-moveradvantage over Mylan/Biocon, which could limit Mylan/Biocon market-share gains.
Exhibit 16:Exhibit 16: Glargine economics
Sou rce: Morgan Stan ley Research estimates
Exhibit 17:Exhibit 17: Weekly NBRx share within basal inUS
Source: Company data
Exhibit 18:Exhibit 18: Lantus reported sales
Source: Company data
| April 5, 2016Biocon Ltd
14
Deep Dive into the Pipeline #2 – TrastuzumabDeep Dive into the Pipeline #2 – Trastuzumab
Drug profile – Trastuzumab (brandname Herceptin) is a monoclonal antibody that interferes with the humanepidermal growth factor receptor (HER2)/neu receptor. In some cancers, notably certain types of breast cancer,HER2 is overexpressed, and causes cancer cells to reproduce uncontrollably. Trastuzumab is therefore used totreat certain breast cancers. Roche is the innovator of Herceptin. The product was approved by the US FDA inSeptember 1998 and by EMA in August 2000.
Patent expiration – The compound patent for Herceptin expires in the US in June 2019 and expired in Europein July 2014. Previously, Hospira UK won a court case overturing two patents (115 and 455) related to dosagesand the composition of the drug. The basic underlying compound patent held by Roche on its medicine was notchallenged by Hospira.
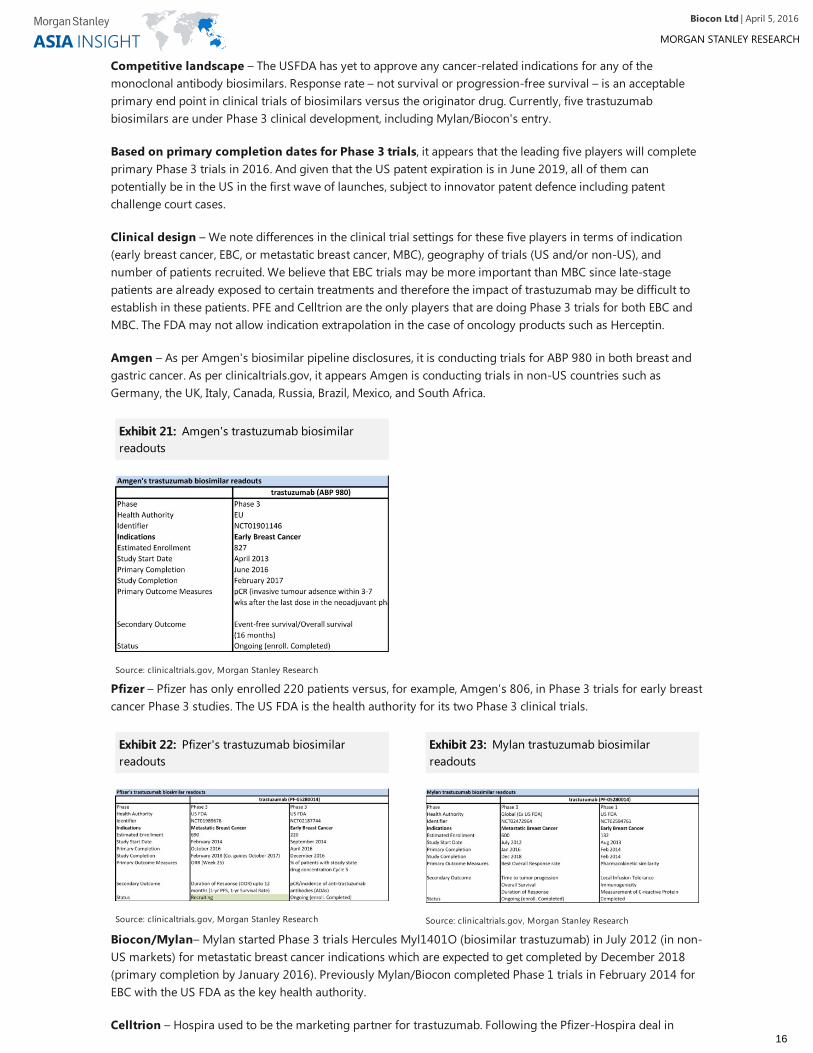
Market – Total sales for Herceptin in 2015 were US$6.5bn. The US accounts for roughly 35% of the market(US$2.4bn) while Europe is the second-largest market with a 30% share. Herceptin is used for adjuvant (earlystage) and metastatic (late stage) breast cancer. A cancer's stage refers to how much the cancer has grown andwhere it has spread. Early-stage cancer treatment accounts for roughly 60% of Herceptin's global sales.
Innovator defence – Roche is focusing on combination therapies HER2 plus franchise in order to defend itsHerceptin market. Its HER2 franchise (Herceptin plus new additions, Perjeta and Kadcyla) has been able togenerate significant demand owing to longer treatment duration for patients taking the new standardcombination (Herceptin + Perjeta +docetaxel) as a first-line therapy in HER2 positive MBC, accounting for 40%of Herceptin’s global sales. Roche is also carrying out the APHINITY trial for the Herceptin + Perjeta combinationto expand into adjuvant therapy (~60% of Herceptin sales).
In addition, Roche has already improved formulations (greater patient convenience) for trastuzumab (fromintravenous – 150mg/440mg to subcutaneous injection – 600mg) in ex-US markets.
Herceptin Herceptin – Intravenous versus – Intravenous versus subcutaneoussubcutaneous
“The subcutaneous formulation of Herceptin provides an alternative to intravenous Herceptin and is animportant treatment option for patients with HER2 positive breast cancer. Because it is less invasive andtakes five rather than 30-90 minutes to administer, subcutaneous Herceptin is more convenient forpatients and may reduce healthcare costs relative to the standard intravenous formulation.”
– Hal Barron, M.D., Roche's Chief Medical Officer and Head, Global Product Development
Exhibit 19:Exhibit 19: Herceptin sales (US$ millions), 2015
Source: Roche
Exhibit 20:Exhibit 20: Herceptin sales by region, 2015
Source: Roche
| April 5, 2016Biocon Ltd
15
Competitive landscape – The USFDA has yet to approve any cancer-related indications for any of themonoclonal antibody biosimilars. Response rate – not survival or progression-free survival – is an acceptableprimary end point in clinical trials of biosimilars versus the originator drug. Currently, five trastuzumabbiosimilars are under Phase 3 clinical development, including Mylan/Biocon's entry.
Based on primary completion dates for Phase 3 trials, it appears that the leading five players will completeprimary Phase 3 trials in 2016. And given that the US patent expiration is in June 2019, all of them canpotentially be in the US in the first wave of launches, subject to innovator patent defence including patentchallenge court cases.
Clinical design – We note differences in the clinical trial settings for these five players in terms of indication(early breast cancer, EBC, or metastatic breast cancer, MBC), geography of trials (US and/or non-US), andnumber of patients recruited. We believe that EBC trials may be more important than MBC since late-stagepatients are already exposed to certain treatments and therefore the impact of trastuzumab may be difficult toestablish in these patients. PFE and Celltrion are the only players that are doing Phase 3 trials for both EBC andMBC. The FDA may not allow indication extrapolation in the case of oncology products such as Herceptin.
Amgen – As per Amgen's biosimilar pipeline disclosures, it is conducting trials for ABP 980 in both breast andgastric cancer. As per clinicaltrials.gov, it appears Amgen is conducting trials in non-US countries such asGermany, the UK, Italy, Canada, Russia, Brazil, Mexico, and South Africa.
Pfizer – Pfizer has only enrolled 220 patients versus, for example, Amgen's 806, in Phase 3 trials for early breastcancer Phase 3 studies. The US FDA is the health authority for its two Phase 3 clinical trials.
Biocon/Mylan– Mylan started Phase 3 trials Hercules Myl1401O (biosimilar trastuzumab) in July 2012 (in non-US markets) for metastatic breast cancer indications which are expected to get completed by December 2018(primary completion by January 2016). Previously Mylan/Biocon completed Phase 1 trials in February 2014 forEBC with the US FDA as the key health authority.
Celltrion – Hospira used to be the marketing partner for trastuzumab. Following the Pfizer-Hospira deal in
Exhibit 21:Exhibit 21: Amgen's trastuzumab biosimilarreadouts
Source: clinicaltrials.gov, Morgan Stanley Research
Exhibit 22:Exhibit 22: Pfizer's trastuzumab biosimilarreadouts
Source: clinicaltrials.gov, Morgan Stanley Research
Exhibit 23:Exhibit 23: Mylan trastuzumab biosimilarreadouts
Source: clinicaltrials.gov, Morgan Stanley Research
| April 5, 2016Biocon Ltd
16
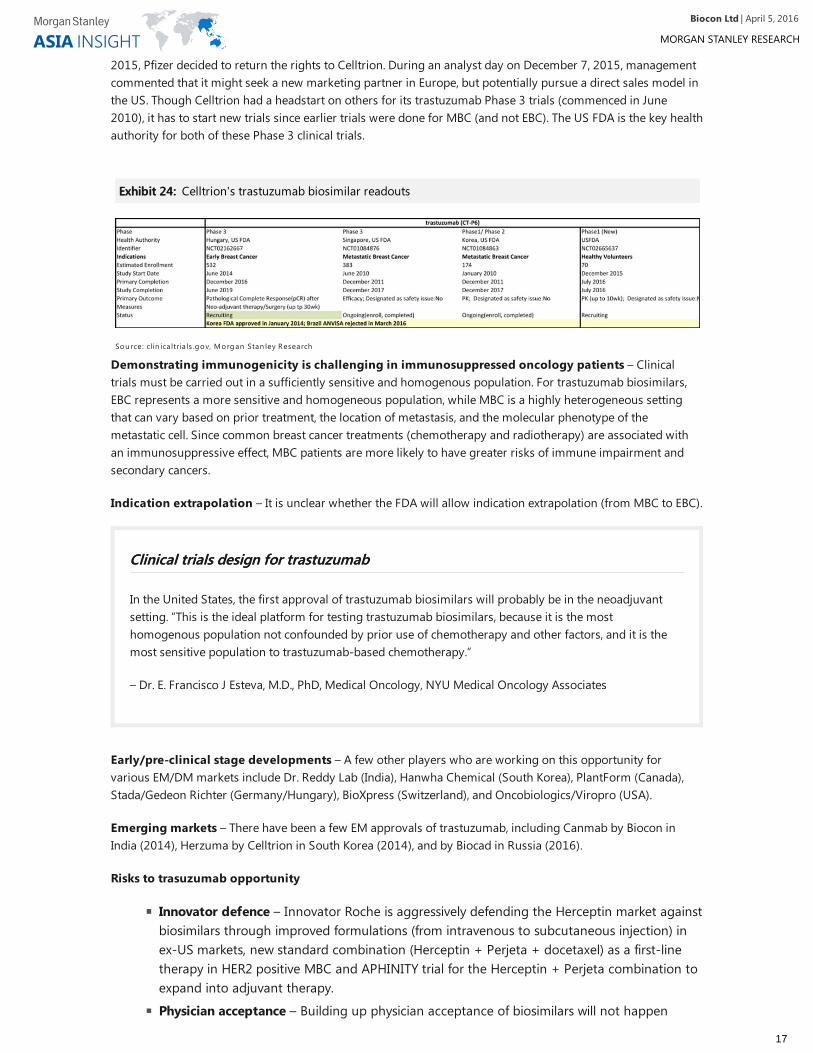
2015, Pfizer decided to return the rights to Celltrion. During an analyst day on December 7, 2015, managementcommented that it might seek a new marketing partner in Europe, but potentially pursue a direct sales model inthe US. Though Celltrion had a headstart on others for its trastuzumab Phase 3 trials (commenced in June2010), it has to start new trials since earlier trials were done for MBC (and not EBC). The US FDA is the key healthauthority for both of these Phase 3 clinical trials.
Demonstrating immunogenicity is challenging in immunosuppressed oncology patients – Clinicaltrials must be carried out in a sufficiently sensitive and homogenous population. For trastuzumab biosimilars,EBC represents a more sensitive and homogeneous population, while MBC is a highly heterogeneous settingthat can vary based on prior treatment, the location of metastasis, and the molecular phenotype of themetastatic cell. Since common breast cancer treatments (chemotherapy and radiotherapy) are associated withan immunosuppressive effect, MBC patients are more likely to have greater risks of immune impairment andsecondary cancers.
Indication extrapolation – It is unclear whether the FDA will allow indication extrapolation (from MBC to EBC).
Clinical trials design for trastuzumabClinical trials design for trastuzumab
In the United States, the first approval of trastuzumab biosimilars will probably be in the neoadjuvantsetting. “This is the ideal platform for testing trastuzumab biosimilars, because it is the mosthomogenous population not confounded by prior use of chemotherapy and other factors, and it is themost sensitive population to trastuzumab-based chemotherapy.”
– Dr. E. Francisco J Esteva, M.D., PhD, Medical Oncology, NYU Medical Oncology Associates
Early/pre-clinical stage developments – A few other players who are working on this opportunity forvarious EM/DM markets include Dr. Reddy Lab (India), Hanwha Chemical (South Korea), PlantForm (Canada),Stada/Gedeon Richter (Germany/Hungary), BioXpress (Switzerland), and Oncobiologics/Viropro (USA).
Emerging markets – There have been a few EM approvals of trastuzumab, including Canmab by Biocon inIndia (2014), Herzuma by Celltrion in South Korea (2014), and by Biocad in Russia (2016).
Risks to trasuzumab opportunity
Exhibit 24:Exhibit 24: Celltrion's trastuzumab biosimilar readouts
Sou rce: clin ica ltria ls .gov, Morgan Stan ley Research
Innovator defence – Innovator Roche is aggressively defending the Herceptin market againstbiosimilars through improved formulations (from intravenous to subcutaneous injection) inex-US markets, new standard combination (Herceptin + Perjeta + docetaxel) as a first-linetherapy in HER2 positive MBC and APHINITY trial for the Herceptin + Perjeta combination toexpand into adjuvant therapy.
Physician acceptance – Building up physician acceptance of biosimilars will not happen
| April 5, 2016Biocon Ltd
17
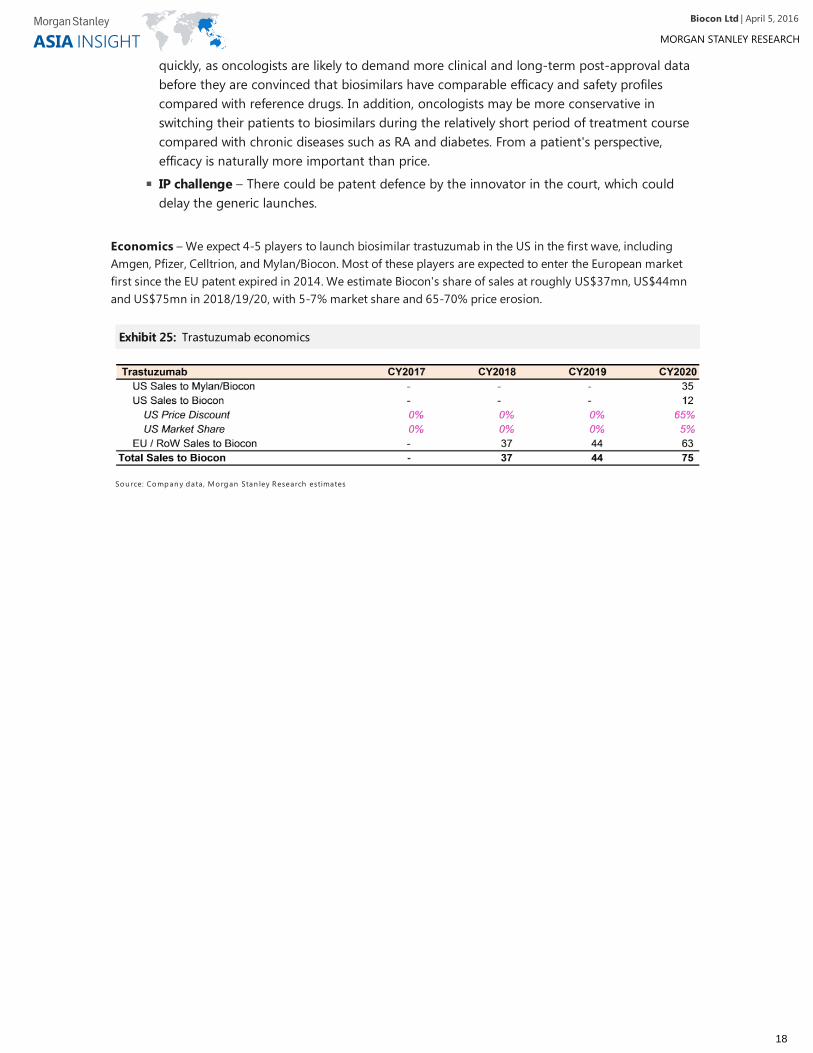
Economics – We expect 4-5 players to launch biosimilar trastuzumab in the US in the first wave, includingAmgen, Pfizer, Celltrion, and Mylan/Biocon. Most of these players are expected to enter the European marketfirst since the EU patent expired in 2014. We estimate Biocon's share of sales at roughly US$37mn, US$44mnand US$75mn in 2018/19/20, with 5-7% market share and 65-70% price erosion.
quickly, as oncologists are likely to demand more clinical and long-term post-approval databefore they are convinced that biosimilars have comparable efficacy and safety profilescompared with reference drugs. In addition, oncologists may be more conservative inswitching their patients to biosimilars during the relatively short period of treatment coursecompared with chronic diseases such as RA and diabetes. From a patient's perspective,efficacy is naturally more important than price.
IP challenge – There could be patent defence by the innovator in the court, which coulddelay the generic launches.
Exhibit 25:Exhibit 25: Trastuzumab economics
Sou rce: Compan y data , Morgan Stan ley Research estimates
| April 5, 2016Biocon Ltd
18
Deep Dive into the Pipeline #3 – NeulastaDeep Dive into the Pipeline #3 – Neulasta
Drug profile – Amgen is the innovator of the Neulasta (pegfilgrastim) biologic. It is a long-acting granulocytecolony stimulating factor (G-CSF) that is used to bolster white cells in patients undergoing chemotherapy forcancer (to prevent inspection in patients undergoing chemotherapy). Pegfilgrastim has a human half-life of 15-80 hours, much longer than the parent filgrastim (3-4 hours).
Patent expiry – US patents expired in October 2015, but remain in force in Europe until August 2017.Supplementary protection certificates (SPCs) have been issued related to the indicated products for patents in atleast the following countries – France, Germany, Italy, Spain, and the United Kingdom, expiring in August 2017.
Market size – Neulasta grossed sales of US$4.7bn in 2015, of which, US accounted for US$3.9bn of sales.Therefore, US commercialization holds the key to generating returns on this opportunity.
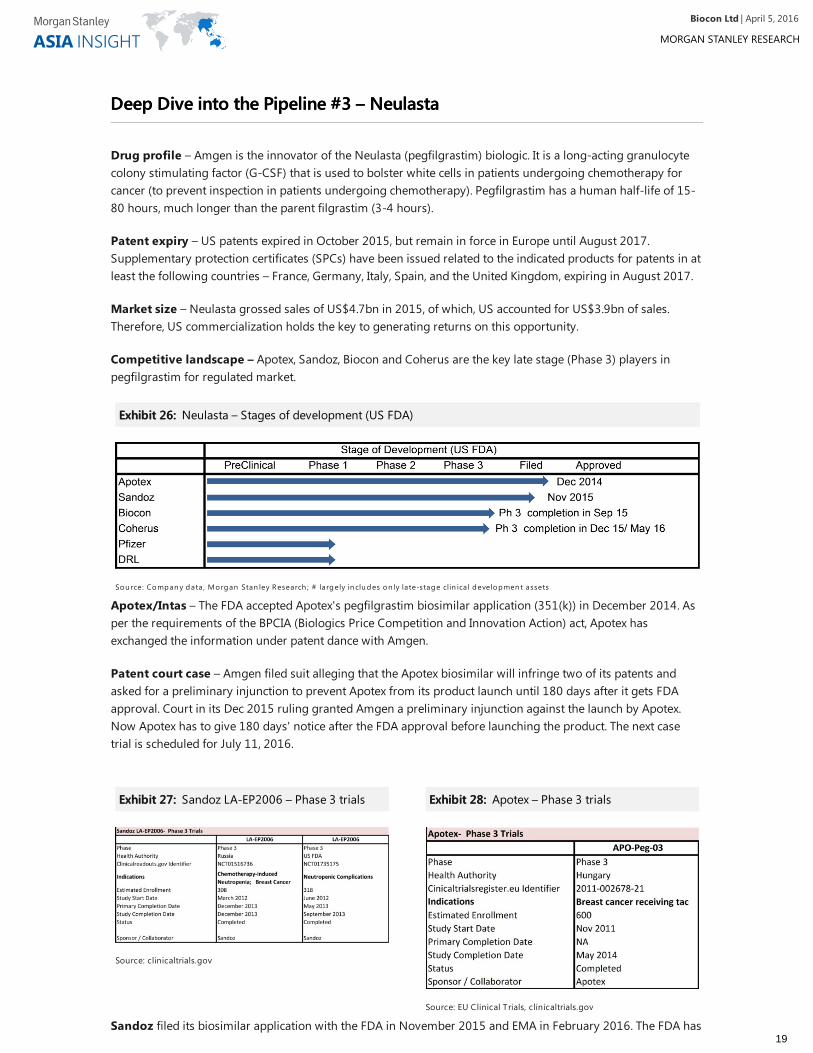
Competitive landscape – Apotex, Sandoz, Biocon and Coherus are the key late stage (Phase 3) players inpegfilgrastim for regulated market.
Apotex/Intas – The FDA accepted Apotex's pegfilgrastim biosimilar application (351(k)) in December 2014. Asper the requirements of the BPCIA (Biologics Price Competition and Innovation Action) act, Apotex hasexchanged the information under patent dance with Amgen.
Patent court case – Amgen filed suit alleging that the Apotex biosimilar will infringe two of its patents andasked for a preliminary injunction to prevent Apotex from its product launch until 180 days after it gets FDAapproval. Court in its Dec 2015 ruling granted Amgen a preliminary injunction against the launch by Apotex.Now Apotex has to give 180 days' notice after the FDA approval before launching the product. The next casetrial is scheduled for July 11, 2016.
Sandoz filed its biosimilar application with the FDA in November 2015 and EMA in February 2016. The FDA has
Exhibit 26:Exhibit 26: Neulasta – Stages of development (US FDA)
Sou rce: Compan y data , Morgan Stan ley Research ; # largely in clu des on ly late-stage clin ica l developmen t assets
Exhibit 27:Exhibit 27: Sandoz LA-EP2006 – Phase 3 trials
Source: clinicaltrials.gov
Exhibit 28:Exhibit 28: Apotex – Phase 3 trials
Source: EU Clinical Trials, clinicaltrials.gov
| April 5, 2016Biocon Ltd
19
accepted its application, triggering a 10-month review period under the agency's 351(k) regulatory pathway forbiosimilars. Similarly, EMA started reviewing the MAA application in February 2016.
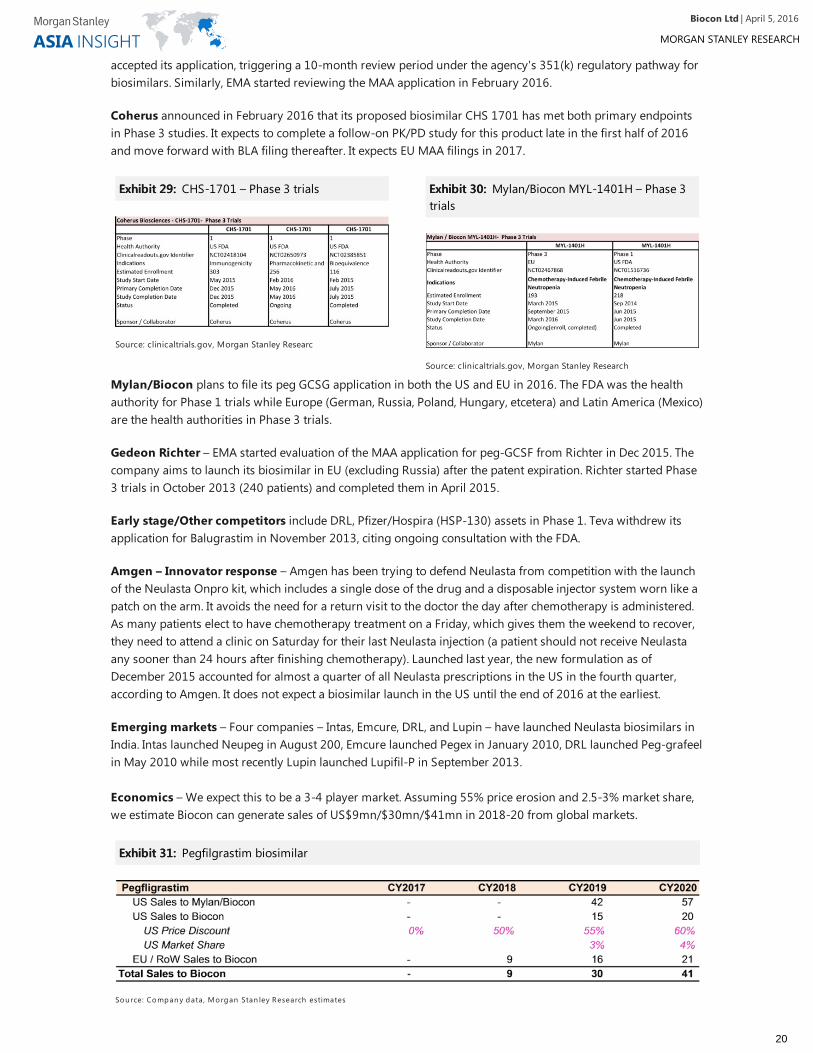
Coherus announced in February 2016 that its proposed biosimilar CHS 1701 has met both primary endpointsin Phase 3 studies. It expects to complete a follow-on PK/PD study for this product late in the first half of 2016and move forward with BLA filing thereafter. It expects EU MAA filings in 2017.
Mylan/Biocon plans to file its peg GCSG application in both the US and EU in 2016. The FDA was the healthauthority for Phase 1 trials while Europe (German, Russia, Poland, Hungary, etcetera) and Latin America (Mexico)are the health authorities in Phase 3 trials.
Gedeon Richter – EMA started evaluation of the MAA application for peg-GCSF from Richter in Dec 2015. Thecompany aims to launch its biosimilar in EU (excluding Russia) after the patent expiration. Richter started Phase3 trials in October 2013 (240 patients) and completed them in April 2015.
Early stage/Other competitors include DRL, Pfizer/Hospira (HSP-130) assets in Phase 1. Teva withdrew itsapplication for Balugrastim in November 2013, citing ongoing consultation with the FDA.
Amgen – Innovator response – Amgen has been trying to defend Neulasta from competition with the launchof the Neulasta Onpro kit, which includes a single dose of the drug and a disposable injector system worn like apatch on the arm. It avoids the need for a return visit to the doctor the day after chemotherapy is administered.As many patients elect to have chemotherapy treatment on a Friday, which gives them the weekend to recover,they need to attend a clinic on Saturday for their last Neulasta injection (a patient should not receive Neulastaany sooner than 24 hours after finishing chemotherapy). Launched last year, the new formulation as ofDecember 2015 accounted for almost a quarter of all Neulasta prescriptions in the US in the fourth quarter,according to Amgen. It does not expect a biosimilar launch in the US until the end of 2016 at the earliest.
Emerging markets – Four companies – Intas, Emcure, DRL, and Lupin – have launched Neulasta biosimilars inIndia. Intas launched Neupeg in August 200, Emcure launched Pegex in January 2010, DRL launched Peg-grafeelin May 2010 while most recently Lupin launched Lupifil-P in September 2013.
Economics – We expect this to be a 3-4 player market. Assuming 55% price erosion and 2.5-3% market share,we estimate Biocon can generate sales of US$9mn/$30mn/$41mn in 2018-20 from global markets.
Exhibit 29:Exhibit 29: CHS-1701 – Phase 3 trials
Source: clinicaltrials.gov, Morgan Stanley Researc
Exhibit 30:Exhibit 30: Mylan/Biocon MYL-1401H – Phase 3trials
Source: clinicaltrials.gov, Morgan Stanley Research
Exhibit 31:Exhibit 31: Pegfilgrastim biosimilar
Sou rce: Compan y data , Morgan Stan ley Research estimates
| April 5, 2016Biocon Ltd
20
Deep Dive into the Pipeline #4 – Humira: Patent ComplexityDeep Dive into the Pipeline #4 – Humira: Patent Complexity
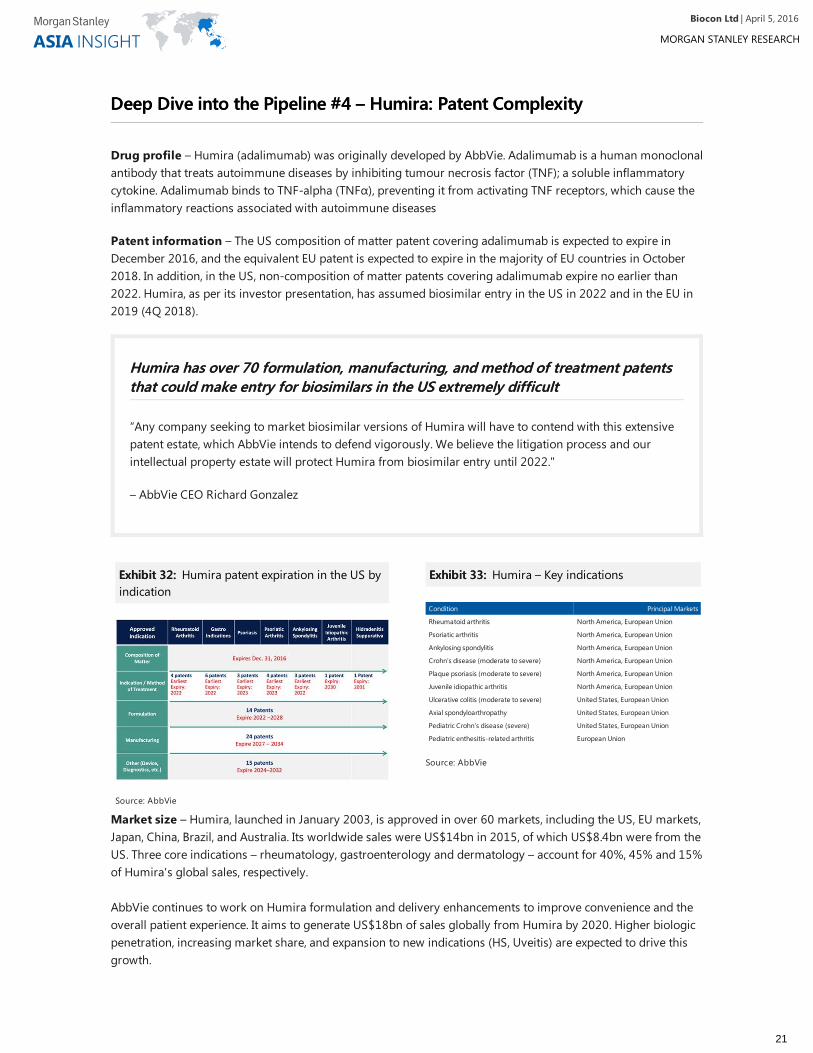
Drug profile – Humira (adalimumab) was originally developed by AbbVie. Adalimumab is a human monoclonalantibody that treats autoimmune diseases by inhibiting tumour necrosis factor (TNF); a soluble inflammatorycytokine. Adalimumab binds to TNF-alpha (TNFα), preventing it from activating TNF receptors, which cause theinflammatory reactions associated with autoimmune diseases
Patent information – The US composition of matter patent covering adalimumab is expected to expire inDecember 2016, and the equivalent EU patent is expected to expire in the majority of EU countries in October2018. In addition, in the US, non-composition of matter patents covering adalimumab expire no earlier than2022. Humira, as per its investor presentation, has assumed biosimilar entry in the US in 2022 and in the EU in2019 (4Q 2018).
Humira has over 70 formulation, manufacturing, and method of treatment patentsHumira has over 70 formulation, manufacturing, and method of treatment patentsthat could make entry for biosimilars in the US extremely difficultthat could make entry for biosimilars in the US extremely difficult
“Any company seeking to market biosimilar versions of Humira will have to contend with this extensivepatent estate, which AbbVie intends to defend vigorously. We believe the litigation process and ourintellectual property estate will protect Humira from biosimilar entry until 2022."
– AbbVie CEO Richard Gonzalez
Market size – Humira, launched in January 2003, is approved in over 60 markets, including the US, EU markets,Japan, China, Brazil, and Australia. Its worldwide sales were US$14bn in 2015, of which US$8.4bn were from theUS. Three core indications – rheumatology, gastroenterology and dermatology – account for 40%, 45% and 15%of Humira's global sales, respectively.
AbbVie continues to work on Humira formulation and delivery enhancements to improve convenience and theoverall patient experience. It aims to generate US$18bn of sales globally from Humira by 2020. Higher biologicpenetration, increasing market share, and expansion to new indications (HS, Uveitis) are expected to drive thisgrowth.
Exhibit 32:Exhibit 32: Humira patent expiration in the US byindication
Source: AbbVie
Exhibit 33:Exhibit 33: Humira – Key indications
Condition Principal Markets
Rheumatoid arthritis North America, European Union
Psoriatic arthritis North America, European Union
Ankylosing spondylitis North America, European Union
Crohn’s disease (moderate to severe) North America, European Union
Plaque psoriasis (moderate to severe) North America, European Union
Juvenile idiopathic arthritis North America, European Union
Ulcerative colitis (moderate to severe) United States, European Union
Axial spondyloarthropathy United States, European Union
Pediatric Crohn’s disease (severe) United States, European Union
Pediatric enthesitis-related arthritis European Union
Source: AbbVie
| April 5, 2016Biocon Ltd
21
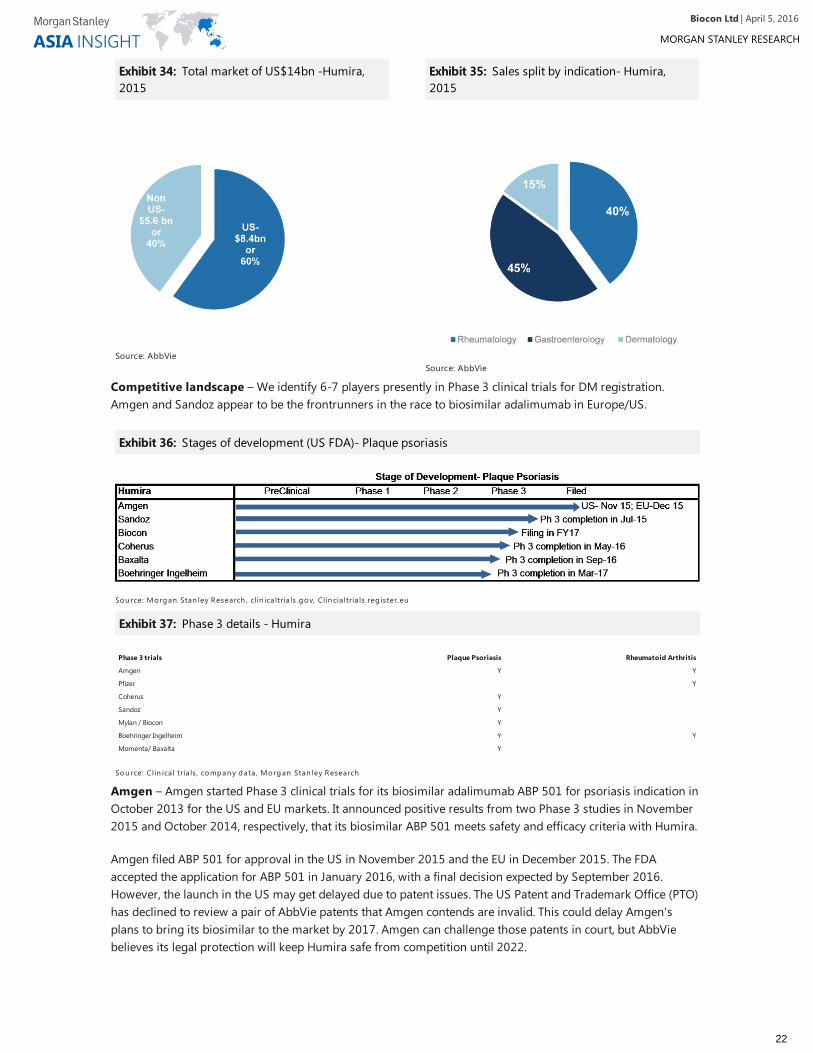
Competitive landscape – We identify 6-7 players presently in Phase 3 clinical trials for DM registration.Amgen and Sandoz appear to be the frontrunners in the race to biosimilar adalimumab in Europe/US.
Amgen – Amgen started Phase 3 clinical trials for its biosimilar adalimumab ABP 501 for psoriasis indication inOctober 2013 for the US and EU markets. It announced positive results from two Phase 3 studies in November2015 and October 2014, respectively, that its biosimilar ABP 501 meets safety and efficacy criteria with Humira.
Amgen filed ABP 501 for approval in the US in November 2015 and the EU in December 2015. The FDAaccepted the application for ABP 501 in January 2016, with a final decision expected by September 2016.However, the launch in the US may get delayed due to patent issues. The US Patent and Trademark Office (PTO)has declined to review a pair of AbbVie patents that Amgen contends are invalid. This could delay Amgen'splans to bring its biosimilar to the market by 2017. Amgen can challenge those patents in court, but AbbViebelieves its legal protection will keep Humira safe from competition until 2022.
Exhibit 34:Exhibit 34: Total market of US$14bn -Humira,2015
Source: AbbVie
Exhibit 35:Exhibit 35: Sales split by indication- Humira,2015
Source: AbbVie
Exhibit 36:Exhibit 36: Stages of development (US FDA)- Plaque psoriasis
Sou rce: Morgan Stan ley Research , clin ica ltria ls .gov, Clin cia ltria ls reg ister.eu
Exhibit 37:Exhibit 37: Phase 3 details - Humira
Phase 3 trials Plaque Psoriasis Rheumatoid Arthritis
Amgen Y Y
Pfizer Y
Coherus Y
Sandoz Y
Mylan / Biocon Y
Boehringer Ingelheim Y Y
Momenta/ Baxalta Y
Sou rce: Clin ica l tria ls , compan y data , Morgan Stan ley Research
| April 5, 2016Biocon Ltd
22
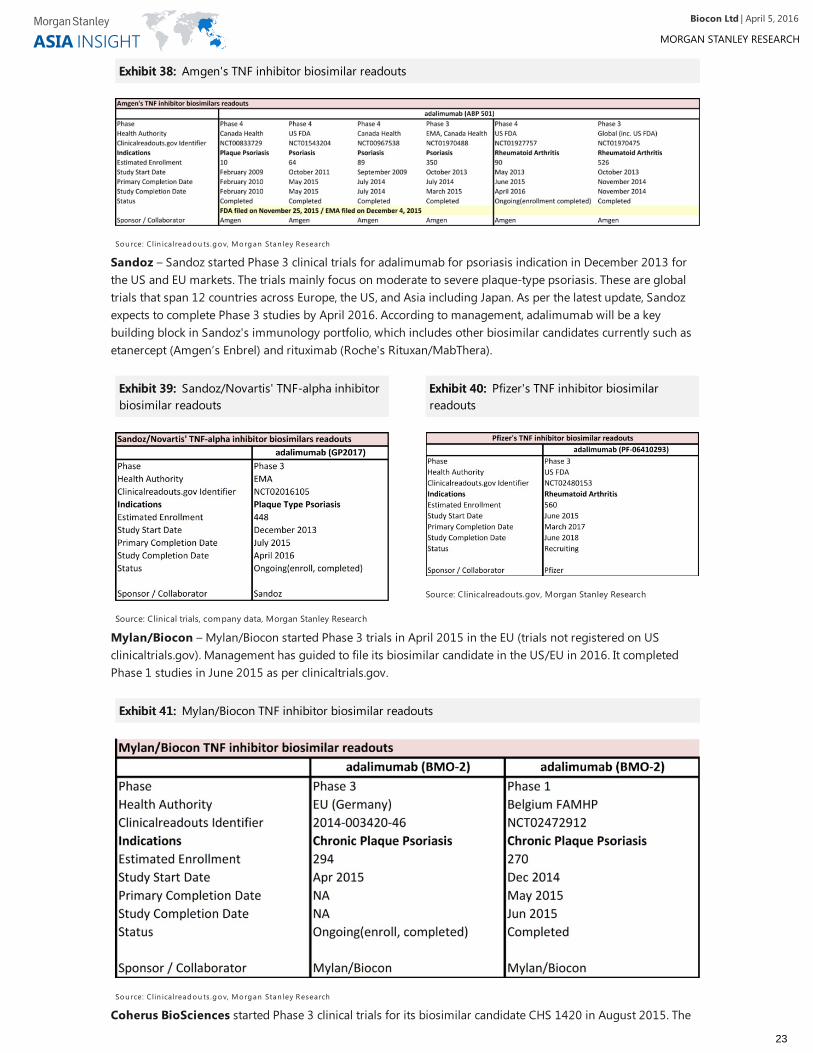
Sandoz – Sandoz started Phase 3 clinical trials for adalimumab for psoriasis indication in December 2013 forthe US and EU markets. The trials mainly focus on moderate to severe plaque-type psoriasis. These are globaltrials that span 12 countries across Europe, the US, and Asia including Japan. As per the latest update, Sandozexpects to complete Phase 3 studies by April 2016. According to management, adalimumab will be a keybuilding block in Sandoz's immunology portfolio, which includes other biosimilar candidates currently such asetanercept (Amgen’s Enbrel) and rituximab (Roche's Rituxan/MabThera).
Mylan/Biocon – Mylan/Biocon started Phase 3 trials in April 2015 in the EU (trials not registered on USclinicaltrials.gov). Management has guided to file its biosimilar candidate in the US/EU in 2016. It completedPhase 1 studies in June 2015 as per clinicaltrials.gov.
Coherus BioSciences started Phase 3 clinical trials for its biosimilar candidate CHS 1420 in August 2015. The
Exhibit 38:Exhibit 38: Amgen's TNF inhibitor biosimilar readouts
Sou rce: Clin ica lreadou ts.gov, Morgan Stan ley Research
Exhibit 39:Exhibit 39: Sandoz/Novartis' TNF-alpha inhibitorbiosimilar readouts
Source: Clinical trials, company data, Morgan Stanley Research
Exhibit 40:Exhibit 40: Pfizer's TNF inhibitor biosimilarreadouts
Source: Clinicalreadouts.gov, Morgan Stanley Research
Exhibit 41:Exhibit 41: Mylan/Biocon TNF inhibitor biosimilar readouts
Sou rce: Clin ica lreadou ts.gov, Morgan Stan ley Research
| April 5, 2016Biocon Ltd
23
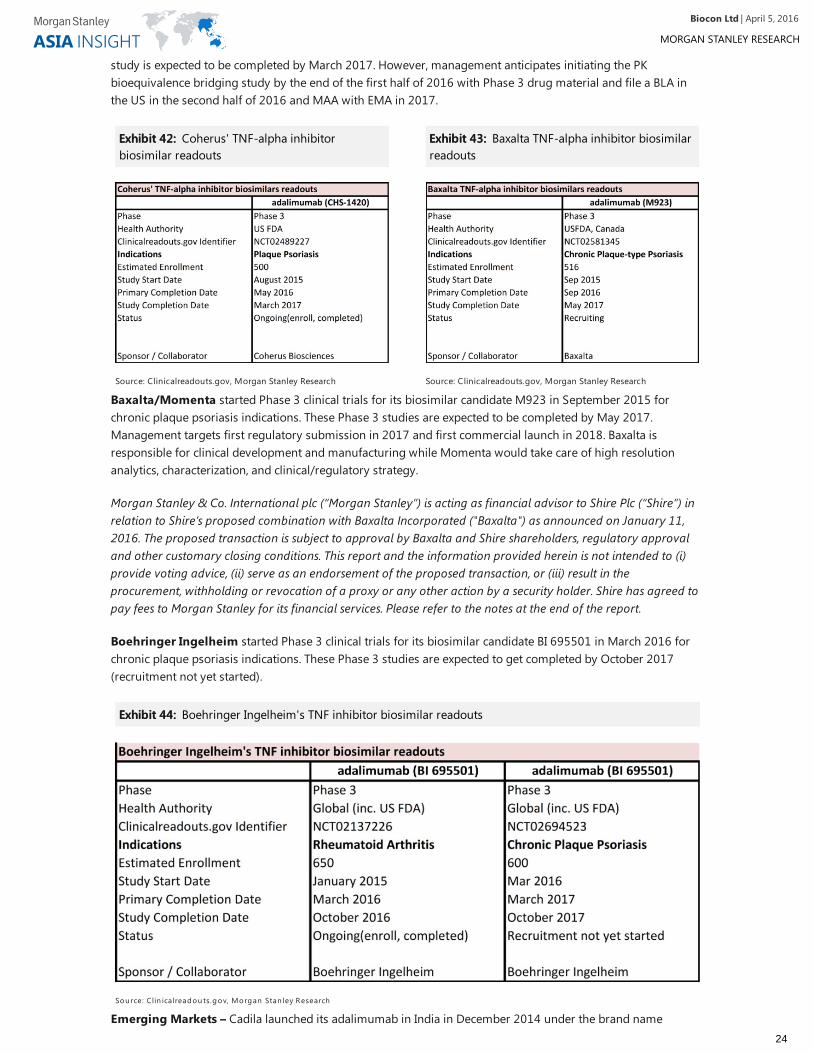
study is expected to be completed by March 2017. However, management anticipates initiating the PKbioequivalence bridging study by the end of the first half of 2016 with Phase 3 drug material and file a BLA inthe US in the second half of 2016 and MAA with EMA in 2017.
Baxalta/Momenta started Phase 3 clinical trials for its biosimilar candidate M923 in September 2015 forchronic plaque psoriasis indications. These Phase 3 studies are expected to be completed by May 2017.Management targets first regulatory submission in 2017 and first commercial launch in 2018. Baxalta isresponsible for clinical development and manufacturing while Momenta would take care of high resolutionanalytics, characterization, and clinical/regulatory strategy.
Morgan Stanley & Co. International plc (“Morgan Stanley”) is acting as financial advisor to Shire Plc (“Shire”) inrelation to Shire’s proposed combination with Baxalta Incorporated ("Baxalta") as announced on January 11,2016. The proposed transaction is subject to approval by Baxalta and Shire shareholders, regulatory approvaland other customary closing conditions. This report and the information provided herein is not intended to (i)provide voting advice, (ii) serve as an endorsement of the proposed transaction, or (iii) result in theprocurement, withholding or revocation of a proxy or any other action by a security holder. Shire has agreed topay fees to Morgan Stanley for its financial services. Please refer to the notes at the end of the report.
Boehringer Ingelheim started Phase 3 clinical trials for its biosimilar candidate BI 695501 in March 2016 forchronic plaque psoriasis indications. These Phase 3 studies are expected to get completed by October 2017(recruitment not yet started).
Emerging Markets – Cadila launched its adalimumab in India in December 2014 under the brand name
Exhibit 42:Exhibit 42: Coherus' TNF-alpha inhibitorbiosimilar readouts
Source: Clinicalreadouts.gov, Morgan Stanley Research
Exhibit 43:Exhibit 43: Baxalta TNF-alpha inhibitor biosimilarreadouts
Source: Clinicalreadouts.gov, Morgan Stanley Research
Exhibit 44:Exhibit 44: Boehringer Ingelheim's TNF inhibitor biosimilar readouts
Sou rce: Clin ica lreadou ts.gov, Morgan Stan ley Research
| April 5, 2016Biocon Ltd
24
Exemptia.
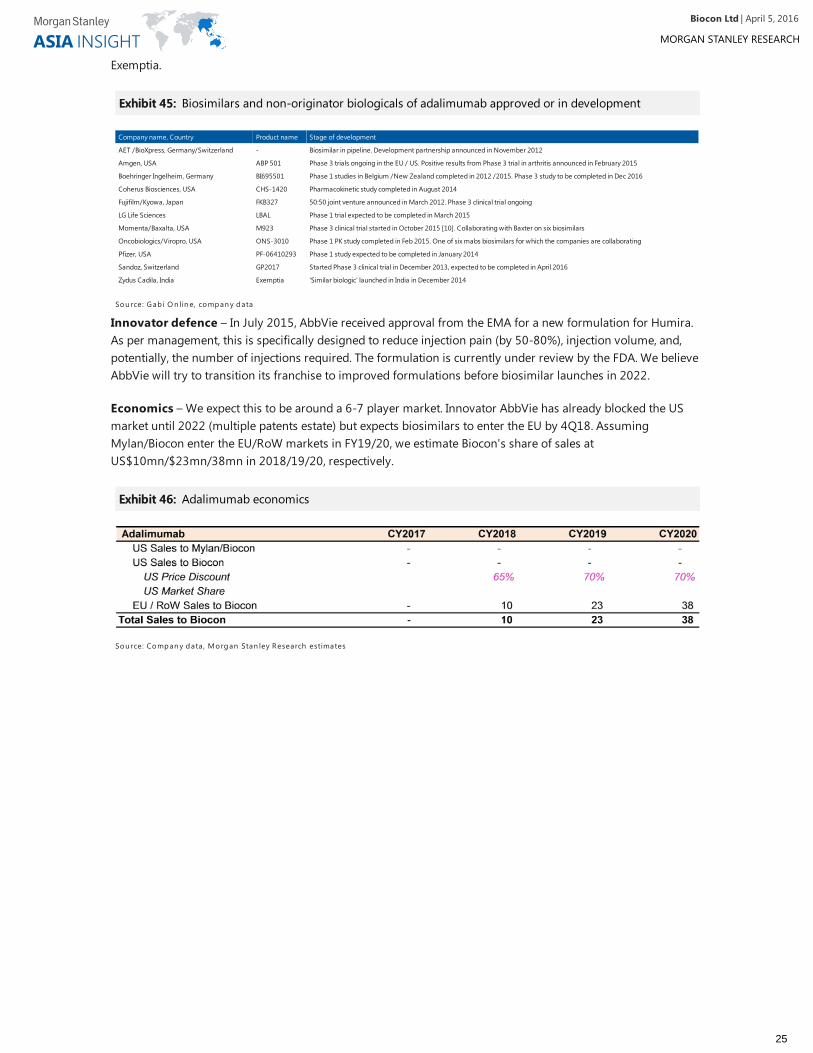
Innovator defence – In July 2015, AbbVie received approval from the EMA for a new formulation for Humira.As per management, this is specifically designed to reduce injection pain (by 50-80%), injection volume, and,potentially, the number of injections required. The formulation is currently under review by the FDA. We believeAbbVie will try to transition its franchise to improved formulations before biosimilar launches in 2022.
Economics – We expect this to be around a 6-7 player market. Innovator AbbVie has already blocked the USmarket until 2022 (multiple patents estate) but expects biosimilars to enter the EU by 4Q18. AssumingMylan/Biocon enter the EU/RoW markets in FY19/20, we estimate Biocon's share of sales atUS$10mn/$23mn/38mn in 2018/19/20, respectively.
Exhibit 45:Exhibit 45: Biosimilars and non-originator biologicals of adalimumab approved or in development
Company name, Country Product name Stage of development
AET /BioXpress, Germany/Switzerland - Biosimilar in pipeline. Development partnership announced in November 2012
Amgen, USA ABP 501 Phase 3 trials ongoing in the EU / US. Positive results from Phase 3 trial in arthritis announced in February 2015
Boehringer Ingelheim, Germany BI695501 Phase 1 studies in Belgium /New Zealand completed in 2012 /2015. Phase 3 study to be completed in Dec 2016
Coherus Biosciences, USA CHS-1420 Pharmacokinetic study completed in August 2014
Fujifilm/Kyowa, Japan FKB327 50:50 joint venture announced in March 2012. Phase 3 clinical trial ongoing
LG Life Sciences LBAL Phase 1 trial expected to be completed in March 2015
Momenta/Baxalta, USA M923 Phase 3 clinical trial started in October 2015 [10]. Collaborating with Baxter on six biosimilars
Oncobiologics/Viropro, USA ONS-3010 Phase 1 PK study completed in Feb 2015. One of six mabs biosimilars for which the companies are collaborating
Pfizer, USA PF-06410293 Phase 1 study expected to be completed in January 2014
Sandoz, Switzerland GP2017 Started Phase 3 clinical trial in December 2013, expected to be completed in April 2016
Zydus Cadila, India Exemptia 'Similar biologic’ launched in India in December 2014
Sou rce: G ab i O n lin e, compan y data
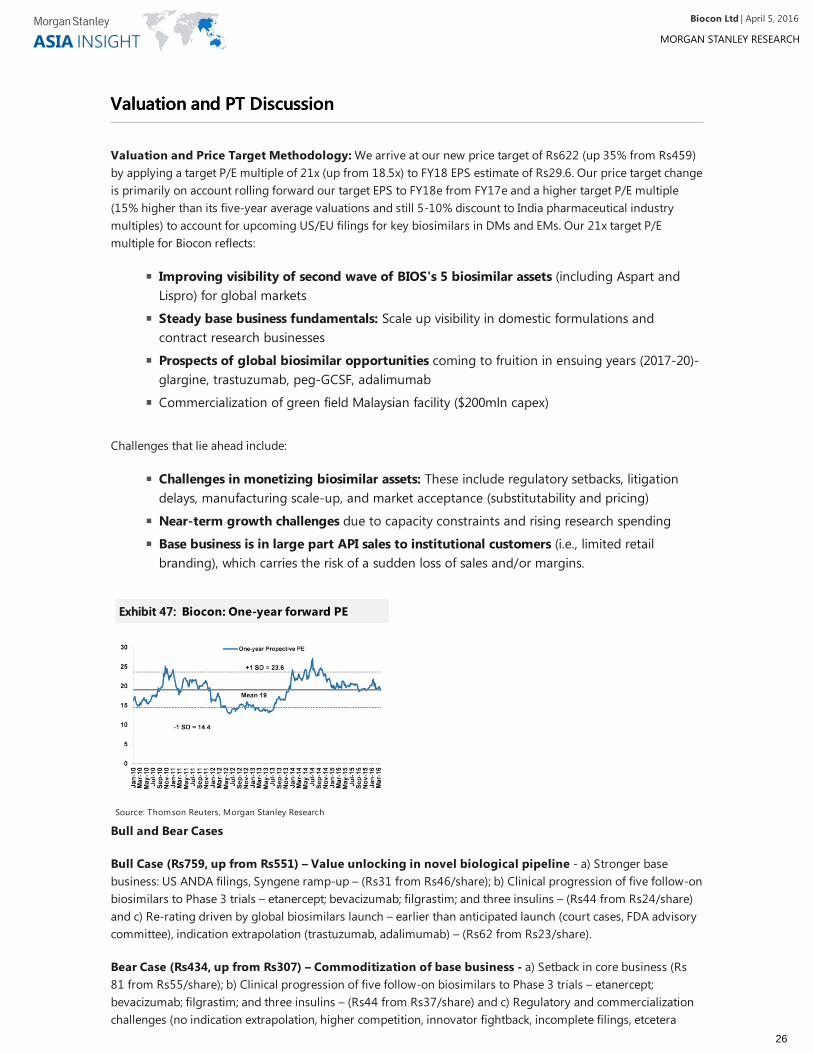
Exhibit 46:Exhibit 46: Adalimumab economics
Sou rce: Compan y data , Morgan Stan ley Research estimates
| April 5, 2016Biocon Ltd
25
Valuation and PT DiscussionValuation and PT Discussion
Valuation and Price Target Methodology: We arrive at our new price target of Rs622 (up 35% from Rs459)by applying a target P/E multiple of 21x (up from 18.5x) to FY18 EPS estimate of Rs29.6. Our price target changeis primarily on account rolling forward our target EPS to FY18e from FY17e and a higher target P/E multiple(15% higher than its five-year average valuations and still 5-10% discount to India pharmaceutical industrymultiples) to account for upcoming US/EU filings for key biosimilars in DMs and EMs. Our 21x target P/Emultiple for Biocon reflects:
Challenges that lie ahead include:
Bull and Bear Cases
Bull Case (Rs759, up from Rs551) – Value unlocking in novel biological pipeline - a) Stronger basebusiness: US ANDA filings, Syngene ramp-up – (Rs31 from Rs46/share); b) Clinical progression of five follow-onbiosimilars to Phase 3 trials – etanercept; bevacizumab; filgrastim; and three insulins – (Rs44 from Rs24/share)and c) Re-rating driven by global biosimilars launch – earlier than anticipated launch (court cases, FDA advisorycommittee), indication extrapolation (trastuzumab, adalimumab) – (Rs62 from Rs23/share).
Bear Case (Rs434, up from Rs307) – Commoditization of base business - a) Setback in core business (Rs81 from Rs55/share); b) Clinical progression of five follow-on biosimilars to Phase 3 trials – etanercept;bevacizumab; filgrastim; and three insulins – (Rs44 from Rs37/share) and c) Regulatory and commercializationchallenges (no indication extrapolation, higher competition, innovator fightback, incomplete filings, etcetera
Improving visibility of second wave of BIOS's 5 biosimilar assets (including Aspart andLispro) for global markets
Steady base business fundamentals: Scale up visibility in domestic formulations andcontract research businesses
Prospects of global biosimilar opportunities coming to fruition in ensuing years (2017-20)-glargine, trastuzumab, peg-GCSF, adalimumab
Commercialization of green field Malaysian facility ($200mln capex)
Challenges in monetizing biosimilar assets: These include regulatory setbacks, litigationdelays, manufacturing scale-up, and market acceptance (substitutability and pricing)
Near-term growth challenges due to capacity constraints and rising research spending
Base business is in large part API sales to institutional customers (i.e., limited retailbranding), which carries the risk of a sudden loss of sales and/or margins.
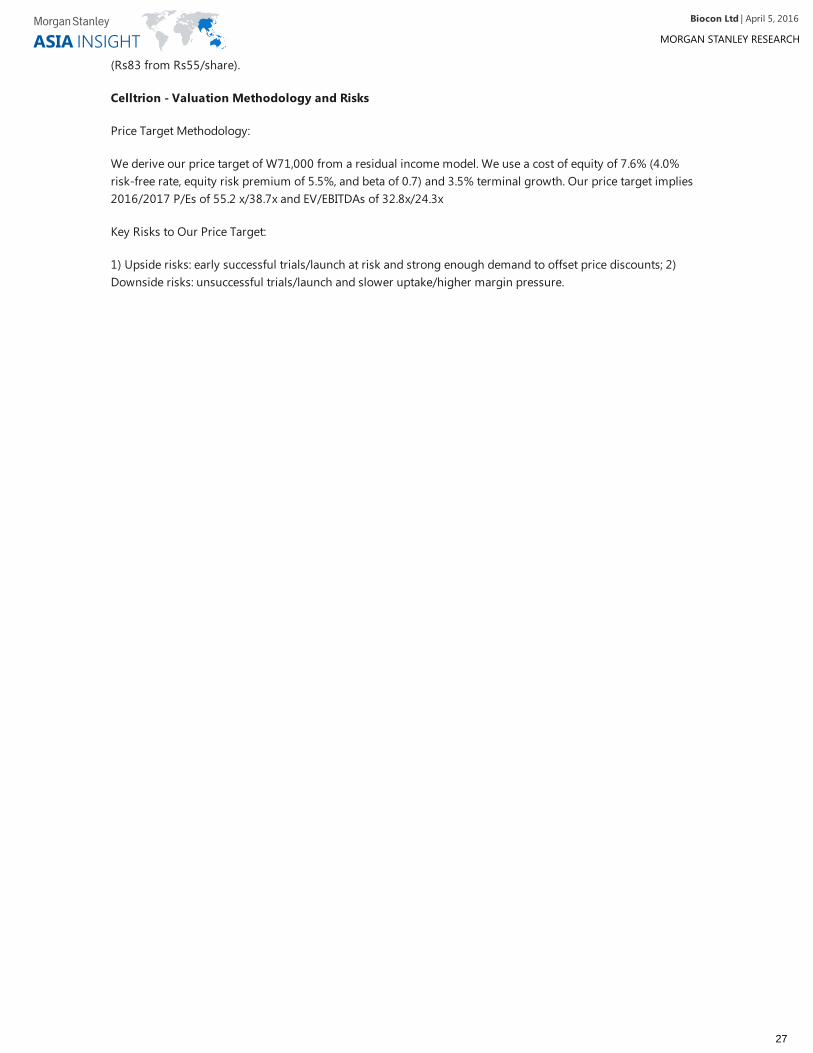
Exhibit 47:Exhibit 47: Biocon: One-year forward PE
Source: Thomson Reuters, Morgan Stanley Research
| April 5, 2016Biocon Ltd
26
(Rs83 from Rs55/share).
Celltrion - Valuation Methodology and Risks
Price Target Methodology:
We derive our price target of W71,000 from a residual income model. We use a cost of equity of 7.6% (4.0%risk-free rate, equity risk premium of 5.5%, and beta of 0.7) and 3.5% terminal growth. Our price target implies2016/2017 P/Es of 55.2 x/38.7x and EV/EBITDAs of 32.8x/24.3x
Key Risks to Our Price Target:
1) Upside risks: early successful trials/launch at risk and strong enough demand to offset price discounts; 2)Downside risks: unsuccessful trials/launch and slower uptake/higher margin pressure.
| April 5, 2016Biocon Ltd
27
Biocon: Key risks to price target; key investment concernsBiocon: Key risks to price target; key investment concerns
1) Regulatory risks include delay in product approvals, indication extrapolation, clinical trial design
2) Legal risks include at risk launches, delay in market entry (180 days, patent dance), 30m NDA stay
3) Asset monetization risks include innovator defence (flexible pricing, reformulation, patents)marketing challenges, slower biosimilar update from physicians
4) Other risks include a slowdown in base business due to factors such as capacity constraints or a sluggishdomestic market; risk pertaining to Syngene business - late-stage client molecules may not culminate inbusiness; and delays in scale-up or regulatory filings from Malaysia facility.
Higher product complexities - The FDA, as of now. has approved only one biosimilarproduct filgrastim(Zarxio) in the US through the 351(K) route and several through the 505(b)(2) route including glargine. However, the subsequent filings are more complex in nature,which the FDA may take longer to approve (or not approve if data is insufficient).
Indication extrapolation - Europe most recently gave approval to Celltrion's biosimilarinfliximab for all six indications though it submitted clinical data for only two indications.Canada, however, has not followed a similar approach in extrapolating the data across otherindications. This is untested for the USFDA, which may use a stringent approach forindication extrapolation.
Clinical trials design- Biocon is conducting three out of four Phase 3 trials at non- USlocations, even though these are meant for US filings. However, BIOS maintains that thesetrials are consistent with FDA requirements. We note that a few other competitors are alsodoing non US studies for US filing for a few bio-similar products.
Uncertainty about 180 days notice of commercialization to innovators if a biosimilarmaker has chosen to participate in the patent - This has been litigated by Apotex and thematter is in Appeal. In addition, Sandoz has currently filed a petition in the Supreme Courtagainst a Federal circuit court ruling that 180 days notice can be given earlier than productapproval date.
Implications of not participating in Patent Dance (launch at risk)- If the company choosesnot to participate in the patent dance and launch the Biosimilar then (a) it cannot file anyrelevant declaratory judgment suits, e.g. for non-infringement or invalidity, and (b) it issubject to the filing of immediate lawsuits by the reference product sponsor, e.g. fordeclaratory judgment of infringement and validity. Therefore, Biosimilar applicants as of nowhave a choice to either participate in the patent dance (delay the start of litigation by at leastby 8 months) or forego disclosure and risk immediate lawsuits by the innovator.
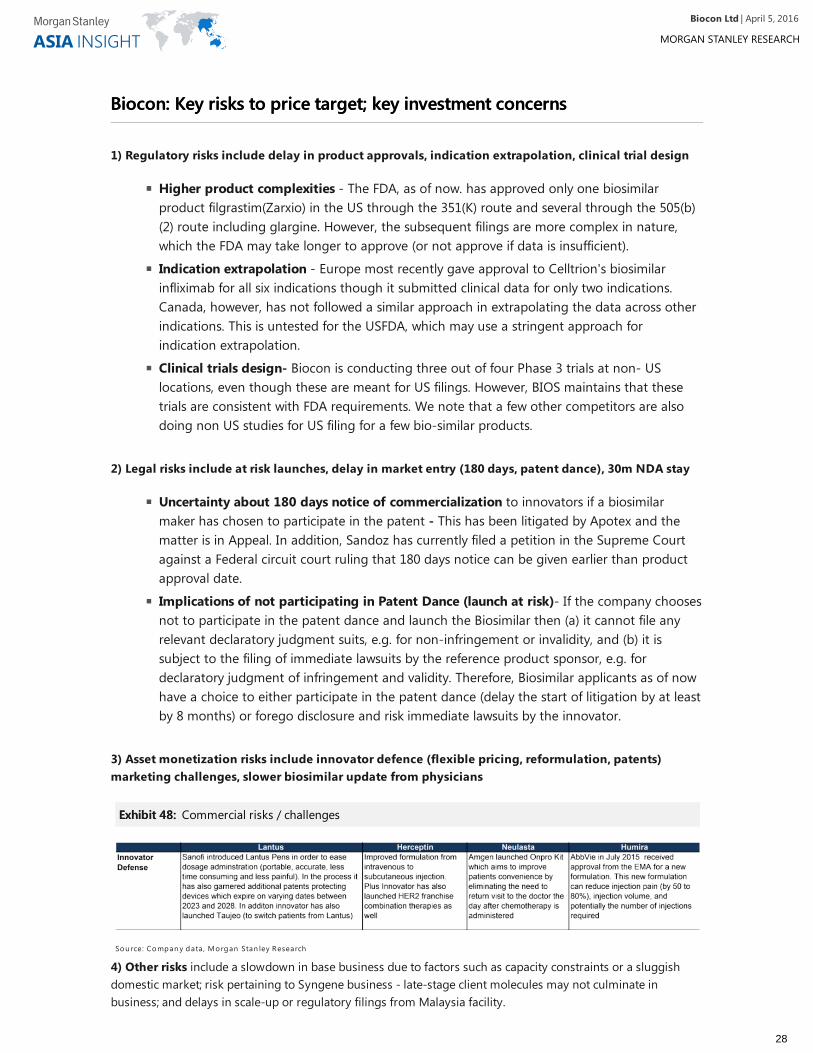
Exhibit 48:Exhibit 48: Commercial risks / challenges
Sou rce: Compan y data , Morgan Stan ley Research
| April 5, 2016Biocon Ltd
28
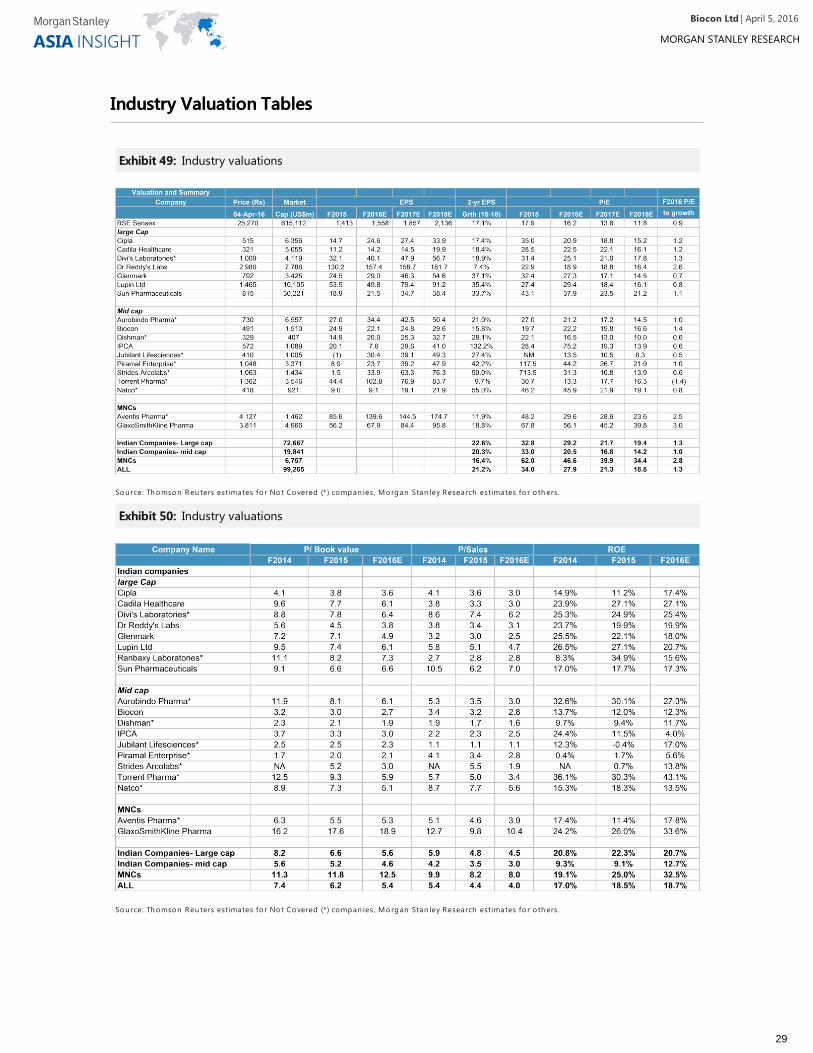
Industry Valuation TablesIndustry Valuation Tables
Exhibit 49:Exhibit 49: Industry valuations
Sou rce: Th omson Reu ters estimates fo r No t Covered (*) compan ies, Morgan Stan ley Research estimates fo r o th ers.
Exhibit 50:Exhibit 50: Industry valuations
Sou rce: Th omson Reu ters estimates fo r No t Covered (*) compan ies, Morgan Stan ley Research estimates fo r o th ers.
| April 5, 2016Biocon Ltd
29
Disclosure SectionThe information and opinions in Morgan Stanley Research were prepared or are disseminated by Morgan Stanley Asia Limited (which accepts theresponsibility for its contents) and/or Morgan Stanley Asia (Singapore) Pte. (Registration number 199206298Z) and/or Morgan Stanley Asia (Singapore)Securities Pte Ltd (Registration number 200008434H), regulated by the Monetary Authority of Singapore (which accepts legal responsibility for its contentsand should be contacted with respect to any matters arising from, or in connection with, Morgan Stanley Research), and/or Morgan Stanley Taiwan Limitedand/or Morgan Stanley & Co International plc, Seoul Branch, and/or Morgan Stanley Australia Limited (A.B.N. 67 003 734 576, holder of Australian financialservices license No. 233742, which accepts responsibility for its contents), and/or Morgan Stanley Wealth Management Australia Pty Ltd (A.B.N. 19 009145 555, holder of Australian financial services license No. 240813, which accepts responsibility for its contents), and/or Morgan Stanley India CompanyPrivate Limited, regulated by the Securities and Exchange Board of India (“SEBI”) and holder of licenses as a Research Analyst (SEBI Registration No.INH000001105); Stock Broker (BSE Registration No. INB011054237 and NSE Registration No. INB/INF231054231), Merchant Banker (SEBI RegistrationNo. INM000011203), and depository participant with National Securities Depository Limited (SEBI Registration No. IN-DP-NSDL-372-2014) which acceptsthe responsibility for its contents and should be contacted with respect to any matters arising from, or in connection with, Morgan Stanley Research, and/orPT Morgan Stanley Asia Indonesia and their affiliates (collectively, "Morgan Stanley").For important disclosures, stock price charts and equity rating histories regarding companies that are the subject of this report, please see the MorganStanley Research Disclosure Website at www.morganstanley.com/researchdisclosures, or contact your investment representative or Morgan StanleyResearch at 1585 Broadway, (Attention: Research Management), New York, NY, 10036 USA.For valuation methodology and risks associated with any price targets referenced in this research report, please contact the Client Support Team as follows:US/Canada +1 800 303-2495; Hong Kong +852 2848-5999; Latin America +1 718 754-5444 (U.S.); London +44 (0)20-7425-8169; Singapore +65 6834-6860;Sydney +61 (0)2-9770-1505; Tokyo +81 (0)3-6836-9000. Alternatively you may contact your investment representative or Morgan Stanley Research at 1585Broadway, (Attention: Research Management), New York, NY 10036 USA.Analyst CertificationThe following analysts hereby certify that their views about the companies and their securities discussed in this report are accurately expressed and thatthey have not received and will not receive direct or indirect compensation in exchange for expressing specific recommendations or views in this report:Sameer Baisiwala, CFA.Unless otherwise stated, the individuals listed on the cover page of this report are research analysts.Global Research Conflict Management PolicyMorgan Stanley Research has been published in accordance with our conflict management policy, which is available atwww.morganstanley.com/institutional/research/conflictpolicies.Important US Regulatory Disclosures on Subject CompaniesAs of February 29, 2016, Morgan Stanley beneficially owned 1% or more of a class of common equity securities of the following companies covered inMorgan Stanley Research: Glenmark Pharmaceuticals.In the next 3 months, Morgan Stanley expects to receive or intends to seek compensation for investment banking services from Cadila Healthcare Ltd.,Cipla Ltd., Dr. Reddy's Lab, Glenmark Pharmaceuticals, Lupin Ltd., Sun Pharmaceutical Industries.Within the last 12 months, Morgan Stanley has provided or is providing investment banking services to, or has an investment banking client relationshipwith, the following company: Cadila Healthcare Ltd., Cipla Ltd., Dr. Reddy's Lab, Glenmark Pharmaceuticals, Lupin Ltd., Sun Pharmaceutical Industries.Within the last 12 months, Morgan Stanley has either provided or is providing non-investment banking, securities-related services to and/or in the past hasentered into an agreement to provide services or has a client relationship with the following company: Sun Pharmaceutical Industries.Morgan Stanley & Co. LLC makes a market in the securities of Dr. Reddy's Lab, Sun Pharmaceutical Industries.The equity research analysts or strategists principally responsible for the preparation of Morgan Stanley Research have received compensation based uponvarious factors, including quality of research, investor client feedback, stock picking, competitive factors, firm revenues and overall investment bankingrevenues.Morgan Stanley and its affiliates do business that relates to companies/instruments covered in Morgan Stanley Research, including market making,providing liquidity, fund management, commercial banking, extension of credit, investment services and investment banking. Morgan Stanley sells to andbuys from customers the securities/instruments of companies covered in Morgan Stanley Research on a principal basis. Morgan Stanley may have aposition in the debt of the Company or instruments discussed in this report.Certain disclosures listed above are also for compliance with applicable regulations in non-US jurisdictions.STOCK RATINGSMorgan Stanley uses a relative rating system using terms such as Overweight, Equal-weight, Not-Rated or Underweight (see definitions below). MorganStanley does not assign ratings of Buy, Hold or Sell to the stocks we cover. Overweight, Equal-weight, Not-Rated and Underweight are not the equivalent ofbuy, hold and sell. Investors should carefully read the definitions of all ratings used in Morgan Stanley Research. In addition, since Morgan StanleyResearch contains more complete information concerning the analyst's views, investors should carefully read Morgan Stanley Research, in its entirety, andnot infer the contents from the rating alone. In any case, ratings (or research) should not be used or relied upon as investment advice. An investor's decisionto buy or sell a stock should depend on individual circumstances (such as the investor's existing holdings) and other considerations.Global Stock Ratings Distribution(as of March 31, 2016)For disclosure purposes only (in accordance with NASD and NYSE requirements), we include the category headings of Buy, Hold, and Sell alongside ourratings of Overweight, Equal-weight, Not-Rated and Underweight. Morgan Stanley does not assign ratings of Buy, Hold or Sell to the stocks we cover.Overweight, Equal-weight, Not-Rated and Underweight are not the equivalent of buy, hold, and sell but represent recommended relative weightings (seedefinitions below). To satisfy regulatory requirements, we correspond Overweight, our most positive stock rating, with a buy recommendation; we correspondEqual-weight and Not-Rated to hold and Underweight to sell recommendations, respectively.
| April 5, 2016Biocon Ltd
30
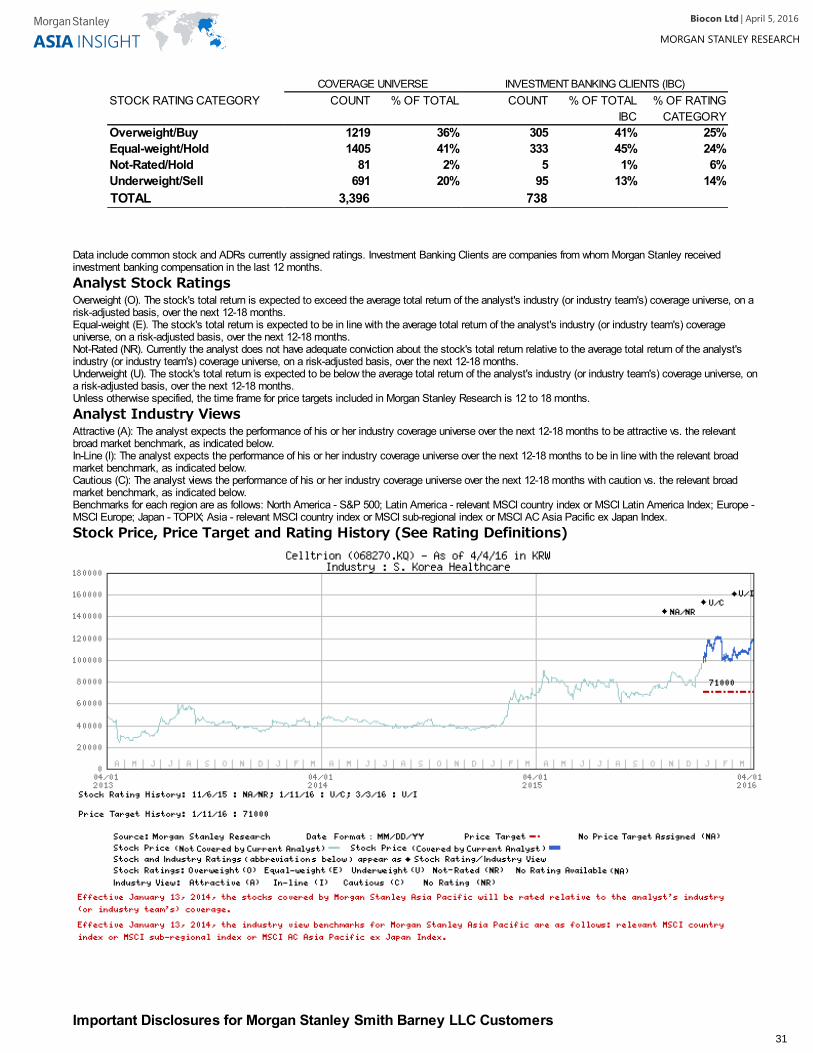
COVERAGE UNIVERSE INVESTMENT BANKING CLIENTS (IBC)STOCK RATING CATEGORY COUNT % OF TOTAL COUNT % OF TOTAL
IBC% OF RATING
CATEGORYOverweight/Buy 1219 36% 305 41% 25%Equal-weight/Hold 1405 41% 333 45% 24%Not-Rated/Hold 81 2% 5 1% 6%Underweight/Sell 691 20% 95 13% 14%TOTAL 3,396 738
Data include common stock and ADRs currently assigned ratings. Investment Banking Clients are companies from whom Morgan Stanley receivedinvestment banking compensation in the last 12 months.Analyst Stock RatingsOverweight (O). The stock's total return is expected to exceed the average total return of the analyst's industry (or industry team's) coverage universe, on arisk-adjusted basis, over the next 12-18 months.Equal-weight (E). The stock's total return is expected to be in line with the average total return of the analyst's industry (or industry team's) coverageuniverse, on a risk-adjusted basis, over the next 12-18 months.Not-Rated (NR). Currently the analyst does not have adequate conviction about the stock's total return relative to the average total return of the analyst'sindustry (or industry team's) coverage universe, on a risk-adjusted basis, over the next 12-18 months.Underweight (U). The stock's total return is expected to be below the average total return of the analyst's industry (or industry team's) coverage universe, ona risk-adjusted basis, over the next 12-18 months.Unless otherwise specified, the time frame for price targets included in Morgan Stanley Research is 12 to 18 months.Analyst Industry ViewsAttractive (A): The analyst expects the performance of his or her industry coverage universe over the next 12-18 months to be attractive vs. the relevantbroad market benchmark, as indicated below.In-Line (I): The analyst expects the performance of his or her industry coverage universe over the next 12-18 months to be in line with the relevant broadmarket benchmark, as indicated below.Cautious (C): The analyst views the performance of his or her industry coverage universe over the next 12-18 months with caution vs. the relevant broadmarket benchmark, as indicated below.Benchmarks for each region are as follows: North America - S&P 500; Latin America - relevant MSCI country index or MSCI Latin America Index; Europe -MSCI Europe; Japan - TOPIX; Asia - relevant MSCI country index or MSCI sub-regional index or MSCI AC Asia Pacific ex Japan Index.Stock Price, Price Target and Rating History (See Rating Definitions)
Important Disclosures for Morgan Stanley Smith Barney LLC Customers
| April 5, 2016Biocon Ltd
31
Important disclosures regarding the relationship between the companies that are the subject of Morgan Stanley Research and Morgan Stanley SmithBarney LLC or Morgan Stanley or any of their affiliates, are available on the Morgan Stanley Wealth Management disclosure website atwww.morganstanley.com/online/researchdisclosures. For Morgan Stanley specific disclosures, you may refer towww.morganstanley.com/researchdisclosures.Each Morgan Stanley Equity Research report is reviewed and approved on behalf of Morgan Stanley Smith Barney LLC. This review and approval isconducted by the same person who reviews the Equity Research report on behalf of Morgan Stanley. This could create a conflict of interest.Other Important DisclosuresMorgan Stanley is not acting as a municipal advisor and the opinions or views contained herein are not intended to be, and do not constitute, advice withinthe meaning of Section 975 of the Dodd-Frank Wall Street Reform and Consumer Protection Act.Morgan Stanley produces an equity research product called a "Tactical Idea." Views contained in a "Tactical Idea" on a particular stock may be contrary tothe recommendations or views expressed in research on the same stock. This may be the result of differing time horizons, methodologies, market events, orother factors. For all research available on a particular stock, please contact your sales representative or go to Matrix athttp://www.morganstanley.com/matrix.Morgan Stanley Research is provided to our clients through our proprietary research portal on Matrix and also distributed electronically by Morgan Stanleyto clients. Certain, but not all, Morgan Stanley Research products are also made available to clients through third-party vendors or redistributed to clientsthrough alternate electronic means as a convenience. For access to all available Morgan Stanley Research, please contact your sales representative or goto Matrix at http://www.morganstanley.com/matrix.Any access and/or use of Morgan Stanley Research is subject to Morgan Stanley's Terms of Use (http://www.morganstanley.com/terms.html). Byaccessing and/or using Morgan Stanley Research, you are indicating that you have read and agree to be bound by our Terms of Use(http://www.morganstanley.com/terms.html). In addition you consent to Morgan Stanley processing your personal data and using cookies in accordancewith our Privacy Policy and our Global Cookies Policy (http://www.morganstanley.com/privacy_pledge.html), including for the purposes of setting yourpreferences and to collect readership data so that we can deliver better and more personalized service and products to you. To find out more informationabout how Morgan Stanley processes personal data, how we use cookies and how to reject cookies see our Privacy Policy and our Global Cookies Policy(http://www.morganstanley.com/privacy_pledge.html).If you do not agree to our Terms of Use and/or if you do not wish to provide your consent to Morgan Stanley processing your personal data or using cookiesplease do not access our research.Morgan Stanley Research does not provide individually tailored investment advice. Morgan Stanley Research has been prepared without regard to thecircumstances and objectives of those who receive it. Morgan Stanley recommends that investors independently evaluate particular investments andstrategies, and encourages investors to seek the advice of a financial adviser. The appropriateness of an investment or strategy will depend on an investor'scircumstances and objectives. The securities, instruments, or strategies discussed in Morgan Stanley Research may not be suitable for all investors, andcertain investors may not be eligible to purchase or participate in some or all of them. Morgan Stanley Research is not an offer to buy or sell or thesolicitation of an offer to buy or sell any security/instrument or to participate in any particular trading strategy. The value of and income from yourinvestments may vary because of changes in interest rates, foreign exchange rates, default rates, prepayment rates, securities/instruments prices, marketindexes, operational or financial conditions of companies or other factors. There may be time limitations on the exercise of options or other rights insecurities/instruments transactions. Past performance is not necessarily a guide to future performance. Estimates of future performance are based onassumptions that may not be realized. If provided, and unless otherwise stated, the closing price on the cover page is that of the primary exchange for thesubject company's securities/instruments.The fixed income research analysts, strategists or economists principally responsible for the preparation of Morgan Stanley Research have receivedcompensation based upon various factors, including quality, accuracy and value of research, firm profitability or revenues (which include fixed income tradingand capital markets profitability or revenues), client feedback and competitive factors. Fixed Income Research analysts', strategists' or economists'compensation is not linked to investment banking or capital markets transactions performed by Morgan Stanley or the profitability or revenues of particulartrading desks.The "Important US Regulatory Disclosures on Subject Companies" section in Morgan Stanley Research lists all companies mentioned where MorganStanley owns 1% or more of a class of common equity securities of the companies. For all other companies mentioned in Morgan Stanley Research,Morgan Stanley may have an investment of less than 1% in securities/instruments or derivatives of securities/instruments of companies and may trade themin ways different from those discussed in Morgan Stanley Research. Employees of Morgan Stanley not involved in the preparation of Morgan StanleyResearch may have investments in securities/instruments or derivatives of securities/instruments of companies mentioned and may trade them in waysdifferent from those discussed in Morgan Stanley Research. Derivatives may be issued by Morgan Stanley or associated persons.With the exception of information regarding Morgan Stanley, Morgan Stanley Research is based on public information. Morgan Stanley makes every effort touse reliable, comprehensive information, but we make no representation that it is accurate or complete. We have no obligation to tell you when opinions orinformation in Morgan Stanley Research change apart from when we intend to discontinue equity research coverage of a subject company. Facts and viewspresented in Morgan Stanley Research have not been reviewed by, and may not reflect information known to, professionals in other Morgan Stanleybusiness areas, including investment banking personnel.Morgan Stanley Research personnel may participate in company events such as site visits and are generally prohibited from accepting payment by thecompany of associated expenses unless pre-approved by authorized members of Research management.Morgan Stanley may make investment decisions that are inconsistent with the recommendations or views in this report.To our readers in Taiwan: Information on securities/instruments that trade in Taiwan is distributed by Morgan Stanley Taiwan Limited ("MSTL"). Suchinformation is for your reference only. The reader should independently evaluate the investment risks and is solely responsible for their investment decisions.Morgan Stanley Research may not be distributed to the public media or quoted or used by the public media without the express written consent of MorganStanley. Information on securities/instruments that do not trade in Taiwan is for informational purposes only and is not to be construed as a recommendationor a solicitation to trade in such securities/instruments. MSTL may not execute transactions for clients in these securities/instruments. To our readers inHong Kong: Information is distributed in Hong Kong by and on behalf of, and is attributable to, Morgan Stanley Asia Limited as part of its regulated activitiesin Hong Kong. If you have any queries concerning Morgan Stanley Research, please contact our Hong Kong sales representatives.Certain information in Morgan Stanley Research was sourced by employees of the Shanghai Representative Office of Morgan Stanley Asia Limited for theuse of Morgan Stanley Asia Limited.Morgan Stanley is not incorporated under PRC law and the research in relation to this report is conducted outside the PRC. Morgan Stanley Research doesnot constitute an offer to sell or the solicitation of an offer to buy any securities in the PRC. PRC investors shall have the relevant qualifications to invest insuch securities and shall be responsible for obtaining all relevant approvals, licenses, verifications and/or registrations from the relevant governmentalauthorities themselves.Morgan Stanley Research is disseminated in Brazil by Morgan Stanley C.T.V.M. S.A.; in Mexico by Morgan Stanley México, Casa de Bolsa, S.A. de C.Vwhich is regulated by Comision Nacional Bancaria y de Valores. Paseo de los Tamarindos 90, Torre 1, Col. Bosques de las Lomas Floor 29, 05120 MexicoCity; in Japan by Morgan Stanley MUFG Securities Co., Ltd. and, for Commodities related research reports only, Morgan Stanley Capital Group Japan Co.,Ltd; in Hong Kong by Morgan Stanley Asia Limited (which accepts responsibility for its contents) and by Bank Morgan Stanley AG, Hong Kong Branch; inSingapore by Morgan Stanley Asia (Singapore) Pte. (Registration number 199206298Z) and/or Morgan Stanley Asia (Singapore) Securities Pte Ltd(Registration number 200008434H), regulated by the Monetary Authority of Singapore (which accepts legal responsibility for its contents and should becontacted with respect to any matters arising from, or in connection with, Morgan Stanley Research) and by Bank Morgan Stanley AG, Singapore Branch(Registration number T11FC0207F); in Australia to "wholesale clients" within the meaning of the Australian Corporations Act by Morgan Stanley AustraliaLimited A.B.N. 67 003 734 576, holder of Australian financial services license No. 233742, which accepts responsibility for its contents; in Australia to"wholesale clients" and "retail clients" within the meaning of the Australian Corporations Act by Morgan Stanley Wealth Management Australia Pty Ltd
| April 5, 2016Biocon Ltd
32
(A.B.N. 19 009 145 555, holder of Australian financial services license No. 240813, which accepts responsibility for its contents; in Korea by MorganStanley & Co International plc, Seoul Branch; in India by Morgan Stanley India Company Private Limited; in Indonesia by PT Morgan Stanley AsiaIndonesia; in Canada by Morgan Stanley Canada Limited, which has approved of and takes responsibility for its contents in Canada; in Germany by MorganStanley Bank AG, Frankfurt am Main and Morgan Stanley Private Wealth Management Limited, Niederlassung Deutschland, regulated by Bundesanstaltfuer Finanzdienstleistungsaufsicht (BaFin); in Spain by Morgan Stanley, S.V., S.A., a Morgan Stanley group company, which is supervised by the SpanishSecurities Markets Commission (CNMV) and states that Morgan Stanley Research has been written and distributed in accordance with the rules of conductapplicable to financial research as established under Spanish regulations; in the US by Morgan Stanley & Co. LLC, which accepts responsibility for itscontents. Morgan Stanley & Co. International plc, authorized by the Prudential Regulatory Authority and regulated by the Financial Conduct Authority andthe Prudential Regulatory Authority, disseminates in the UK research that it has prepared, and approves solely for the purposes of section 21 of theFinancial Services and Markets Act 2000, research which has been prepared by any of its affiliates. RMB Morgan Stanley (Proprietary) Limited is a memberof the JSE Limited and regulated by the Financial Services Board in South Africa. RMB Morgan Stanley (Proprietary) Limited is a joint venture ownedequally by Morgan Stanley International Holdings Inc. and RMB Investment Advisory (Proprietary) Limited, which is wholly owned by FirstRand Limited. Theinformation in Morgan Stanley Research is being disseminated by Morgan Stanley Saudi Arabia, regulated by the Capital Market Authority in the Kingdomof Saudi Arabia , and is directed at Sophisticated investors only.The information in Morgan Stanley Research is being communicated by Morgan Stanley & Co. International plc (DIFC Branch), regulated by the DubaiFinancial Services Authority (the DFSA), and is directed at Professional Clients only, as defined by the DFSA. The financial products or financial services towhich this research relates will only be made available to a customer who we are satisfied meets the regulatory criteria to be a Professional Client.The information in Morgan Stanley Research is being communicated by Morgan Stanley & Co. International plc (QFC Branch), regulated by the QatarFinancial Centre Regulatory Authority (the QFCRA), and is directed at business customers and market counterparties only and is not intended for RetailCustomers as defined by the QFCRA.As required by the Capital Markets Board of Turkey, investment information, comments and recommendations stated here, are not within the scope ofinvestment advisory activity. Investment advisory service is provided exclusively to persons based on their risk and income preferences by the authorizedfirms. Comments and recommendations stated here are general in nature. These opinions may not fit to your financial status, risk and return preferences.For this reason, to make an investment decision by relying solely to this information stated here may not bring about outcomes that fit your expectations.The trademarks and service marks contained in Morgan Stanley Research are the property of their respective owners. Third-party data providers make nowarranties or representations relating to the accuracy, completeness, or timeliness of the data they provide and shall not have liability for any damagesrelating to such data. The Global Industry Classification Standard (GICS) was developed by and is the exclusive property of MSCI and S&P.Morgan Stanley Research, or any portion thereof may not be reprinted, sold or redistributed without the written consent of Morgan Stanley.
INDUSTRY COVERAGE: India Healthcare
COMPANY (TICKER) RATING (AS OF) PRICE* (04/04/2016)
Sameer Baisiwala, CFABiocon Ltd (BION.NS) O (04/05/2016) Rs492.00Cadila Healthcare Ltd. (CADI.NS) O (01/29/2016) Rs315.15Cipla Ltd. (CIPL.NS) U (08/13/2013) Rs514.30Dr. Reddy's Lab (REDY.NS) E (11/26/2015) Rs3,011.75GlaxoSmithKline Pharma (GLAX.NS) U (02/28/2013) Rs3,758.05Glenmark Pharmaceuticals (GLEN.NS) O (12/13/2012) Rs800.20IPCA Laboratories (IPCA.NS) E (07/25/2014) Rs569.90Lupin Ltd. (LUPN.NS) O (10/03/2006) Rs1,461.15Sun Pharmaceutical Industries (SUN.NS) E (12/21/2015) Rs815.05
Stock Ratings are subject to change. Please see latest research for each company.* Historical prices are not split adjusted.
© 2016 Morgan Stanley
| April 5, 2016Biocon Ltd
33