Embed Size (px)
Citation preview
April2018
1
April 2018
ATARI
April2018
2
In this strategic presentation, the terms "Atari“ and/or the "Company" mean Atari. The term "Group" means the group of
companies belonging to the parent Company and all companies within its consolidation’s scope.
This strategic presentation contains statements relating to ongoing or future projects, future financial and operating
results and other statements about Atari’s managements’ future expectations, beliefs, goals, plans or prospects that are
based on current expectations, estimates, forecasts and projections about Atari, as well as company’s future performance
and the industries in which Atari operate will operate, in addition to managements’ assumptions. Words such as
“expects,” “anticipates,” “targets,” “goals,” “projects,” “intends,” “plans,” “believes,” “seeks,” “estimates,” variations of
such words and similar expressions are intended to identify such forward-looking statements which are not statements of
historical facts.
These forward-looking statements are not guarantees of future performance and involve certain risks, uncertainties and
assumptions that are difficult to assess. Therefore, actual outcomes and results may differ materially from what is
expressed or forecasted in such forward-looking statements. These risks and uncertainties are based upon a number of
important factors including, among others: political and economic risks of our respective global operations; changes to
existing regulations or technical standards; existing and future litigation; difficulties and costs in protecting intellectual
property rights and exposure to infringement claims by others summarized in chapter 8 of the company’s annual report
registered to the AMF under the number D17-0823 on August 3, 2017 and its update registered with the AMF under the
number D17-0823-A01 on January 16, 2018.
For a more complete list and description of such risks and uncertainties, refer to Chapter 8 in Atari’s annual report. Except
as required by the rules and regulations of the AMF, Atari disclaims any intention or obligation to update any forward-
looking statements after the distribution of this document, whether as a result of new information, future events,
developments, changes in assumptions or otherwise.
Any investment in Atari shares, which have a highly volatile stock price, represents a significant risk.
Disclosure

April2018
3
ATARI Management
Todd Shallbetter C.O.O. Distribution
• Strong knowledge of Atari’s historical andfuture businesses
• Game production background in digital andphysical products
• Leads Business Development efforts
Philippe Mularski C.F.O.
• Chartered Accountant and Auditor
• Previously Interim Manager, CFO inLagardère Group and AccountingDirector for Sucres & Denrées Group
• Joined the Atari Group in 2014
Jean Marcel Nicolai C.O.O. Games
• Former Head of Walt Disney gamedevelopment studios world
• Strong experience across all platforms
• Strong knowedge of the brand (was withAtari from 2000 to 2007)
Michael Arzt C.O.O. Atari Connect
• Former SVP General Manager forSamsung’s World Cyber Games
• Strong experience in Entertainment
• In charge of the Ataribox
Frederic Chesnais C.E.O.
• Largest shareholder of the Atari Group
• Former Deputy-COO and CFO of the AtariGroup from 2001 to 2004, CEO of AtariInteractive until 2007 – Came back early 2013
• Huge experience in Executive production

April2018
4
April2018
4
Agenda
1
Strategy
& Outlook
2
Games
2018/2019
3
Atari VCS
4
Blockchain
5
Financials
6
Shareholding
April2018
5
ATARI
April 2018
5
STRATEGY& OUTLOOK
1
April2018
6
1 – Strategy & Outlook
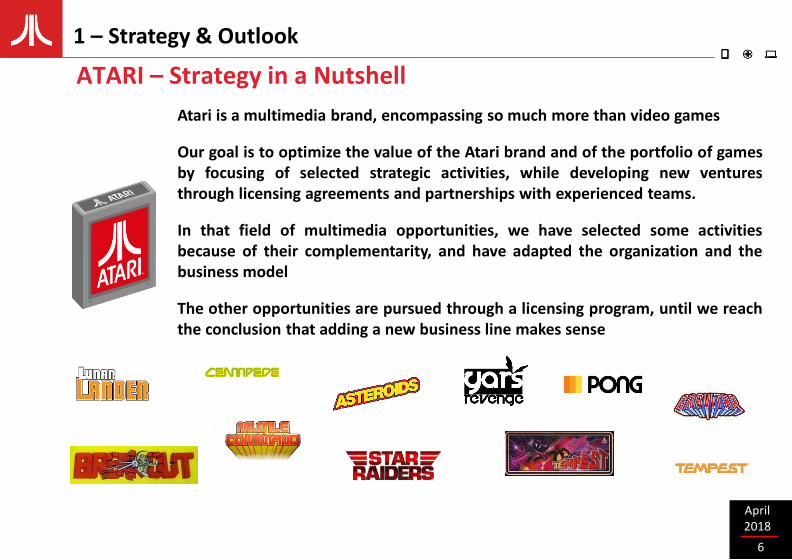
ATARI – Strategy in a Nutshell
Atari is a multimedia brand, encompassing so much more than video games
Our goal is to optimize the value of the Atari brand and of the portfolio of gamesby focusing of selected strategic activities, while developing new venturesthrough licensing agreements and partnerships with experienced teams.
In that field of multimedia opportunities, we have selected some activitiesbecause of their complementarity, and have adapted the organization and thebusiness model
The other opportunities are pursued through a licensing program, until we reachthe conclusion that adding a new business line makes sense

April2018
7
1 – Strategy & Outlook
ATARI – Global POP Culture icon
Created in 1972
Launched the video gaming industry as we know it▪ Revolutionized technology, media and game play▪ Trail-blazed through innovation and trend-setting
Defined a generation socially and culturally
Established a valuable and extensive franchise portfolio▪ Top 10 franchises: historical revenues over$2 billion▪ Over 200 titles with rich history and iconic images
April2018
8
1 – Strategy & Outlook

April2018
9
$2.0 Billion
CA Historique
$525 Million
$456 Million
$85 Million $391 Million
$92 Million
$265 Million
$154 Million
™
Atari’s Top Classic Titles have Generated > $2 Billion in Gaming Revenue
1 – Strategy & Outlook

April2018
10
So much more than video games
1 – Strategy & Outlook

April2018
11
A unique vault of entertainment content
▪ Worldwide recognition in the entertainment content space,cross-generational
▪ Full ownership of all IPs, except for the RollerCoater Tycoonlicense from Chris Sawyer
▪ Each IP of the vault can be the basis of a new franchise; this is amultimedia opportunity
1 – Strategy & Outlook

April2018
12
(2017)
(1982)
Still going strong today …
1 – Strategy & Outlook
A u t h e n t i c a n d E n d u r i n g B r a n d P o w e r
April2018
13
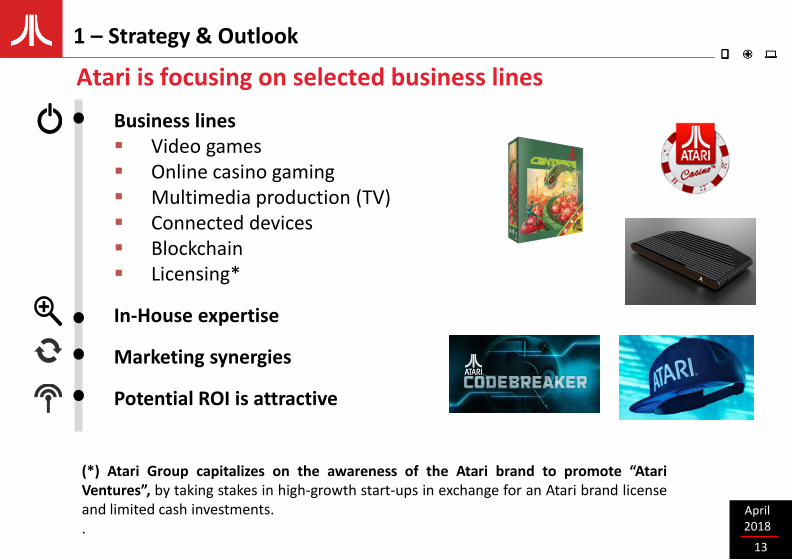
(*) Atari Group capitalizes on the awareness of the Atari brand to promote “AtariVentures”, by taking stakes in high-growth start-ups in exchange for an Atari brand licenseand limited cash investments..
1 – Strategy & Outlook
Atari is focusing on selected business lines
Business lines▪ Video games▪ Online casino gaming▪ Multimedia production (TV)▪ Connected devices▪ Blockchain▪ Licensing*
In-House expertise
Marketing synergies
Potential ROI is attractive

April2018
14
The business model has been adapted to reach our goal
A hudge IP portfolio
Efficient production and operations
Effective digital marketing management
An experiencedManagement Team
STRONG ASSETS
TO MAXIMIZE
PROFITS
Global digital distribution is fully implemented and deployed
Fixed costs are at the lowest levels and production is externalized
Co-investmentsare favored withstudios or thirdparties
1 – Strategy & Outlook

April2018
15
A new simplified organization
€Team
ExecutiveProduction
ExternalStudios
DigitalDistribution
Community
ManagementLicensing
Box distribution
IPs
Atari Today
1 – Strategy & Outlook

April2018
16
Since 2013, the Atari Group has been relaunched with essentially 2 gamefranchises and a licensing program
▪ Rollercoaster Tycoon: PC, Mobile, and Switch / PS4 soon
▪ Atari Vault
▪ Licensing program: Atari Flashback, mini-arcades, ..
There are almost 200 games left in the catalog, and multimedia activitiesare gaining momentum
▪ Games: limited risk by using known IPs (Food Fight, Lunar Battle,…)
▪ Online casino
▪ Atari VCS
▪ TV and movie licenses
1 – Strategy & Outlook
April2018
17
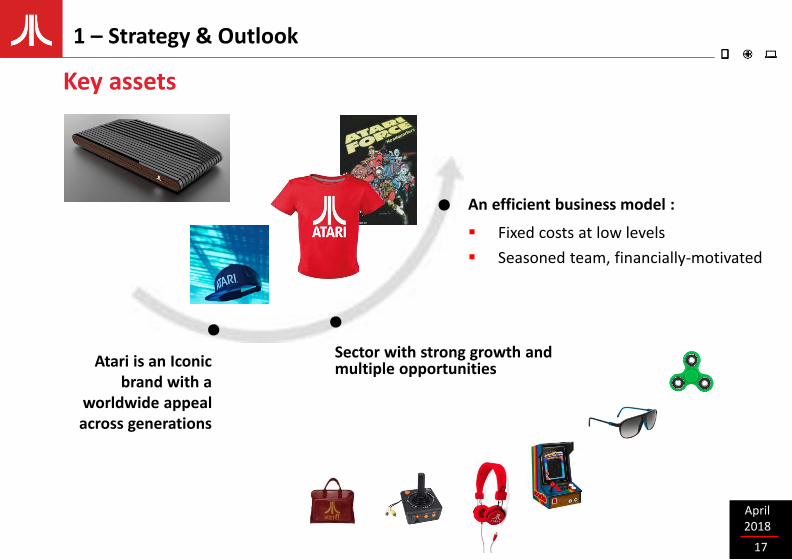
Atari is an Iconic brand with a
worldwide appeal across generations
Sector with strong growth and multiple opportunities
An efficient business model :
▪ Fixed costs at low levels
▪ Seasoned team, financially-motivated
1 – Strategy & Outlook
Key assets

April2018
18
ATARI
April 2018
18
GAMES2018-2019
2

April2018
19
2 – Games 2018-2019
Relive the golden age of video gameswith a new collection of 50 Atari hits
Build and ride breathtaking coastersin PS4 VR for the first time ever
The legendary arcade racing Game returns on iOS and Android
Jonathan “foodgod” ChebanIntroduces new food-themedcontent In Atari’s best-selling themepark sim for iOS and Android
Action-packed and visually stunning shooter based on the classic arcade game Tempest for Steam PC
Relive the golden age of video gameswith a new collection of 150 Atarihits specially developed for theNintendo Switch
April2018
20
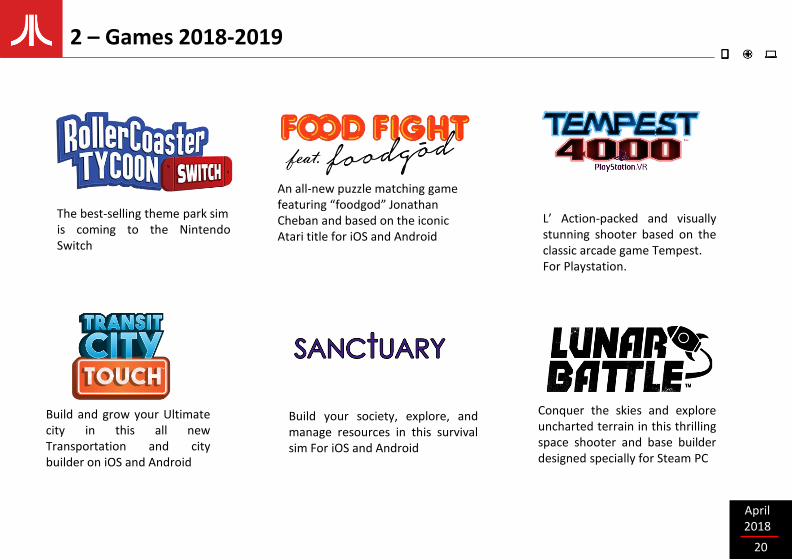
L’ Action-packed and visuallystunning shooter based on theclassic arcade game Tempest.For Playstation.
An all-new puzzle matching game featuring “foodgod” Jonathan Cheban and based on the iconic Atari title for iOS and Android
The best-selling theme park simis coming to the NintendoSwitch
Build your society, explore, andmanage resources in this survivalsim For iOS and Android
Build and grow your Ultimatecity in this all newTransportation and citybuilder on iOS and Android
Conquer the skies and exploreuncharted terrain in this thrillingspace shooter and base builderdesigned specially for Steam PC
2 – Games 2018-2019

April2018
21
ATARI
April 2018
21
ATARI VCS
3

April2018
22
3 - Atari VCS
More than 500 000 Flashback consoles (plug-and-play) are sold each year.
Atari VCS : a new platform to bring the best of the PC experience to the TV in 2018
▪ Games, Games, Games
▪ Media Content + Curation/Playlists
▪ Connected Products + Accessories
▪ Online store
To limit the risks, the Box will be first sold through a crowd-funding campaign and
can then be licensed to a third-party.

April2018
23
Partners:
▪ Controller
▪ Processor: AMD – Linux OS
▪ Manufacturing: Flextronics
Price / Timeline:
▪ SRP: $249 (depending on configuration)
▪ Crowd-funding campaign announced in April 2018
▪ Tool to estimate market potential
▪ Refer to website
3 - Atari VCS

April2018
24
ATARI
April 2018
24
BLOCKCHAIN
4

April2018
25
4 - Blockchain
Short-term / long-term impact of blockchain technology
▪ Important potential, technology revolution
▪ Strategic impact, even if speculation in crypto-currency sometimes blurs the
potential of crypto-industrial projects
Atari Strategy :
▪ Do not ignore the technology, be part of the revolution
▪ Favor partnerships, with limited cash investments
Investments completed :
▪ Unlimited Networks (Atari Token)
▪ Crypto-casinos, with Pariplay (Pong Token)
Refer to Press Release of February 8, 2018 on the Atari website http://www.atari-investisseurs.fr/communiques-de-presse
April2018
26
ATARI
April 2018
26
5
FINANCIALS
April2018
27
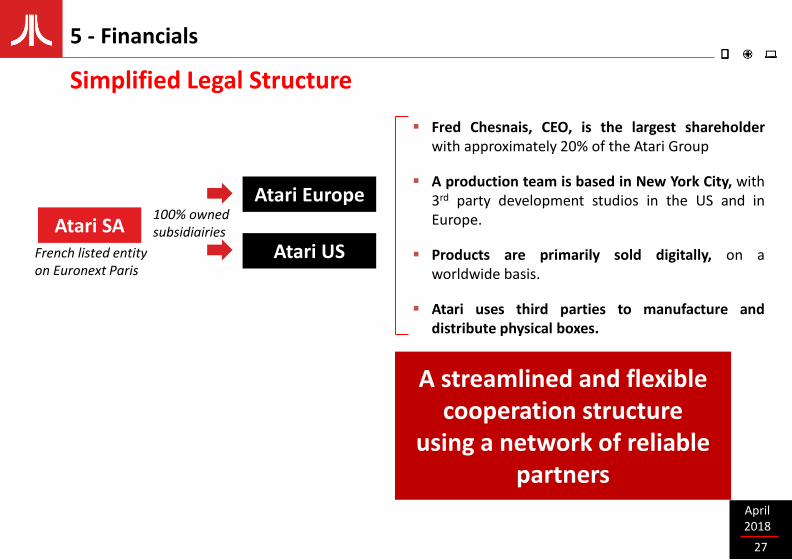
5 - Financials
Atari SAFrench listed entity on Euronext Paris
100% owned subsidiairies
Atari US
Atari Europe
▪ Fred Chesnais, CEO, is the largest shareholderwith approximately 20% of the Atari Group
▪ A production team is based in New York City, with3rd party development studios in the US and inEurope.
▪ Products are primarily sold digitally, on aworldwide basis.
▪ Atari uses third parties to manufacture anddistribute physical boxes.
A streamlined and flexible cooperation structure
using a network of reliable partners
Simplified Legal Structure
April2018
28
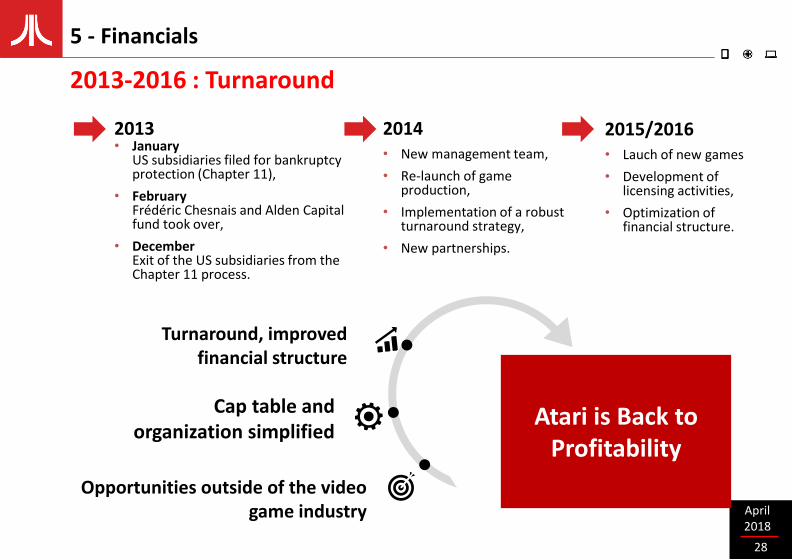
2013-2016 : Turnaround
Cap table and organization simplified
Turnaround, improvedfinancial structure
Atari is Back to Profitability
2013• January
US subsidiaries filed for bankruptcy protection (Chapter 11),
• FebruaryFrédéric Chesnais and Alden Capital fund took over,
• DecemberExit of the US subsidiaries from the Chapter 11 process.
2014• New management team,
• Re-launch of game production,
• Implementation of a robust turnaround strategy,
• New partnerships.
2015/2016• Lauch of new games
• Development of licensing activities,
• Optimization of financial structure.
Opportunities outside of the video game industry
5 - Financials
April2018
29
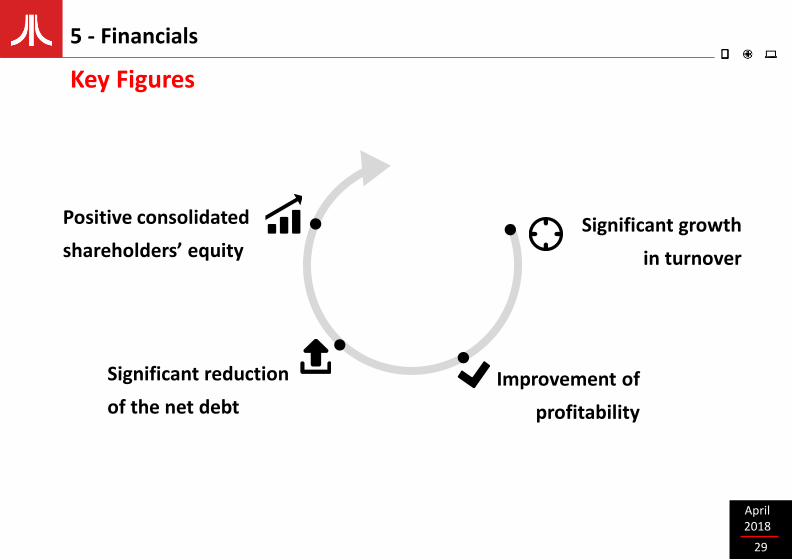
Key Figures
Significant growth
in turnover
Positive consolidated
shareholders’ equity
Improvement of
profitability
Significant reduction
of the net debt
5 - Financials

April2018
30
Consolidated Statements as at March 31, 2017
Net revenue : 15,4 M€
▪ An increase in turnover of 29%
Operating income: + 8,5 M€
▪ Other operating income : +6,6 M€ including +7,1 M€ related to the gain of the redemption of the Alden loan.
Net consolidated income : + 7,7 M€
▪ Cost of debt : - 0,8 M€(in annual trend: 0,1 M€)
▪ Other financial income : + 0,0 M€
Current operating income : + 1,9 M€
▪ An increase of more than 36%
(1) Restated under IAS8
5 - Financials
(M€) 31.03.2017 31.03.2016 (1)
Revenue 15,4 11,9
Cost of goods sold (3,9) (1,8)
GROSS MARGIN 11,5 10,1
in % of Revenue 83,7% 83,8%
CURRENT OPERATING INCOME (LOSS) 1,9 1,4
in % of Revenue 14,1% 2,3%
OPERATING INCOME (LOSS) 8,5 0,0
in % of Revenue 3,5% 20,2%
NET INCOME (LOSS) FOR THE YEAR 7,7 (0,1)
April2018
31
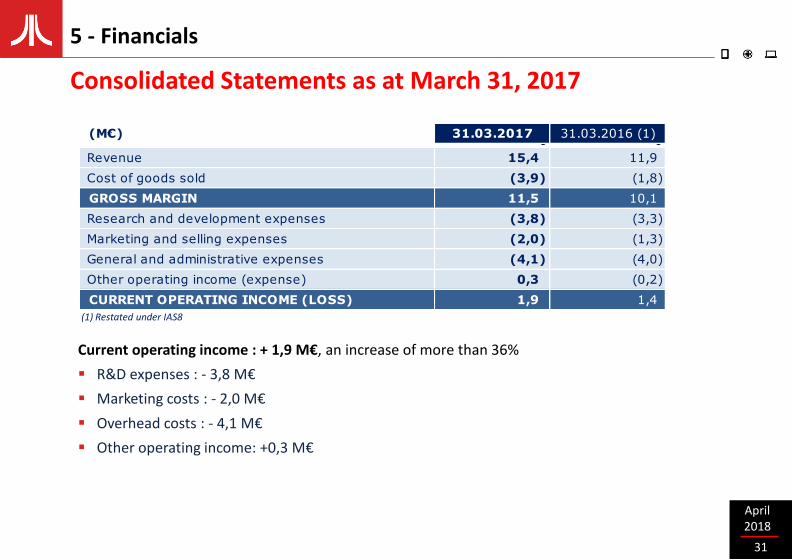
Consolidated Statements as at March 31, 2017
Current operating income : + 1,9 M€, an increase of more than 36%
▪ R&D expenses : - 3,8 M€
▪ Marketing costs : - 2,0 M€
▪ Overhead costs : - 4,1 M€
▪ Other operating income: +0,3 M€
5 - Financials
(M€) 31.03.2017 31.03.2016 (1)0 0
Revenue 15,4 11,9
Cost of goods sold (3,9) (1,8)
GROSS MARGIN 11,5 10,1
Research and development expenses (3,8) (3,3)
Marketing and selling expenses (2,0) (1,3)
General and administrative expenses (4,1) (4,0)
Other operating income (expense) 0,3 (0,2)
CURRENT OPERATING INCOME (LOSS) 1,9 1,4
(1) Restated under IAS8

April2018
32
Consolidated Statements as at September 30, 2017
Net revenue : 8,5 M€
▪ An increase in turnover of 41%
Operating income: + 1,3 M€
▪ September 2016 : +7,1 M€ related to the gain of the redemption of the Alden loan
Net consolidated income: + 1,1 M€
▪ Cost of debt : - 0,1 M€
▪ Other financial income : - 0,1 M€
Current operating income : + 1,2 M€
▪ An increase of 260%
(M€) 30.09.2017 30.09.2016
Chiffre d'affaires 8,5 6,0
Coût des ventes (1,1) (1,1)
MARGE BRUTE 7,3 5,0
en % du chiffre d'affaires 86,5% 82,3%
RESULTAT OPERATIONNEL COURANT 1,2 0,3
en % du chiffre d'affaires 13,9% 5,4%
RESULTAT OPERATIONNEL 1,3 7,9
Résultat net des activités non poursuivies - -
RESULTAT NET DE L'ENSEMBLE CONSOLIDE 1,1 7,4
5 - Financials

April2018
33
Current operating income : + 1,2 M€, X 3,6 versus September 2016
▪ Research & development : Expensed 4,3 M€ - Capitalized 3,1 M€ - Amortization 1,0 M€ = 2,2M€
▪ Marketing expenses : 1,9 M€, significant increase due to RCT Touch
▪ Overhead expenses : 1,7 M€ under control
▪ Other operating expenses : - 0,4 M€, mainly depreciation on receivables
Consolidated Statements as at September 30, 2017
5 - Financials
(M€) 30.09.2017 30.09.2016
Revenue 8,5 6,0
Cost of goods sold (1,1) (1,1)
GROSS MARGIN 7,3 5,0
Research and development expenses (2,2) (2,0)
Marketing and selling expenses (1,9) (0,6)
General and administrative expenses (1,7) (2,0)
Other operating income (expense) (0,4) (0,1)
CURRENT OPERATING INCOME (LOSS) 1,2 0,3
April2018
34
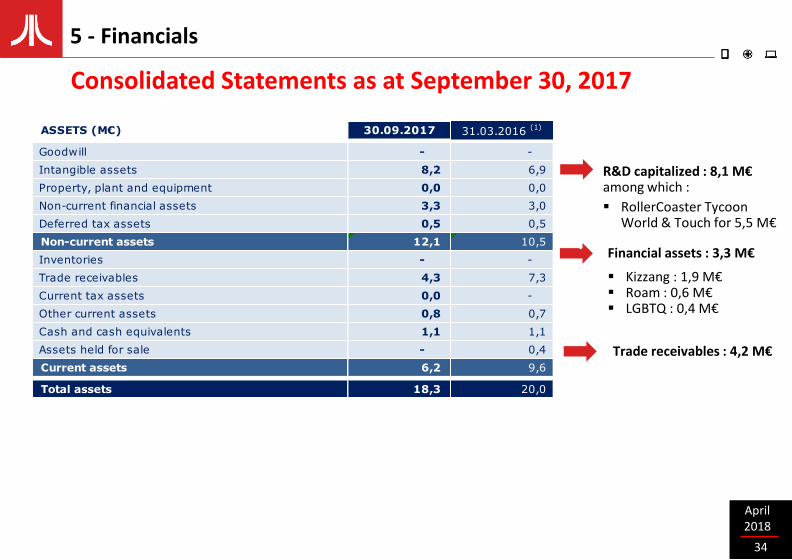
R&D capitalized : 8,1 M€ among which :
▪ RollerCoaster Tycoon World & Touch for 5,5 M€
Trade receivables : 4,2 M€
Financial assets : 3,3 M€
▪ Kizzang : 1,9 M€▪ Roam : 0,6 M€▪ LGBTQ : 0,4 M€
Consolidated Statements as at September 30, 2017
5 - Financials
<<<<<<<<<<<<
ASSETS (M€) 30.09.2017 31.03.2016 (1)
Goodwill - -
Intangible assets 8,2 6,9
Property, plant and equipment 0,0 0,0
Non-current financial assets 3,3 3,0
Deferred tax assets 0,5 0,5
Non-current assets 12,1 10,5
Inventories - -
Trade receivables 4,3 7,3
Current tax assets 0,0 -
Other current assets 0,8 0,7
Cash and cash equivalents 1,1 1,1
Assets held for sale - 0,4
Current assets 6,2 9,6
Total assets 18,3 20,0

April2018
35
Positive equity : 7,8 M€
Debt net : - 0,9 M€Versus -13,3 M€ as at March 31, 2016
Current liabilities: 8,1 M€ among which▪ 5,8 M€ Trade payables▪ 0,9 M€ deferred income.
Consolidated Statements as at September 30, 2017
5 - Financials
EQUITY & LIABILITIES (M€) 30.09.2017 31.03.2016 (1)
Capital stock 2,3 2,3
Share premium 7,5 7,5
Consolidated reserves (3,1) (10,1)
Net Income (Group share) 1,2 7,7
Shareholders' equity 7,9 7,4
Minority interests 0,0 0,0
Total equity 7,9 7,4
Provisions for non-current contingencies and losses 0,2 0,3
Non-current financial liabilities 2,0 2,0
Deferred tax liabilities - -
Other non-current liabilities - 0,0
Non-current liabilities 2,3 2,3
Provisions for current contingencies and losses 0,4 0,4
Current financial liabilities - -
Trade payables 5,8 6,3
Current tax liabilities - 0,0
Other current liabilities 2,0 3,6
Current liabilities 8,1 10,3
Total equity and liabilities 18,3 20,0
April2018
36
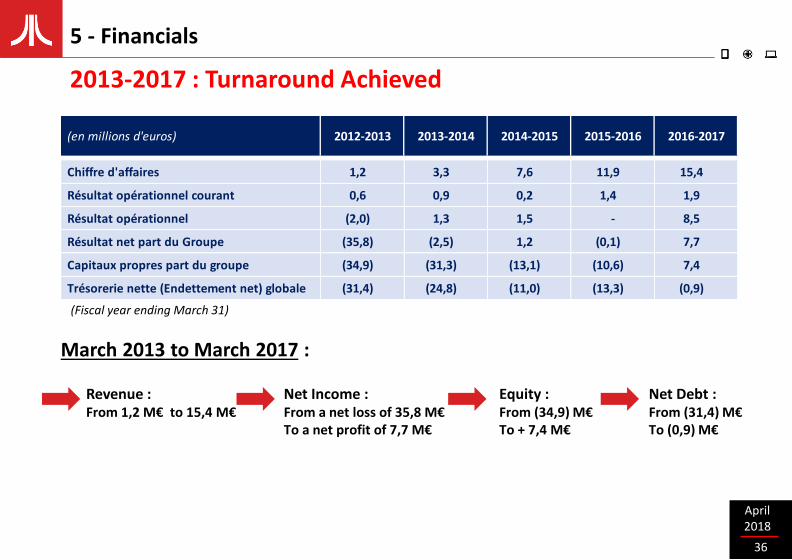
Revenue : From 1,2 M€ to 15,4 M€
Net Income :From a net loss of 35,8 M€To a net profit of 7,7 M€
Equity :From (34,9) M€ To + 7,4 M€
Net Debt :From (31,4) M€ To (0,9) M€
March 2013 to March 2017 :
(Fiscal year ending March 31)
(en millions d'euros) 2012-2013 2013-2014 2014-2015 2015-2016 2016-2017
Chiffre d'affaires 1,2 3,3 7,6 11,9 15,4
Résultat opérationnel courant 0,6 0,9 0,2 1,4 1,9
Résultat opérationnel (2,0) 1,3 1,5 - 8,5
Résultat net part du Groupe (35,8) (2,5) 1,2 (0,1) 7,7
Capitaux propres part du groupe (34,9) (31,3) (13,1) (10,6) 7,4
Trésorerie nette (Endettement net) globale (31,4) (24,8) (11,0) (13,3) (0,9)
2013-2017 : Turnaround Achieved
5 - Financials

April2018
37
Net debt significantly reduced
▪ Net financial debt decreased from -31,4 M€ in March 2013 to - 0,9 M€ in March 2017
▪ As at March 31, 2018 the OCEANEs 2015-2020 are fully reimbursed.
▪ As at March 31, 2018 only the OCEANEs 2003-2020 for 0,6 M€ maturity for 2020.
▪ As at March 31, 2018 the Group has a positive net cash position.
A very significant reduction of the net debt
5 - Financials
(€ million) March 31, 2013 March 31, 2014 March 31, 2015 March 31, 2016 March 31, 2017
OCEANEs 2019 (18,4) - - -
ORANES (1,7)
OCEANEs 2003-2020 (0,6) (0,6) (0,6) (0,6) (0,6)
OCEANEs 2015-2020 - (1,2) (1,3) (1,4)
Alden loan (22,7) (11,5) (12,1) (12,5) -
Others (8,4) (0,7) (0,2) -
Gross Financial Debt (33,4) (30,5) (14,6) (14,5) (2,0)
Cash and cash equivalents 2,0 5,8 3,7 1,2 1,1
Net Financial Debt (31,4) (24,8) (11,0) (13,3) (0,9)
April2018
38
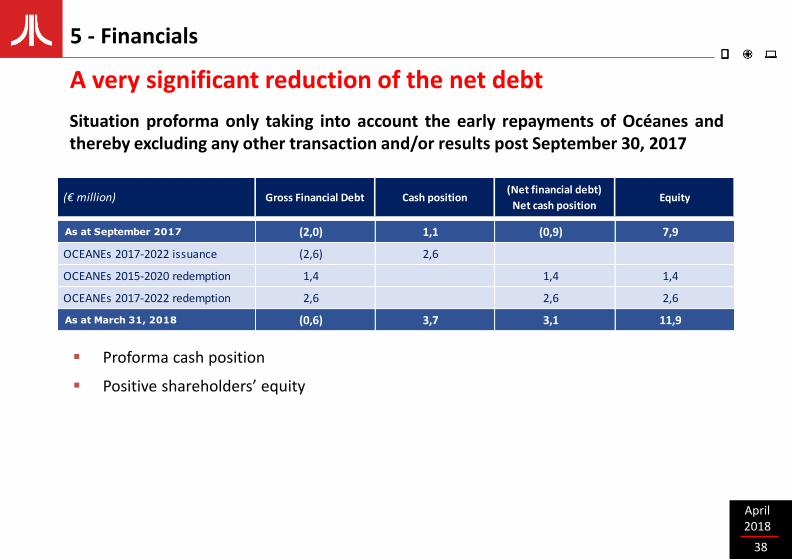
▪ Proforma cash position
▪ Positive shareholders’ equity
Situation proforma only taking into account the early repayments of Océanes andthereby excluding any other transaction and/or results post September 30, 2017
A very significant reduction of the net debt
5 - Financials
(€ million) Gross Financial Debt Cash position(Net financial debt)
Net cash positionEquity
As at September 2017 (2,0) 1,1 (0,9) 7,9
OCEANEs 2017-2022 issuance (2,6) 2,6
OCEANEs 2015-2020 redemption 1,4 1,4 1,4
OCEANEs 2017-2022 redemption 2,6 2,6 2,6
As at March 31, 2018 (0,6) 3,7 3,1 11,9

April2018
39
➢ In France, tax loss carry-forwards come to 735 million euros.
▪ Potential tax savings : circa 245 million euros, subject to usual applicable tax limitations.
▪ Potential tax savings per share : circa 1,08 €(calculated on the basis of shares outstanding as at March 31, 2017 less treasury shares).
➢ In the United States, the US tax authorities confirmed at the beginning of 2017,the tax-loss carry-forwards of nearly 600 million US dollars.
▪ Potential tax savings : circa 200 million US dollars, subject to usual applicable tax limitations.
▪ Potential tax savings per share : circa 0,88 $(calculated on the basis of shares outstanding as at March 31, 2017 less treasury shares).
Deferred Tax Assets
5 - Financials

April2018
40
ATARI
April 2018
40
SHAREHOLDING
6
April2018
41
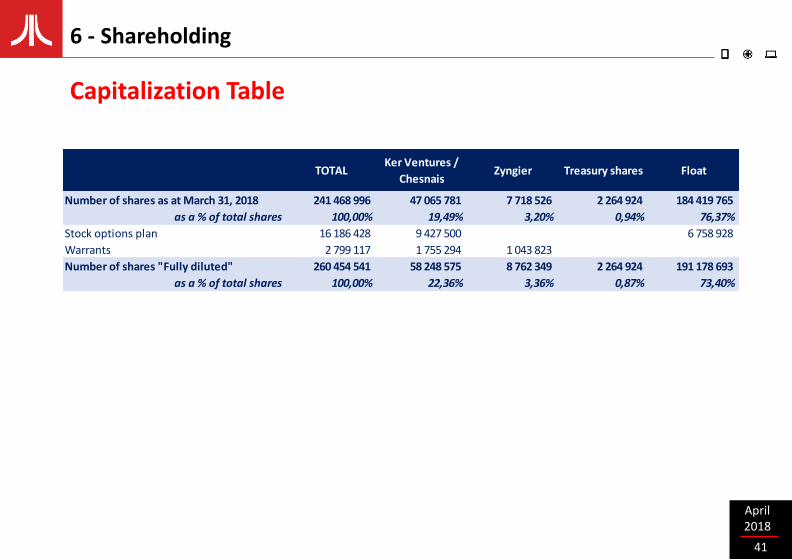
Capitalization Table
6 - Shareholding
TOTALKer Ventures /
ChesnaisZyngier Treasury shares Float
Number of shares as at March 31, 2018 241 468 996 47 065 781 7 718 526 2 264 924 184 419 765
as a % of total shares 100,00% 19,49% 3,20% 0,94% 76,37%
Stock options plan 16 186 428 9 427 500 6 758 928
Warrants 2 799 117 1 755 294 1 043 823
Number of shares "Fully diluted" 260 454 541 58 248 575 8 762 349 2 264 924 191 178 693
as a % of total shares 100,00% 22,36% 3,36% 0,87% 73,40%

April2018
42
0,15 €
0,20 €
0,25 €
0,30 €
0,35 €
0,40 €
0,45 €
0,50 €
0,55 €
0,60 €
0,65 €
0,70 €
0,75 €
0,80 €
0,85 €
avr.-17 mai-17 juin-17 juil.-17 août-17 sept.-17 oct.-17 nov.-17 déc.-17 janv.-18 févr.-18
Evolution du cours de bourse depuis le 01/04/2017
Stock price evolution
6 - Shareholding

April2018
43
Volumes traded on NYSE Euronext
6 - Shareholding
0
3 000 000
6 000 000
9 000 000
12 000 000
15 000 000
18 000 000
21 000 000
24 000 000
27 000 000
30 000 000
33 000 000
36 000 000
39 000 000
42 000 000
45 000 000
48 000 000
51 000 000
54 000 000
57 000 000
60 000 000
avr.-17 mai-17 juin-17 juil.-17 août-17 sept.-17 oct.-17 nov.-17 déc.-17 janv.-18 févr.-18 mars-18
Volumes échangés depuis le 01/04/2017

April2018
44
Thank youfor your
attention
www.atari-investisseurs.fr