Embed Size (px)
Citation preview

Measures under Pressure
I
Graduate Business School
School of Economics and Commercial Law
Göteborg University
International Management Master Thesis 1999:
Measures under Pressure
- Applicable Types of Performance Measurements for
Strategy Implementation at KappAhl and Skandia AFS
Johan Bengtsson and Jörg Jung

Measures under Pressure
II
ABSTRACT
n today’s business environment concepts such as stakeholder value and service management have become extremely important to satisfy employees, customers and
shareholders. This thesis focuses on how service companies can use different
performance measurements for management control purposes to identify what types of
measures are most applicable for strategy implementation. The research gets investigated
from several different perspectives: consultants, academics, and case companies. The
theoretical framework is adopted as a model for combining concepts of performance- and service management, while the empirical study encompasses KappAhl and Skandia AFS
performance measurement systems. The emphasis is put on different types of performance
measurements from a matrix point of view, which besides the three research perspectives
explores the best practice (theory), the actual use (empirical) and applicability (analysis) in
order to obtain high quality outcome. The basis for monitoring performance in the case companies has been based upon the Balanced Scorecard concept as being the most well-
known performance measurement system. This thesis identifies not only what variables
create real shareholder value, but also what types of measures deliver sustained future
success to service organisations in general.
Key Words: Strategy implementation, management control, performance
measurement, service management, measurement systems and types,
stakeholder value, balanced scorecard
“If you want something to be done, measure it. If you cannot define it, you cannot measure it. If you cannot measure it, you cannot manage it. If you cannot manage it, you cannot improve it” [KPMG]
I

Measures under Pressure
III
ACKNOWLEDGEMENTS
e would like to show our deepest gratitude to all people that have been involved in our thesis process. First, we would like to thank our case
companies KappAhl and Skandia AFS for making the research possible. A
special thought we would like to give to Marianne Ax and Lotta Leuckfeld at
Skandia AFS as well as Peter Karlsson and Hakan Westin at KappAhl.
We cannot, however, let this opportunity pass without expressing our deep obligations to
the consultancies that provided us with invaluable insights and reflections upon our
research and ideas. First of all we would like to thank Martin Sande as a discussion partner
in the initial phases of the thesis process. Moreover, we would like to express our gratitude
to KPMG Consulting in Gothenburg and especially Sven-Martin Åkesson for sharing
valuable knowledge. And last but not least we are indebted with the guidance and fruitful discussions of Nils-Göran Olve from Cepro Consultancy.
Further we would like to express our appreciation to all academics from the
School of Economics and Commercial Law at Gothenburg University and
especially the Graduate Business School. Many thanks also goes to Torbjörn
Stjernberg whose critical comments and suggestions we appreciated.
Finally we would like to express our unfathomable gratitude to Ingemar Claesson for
valuable and insightful advice and excellent business contacts, which have contributed to
this thesis to a very high extent.
Johan Bengtsson and Jörg Jung Gothenburg, Sweden
December 1999
W
Measures under Pressure
IV
TABLE OF CONTENTS 1. INTRODUCTION ...................................................................................1
1.1 SERVICE DEVELOPMENT....................................................................2 1.2 PROBLEM STATEMENT.......................................................................3 1.3 PURPOSE...........................................................................................3 1.4 PERSONAL INTENTION .......................................................................3 1.5 DELIMITATION ....................................................................................4 1.6 METHODOLOGY .................................................................................4
1.6.1 Research Perspective ..................................................................5 1.6.2 Research Approach.....................................................................5 1.6.3 Research Parties.........................................................................6 1.6.4 Thesis Process ............................................................................7
2. THEORETICAL FRAMEWORK .........................................................8
2.1 PERFORMANCE MANAGEMENT ..........................................................8 2.1.1 Measurement Approaches ......................................................9
2.1.1.1 Basis for Measurements .....................................................9 2.1.1.2 Measurement Classification ............................................11 2.1.1.3 Basic Types of Measures .................................................13
2.1.2 Measurement Correlations....................................................14 2.1.2.1 Performance Drivers and Outcome Measures.............14 2.1.2.2 Primary vs. Secondary Objectives .................................15 2.1.2.3 Cause – Effect - Relationship ..........................................15
2.1.3 Strategic Impact on Performance .......................................16 2.1.3.1 Generic perspectives on strategy ..................................16 2.1.3.2 Strategic Control ................................................................18 2.1.3.3 Strategic Concept of Performance .................................19
2.2 SERVICE MANAGEMENT...................................................................20 2.2.1 The character of a service ....................................................22 2.2.2 Service Management System...............................................22 2.2.3 Stakeholder Approach ...........................................................24 2.2.4 Customer Satisfaction ...........................................................26 2.2.5 Moments of Truth ...................................................................27 2.2.6 Organisational Learning ........................................................28
2.2.6.1 Positive Feedback Loops ................................................28 2.2.6.2 Double-Loop Learning .....................................................29

Measures under Pressure
V
2.3 PERFORMANCE MEASUREMENT MODELS ........................................30 2.3.1 Balanced Scorecard (BSC)...................................................30 2.3.2 Performance Pyramid (PP) ..................................................31 2.3.3 EPPM and EFQM .................................................................33 2.3.4 Performance Measurement System for Services .............34 2.3.5 “Economic Value” Measures.................................................37
2.4 PREVIOUS RESEARCH .....................................................................37
3. EMPIRICAL STUDY............................................................................39
3.1 KAPPAHL .........................................................................................40 3.1.1 The measurement system ....................................................41 3.1.2 Types of measurements........................................................43
3.2 SKANDIA AFS..................................................................................45 3.2.1 The Measurement System....................................................46 3.2.2 Types of Measurements.......................................................49
3.3 CONSULTANTS VIEW........................................................................51 3.4 EXPERTS VIEW ................................................................................54
3.4.1 Previous research ...................................................................54 3.4.2 Academics ...............................................................................56
3.4.2.1 Strategic Control ...............................................................56 3.4.2.2 Performance Measures ....................................................58
4. ANALYSIS.............................................................................................61
4.1 FRAMEWORK OF INVESTIGATIONS....................................................62 4.1.1 The Use of Performance Measurement Systems ..............63 4.1.2 Types of Performance Measurement ...................................64
4.2 KAPPAHL .........................................................................................64 4.2.1 The strategy process ..............................................................65 4.2.2 Performance measurement system ......................................65 4.2.3 Types of performance measurements ..................................67 4.2.4 Connection to strategy............................................................68
4.3 SKANDIA AFS..................................................................................69 4.3.1 The Strategy Process .............................................................69 4.3.2 Performance Measurement System .....................................70 4.3.3 Types of Performance Measurements .................................72 4.3.4 Connection to Strategy ...........................................................73
4.4 A MODEL APPLICABLE TO THE GENERAL SERVICE INDUSTRY .........74 4.5 CRITICAL APPROACHES TO PERFORMANCE MEASUREMENTS .........77
4.5.1 The BSC as a Product...........................................................77 4.5.2 Failure Approach as a Success Formula ............................78 4.5.3 Means Towards Financial Ends ..........................................79

Measures under Pressure
VI
5. FURTHER REFLECTIONS.................................................................81
5.1 CATALYTIC MECHANISMS ................................................................81 5.2 FAILURE ANALYSIS ..........................................................................83 5.3 HAWTHORN EFFECTS ......................................................................84
BIBLIOGRAPHY .......................................................................................94
INTERVIEWS AND MEETINGS ........................................................... 101
APPENDICES APPENDIX 1: EXAMPLES OF MEASURES AT KAPPAHL APPENDIX 2: INTELLECTUAL CAPITAL MEASURES AT SKANDIA APPENDIX 3: SKANDIA NAVIGATOR MEASUREMENTS APPENDIX 4: INTERVIEW GUIDE/DISCUSSION TOPICS

Measures under Pressure
VII
LIST OF FIGURES
FIGURE 1: DETERMINANTS OF RESEARCH ......................................................6 FIGURE 2: DIMENSIONS OF PERFORMANCE ..................................................12 FIGURE 3: CAUSE–AND-EFFECT RELATIONSHIP...........................................16 FIGURE 4: GENERIC STRATEGIES ................................................................17 FIGURE 5: PERFORMANCE MANAGEMENT ...................................................20 FIGURE 6: SERVICE MANAGEMENT SYSTEM................................................23 FIGURE 7: STAKEHOLDER PERFORMANCE APPROACH..................................25 FIGURE 8: FEEDBACK LOOPS ......................................................................29 FIGURE 9: BALANCED SCORECARD .............................................................31 FIGURE 10: PERFORMANCE PYRAMID .........................................................32 FIGURE 11: EFQM MODEL .........................................................................33 FIGURE 12: BSC FOR SERVICES ..................................................................35 FIGURE 13: PMSSI ....................................................................................36 FIGURE 14: KAPPAHL’S BSC .....................................................................42 FIGURE 15: IC AS A PART OF CORPORATE MARKET VALUE .........................47 FIGURE 15: SKANDIA’S NAVIGATOR ...........................................................48 FIGURE 15: PERFORMANCE MEASUREMENT MODEL....................................75

Measures under Pressure
1
1. Introduction
ighly competitive market conditions and growing globalisation are
business trends among others that have imposed new demands on
business, where customers demand broader product lines, higher
quality, more reliable delivery and lower prices. As a consequence, companies
have increased their investment in R&D, new technology and new processes
(Bromwhich and Bhimani, 1994). With these changes in the business
environment, there has also been a growing interest in changing and
improving management control systems. Traditional methods of management
control have been under great critique by many academics and practitioners.
Companies have been criticized for the ways they plan their operations and
monitor performance.
The “relevance lost debate” by Johnson and Kaplan (1987) started the critique
that traditional cost accounting systems and financial measures produce
information that is too distorted, too aggregated, and too late to be useful in
reducing cost or improving productivity and to be relevant for manager’s
planning and control decisions. For decades, companies have measured
performance by financial indicators. This may have been adequate in the
industrial age, but in the current information and knowledge intensive milieu,
the value chain includes other perspectives such as service, customisation and
time. In today’s fast changing environment, financial statements are neither
adequate to measure competitiveness nor a guide for future performance. Vliet
(1997) argues that financial measures lead to short-term decision making, over
investments in easily valued assets and under investments in intangible assets
such as process innovation, employee skills and customer satisfaction. Today,
organizations operate in turbulent environments and executives need more
sophisticated feedback on performance.
The field of performance measurement has always been interesting in order to
monitor strategic direction. Management control is one of the main priorities
H

Measures under Pressure
2
for executives, because they need sophisticated feedback on decision-making.
Management insecurity is one of the main forces that drive measurement
systems. Feedback is needed in order to examine the changing environment
and to adjust strategic decisions. In the hustle for competitive advantage,
every executive is searching for the adequate performance measurements that
guide the way into the future.
1.1 Service Development
According to Looy, Dierdonck and Gemmel (1998), our economy can be
basically divided into three sectors. The primary includes farming, forestry
and fishing while the secondary is characterised by the industrial sector, which
has dominated during the last decades. The tertiary sector is a synonym for the
service sector that continuously increased in importance during the second
half of our century. Today our economy has shifted towards an information
and service focus. Historically, in the 19th century, the agricultural sector was
the dominant one in the Swedish economy with the main population employed
to “produce” foodstoffs. In the farming society, money was invested in soil,
which by that time was the most powerful resource to own . As a result of the
industrial revolution, people moved to the cities to work in factories, in which
they “produced” physical products. In this industrial society, investment was
made in machines and factories. When technology started to carry through the
same workload quicker and more cost efficiently, the human resources were
not demanded in the production process to the same extent. Consequently, the
human factor in the 70’s moved into offices to start “producing” paper work.
Today in the 90’s, information and other intangible assets have become
powerful resources in the business environment. In the capital society, money
is invested in human capital. Today, customers and selling activities are
valuable resources to invest in. (Dahlbom, 1999)
Pine and Gilmore (1998) assert the next step in their so-called “progression of
economic value”. They argue that as services are becoming commodities,
experiences have emerged as a next step. Leading-edge companies will find

Measures under Pressure
3
that the next competitive background lies in producing experiences. It is no
longer the service alone that creates customer satisfaction and in turn retention
and loyalty, but rather the experience connected with the service. The idea is
to engage customers in a way that creates a memorable event. While prior
economic offerings – such as products and services – are external to the buyer,
experiences are inherently personal, embedded in the customer’s emotional,
physical, intellectual, or even spiritual level.
1.2 Problem Statement
The predicament is how companies are able to monitor if a chosen strategic
direction is appropriate and if it is possible to be measured at all. We want to
investigate what types of performance measurement systems are used in
practice to monitor strategy implementation and if they differ from theory?
Our main interest lies in the problem of which types of performance
measurements service companies use to monitor strategy implementation and
which are the most applicable ones?
1.3 Purpose
The purpose of this thesis is to enhance our knowledge and understanding of
performance measurement types, applicable for strategy implementation at
service companies. Our interest of research is to focus on different steps from
strategy and vision to measurements.
1.4 Personal Intention
The reason behind our choice of research area is the complex and challenging
combination of different management concepts. Our interest unites concepts
such as strategy implementation, service management, stakeholder approach,
organisational learning, and management control. Moreover, the service
concept increases its importance in the market, though it is not enough to

Measures under Pressure
4
manufacture and sell products, but to satisfy expectations and sell experiences.
We believe in the increased importance of monitoring businesses from non-
traditional perspectives in order to reach sustainable competitive advantage.
For us, gaining knowledge in this area is terribly attractive, because we
perceive them to be the most critical areas managers might face and essential
for leading companies.
1.5 Delimitation
The basic premise of our research is to focus on two different industries
intensively in order to compare and connect the findings to a more general
sample (a holistic approach). The case companies are considered as being
successful Swedish representatives of service industry, but operating
internationally. Both companies have changed from being traditional to
become users of more sophisticated methods to adjust and monitor new
environments. Moreover, we decided to focus on types of measurements that
should be a result of strategy implementation. Our investigations are carried
through with a helicopter view, focusing on the executive level where
decisions and measures are designed. Furthermore, we will not explore the
field of measurements on the operational level, but will look at how strategy
and measurements are correlated.
1.6 Methodology
Our decision is, in order to question the status quo, to use an innovative
approach. In this section we will give a short introduction to the research
perspective but the interesting and important theories of how to investigate
and carry out proper research will be included in the specific chapters. We are
well aware of the fact that to introduce you to our learning process is very
difficult, but at least we will try.

Measures under Pressure
5
1.6.1 Research Perspective
Yin (1994) is one of the most well known authors in the field of how to design
and conduct case studies for research purposes. Case studies are in general
terms an exploratory tool, but some famous case studies have proven that they
can be descriptive as well as explanatory (Yin, 1994). Our research approach
will mainly be of an exploratory kind, but we are trying to implement some
descriptive and explanatory elements as well. We studied his book very
carefully before starting to investigate our case companies and designing the
research method. But we felt that a very important aspect was missing. Due to
the fact that we will graduate in our Master of Science in International
Management, the management perspective needed deeper attention. A book
by Easterby-Smith, Thorpe and Lowe (1991) quenched our thirst for
knowledge in this area of management research. We believe that one of the
most dangerous traps in thesis writing is to put too much emphasis on this
method part. Quite frequently we have experienced that theses tend to stop
after explaining how proper data was gathered, interviews conducted, and
reliability and validity requirements met, but few take the newly acquired
knowledge one step further. Our main purpose is to use the newly acquired
knowledge for analysis purposes and put it into the literature content to make
a fruitful contribution to our field of interest. As mentioned before, deeper
introduction into the research perspective and methods will be included if
necessary in each section.
1.6.2 Research Approach
To fulfil our deep investigation, we find it essential to first see what types of
performance measurements should be used according to the theory. Secondly,
we want to compare which types of measurements are actually used by the
two case companies according to the empirical study. Finally, our analysis
should identify the most applicable types of performance measurements to
monitor strategy implementation. As we see it, 3 determinants meet in
continuous interaction in the marketplace: companies, academics and
consulting companies.

Measures under Pressure
6
Research Matrix: Theory KappAhl Skandia
AFS Academics Consultants Previous
Research
PM best (Theory)
PM used (Empirical)
PM most applicable (Analysis)
PM= Performance Measurement FIGURE 1: DETERMINANTS OF RESEARCH ; OWN ELABORATION
A likely cycle starts with companies getting studied by academics. The
findings of any new innovative model or philosophy then get published in well
known special Journals and Magazines or books. After acknowledging new
models or revolutionary ideas, consulting companies string their package for
selling new products back to the companies. After implementation, academics
start the cycle over again by inquiring into the new approaches. Or, when
companies have a problem, consulting companies recommend solutions to the
specific company. After that, academics try to accumulate the new
approaches. Due to that simple but yet important aspect, we decided to explore
all of the three determinants in combination with the deep literature studies.
1.6.3 Research Parties
KappAhl and Skandia AFS are successful service companies and have been
implementing new performance measurement systems during the 90’s. We
chose KPMG Consulting, simply because it helped KappAhl to implement the
Balanced Scorecard (BSC) as well as the fact that KPMG was a part of the
research project that developed the original BSC. Furthermore, Cepro
Consulting, because of Nils-Göran Olve, a guru in performance management,
the author of two astonishing books, and our discussion partner during our
thesis work. Olve has recently launched two books in the field of performance
Measures under Pressure
7
measurement where he investigated both case companies. The framework
Olve presents lies as a foundation for our research. Finally, we discussed with
Martin Sande, at Sande Consulting, familiar with both case companies and our
research area. Furthermore, we interviewed academic researchers chosen for
their specific professional fields.
1.6.4 Thesis Process
The thesis process has been a very stimulating one, yet extremely valuable and
sometimes quite painful. The main direction of the thesis has been changed at
least three times. In the initial phase, our stubborn attitude sometimes
inhibited the learning process. Fortunately, after deep discussions we
broadened our view and were finally able to adapt to changing situations. For
us, this thesis should not only be a piece of work produced in order to
graduate. Initially, the overall goal was not our performance itself but rather
the continued learning process after finishing all necessary exams and papers.
From the beginning we were lacking the system thinking perspective. We
were unable to combine different concepts to one research question. We
believed that the BSC alone would be enough to describe the research area. It
took us some time to realise that this concept is just a tiny part surrounded by
much more important overall concepts. Finally we came to a broader
definition of performance measurement combined with the service concept.
Later, we investigated the idea with the three research determinants, followed
by smaller changes of direction. An ongoing process over time led us through
this development, which probably was the most time consuming part of the
thesis writing. The more we investigated, the more questions and perspectives
were brought up for discussion.

Measures under Pressure
8
2. Theoretical Framework
s we see it, “performance measurement” is a part of the whole
organization related to various concepts. It is nothing that could be
easily isolated. Therefore, we have to conduct a holistically designed
case study in our choice of literature (Yin, 1994). So what is needed is a
system perspective view on the overall concept. For example, the two main
areas we investigate are performance management combined with service
management strategies. Within these two areas, various other concepts are
relevant. Even though the theories are of holistic nature, we still want to avoid
the typical traps of this kind of case study. Hence, all related concepts must
have a strong correlation to the main concept of performance measurement.
We will illustrate a biased view on different concepts towards our main
research question. First, we will introduce the concept of performance
management that will lead directly into the second field of service
management. Moreover, in the third part of this chapter we will provide an
overview of different performance measurement models. Finally, the latest
research in this area leads directly into the empirical study and analysis.
2.1 Performance Management
Performance management is defined as what “organizations, teams,
managers, team leaders and individuals do or could do better to manage
their performance in order to achieve success” (Armstrong and Baron,
1998). It is a strategic and integrated approach to deliver sustained future
success to organizations. Performance management is concerned with
creating a culture in which organizational and individual learning and
development are a continuous process. Lynch and Cross (1991) define
performance measurement as “feedback on activities that motivate
behaviour leading to continuous improvement in customer satisfaction,
flexibility, and productivity”. It is not an employee evaluation. The most
popular phrases concerning performance are “What you measure is what
you get” and “What gets measured gets done”. The basic objective behind
A

Measures under Pressure
9
measurements is simply to improve current performance. To be able to do
so, specific standards or benchmarks are important aspects. Measurements
are the root for providing and generating feedback, they identify where
things are going well or not and provide a foundation for future change.
Problems in measuring performance necessarily occur when evaluating the
organisational success (Bruns, 1992).
2.1.1 Measurement Approaches
Armstrong and Baron (1998) argue that what gets measured is often what is
easy and possible to measure. And in some cases, what is meaningful is not
measurable. Levinson (1970) claimed already long ago that the more
emphasis relies on quantification, the more likely subtle and non-
measurable elements will be sacrificed. That would imply that quality
decreases. But, indeed, all jobs produce results and these results are
measurable. Smith (1994) divides the measurements into four basic types:
financial quantitative, financial qualitative, non-financial quantitative, and
non-financial qualitative. What is necessary is to be clear about what is
important and relevant before defining what measures should be used.
Armstrong and Baron (1998) continue to claim that what to measure
ultimately depends on what stakeholders and customers believe to be
important. Measurements provide the link between customer-oriented
strategies and goals and action. Furthermore, Hope (1998) asserts that
businesses should be value-driven, not cost-driven. It is more important to
understand what creates value than what causes costs. A value driven
approach creates appropriate measures aligned to the business strategy.
2.1.1.1 Basis for Measurements
To understand what measurement is all about, some kind of basic introduction
is essential. The basis for measurements can be defined in different ways
according to different authors. Oakland (1993) suggests that appropriate
performance measurements as a basis:
Measures under Pressure
10
• Ensures customer requirements have been met
• Provides standards for establishing comparisons
• Provides visibility and provides a “scorecard” for people to monitor
their own performance levels
• Highlights quality problems and determines which areas require priority
attention
• Gives an indication of the costs of poor quality
• Justifies the use of resources
• Provides feedback for driving the improvement effort
Thor (1995) has advanced three principles governing the development of
performance measures as means of increasing organisational effectiveness:
• What to measure is ultimately determined by what the customer
considers important.
• The customer’s needs are translated into strategic priorities and a
strategic plan indicating what should be measured.
• Supplying improvement teams with measured results of key strategic
priorities contributes to further improvement by providing both team
motivation and information on what works and does not work
It is often argued that most performance indicators paint a picture of the past,
but if measurement is to be useful in performance management it has to be
forward looking and concerned with performance improvement.
Consequently, any organization needs a range of indicators to measure
performance and make adjustments about effectiveness (Williams, 1998).
Thus, we would expect to see measures of outcome, output, throughput,
internal functioning, etc., including the five main areas suggested by Walters
(1995):

Measures under Pressure
11
• Contribution to the achievement of strategic objectives
• Measures of quality
• Measures of quantity and volume
• Measures of efficiency and value for money
• Measures of external and internal customer satisfaction
2.1.1.2 Measurement Classification
Armstrong and Baron (1998) distinguish between two general types of
measures namely output and input measures. While output measures in
general deliver service and quality to internal and external customers, input
measures are characterized by what employees bring to their roles in the shape
of knowledge, skills and competencies. Various types of measures exist,
selected on different criteria like being related, relevant, significant,
comprehensive, precise, verifiable, measurable etc. Kane (1996) sums up a
kind of classification for measures:
Finance - income, shareholder value, added value, rates of return, costs
Output - units produced or processed, throughput, new accounts
Impact - quality and level of standard, behaviour, completion of work
Reaction - judgement by others, colleagues, internal / external customers
Time - speed, achievements, time to market, delivery times
To achieve competitive advantage in a market place where virtually all players
are comparable on price, customer service, and innovation, it is indispensable
to make better decisions faster than competitors. A focused set of performance
measures, derived from linking measures to strategy and decision-making
should make the difference (Axson, 1999). The author continues by claiming
that too few organisations report on the basis of leading / lagging and
predictive / competitive measures. Instead of trying to balance all
measurements, Axson (1999) votes for a biased view depending on the
priorities of a particular industry. Each performance measurement system
must be tailored to specific approaches. The Business Logics Model
developed by Swedish researcher and consultant Dr Eric Giertz (his book

Measures under Pressure
12
“Measuring Success: Operations Development in Practice” will be published
later this year 1999 by Celemi) takes it one step further. His performance
measurement tool helps managers to identify and implement the performance
metrics that are most relevant to their specific operations (Barchan, 1999). On
the basis of this model, management will be able to prioritise the most
effective actions for short-term results to use these indicators to guide and
generate continuous improvement in the long run. Frost (1999) agrees that the
best performance measures are certainly not those that follow a popular
model, but those that are designed to fit the business and which are engineered
to specific criteria. Moreover, Boyett and Conn (1995) defined four ways in
which measures could be expressed: counts, ratios, percentage and financial
impact.
Bredrup (1994) defines performance by three dimensions in a business
context: efficiency, effectiveness and changeability. The integration of these
dimensions will ultimately decide the competitiveness of a company.
FIGURE 2: DIMENSIONS OF PERFORMANCE; ADOPTED FROM ROLSTADÅS
(1995:P.85)
Dynamic global competition, product proliferation, shorter product life cycles,
and advanced product and process technologies have forever changed the
formula for success in 90s management thinking. The MIT Commission has
Efficiency
Changeability
Effectiveness
Performance

Measures under Pressure
13
identified several “best practices” for successful firms (Lynch and Cross,
1995):
• Simultaneous improvement in quality, cost and speed
• Competitive benchmarking
• Close ties with customers and suppliers
• More functional integration instead of stratification
• Training and continuous learning
Furthermore, Olve, Roy and Wetter (1999b) present some certain criteria
usable to distinguish what kind of measurements should be used such as:
• Measurements should be clear and well defined everywhere in the
company
• The measurements used should, when they are used together, provide a
sufficient picture of characteristics within the business that are defined
in the corporate strategy and critical success factors
• The relations between measurements in the different perspectives shall
be clear
• The measurements shall be usable to provide goals that the management
finds realistic
• Measuring must be done in a easy way, and the measurements shall be
able to handle different systems (IT systems)
2.1.1.3 Basic Types of Measures
Anything that is important to at least one important group of stakeholders
should, according to Risher and Fay (1995), be measured somewhere.
Basically, the authors developed three key groupings of measurement types
that should cover most aspects of measurement: productivity, quality, and
innovation.

Measures under Pressure
14
Productivity measures are characterised by outcome measures that are a
result of different inputs required to produce the output. The output is more
clearly understood in manufacturing terms, but is more difficult to illustrate in
service businesses. A clear distinction between output and outcome is
desirable. Many processes cannot be judged at the time of output delivery.
What is more important to measure is if there is any outcome as well. Output
must lead towards outcomes. Otherwise the productivity measures fail.
Quality measures are fundamentally the prevention and elimination of waste,
where waste is broadly defined as anything that does not create stakeholder
value. Quality improvement and waste reduction are the usual types of this
measurement for its main stakeholders - the customer. Specific examples
could be lead times, time to market, inventories etc.
Innovation is an elusive concept. It is usually associated with counting
“special” results, above and beyond what could be normally expected.
Employee activities and behaviour could describe a typical type. Teamwork is
another interesting approach to measure in various ways. Process and
development suggestions as well as job sharing and decision making also
characterise this perspective.
2.1.2 Measurement Correlations
As measures are usually not developed independently some correlations
between different measures are quite obvious. No single measure can exist
alone without affecting other measures. To identify areas that affect others
is the basic logic behind measurement. Three very essential approaches will
be discussed: performance measures and outcome drivers, primary vs.
secondary objectives, and the cause-and-effect relationship.
2.1.2.1 Performance Drivers and Outcome Measures
According to Olve, Roy and Wetter (1999b), it is essential to distinguish
and to balance between measurements that describe what companies do

Measures under Pressure
15
(performance drivers) and measurements that tell companies what they have
done (outcomes measures). “Drivers” and “Outcome” build up a chain in
which the first “outcome” can in turn drive the next level of the chain.
These chains of cause and effect can be very difficult to find and identify,
because they are influenced by external circumstances that are intricate to
control, but indispensable for corporate success.
2.1.2.2 Primary vs. Secondary Objectives
Atkinson et al (1997) claim “employees plan, design, implement, and operate
the processes that make and deliver the company’s products to its customer”.
Consequently, the authors argue for a more adequate distinction in primary
and secondary objectives. Primary objectives are those that show the results
while secondary objectives are the drivers behind them. It is a quite similar
approach to the performance drivers of Olve, Roy and Wetter (1999a). To
manage results of primary objectives, the company must focus on the
secondary objectives that create those results. In contrast to the secondary
objectives, which are supposed to help the organisation to achieve its primary
targets, the organisation’s owners design primary objectives. For example,
customer satisfaction, a secondary objective, is deemed important because it
leads to increased shareholder wealth, a primary objective.
2.1.2.3 Cause – Effect - Relationship
The great challenge in performance measurement is to find clear cause-and-
effect relationships and to create a balance between the different measures in
the selected perspectives (Olve, Roy and Wetter, 1999a). The measures in the
selected perspectives must fit and support the comprehensive vision and the
overall strategy. All measurements have a strong correlation to each other
throughout the different perspectives. The following example illustrates some
possible relationships, which could be adjusted to any other scenario of cause-
and-effect relationships.

Measures under Pressure
16
FIGURE 3: CAUSE–AND-EFFECT RELATIONSHIP, ADOPTED FROM OLVE, ROY
AND WETTER (1999A:P.71)
Olve, Roy and Wetter (1999a) found in their research of several companies,
both possibilities. Most companies used a cascading downstream approach
breaking the corporate vision down into the different levels while some started
at the bottom to build the scorecard up.
2.1.3 Strategic Impact on Performance
Since we are talking about performance measurements from a systems
perspective, a close connection to strategy is essential. It is vital to view
different perspectives of strategy and how they could be controlled and
related to the concept of performance measurement. 2.1.3.1 Generic perspectives on strategy
Over the years, academics have had many ideas on what strategy really is.
Whittington (1993) presents four approaches; Classical, Systemic,
Evolutionary and finally the Processual approach. The four approaches differ
Financial
Customer
Internal Business Process
Learning & Growth
Motivated Employees Competitive Product Development
Efficient internal processes
High Value to customers
Shareholder Value
Growth and Profits Cost-effective Production
Growth Strategy
Production Strategy

Measures under Pressure
17
fundamentally along two dimensions; the outcomes and the processes by
which the strategy is made.
FIGURE 4: GENERIC STRATEGIES, ADOPTED FROM WHITTINGTON (1993)
Classical perspective. Authors such as Igor Ansoff and Michael Porter
support this approach to strategy by claiming that strategy is a rational process
of deliberate calculation and analysis, designed to maximize long-term
advantage. Careful planning is the key to mastering internal and external
environments and to coping with competition. Strategy matters in that rational
analysis and objective decisions make the difference between long-run success
and failure.
Systematic perspective. Objectives and strategy practices depend on the
particular social system in which strategy-making takes place. The Systematic
strategies often deviate from the profit-maximizing norm quite deliberately,
thus their social backgrounds give them other interests than profit. Firms differ
according to the social and economic systems in which they are embedded.
The strategy reflects the particular social systems in which companies
SYSTEMATIC PROCESSUAL
CLASSICAL EVOLUTIONARY
Emergent Deliberate
Pluralistic
Profit-Maximizing
OUTCOMES
PROCESSES

Measures under Pressure
18
participate, defining for them the interest in which they act and the rules by
which they survive.
Evolutionary perspective. Rather than relying on managers, the Evolutionists
expect the markets to secure planning methods, but stress competitive
processes of natural selection. They argue that whatever methods managers
adopt, it will be only the best that survive. Moreover, environmental fit is
more likely to be the result of change and good fortune, even failure, than the
outcome of conscious strategic choice. The only competitive advantage a
business might have in the market is relative efficiency. Since sophisticated
strategies only deliver a temporary advantage, competitors will be quick to
imitate and erode any early benefit.
Processual perspective. This perspective generally shares the Evolutionary
scepticism about rational strategy making, but is less confident about markets
ensuring profit-maximizing outcomes. Organizations and markets are
complicated phenomena, from which strategies emerge with much confusion
and in small steps. Consequently, it is no idea to strive after the unachievable
ideal, but it is better to accept and work with the world as it is. People are
unable to consider more than a handful of factors at the same time, and
therefore they cannot be as rational as the Classical planning approaches to
strategy suggest. Furthermore, a strategy is a way in which managers try to
simplify and order a world that is too complex and chaotic for them to
comprehend.
2.1.3.2 Strategic Control
The basic root behind all measurements is the assumption of control
mechanisms. Questions such as “are we moving in the right direction” and
“how are we performing” typically characterise the control of strategies. Three
fundamental perspectives provide the basics for designing strategy control
systems – strategic control, operational control, and total quality / continuous
improvement. In contrast to post-action control, strategic control is designed to
meet top management’s needs, track the strategy as it is being implemented, to

Measures under Pressure
19
detect underlying problems, and to make the necessary adjustments. (Pierce
and Robinson, 1997)
The traditional means of operational control systems such as budgets,
schedules and management by objectives are getting more and more replaced
by critical success factors. The idea behind that is to identify performance
standards associated with allocation and use of all the firm’s resources (Byars,
1987). A critical concern is the identification and evaluation of performance
deviations. The important point here is the need to monitor progress against
standards and identify the causes of deviation in order to adjust to the new
situation. (Pierce and Robinson, 1997)
Continuous improvement has emerged over the last decades. Around an
intensive focus on customer satisfaction, employees across all levels in an
organisation define customer value, identify processes to influence customer
value, and seek continuously to enhance quality, efficiency, and
responsiveness with which processes, products, and services are created and
supplied. (Pierce and Robinson, 1997) 2.1.3.3 Strategic Concept of Performance
Bredrup (1995) understands performance management as comprising three
main processes – planning, improving and reviewing. These three processes
could be applied to the management of performance at whatever level of
analysis – organisation wide, business unit, department, team, individual, etc.
(Mabey and Salaman, 1995). But Bredrup’s schematic representation of this
model shows rather clearly the organisational perspective. Thus, in this model
performance planning is concerned with such activities as formulating the
organisation’s vision and strategy and defining what is meant by performance.
Performance improvement takes a process perspective, that includes such
activities as business process re-engineering, continuous process
improvement, benchmarking, and total quality management. One of the
reasons why this model is of particular interest is because it incorporates many

Measures under Pressure
20
management ideas, philosophies, practices, etc. that have emerged over the
last two decades (Williams, 1998).
FIGURE 5: PERFORMANCE MANAGEMENT; ADOPTED FROM WILLIAMS
(1998:P.12)
2.2 Service Management
Lovelock (1992) presents two major shifts of service management thinking
compared to traditional manufacturing management: Firstly, a shift from
the internal consequences of performance to external consequences. And
secondly, the focus changed from structure to process. Traditionally,
management philosophies of manufacturing industries have proclaimed
economies of scale and productivity of capital and labour as a means of
delivering sustained corporate success. Consequently, internal efficiency of
the business is the main focus of management.
On the contrary, in managing service business, the complicated
characteristics of services (inseparability of production and consumption
and the role of customers as co-producers) make the external efficiency of
the business (customer satisfaction within the operations of the
PERFORMANCE PLANNING PRIORITIES
PERFORMANCE IMPROVEMENT TQM, BPR, ETC.
PERFORMANCE REVIEW MEASURMENT EVALUATION
EXTERNAL REQUIREMENTS Vision, Strategy, Stakeholders, Customers
PERFORMANCE REFERENCE Benchmarking, Customer and Competitor Analysis
SELF-AUDIT Key Process Review
Performance Gap
PLAN DO CHECK
ACT

Measures under Pressure
21
organisation) a crucial point of management. Internal efficiency, as for
example cost efficiency, is still important, but customer satisfaction and
external efficiency mostly have first priority. Lovelock (1992) presents a
definition of service management, which is also supported by Grönroos
(1990).
• Understanding the utility of value customers receive by consuming or
using the offerings of the organisation and how services alone or
together with physical goods or other kinds of tangibles contribute to
this utility, that is, to understand how total quality is perceived in
customer relationships and how it changes over time
• Understanding how the organisation (personnel, technology &
physical resources, systems, and customers) will be able to produce
and deliver this utility or quality
• Understanding how the organisation should be developed and
managed so that the intended utility or quality is achieved
• Make the organisation function so that this utility or quality is
achieved and the objectives of the parties involved (the organisation,
the customers, other partners, the society, etc.) are met
Albrecht (1986) provides a shorter description of service management
stating that “Service management is a total organisational approach that
makes quality of service, as perceived by the customer, the number one
driving force for the operation of the business”. Schneider and Rentsch
(1987) compress the definition by claiming that firms that apply service
management principles consider “service as the organisational imperative”.
Finally, Normann (1992) gives another approach to service management as
he claims that service is a social process and management is the ability to
guide these processes. Consequently, service organizations are more
sensitive to the management quality that any other type of organization.

Measures under Pressure
22
2.2.1 The character of a service
By tradition, banks, insurance companies, hotels, restaurants and most
public agencies are included in the service sector (Gummesson, 1993).
However, service operations are also highly dependant on physical
products. These include buildings, machines and other capital goods and
also consumer goods. Levitt (1972) claims that purveyors of service, for
their part, think that they and their problems are fundamentally different
from other business and their problems. They feel that service is people-
intensive, while the rest of the economy is capital-intensive. There are only
industries whose service components are greater or less than those of other
industries. With this statement, Levitt (1972) clearly states, “Everybody is
in service”.
According to Gummesson (1993), a large number of typologies to
determine the differences between various services and between goods and
services can be found in the literature. However, the author argues that they
are often characterised by good logic but may have a limited empirical and
operational connection. Their contribution is primarily to show that services
have many dimensions and cannot be described by means of simple
definitions.
2.2.2 Service Management System
According to Lovelock (1992), any service business can be thought of as a
system comprising service operations, where inputs are processed and the
elements of the service product are created. Service delivery, the final
“assembly”, of these elements takes place and the product is delivered to the
customer. Parts of this system are visible (or otherwise apparent) to customers,
while other parts are hidden from the view in what is sometimes referred to as
the technical core. Some texts refer to “front office” and “ back office” as the
visible and invisible parts of the operation. Moreover, the visible components
of the service operations system can be divided into those relating to the

Measures under Pressure
23
service personnel and those relating to the physical facilities and equipment.
What goes on in the back office is of little interest to the customers. However,
customers evaluate the production with reference to those elements that they
actually experience in the course of service delivery and on the perceived
service outcome. Consequently, if employees in the back office fail to perform
their support tasks properly, the impact will be apparent to customers.
FIGURE 6: SERVICE MANAGEMENT SYSTEM, ADOPTED FROM NORMANN
(1992:P.65)
Normann (1992) has defined the service management system as a strategic
concept defined by the following five parts:
1. The market segment is aimed at the specific type of customer (core
customer) for whom the whole service system is build.
2. The service concept consists of the advantages as are offered to the
customer (physical, psychological or emotional). Some are more
imperative than others and are referred to as core service while others
are peripheries. Some can be measured and specified while others might
be of utmost importance but impossible to define.
3. Service supply system, which can be compared to a manufacturing
company’s production and distribution systems, but differently
Service Concept
Culture and
Philosophy
Supply System
Image
Market Segment

Measures under Pressure
24
constructed. It consists of three sub components. Employees: Service
organizations are extremely employee intensive and successful
organizations use highly innovative ways to find, develop and to focus
human resources. Customers play an interesting and complex role in a
service-organization. Not only does the customer receive and consume
the service but also takes part in production and supply processes.
Customers must be selected as carefully as employees. Technology and
physical support: As service organizations are highly human intensive
they also require a high degree of capital and equipment.
4. Image is here considered as an information tool through which
management can influence employees, customers and other resources
whose actions and opinions are essential for market positioning and cost
efficiency. In the long run however, the image depends on what the
company really offers and who the customer really is.
5. Culture and Philosophy is covered by the overall principals from
which the social process leads to the delivery of services and
comparative advantages to customers, which are controlled, maintained
and developed. At the point when a superior service system and an
applicable service concept have been created, no other component is
more decisive for the service organization’s long-term efficiency than
its culture and philosophy.
2.2.3 Stakeholder Approach
According to Rolstadås (1995), measurement as a basis is a non-value-adding
activity. However, the interest of the various stakeholders in development and
improvement of competitiveness ensures that performance measurement
belongs to the value creating process. Stakeholders vary according to their
different importance. Bounds et al. (1994), for example, present a strategic
management model driven solely by customers needs. Important though the
customer is, there is today the idea that a successful organisation should seek
to meet the interests of several stakeholders. Illustrative of this view is the
work of Kotter and Heskett (1992), as they view customers, shareholders and
employees as key stakeholders. An efficient performance measurement system

Measures under Pressure
25
has to be maintained continuously to sustain capability in a rapidly changing
environment. Reports for owners, top management, customers and suppliers
are an important task in the communication with the stakeholders for
increasing their knowledge. By defining performance on the basis of the
stakeholder model and the vision and strategy, a direct link to competitiveness
is achieved (Rolstadås, 1995).
FIGURE 7: STAKEHOLDER PERFORMANCE APPROACH; ADOPTED FROM
ROLSTADÅS (1995: P.110) This model integrates existing external requirements with future requirements.
Efficiency and effectiveness fulfill existing requirements while future actions
are covered by adaptability. The impact of all stakeholders is very important
for a company’s success. To measure success, a proper performance system is
inevitable. That makes the strong correlation between stakeholders and
performance management. As we can sum up, the analysis of stakeholders’
needs and interests is of particular importance for performance management as
different stakeholders have different views of the nature of performance and
of standards of performance that are expected (Williams, 1998).
Surveying of existing priorities
Common understanding of performance priorities
Process indicators
External performance requirements
Stakeholder requirements for effectiveness
Strategic requirements for adaptability
Stakeholder model
Vision and strategy

Measures under Pressure
26
2.2.4 Customer Satisfaction
The link between customer satisfaction and service quality is a very
important one. The level of customer satisfaction is the result of a
customer’s comparison of expected and perceived service quality (Looy,
Dierdonck and Gemmel, 1998). This leads to the conclusion that customer
satisfaction is a subjective concept that is hard to measure due to the
personal perceptions and expectations of each individual. Dutka (1995)
argues that the gap between customer perception and expectation must be
eliminated to create real customer satisfaction and achieve enduring
retention and growth. Another problem is the definition of the customer
chain (Kim and Mauborgne, 1999). Most companies are looking for the
target customer when in reality, it is a whole chain of customers. The
distinctions of buyers, users, initiators, influencers etc must be taken into
consideration as well, which makes it even more difficult to find adequate
measurements. The principle guiding solution is to find out who has the
strongest influence on the actual buying decision which varies from
situation to situation (Looy, Dierdonck and Gemmel, 1998).
The authors continue that overall satisfaction, loyalty and referral measures
are the most important aspects to be measured. Overall satisfaction can be
divided into relationship and transaction satisfaction measures with strong
correlation between them. Transaction satisfaction refers to the most recent
interaction with the service whereas relationship satisfaction covers the
overall picture of the service. Anderson, Fornell and Lehmann (1994)
developed the Swedish Customer Satisfaction Barometer, which monitors
both types of satisfaction in several Swedish industries. Loyalty and
referrals result basically because customer satisfaction affects customer
loyalty and this loyalty may eventually result in referrals to other new
customers. The findings of the authors conclude and support a positive
impact of quality on customer satisfaction and, in turn, profitability.

Measures under Pressure
27
The value creating processes plays another central role in performance and
service management. Normann and Ramirez (1994) modified the original
value chain created by the famous Michael Porter to the changed business
environment. Now the value chain is seen as a value constellation process
where actors come together to co-produce value. The ultimate goal is value
creation in all senses of the end customer. But the customer is not interested
in the value creation process. What counts for the customers is only the
value that the end service or product creates. To create competitive
advantage, the value perceived must be better than that of any other
competitor.
2.2.5 Moments of Truth
Jan Carlzon, former CEO of SAS, coined the phrase “moments of truth”. A
moment of truth is any point at which a customer comes in contact with a
business - experience can be favourable or unfavourable (Normann, 1992).
According to Lynch and Cross (1991), it is important to make a distinction
between primary and secondary points of contact. The primary points of
contact, are those moments of truth directly related to the consumption of
the product or service. The secondary points of contact are those moments
of truth not directly related to the consumption of the product or service.
For example, calling a company with a question or complaint is secondary
to the actual delivery of the product or service. For the purpose of
performance measurement, it is important to note the point at which there is
contact with the customer. These moments of truth will determine customer
satisfaction (or dissatisfaction). Only then it is possible to identify the
specific attributes of a company’s performance, which will make or break
the opportunities provided by the moments of truth. Understanding the
attributes of performance, which are important to the customer, can go a
long way towards instituting an effective performance measurement system.
Carlzon (1987)
Measures under Pressure
28
2.2.6 Organisational Learning
A quantum leap forward in organizational learning was achieved with the
publishing of Peter Senge’s (1990) book “The Fifth Discipline”. Learning in
an organization may be thought of as a system or, perhaps more precisely, a
flow process that often needs to be unblocked or released. People who
examined organizational learning would have to take into consideration the
basic ideas of system thinking, shared vision, team learning and mental
models (Fulmer and Keys, 1998). Fulmer, Gibbs and Keys (1998)
determine the second generation of learning organisations. They identify six
second-generation learning tools as the best practice: dialogue, scenario
planning, the merlin exercise, action planning, practice fields, and
knowledge management and mapping. All of them should transform the
organization into a flexible, dynamic process able to change over time.
2.2.6.1 Positive Feedback Loops
According to Armstrong and Baron (1998) the latest development concerning
feedback in performance management is “360-degree feedback”. A 360-
degree feedback is defined by the interaction between performance feedback
of individuals or groups derived from a number of stakeholders (Ward, 1997).
For example, a Strategic Business Unit (SBU) could get feedback concerning
their development and performance improvements by peers, managers,
internal and external customers, clients and/or suppliers. Feedback is the most
essential success factor for any performance and is continuously practised by
this model.
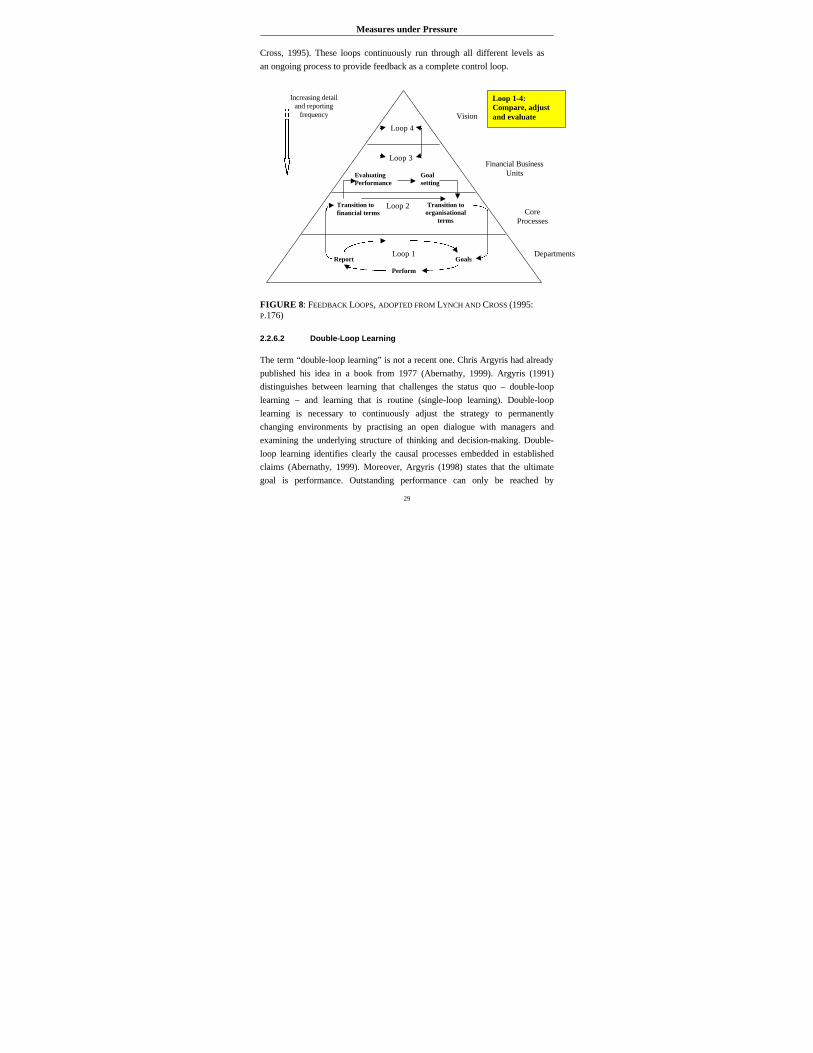
Lynch and Cross (1995) argued that the new yardsticks for performance
management must be customer-focused, flexible and dynamic. But as
strategies and customers change, so must the yardsticks in order to tailor
each specific measurement system to the changing needs of the customers.
To be able to adjust to continuous development, the right information must
be provided at the right time. Providing this information and adjusting the
goals through the feedback process is called “feedback loops” (Lynch and
Measures under Pressure
29
Cross, 1995). These loops continuously run through all different levels as
an ongoing process to provide feedback as a complete control loop.
FIGURE 8: FEEDBACK LOOPS, ADOPTED FROM LYNCH AND CROSS (1995: P.176)
2.2.6.2 Double-Loop Learning
The term “double-loop learning” is not a recent one. Chris Argyris had already
published his idea in a book from 1977 (Abernathy, 1999). Argyris (1991)
distinguishes between learning that challenges the status quo – double-loop
learning – and learning that is routine (single-loop learning). Double-loop
learning is necessary to continuously adjust the strategy to permanently
changing environments by practising an open dialogue with managers and
examining the underlying structure of thinking and decision-making. Double-
loop learning identifies clearly the causal processes embedded in established
claims (Abernathy, 1999). Moreover, Argyris (1998) states that the ultimate
goal is performance. Outstanding performance can only be reached by
Increasing detail and reporting
frequency Vision
Financial Business Units
Core Processes
Departments
Loop 1-4: Compare, adjust and evaluate
Loop 4
Loop 3
Loop 2
Loop 1
Evaluating Performance
Goal setting
Transition to financial terms
Transition to organisational
terms
Report
Perform
Goals

Measures under Pressure
30
constantly questioning the established patterns and change if necessary. To put
double-loop learning in a performance measurement perspective, feedback on
performance should be generated in order to make sure that the company is
progressing in the right direction.
2.3 Performance Measurement Models
In this chapter we discuss the main points concerning performance
measurement models. These models are basically designed to measure the
business performance and to link measures to the company’s overall strategy.
2.3.1 Balanced Scorecard (BSC)
The balanced scorecard (BSC) was originally developed by Kaplan and
Norton (1992, 1993, 1996a, 1996b, 1996c, 1996d, 1996e, 1999) as a
framework to help managers translate their organisation’s mission, goal and
strategy into a comprehensive set of performance measures aimed at achieving
competitive success. Thus, the BSC is primarily a mechanism for strategy
implementation. Four perspectives are included and organised around the
BSC:
• How do customers see us? (Customer perspective)
• What must we excel at? (Internal perspective)
• Can we continue to improve and create value? (Innovation and learning
perspective)
• How do we look to shareholders? (Financial perspective)
These four perspectives provide an integrated balance between measures of
current, short-term operating performance, but are also the drivers for future
competitive performance and growth. The key lies in linking the different
measures together properly in a cause-and-effect interrelationship aimed at
achieving a single integrated strategy. The BSC-framework provides balance
between quantitative outcome measures and more subjective, non-financial

Measures under Pressure
31
measures as the drivers of performance. Moreover, it represents a balance
between external measures for shareholders and customers, and internal
measures of critical business process, innovation, and learning and growth.
FIGURE 9: BALANCED SCORECARD; ADOPTED FROM KAPLAN & NORTON
(1996B) We do not want to start philosophising about what came first “the egg or the
hen”. The only discrepancy in Maisel’s (1992) BSC is instead of a “learning
and growth perspective”, the author uses a “human-resource perspective”,
which measures innovation as well as factors of education and training,
product development, core competencies, and corporate culture. Thus the
difference between Kaplan and Norton’s BSC is minimal. Maisel’s reasoning
for using a separate employee perspective is, that management should be
attentive to, and should measure, the effectiveness of an organisation and its
people.
2.3.2 Performance Pyramid (PP)
McNair et al (1990) presented a model, which is referred to as the
Performance Pyramid (PP). The basic assumption is that of customer-oriented
FINANCIAL: To succeed financially, how
should we appear to our shareholders?
CUSTOMER: To achieve our vision, how
should we appear to our customers?
LEARNING & GROWTH: To achieve our vision, how will we sustain our ability to
change and improve?
INTERNAL BUSINESS: To satisfy our shareholders
and customers, what processes must we excel at?
Vision and
Strategy

Measures under Pressure
32
principles combined with financial and non-financial figures. The PP shows a
company at four different levels and provides a structure of two-way
communication. The PP links a firm’s strategy and operations together by
translating objectives from the top down based on customer priorities and
measuring from the bottom up.
FIGURE 10: PERFORMANCE PYRAMID; ADOPTED FROM LYNCH & CROSS
(1995: P.65/67) The Performance Pyramid System (PPS) distinguishes between several types
and levels of measurement (Lynch and Cross, 1995). From an external view,
customers and shareholders determine what is important to measure while the
internal view focuses on employees, processes etc. The PPS contains four
levels of objectives that address both external effectiveness and internal
efficiency in an organisation. The development of a company’s PP starts with
the determination of an overall corporate vision, which is then translated into
individual business units. In order to identify the key objectives in the second
level, market and financial measures, key measures of customer satisfaction,
Quality Delivery
Cycle Times Waste
Performance Management Systems
External Effectiveness
Internal Efficiency
Core business processes
Departments & Work Teams
OBJECTIVES MEASURES
Customer Satisfaction
Productivity
Market
Financial
Flexibility
Vision
Business units

Measures under Pressure
33
flexibility and productivity are derived. They are in turn converted into specific
operational measures, which are the base of the pyramid: quality, delivery,
cycle time and waste (Judson, 1990). Successful companies have been
basically competing on the three fronts of their core businesses: customer
satisfaction, flexibility and productivity (Lynch and Cross, 1995). Customer
satisfaction gets the most attention. Flexibility is certainly seen as a major
competitive advantage while productivity increases external effectiveness and
internal efficiency.
2.3.3 EPPM and EFQM
The European Foundation for The Quality Management Model (EFQM)
underlyies the European Quality Award, which is awarded by the European
Foundation of Quality Management. Originally this model was build upon a
kind of checklist for a quality award, but its philosophy was translated into a
model as well. The philosophy of EFQM is as follows (Looy, Dierdonck and
Gemmel, 1998: p.365): “Customer satisfaction, people satisfaction and impact
on society are achieved through leadership driving policy and strategy, people
management, resources and processes, leading ultimately to excellence in
business results.”
FIGURE 11: EFQM MODEL; ADOPTED FROM LOOY, DIERDONCK & GEMMEL
(1998: P.278)
Leadership
Processes
Business Results
People Management
Policy & Strategy
Resources Impact on society
Customer Satisfaction
People Satisfaction
Enablers Results

Measures under Pressure
34
The EFQM model is balanced in the sense that it not only focuses on financial
performance, but on various types. They include business results for
shareholders, customer satisfaction, people satisfaction and impact on society.
Furthermore, this model is proactive, because it defines five enablers of the
above results: leadership, people management, policy & strategy, resources
and processes. Adams and Roberts (1993) provide another approach, which
they call Effective Progress and Performance Measurement (EPPM).
According to the authors, it is especially important to measure what the
company does in four areas:
• External measures - serving customers and markets
• Internal measures - improving effectiveness and efficiency
• Top-down measures - breaking down strategy and speeding change
progress
• Bottom-up measures - empowering ownership and enhancing
freedom of action
The authors argue that the purpose of a measurement system is not only to
implement vision and strategy, but also to foster a culture of constant change.
2.3.4 Performance Measurement System for Services
To ensure that an organization moves in the right direction of the proposed
goals, a performance measurement and reporting system is inevitable.
Especially with the famous phrase “You get what you measure”. The
alignment of performance measures with the service concept is extremely
important in service organizations because of the danger of losing focus
(Looy, Dierdonck and Gemmel, 1998). Therefore, the performance
measurement system must be integrated with the definition of the service
concept as the starting point. To make sure that this system moves in the right
direction, a more balanced view of performance is of great importance.
Consider, a service key strategy that builds on quality and customer

Measures under Pressure
35
satisfaction, but the performance report focuses on costs. Looy, Dierdonck and
Gemmel (1998) developed a special BSC for service companies, because they
argue that a good performance measurement system must be linked to the
service concept and needs to be balanced.
FIGURE 12: BSC FOR SERVICES; ADOPTED FROM LOOY, DIERDONCK & GEMMEL (1998: P.366) Four areas characterise this model with the service concept at the top:
organisation capability, employee satisfaction, service processes, and
customer satisfaction. Of course they stand in a permanent correlation such as
cause-and-effect relationships. Designing capabilities are the foundation of
this model and are a synonym for skills or resources. Employee satisfaction is
an absolute must, because they are once more first in the line of fire and meet
the customers at the moments of truth (Carlzon, 1987). Employees perform
activities, which constitute the service processes they perform within.
Customer satisfaction can be seen as a result of the former focus areas, but
needs equal attention.
Fitzgerald et al (1991) present an integrated system of service and
performance measurements, which they call the Performance Measurement
System for Service Industries (PMSSI). The authors argue that this model is
Measuring and Assessing
Defining the Service
Concept
Employee Satisfaction and Loyalty
Customer Satisfaction and Loyalty
Process Productivity and Quality
Designing Capability

Measures under Pressure
36
the result of the lack of integration between financial and non-financial
measures based on causal relationships between those measures. Their model
encourages the focusing on results, competitiveness and financial
performance, and the determinants of the results namely quality, flexibility,
resource utilization and innovation. The criteria for the dimensions
incorporate both financial and non-financial, as well as external and internal
measures of performance. The first dimension, results, reflects the success of
the chosen strategy. Determining the key drivers of success as competitiveness
and financial performance is the reason for the second dimension (Laitinen,
1996). Fitzgerald et al (1991) argue that in most service companies, data exists
but is hardly integrated into any system to support the monitoring and
development of the business strategy. The PMSSI can make trade offs within
the different categories and dimensions visible.
FIGURE 13: PMSSI; ADOPTED FROM LAITINEN (1996: P.19)
RESULTS
DETERMINANTS
DIMENSION OF PERFORMANCE
TYPES OF MEASURES
Competitiveness Financial Performance
Relative market share and position Sales growth Measures of customer base Profitability, Liquidity Capital structure
Quality of service Flexibility Resource utilisation Innovation
Reliability,Responsiveness, Aesthetics / Appearance, Cleanliness / Tidiness, Comfort, Friendliness, Communication, Courtesy, Competence, Access, Availability, Security Volume flexibility Delivery speed flexibility Specification flexibility Productivity Efficiency Performance of the innovation process Performance of individual innovations

Measures under Pressure
37
2.3.5 “Economic Value” Measures
The increased emphasis on both financial and non-financial measures is
consistent with two trends that have dominated recent performance
measurement discussion. Firstly, the addition of new financial measures that
are claimed to overcome some of the limitations of traditional financial
performance measures and second increased focus on non-financial “forward
looking” measures such as customer satisfaction, employee satisfaction and
deflect rates (Ittner and Larcker, 1998). This section will focus on the
illustration of the first trend. The authors continue to declare that while
traditional accounting measures such as "earning per share" and “return on”
ratios are the most common performance measures, they have been criticised
for not taking the cost of capital into consideration. Economic value measures
are promoted to overcome these limitations. The most well known measures
of this kind are the Economic Value Added (EVA) and Cash Flow Return on
Investment (CFROI). From a managerial point of view, the key question is
whether these measures could be useful for internal decision-making,
performance measurement or compensation purposes in order to improve
organisational performance.
2.4 Previous research
The background to Kald and Nilsson's (1999) study, “Performance
measurement at Nordic companies”, was of considerable interest in how to
improve performance measurement. According to the authors, the knowledge
about the methods, which companies in the Nordic countries have chosen to
monitor performance, is limited. Therefore the purpose of the study was to
improve the awareness of how systems of performance measurement have
been designed and used at companies in the Nordic countries. The study was
conducted on a broad scale of well-known major Nordic corporate groups.

Measures under Pressure
38
The research supports the idea that Nordic companies meet many criteria for
modern, well functioning management control at the time of globalisation and
increasing competition. The study also indicates that measures are relatively
well developed, combining both financial and non-financial. Moreover, the
study provides evidence of a strong connection between measures used and
different planning routines, such as strategic planning and the budget. The
primary finding of the research is that performance measurement is principally
used to support decision-making. Furthermore, its use in formulating and
implementing strategies indicates that the criticism of traditional management
control has been taken seriously and undoubtedly affected the development of
planning and performance monitoring systems at Nordic companies.
We find it suitable to use their survey though it covers 200 companies or
totally 800 businesses. To carry out such research is beyond our financial
limitations. We are well aware that their research does not exclusively focus
on service industries (50%) but corporate groups in all industries, whose
shares were among the 100 most frequently traded on the stock exchange of
the country in question. However, we strongly believe this research provides
us with unique data contributing greatly to the quality of our empirical data.

Measures under Pressure
39
3. Empirical study
in (1994) stresses that to increase the quality of a case study, three
principles should be followed: multiple sources of evidence, a case
study database, and a chain of evidence. We increase our quality by
explicitly linking multiple resources within the chain of evidence. We used
many sources for empirical research such as documentation, archival records,
former research, official publications, seminars and interviews – not forgetting
the Internet as an important information system. This directly created a case
study database for further investigation. As a result we were able to link the
questions asked with the data collected and the conclusions that we will draw,
providing a chain of evidence.
In this chapter we will illustrate the two specific measurement systems of
KappAhl and Skandia AFS. Both developed through a certain tailored version
of the original BSC. As we have mentioned earlier, our prime objective is not
to carry out an evaluation of the BSC, as such, but to identify what types of
performance measurements are applicable for strategy implementation in the
service industry. Material and information collected from interviews and
discussions with people involved in our research project is presented with an
objective view, as it is not our purpose to bring in own opinions in this
chapter.
Before the interviews took place we made sure we had deep theoretical
knowledge in the area of performance measurement, which enabled us to
apply a more flexible approach during the interviews. We used an open
interview technique, as we considered this to be the most valuable and
applicable of approaches to gather the primary data necessary to carry through
the analysis. This means that we mainly used the focused interview type
(Merton et al., 1990). By choosing this technique, we set up interviews for a
specific time period (this is inevitable due to the managers’ lack of time), but
still remained open-ended with the questionnaires. The secondary data was
collected from official reports and literature written with reference to the
Y

Measures under Pressure
40
companies and previous research in the area. Regrettably, due to distance
barriers, availability and financial resources, some interviews could not take
place face-to-face, but via telephone and e-mail.
3.1 KappAhl
KappAhl, one of the largest Swedish retail-clothing chains, was established in
1954 and quickly became one of the country’s most successful chains. The
KappAhl organisation is concentrated at the Gothenburg based parent
company KappAhl AB, with its 5 subsidiaries (Denmark, Norway, Finland,
Poland, and Hong Kong). The group has a service office from which all
centralised purchases and design work are made. The Headquarters run all
administrative matters, and the executive management board is located within
the same building. Each country has its own service office to manage local
information requests (KappAhl).
When KappAhl in 1990 was acquired by KF (Swedish Cooperative Wholesale
Society), the success years were over. Despite a series of management
changes, it proved difficult to re-establish profitability. In the autumn of 1995,
a new CEO for KappAhl was appointed, namely Thommy Nilsson. He and the
new management group reorganised the company focusing on the
development of the BSC as a major restructuring process. Among other
things, the new CEO reduced the number of employees, at the head office, by
25 percent and renamed the same “service office”. KappAhl had faced
difficulties restoring profitability and the company needed a new core and
profile to underline its strength – that of “a service company for the general
public, but with an up-to-date image”. (Olve, Roy and Wetter, 1999a) With
sales of more than 2.5 billion SEK and a market share of almost 5 percent, the
company is today one of the most successful retailers in the Nordic area.
(KappAhl)

Measures under Pressure
41
3.1.1 The measurement system
The intention behind the BSC implementation at KappAhl was to create a
strong engagement in the entire organisation. Critical success factors were
identified at every level of the company. A project group was set up in order
to develop the BSC for KappAhl’s specific needs. The task was to continue
the process in order to:
• Provide guidance for a relatively decentralised organisation towards the
comprehensive vision
• Supply tools that would indicate direction and speed
• Signal that the methods to be used for reaching the goals should be
determined locally
• Indicate a broader focus than just monetary values
• Provide earlier warnings than conventional accounts
The choice of perspectives should be controlled primarily by business logic,
with a clear interrelationship among the different perspectives, after the
comprehensive vision and the business concept were established. In contrast
to the original concept of the BSC, KappAhl added a fifth perspective,
“employee or human perspective”. Consequently, the scorecard for KappAhl
included five perspectives with the following formulated strategic goals (Olve,
Roy and Wetter, 1999a):
• Finance : high earnings
• Customer : increased market share and delighted customers
• Employees : satisfied employees
• Process : on time; short process times
• Development : innovation force; learning organisation
KappAhl’s specific scorecard had been developed to include success factors,
measures and goals. The basic elements and result of the project group are
presented in the following figure.

Measures under Pressure
42
FIGURE 14: KAPPAHL’S BSC; ADOPTED FROM OLVE, ROY & WETTER
(1999A: P. 75) The process also led to the realisation that everyone in the organisation did not
need to understand every overall strategic goal, instead concentrating on the
few important ones each employee could directly affect. At the same time, it
was important to see the whole picture. The development of KappAhl’s
scorecard was very carefully planned. Critical measures were well defined and
goals were set at the appropriate level. Moreover, measures should not conflict
with each other. For instance, maximising the percentage of “closed sales”
Critical success factors
Business idea
Measures
Area of focus
Strategic goals
Vision KappAhl as the industry’s leading service company
God value for smart dressers
Finance Customer Employees Process Development
High and even earnings
Increased market share/ delighted cust.
Satisfied employees
On time; short process times
Innovation force; learning organisation
-reduced seasonality - low markdowns - performance
- match customer expectations - In store traffic - Merchandising
- Leadership
- Timelines - Lead time order-to-store
- Daring to test new ways
- net/gross profit - Markdowns - Days of inventory goods
- Market share - Customer Satisfaction Index- No. of visitors
- Satisfied Employee Index
- Percentage on time - Days from order to delivery
- Satisfied Employee Index

Measures under Pressure
43
was found inconsistent with the same for “average amount of sale”.
Furthermore, the company also attempted to show how performance drivers
and outcome measures for different parts of the organisation were related to
the business of the company as a whole. (Olve, Roy and Wetter, 1999a). The
process of implementing the new system took almost three years and in the
winter of 97/98 the concept was ready to be launched at all stores. (KappAhl).
The BSC is regarded primarily as a translation tool to make financial figures
comprehensible at all levels of the organization, as communication is the most
important factor for success. KappAhl’s strong position in the market is
especially built upon a unique marketing strategy in which large resources are
invested. As a result, it is essential for KappAhl to continuously measure its
specific and unique image in the market as well as customer perceptions
concerning price and quality. KappAhl is currently following a push strategy,
which means that they proceed, according to their market predictions, the
goods through the supply chain to the end consumer. A critical point in the
supply chain is that KappAhl might lose profitability as regards the timing to
the market. An excess supply of old clothes forces KappAhl to mark down
prices at the same time as the latest fashion in clothing enter the stores too late
and consequently lose alternative sales. (KappAhl)
3.1.2 Types of measurements
According to (Olve, Roy and Wetter, 1999a), the measures actually adopted
by KappAhl did not really reflect all the points of strategies and success
factors, on the contrary they had the advantage of being tangible and clear.
For example the measures used in the financial focus were “profit”,
“markdown percentage” and “gross profit per square meter". For each
measure, a method of measurement was specified, to assure that the data
required would in fact be available. In developing measures, KappAhl did not
seek identical ones for all levels in the organisation. Rather what was
considered important was the consistency among measures at different levels.
For example, some measures considered as performance drivers were pushed
quite far down the organisational levels. In this situation Kappahl

Measures under Pressure
44
distinguishes between performance drivers and outcome measures. While
outcome measures are easier to measure, performance drivers enlighten the
outcome. (KappAhl)
Apart from usual measures such as “sales”, KappAhl also follows up
“customer- and employee satisfaction indexes”. At the local stores, measures
such as “total number of visitors” and “average time spent on customer
relations” are measured. KappAhl has reached a more legible focus and strives
for values that do not only relate to monetary terms. The dialogue with the
local stores leads to involvement and guides operation towards common goals.
Moreover, all employees have the possibility to speak up regarding their
suggestions about improvement (KappAhl).
KappAhl continuously tries to identify the adequate performance drivers,
which correlate best with their core activities. This is of course a long and cost
consuming process, but extremely essential in order to be able to identify the
most valuable measures in the cause and effect relation. Within its
measurement system, KappAhl applies a great number of different measures
(See Appendix 1). The company continuously evaluates its consistency, after
which the most valid variables are identified. KappAhl uses two major
performance measurement tools: Radar and Kund-Barometer (KappAhl).
The Radar is mainly a method of tracking company image. The method puts
KappAhl into a competitive comparison to its competitors. This is a measure
of how the image of KappAhl is positioned and how it develops over time,
based on customers´ perceptions. The Kund-Barometer is a customer
satisfaction measurement method. The objective is to match customers´
expectations with the help of customer satisfaction index. The index only
presents the highest score available and uses the complete customer base
shopping in the stores. Consequently, the index does not separate customer
segments or even identify core customers (KappAhl).

Measures under Pressure
45
Referring back to the supply chain, this has today become a critical
component of KappAhl´s success factors. Much of the success is realted back
to lead time and cost efficiency. Furthermore, the supply chain mechanism is
very much embedded within the BSC in, for example, processes, development,
and customers. Timing in the supply chain is one of the most important critical
factors to be measured, though the overall aim is to cut back on lead times.
Moreover, the importance of finding measurements within the supply chain
that matches end goals is important. The supply chain includes a large
spectrum of different types of measures, for instance soft, intangible, non-
financial, tangible, hard, and financial. Finally, it is difficult to answer what
type of measurement is the most valuable for future success. Whilst financial
ratios determine how the company has performed in the past, being able to
measure intangible measures such as attitudes, quality and image will
unquestionably deliver sustained future success. (KappAhl)
3.2 Skandia AFS
Skandia, an international financial services and insurance group, was
established in Sweden in 1855. The company operates in 24 countries
worldwide, with its head office in Stockholm, Sweden. In 1998, Skandia had
596 billion SEK in assets under management with sales totalling 90 billion
SEK. Skandia has three business units: Long-Term Savings, Asset
Management, and Property & Casualty Insurance (The Property & Casual
Insurance has merged with Norwegian Storebrand). Skandia is the fourth
largest unit linked company in the world, and subsidiaries are working
independently from the headquarters and are tied together through a big
network of knowledge sharing units (Skandia). Skandia has become well
know for what it has done with the BSC, but particularly the development of
the concept of intellectual capital has received considerable publicity even
outside Sweden. In a series of supplements (“Visualising Intellectual Capital
in Skandia”) to its annual reports from 1994 onwards, Skandia has presented
its intellectual capital as a justification for the premium added to its traditional
balance sheet. One of the reasons behind the development of the supplements

Measures under Pressure
46
was that less than 10% of a company's stock price movement was attributable
to financial information from annual reports. The rest was attributable to
information from other sources (Skandia). In these publications, statistics for
various Skandia units are presented in the form of scorecards, which are
referred to collectively as the Skandia Navigator. The Navigator is mostly a
result of the intellectual capital, focusing on different perspectives within the
company, to highlight the focus on the control processes (Olve, Roy and
Wetter, 1999a).
Today, Skandia Assurance and Financial Services (AFS) comprise 26
different companies in 20 countries. These companies have been built from
the ground rather than through acquisitions. Each local office operates as an
independent subsidiary. The Skandia AFS organization is structured as a
global federation of local companies tied together by a common mission,
networking and knowledge base, with cross-boarder operations and sales
functions. The global information network and focus on intellectual capital
allows all offices to work closely together. In each local market, Skandia AFS
forms strategic partnerships with expert sales people and fund managers, also
referred to as “specialists in cooperation”. This allows Skandia AFS to focus
on its core activities: customer service, product development, technology
development, sales support and administration. (Skandia AFS)
Skandia AFS’s vision is “ to contribute, to enhance and secure prosperity and
quality of life into old age and other long-term needs by providing
customized, flexible and innovative savings solutions with high market related
returns at world competitive prices ”. The long-term overall strategy is to
provide "Security for Generations and create shareholder value “. (Skandia
AFS)
3.2.1 The Measurement System
Skandia AFS began its work with intellectual capital even before the BSC
became a recognised model. As the term intellectual capital suggests, the

Measures under Pressure
47
original purpose was to describe assets not shown in the balance sheet rather
than to keep score in various parts of Skandia AFS. The intellectual capital is
often referred to as “packaged useful knowledge” (Steward, 1997, p.67), and
is assumed to be the reason why a company is valued at more than the sum of
the “hard” assets in its balance sheet, even if these have been written up to
their current market value. The intellectual capital is the root for processes and
activities within Skandia AFS and thus the factor to deliver sustained success
(Skandia AFS).
FIGURE 15: IC AS A PART OF CORPORATE MARKET VALUE; ADOPTED FROM
SKANDIA AFS Human capital is the employees´ knowledge, experiences, relations towards
customers and capability to share knowledge with other employees.
Consequently, hiring and developing the right kind of employees can increase
the human capital. However, human capital is highly volatile and to secure
stability, it must be met by tying accumulated competence and capability to
the company in a more lasting way. Structure capital, could be customer
capital, information systems, organizational processes, product solutions,
culture, leadership etc. The development of structural capital has external
aspects such as investing in customer’s image of the company, e.g. by making
the company known to more customers, by presenting them with a more
favourable image, or in some other way making them more inclined to support
Market value
Own capital
Human capital
Intellectual capital
Structure capital
Customer capital Organisational capital
Innovation capital Process capital

Measures under Pressure
48
the company. Customer capital is defined as “the value of the customer base,
customer relations and customer potential”. Furthermore, the organisational
capital is systemised and packaged competence as well as systems to maintain
a company’s innovative power respective value creating working process.
Innovation capital is the renewal power expressed in commercial rights,
intellectual properties and other immaterial assets. Finally, process capital is
the collected value of the value creating processes (See Appendix 2). (Skandia
AFS)
FIGURE 15: SKANDIA’S NAVIGATOR; ADOPTED FROM OLVE, ROY & WETTER
(1999A: P.95) Skandia AFS added a fifth focus – “human resources” - to the original four
perspectives the BSC, because the company wanted to stress the interaction
between this perspective and the others. Skandia AFS argues that employees
produce results with the “competence for customer focus” as well as potential
for process development. From 1995 onwards, the Navigator has been used in
Skandia AFS´s internal business planning. Moreover, Skandia AFS views the
Human Focus
Customer Focus Process Focus
Operating Environment
History
Today
Tomorrow
IC
Financial Focus
Renewal & Development Focus

Measures under Pressure
49
BSC concept as a mixture of internal management control and as a
complement to its financial reporting to external stakeholders. A company’s
balance sheet cannot fully explain its value, particularly if the latter consists
largely of intangible assets. Market value consists of the five different
perspectives embedded in the Navigator. (Skandia AFS)
Human resource capital is considered to have a multiplier effect on process
and development capital. Without the former, the latter has little value. This
indicates that different measures can be combined in an overall index. Skandia
AFS attempts to combine features of strategic and operational focus as the
BSC is divided into sectors of “yesterday-today-tomorrow”, as well as the fact
that Skandia AFS regards the financial focus as a review of the history and the
other areas of focus as indicators of how well they are preparing for the future.
(Olve, Roy and Wetter, 1999a)
Finally, Skandia AFS has continued to develop the Navigator, and top-
management groups use the Navigator to monitor progress on a quarterly
basis. There is a general trend towards an external environment focus
(currently included in the renewal & development perspective). This
development might call for a further extension of a future Navigator in a
separate perspective. (Skandia AFS)
3.2.2 Types of Measurements
To distinguish between the BSC and the Navigator, Skandia AFS argues that
the original BSC shows the status here and now and hence places less focus on
the human and renewal & development-approaches. However, the Navigator
reflects upon position, bearing and speed. The Navigator is thereby regarded
as a dynamic navigation instrument (Skandia AFS). The original BSC was
quite static, like the scores in a football game, but the models do not indicate
how the game is proceeding over time. Skandia AFS basically uses three
major methods to identify, measure, and develop the intellectual capital:

Measures under Pressure
50
The value scheme — a simplified statistical diagram that shows the
operations' value-creating building parts. The process model — a dynamic
model in which the respective operation's vision is broken down into a number
of success factors. Coupled to these are a number of indicators that are then
arranged under the Navigator's various components. In the Navigator these
indicators are tied together into five focuses, which represent the value-
creating aspects of the operation: financial focus, customer focus, process
focus, human focus, and renewal and development focus. This gives a
balanced total picture of the operations. The Intellectual Capital (IC) index
– is a dynamic graphic diagram based on a view of the various IC indicators’
relevance, robustness, and relative weight, condensed into a total picture.
The basic notion of measurements is that there is no single type of
measurement that is more central than others. Everything depends on what
perspective and situation is focused on. The logic Skandia AFS uses is to
break down business concepts into success factors, as these success factors
identify specific indicators for the chosen perspectives. Measurements that
present drivers of the business are the most important in addition to
measurements, which are related to success factors. In order for the Navigator
to work effectively, indicators must be easy to define, measure, understand
and communicate (See Appendix 3). By using the indicators in the Navigator,
a more effective organization including motivated employees is created.
(Skandia AFS)
Measurements are the result of working with process models and success
factors. Some of the measurements are comparable between companies while
others are adjusted to a local level. For example, types of measures include
“RoE”, “P/E ratios” and “Earnings”, which are measures that Skandia AFS
uses as competitive benchmarks between companies (Skandia AFS). The basic
idea is that every employee in the company should act as a controller. Many of
the success factors are more qualitative than quantitative in character and thus
cannot be measured or specified by indicators in a Navigator. This does not
mean that they are less important. Albeit, it is important to keep down the

Measures under Pressure
51
number of measurements per perspective . But these measures must be altered
as environmental conditions change. When external factors change, internal
processes change, and consequently goals and measurements. The evaluation
of the measurements should be integrated in the daily work at every level and
should not be considered as a separate function. Additionally, Skandia AFS
uses “early warning measurements” in order to guide internal processes into
the set direction (Skandia AFS).
Skandia’s AFS customer capital is based on three principles – customer base,
customer relationships, and customer potential. Customer capital measures
the present value of customer relationships. Thus the value does not arise from
the individual components but from their interaction. Skandia AFS measures
its customer relationships, because the size and structure of the customer base
is crucial to Skandia AFS’s future value. Every customer contact is an
investment for Skandia AFS in a value creating relationship (Skandia AFS).
Customer relationships are visualised by using various indicators, which
together form a pattern. These indicators measure the number of relationships,
the nature of them and their duration, their role in the value-creating process,
customer support systems, and value appreciations. A major objective is to
create long-term sustainable growth in shareholder value, which includes
development of intellectual capital. The human focus is described with the
help of a survey conducted by SIFO (Swedish Institute of Public Opinion
Research). This survey measures an empowerment index, which monitors the
employees’ motivation support within the organization, awareness of quality
demand, responsibility vs. authority, and competence (Skandia AFS will not
use SIFO in the future) . (Skandia AFS).
3.3 Consultants View
In this section we present the consultants’ points of view on performance
measurement and related concepts. The cause-and-effect relationship is
necessary to know the causes and not only to see the effects after they have
already appeared, as they cannot be changed afterwards. Without knowing the

Measures under Pressure
52
cause of the outcome, it is unfeasible to change any effect. This relationship
between causes and effects is indispensable in its nature and extremely
important for any performance measurement analysis. Furthermore, an up-
and downstream relationship could be visualised. A metaphor could explain
this as “water flowing down a river”. The performance measurement process
should include both. The vision and strategy is flowing down streams while
feedback must be generated at all levels (Sande Consulting).
Moreover, it is crucial to visualise measures to make them comprehensive in a
kind of “learning cycle”. The learning takes place when a company acts on
outcomes of measurements. Either the outcome satisfies the control system or
it requires an adjustment and change towards new measures. The next loop
visualises the new or old measures. If the old measures still hold true, the
company should keep them, or otherwise adjust the measures. It is a
continuous learning cycle, which leads towards the statement that “strategy is
a value creating hypothesis”. Consequently, it is essential to define this value
creating hypothesis, for whom value is created, and if the company really
creates value (Sande Consulting).
The major strength of the BSC is that the concept is so easy and simple to both
understand and use and can be applied to any company in any situation. This
is inevitable, because the acceptance of the BSC throughout the entire
organisation is vital. All levels of an organisation must understand and agree
on the implementation. But the overall responsibility lies with the top
management. The BSC is so basic that once implemented, the concept will not
have any need of change as such. But small parts will always be in need of
adjustment, because when the environment changes, so does the scorecard.
Nevertheless, there is always a specific focus within the scorecard depending
on the strategy. But this focus must be balanced towards other perspectives
(KPMG). Furthermore, the BSC is a concept that combines common sense
with all interest groups. The BSC allows the basic framework to be
complemented with additional models to modify specific areas and needs.
Moreover, the types of measurements used within the BSC do not play a

Measures under Pressure
53
significant role. What is perceived as being important is the fact that every
company has to make sure what the purpose of the BSC is, for example,
employee motivation, management information and control, or shareholder
information. The statement “What gets measured gets done” still holds, so “If
you want something to be done, measure it. If you cannot define it, you cannot
measure it. If you cannot measure it, you cannot manage it. If you cannot
manage it, you cannot improve it”. The premise of the BSC is to decide what
data should be gained from the measurement system. If the purpose is set, the
measurements will be designed to tailor the desired outcome (KPMG).
Additionally, the use of the BSC differs radically between the service sector,
public and manufacturing sector. In the service sector a distinction between
needs and expectations for customer satisfaction has to be made. A company
must find out what customer satisfaction really means to them. In the public
sector, needs are satisfied while service companies also ought to satisfy
customer expectations. Moreover, a segmentation of the core customers is
essential in order to identify the right variables for measurement. Quality plays
an extremely important role in service companies, and indicators of quality
that identify areas of focus and areas of less interest must be clear. Quality
should not be expressed in numbers but rather in finding indicators for
improvement, as quality is a business philosophy that should manage
operations towards higher customer value and/or improved cost efficiency,
which leads to increased profitability (KPMG).
Previous research (Kald and Nilsson, 1999) has articulated that there is a need
to extend the scope of performance measurement vertically both upward (to
meet capital market requirements) and downward (measures relevant to
operations) as well as horizontally (to design measures that support process
orientation). However, in practice there is a tendency to make much more
partial analyses. The important part is to trigger discussion about intentions
and performance in the areas which are deemed important. Even fairly "weak"
measures, indicators, proxy measures etc., can be used for this (Cepro
Consulting).

Measures under Pressure
54
There are usually quite a lot of measures, which already exist concerning how
markets and competitors develop in the marketing department. Sometimes of
course, a company has to question the CSI (Customer Satisfaction Index)
measures because they concern “wrong” populations. Therefore, a company
should care more about whether the most important customers are satisfied.
Sometimes it is hard to find first-class measures for a company’s relative
position in the market, as there are no statistics concerning competitors. But
there has been little evidence that this should be a major problem.
Measurement after all is more a means than an end. By communicating
measures (targets or actual) a company gets employees to discuss and
gradually commit themselves to a shared view of the logic behind the
business, and what they should do themselves in order to further the success of
it (Cepro Consulting).
3.4 Experts View We have chosen to present some secondary data in the area of performance
measurements collected from research carried out in Sweden during this year
(1999). The research provides us with high quality, detailed data, collected
from a great number of companies.
3.4.1 Previous research
Nilsson and Trossmark (1999), argue that the true potential of the BSC is
rarely fully used. Instead of highlighting the overall picture and facilitating
changes strategically, many scorecards contribute in practice to preserve
traditional budget thinking. Although a great number of companies have
started to implement the BSC, few have made use of its full potential and this
has lead to misinterpretation about the scorecard’s potential. Lindvall (1999)
believes that companies have not had the time necessary to fully develop the
BSC. Furthermore, management has not got the true insight about the

Measures under Pressure
55
objective of the BSC. Subsequently, the scorecard is treated as a collection of
key ratios and not the extensive scorecard it really is (Lindvall, 1999).
Nilsson and Trossmark (1999) stress the fact that companies rarely follow up
areas that tend to influence future competitive power such as product and
competence development. It is also censorious that numerous companies have
not developed measurements that reflect how markets and competitors
develop. In too many cases, the BSC is biased and strongly focused on the
internal business. Thus the scorecard becomes non-balanced and planning &
follow-up activities become a management concern. According to Nilsson and
Trossmark (1999), there is an obvious need to develop measurements that
encourage entrepreneurship and innovations. Consequently, the measurements
cannot focus solely upon short-term goals but must also promote long-term
development at both the strategic and operational level. Too frequently, the
management level is responsible for environmental analysis and business
development. As a result, companies avoid the most important resource to
successful renewal - their own employees. The authors suggest two major
improvements for measurement systems. Firstly, companies who have realized
that the employees are the most valuable resource, allow employees´ creativity
and learning to constitute the driving force behind all developments. Secondly,
the scorecard must become intelligent, which means that entrepreneurial
thinking is stimulated and impulses to development are caught up and refined
(Nilsson and Trossmark, 1999).
Kald and Nilsson (1999) have found that increasing competition has forced
companies to measure performance differently which to a higher extent
focuses on measures directly related to operations and to areas of strategic
importance. Measures that reflect profitability, cost effectiveness, and
distribution of sales (which relates directly to profitability) play a significant
role in the performance of the business. These types of measures are relevant
to identify possible needs for changes in strategy and to facilitate
implementation of a business strategy, which has already been adopted.
Measures reflecting on management of external relations – that is reliability of

Measures under Pressure
56
delivery, market position, and customer satisfaction – also play a relatively
important role.
Finally, measures least used by companies reflect employee satisfaction &
attitudes, product development, competence, the environmental profile, and
process development. Since all these types of measurement concern future
development and also long-term success, it is hard to believe that these are
low priority areas. More surprisingly, measures that reflect value for
shareholders are among the least important to measure (Kald and Nilsson,
1999).
3.4.2 Academics
The preference of academics selection is directly influenced by our research
question. Since many research areas are related to the thesis, we searched for
deep insights in a wider perspective by interviewing academics specialised in
different fields such as: financial and management accounting, management
control, and strategy.
3.4.2.1 Strategic Control
Management control should be seen as ongoing processes to monitor visions
and future goals. Therefore it is important to discuss changes over time and
development for future direction (emergent strategies) instead of control. The
objective with strategic control, is to set rough directions, since the more
detailed the information becomes, the more complicated the changes are.
Therefore, more informal ways of changing and adapting to the environment
is preferable. Furthermore, there is an ongoing conflict between long-term
vision and short-term action. Albeit, evaluation of performance is not usually
what the control system claims it should be. (Lecturer, Business
Administration / Strategy, HGU).
Financial accounting outcomes such as balance sheets and annual reports will
always endure because of legal reasons and external requirements

Measures under Pressure
57
(shareholders / stock market), but are not as useful for internal use in the
control system. The reason of a firm’s existence is to increase the shareholder
long-term value and therefore financial goals are the most important to
measure (Assistant Professor, Accounting and Finance, HGU). The BSC is a
tool to increase the shareholder’s wealth, because every action taken within
the company must in the end create shareholder value. Consequently,
customer satisfaction is of no use, if it does not create shareholder value. The
BSC is one of the most misinterpreted control models. This concept is nothing
else than a tool to implement strategies, and flexible strategies cannot be
combined with static control models. The BSC is another philosophy to
illustrate the reality in just the same way as other control models do, and is
therefore a product highly demanded by market. The BSC will probably fade
away in the future just as other management philosophies have, because there
is no general solution to control challenges that one single model could solve.
Finally, lack of evidence for a positive correlation between organisational
models and success is evident (Assistant Professor, Accounting and Finance,
HGU).
It is unfeasible in the long run to only maximise the requirements of one
interest group. Instead, an intermediate way to satisfy different stakeholders´
needs, that have a tendency to vary over time, is desirable. To clarify this
trend, the labour unions in the 70’s had a strong influence while today’s stock
market is powerful. Basically, financial measures show how the company has
performed historically, but have no relevance for future strategic decisions
(Assoc. Professor, Business Administration / Management, HGU).
Western countries are obsessed with measuring, and the market economy
demands that only the most profitable companies survive. As a result,
shareholder value is the most important measure in the long run. However,
there is an ongoing discussion whether or not it is feasible to apply
shareholder measures to the operational level. Management control systems
are greatly decisive for the shareholder view, but to achieve that shareholder
objective, it is important to focus on a broader (stakeholder) perspective such

Measures under Pressure
58
as customers, employees and processes. Additionally, it does not matter what
kind of model is used. The essential goal is to recognise the problem of
management control systems. Interestingly, sometimes consultancies might
tend to sell solutions without having a real problem identified. The point is
that most systems look nice and are easy to manipulate, but the company
distances itself from real figures and problems (Assistant Master, Accounting
& Finance, HGU).
Performance measures depend heavily on who the interest groups are and
whom the information is for. Subsequently, what is central to report is what
the milieu requires. A company has to follow the stream of information
demands. Research has proven that a very small amount of the data available
to the company is actually used. The uncertainty towards the types of
measures that are really appropriate has led towards the design of large
performance measurement systems. There is a tendency of over measuring.
The so called “evaluator trap” explains the outcomes in situations of under-
performance. The natural reaction is to identify and measure the causes of the
dilemma. However, this will almost certainly lead towards the increased cost
of the strategic control (system), which in turn decreases profitability
(Professor, Business Administration and Accounting, HGU).
3.4.2.2 Performance Measures
Performance measures need to focus on effects and behaviour, which financial
measures fail to do. Therefore, performance measures should be pushed down
the organization. Effects and visualization of measurements take place on the
operational level. The operational level must lead directly to financial
measures, because that is what matters to management and shareholders. The
bottom line measures have to lead towards overall goals and not only towards
translation into financial terms. Employees at specific levels need to
comprehend their tailored measures in order to contribute to overall goals and
to understand what behaviour affects the goals (Assistant Master, Accounting
& Finance, HGU).

Measures under Pressure
59
Measuring values is more imperative than cost. When a company makes
investments, it must be capable of measuring effects in terms of value.
Merely, measuring cost does not say anything about the performance on the
market. But the real dilemma lies with how far measures can be used.
Normally, there is a limit to using exact measures. Companies seek to identify
proper measures in order to form a picture of the true results. These outcomes
should guide the company into a unpredictable and changing milieu. To
recapitulate, companies try to control an uncontrollable process (Lecturer,
Business Administration / Strategy, HGU).
The "measurement paradox" entails that large companies become obsessed
with measurement in order to satisfy control requirements. Small growing
companies, however, learn to solve problems through informal discussions
and are subsequently more flexible to strategy changes. But as soon as they
grow and become larger they also become aware of the need for tighter
control and therefore the increased number of measurements. However, too
many measures create severe obstacles towards flexible change. What
managers are trying to do is to find a rational solution to a chaotic reality.
However, the reality is usually completely different from the planned models.
More non-formalized and non-standardized measurements are indispensable
to prepare for smooth and quick changes as well as to adapt to the learning
process (Lecturer, Business Administration / Strategy, HGU).
In the service industry, the customer determines measurements and customer
expectations are vital variables to measure. A service company has to ask
itself: “Do our customers appreciate our efforts?” The most important
information measurements bring to the service company are indicators about
what factors are essential to the creation of customer value. Nevertheless,
variables are not fixed; they tend to change constantly and are above all
unpredictable. The importance of measuring competence and development
could be used to identify critical areas that must be improved to deliver
sustained future success. Service companies are highly sensitive to image and
core service failures. For that reason, measurement practice tends to pay

Measures under Pressure
60
attention to well performing areas rather than failure factors. There is a
distinction between short- and long-term customer satisfaction. What is
essential for the company is customer satisfaction in the long run, as
customers cannot be told what good quality and image is - they need to
experience it. Finally, a fixed performance measurement system is very
difficult to implement and change, because it builds upon quantitative
information. Hence, there is a major conflict, because the system cannot live
up to the qualitative measures (Assoc. Professor, Business Administration /
Management, HGU).

Measures under Pressure
61
4. Analysis
fter the theoretical framework and presentation of the empirical
research, we are now entering the analysis chapter, where we want to
judge and analyse the data discovered. According to Yin (1994), two
criteria for judging the quality of any research are validity and reliability.
Validity means that we need to establish a causal relationship between the
analysis and the empirical data, as well as establishing correct operational
measures for the concept being studied. We selected the specific topics before
we started the research and they were clear from the very beginning.
Furthermore, we will base the analysis on the knowledge gained and the
literature to achieve a clear link between them.
The second criterion is reliability, which implies that operations of this study
can be repeated with the same results. If later investigators follow exactly the
same procedures as described now and conduct the same case studies, the later
investigators should arrive at the same findings and conclusions (Yin, 1994:
p.36). This is definitely the case in our research. However, we find it quite
peculiar that other researchers to accomplish exactly the same final results as
we do. The reason is simply that we want to make fruitful contributions to this
field of research, which means a high degree of own thoughts and judgements.
This should be realistic for others to achieve as well but cannot be repeated in
the exact way. Of course, the investigation of the empirical study can be done
by anybody else, but how the researcher interprets and evaluates the data is
very subjective. We do not want to fall in the trap of just explaining things
rather than really analysing and discussing the knowledge gained.
Easterby-Smith, Thorpe and Lowe (1991) add a third criterion:
generalisability. That means the observed patterns in a sample should also be
presented in the wider population from which the sample is drawn. This point
is not so easy fulfilled, as our research mainly relies upon two companies from
different sectors in the service industry. Since this research is so complex in its
A

Measures under Pressure
62
structure, it is particularly challenging to try to find a standardised solution to
be implemented in a more general context. We strongly believe that a deep
form of literature research together with adetailed empirical research, and our
matrix approach, the findings should be able to meet these requirements.
Furthermore, Easterby-Smith, Thorpe and Lowe (1991) point out the
importance of dissertations on the master level. Especially at this level, the
thesis normally includes theoretical ideas, based on literature and some form
of data collected. But the collection of the data is not enough. What is
expected is to show maturity and ability to use the information gained and
evaluate the knowledge, which is exactly our main emphasis in this section.
This idea is the reason why we have chosen the unique research determinants
approach. We will combine all the perspectives from previous research,
theory, academics, consulting, and business into one single investigation
concerning our two specific case companies. Our aim is to identify a flow
from implementing a new strategy to the use of the performance measurement
system, which will identify applicable types of performance measurements
used by the specific company. This classification of performance
measurements will give us an answer for how strategy implementation,
performance measurement, and different types of measures are correlated.
Particularly these outcomes will make the data comparable and will constitute
a strong link to the industry in general.
4.1 Framework of Investigations
In this chapter we will analyse the investigations in the area of the literature,
the academics and research approaches, as well as the impact from the
consultants’ point of view. These different approaches will provide the
framework, on which we base our findings from the specific case companies.
The idea is to start the analysis by describing the strategic changes in both
companies, which is the starting point for strategy implementation. After this
we investigate how the implementation of the strategy is controlled and

Measures under Pressure
63
measured. Then, we identify, in both cases, the types of measurements that
best monitor the chosen strategy implementation. Finally, we compare the
result and relate it back to the service industry, from which the sample was
taken.
4.1.1 The Use of Performance Measurement Systems
The “relevance lost debate” initiated the discussion about traditional
management control in general and performance measurement in particular.
The main point of discussion was whether financial measures are adequate in
measuring the performance of the company. The new suggestion was to
combine financial with non-financial measures, because financial measures
were too late, too distorted, and too aggregated. Furthermore, management
control should be connected to the company’s strategy and vision. These
discussions led to the publishing of several new performance measurement
systems such as the performance pyramid, PMSSI, the BSC, and EPPM
(literature perspective/view). The framework for all of these models is
basically the same. All of them concentrate on the balance between financial
and non-financial measurements. Moreover, they all take strategy and vision
as the starting point and combine external and internal aspects. Finally, the
time perspective took place in terms of leading and lagging indicators. It is
quite astonishing that similar ideas arise almost at the same point of time even
though distance and acknowledgement do not take place with the different
researchers (academic perspective/view). There is a obvious time lag between
the original idea and the acceptance through the official publication in official
magazines and journals. When they finally do get published it is probably the
most famous such as Harvard Business Review that get the most attention.
Today, facts prove that the BSC is the most accepted and used performance
model in use, mainly for the reason that it is easy and simple to apply and
comprehend. Additionally, the BSC concept is applicable almost to any
company in any situation (consultant perspective/view). Both KappAhl and
Skandia AFS, introduced a modified BSC approach as their performance

Measures under Pressure
64
measurement system. Both companies have added a fifth perspective – “the
human or employee perspective”. While KappAhl still focus on its BSC,
Skandia AFS named its approach the “Skandia Navigator”. The latest
contributions in the area of new performance models are the approaches of the
EFQM and a unique BSC tailored for services (literature perspective/view).
For us, these concepts just add small adjustments to the same concept rather
than launching innovative ideas. 4.1.2 Types of Performance Measurement
The measurements within the different perspectives must not lead to sub-
optimisation, but should support the overall vision and strategy (research
perspective/view). The big challenge is to find evident links and to create a
balance between different measurements in the chosen perspectives. A
discussion is essential to decide whether it is possible to obtain balance
between the different measurements, so short term improvements do not
conflict with long term goals (academic perspective/view). In light of the
debate on balanced control, it is interesting to survey the degree to which
performance measurement actually includes measures that reflect external
relations, the efficiency of internal processes, innovation and renewal, etc.
(academic and consultant perspective/view). Interestingly, what gets measured
is often what is easy and possible to measure and in some cases, what is
meaningful to measure is not measurable (literature perspective/view). The
important part is to trigger discussion about intentions and performance in the
areas, which are deemed important. Even fairly "weak" measures, indicators,
proxy measures etc., can be used for this. Measurement after all is more a
means than an end (consultant perspective/view).
4.2 KappAhl The investigation of KappAhl is divided into different sections in order to
allow the reader to follow the argumentation. First of all we will describe the
new strategic process chosen by KappAhl. An analysis of the performance

Measures under Pressure
65
measurement system and the identification of types of performance measures
actually used will directly follow this. Finally, we will link the connection of
the different measurement types back to the strategic perspective.
4.2.1 The strategy process
After some demanding years, a new CEO took over at KappAhl in 1995. To
save KappAhl from losses, a completely new vision and strategy was
indispensable. We can interpret this process to Normann’s (1992) strategic
service concept. The first part of the market segment is equal to the design of
the new target group at KappAhl – that of “ a company creating good value
for smart dressers “. That is how KappAhl identified the core market segment,
which they wanted to serve. The second part of designing the service concept
is to identify the core service as having good quality for human prices offered
at a wide range of local stores. By choosing this approach, employees,
customers and supply chains are put in main focus, which can be understood
as equivalent to the original idea of service supply systems. Furthermore, the
image of KappAhl takes a central role and was completely re-established.
KappAhl completely changed its face towards the new customer segment.
Finally, the new CEO himself stood for the new culture and philosophy. As
we see it, the link between the strategic service concept and the new strategy
of KappAhl is quite evident. The new vision of the company was stated as
“KappAhl being the industry’s leading service company”. For us, this vision
has a strong correlation to the design of the new image and culture.
4.2.2 Performance measurement system
The BSC at KappAhl is top management responsibility. It is a communication
tool for top management to implement strategies and control the process. The
belief that performance measurement should be designed to suit the needs of
top management is a common normative viewpoint, which as we have seen is
also widespread in practice (academic and research perspective/view). When
the new CEO took over, the new strategic direction of KappAhl was carefully
planned. KappAhl’s choice of a push strategy was carefully prepared to master
the internal and external environment. Much focus was placed on the design

Measures under Pressure
66
of the new strategy and a clear vision was also stated. From a consultant’s
viewpoint there is no use in implementing any scorecard before the strategy is
absolutely clear. This is the paramount focus and has top priority.
The BSC at KappAhl was decided on as a suitable tool for measuring
performance. Questions such as “Are we moving into the right direction?” and
“How are we performing?” typically characterize the control of strategies
(literature perspective/view). As we see it, the BSC was a control tool for
commanding the re-structuring process and was not the primary reason for
delivering organisation success. In general terms, what is most important is
what basic purpose underlines the implementation of the BSC. This could be
anything such as employee motivation, re-organization tool, management
control, or shareholder information (consultant perspective/view). We see the
BSC as a helpful instrument for management to implement new strategies and
visions, which is supported by the academics view. More notably as we argue,
what most characterises the BSC is above all its efficiency to provide quick
results, and to focus resources on common objectives, which are other strong
arguments for the BSC to be an extremely attractive management instrument,
particularly when facing financial pressure.
To be able to communicate the overall goal, the KappAhl management made
use of the BSC to visualize for everyone in the company their part of the re-
structuring process. We believe that the additional fifth perspective was added
to KappAhl’s specific BSC just to demonstrate the importance of the
employees, since without employee’s acceptance and commitment, the new
management would not be able to carry through the necessary changes within
the defined timeframe. By communicating measures (targets or actual) a
company gets employees to discuss and gradually commit themselves to a
shared view of the logic behind the business, and what they should do
themselves in order to further the success of it (consultant perspective/view).
Suddenly, the employee perspective has acquired the central role in the BSC.
Especially, because all KappAhl employees were asked to make suggestions

Measures under Pressure
67
for improvement in their specific area, the whole company was involved into
the change process.
4.2.3 Types of performance measurements
Examples of measures include “markdowns”, “days of inventory goods”,
“number of visitors”, “satisfied employees and customers indexes”, and “days
from order to delivery”. These kinds of measurements represent types that are
easy to measure and simply structured (consultant perspective/view). We see,
KappAhl following a clear structure by deciding to keep measures as simple
as possible with direct links to the specific perspectives. KappAhl continually
tries to identify the adequate performance drivers, which correlate best with
their core activities. From an academic’s or researcher’s perspective/view this
is one of the most crucial relationships between measures. But most measures
do not reflect the overall game plan (strategy). Those measures that typically
do, are fragmented and isolated by functional specialty (BSC). Even when
these measures are aligned with the company’s strategy, the performance
information to the management is still fragmented (research
perspective/view). As we see it, the cause-and-effect relationship between
performance drivers and outcome measures is apparent, but KappAhl uses
mostly a vertical approach. In practice, there is a tendency to use much more
partial analysis (consultant perspective/view).
Measurements of attitudes are the key to long-term success, but have proved
to be the most difficult to identify/monitor. Accordingly, KappAhl uses
“employee satisfaction” as a measurement in two perspectives – employee and
development. We distinguish two major advantages. Firstly, it positions the
employee in main focus and secondly employee satisfaction is easy to
measure and to improve. KappAhl puts a lot of emphasis on profitability
measures combined with satisfaction measures. KappAhl measures what
creates value for shareholders rather than measures for direct shareholder
value in itself, as exemplified in the example of the process and finance
perspective, which represents profitability measures that directly create value
for shareholders. The shareholder focus is the most important aspect for

Measures under Pressure
68
performance measurements (consultant perspective/view), while a more
biased approach towards shareholders within the stakeholder model is crucial
as well (academic perspective/view).
As we see it, KappAhl also follows this guideline by focusing a great deal on
market share, customer satisfaction, but also the supply chain. The supply
chain dominates three perspectives of the performance measurement system:
customer, process, and development. This focus is typical, because from a
consultant’s perspective KappAhl is still a manufacturer and not a typical
service company. Especially for manufacturing companies supply chain
efficiency is essential. The timing within the supply chain is one of the most
critical factors to be monitored, since the overall objective is to reduce lead-
time. Again, this highlights the eagerness to focus on measures that are easy to
control but also manifests the objective searching for profitability measures
that in the end create shareholder value.
4.2.4 Connection to strategy
To pinpoint essential types of measures for its strategy implementation,
KappAhl has emphasized measurements that reflect profitability and
satisfaction measures. This confirms previous research claiming these types of
measures are among the most frequently used in practice (research
perspective/view). Lots of emphasis was also put on measures that could
identify KappAhl’s new image and those that mirror employee satisfaction.
Not surprisingly, these areas of success should be the most critical to monitor
during the restructuring process such as KappAhl's strategy implementation.
Despite the fact that it is indispensable that every employee is committed to
put effort into the process, profitability measures are concerned and the
process is within budget. These facts prove why the employee perspective
receives so much attention through the BSC and stands for a major type of
measurement within the performance measurement system. Furthermore, the
new image was paramount for the new direction of KappAhl. This explains
why KappAhl puts so much emphasis on customer satisfaction indexes.
Finally, the supply chain within KappAhl is crucial for business success,
Measures under Pressure
69
which makes it one of the main types of measurements. We believe that
KappAhl really managed to create those types of measures that best reflected
their new-implemented strategy. However, the main reason for KappAhl's
success has nothing to do with the BSC but is rather a sophisticated strategy.
Referring back to our main argument, the BSC is solely a management tool to
implement strategy, measure success and to motivate employees. Even
though, in the case of KappAhl the strategy implementation was exceptionally
successful.
4.3 Skandia AFS
This chapter has the same structure as 4.2, in order to compare both
companies in a final analysis.
4.3.1 The Strategy Process
The reorganization started in the 80s to change the way Skandia AFS (at this
time a traditional insurance company) viewed and measured its value. The
former chairman, Björn Wolrath and Jan Carendi, who became CEO at
Skandia AFS in 1991, led the strategy process. The process was initiated by
the idea that traditional management theory no longer matched the
development of service companies and especially not knowledge intensive
companies. The two noticed the fact that a company’s competitive power was
less dependent upon traditional assets such as buildings, equipment and
inventory. Instead, new factors, as for example individual talents,
collaborating market relations and abilities to handle torrents of competence
were considered to determine a company’s future success.
Making an interpretation of Normann's (1992) strategic service concept,
within the market segment, there is a trend that fewer pensions and other
financial assets are being passed down from one generation to the next, driven
by the overall aging of the populations. This creates an increased demand for
private savings solutions. Skandia AFS´s core service concept is to contribute,

Measures under Pressure
70
enhance and secure prosperity and quality of life into old age and other long-
term needs. This is achieved by providing customized, flexible and innovative
savings solutions with high market related returns at world competitive prices.
For Skandia AFS´s Service supply system, the imaginary organization whose
operations are dependent upon collaboration with other actors (strategic
partnership with local experts) means that the organization is actually greater
than the sum of its parts. This implies that the company gains competitive
market power with a low number of employees and infrastructure investments. Intellectual capital has received lots of publicity around the world and is an
important component for Skandia AFS's corporate image. It is not only a
method for external use but also to meet stakeholder requirements as well as
being a marketing tool that creates goodwill and thus attracts skilful workers.
Everyone in the organization should share the same values and attitudes,
which then makes it easier to strive towards a common goal. Culture and
philosophy are other cornerstones for Skandia AFS as it is argued that the best
way to satisfy customers is by having satisfied employees. A high trust value
means, “Everyone expects you to do the job you were hired to do”. This is the
term used to define the attitude toward employees, as the company considers
the people to be the most valuable asset of the organization (the uniqueness of
this statement is of course questioned).
4.3.2 Performance Measurement System
As we see it, one of the strengths with Skandia AFS´s measurement system, is
its ability to focus on one part of the value chain, concentrating only on those
areas where Skandia AFS has core competences. All other responsibilities are
outsourced to specialists. The Navigator is designed to provide a balanced
picture of financial and intellectual capital. From a management perspective,
this process highlights indicators and intellectual capital ratios that describe
Skandia AFS´s strategic development and value creation. The cause and
effect relationship is clearly defined as it reflects not only upon current
situation analysis but also on direction and speed (consultant
perspective/view).
Measures under Pressure
71
Moreover, the Navigator is built with a top to bottom architecture and vice
versa. Strategic direction is clarified from the top management in the
organization, while the identification of indicators originates from bottom up
in the operative activities. The essence of getting acceptance at all levels of the
company is one of the main critical factors to a successful BSC
implementation (academic and consultant perspectives/view). Together with
the imaginary structure with the collaborative knowledge network, we view
the measurement model as a cross-functional approach as it focuses every
dimension of the organization, both vertically and horizontally and intra
companies.
Every unit at Skandia AFS designs its own Navigator approach and tailor the
specific measures to their specific situation as long as it is aligned to the over
all strategic goals. Accordingly, the Navigator takes a system perspective view
and does not isolate measures in their functional specialty – in contrast to
KappAhl who applied a vertical approach. The reason behind this is that
Skandia AFS undertakes the intellectual capital as a base for its entire
performance measurement system. Types of measurements that monitor competence and development are
essential for service companies, in general, to be competitive and create
customer value (academic perspective/view). As we have learned from
previous research, future competitive power such as competence tends to be a
low priority area to monitor at Nordic companies (research perspective/view).
Still, as we have found in our research, Skandia AFS gives the impression of
fulfilling these requirements, predominantly in the area of competence
monitoring.
The Navigator guides the types of measurements, links them together in a
logical way by category and then ties these categories together into a unified
whole. Nevertheless this is not enough; the Navigator must further align all of
the measurement data to create fewer overall figures, which is sometimes not

Measures under Pressure
72
easily achievable. We argue that the value creating models such as the value
scheme, the process model and the IC index, all live up to the obligation of
“strategy as a value creating hypothesis”. Not only do they define for whom
the value is created but most importantly answer the question of whether the
company really creates value. Moreover, The Navigator emphasises changes
over time and future direction and not only control, which gives the entire
system a flexible approach (academic perspective). Finally, it provides
evidence that the Navigator provides a basic framework that could be
combined with additional model-specific areas (consultant perspective/view).
4.3.3 Types of Performance Measurements
When the Navigator was developed, a great number of measurements were
investigated. Later, the types were reduced in order to identify the most
valuable to the processes – KappAhl followed the same procedure. Today,
Skandia AFS puts a lot of emphasis on the renewal & development focus in
order to guide the company into future directions. As we see it, what types of
measurements are most applicable is not as apparent at Skandia AFS as in the
case of KappAhl, for the reason that each unit uses tailored approaches to
achieve desired results (it is therefore difficult to grasp the whole picture).
There are general guidelines of measures, but the specific design is end user
responsibility. However, the characteristics of the types of measurements
actually implemented are flexibility to environmental changes and easy to
implement (academic perspective/view). Contrary, to our previous argument,
there might be a long-term risk with too fragmented measures. In response to
that, Skandia AFS claims that this could be a threat, but it is not applicable to
them, since they use competitive benchmark measures (Skandia AFS). Our
reaction to that is the challenge to consider measurement standards in the local
markets; as "local" measures might be interpreted in different ways.
The challenges with the customer capital measurements are to find those
measurements that best capture effective company-customer relations. These
measures typically include “customer type”, “customer duration”, “customer

Measures under Pressure
73
role”, “customer support”, and “customer success”. Customer value and
satisfaction are essential to monitor, though, as we interpret it, the Navigator is
a tool for increasing shareholder value. Subsequently, every decision within
the Skandia AFS must lead to increased shareholder wealth through long-term
satisfied customers (academic perspective/view). The bottom line is that
overall measures must be comprehended by the specific end user (consultant
perspective/view).
As we have argued throughout the analysis of Skandia AFS, general types of
measurements are arduous to identify, as the usual statement we have met
during interviews is that "everything depends upon specific situations and
perspectives". That is an accepted response since all subsidiaries operate in
different countries, cultures and leader styles etc. Therefore it is crucial to
apply tailor made measures for each specific situation. Skandia AFS argues
that the most applicable measures to monitor successful strategy
implementation are those that reflect “market shares”, “sales measures”, but
also “number of wholesalers” and “financial planners and performance funds”.
As previous research suggests, this confirms the willingness of companies to
focus on profitability measures, and conceivably also our argument that the
Navigator is solely a tool to increase shareholder wealth.
4.3.4 Connection to Strategy
As we have pinpointed, successful strategic measures must reflect future and
human resource factors. Yet, and directly as a result of the latter, the customer
perspective is also a key issue. For Skandia AFS, strengthening customer
relationships is paramount. Consequently, if Skandia AFS invests in the
human and future perspectives, satisfied customers will become a likely result
as we value high quality measurements as outcomes of a well-defined process.
As far as we are concerned, a high degree of internal processes and strategic
actions taken within Skandia AFS rely heavily upon intellectual capital as
such, hence intellectual capital is THE measurement type for strategy
implementation. However, most importantly, intellectual capital is more than

Measures under Pressure
74
simply a measurement system. It creates a specific image for the entire
company and unites the mutual vision of Skandia AFS. For us, intellectual
capital is the means for implementing the strategy itself. Firstly, it motivates
employees to a very high extent in terms of change incentives and personal
satisfaction, which is exactly what Skandia AFS must do in order to
acclimatize itself to its competitive milieu and its specific organisational
structure (“specialists in cooperation”). That leads us to the primary objective
– highly motivated, skilful and satisfied employees. Furthermore, the second aim is to create customer value and satisfaction
through intellectual capital and motivated employees. In the service industry,
customer value is the supreme factor for delivering company success
(consultant perspective/view). Skandia AFS especially highlights its
employees as the most important resource for creating customer value. Lastly,
we see the very end of the value creating chain (through intellectual capital,
employee satisfaction and customer value) as the establishment of shareholder
wealth. After all, Skandia AFS´s long-term strategy is to create shareholder
value. Accordingly every measurement leads undoubtedly to shareholder
value (and management careers).
4.4 A Model Applicable to the General Service Industry After having studied and analysed all research determinants we would like to
summarise our own evaluations and judgements. The following model is a
summary of our point of view on performance measurement. We want to
apply our main findings to the general sample by designing a model over the
vital types of measurements strongly connected to the value creating processes
(through strategy implementation) particular suitable for service organisations.

Measures under Pressure
75
FIGURE 15: PERFORMANCE MEASUREMENT MODEL; OWN ELABORATION
Our overall argument has been that the goal with every decision made within a
service company, with the help of a performance measurement system, is to
create shareholder value. Measurements are after all more a means than an
end. Most academics and consultants as well as research share this view.
However, what we find highly remarkable is the fact that the types of
measurements tend not to reflect measures, which show what creates value for
shareholders rather than value for shareholders in itself. The primary intention
behind the use of performance measurement systems (BSC and Navigator) has
been to monitor strategy and vision implementation. From investigating the
two service companies we can identify two major areas of focus for
Management
Strategy & Vision
Employee Satisfaction / Value / Motivation
Customer Satisfaction / Value
SHAREHOLDER VALUE
Commitment and Communication

Measures under Pressure
76
performance measurement that deliver sustained future success to service
organisations: employees and customers. We have found a strong correlation
between employee satisfaction / motivation and customer value. Despite the
old-fashioned statement of Skandia AFS, it is still true that ”The best way to
satisfy customers is to have satisfied employees”. KappAhl also emphasised
the areas of employee motivation and personal commitment to facilitate
necessary strategic changes. A common denominator is therefore, in both
cases, identified as being intangible measurements reflecting human
resources; a starting point for the creation of customer value.
The second step in our interpretation is the strong correlation between
customer satisfaction and shareholder value. With this we stress that every
action taken within a service company must lead to shareholder value, hence if
customer satisfaction does not create that kind of value, it is worthless and
should be abandoned. What is important to keep in mind is to satisfy the right
kind of customers and monitor with the right type of measurements, in order to
meet customer expectations and optimally to exceed their needs. A customer
satisfaction index should concern the “right” population, because the company
should care more about its most important customers’ satisfaction. Today a
service company sells entire experiences that are valued highly by its
customers, who of course pay more, and subsequently leads to higher
shareholder value. Customer experience is a factor of high importance in the
link to the image of the service company. In spite of this, the framework for
customer satisfaction is a satisfied and skilful employee. That leads to a direct
linkage between shareholder value and employee motivation and satisfaction.
Employee satisfaction is based on the specific culture of the company, which
must lead towards the desired image. That means that employees and
customers share the same kind of values. To sum up, culture and image are
two extremely important areas for service companies to monitor and improve
in order to deliver sustained future success.

Measures under Pressure
77
4.5 Critical Approaches to Performance Measurements
In this section we want to present some major arguments of criticism towards
performance measurements in general but to KappAhl and Skandia AFS in
particular, concerning strategy implementation.
4.5.1 The BSC as a Product The success of a strategy implementation does not necessarily depend on the
performance measurement system as such or how to actually monitor
operations. Instead we have identified single executives to be the main reasons
for success. At Skandia AFS and KappAhl they have created strong corporate
culture and vision, which is the only true basis for long term success. The
reason behind the use of Navigator/BSC was instead to create strong personal
commitment and communication channels inside the company to achieve
successful strategic objectives. Undoubtedly, we cannot neglect the fact that
the Navigator/BSC was somehow used as a strong management control tool,
for personal interests.
The BSC is a tool for strategy implementation and employee motivation. It is a
consultant product. The BSC is easy to sell, because of its simplicity and
comprehensibility. This is a suitable combination for executives (under
pressure from stakeholders) who are willing to invest significant sums of
money to achieve quick results to move the organisation in the desired
strategic direction (after all, executives do consider their own results and
careers). Consequently, the BSC is top management responsibility. The model
as such is not guiding the company into the future rather than monitoring
present operations and strategy implementation, set by the executive level. It
is operating within a predetermined framework, and in that sense, the BSC is
static and not suitable for flexible strategy approaches.
As the analysis has suggested Skandia AFS rely heavily on its "product" the
intellectual capital, to implement strategic changes. Intellectual capital as a
measurement can be challenged, as the formula today does not contain any

Measures under Pressure
78
uniqueness along with the fact that the concept is maturing. If intellectual
capital really is a true way to measure and deliver business success, why have
so few companies implemented the idea?
A critical risk might be a kind of "blindness" towards intellectual capital, and
in the long run inhibiting changes and making the entire organisation
inflexible towards strategic movements. The final point of reflection is the true
understanding of the Navigator. Does every employee at all levels
comprehend the measurement system? Probably not, because it is a model to
control employees. 4.5.2 Failure Approach as a Success Formula The BSC is fundamentally a SUCCESS model. The BSC provides visualised
and simplified pictures of a complex reality by concentrating on the
contemporary strengths and success areas to improve.
However, the BSC tends to neglect weak areas, which are crucial for future
strategic direction and development. The long-term objective for organisations
is in addition to fulfilling shareholders requirements to be competitive in the
long run. There is a potential risk in neglecting weaknesses, because at some
point an organisation will realise that these are strategically important as well,
but then it is too late for modifications. Hence, there is a likely risk that weak
areas might diminish success. To be responsive to potential risks and
opportunities, we vote for stronger attention to types of measures that reflect
failure areas.
KappAhl follows the common approach of focusing on success areas rather
than analysing failure. For instance, measures within the customer satisfaction
indexes only take into account the most satisfied numbers. Moreover, these
measures basically judge cumulated figures instead of separating customer
segments. Neither core customers nor defecting customers are taken into
consideration. We suggest that KappAhl apply a combined measurement
system. This system might include critical success factors (core customers)

Measures under Pressure
79
and failure analysis (defecting customers) and most essentially defecting core
customers. Defecting customers are critical to monitor, as they provide the
service company with valuable information about market performance.
However, there are threats with failure measures, since failure is often
considered to have a negative impact on personal motivation and value
creation. It entails a mature organisation in combination with strong
leadership. Therefore we suggest a smooth mixture between success and
failure measures. It is essential to be acquainted with the causes of former
crises before identifying what will deliver future success. SWOT measures as
well as competitive measures are essential for any scorecard implementation.
These analyses provide answers to the current situation of the company and
advise on future guidelines. Only after having identified the weaknesses as
well as the strengths combined with opportunities and threats in relation to
external competition, can a proper strategic direction be identified. The BSC
fails in practice, because of its internal character.
4.5.3 Means Towards Financial Ends
Financial measurements are truly important, not only due to legal aspects and
external interests but also to monitor internal profitability. However we cast
doubt on the strong attention financial measures still receive in both KappAhl
and Skandia AFS through the performance models. The “relevance lost
debate” somehow judged the financial perspective as being solely a provider
of past actions through accounts of figures from prior periods that cannot be
changed or influenced. There are always lessons to learn from history as long
as one acts rationally. However, companies are not rational in this aspect and
as the environment continuously changes it is impossible to apply financial
measures to present situations, as success cannot be copied. Financial
measures are the outcome and the end of the entire performance measurement
system. The word “Measure” is wrong in this setting. What really is
imperative to measure is firstly the perspective of employees that secondly
leads to customer satisfaction/value. These measures indicate how the

Measures under Pressure
80
company progresses and adapts to changing conditions in a feedback loop
relationship. That will offer internal evidence if employees feel comfortable
with the new strategic direction and can contribute to future success. Customer
measures provide external answers on how customers appreciate the efforts of
the company, which are directly related to the final outcome of the
performance measurement system, namely shareholder value. These two
measurement types are the means towards the financial end.
In addition, process measurements should receive a great deal of interest as
well. This perspective should include measures concerning, total quality,
supply chain, process innovation, R&D, lean production, etc. whatever suits
the specific service company best. KappAhl's performance areas could be
divided into one logistical and one service oriented. Production and
Transportation processes focus mainly on financial measures and depend upon
efficient supply chain management and proficiency measurements in order to
fulfil the overall objective of reducing lead-time. This function produces the
real quality. Within Sales and Retail employees take a centre role in living up
to customers’ expectations on quality and service. Intangible measures such as
attitudes, motivation and satisfaction are essential. As a result, the supply
chain is basic for the company’s success, but the service part of the company
must live up to the image and quality as well. We vote for two different
scorecards: one for the logistic function and one for the service function that
provide a more biased approach to the entire service organisation.

Measures under Pressure
81
5. Further Reflections
o continue our innovative thesis approach we do not want to start
claiming phrases about further research that just reformulates our
research question with small modifications in terms of different
delimitation. Throughout the analysis we found three very interesting
aspects/approaches that were not covered in this thesis, but should be
investigated further and which attract considerable attention. These aspects
include catalytic mechanisms, failure analysis, and Hawthorn effects.
5.1 Catalytic Mechanisms
According to Collins (1999), the answer for managerial control systems is
very basic. He developed the term “Catalytic Mechanisms” that are the crucial
link between objectives and performance. These mechanisms translate every
“big, hairy, audacious goal” into action. To say it in short, it is an instrument
for vision and strategy implementation. This simple yet powerful managerial
tool helps organizations turn goals into results. Catalytic mechanisms share
five distinct characteristics:
• Produces desired results in unpredictable ways
• Distributes power for the benefit of the overall system, often to the great
discomfort of those who traditionally hold power
• Has sharp teeth
• Attracts the right people and ejects viruses
• Produces an ongoing effect
When executives identify a confident organizational goal, the first thing they
usually do is design a excess of systems, control, procedures, and practices
that seem likely to make it happen. That process is called "alignment". The
great paradox is that by giving up control and decreasing predictability, a
company increases its probability of attaining extraordinary results. But no
executive or manager would ever give up control. The key to success lies in
T

Measures under Pressure
82
new ways of achieving targets using unpredictable ways. That can only be
reached by giving up control. But by giving up control, managers make
themselves useless in the organization. The catalytic mechanism tilts the
balance of power away from inertia towards change. It challenges the default
tendency of bureaucracies to choose inaction over action, status quo over
change, and idiotic rules over common sense. What is meant by the first two
mechanisms is solely that a company will never achieve outstanding
performance without trying new ways. The winners are not the ones that
follow the herd. The most successful entrepreneurs set trends instead of
following.
The fact is that executives spend hours drafting, redrafting, and redrafting yet
again statements of core values, missions, and visions. This is a very useful
process, but statements themselves will not accomplish anything. By contrast,
a catalytic mechanism pits a process in place that all but guarantees that the
vision will be fulfilled. That means it has sharp teeth to achieve the goals. A
lot of traditional controls are designed to get employees to act the “right” way
and to do the “right” things, even if they are not so inclined. But great
organizations have figured something really important out: the old adage
“people are your most important asset” is wrong; the right quotation is “the
right people are your most important asset”. The right people are those who
would exhibit the desired behavior anyway, as a natural extension of their
character and attitude, regardless of any control and incentive system. The real
challenge is to find people who already share your core values and to create
catalytic mechanisms that so strongly reinforce those values that people who
do not share them either never get hired or find the door very soon. Events are
not enough to achieve the desired outcomes. Instead ongoing processes are
needed. An inspiring speech to the troops, an electrifying off-site meeting, a
euphoria-producing buzzword, a new initiative or strategic imperative, an
impending crisis – all of them are events and most are useful. But there will be
no effect if no ongoing process is started. Instead of just adding catalytic
mechanisms, the whole system must be removed by; create and do not copy;
allow your mechanisms to evolve over time, and build an integrated set.

Measures under Pressure
83
5.2 Failure Analysis According to Reichheld (1996), the lifeblood of adaptive change is employee
learning, and most useful and instructive learning grows from the recognition
and analysis of failure. A first step in getting people in an organization to
focus on failure analysis (customer defections, etc.) requires overcoming the
preoccupation with success. Of course, success has lessons to teach. But
businesspeople today are obsessed with success and sometimes more obsessed
with other people’s success than with their own. Benchmarking has become a
enthusiastic search for the world’s lowest cost, highest volumes, and fastest
growth. Consultants and executives search for approaches that have led to big
profits in one situation so they can apply them in others. This so-called best
practice is by research proved to create less value than one might expect. Why
is that? When systems are working well, its success rests on a long chain of
subtle interactions, and it is not easy to determine which links in the chain are
most important. Even if the critical links were identifiable, their relative
importance would shift as the world around the system changed. So even if it
was possible to point to the critical links and more or less reproduce them, it
would still not be possible to reproduce all the relationships or the external
environment in which they operate.
Warren Buffett, one of the world's most successful business men (in monetary
terms) claims that he has more to gain by studying business failures than
business success. “In my business we try to study where people go astray and
why things do not work. We try to avoid mistakes. If my job were to pick a
group of ten stocks in the Dow-Jones average that would outperform the
average itself, I would probably not start by picking the ten best. Instead, I
would try to pick the 10 or 15 worst performers and take them out of the
sample and work with the residual. It is an inversion process. (Richman, 1996)
Of course it is hard for companies to use failure analyses. Psychologically and
culturally, it is difficult and sometimes threatening to look at failure too
closely. Ambitious managers want to link their careers to successes, because

Measures under Pressure
84
failures are usually examined for the purpose of assigning blame rather than
detecting and get rid of the systematic causes of poor performance.
5.3 Hawthorn Effects
Itter and Larcker (1998) vote for the possibility that any performance
consequences might simply be due to a “Hawthorn Effect”, with specific
measures having minimal importance. The authors provide a broad overview
of potential research opportunities related to economic value measures, non-
financial performance measures and the BSC, and performance measurement
initiatives in government agencies that characterize the recent innovations in
performance measurement trends. The ultimate question is whether there is
anything fundamentally superior about these measurement practices that
produce desirable changes in managerial behavior. Perhaps the same (or
better) results could be obtained with other performance metrics, as long as
senior-level managers champion the performance measurement choice. We
have identified the loop/chain from implementing a new strategy, measuring
performance, and connecting the outcome back to the strategic direction. Our
case companies used a modified BSC concept to support the strategy
implementation. It could be interesting which other concepts besides the BSC
could fulfill the same desired results.
Machiavelli (16th century) claimed that no prince (manager) should believe in
solely secure decision making. Rather than believing in secure decisions, these
must be questioned, because it lies in the nature of things that you cannot
avoid one problem without struggling into another problem. The wisdom of
decision-making lies in identifying all problems and choosing the one that
implies the minimum risk and translating it into positive issues.
“ Invert, always invert, in mathematics and physics, and it is a very good idea
in business, too. Start out with failure, and then engineer its removal”
[Albert Einstein]

Measures under Pressure
85
APPENDIX 1: Examples of Measures at KappAhl
(Adopted from Olve, Roy and Wetter, 1999a)
FINANCIAL PERSPECTIVE
1. Total cost ($)
2. Revenues/total assets (%)
3. Return on investment (%)
4. Revenues/employee ($)
5. Profits/total assets (%)
6. Market value ($)
7. Return on net assets (%)
8. Profit margin (%)
9. Cash flow ($)
CUSTOMER PERSPECTIVE
1. Number of customers (No.)
2. Annual sales/customer ($)
3. Average time spent on customer relations (No.)
4. Customer/employee (No. or %)
5. Customer loyalty index (%)
6. Customer visits to the company (No.)
7. Number of complaints (No.)
8. Brand image index (%)
9. Service expense/customer/year ($)
10. Customer rating (%)

Measures under Pressure
86
PROCESS PERSPECTIVE
1. On time delivery (%)
2. Average lead time (No.)
3. Inventory turnover (No.)
4. Environmental impact of product use (No.)
5. Cost of administrative error/management revenues (%)
6. Contracts filed without error (No.)
7. Lead time, product and development (No.)
8. Administrative expense/total revenues (%)
9. Average time for decision making (No.)
10. Improvement in productivity (%)
RENEWAL AND DEVELOPMENT PERSPECTIVE
1. R&D expense ($)
2. Hours, R&D (%)
3. Investment in training/customer (No.)
4. Investment in development of new markets ($)
5. Patents pending (No.)
6. Competence development expense/employee ($)
7. Satisfied employee index (No.)
8. Marketing expense/customer ($)
9. Non-product-related expense/customer/year ($)
10. Employee’s view (empowerment index) (No.)

Measures under Pressure
87
HUMAN-RESOURCES PERSPECTIVE
1. Leadership index (No.)
2. Motivation index (No.)
3. Number of employees (No.)
4. Employee turnover (%)
5. Time in training (days/year) (No.)
6. Share of employees with university degrees (%)
7. Percentage of full-time permanent employees (%)
8. Number of full-time permanent employees (%)
9. Number of applicants for employment at the company (No.)
10. Empowerment index (No.), number of managers (No.)

Measures under Pressure
88
APPENDIX 2: Intellectual Capital Measures at Skandia
(Adopted from Buren, 1999)
HUMAN CAPITAL
1. Organisational learning
2. Effectiveness of learning transfer in key areas
3. Management credibility
4. Employee wages and salaries
5. Educational levels – percentage of college graduates
6. Employee empowerment
7. Management experience
8. Time in training
9. Percentage of employees with X+ years of service
10. Empowered teams
INNOVATION CAPITAL
1. Number of copyrights and trademarks
2. Number of patents used effectively
3. Planned obsolescence
4. New opportunities exploited
5. New markets development investment
6. R&D productivity
7. Sales from products released in past five years
8. Research leadership
9. Net present value (NPV) of patents
10. Effectiveness of feedback mechanism

Measures under Pressure
89
PROCESS CAPITAL
1. Strategy execution
2. Quality f decisions
3. Percent of revenues invested in knowledge management
4. Percent of company effectively engaged with customers
5. IT access per employee
6. Strategy innovativeness
7. Cycle Times
8. IT investment per employee
9. Process Quality
10. Time-to-market
CUSTOMER CAPITAL
1. Market growth
2. Customer needs met
3. Marketing effectiveness
4. Annual sales per customer
5. Market share
6. Average customer size (in dollars)
7. Five largest customers as percentage of revenues
8. Days spent visiting customers
9. Support expense per customer
10. Image-enhancing customer as percentage of revenues

Measures under Pressure
90
APPENDIX 3: Skandia Navigator measurements
(Adopted from Olve, Roy and Wetter, 1999a)
Financial focus:
• Return on capital employed (%)
• Operating result (SEK 1 million)
• Value added/employee (SEK 000s)
• Change in company’s IT literacy (%)
Customer focus:
• Number of contracts
• Savings/contract (SEK 000s)
• Surrender ratio (%)
• Point of sale
Renewal & Development Focus:
• Share of gross premiums written
from new launches (%)
• Increase in net premiums written (%)
• Development/ administration expense (%)
• Share of staff under 40 years
Process Focus:
• Number of contracts/employee
• Administration expenses/gross premiums written (%)
• IT /administration expense (%)
Human Focus:
• Number of employees, full-time
• Number of managers
• Of whom women
• Training expense/employee (SEK 000s)

Measures under Pressure
91
APPENDIX 4: Interview Guide/Discussion topics
Consulting Perspective/view
• We have looked into types of measurements that can provide a strong
connection between strategic planning and performance monitoring. As far
as we are concerned there is a need to extend the scope of performance
measurement, vertically, both upward (to meet capital market
requirements) and downward as well as horizontally (to design measures
that support process orientation). Comments!
• As we have acknowledged, the most important measures used are measures
that reflect profitability, cost effectiveness and distribution of sales.
However, we question which part the interaction between customers and
employees takes and how culture and values could be monitored. It seems
like that the BSC neglects measures of this type. How important is the core
customer?
• What we have seen is that companies still focus on internal processes. How
can the balanced scorecard become more customer and market oriented
(how markets and competitors develop)?
• As we have seen both in literature and practice, the BSC is always used for
specific purposes in each company (for example employee motivation, a
tool for re-structuring processes, management information or maybe
shareholder value). We believe that the BSC is not the general
measurement tool to make sure that companies can adopt quickly to
changing needs and measure accurate data. For us, the purpose of the BSC
gets set before and then the desired outcomes get measured. So the original
statement: "You get what you measure" should be understood as: "Decide
what you want and measure it, so it can be done!" Comments!

Measures under Pressure
92
Company Perspective/view
• For you as a Controller, what should a sophisticated performance
measurement system provide you with?
• We don't believe that intellectual capital is responsible for
Skandia AFS's /KappAhl's entire success rather than a clever strategy
implementation in collaboration with a committed management
Comments!
• From your point of view, what types of variables/factors have been most
applicable to monitor Skandia AFS's/KappAhl's strategy implementation?
• As we see it, there might be a long-term risk to use too fragmented
measures, because they fail to benchmark performance between companies
and also lack the focus towards a common vision. Comments!
• How big is the impact of intangible measurements for management control
today? How has the role of financial measures changed?
• Is it the vital types of measurements within the Navigator that create
success or is it the concept as such that matters?
• How do you measure customer satisfaction and customer value?
• What are the most important areas to monitor in order to deliver sustained
future success?
• What are the alternatives to measurement?
• What does the statement "What you measure is what you get" mean to
you?

Measures under Pressure
93
Academic Perspective/view
• Why do firms exist and who are the interest groups that are most important
for service industry?
• How are performance measurement systems conducted and who’s
responsibility is it?
• How does financial accounting and measurements correlate?
• What kinds of strategic control systems do exist and which are the most
applicable and most used in practice?
• What are the alternatives to performance measurements?
• How are strategy and performance measurements connected?
• What kinds of service strategies do exist, are most applicable and are most
used in practice?
• What is value and how can it be measured?
• What is the importance of the customer and shareholders?
• What is the difference between external and internal control / measurement
systems?
• To what extent are strategies flexible to changing business environments
and how does that align with measurement and control mechanisms?
• What is the purpose of performance measurements and the BSC?
• Why is the BSC so popular?
• What other performance measurement systems do exist and what is the
most applicable for service industry?
• What is the difference between service industry and manufactures?
• How do consultants and academics treat knowledge and what are the major
differences?
• Which role does performance measurement take within the organisation?

Measures under Pressure
94
Bibliography Abernathy, D.J. (1999) A Chat with Chris Argyris. Training & Development.
May, vol.53, no.5.
Adams, C. and Roberts, P. (1993) You Are What You Measure.
Manufacturing Europe 1993, Sterling Publications Ltd, p. 504 – 507.
Albrecht, K. and Zemke, R. (1986) Service America, Dow Jones-Irwin.
Anderson, E.W., Fornell, C. and Lehmann, D.R. (1994) Customer
Satisfaction, Market Share, and Profitability: Findings From Sweden. Journal
of Marketing, July, vol.58, p. 53 – 66.
Argyris, C. (1991) Teaching Smart People How to Learn. Harvard Business
Review, May-June, p. 99 – 108.
Argyris, C. (1998) Empowerment: The Emperor’s New Cloth. Harvard
Business Review, May-June, p. 98 – 108.
Armstrong, M. and Baron, A. (1998) Performance Management – The New
Realities. Institute of Personnel and Development, London.
Atkinson, A.A., Waterhouse, J.H. and Wells, R.B. (1997) A Stakeholder
Approach to Strategic Performance Measurement. Sloan Management Review,
Spring, p. 25 – 37.
Axson, D.A.J. (1999) The fastest route to right answers: refining approaches
for better decision making through performance reporting. Strategy and
Leadership, May-June, vol.27, no.3.
Barchan, M. (1999) Measuring success in a changing environment. Stratgey &
Leadership, May-June, vol.27, no.3.

Measures under Pressure
95
Bounds, G., Yorks, L., Adams, M. and Ranney, G, (1994) Beyond Total
Quality Management. McGraw-Bass, New York.
Boyett, J.H. and Conn, H.P. (1995) Maximum Performance Management.
Glenbridge Publishing, Oxford.
Bredrup, H. (1995) Background for performance management in A. Rolstadås
“Performance Management – A Business Process Benchmarking Approach”
London: Chapman & Hall.
Bromwich, M. and Bhimani, A. (1994) Management Accounting: pathways to
progress, CIMA. London.
Bruns, W.J.Jr. (1992) Performance Measurement, Evaluation, and Incentives,
Harvard Business School Press, Boston, Mass.
Buren, M.E. van (1999) A Yardstick for Knowledge Management, Training &
Development, May, Vol.53, No.5.
Byars, L.L. (1987) Strategic Management-planning and implementation,
Harper & Row publishers, New York.
Carlzon, J. (1987) Moments of Truth, Ballinger, Cambridge, Mass.
Collins, J. (1999) Turning Goals into Results: The Power of Catalytic
Mechanisms, Harvard Business Review, Jul-Aug, p. 71 – 82.
Dutka, A. (1995) AMA Handbook for Customer satisfaction, American
Marketing Association.
Easterby-Smith, M., Thorpe, R. and Lowe, A. (1991) Management Research –
An Introduction, SAGE Publications, London.

Measures under Pressure
96
Fitzgerald, L., Johnston, R., Brignall, S., Silvestro, R. and Voss, C. (1991),
Performance measurement in service sector, CIMA, UK.
Frost, B. (1999) Performance metrics: the new strategic discipline, Strategy &
Leadership, May-June, vol.27, no.3.
Fulmer, R.M., Gibs, P. and Keys, J.B. (1998) The second generation learning
organisations: new tools for sustaining competitive advantage, Organizational
Dynamics, Autumn, vol.27, no.2.
Fulmer, R.M. and Keys, J.B. (1998) A conversation with Peter Senge: new
developments in organizational learning, Organizational Dynamics, Autumn,
vol.27, no.2.
Giertz, E. (1999) Measuring Success: Operations Development in Practice,
Celemi.
Gummesson, E. (1993) Quality management in service organisations, ISQA.
Stockholm.
Grönroos, C. (1990) Service Management, ISL förlaget. Göteborg.
Hope, T. (1998) Address to the Compensation Forum, London.
Ittner, C.D. and Larcker, D.F. (1998) Innovations in Performance
measurement: Trends and Research Implications, Journal of Management
Accounting Research, p. 205 – 238.
Johnson, H.T. and Kaplan, R.S. (1987) The Rise and Fall of Management
Accounting, Management Accounting, Jan, p.5 – 12.
Judson, A.S. (1990) Making strategy happen – Transforming plans into
reality, Basil Blackwell, London.

Measures under Pressure
97
Kald, M. & Nilsson, F. (1999) Performance measurement at Nordic
companies, Linköping University of Technology.
Kane, J.S. (1996) The conceptualisation and representation of total
performance effectiveness, Human Resource Management Review, Summer,
p. 123 – 145.
Kaplan, R.S. and Norton, D.P. (1992) The Balanced Scorecard – Measures
That Drive Performance, Harvard Business Review, Jan-Feb, p. 71-79.
Kaplan, R.S. and Norton, D.P. (1993) Putting the Balanced Scorecard to
Work, Harvard Business Review, Sep-Oct, p. 134 – 147.
Kaplan, R.S. and Norton, D.P. (1996a) The Balanced Scorecard, Harvard
Business School Press, Boston, Mass.
Kaplan, R.S. and Norton, D.P. (1996b) Using the Balanced Scorecard as a
Strategic Management System, Harvard Business Review, Jan-Feb, p. 75 – 85.
Kaplan, R.S. and Norton, D.P. (1996c) Strategic Learning and the Balanced
Scorecard, Strategy and Leadership, Sep-Oct, p. 17 – 24.
Kaplan, R.S. and Norton, D.P. (1996d) Linking the Balanced Scorecard to
Strategy, California Management Review, Fall, p. 53 – 79.
Kaplan, R.S. and Norton, D.P. (1996e) Knowing the Score, Financial
Executive, Nov-Dec, p. 30 – 33.
Kaplan, R.S. and Norton, D.P. (1999) Från strategi till handling- The balanced
Scorecard, ISL förlaget. Göteborg.
Kim, W.C. and Mauborgne, R. (1999) Creating New Market Space, Harvard
Business Review, Jan-Feb, p. 83 – 93.

Measures under Pressure
98
Kotter, J.P. and Heskett, J.L. (1992) Corporate Culture and Performance, New
York: Free Press.
Laitinen, E.K. (1996) Framework for Small Business performance
Measurement, University of Vaasa.
Levinson, H. (1970) Management by whose objectives?, Harvard Business
Review, Jul-Aug, p. 125 – 134.
Levitt, T. (1972) Production line approach to service, Harvard Business
Review, Sep-Oct.
Lindvall, J (1999) Låt inte styrkortet bli något vid sidan av, Dagens Industri, 21 may, p.4
Lynch, R.L. and Cross (1991) Measure Up – How to measure corporate
performance, Blackwell Business, Cambridge.
Lynch, R.L. and Cross (1995) Measure Up – How to measure corporate
performance, 2nd Edition, Blackwell Business, Cambridge.
Looy, B. van, Dierdonck, R. van and Gemmel, P. (1998) Service Management
– An Integrated Approach, Financial Times Pitman Publishing, London.
Lovelock, C.H. (1992) Managing Services- marketing, operations and human
resources , Prentice Hall. New Jersey.
Mabey, C. and Salaman, G. (1995) Strategic Human Resource Management,
London: Routledge.
Machiavelli, N. (16th century), “The Prince”
Maisel, L.S. (1992) “Performance Measurement: The Balanced Scorecard
Approach,” Journal of Cost Management, Summer, p. 47 – 52.

Measures under Pressure
99
McNair, C.J., Lynch, R.L. and Cross, K.F. (1990) Do Financial and Non-
financial Performance Measures Have to Agree? Management Accounting,
November, p. 28 – 35.
Merton, R.K., Fiske, M. and Kendall, P.L. (1990) The focused interview: A
manual of problems and procedures,2 nd Edition, New York: Free Press.
Normann, R. (1992) Service Management, Liber ekonomi. Malmö.
Nilsson, F and Trossmark, P (1999) Styrkortets potential utnyttjas allför sällan, Dagens Idustri, 15 april p.3
Normann, R. and Ramirez, R. (1994) Designing Interactive Strategy – from
value chain to value constellation, John Wiley & Sons.
Oakland, J.S. (1993) Total Quality Management: The route to improved
performance, 2nd Edition, Oxford, Butterworth – Heinemann.
Olve, N.G., Roy, J. and Wetter, M. (1999a) Performance Drivers – A Practical
Guide to Using the Balanced Scorecard, John Wiley & Sons.
Olve, N.G., Roy, J. and Wetter, M. (1999b) Balanced Scorecard- i svensk
praktik, Liber AB, Malmö.
Pearce, J.A. and Robinson, R.B. (1997) Strategic Management-formulation,
implementation and control , Irwin, Boston.
Pine, B.J. II and Gilmore, J.H. (1998) Welcome to the Experience Economy,
Harvard Business Review, Jul-Aug, p.97 – 105.
Reichheld, F.F. (1996) Learning from Customer defections, Harvard Business
Review, Mar-Apr, p. 56 -69

Measures under Pressure
100
Richman, T. (1996) Service industries - Why customers leave, Harvard
Business Review, Jan-Feb,
Risher, R. and Fay, C. (1995) The Performance Imperative, San Francisco,
Calif., Jossey Bass.
Rolstadås, A. (1995) Performance Management – A Business Process
Benchmarking Approach, London: Chapman & Hall.
Schneider, B. and Rentsch, J. (1987) The management of climate and culture:
A future perspective, Lexington books, Lexington, Mass.
Senge, P. (1990) The Fifth Discipline: The Art and Practice of the Learning
Organisation, Doubleday.
Smith, M. (1994) New tools for management accounting – Putting activity
based costing and non-financial indicators to work, Pitman Publishing,
London.
Steward, T.A. (1997) Intellectual capital – The New Wealth of Organisations,
Currency Doubleday, New York.
Thor, C.G. (1995) Using Measures to reinforce strategy, in Risher, R. and Fay,
C. (1995); “The Performance Imperative,” San Francisco, Calif., Jossey Bass.
Vliet, A. van de (1997) The new balancing act,Management Today, p. 78 – 80.
Walters, M. (1995) The Performance Management Handbook, Institute of
Personnel and Development, London.
Ward, p. (1997) 360-Degree Feedback, London, Institute of Personnel and
Development, London.

Measures under Pressure
101
Williams, R.S. (1998) Performance Management – Perspectives on Employee
Performance, International Thompson Business Press.
Whittington, R. (1993) What is strategy and does it matter? Routledge,
London.
Yin, R.K. (1994) Case Study Research – Design and Methods, 2nd Edition,
SAGE Publications, London.
Interviews and meetings
Peter Karlsson KappAhl Controller 02 sep 1999 Göteborg
Hakan Westin KappAhl Fin.Director 16 dec 1999 Göteborg
Marianne Ax Skandia Controller § ¶
Lotta Leuckfeld Skandia Controller §
Leif Edvinsson Skandia Director 12 apr 1999 *
Ingemar Claesson HGUS Cons./Lect. ¤
Olov Olson HGUS Professor 03 sep 1999 Göteborg
Björn Alarik HGUS Lecturer 01 sep 1999 Göteborg
Christian Ax HGUS Ass. Prof 02 sep 1999 Göteborg
Torbjörn Stjernberg HGUS Professor 02 sep 1999 Göteborg
Axel Targama HGUS Assoc. Prof. 03 sep 1999 Göteborg
Johan Åkesson HGUS Ass. Master 03 sep 1999 Göteborg
Bo Dahlbom GU Professor 20 sep 1999 Göteborg
Nils-Göran Olve Cepro Prof/Cons §
Martin Sande Sande Cons. Consultant 26 may1999 Göteborg
Sven-Martin Åkesson KPMG Consultant 13 sep 1999 Göteborg
_____________________________
* seminar § e-mail ¶ telephone ¤ tutor