Embed Size (px)
Citation preview
ContentExecutive Summary 2Agriculture 5Industry 7Monetary and Credit Developments 10Capital Market 15Public Finance 15Exports 16Imports 17Remittances 18Foreign Aid 19Foreign Direct Investment (FDI) 19Balance of Payment 20Exchange Rate 21Foreign Exchange Reserves 22Overseas Employment Situation 22Price Situation 23Chamber’s Projection on Some Selected Economic Indicators 23Concluding Observations 24
2 QUARTERLY REVIEW
General
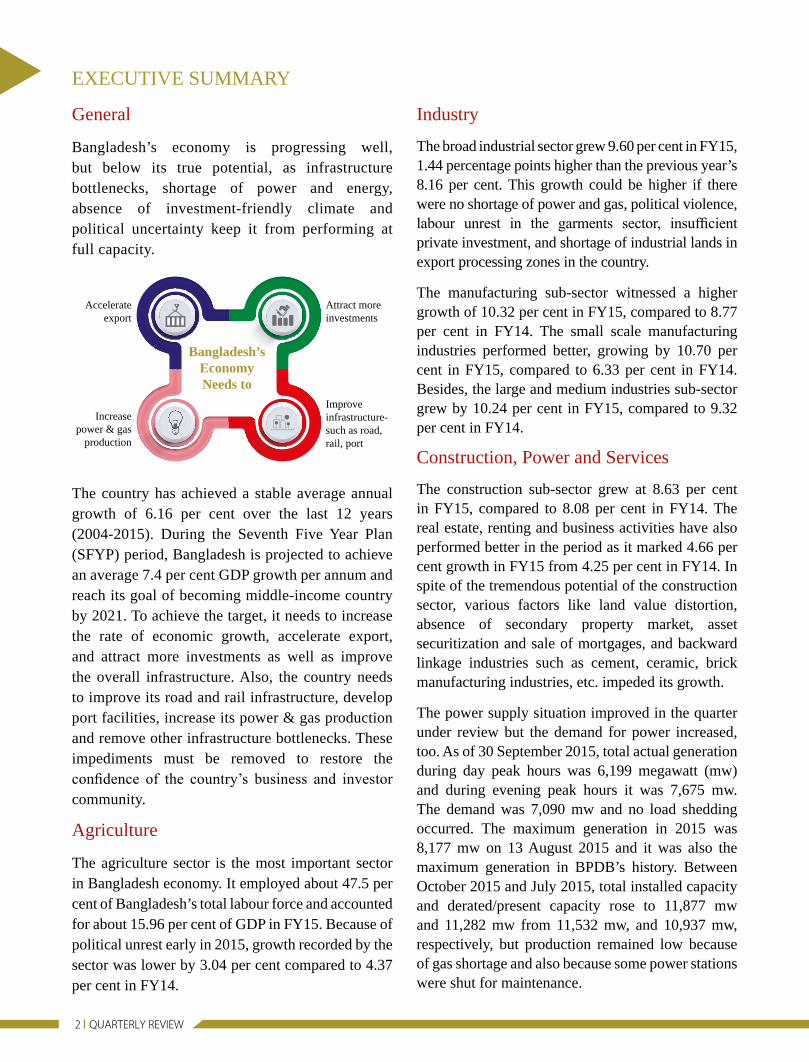
Bangladesh’s economy is progressing well, but below its true potential, as infrastructure bottlenecks, shortage of power and energy, absence of investment-friendly climate and political uncertainty keep it from performing at full capacity.
The country has achieved a stable average annual growth of 6.16 per cent over the last 12 years (2004-2015). During the Seventh Five Year Plan (SFYP) period, Bangladesh is projected to achieve an average 7.4 per cent GDP growth per annum and reach its goal of becoming middle-income country by 2021. To achieve the target, it needs to increase the rate of economic growth, accelerate export, and attract more investments as well as improve the overall infrastructure. Also, the country needs to improve its road and rail infrastructure, develop port facilities, increase its power & gas production and remove other infrastructure bottlenecks. These impediments must be removed to restore the confidence of the country’s business and investor community.
Agriculture
The agriculture sector is the most important sector in Bangladesh economy. It employed about 47.5 per cent of Bangladesh’s total labour force and accounted for about 15.96 per cent of GDP in FY15. Because of political unrest early in 2015, growth recorded by the sector was lower by 3.04 per cent compared to 4.37 per cent in FY14.
Industry
The broad industrial sector grew 9.60 per cent in FY15, 1.44 percentage points higher than the previous year’s 8.16 per cent. This growth could be higher if there were no shortage of power and gas, political violence, labour unrest in the garments sector, insufficient private investment, and shortage of industrial lands in export processing zones in the country.
The manufacturing sub-sector witnessed a higher growth of 10.32 per cent in FY15, compared to 8.77 per cent in FY14. The small scale manufacturing industries performed better, growing by 10.70 per cent in FY15, compared to 6.33 per cent in FY14. Besides, the large and medium industries sub-sector grew by 10.24 per cent in FY15, compared to 9.32 per cent in FY14.
Construction, Power and Services
The construction sub-sector grew at 8.63 per cent in FY15, compared to 8.08 per cent in FY14. The real estate, renting and business activities have also performed better in the period as it marked 4.66 per cent growth in FY15 from 4.25 per cent in FY14. In spite of the tremendous potential of the construction sector, various factors like land value distortion, absence of secondary property market, asset securitization and sale of mortgages, and backward linkage industries such as cement, ceramic, brick manufacturing industries, etc. impeded its growth.
The power supply situation improved in the quarter under review but the demand for power increased, too. As of 30 September 2015, total actual generation during day peak hours was 6,199 megawatt (mw) and during evening peak hours it was 7,675 mw. The demand was 7,090 mw and no load shedding occurred. The maximum generation in 2015 was 8,177 mw on 13 August 2015 and it was also the maximum generation in BPDB’s history. Between October 2015 and July 2015, total installed capacity and derated/present capacity rose to 11,877 mw and 11,282 mw from 11,532 mw, and 10,937 mw, respectively, but production remained low because of gas shortage and also because some power stations were shut for maintenance.
EXECUTIVE SUMMARY
Improveinfrastructure-such as road,rail, port
Increase power & gas
production
Accelerate export
Attract moreinvestments
Bangladesh’s Economy Needs to
JULY-SEPT. 2015 (Q1 FY16) Issue 01
In the quarter (Q1) under review, the disbursement of agricultural credit and non-farm rural credit by banks increased by 16.50 per cent from the corresponding period of the previous fiscal due mainly strong monitoring by the BB. The recovery, however, decreased by 4.33 per cent in Q1 of FY16 from the corresponding period of the previous fiscal year.
The capital market ended flat after a volatile session on 30 September 2015 as the investors were also eyeing the economic updates at the end of Q1 of FY16.
Public Finance
NBR tax revenue collection during July-September (Q1) of FY16 was Tk.30,928 crore, which was 9.59 per cent higher than the collection of Tk.28,221 crore during July-September of FY15, thanks to a boost in receipts in September 2015. NBR tax revenue collection in September 2015 stood at Tk.11,355 crore which was higher by Tk.1,828 crore or 19.19 per cent against the collection of Tk.9,527 crore during the previous month of the same fiscal but that value remained the same in the corresponding month of the previous fiscal.
The implementation of the Annual Development Programme (ADP) failed to pick pace in the first quarter of the current fiscal year (FY16). The implementation rate in July-September of FY16 was only 7 per cent, a record low in eight years mainly due to failure of ministries and divisions with higher allocation. The low implementation can be attributed to the lack of capacity and unfavourable weather, mainly heavy rain. The rate was 9 per cent in the corresponding period of the previous fiscal.
External Sector: Export, Import, Remittances, Foreign Aid, FDI and Exchange Rate
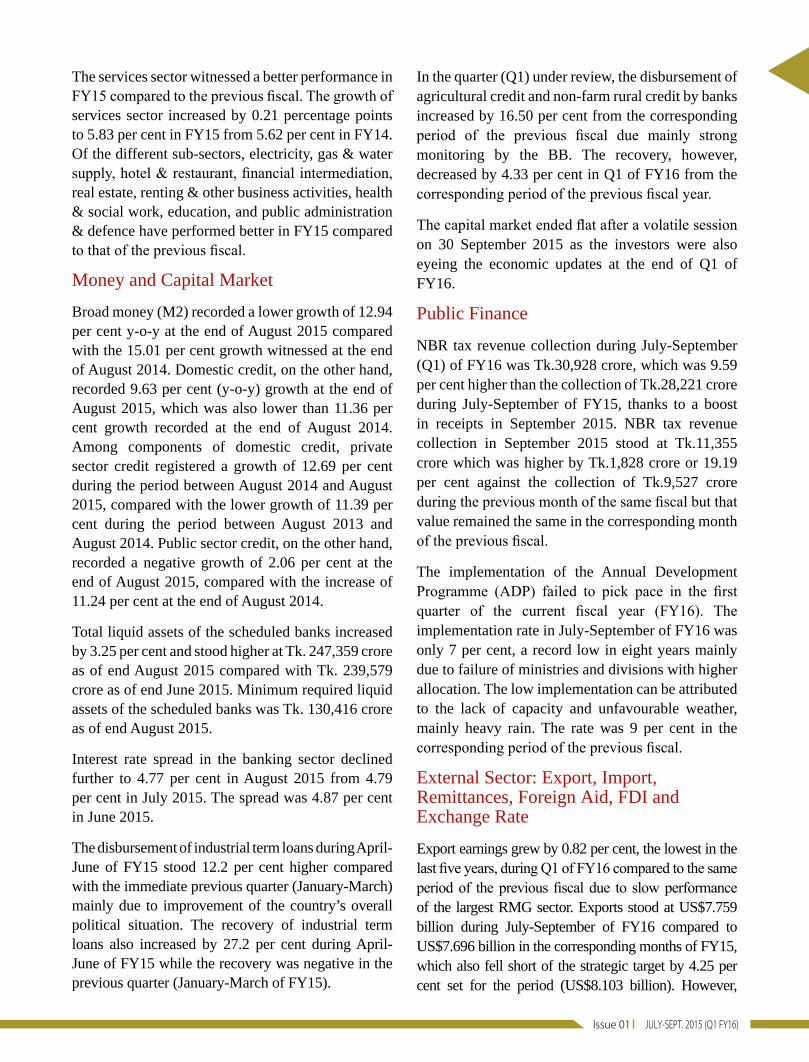
Export earnings grew by 0.82 per cent, the lowest in the last five years, during Q1 of FY16 compared to the same period of the previous fiscal due to slow performance of the largest RMG sector. Exports stood at US$7.759 billion during July-September of FY16 compared to US$7.696 billion in the corresponding months of FY15, which also fell short of the strategic target by 4.25 per cent set for the period (US$8.103 billion). However,
The services sector witnessed a better performance in FY15 compared to the previous fiscal. The growth of services sector increased by 0.21 percentage points to 5.83 per cent in FY15 from 5.62 per cent in FY14. Of the different sub-sectors, electricity, gas & water supply, hotel & restaurant, financial intermediation, real estate, renting & other business activities, health & social work, education, and public administration & defence have performed better in FY15 compared to that of the previous fiscal.
Money and Capital Market
Broad money (M2) recorded a lower growth of 12.94 per cent y-o-y at the end of August 2015 compared with the 15.01 per cent growth witnessed at the end of August 2014. Domestic credit, on the other hand, recorded 9.63 per cent (y-o-y) growth at the end of August 2015, which was also lower than 11.36 per cent growth recorded at the end of August 2014. Among components of domestic credit, private sector credit registered a growth of 12.69 per cent during the period between August 2014 and August 2015, compared with the lower growth of 11.39 per cent during the period between August 2013 and August 2014. Public sector credit, on the other hand, recorded a negative growth of 2.06 per cent at the end of August 2015, compared with the increase of 11.24 per cent at the end of August 2014.
Total liquid assets of the scheduled banks increased by 3.25 per cent and stood higher at Tk. 247,359 crore as of end August 2015 compared with Tk. 239,579 crore as of end June 2015. Minimum required liquid assets of the scheduled banks was Tk. 130,416 crore as of end August 2015.
Interest rate spread in the banking sector declined further to 4.77 per cent in August 2015 from 4.79 per cent in July 2015. The spread was 4.87 per cent in June 2015.
The disbursement of industrial term loans during April-June of FY15 stood 12.2 per cent higher compared with the immediate previous quarter (January-March) mainly due to improvement of the country’s overall political situation. The recovery of industrial term loans also increased by 27.2 per cent during April-June of FY15 while the recovery was negative in the previous quarter (January-March of FY15).
4 QUARTERLY REVIEW
export earnings in September 2015 witnessed a negative growth of 6.97 per cent to US$2.375 billion compared to US$2.553 billion in September 2014 which also below the strategic target (US$2.446 billion).
Import payments with cost and freight (C&F) during
July-August of FY16 stood at US$6,561 million, which was 2.99 per cent lower than that of the corresponding months of FY15. Import payments in August 2015 decreased by 2.79 per cent over the same month of 2014, but increased by 20.32 per cent over the previous month (July 2015) because of higher demand for most of the importable items.
Remittance inflow in the first quarter of the current financial year (FY16) dropped slightly by 1.97 per cent compared to the corresponding period of the last year despite a slight rise in inflow in the last two months. The country received US$3.931 billion during July-September of FY16 compared to US$4.010 billion during the same period of FY15. Month wise, the remittance inflow y-o-y increased slightly in August (1.79%) and September (0.15%) because of Eid-centric activities. But the inflow in July was much lower than the same month last year.
The disbursement of foreign aid during July-September of FY16 increased by 6.87 per cent to US$502.27 million from US$470 million in the corresponding period of the previous fiscal. On the other hand, the commitment of foreign aid dropped by 87.96 per cent to US$52.80 million in Q1 of FY16 compared to US$438.40 million in the corresponding period of the previous fiscal as the major development partners have not confirmed adequate loans during the period. Also delay in project approval and start-up delay for projects work
by the government agencies were the reasons behind the lower external fund commitment.
In July-August of FY16, the net foreign direct investment (FDI) increased by 11.27 per cent to US$316 million from US$284 million in the same period of FY15, although this investment is not enough for the country’s development. The investors are still to get back the confidence.
Trade deficit decreased by 40.59 per cent in the first two months of FY16 from a year earlier thanks to lower imports and higher exports. At the end of August 2015, the trade deficit stood at US$412 million. Imports decreased by 2.99 per cent in July-August of FY16, while exports grew by 4.53 per cent. The drop in petroleum prices in the international market lessened the import bills.
Between end-June and end-September of 2015, the external value of Taka remained the same in terms of US dollar, showing stability in the foreign exchange market. On the inter-bank market, the US dollar was quoted at Tk.77.8000. The foreign exchange reserve rose to US$26.379 billion on 30 September 2015 from US$26.175 billion at the end of August 2015.
Inflation
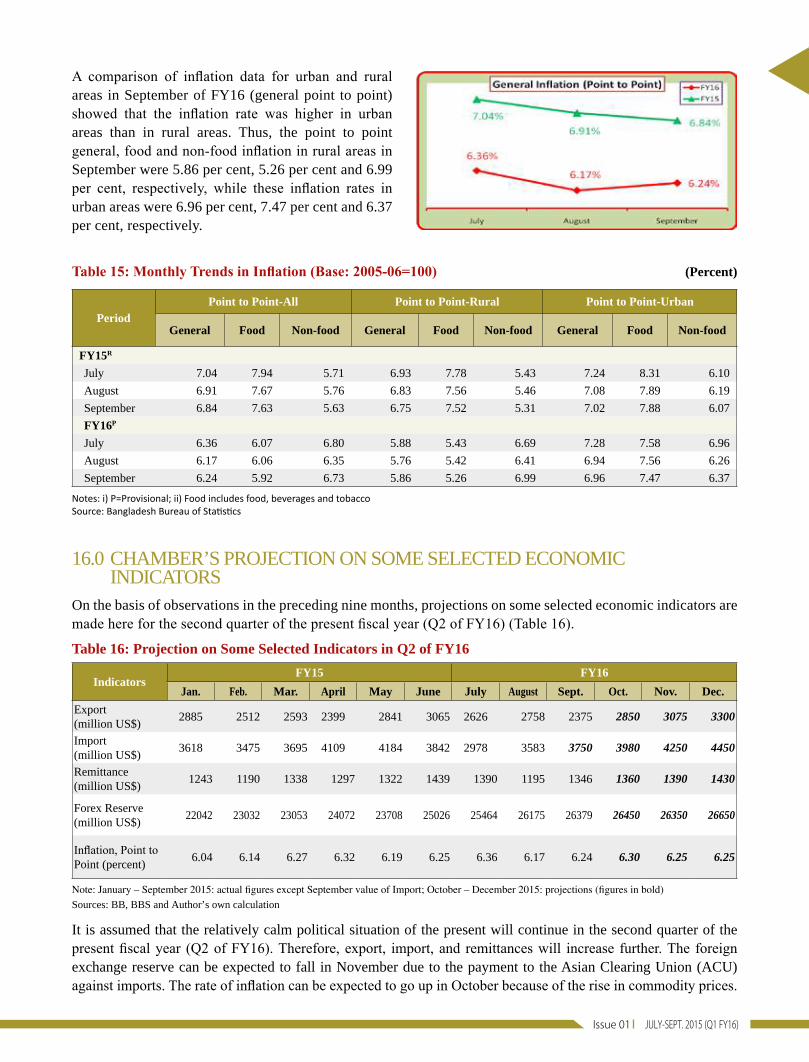
In September 2015, the general point to point inflation increased slightly by 0.07 percentage point to 6.24 per cent from 6.17 per cent in August 2015. Uptrend in prices of some non-food items on the domestic market mainly pushed up the inflation in September. A year back, in September 2014, the inflation was 6.84 per cent. The food inflation, however, fell to 5.92 per cent in September 2015 from 6.06 per cent a month ago. On the other hand, the non-food inflation increased by 0.38 percentage point to 6.73 per cent in September 2015 from 6.35 per cent in August 2015.
A comparison of inflation data for urban and rural areas in September of FY16 (general point to point) showed that the inflation rate was higher in urban areas than in rural areas. Thus, the point to point general, food and non-food inflation in rural areas in September were 5.86 per cent, 5.26 per cent and 6.99 per cent, respectively, while these rates in urban areas were 6.96 per cent, 7.47 per cent and 6.37 per cent, respectively.
July-Sep of FY16
Export earnings: Growth 0.82 %
Remittance inflow: Fell
1.92%
Foreign aid: Growth 6.87%
US$502.27
million
p
received US$3.931
billion
US$7.759 billion
JULY-SEPT. 2015 (Q1 FY16) Issue 01
1.0 AGRICULTUREData on agricultural production for the first quarter of the present fiscal (Q1 of FY16) is yet to be available because the harvesting of the three major crops – aman, aus and boro - will be spread over the coming months of the fiscal. However, due to political unrest early in 2015, the sector recorded a lower growth of 3.04 per cent in FY15 compared to 4.37 per cent in FY14. Given the government’s strong commitment to support the growth of agriculture with timely availability of inputs and finance, the sector is expected to perform well in the present fiscal.
Recently a group of Bangladeshi rice scientists have successfully completed lab trial of the famous ‘Golden Rice’, a genetically engineered type of rice that would contain biosynthesized beta-carotene, an antecedent of vitamin A. The scientists are now preparing to conduct field tests of the rice variety. Bangladesh Rice Research Institute (BRRI), according to the report, is taking their newly-cultured variety of the Golden Rice (dubbed ‘GR-2 E BRRI dhan29’) to limited field trials in the coming boro season this November before starting its production and marketing phases. The new variety that promises to have been endowed with Vitamin A has been engineered from three existing varieties: one variety of Bangladesh, one of IRRI and one of the Philippines. If the field trial of the variety turns out to be equally successful the scientific breakthrough may put Bangladesh on the threshold of starting a new agricultural revolution, especially for those rice-eaters who suffer from Vitamin A Deficiency.
1.1 Food Situation
Domestic Production
The target of domestic food grains (rice and wheat) production for FY16 was set by the Department of Agricultural Extension (DAE) at 36.425 million metric tons (mmt), which is 0.57 per cent higher than that of FY15 (36.220 mmt). Production targets for aman, aus, boro and wheat are 13.555 mmt, 2.475 mmt, 19.000 mmt, and 1.395 mmt, respectively. Farmers have already started harvesting early varieties of aman rice. It is worth noting that the actual production of food grains during FY15 stood at 36.056 mmt which exceeded the production in FY14 (35.731 mmt) by 0.91 per cent, but fell 0.45 per cent short of the FY15 target.
Food Grains Import
As of 1 October 2015, about 65.90 thousand metric tons (tmt) of rice was imported by the private sector. No rice was imported by the public sector. Over the same period last year, no rice was imported by the public sector but 9.50 tmt of rice was imported by the private sector. During the fortnight ending 1 October 2015, a total of 163.54 tmt of wheat was imported by the public sector and 686.74 tmt by the private sector. Over the same period last year, a total of 68.52 tmt of wheat was imported by the public sector and 516.59 tmt by the private sector.
Domestic Procurement
To provide price incentive to farmers, government decided to procure at least 1,100 tmt of boro rice at Tk.32.00 per kg from the domestic market. The drive began on 1 May 2015. As of 1 October 2015, about 1,023.20 tmt of boro rice was procured and 1,036 tmt was contracted.
Public Distribution
The government has enhanced its efforts to ease the hardship of poor households by distributing subsidized grains through open market sale (OMS) and fair price card (FPC) channels. The target is to distribute a total of 2.78 mmt food grains this fiscal (FY16) as against the actual distribution of 1.84 mmt in FY15. Over the fortnight ending 1 October 2015, a total of 110.60 tmt food grains was distributed

6 QUARTERLY REVIEW
mainly through VGF (75.50 tmt), VGD (13.90 tmt), EP (5.90 tmt) and OP (1.40 tmt). As of that date, a total of 313.70 tmt had been distributed through PFDS, which is about 11.28 per cent of the yearly target. The OMS drive, which was resumed in small scale only in major metropolitan areas, continues, with rice being sold at Tk.24 per Kg and atta at Tk.22 per Kg.
Public Stock
According to the Directorate General of Food, the public food grains stock, as of 1 October 2015, stood at 1,588.69 tmt – 1,265.87 tmt for rice and 322.82 tmt for wheat.
Domestic Market Prices
In the fortnight ending 1 October 2015, the wholesale price of rice (Swarna) in Dhaka city markets increased by 1.8 per cent, to Tk.28.00 per Kg, while the retail price remained unchanged at Tk.31.00 per Kg. The wholesale and retail prices now are, respectively, 21.0 per cent and 13.9 per cent lower than a year ago. Over the same period, the wholesale and the retail prices of atta in Dhaka city markets remained unchanged at Tk.28.00 per Kg and Tk.21.70 per Kg, respectively. The wholesale and retail prices are, respectively, 14.0 per cent and 11.6 per cent lower now than a year ago.
International Market Prices
In the fortnight ending 2 October 2015, the prices of India 5% parboiled and Thai 5% parboiled rice declined by 5.0 per cent, and 1.4 per cent, to US$345 per mt, and US$345 per mt, respectively. But the prices of Vietnam 15% white and West Bengal coarse rice increased by 1.9 per cent, and 0.3 per cent, up to
US$330 per mt, and US$320 per mt, respectively. On the other hand, the price of Pakistan 5% parboiled rice remained unchanged at US$420 per mt. However, the wholesale price of rice in Dhaka city stood at US$353 per mt (increased by 1.7%) on the same date. In the fortnight ending 2 October 2015, the prices of US Soft Red Winter (SRW), Russia, and Ukraine wheat increased by 0.5 per cent, 3.9 per cent, and 2.2 per cent, up to US$187 per mt, US$188 per mt, and US$187 per mt, respectively. On the same date, Dhaka city wholesale wheat price stood at US$334 per mt (increased by 2.0%).
1.2 Fisheries, Livestock and Poultry
According to the provisional estimates of BBS, fisheries and animal farming (livestock and poultry) sub-sectors contributed around 5.42 per cent to the GDP in FY15, of which the fish sector contributed around 3.69 per cent and the animal farming sector contributed 1.73 per cent. Nearly 17.1 million people are involved in the fish sector, while the animal farming sector has created job opportunities for around 6.5 million people.
Country’s fish production has been increasing to keep up with the growing demand at home and abroad for around a decade or so. According to the Department of Fisheries (DoF), in FY15 and FY14, the country produced 3.55 million tons and 3.45 million tons of fish, respectively. Production has increased though it suffered in the first few months of 2015 as the political unrest prevented sales in the local markets and also obstructed export. For gearing up the production of fish, the government has set up 120 hatcheries in different parts of the country to provide training to the people and hatchery owners.
JULY-SEPT. 2015 (Q1 FY16) Issue 01
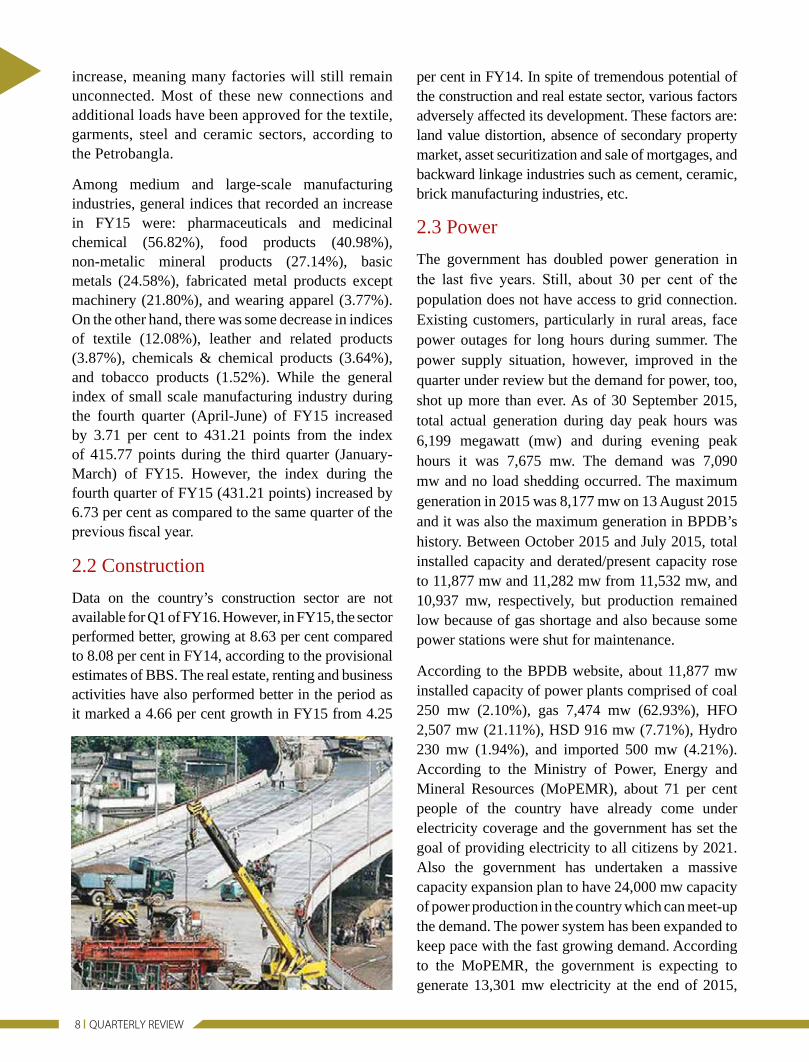
2.1 Manufacturing Industries
The manufacturing sub-sector witnessed a higher growth of 10.32 per cent in FY15, compared to 8.77 per cent in FY14. The small scale manufacturing industries performed better, growing by 10.70 per cent in FY15, compared to 6.33 per cent in FY14. Besides the large and medium industries sub-sector grew by 10.24 per cent in FY15, compared to 9.32 per cent in FY14.
Data on manufacturing industries are available up to June 2015. During July-June of FY15, the general index (Base: 2005-06=100) of industrial production of medium and large scale manufacturing industries registered an increase by 13.43 per cent to 239.67 points compared to 211.29 points over the corresponding period of FY14. According to industry insiders, performance of industrial activity is not expected level due to mainly shortage of power and gas and also political uncertainty. The government had stopped giving gas connections to industries in July 2009. Recently the government has decided to provide new gas connections and additional load to over 354 industrial units which is a long time demand for business persons and investors, who put their investment plans on hold for this. The suspension has not only piled up applications, but also hurt banks and entrepreneurs, who invested their money in setting up factories and were forced to run the plants on costly diesel generators in the absence of gas connections. Over 2,000 applications are now pending with distribution companies for new gas connections and load
The government also set a target to produce 4.52 million tons of fish by FY21. Proper utilization of the existing water bodies using the latest technologies could boost fish production.
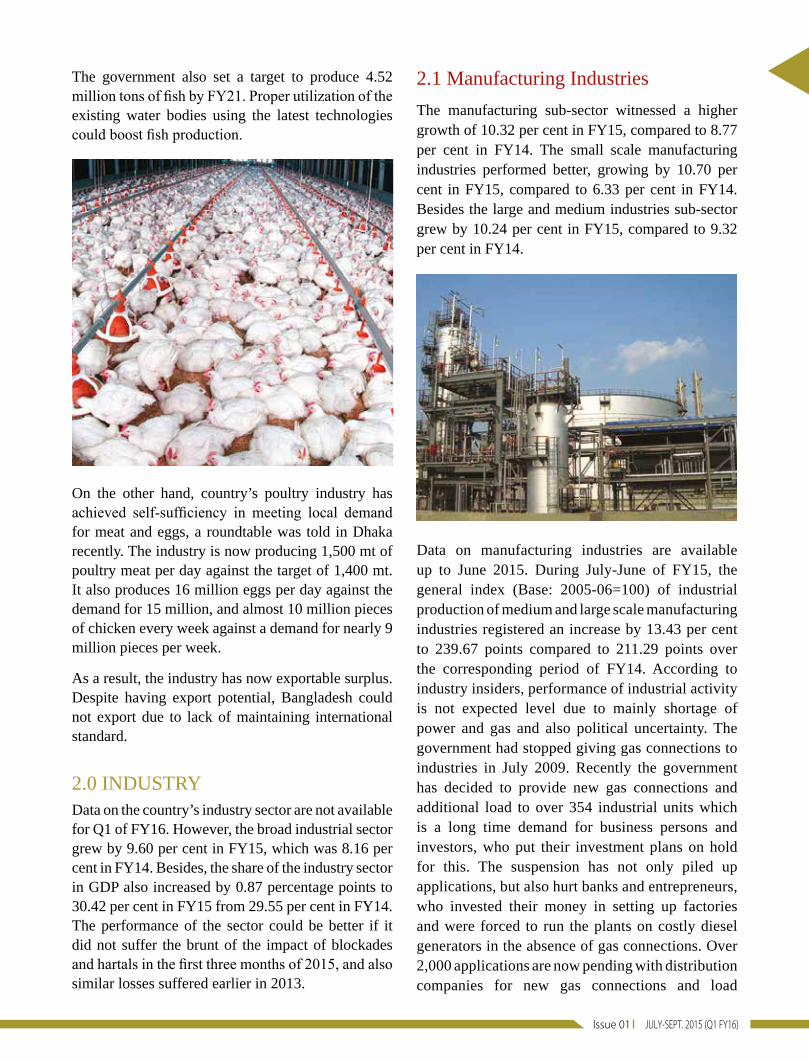
On the other hand, country’s poultry industry has achieved self-sufficiency in meeting local demand for meat and eggs, a roundtable was told in Dhaka recently. The industry is now producing 1,500 mt of poultry meat per day against the target of 1,400 mt. It also produces 16 million eggs per day against the demand for 15 million, and almost 10 million pieces of chicken every week against a demand for nearly 9 million pieces per week.
As a result, the industry has now exportable surplus. Despite having export potential, Bangladesh could not export due to lack of maintaining international standard.
2.0 INDUSTRYData on the country’s industry sector are not available for Q1 of FY16. However, the broad industrial sector grew by 9.60 per cent in FY15, which was 8.16 per cent in FY14. Besides, the share of the industry sector in GDP also increased by 0.87 percentage points to 30.42 per cent in FY15 from 29.55 per cent in FY14. The performance of the sector could be better if it did not suffer the brunt of the impact of blockades and hartals in the first three months of 2015, and also similar losses suffered earlier in 2013.
8 QUARTERLY REVIEW
per cent in FY14. In spite of tremendous potential of the construction and real estate sector, various factors adversely affected its development. These factors are: land value distortion, absence of secondary property market, asset securitization and sale of mortgages, and backward linkage industries such as cement, ceramic, brick manufacturing industries, etc.
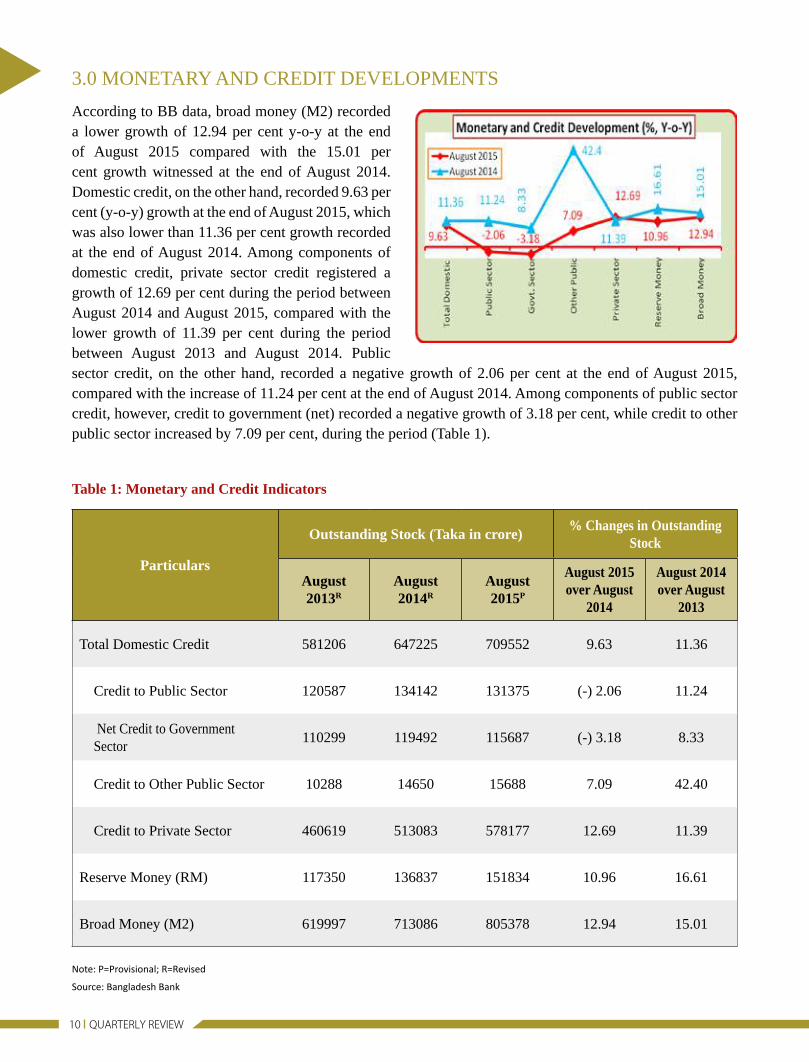
2.3 Power
The government has doubled power generation in the last five years. Still, about 30 per cent of the population does not have access to grid connection. Existing customers, particularly in rural areas, face power outages for long hours during summer. The power supply situation, however, improved in the quarter under review but the demand for power, too, shot up more than ever. As of 30 September 2015, total actual generation during day peak hours was 6,199 megawatt (mw) and during evening peak hours it was 7,675 mw. The demand was 7,090 mw and no load shedding occurred. The maximum generation in 2015 was 8,177 mw on 13 August 2015 and it was also the maximum generation in BPDB’s history. Between October 2015 and July 2015, total installed capacity and derated/present capacity rose to 11,877 mw and 11,282 mw from 11,532 mw, and 10,937 mw, respectively, but production remained low because of gas shortage and also because some power stations were shut for maintenance.
According to the BPDB website, about 11,877 mw installed capacity of power plants comprised of coal 250 mw (2.10%), gas 7,474 mw (62.93%), HFO 2,507 mw (21.11%), HSD 916 mw (7.71%), Hydro 230 mw (1.94%), and imported 500 mw (4.21%). According to the Ministry of Power, Energy and Mineral Resources (MoPEMR), about 71 per cent people of the country have already come under electricity coverage and the government has set the goal of providing electricity to all citizens by 2021. Also the government has undertaken a massive capacity expansion plan to have 24,000 mw capacity of power production in the country which can meet-up the demand. The power system has been expanded to keep pace with the fast growing demand. According to the MoPEMR, the government is expecting to generate 13,301 mw electricity at the end of 2015,
increase, meaning many factories will still remain unconnected. Most of these new connections and additional loads have been approved for the textile, garments, steel and ceramic sectors, according to the Petrobangla.
Among medium and large-scale manufacturing industries, general indices that recorded an increase in FY15 were: pharmaceuticals and medicinal chemical (56.82%), food products (40.98%), non-metalic mineral products (27.14%), basic metals (24.58%), fabricated metal products except machinery (21.80%), and wearing apparel (3.77%). On the other hand, there was some decrease in indices of textile (12.08%), leather and related products (3.87%), chemicals & chemical products (3.64%), and tobacco products (1.52%). While the general index of small scale manufacturing industry during the fourth quarter (April-June) of FY15 increased by 3.71 per cent to 431.21 points from the index of 415.77 points during the third quarter (January-March) of FY15. However, the index during the fourth quarter of FY15 (431.21 points) increased by 6.73 per cent as compared to the same quarter of the previous fiscal year.
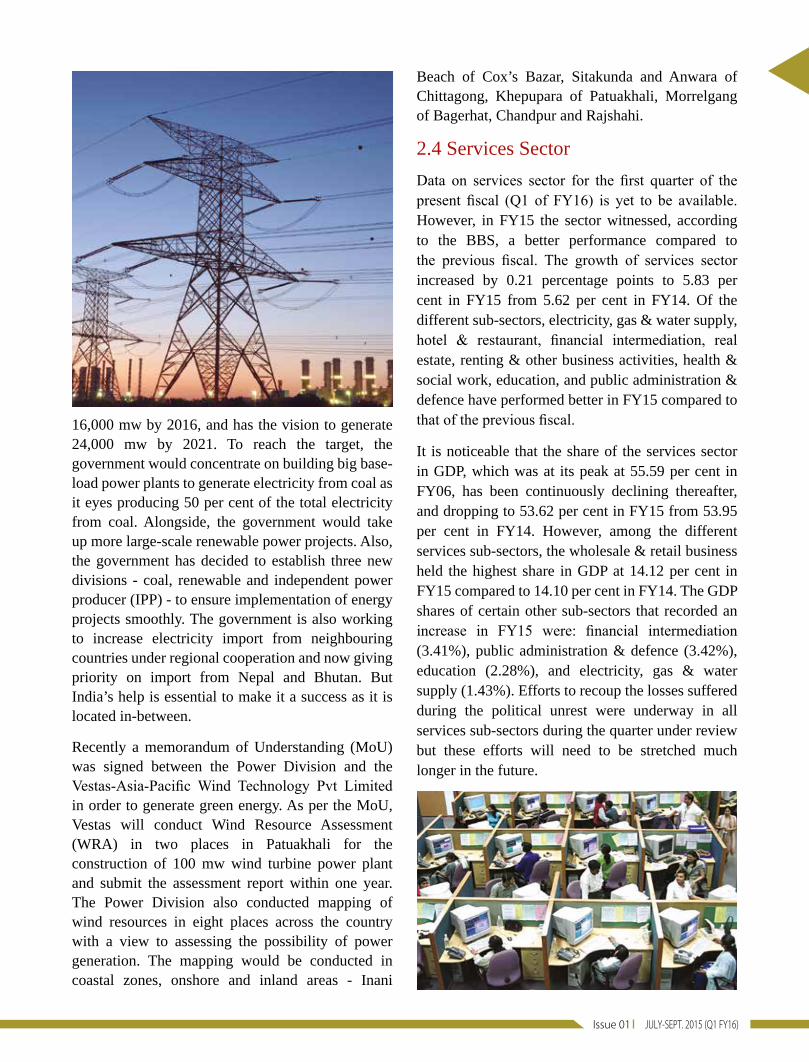
2.2 Construction
Data on the country’s construction sector are not available for Q1 of FY16. However, in FY15, the sector performed better, growing at 8.63 per cent compared to 8.08 per cent in FY14, according to the provisional estimates of BBS. The real estate, renting and business activities have also performed better in the period as it marked a 4.66 per cent growth in FY15 from 4.25
JULY-SEPT. 2015 (Q1 FY16) Issue 01
16,000 mw by 2016, and has the vision to generate 24,000 mw by 2021. To reach the target, the government would concentrate on building big base-load power plants to generate electricity from coal as it eyes producing 50 per cent of the total electricity from coal. Alongside, the government would take up more large-scale renewable power projects. Also, the government has decided to establish three new divisions - coal, renewable and independent power producer (IPP) - to ensure implementation of energy projects smoothly. The government is also working to increase electricity import from neighbouring countries under regional cooperation and now giving priority on import from Nepal and Bhutan. But India’s help is essential to make it a success as it is located in-between.
Recently a memorandum of Understanding (MoU) was signed between the Power Division and the Vestas-Asia-Pacific Wind Technology Pvt Limited in order to generate green energy. As per the MoU, Vestas will conduct Wind Resource Assessment (WRA) in two places in Patuakhali for the construction of 100 mw wind turbine power plant and submit the assessment report within one year. The Power Division also conducted mapping of wind resources in eight places across the country with a view to assessing the possibility of power generation. The mapping would be conducted in coastal zones, onshore and inland areas - Inani
Beach of Cox’s Bazar, Sitakunda and Anwara of Chittagong, Khepupara of Patuakhali, Morrelgang of Bagerhat, Chandpur and Rajshahi.
2.4 Services Sector
Data on services sector for the first quarter of the present fiscal (Q1 of FY16) is yet to be available. However, in FY15 the sector witnessed, according to the BBS, a better performance compared to the previous fiscal. The growth of services sector increased by 0.21 percentage points to 5.83 per cent in FY15 from 5.62 per cent in FY14. Of the different sub-sectors, electricity, gas & water supply, hotel & restaurant, financial intermediation, real estate, renting & other business activities, health & social work, education, and public administration & defence have performed better in FY15 compared to that of the previous fiscal.
It is noticeable that the share of the services sector in GDP, which was at its peak at 55.59 per cent in FY06, has been continuously declining thereafter, and dropping to 53.62 per cent in FY15 from 53.95 per cent in FY14. However, among the different services sub-sectors, the wholesale & retail business held the highest share in GDP at 14.12 per cent in FY15 compared to 14.10 per cent in FY14. The GDP shares of certain other sub-sectors that recorded an increase in FY15 were: financial intermediation (3.41%), public administration & defence (3.42%), education (2.28%), and electricity, gas & water supply (1.43%). Efforts to recoup the losses suffered during the political unrest were underway in all services sub-sectors during the quarter under review but these efforts will need to be stretched much longer in the future.
10 QUARTERLY REVIEW
3.0 MONETARY AND CREDIT DEVELOPMENTS
According to BB data, broad money (M2) recorded a lower growth of 12.94 per cent y-o-y at the end of August 2015 compared with the 15.01 per cent growth witnessed at the end of August 2014. Domestic credit, on the other hand, recorded 9.63 per cent (y-o-y) growth at the end of August 2015, which was also lower than 11.36 per cent growth recorded at the end of August 2014. Among components of domestic credit, private sector credit registered a growth of 12.69 per cent during the period between August 2014 and August 2015, compared with the lower growth of 11.39 per cent during the period between August 2013 and August 2014. Public sector credit, on the other hand, recorded a negative growth of 2.06 per cent at the end of August 2015, compared with the increase of 11.24 per cent at the end of August 2014. Among components of public sector credit, however, credit to government (net) recorded a negative growth of 3.18 per cent, while credit to other public sector increased by 7.09 per cent, during the period (Table 1).
Table 1: Monetary and Credit Indicators
Particulars
Outstanding Stock (Taka in crore)% Changes in Outstanding
Stock
August2013R
August2014R
August2015P
August 2015 over August
2014
August 2014 over August
2013
Total Domestic Credit 581206 647225 709552 9.63 11.36
Credit to Public Sector 120587 134142 131375 (-) 2.06 11.24
Net Credit to Government Sector
110299 119492 115687 (-) 3.18 8.33
Credit to Other Public Sector 10288 14650 15688 7.09 42.40
Credit to Private Sector 460619 513083 578177 12.69 11.39
Reserve Money (RM) 117350 136837 151834 10.96 16.61
Broad Money (M2) 619997 713086 805378 12.94 15.01
Note: P=Provisional; R=Revised
Source: Bangladesh Bank
JULY-SEPT. 2015 (Q1 FY16) Issue 01
Table 2: Liquidity Position of Scheduled Banks (Taka in crore)
Bank Group
As of end June, 2015R As of end August, 2015P
Total liquid assetsTotal Liquid
Assets
Minimum Required
Liquid Assets
Excess Liquidity
1 2 3 4 5 (3-4)
State owned banks 90500 83788 39635 44153
Private banks (other than Islamic) 98086 109136 65328 43808
Private banks (Islamic) 28412 30705 17071 13634
Foreign banks 21032 22250 6961 15289
Specialized banks* 1549 1480 1421 59
Total 239579 247359 130416 116943
Notes: P=Provisional; R=Revised; *= SLR does not apply to Specialized banks (except BASIC Bank) as exempted by the government Source: Bangladesh Bank
Total liquid assets of the scheduled banks increased by 3.25 per cent and stood higher at Tk.247,359 crore as of end August 2015 compared with Tk.239,579
crore as of end June 2015. Minimum required liquid assets of the scheduled banks was Tk.130,416 crore as of end August 2015 (Table 2).
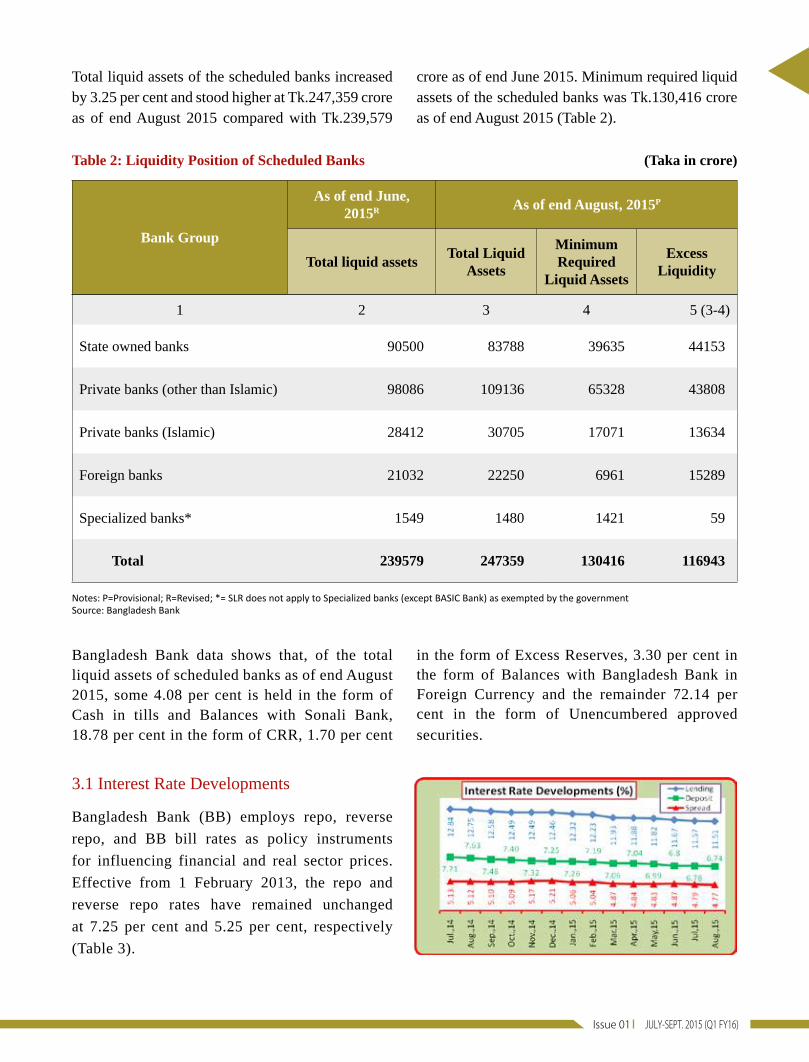
3.1 Interest Rate Developments
Bangladesh Bank (BB) employs repo, reverse
repo, and BB bill rates as policy instruments
for influencing financial and real sector prices.
Effective from 1 February 2013, the repo and
reverse repo rates have remained unchanged
at 7.25 per cent and 5.25 per cent, respectively
(Table 3).
Bangladesh Bank data shows that, of the total liquid assets of scheduled banks as of end August 2015, some 4.08 per cent is held in the form of Cash in tills and Balances with Sonali Bank, 18.78 per cent in the form of CRR, 1.70 per cent
in the form of Excess Reserves, 3.30 per cent in the form of Balances with Bangladesh Bank in Foreign Currency and the remainder 72.14 per cent in the form of Unencumbered approved securities.

12 QUARTERLY REVIEW
Table 3: Interest Rate (weighted average) movements in FY14 and FY15 (in percent)
Month/Quarter Repo Reverse Repo Lending RateDeposit
RateInterest Rate
Spread
FY15R
July 7.25 5.25 12.84 7.71 5.13
August 7.25 5.25 12.75 7.63 5.12
September 7.25 5.25 12.58 7.48 5.10
October 7.25 5.25 12.49 7.40 5.09
November 7.25 5.25 12.49 7.32 5.17
December 7.25 5.25 12.46 7.25 5.21
January 7.25 5.25 12.32 7.26 5.06
February 7.25 5.25 12.23 7.19 5.04
March 7.25 5.25 11.93 7.06 4.87
April 7.25 5.25 11.88 7.04 4.84
May 7.25 5.25 11.82 6.99 4.83
June 7.25 5.25 11.67 6.80 4.87
FY16P
July 7.25 5.25 11.57 6.78 4.79
August 7.25 5.25 11.51 6.74 4.77
September 7.25 5.25 NA NA NA
Notes: P=Provisional, R=Revised, NA=Not Available
Source: Bangladesh Bank
Interest rate spread, the gap between the interest rate on credit and deposit, in the banking sector declined further in August 2015 as most of the scheduled banks were compelled to reduce rates of interest on their lending and deposit products amid dull business due to political uncertainty and also to attract clients, particularly corporate ones. According to BB data, the overall interest rate spread in the country’s banking sector decreased to 4.77 per cent in August 2015 from 4.79 per cent in July 2015. The spread was 4.87 per cent in June (Table 3). The falling trend of overall interest rate spread continued in the recent months
mainly due to strict monitoring and supervision of the central bank. The central bank is persuading the commercial banks to bring down the spread to nearly 4.0 per cent shortly from the existing level. And the central bank already advised the bankers to take necessary measures in this connection. The weighted average interest rate on deposit in the banking sector declined to 6.74 per cent in August 2015 from 6.78 per cent in the previous month. Scheduled banks also changed their average lending interest rate to 11.51 per cent in August from 11.57 per cent in July 2015 (Table 3).

JULY-SEPT. 2015 (Q1 FY16) Issue 01
3.2 Industrial Term Loans
Data on industrial term loans are available only up to
the 4th quarter (April-June) of the past fiscal (FY15). According to BB data, the disbursement of industrial
term loans during April-June of FY15 stood 12.2
per cent higher at Tk.14,980 crore, compared to
Tk.13,351 crore during the immediate previous
quarter (January-March) of that fiscal (Table 4). The higher growth in industrial term loans was due to a
rising trend following improvement of the country’s overall political situation. The loans went mostly to
energy and power, pharmaceuticals, textiles, food processing, steel and engineering industries, constructions
and transportation sectors. The recovery of industrial term loans, however, increased by 27.2 per cent during
April-June of FY15 while the recovery was negative in the previous quarter (January-March of FY15).
Table 4: Disbursement and Recovery of Industrial Term Loans
Quarter
(Tk. in crore)
Disbursement Recovery
LSI MSI SSCI Total LSI MSI SSCI Total
April-June of FY14R 7650 2848 965 11463 (23.5) 7023 2359 797 10179 (3.8)
July-September of FY15R 10325 1843 641 12809 (11.7) 7745 2778 1190 11713 (15.1)
October-December of FY15P 14074 3312 1259 18645 (45.6) 8682 2274 967 11923 (1.8)
January-March of FY15P 9888 2038 1425 13351 (-28.4) 7939 1538 1044 10521 (-11.8)
April-June of FY15P 11182 2497 1301 14980 (12.2) 8434 3308 1641 13383 (27.2)
Notes: LSI=Large Scale Industries, MSI=Medium Scale Industries and SSCI=Small Scale & Cottage Industries P=Provisional; R=Revised; Figures in parentheses indicate the percentage change over the previous quarte
Source: Bangladesh Bank
3.3 SME Loans
Data on SME loans are not available for Q1 of FY16.
According to BB data, total SME loans by all banks
and non-bank financial institutions (NBFIs) increased by 13.6 per cent to Tk.136,908 crore at the end of June
2015 from Tk.120,507 crore at the end of June 2014.
The disbursement of SME loans was 23.4 per cent of
total loans disbursed by all banks and NBFIs at the end
of June 2015 (Table 5).
14 QUARTERLY REVIEW
Table 5: Outstanding Position of SME Loans (Tk. in crore)
QuarterTypes of Loans
SOBs PBs FBs SBs NBFIs Total
April-June of FY14R
Total LoansSME LoansPercentage
8488515698(+18.5)
33618488864(+26.4)
229992070(+9.0)
333689810
(+29.4)
338704065
(+12.0)
511306120507(+23.6)
July-Sept. of FY15R
Total LoansSME LoansPercentage
8694616576(+19.1)
34996892907(+26.6)
233781905(+8.2)
334619906
(+29.6)
356544321
(+12.1)
529408125615(+23.7)
Oct.-Dec. of FY15P
Total LoansSME LoansPercentage
10239327215(+26.6)
369935101978(+27.6)
233851815(+7.8)
22126760
(+3.4)
367984380
(+11.9)
554637136148(+24.5)
Jan.-Mar. of FY15P
Total LoansSME LoansPercentage
10073722241(+22.1)
378556102868(+27.2)
223051857(+8.3)
22126760
(+3.4)
393354523
(+11.5)
563100132406(+23.5)
April-June of FY15P
Total LoansSME LoansPercentage
10377625477(+24.5)
394357103688(+26.3)
235281862(+7.9)
21425835
(+3.9)
408845046
(+12.3)
583970136908(+23.4)
% change of SME loans at the end of June 2015 over end of June 2014
+62.3 +16.7 -10.0 -91.5 +24.1 +13.6
Notes: P=Provisional, R=Revised; SOBs= State Owned Banks, PBs= Private Banks, FBs= Foreign Banks, SBs= Specialized Banks, NBFIs= Non-bank Financial Institutions; Figures in parentheses indicate SME loans as percentage of total loans Source: Bangladesh Bank
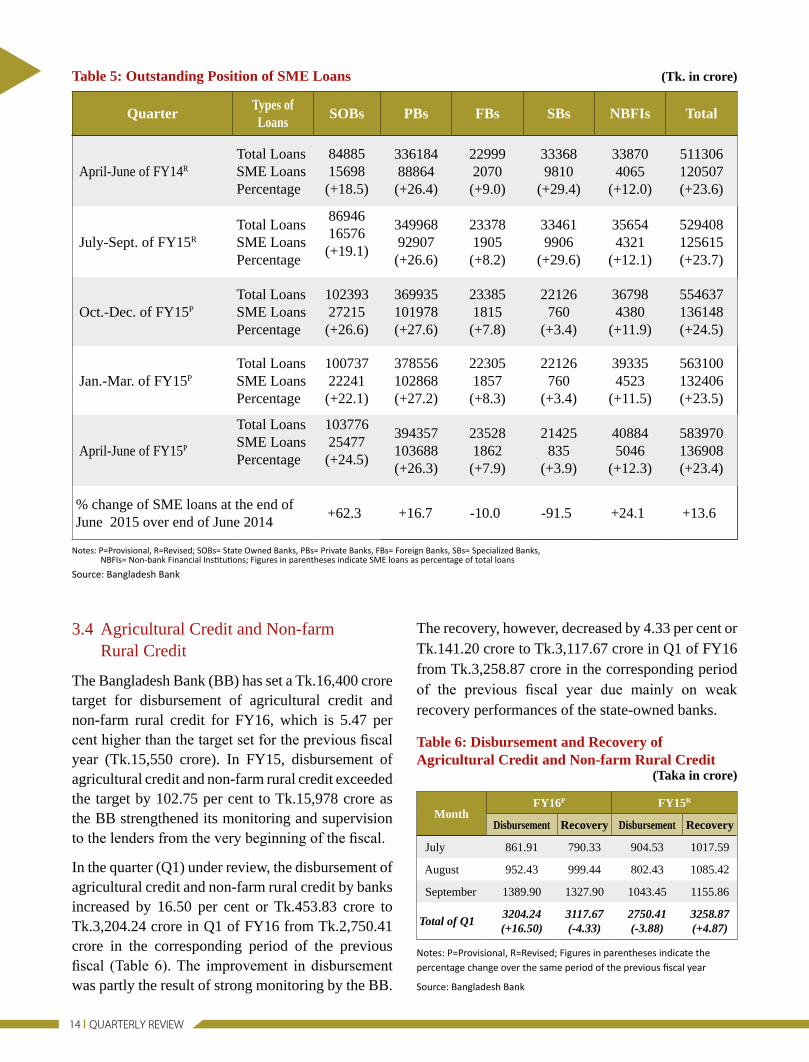
3.4 Agricultural Credit and Non-farm Rural Credit
The Bangladesh Bank (BB) has set a Tk.16,400 crore target for disbursement of agricultural credit and non-farm rural credit for FY16, which is 5.47 per cent higher than the target set for the previous fiscal year (Tk.15,550 crore). In FY15, disbursement of agricultural credit and non-farm rural credit exceeded the target by 102.75 per cent to Tk.15,978 crore as the BB strengthened its monitoring and supervision to the lenders from the very beginning of the fiscal.
In the quarter (Q1) under review, the disbursement of agricultural credit and non-farm rural credit by banks increased by 16.50 per cent or Tk.453.83 crore to Tk.3,204.24 crore in Q1 of FY16 from Tk.2,750.41 crore in the corresponding period of the previous fiscal (Table 6). The improvement in disbursement was partly the result of strong monitoring by the BB.
The recovery, however, decreased by 4.33 per cent or Tk.141.20 crore to Tk.3,117.67 crore in Q1 of FY16 from Tk.3,258.87 crore in the corresponding period of the previous fiscal year due mainly on weak recovery performances of the state-owned banks.
Table 6: Disbursement and Recovery of Agricultural Credit and Non-farm Rural Credit (Taka in crore)
MonthFY16P FY15R
Disbursement Recovery Disbursement Recovery
July 861.91 790.33 904.53 1017.59
August 952.43 999.44 802.43 1085.42
September 1389.90 1327.90 1043.45 1155.86
Total of Q13204.24(+16.50)
3117.67(-4.33)
2750.41(-3.88)
3258.87(+4.87)
Notes: P=Provisional, R=Revised; Figures in parentheses indicate the percentage change over the same period of the previous fiscal year
Source: Bangladesh Bank
JULY-SEPT. 2015 (Q1 FY16) Issue 01
4.0 CAPITAL MARKET
Capital market ended flat after a volatile session on 30 September 2015 as the investors were also eyeing the economic updates at the end of Q1 of FY16. The market moved heavily between red and green throughout the session as intra-day volatility was around 25 points. DSEX, the broad index of the Dhaka Stock Exchange (DSE), settled at 4,852.08, shedding 1.09 points or 0.02 per cent over the previous session. Turnover improved to Tk.4.95 billion, which was 13.79 per cent higher than the previous session’s Tk.4.35 billion. The losers took a modest lead over the gainers as out of 320 issues traded, 151 closed lower, 125 ended higher and 44 remained unchanged on the DSE trading floor. On the same day, the selective categories index, CSCX, on Chittagong Stock Exchange (CSE) also closed lower, lost 11.21 points to end at 9,035.12. Among 248 traded issues, 87 advanced, 127 declined and 34 remained unchanged on the port city bourse that traded 9.96 million shares and mutual fund units with a value of Tk.333 million.
5.0 PUBLIC FINANCEIn FY16, the National Board of Revenue (NBR) has set a revenue collection target of Tk.176,370 crore, which is about 17.8 per cent higher than that of the previous fiscal year’s original target (Tk.149,720 crore) and also about 30.6 per cent higher than the revised target of Tk.135,028 crore.
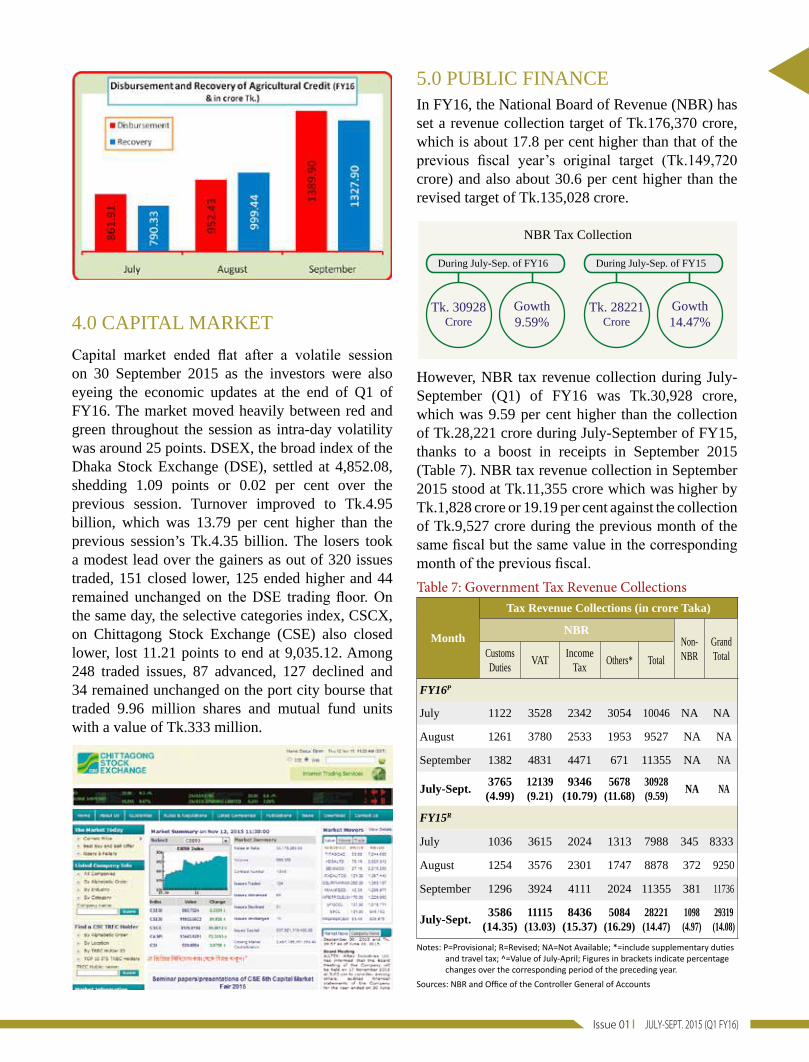
However, NBR tax revenue collection during July-September (Q1) of FY16 was Tk.30,928 crore, which was 9.59 per cent higher than the collection of Tk.28,221 crore during July-September of FY15, thanks to a boost in receipts in September 2015 (Table 7). NBR tax revenue collection in September 2015 stood at Tk.11,355 crore which was higher by Tk.1,828 crore or 19.19 per cent against the collection of Tk.9,527 crore during the previous month of the same fiscal but the same value in the corresponding month of the previous fiscal.Table 7: Government Tax Revenue Collections
Month
Tax Revenue Collections (in crore Taka)
NBRNon-NBR
GrandTotal Customs
DutiesVAT
IncomeTax
Others* Total
FY16P
July 1122 3528 2342 3054 10046 NA NA
August 1261 3780 2533 1953 9527 NA NA
September 1382 4831 4471 671 11355 NA NA
July-Sept.3765(4.99)
12139(9.21)
9346(10.79)
5678(11.68)
30928(9.59)
NA NA
FY15R
July 1036 3615 2024 1313 7988 345 8333
August 1254 3576 2301 1747 8878 372 9250
September 1296 3924 4111 2024 11355 381 11736
July-Sept.3586
(14.35)11115
(13.03)8436
(15.37)5084
(16.29)28221(14.47)
1098(4.97)
29319(14.08)
Notes: P=Provisional; R=Revised; NA=Not Available; *=include supplementary duties and travel tax; ^=Value of July-April; Figures in brackets indicate percentage changes over the corresponding period of the preceding year.
Sources: NBR and Office of the Controller General of Accounts
NBR Tax Collection
During July-Sep. of FY16
Tk. 30928Crore
Gowth9.59%
During July-Sep. of FY15
Tk. 28221Crore
Gowth14.47%
16 QUARTERLY REVIEW
5.1 Public Expenditure
The implementation of the Annual Development Programme (ADP) failed to pick pace in the first quarter of the current fiscal year (FY16). The implementation rate in July-September of FY16 was only 7 per cent, a record low in eight years mainly due to failure of ministries and divisions with higher allocation. Also attributed the low implementation was lack of capacity and unfavourable weather, mainly heavy rain. The rate was 9 per cent in the corresponding period of the previous fiscal (FY15).
According to the Implementation Monitoring and Evaluation Division (IMED) data, 53 ministries and divisions could spent only Tk.68.06 billion of the total allocation of Tk.1,009.97 billion. Top 10 ministries and divisions which got 73 per cent of total allocation of ADP, on an average spent only 7 per cent affecting the overall implementation rate. Among the 10 large ministries and divisions, the performance of the Ministry of Education was the best (13%), followed by the Ministry of Health and Family Welfare and the Ministry of Primary and Mass Education (both 12%), the Local Government Division (11%), the Bridge Division and the Road Transport & Highways Division (4% both), the Ministry of Railway (3.73%), the Power Division and the Energy & Mineral Resources Division (both 3%) and the Ministry of Water Resources (0.3%).
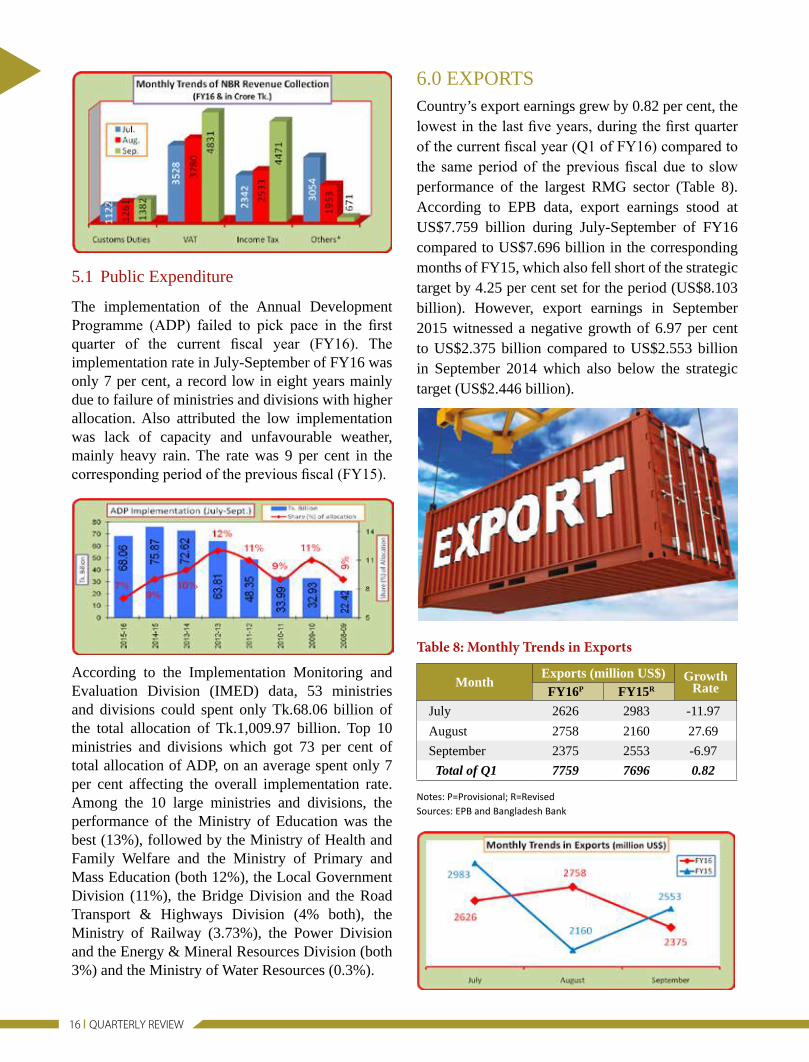
6.0 EXPORTSCountry’s export earnings grew by 0.82 per cent, the lowest in the last five years, during the first quarter of the current fiscal year (Q1 of FY16) compared to the same period of the previous fiscal due to slow performance of the largest RMG sector (Table 8). According to EPB data, export earnings stood at US$7.759 billion during July-September of FY16 compared to US$7.696 billion in the corresponding months of FY15, which also fell short of the strategic target by 4.25 per cent set for the period (US$8.103 billion). However, export earnings in September 2015 witnessed a negative growth of 6.97 per cent to US$2.375 billion compared to US$2.553 billion in September 2014 which also below the strategic target (US$2.446 billion).
Table 8: Monthly Trends in Exports
MonthExports (million US$) Growth
RateFY16P FY15R
July 2626 2983 -11.97
August 2758 2160 27.69
September 2375 2553 -6.97
Total of Q1 7759 7696 0.82
Notes: P=Provisional; R=Revised Sources: EPB and Bangladesh Bank
JULY-SEPT. 2015 (Q1 FY16) Issue 01
An analysis of EPB’s export data shows that the country’s major export products, i.e., woven garments, specialized textiles, leather products, other footwear, chemical products, engineering products, other manufactured products and jute & jute goods experienced positive growth while knitwear, home textile, leather & leather footwear, plastic products, frozen food & live fish, agricultural products, cotton & cotton products and computer services showed negative growth in Q1 of FY16 compared to the corresponding period in the previous fiscal. Exports of RMG, the main export item, displayed the poorest performance in the quarter, where knitwear witnessed a negative growth of 0.62 per cent to US$3.250 billion in Q1 of FY16 compared to US$3.270 billion in the corresponding period of the previous fiscal while woven garments rose by only 7.64 per cent to US$3.189 billion in Q1 of FY16 compared to US$2.963 billion in Q1 of FY15. Export earnings in the RMG products made slow growth due to shortage of orders, as well as reduction of orders’ unit prices. The global retailers, especially from European Union, cut prices of apparel products due to devaluation of Euro, and Australian and Canadian dollars against US dollar. Also impact of political unrest slowing down the growth as placing of orders was hampered, according to the Exporters.
According to EPB data, exports to the US market rebounded strongly in the first quarter of the current fiscal year, rose by 15.79 per cent compared with that in the same period of the last fiscal year due to progress in garment factory remediation work. Moreover, the steadiness of value of the Taka against the US dollar, relaxation of US visa processing and value addition by the Bangladesh garment makers helped increase in shipment of RMG products. Export earnings from the US market rose to US$1.555 billion in July-September of FY16 from that of US$1.343 billion in the same period of FY15. The earnings from India also witnessed a growth of 11.43 per cent year-on-year in Q1 because of huge rise in exports of jute and jute products despite disappointing figure of garment exports to the country. Export earnings from India rose to US$160.40 million in July-September of FY16 from US$143.95 million in the same period of FY15.
Out of 53 Bangladesh missions abroad, 36 have failed to achieve their respective export targets for July-August of FY16. The key Bangladesh missions like Berlin, London, Paris, Madrid, Rome, the Hague,
Stockholm, Brussels, Riyadh, Brasilia and Beijing have failed to achieve their July-August export targets while some other important missions like Washington, Canberra, Ottawa, New Delhi, Dubai, Singapore and Tokyo have been able to reach their targets. The overall export earnings for July-August period amounted to US$5.280 billion which is 98.07 per cent of national export income. However, only 18 missions, out of 53, have commercial wings to promote country’s external trade and the export earning of these commercial wings for these two months is US$4.177 billion. Notwithstanding, 11 of them could not achieve the export targets.
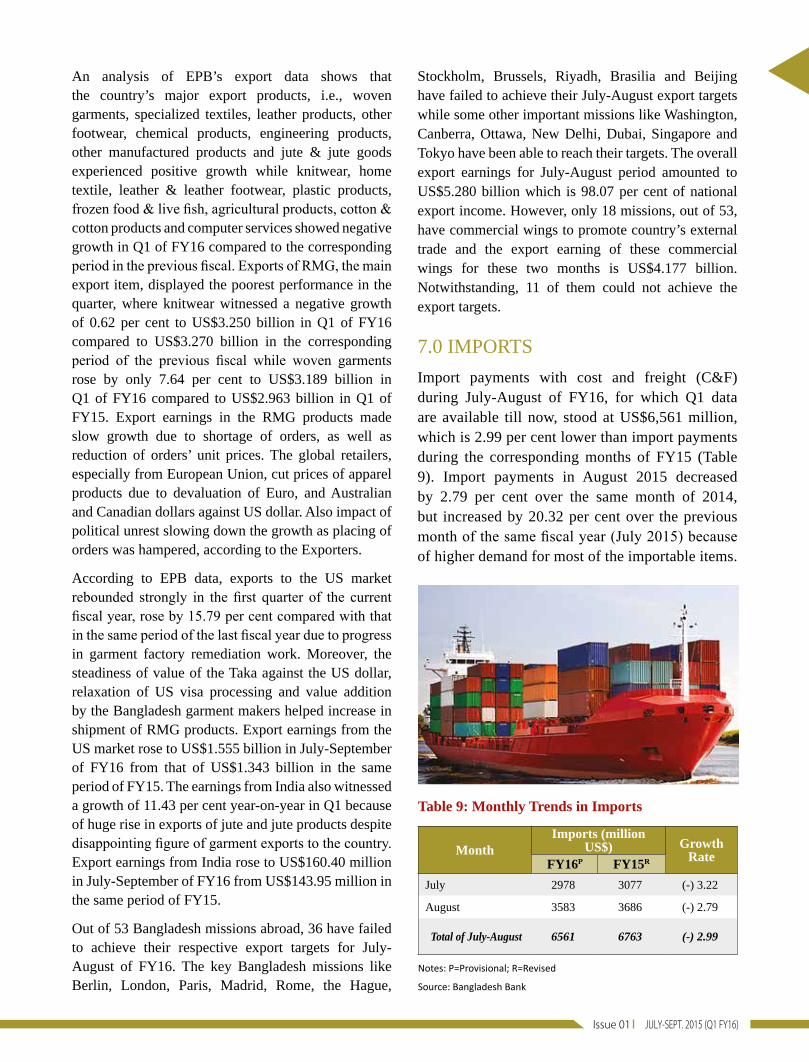
7.0 IMPORTS
Import payments with cost and freight (C&F) during July-August of FY16, for which Q1 data are available till now, stood at US$6,561 million, which is 2.99 per cent lower than import payments during the corresponding months of FY15 (Table 9). Import payments in August 2015 decreased by 2.79 per cent over the same month of 2014, but increased by 20.32 per cent over the previous month of the same fiscal year (July 2015) because of higher demand for most of the importable items.
Table 9: Monthly Trends in Imports
MonthImports (million
US$) Growth RateFY16P FY15R
July 2978 3077 (-) 3.22
August 3583 3686 (-) 2.79
Total of July-August 6561 6763 (-) 2.99
Notes: P=Provisional; R=Revised
Source: Bangladesh Bank

18 QUARTERLY REVIEW
Table 10: Monthly Trends in Remittances
MonthRemittances (million US$) Growth
RateFY16P FY15R
July 1390 1492 -6.84
August 1195 1174 1.79
September 1346 1344 0.15
Total of Q1 3931 4010 -1.97
Notes: P=Provisional; R=RevisedSource: Bangladesh Bank
The central bank along with commercial bankers had worked hard round the year to increase the flow of inward remittances from across the world. The delivery channel of inward remittances to the beneficiary has improved significantly because of the bank-led effective mobile banking under the leadership of the BB. As part of the moves, the BB is allowing local banks to establish exchange houses and drawing arrangements abroad to facilitate the inflow of remittance. Currently, 34 exchange houses operating across the globe have set up 1,078 drawing arrangements abroad to scale up the remittance inflow. The central bank earlier took a set of measures, including building mass awareness so that expatriate Bangladeshis send their hard-earned money home through the banking channel instead of illegal ‘hundi’ system, which also help boost the country’s foreign-exchange reserves.
Most private commercial banks along with the state-owned ones have been trying to increase the flow of inward remittances from the Middle East, the United Kingdom, Japan, Canada, Australia, Malaysia, Singapore, Italy and the United States. In September 2015, the private commercial banks (PCBs) channeled US$916 million of remittances, the state-owned commercial banks (SCBs) US$399.37 million, foreign commercial banks (FCBs) US$15.40 million, and specialized banks (SBs) US$15 million.
According to BB data, the settlement of import Letters of Credit (LCs) increased by 8.0 per cent to US$6,940 million during July-August of FY16 compared to US$6,426 million in the corresponding period of the previous fiscal. But the opening of fresh LCs against imports decreased by 6.84 per cent to US$6,643 million during the July-August period of FY16 from US$7,131 million.
8.0 REMITTANCES
The trend of inward remittance was slower in recent months due to stronger local currency against dollar when currencies are tumbling in the Asia region. Remittance inflow in the first quarter of the current fiscal (FY16) dropped slightly by 1.97 per cent compared to the corresponding period of the previous fiscal despite a slight rise in inflow in the last two months. According to the BB data, the country received US$3.931 billion in remittance in July-September of FY16 compared to US$4.010 billion during the same period of FY15 (Table 10). Month wise, the remittances y-o-y increased slightly in August (1.79%) and September (0.15%) because of Eid-centric activities. But the inflow in July 2015 was much lower (by 6.84%) than the same month last year due to the slowdown of the European economic activities.
JULY-SEPT. 2015 (Q1 FY16) Issue 01
9.0 FOREIGN AID
According to the Economic Relations Division (ERD), the commitment of foreign aid to Bangladesh has plunged 87.96 per cent to US$52.80 million in the first quarter of the present fiscal year (Q1 of FY16) compared to US$438.40 million in the corresponding period of the previous fiscal as the major development partners have not confirmed adequate loans during the period. Also delay in project approval and start-up delay for projects work by the government agencies are the reasons behind the lower external fund commitment. Though, the government has targeted to receive external assistance worth nearly US$6.0 billion in FY16. The disbursement of foreign aid, however, has shown a positive 6.87 per cent growth to US$502.27 million during July-September of FY16 compared to US$470 million in the corresponding period of the previous fiscal. Out of US$502.27 million, the government received US$408 million in loans and US$94.27 million in grants. Some major donors, including World Bank (WB), Asian Development Bank (ADB), Islamic Development Bank (IDB), Japan and Russia disbursed US$192 million, US$76.20 million, US$42.50 million, US$41.60 million and US$22.70 million, respectively. Earlier, the government has set the target of foreign aid disbursement for FY16 at US$4.36 billion, up from US$3.35 billion last fiscal year.
According to the ERD, the government had to pay back US$237.70 million and US$182 million in principals and US$55.70 million in interest on loans.
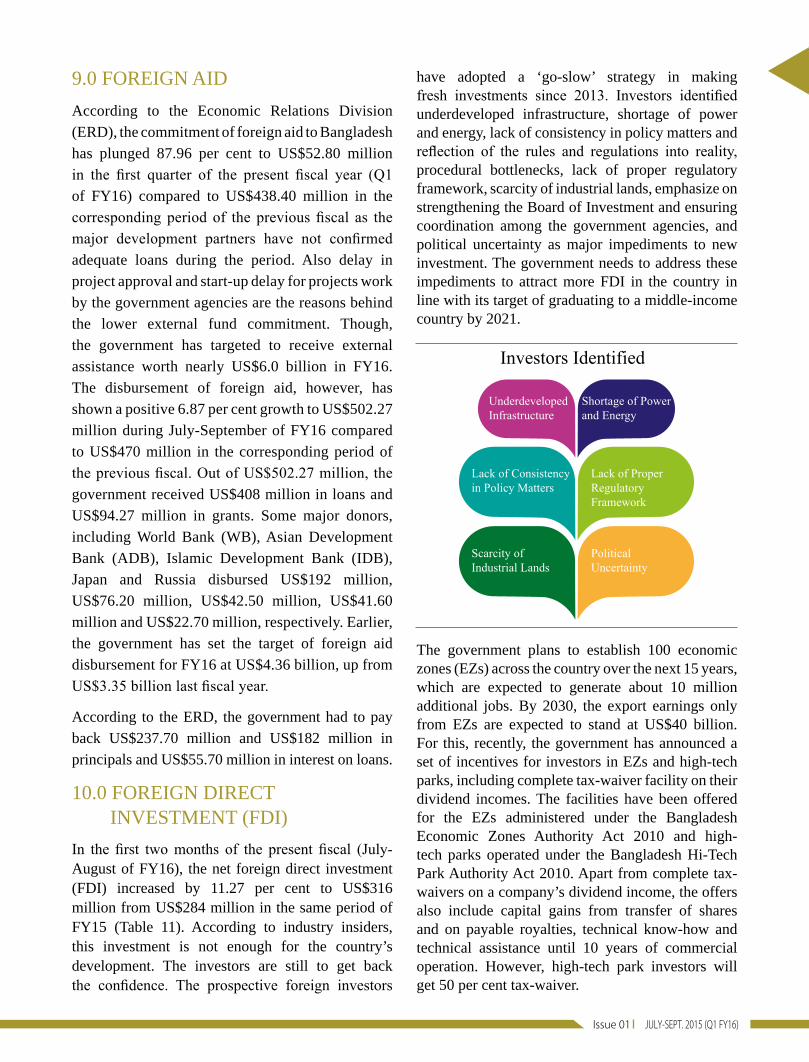
have adopted a ‘go-slow’ strategy in making fresh investments since 2013. Investors identified underdeveloped infrastructure, shortage of power and energy, lack of consistency in policy matters and reflection of the rules and regulations into reality, procedural bottlenecks, lack of proper regulatory framework, scarcity of industrial lands, emphasize on strengthening the Board of Investment and ensuring coordination among the government agencies, and political uncertainty as major impediments to new investment. The government needs to address these impediments to attract more FDI in the country in line with its target of graduating to a middle-income country by 2021.
The government plans to establish 100 economic zones (EZs) across the country over the next 15 years, which are expected to generate about 10 million additional jobs. By 2030, the export earnings only from EZs are expected to stand at US$40 billion. For this, recently, the government has announced a set of incentives for investors in EZs and high-tech parks, including complete tax-waiver facility on their dividend incomes. The facilities have been offered for the EZs administered under the Bangladesh Economic Zones Authority Act 2010 and high-tech parks operated under the Bangladesh Hi-Tech Park Authority Act 2010. Apart from complete tax-waivers on a company’s dividend income, the offers also include capital gains from transfer of shares and on payable royalties, technical know-how and technical assistance until 10 years of commercial operation. However, high-tech park investors will get 50 per cent tax-waiver.
10.0 FOREIGN DIRECT INVESTMENT (FDI)
In the first two months of the present fiscal (July-August of FY16), the net foreign direct investment (FDI) increased by 11.27 per cent to US$316 million from US$284 million in the same period of FY15 (Table 11). According to industry insiders, this investment is not enough for the country’s development. The investors are still to get back the confidence. The prospective foreign investors
20 QUARTERLY REVIEW
Table 11: Balance of Payments (in million US$)
ItemsJuly-August
of FY16P
July-August of FY15R Change
Trade Balance (-) 603 (-) 1015 412
Exports f.o.b (including EPZ)* 5304 5074
Of which: Readymade Garments 4485 4232
Imports f.o.b (including EPZ)* 5907 6089
Services (-) 632 (-) 908 276
Credit 480 488
Debit 1112 1396
Primary Income (-) 502 (-) 541 39
Credit 16 10
Debit 518 551
Of which: Official Interest Payment 90 68
Secondary Income 2619 2717 (-) 98
Official Transfers 4 3
Private Transfers 2615 2714
Of which: Workers’ Remittances (current a/c portion)
2546 2648 (-) 102
Current Account Balance 882 253 629
Capital Account 47 38
Capital Transfers 47 38
Financial Account 255 658 (-) 403
Foreign Direct Investment (net) 316 284 32
Portfolio Investment (net) 19 47
Of which: Workers’ Remittances (financial a/c portion) 39 18
Other Investment (net) (-) 80 327
Errors and Omissions 82 (-) 167 249
Overall Balance 1266 782 484
Notes: P=Provisional; R=Revised; * = Exports and Imports both are compiled on the basis of shipment data
Source: Bangladesh Bank
11.0 BALANCE OF
PAYMENTS
Trade deficit decreased by 40.59 per cent in the first two months of FY16 from a year earlier thanks to
lower imports and higher exports.
At the end of August 2015, the
trade deficit stood at US$412 million. Imports decreased by
2.99 per cent in July-August of
FY16, while exports grew by 4.53
per cent from a year earlier. The
drop in petroleum prices in the
international market also lessened
the import bills, according to BB
data (Table 11).
In July-August of FY16, the
financial account recorded a surplus to US$255 million
from US$658 million in the
corresponding period of FY15
which has helped keep the overall
balance of payments in the surplus
and the balance of payments
surplus soared by 61.89 per cent
during the period. At the end of
August 2015, the overall surplus
stood at US$1.266 billion in
contrast to US$0.782 billion a year
earlier. There was a turnaround
in errors and omissions, it was
US$82 million in inflows in July-August of FY16 in contrast to
US$167 million in outflows in the corresponding period of FY15.

JULY-SEPT. 2015 (Q1 FY16) Issue 01
12.0 EXCHANGE RATE
Between end-June and end-September of 2015, Taka remained the same in terms of US dollar, showing stability in the foreign exchange market. On the inter-bank market, the US dollar was quoted at Tk.77.8000 (Table 12).
Table 12: Monthly Exchange Rate
MonthFY16P (Taka per US$) FY15R (Taka per US$)
Month Average
End Month
Month Average
End Month
June - - 77.8000 77.8000
July 77.8007 77.8000 77.5907 77.5005
August 77.8000 77.8000 77.4588 77.4000
September 77.8001 77.8000 77.4006 77.4000
Note: i) P=Provisional; R=Revised
ii) Exchange rate represents the mid-value of buying and selling rates
Source: Bangladesh Bank
13.0 FOREIGN EXCHANGE RESERVES
BB’s gross foreign exchange reserves stood at US$26.379 billion as of end September 2015. The reserves were US$26.175 billion at the end of August 2015 (Table 13). The amount is sufficient to cover more than six months’ import bills. The reserves were above US$26 billion during Q1 of FY16 mainly due to the rise in inward remittances as well as lower import pressure. Also lower prices of petroleum products in the global market and private sector credit from overseas sources have helped raise the country’s foreign exchange reserves. Moreover, the BB has continued purchasing US dollars from the commercial banks directly in order to keep the exchange rate stable, which, incidentally has also contributed to the increase in the foreign
exchange reserves. The BB has purchased around US$1.77 billion in Q1 of FY16 (where in July US$0.872 billion, in August US$0.337 billion and in September US$0.561 billion) to maintain a balance between supply and demand as inflow of the foreign currency increased due to Eid-ul-Azha. The BB also had purchased around US$3.76 billion in FY15 and around US$5.15 billion in FY14, which is also a reason behind the increase of foreign exchange reserves.
A healthy reserve allows a country to get higher credit rating and helps its private sector to get loans from foreign sources at low interest rates. Also, the current reserves will help keep the Taka stable against the US dollar. The latest available information indicates that the foreign exchange reserves crossed the US$27 billion mark for the first time on 29 October 2015 due to a drop in global commodity prices, stable exports and a steady inflow of remittances. The reserves, which stood at US$27.06 billion, are 21.5 per cent higher year-on-year, and are enough to cover the country’s imports for approximately seven months, according to BB.
Table 13: Monthly Trends in Foreign Exchange Reserves
MonthForeign Exchange Reserve (million US$)
FY16P FY15R
July 25464 21383
August 26175 22070
September 26379 21837
Notes: P=Provisional; R=RevisedSource: Bangladesh Bank
22 QUARTERLY REVIEW
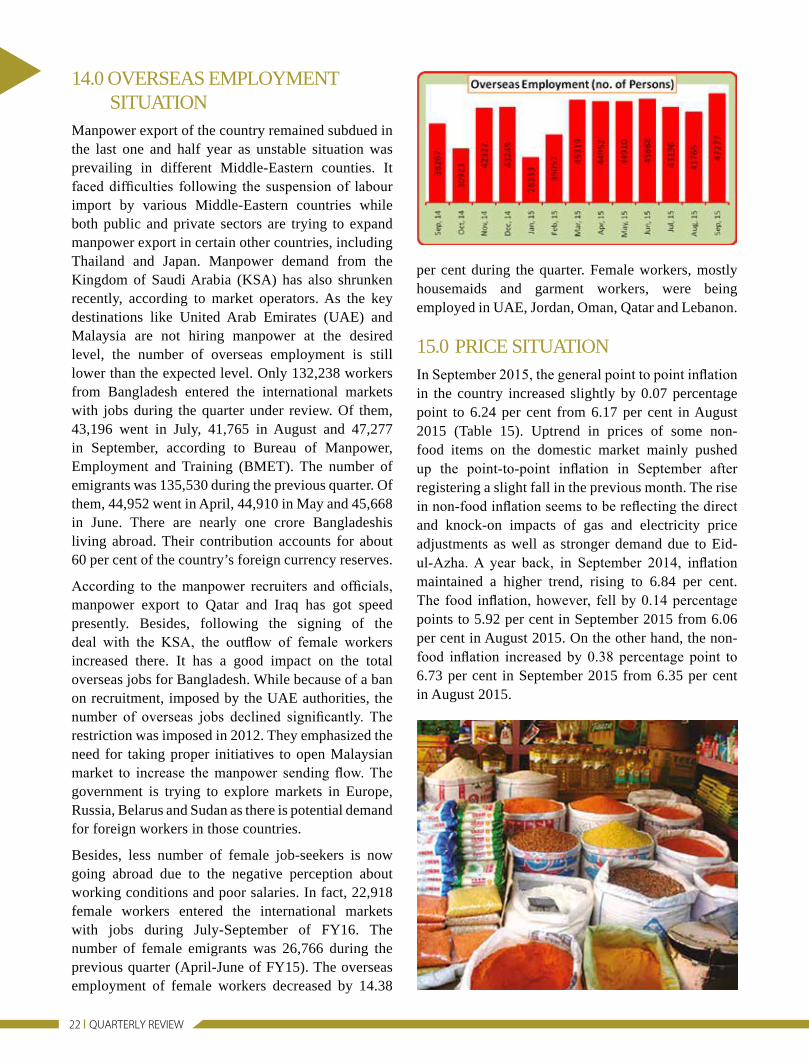
14.0 OVERSEAS EMPLOYMENT SITUATION
Manpower export of the country remained subdued in the last one and half year as unstable situation was prevailing in different Middle-Eastern counties. It faced difficulties following the suspension of labour import by various Middle-Eastern countries while both public and private sectors are trying to expand manpower export in certain other countries, including Thailand and Japan. Manpower demand from the Kingdom of Saudi Arabia (KSA) has also shrunken recently, according to market operators. As the key destinations like United Arab Emirates (UAE) and Malaysia are not hiring manpower at the desired level, the number of overseas employment is still lower than the expected level. Only 132,238 workers from Bangladesh entered the international markets with jobs during the quarter under review. Of them, 43,196 went in July, 41,765 in August and 47,277 in September, according to Bureau of Manpower, Employment and Training (BMET). The number of emigrants was 135,530 during the previous quarter. Of them, 44,952 went in April, 44,910 in May and 45,668 in June. There are nearly one crore Bangladeshis living abroad. Their contribution accounts for about 60 per cent of the country’s foreign currency reserves.
According to the manpower recruiters and officials, manpower export to Qatar and Iraq has got speed presently. Besides, following the signing of the deal with the KSA, the outflow of female workers increased there. It has a good impact on the total overseas jobs for Bangladesh. While because of a ban on recruitment, imposed by the UAE authorities, the number of overseas jobs declined significantly. The restriction was imposed in 2012. They emphasized the need for taking proper initiatives to open Malaysian market to increase the manpower sending flow. The government is trying to explore markets in Europe, Russia, Belarus and Sudan as there is potential demand for foreign workers in those countries.
Besides, less number of female job-seekers is now going abroad due to the negative perception about working conditions and poor salaries. In fact, 22,918 female workers entered the international markets with jobs during July-September of FY16. The number of female emigrants was 26,766 during the previous quarter (April-June of FY15). The overseas employment of female workers decreased by 14.38
per cent during the quarter. Female workers, mostly housemaids and garment workers, were being employed in UAE, Jordan, Oman, Qatar and Lebanon.
15.0 PRICE SITUATIONIn September 2015, the general point to point inflation in the country increased slightly by 0.07 percentage point to 6.24 per cent from 6.17 per cent in August 2015 (Table 15). Uptrend in prices of some non-food items on the domestic market mainly pushed up the point-to-point inflation in September after registering a slight fall in the previous month. The rise in non-food inflation seems to be reflecting the direct and knock-on impacts of gas and electricity price adjustments as well as stronger demand due to Eid-ul-Azha. A year back, in September 2014, inflation maintained a higher trend, rising to 6.84 per cent. The food inflation, however, fell by 0.14 percentage points to 5.92 per cent in September 2015 from 6.06 per cent in August 2015. On the other hand, the non-food inflation increased by 0.38 percentage point to 6.73 per cent in September 2015 from 6.35 per cent in August 2015.
JULY-SEPT. 2015 (Q1 FY16) Issue 01
16.0 CHAMBER’S PROJECTION ON SOME SELECTED ECONOMIC INDICATORS
On the basis of observations in the preceding nine months, projections on some selected economic indicators are made here for the second quarter of the present fiscal year (Q2 of FY16) (Table 16).
Table 16: Projection on Some Selected Indicators in Q2 of FY16
IndicatorsFY15 FY16
Jan. Feb. Mar. April May June July August Sept. Oct. Nov. Dec.
Export(million US$)
2885 2512 2593 2399 2841 3065 2626 2758 2375 2850 3075 3300
Import (million US$)
3618 3475 3695 4109 4184 3842 2978 3583 3750 3980 4250 4450
Remittance(million US$)
1243 1190 1338 1297 1322 1439 1390 1195 1346 1360 1390 1430
Forex Reserve(million US$)
22042 23032 23053 24072 23708 25026 25464 26175 26379 26450 26350 26650
Inflation, Point to Point (percent)
6.04 6.14 6.27 6.32 6.19 6.25 6.36 6.17 6.24 6.30 6.25 6.25
Note: January – September 2015: actual figures except September value of Import; October – December 2015: projections (figures in bold) Sources: BB, BBS and Author’s own calculation
It is assumed that the relatively calm political situation of the present will continue in the second quarter of the present fiscal year (Q2 of FY16). Therefore, export, import, and remittances will increase further. The foreign exchange reserve can be expected to fall in November due to the payment to the Asian Clearing Union (ACU) against imports. The rate of inflation can be expected to go up in October because of the rise in commodity prices.
Table 15: Monthly Trends in Inflation (Base: 2005-06=100) (Percent)
PeriodPoint to Point-All Point to Point-Rural Point to Point-Urban
General Food Non-food General Food Non-food General Food Non-food
FY15R
July 7.04 7.94 5.71 6.93 7.78 5.43 7.24 8.31 6.10
August 6.91 7.67 5.76 6.83 7.56 5.46 7.08 7.89 6.19
September 6.84 7.63 5.63 6.75 7.52 5.31 7.02 7.88 6.07
FY16P
July 6.36 6.07 6.80 5.88 5.43 6.69 7.28 7.58 6.96
August 6.17 6.06 6.35 5.76 5.42 6.41 6.94 7.56 6.26
September 6.24 5.92 6.73 5.86 5.26 6.99 6.96 7.47 6.37
Notes: i) P=Provisional; ii) Food includes food, beverages and tobacco Source: Bangladesh Bureau of Statistics
A comparison of inflation data for urban and rural areas in September of FY16 (general point to point) showed that the inflation rate was higher in urban areas than in rural areas. Thus, the point to point general, food and non-food inflation in rural areas in September were 5.86 per cent, 5.26 per cent and 6.99 per cent, respectively, while these inflation rates in urban areas were 6.96 per cent, 7.47 per cent and 6.37 per cent, respectively.
24 QUARTERLY REVIEW
17.0 CONCLUDING OBSERVATIONS
During July-September of FY16, the agriculture sector performed well, but continuous government support with inputs and finance will be needed to sustain the sector’s growth. While infrastructure deficits and gas & power supply problems were undermining the performance of the manufacturing sector. Government will therefore need to adopt suitable measures to remove bottlenecks in physical infrastructure and crisis in power & gas supplies in support of agriculture and industry sectors. Services sectors are doing well but these will need government support to be able to recover the losses they suffered during the political unrest. However, in order to achieve the government’s growth and inflation targets, the political stability should be maintained. Adequate infrastructure, energy, skilled manpower, political stability and investment-friendly climate are the key factors for higher economic growth.
Rising investment is a precondition for economic growth, but there are many impediments that have kept investment at a low level. Maintaining macroeconomic stability, restoring momentum in economic activities, enhancing revenue collection, raising investment, achieving the export target, containing inflation, and above all, improving law and order conditions in the country will be the major challenges for the government. It apparently seems that foreign investors have adopted a ‘go-slow’ strategy in making fresh investments since 2013. While
public investment has increased, it cannot be an alternative to private investment, which is crucial to accelerating economic growth. Besides, the business environment over the last one year deteriorated further, Bangladesh slid to 174th out of 189 countries according to recently published the World Bank’s report ‘Doing Business-2016: Measuring Regulatory Quality and Efficiency’ of the world’s economies. The country fell behind two places from 172nd in 2015. Out of 10 indicators, Bangladesh slipped down to five and remained unchanged in five. As regards power connection, the country is the lowest performer among the surveyed economies, coming 189th. Getting new electricity connection here requires on an average 404 days, which inflates the cost of doing businesses while property registration takes 244 days that shoots up the cost. For starting a business, Bangladesh’s rank slipped to 117 in 2016 from 115 the year before. For registering property, the country slipped into the last place from its previous position of 188th. For enforcing contracts, the country’s ranking remained unchanged near the bottom of the pile, at 188. Among South Asian countries, Nepal ranked 99th, Sri Lanka 107th, the Maldives 128th, India 130th, and Pakistan ranked 138th. Country’s business and investor community, however, called upon the government to execute business regulatory reforms quickly in order to brighten the country’s image and ensure business environment for attracting foreign and local investments.
In the quarter under review (Q1 of FY16), the overall economic situation in the country was positive as indicated by steady improvements in the major economic variables. Although the progress made is below potential, the country experienced stable growth, inflation was under control, the exchange rate remained stable, and foreign exchange reserves rose and remained at
comfortable level. The international rating agencies have given stable ratings to Bangladesh as they have done for a number of years now.


![INDUSTRIAL PNEUMATICS - fittings€¦ · MW-2007003 6 MW-2L07004 8 MW-2007005 10 MW-2007006 12 MW-2007007 14 Tee adapter, brass R 5 code hose O.D. [mm] MW-2005A02 3 MW-2005A01 3.17](https://img.pdfslide.us/doc/110x75/6020b0177745f5137a1d1da5/industrial-pneumatics-fittings-mw-2007003-6-mw-2l07004-8-mw-2007005-10-mw-2007006.jpg)