Embed Size (px)
Citation preview
-AND-
2002
Findings from the
Kaiser/HRET and
Kaiser/Hewitt Employer Surveys
California Employers Health Benefits Survey 2000
Employer Health Benefits, 2002
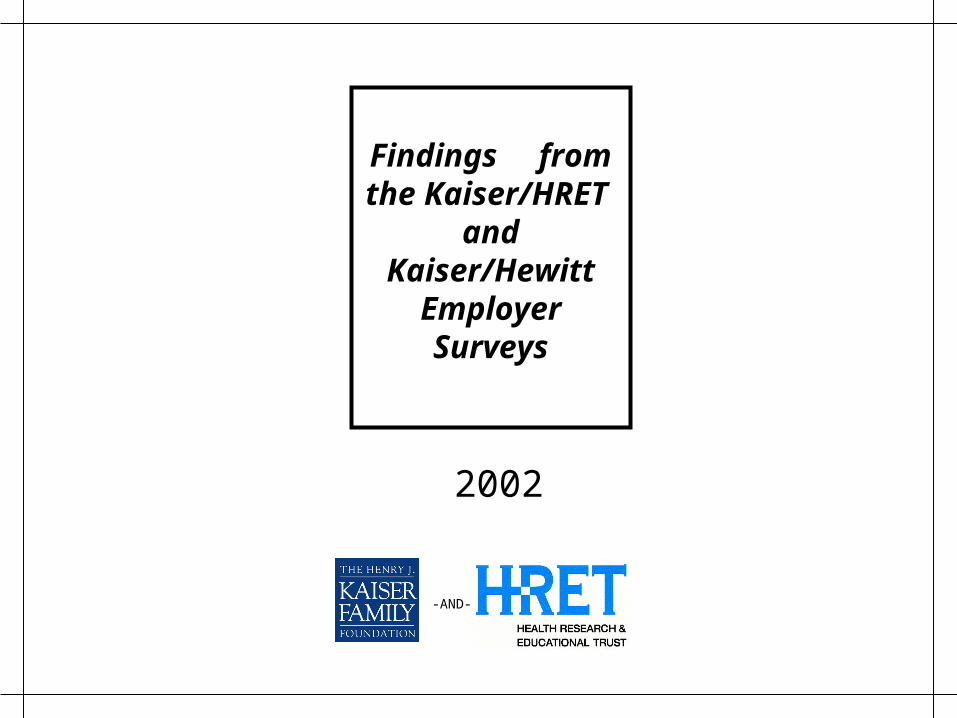
Overview
- Methods
- Health Insurance Costs
- Plan Choice and Enrollment
- Coverage and Benefits
- Retiree Coverage
California Employers Health Benefits Survey 2000
Employer Health Benefits, 2002
Survey Methods
• Kaiser/HRET National Employer Health Benefits Survey – Telephone survey was conducted between January and May 2002 – 3,262 randomly selected public and private employers, ranging from
3 to 300,000 employees, representative of all regions and industries– 2,014 firms responded to the full survey– An additional 1,248 firms indicated whether or not they provide
health coverage
• Kaiser/Hewitt Retiree Health Survey– Online survey was conducted between July and September 2002 – 435 private employers with more than 1,000 employees responded
to the survey. Only firms offering retiree benefits were surveyed– The sample sample represents 36% of Fortune 100 companies and
28% of Fortune 500 companies, impacting 18.5 million employees and family members, and 5.4 million retirees and family members
California Employers Health Benefits Survey 2000
Employer Health Benefits, 2002
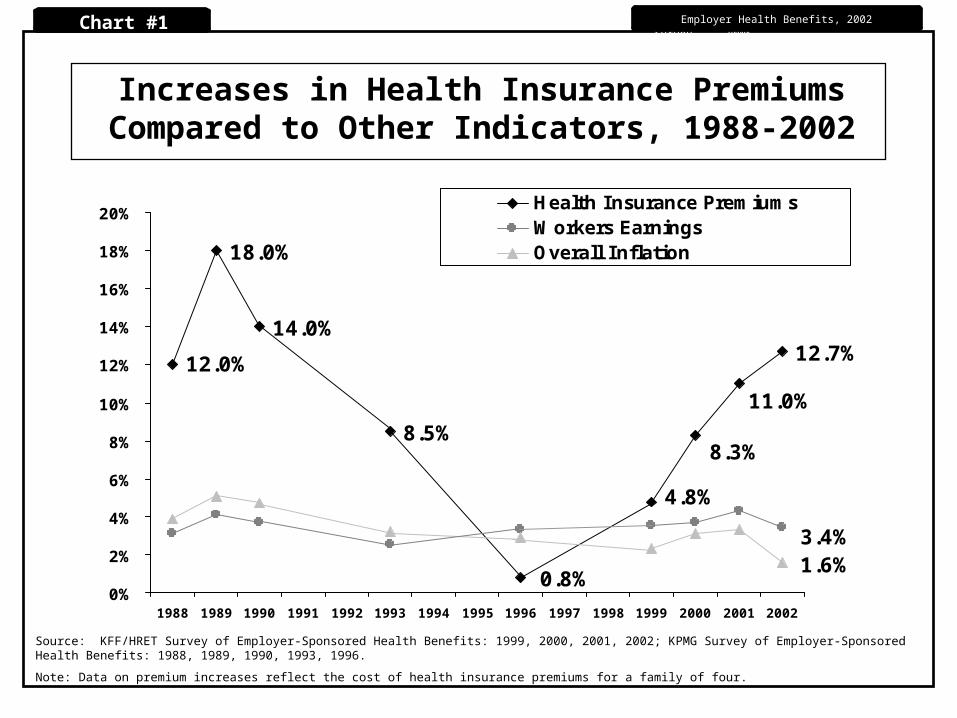
14.0%
18.0%
12.7%
11.0%
8.3%
4.8%
0.8%
8.5%
12.0%
0%
2%
4%
6%
8%
10%
12%
14%
16%
18%
20%
1988 1989 1990 1991 1992 1993 1994 1995 1996 1997 1998 1999 2000 2001 2002
Health Insurance PremiumsWorkers EarningsOverall Inflation
1.6%3.4%
Increases in Health Insurance Premiums Compared to Other Indicators, 1988-2002
Source: KFF/HRET Survey of Employer-Sponsored Health Benefits: 1999, 2000, 2001, 2002; KPMG Survey of Employer-Sponsored Health Benefits: 1988, 1989, 1990, 1993, 1996.
Note: Data on premium increases reflect the cost of health insurance premiums for a family of four.
Chart #1

California Employers Health Benefits Survey 2000
Employer Health Benefits, 2002
13.2%12.4%12.4%
14.2% 13.7%12.3% 12.0% 12.0%
12.9%11.2%
0%
5%
10%
15%
20%
All Plans Conventional HMO PPO POS
Fully Insured Self-Insured
Premium/Cost Increases1, by Plan Type and Funding Arrangement, 2002*
Source: Kaiser/HRET Survey of Employer-Sponsored Health Benefits: 2002.
Chart #2
Note1: Fully insured plans measure premium increases, self-insured measures cost increases.
* Tests found no statistically different estimates between Fully Insured and Self-Insured within a plan type.

California Employers Health Benefits Survey 2000
Employer Health Benefits, 2002
$8,173
$3,175
$8,037
$3,119
$7,541*
$2,764*
$8,479
$3,582*
$7,954
$3,060
$0 $1,000 $2,000 $3,000 $4,000 $5,000 $6,000 $7,000 $8,000
Single
Family
Single
Family
Single
Family
Single
Family
Single
Family
Conventional
HMO
PPO
POS
All Plans
Average Annual Premium Costs for Covered Workers, by Plan Type, 2002
* Estimate is statistically different from All Plans by coverage type.
Source: Kaiser/HRET Survey of Employer-Sponsored Health Benefits: 2002.
Chart #3

California Employers Health Benefits Survey 2000
Employer Health Benefits, 2002
Average Monthly Worker Contribution, 1988-2002
$8
$52$34
$124
$37
$122
$30
$150$138*
$28*
$174*
$38*
$0
$40
$80
$120
$160
$200
Single Coverage Family Coverage
1988
1993
1996
2000
2001
2002
* Estimate is statistically different from the previous year shown: 1996-2000, 2000-2001, 2001-2002.
Source: Kaiser/HRET Survey of Employer-Sponsored Health Benefits: 2000, 2001, 2002; KPMG Survey of Employer-Sponsored Health Benefits: 1988, 1993, 1996
11%
29%
20%
32%
21%
28% 27%
15%
27%
16%
27%
14% *
0%
5%
10%
15%
20%
25%
30%
35%
Single Coverage Family Coverage
1988
1993
1996
2000
2001
2002
Percentage of Premium Paid by Covered Workers, 1988-2002
* Estimate is statistically different from the previous year shown: 1996-2000, 2000-2001, 2001-2002.
Source: Kaiser/HRET Survey of Employer-Sponsored Health Benefits: 2000, 2001, 2002; KPMG Survey of Employer-Sponsored Health Benefits: 1988, 1993, 1996.
Chart #4
California Employers Health Benefits Survey 2000
Employer Health Benefits, 2002
$663
$588
$529
$463$442
$367
$197
$89
$255$221$202
$173$170
$0
$100
$200
$300
$400
$500
$600
$700
1996 2000 2001 20021993
Average Monthly Premium Costs for Covered Workers, 1988-2002
* Estimate is statistically different from the previous year shown: 1988-1993, 1993-1996, 1996-2000, 2000-2001, 2001-2002.
Source: Kaiser/HRET Survey of Employer-Sponsored Health Benefits: 2002. Data not available for 1993 Single Coverage. All data are nominal figures.
Chart #5
NA
1988
1998
// // // //
California Employers Health Benefits Survey 2000Employer Health Benefits 2002 Annual Survey
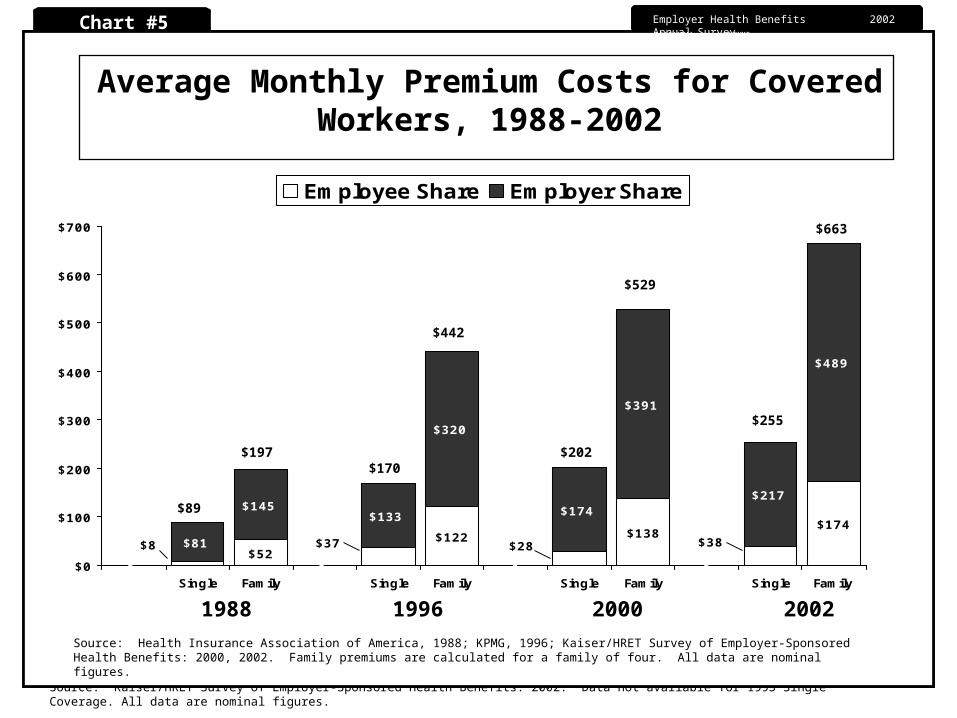
$174$138$122
$52
$489
$217
$391
$174
$320
$133$145
$81$8 $37 $28 $38
$0
$100
$200
$300
$400
$500
$600
$700
Family SingleFamilySingleFamilySingleFamilySingle
Employee Share Employer Share
Source: Health Insurance Association of America, 1988; KPMG, 1996; Kaiser/HRET Survey of Employer-Sponsored Health Benefits: 2000, 2002. Family premiums are calculated for a family of four. All data are nominal figures.
Average Monthly Premium Costs for Covered Workers, 1988-2002
1988 1996 2000 2002
$89
$197$170
$442
$202
$529
$255
$663

California Employers Health Benefits Survey 2000
Employer Health Benefits, 2002
Percentage of Covered Workers With a Choice of Conventional, HMO, PPO, or POS
Plans, 1988-2002
Chart #6
90%
68%
49%
71%76%
18%
46%
21%
59%
30%
45%
64%
52%
44% *
66% *
55% *
21% *
37% *
46% *
21%
53% *
16%
35%
0%
20%
40%
60%
80%
100%
Conventional HMO PPO POS
1988 1993 1996 2000 2001 2002
Source: KFF/HRET Survey of Employer-Sponsored Health Benefits: 2000, 2001, 2002; KPMG Survey of Employer-Sponsored Health Benefits: 1988, 1993, 1996.
10
* Estimate is statistically different from the previous year shown: 1996-2000, 2000-2001, 2001-2002.
^ Information was not obtained for POS plans in 1988.
^
California Employers Health Benefits Survey 2000
Employer Health Benefits, 2002
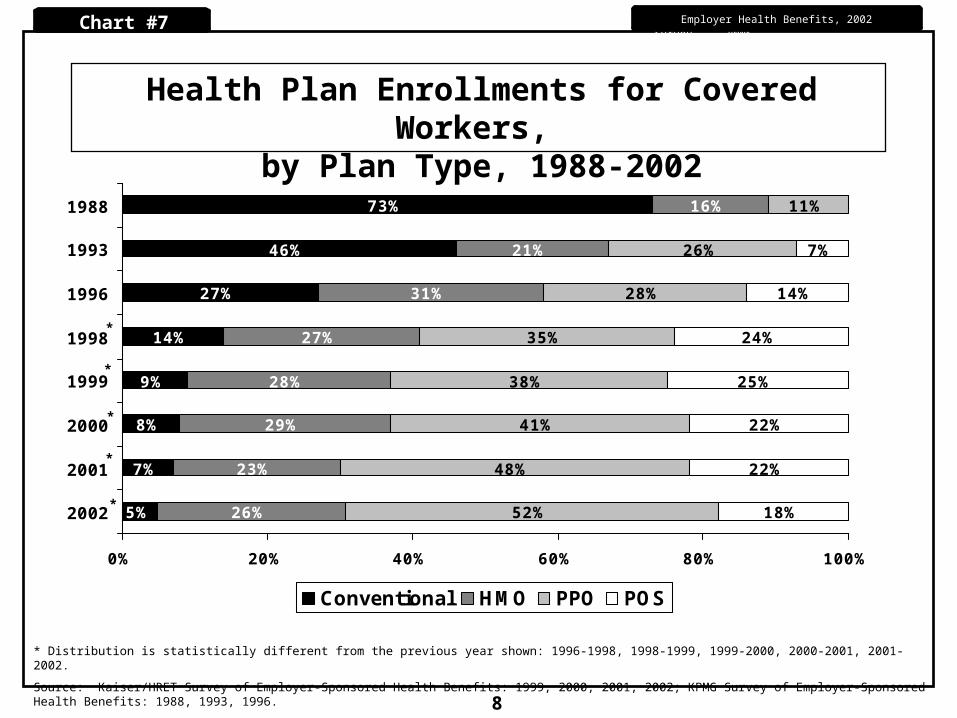
73%
46%
27%
14%
9%
8%
7%
5%
11%
26%
28%
35%
38%
41%
48%
52%
7%
14%
24%
25%
22%
22%
18%26%
23%
29%
28%
27%
31%
21%
16%
0% 20% 40% 60% 80% 100%
1988
1993
1996
1998
1999
2000
2001
2002
Conventional HMO PPO POS
Health Plan Enrollments for Covered Workers,
by Plan Type, 1988-2002
* Distribution is statistically different from the previous year shown: 1996-1998, 1998-1999, 1999-2000, 2000-2001, 2001-2002.
Source: Kaiser/HRET Survey of Employer-Sponsored Health Benefits: 1999, 2000, 2001, 2002; KPMG Survey of Employer-Sponsored Health Benefits: 1988, 1993, 1996.
Chart #7
8
*
*
*
*
*

California Employers Health Benefits Survey 2000
Employer Health Benefits, 2002Chart #8
12
Percentage of All Firms Offering Health Benefits, 1996-2002
59%65% 62%
67% *
55%
0%
20%
40%
60%
80%
1996 1998 2000 2001 2002
* Estimate is statistically different from the previous year shown: 1996-1998, 1998-2000, 2000-2001, 2001-2002.
Source: Kaiser/HRET Survey of Employer-Sponsored Health Benefits: 2000, 2001, 2002; KPMG Survey of Employer-Sponsored Health Benefits: 1996, 1998.
California Employers Health Benefits Survey 2000
Employer Health Benefits, 2002
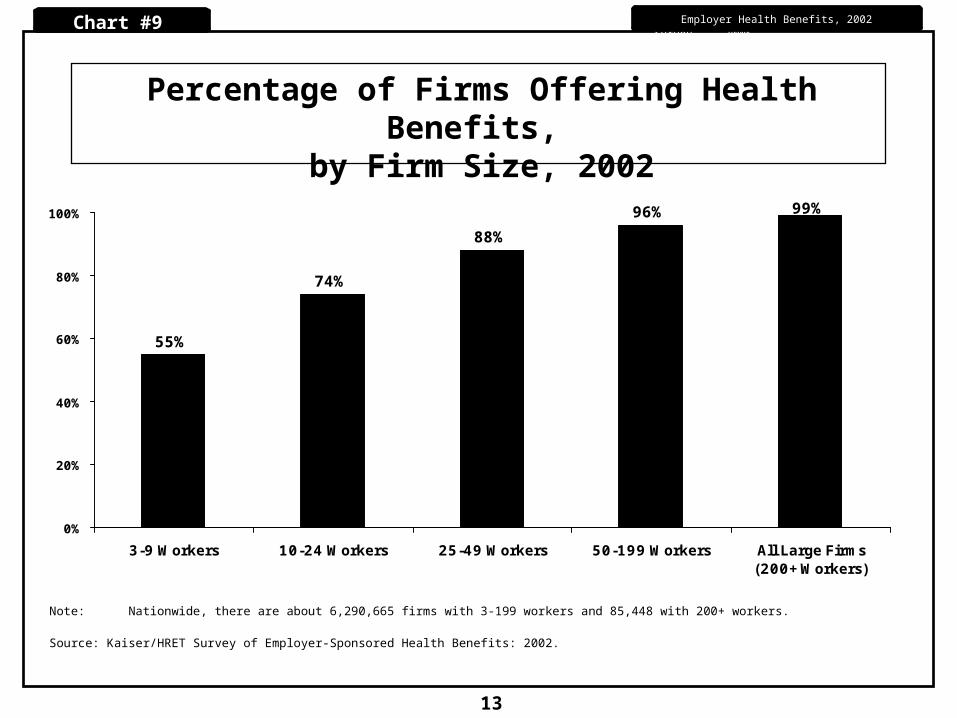
55%
74%
88%
96% 99%
0%
20%
40%
60%
80%
100%
3-9 Workers 10-24 Workers 25-49 Workers 50-199 Workers All Large Firms(200+Workers)
Note: Nationwide, there are about 6,290,665 firms with 3-199 workers and 85,448 with 200+ workers.
Percentage of Firms Offering Health Benefits,
by Firm Size, 2002
Source: Kaiser/HRET Survey of Employer-Sponsored Health Benefits: 2002.
Chart #9
13
California Employers Health Benefits Survey 2000
Employer Health Benefits, 2002
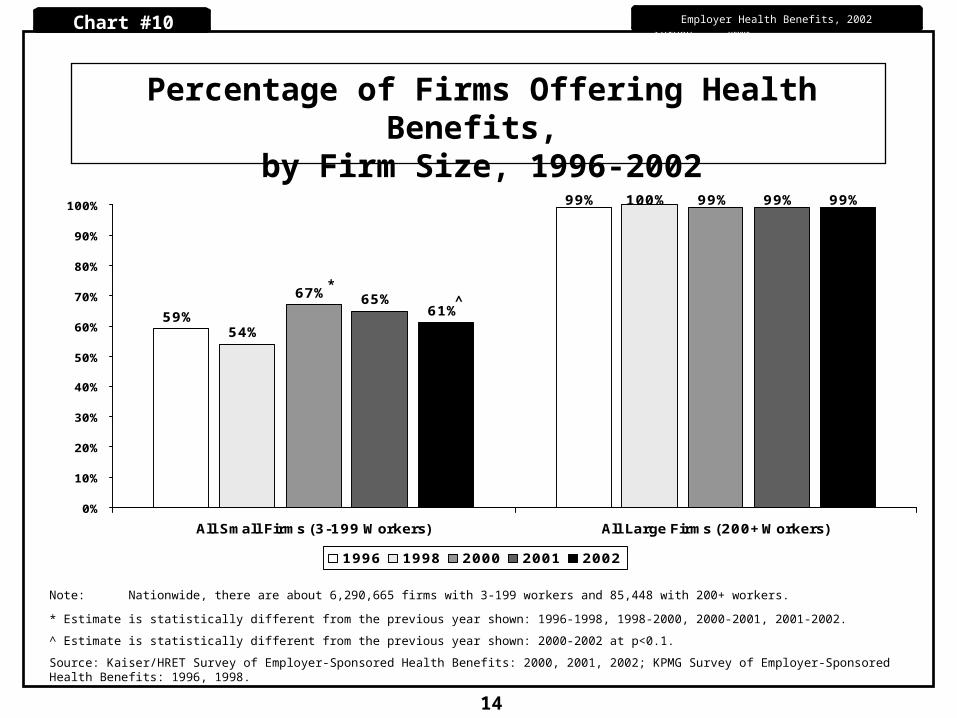
59%
99%
54%
100%
67%
99%
65%
99%
61%
99%
0%
10%
20%
30%
40%
50%
60%
70%
80%
90%
100%
All Small Firms (3-199 Workers) All Large Firms (200+Workers)
1996 1998 2000 2001 2002
Note: Nationwide, there are about 6,290,665 firms with 3-199 workers and 85,448 with 200+ workers.
Percentage of Firms Offering Health Benefits,
by Firm Size, 1996-2002
* Estimate is statistically different from the previous year shown: 1996-1998, 1998-2000, 2000-2001, 2001-2002.
^ Estimate is statistically different from the previous year shown: 2000-2002 at p<0.1.
Source: Kaiser/HRET Survey of Employer-Sponsored Health Benefits: 2000, 2001, 2002; KPMG Survey of Employer-Sponsored Health Benefits: 1996, 1998.
Chart #10
14
*^

California Employers Health Benefits Survey 2000
Employer Health Benefits, 2002
Even When a Firm Offers Health Benefits, Not All Workers Are Covered, 2002
67%
79%
84%
0% 10% 20% 30% 40% 50% 60% 70% 80% 90%
Overall % of Workers Covered
% of Eligible Workers WhoAccept Coverage
In Firms That Offer Coverage, %of Employees Who are Eligible
41%
3%
49% 49% 48%
9%10% *6%
0%
10%
20%
30%
40%
50%
60%
Part-Time Workers Temporary Workers
1999 2000 2001 2002
Percentage of Workers Employed in Firms That Offer Part-Time and Temporary Workers Health Coverage, 1999-2002
Source: Kaiser/HRET Survey of Employer-Sponsored Health Benefits: 2002.
* Estimate is statistically different from the previous year shown: 1999-2000, 2000-2001, 2001-2002.
Sources: Kaiser/HRET Survey of Employer-Sponsored Health Benefits: 1999, 2000, 2001, 2002.
Chart #11
15
California Employers Health Benefits Survey 2000
Employer Health Benefits, 2002
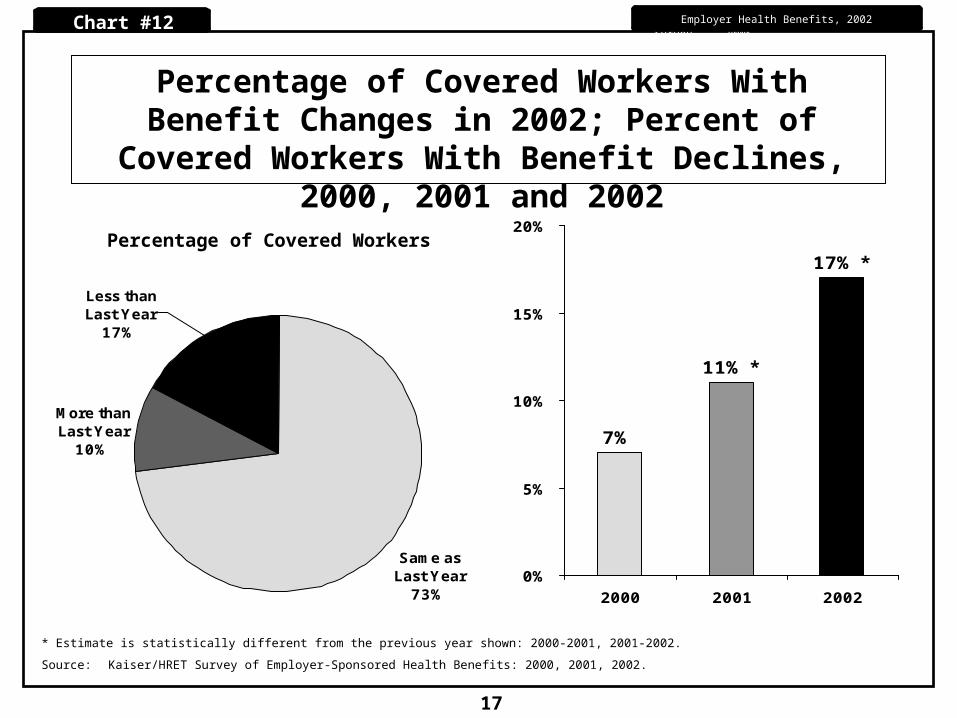
Percentage of Covered Workers With Benefit Changes in 2002; Percent of
Covered Workers With Benefit Declines, 2000, 2001 and 2002
7%
17% *
11% *
0%
5%
10%
15%
20%
2000 2001 2002
Same as Last Year
73%
Less than Last Year
17%
More than Last Year
10%
Chart #12
17
* Estimate is statistically different from the previous year shown: 2000-2001, 2001-2002.
Source: Kaiser/HRET Survey of Employer-Sponsored Health Benefits: 2000, 2001, 2002.
Percentage of Covered Workers

California Employers Health Benefits Survey 2000
Employer Health Benefits, 2002
Average Annual Deductibles for Single Coverage
in PPO and POS Plans, 1996 - 2002
Chart #13
$181
$313 $324
$79
$367
$84
$406
$488
$71
$361*
$187
$407*
$201
$276*
$59
$413
$0
$100
$200
$300
$400
$500
$600
PPO IN-PLAN PPO OUT-PLAN POS IN-PLAN POS OUT-PLAN
1996 2000 2001 2002
* Estimate is statistically different from the previous year shown: 1996-2000, 2000-2001, 2001-2002.
Source: Kaiser/HRET Survey of Employer-Sponsored Health Benefits: 2000, 2001, 2002; KPMG Survey of Employer Sponsored Health Benefits: 1996.
19
California Employers Health Benefits Survey 2000
Employer Health Benefits, 2002
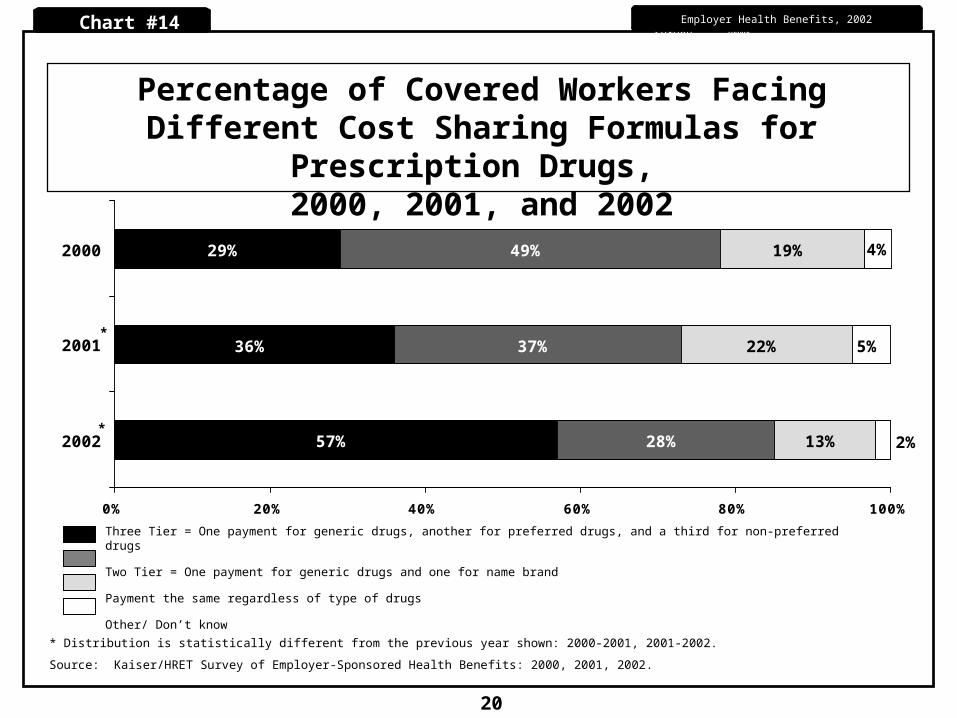
Percentage of Covered Workers Facing Different Cost Sharing Formulas for
Prescription Drugs, 2000, 2001, and 2002
* Distribution is statistically different from the previous year shown: 2000-2001, 2001-2002.
Source: Kaiser/HRET Survey of Employer-Sponsored Health Benefits: 2000, 2001, 2002.
Three Tier = One payment for generic drugs, another for preferred drugs, and a third for non-preferred drugs
Two Tier = One payment for generic drugs and one for name brand
Payment the same regardless of type of drugs
Other/ Don’t know
Chart #14
57%
36%
29%
28%
37%
49%
13%
22%
19%
5%
2%
4%
0% 20% 40% 60% 80% 100%
2002
2001
2000
20
*
*

California Employers Health Benefits Survey 2000
Employer Health Benefits, 2002
Average Copayments for Generic Drugs, Preferred Drugs, and Non-Preferred Drugs,
2000, 2001, and 2002
* Estimate is statistically different from the previous year shown by drug tier: 2000-2001, 2001-2002.
Source: Kaiser/HRET Survey of Employer-Sponsored Health Benefits: 2000, 2001, 2002.
Chart #15
21
$8
$14$16
$9* $8*
$17* $15*
$26*
$20*
$0
$5
$10
$15
$20
$25
$30
2000 2001 2002
Generic Drugs Preferred Drugs Non-Preferred Drugs
California Employers Health Benefits Survey 2000
Employer Health Benefits, 2002
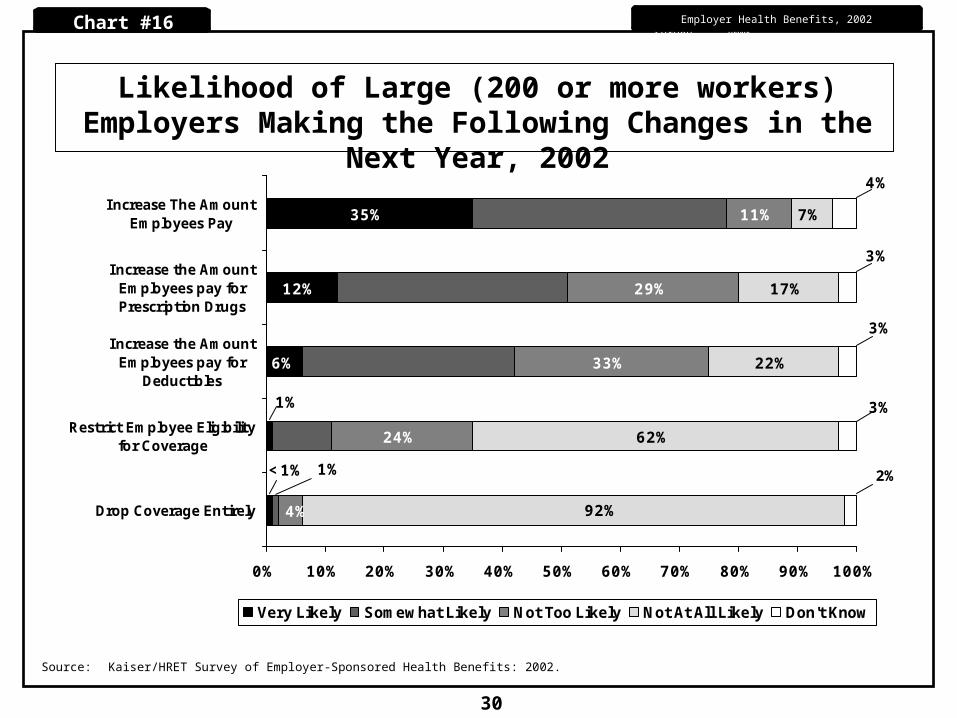
Likelihood of Large (200 or more workers) Employers Making the Following Changes in the
Next Year, 2002
12%
35%
24%
33%
29%
11%
62%
22%
17%
7%
1% 3%
6%
1%
4% 92%
<1%
3%
4%
3%
0% 10% 20% 30% 40% 50% 60% 70% 80% 90% 100%
Drop Coverage Entirely
Restrict Employee Eligibilityfor Coverage
Increase the AmountEmployees pay for
Deductibles
Increase the AmountEmployees pay forPrescription Drugs
Increase The AmountEmployees Pay
Very Likely Somewhat Likely Not Too Likely Not At All Likely Don't Know
3%
Source: Kaiser/HRET Survey of Employer-Sponsored Health Benefits: 2002.
30
Chart #16
2%
California Employers Health Benefits Survey 2000
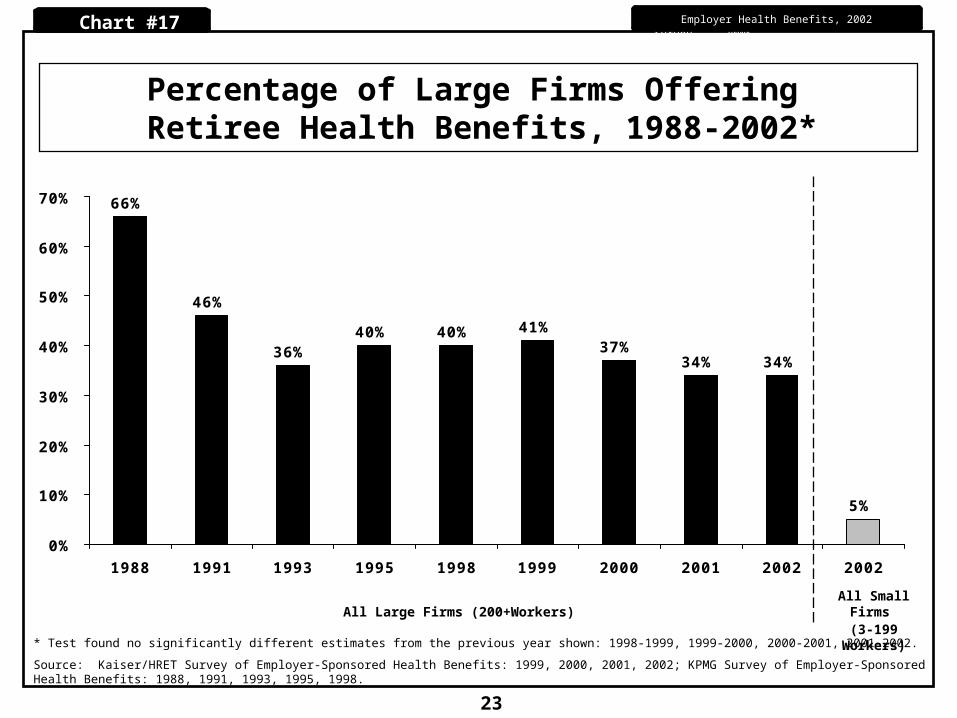
Employer Health Benefits, 2002Chart #17
66%
46%
36%40% 40% 41%
37%34% 34%
5%
0%
10%
20%
30%
40%
50%
60%
70%
1988 1991 1993 1995 1998 1999 2000 2001 2002 2002
Percentage of Large Firms Offering Retiree Health Benefits, 1988-2002*
All Large Firms (200+Workers)All Small Firms
(3-199 Workers)
23
* Test found no significantly different estimates from the previous year shown: 1998-1999, 1999-2000, 2000-2001, 2001-2002.
Source: Kaiser/HRET Survey of Employer-Sponsored Health Benefits: 1999, 2000, 2001, 2002; KPMG Survey of Employer-Sponsored Health Benefits: 1988, 1991, 1993, 1995, 1998.

California Employers Health Benefits Survey 2000
Employer Health Benefits, 2002
Percentage of Large Employers Offering Retiree Health Benefits, by Type of Employee/Retiree
Note: Based on responses from private-sector firms with 1,000 or more employees that offer retiree health benefits.SOURCE: Kaiser/Hewitt 2002 Retiree Health Survey, December 2002.
Chart #18
Pre-65 Only9%
Both Pre-65
and 65+91%
California Employers Health Benefits Survey 2000
Employer Health Benefits, 2002
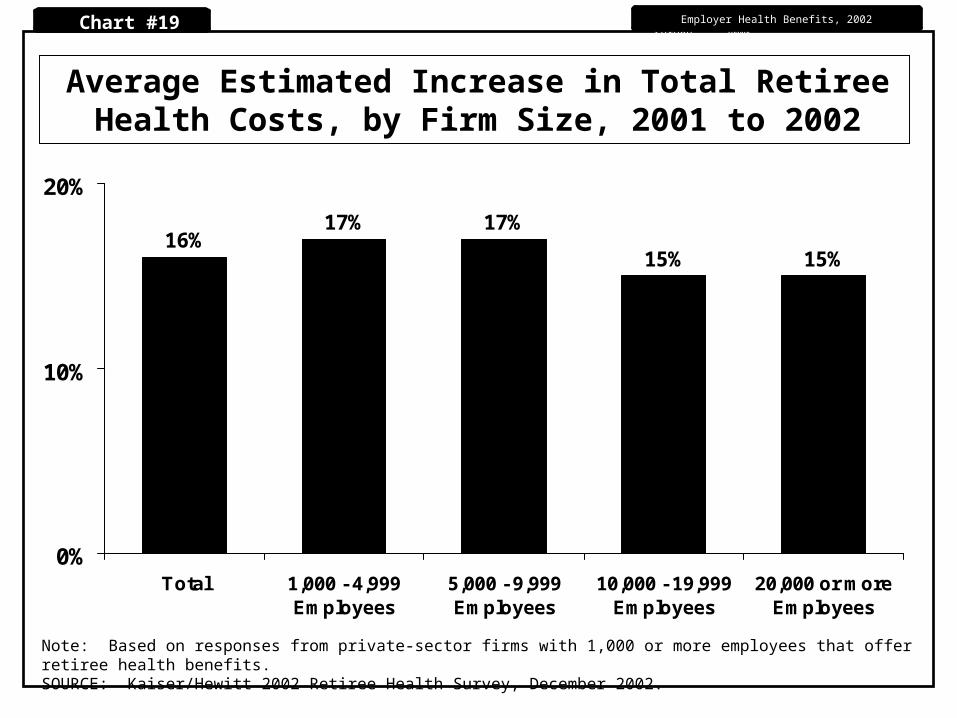
Average Estimated Increase in Total Retiree Health Costs, by Firm Size, 2001 to 2002
16%17% 17%
15% 15%
0%
10%
20%
Total 1,000 - 4,999Employees
5,000 - 9,999Employees
10,000 - 19,999Employees
20,000 or moreEmployees
Note: Based on responses from private-sector firms with 1,000 or more employees that offer retiree health benefits. SOURCE: Kaiser/Hewitt 2002 Retiree Health Survey, December 2002.
Chart #19
California Employers Health Benefits Survey 2000
Employer Health Benefits, 2002
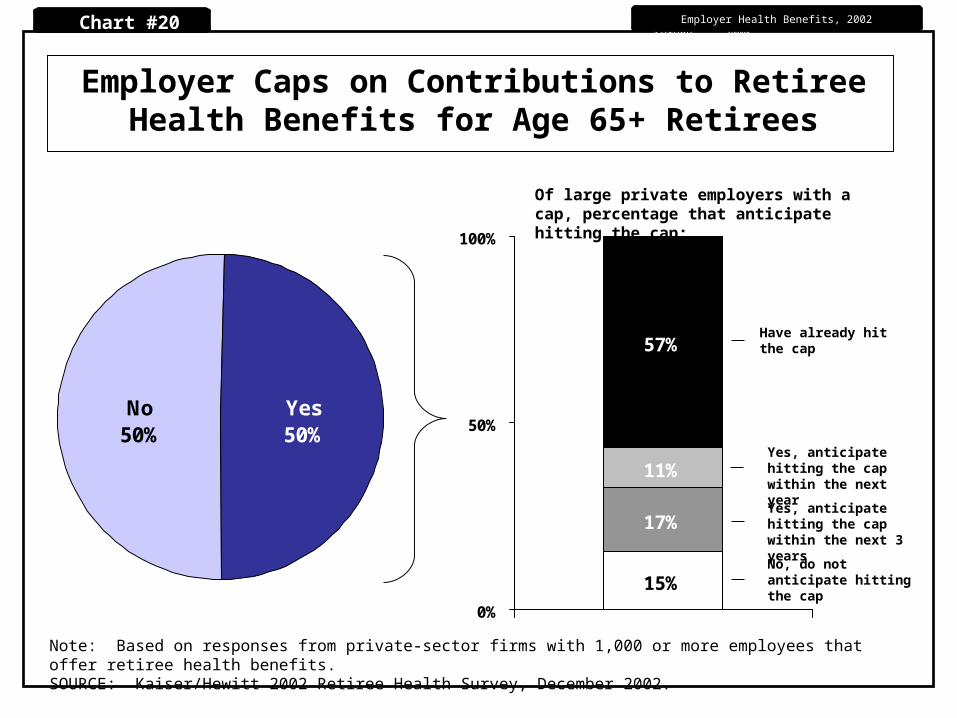
Employer Caps on Contributions to Retiree Health Benefits for Age 65+ Retirees
No50%
Yes50%
15%
11%
57%
17%
0%
50%
100%
Have already hit the cap
Yes, anticipate hitting the cap within the next year
Yes, anticipate hitting the cap within the next 3 years
No, do not anticipate hitting the cap
Of large private employers with a cap, percentage that anticipate hitting the cap:
Note: Based on responses from private-sector firms with 1,000 or more employees that offer retiree health benefits. SOURCE: Kaiser/Hewitt 2002 Retiree Health Survey, December 2002.
Chart #20
California Employers Health Benefits Survey 2000
Employer Health Benefits, 2002
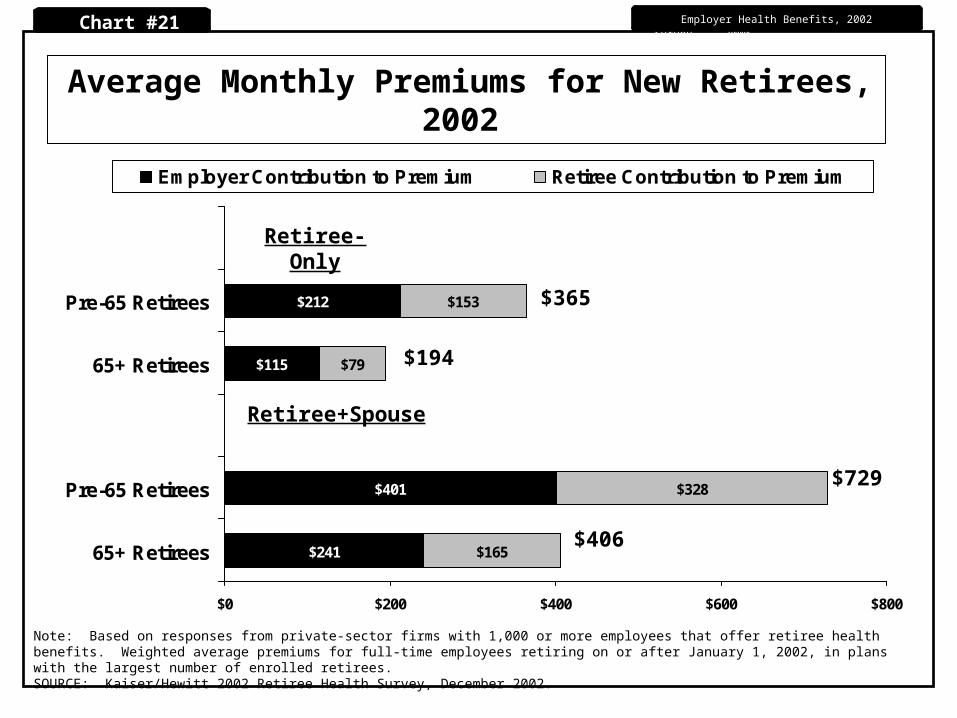
Average Monthly Premiums for New Retirees, 2002
$241
$401
$115
$212
$165
$328
$79
$153
$0 $200 $400 $600 $800
65+ Retirees
Pre-65 Retirees
65+ Retirees
Pre-65 Retirees
Employer Contribution to Premium Retiree Contribution to Premium
Note: Based on responses from private-sector firms with 1,000 or more employees that offer retiree health benefits. Weighted average premiums for full-time employees retiring on or after January 1, 2002, in plans with the largest number of enrolled retirees.SOURCE: Kaiser/Hewitt 2002 Retiree Health Survey, December 2002.
$194
$365
$406
$729
Retiree-Only
Retiree+Spouse
Chart #21
California Employers Health Benefits Survey 2000
Employer Health Benefits, 2002
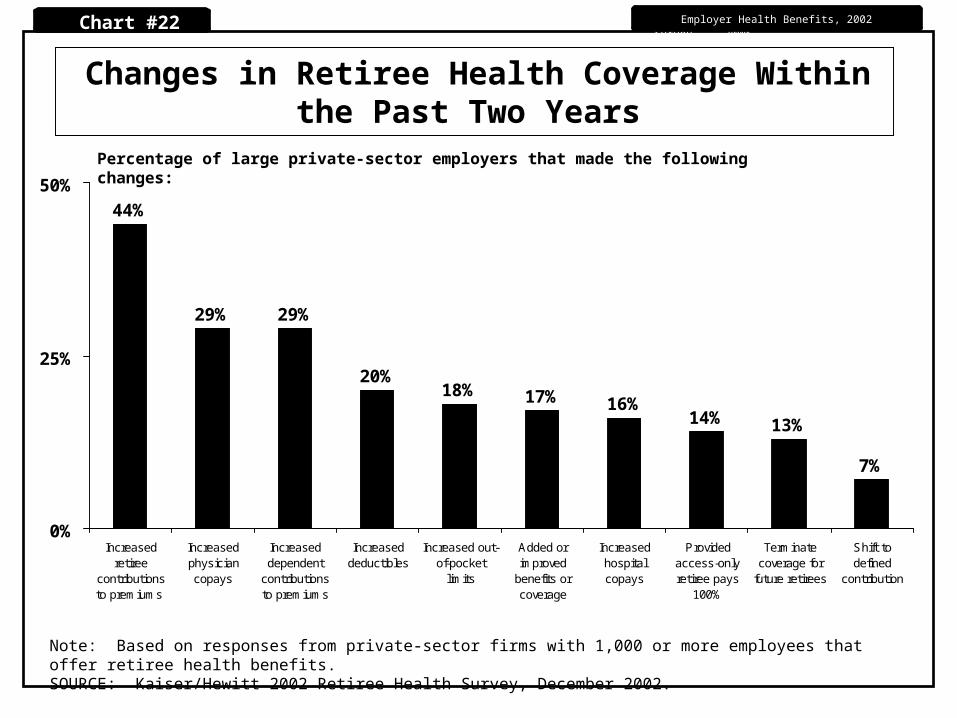
Changes in Retiree Health Coverage Within the Past Two Years
Note: Based on responses from private-sector firms with 1,000 or more employees that offer retiree health benefits. SOURCE: Kaiser/Hewitt 2002 Retiree Health Survey, December 2002.
44%
29% 29%
20%18% 17% 16%
14% 13%
7%
0%
25%
50%
Increasedretiree
contributionsto premiums
Increasedphysiciancopays
Increaseddependent
contributionsto premiums
Increaseddeductibles
Increased out-of-pocket
limits
Added orimproved
benefits orcoverage
Increasedhospitalcopays
Providedaccess-onlyretiree pays
100%
Terminatecoverage for
future retirees
Shift todefined
contribution
Percentage of large private-sector employers that made the following changes:
Chart #22
California Employers Health Benefits Survey 2000
Employer Health Benefits, 2002
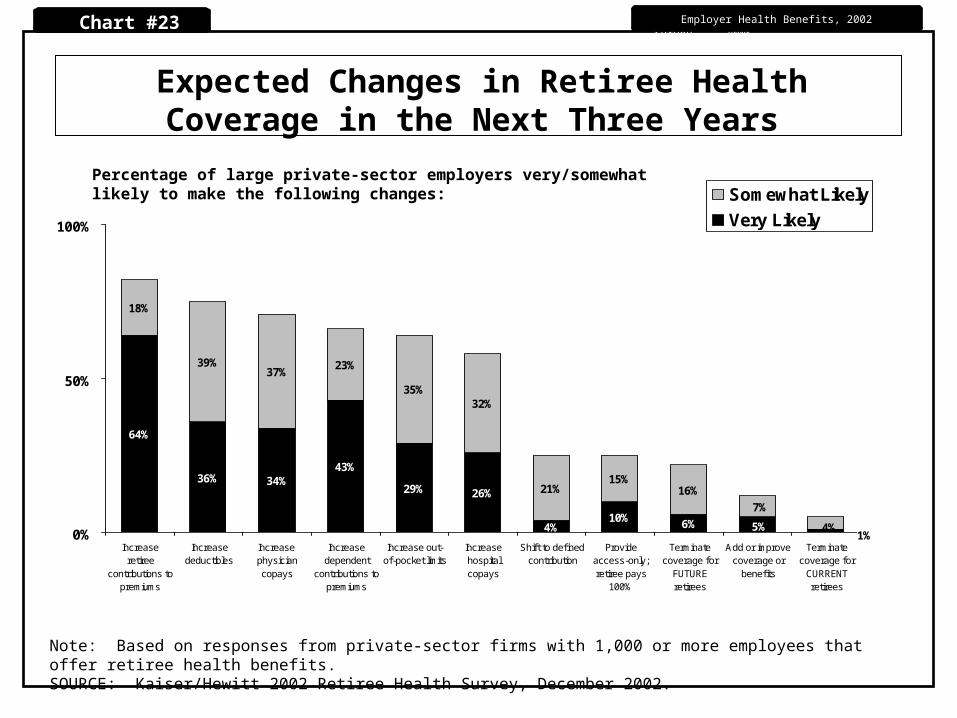
Expected Changes in Retiree Health Coverage in the Next Three Years
Note: Based on responses from private-sector firms with 1,000 or more employees that offer retiree health benefits. SOURCE: Kaiser/Hewitt 2002 Retiree Health Survey, December 2002.
64%
36% 34%43%
29% 26%
4%10% 6%
18%
39%37%
23%
35%32%
21%15%
16%
5%1%
7%
4%0%
50%
100%
Increaseretiree
contributions topremiums
Increasedeductibles
Increase physiciancopays
Increasedependent
contributions topremiums
Increase out-of-pocket limits
Increasehospitalcopays
Shift to definedcontribution
Provideaccess-only;retiree pays
100%
Terminatecoverage for
FUTUREretirees
Add or improvecoverage or
benefits
Terminatecoverage for
CURRENTretirees
Somewhat Likely
Very Likely
Percentage of large private-sector employers very/somewhat likely to make the following changes:
Chart #23