Embed Size (px)
Citation preview
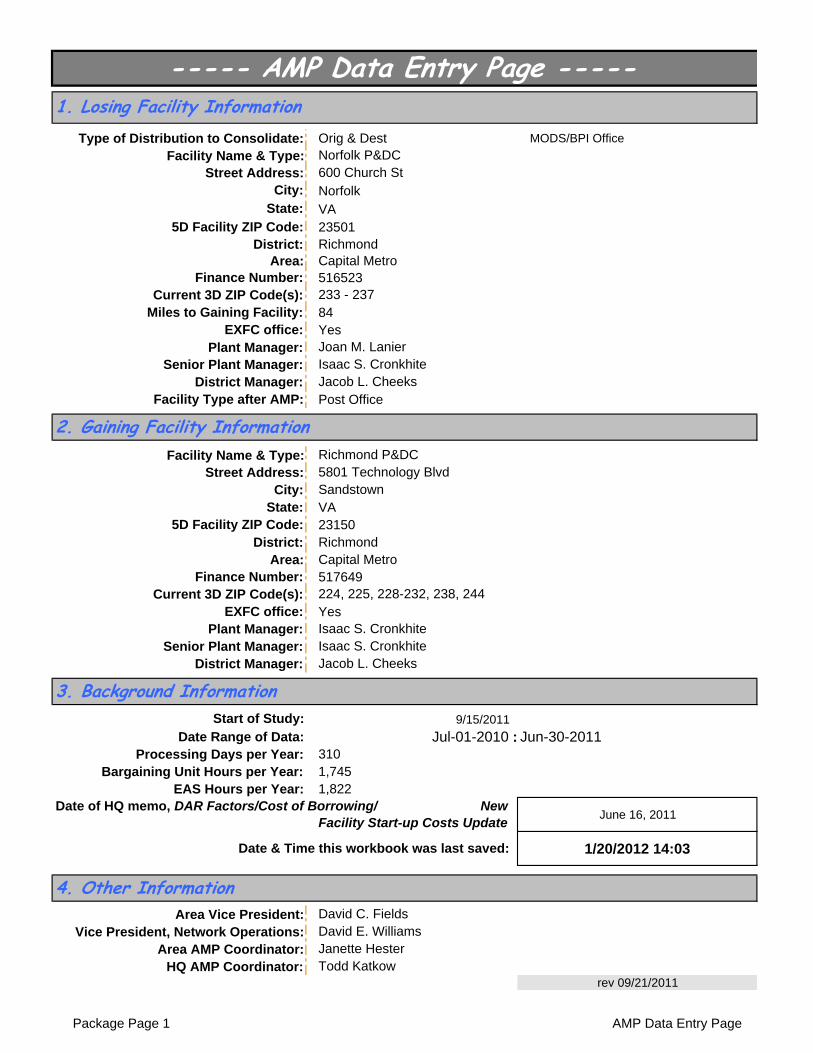
Type of Distribution to Consolidate: Orig & Dest MODS/BPI Office
Facility Name & Type:Street Address:
City: Norfolk State: VA
5D Facility ZIP Code: 23501District: Richmond
Area: Capital Metro Finance Number: 516523
Current 3D ZIP Code(s):Miles to Gaining Facility: 84
EXFC office: YesPlant Manager:
Senior Plant Manager:District Manager:
Facility Type after AMP: Post Office
Facility Name & Type:Street Address:
City:State: VA
5D Facility ZIP Code: 23150District: Richmond
Area: Capital Metro Finance Number: 517649
Current 3D ZIP Code(s):EXFC office: Yes
Plant Manager:Senior Plant Manager:
District Manager:
Start of Study: 9/15/2011
Date Range of Data: Jul-01-2010 : Jun-30-2011Processing Days per Year: 310
Bargaining Unit Hours per Year: 1,745EAS Hours per Year: 1,822
June 16, 2011
1/20/2012 14:03
Area Vice President:Vice President, Network Operations:
Area AMP Coordinator:HQ AMP Coordinator:
rev 09/21/2011
Janette Hester
Date & Time this workbook was last saved:
3. Background Information
Date of HQ memo, DAR Factors/Cost of Borrowing/ New Facility Start-up Costs Update
4. Other Information
Isaac S. Cronkhite
Sandstown
224, 225, 228-232, 238, 244
2. Gaining Facility Information
Todd Katkow
233 - 237
Isaac S. CronkhiteJacob L. Cheeks
David C. FieldsDavid E. Williams
Jacob L. Cheeks
Richmond P&DC5801 Technology Blvd
Isaac S. Cronkhite
Norfolk P&DC600 Church St
Joan M. Lanier
1. Losing Facility Information
----- AMP Data Entry Page -----
Package Page 1 AMP Data Entry Page
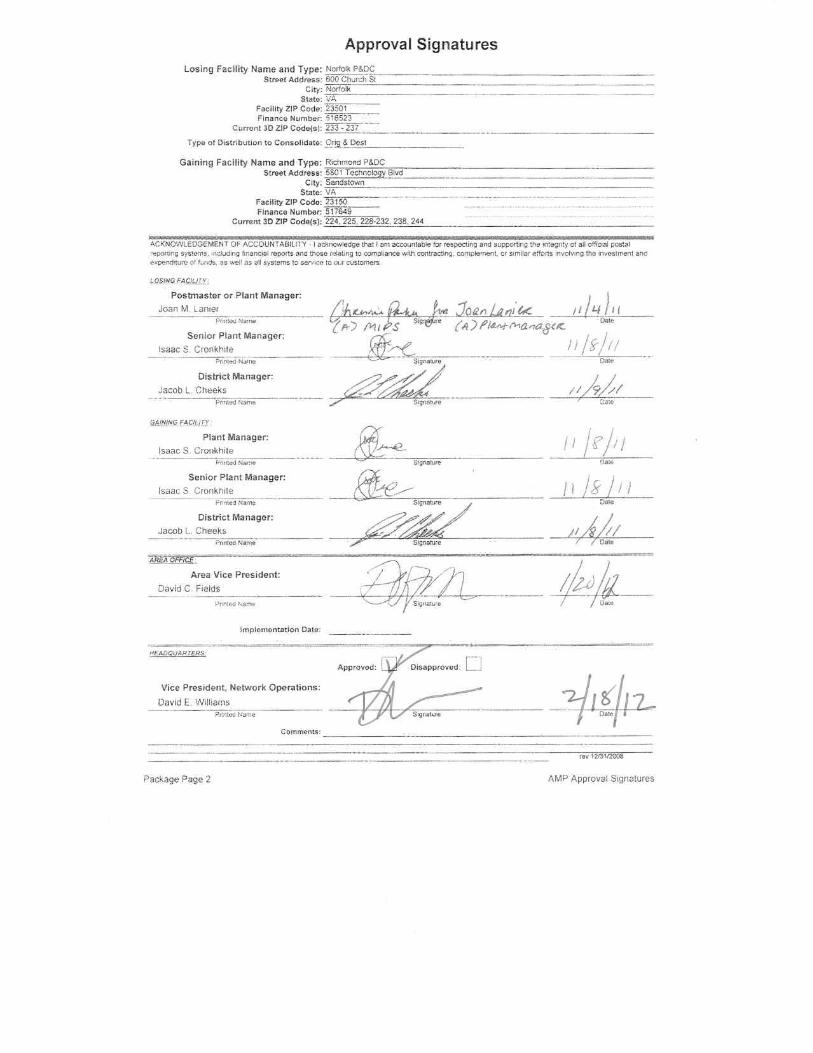

Losing Facility Name and Type:Street Address:
City, State:
Current 3D ZIP Code(s):
Type of Distribution to Consolidate:
Gaining Facility Name and Type:Current 3D ZIP Code(s):
= $11,028,238
= $62,006
= $1,590,398
= ($3,971,103) from Transportation (HCR and PVS)
= $1,285,600 from Maintenance
= $0 from Space Evaluation and Other Costs
= $9,995,138
= $1,777,124 from Space Evaluation and Other Costs
= $8,218,014
= 187 from Staffing - Craft
= 4 from Staffing - PCES/EAS
= 2,469,039 from Workhour Costs - Current
= 5,060,507 from Workhour Costs - Current
= 298,804
ADV ADV ADV %
First-Class Mail® 0 0 0 #DIV/0!
Priority Mail® 0 0 0 #DIV/0!
Package Services 0 0 0 #DIV/0!
Periodicals N/A* N/A* N/A* N/A*
Standard Mail N/A* N/A* N/A* N/A*Code to destination 3-digit ZIP Code volume is not
available
Service
rev 10/15/2009
Total FHP to be Transferred (Average Daily Volume)
Current FHP at Gaining Facility (Average Daily Volume)
Losing Facility Cancellation Volume (Average Daily Volume) (= Total TPH / Operating Days)
Service Standard Impacts by ADV
UPGRADED DOWNGRADEDUnchanged +
Upgrades
Staffing Positions
Craft Position Loss
PCES/EAS Position Loss
Volume
Space Savings
Total Annual Savings
Total One-Time Costs
Total First Year Savings
PCES/EAS Supervisory Workhour Savings from Other Curr vs Prop
Transportation Savings
Maintenance Savings
Savings/CostsMail Processing Craft Workhour Savings from Workhour Costs - Proposed
Non-MP Craft/EAS + Shared LDCs Workhour Savings (less Maint/Trans) from Other Curr vs Prop
84
Richmond P&DC
224, 225, 228-232, 238, 244
Summary of AMP Worksheets
Unchanged + Upgrades
Executive SummaryLast Saved: January 20, 2012
Norfolk P&DC
600 Church St
Norfolk , VA
233 - 237
Orig & Dest Miles to Gaining Facility:
Package Page 3 AMP Executive Summary

Losing Facility Name and Type:Current 3D ZIP Code(s):
Type of Distribution to Consolidate:
Gaining Facility Name and Type:Current 3D ZIP Code(s):
rev 06/10/2009
Summary NarrativeLast Saved:
Norfolk P&DC
Richmond P&DC
233 - 237
January 20, 2012
224, 225, 228-232, 238, 244
Orig & Dest
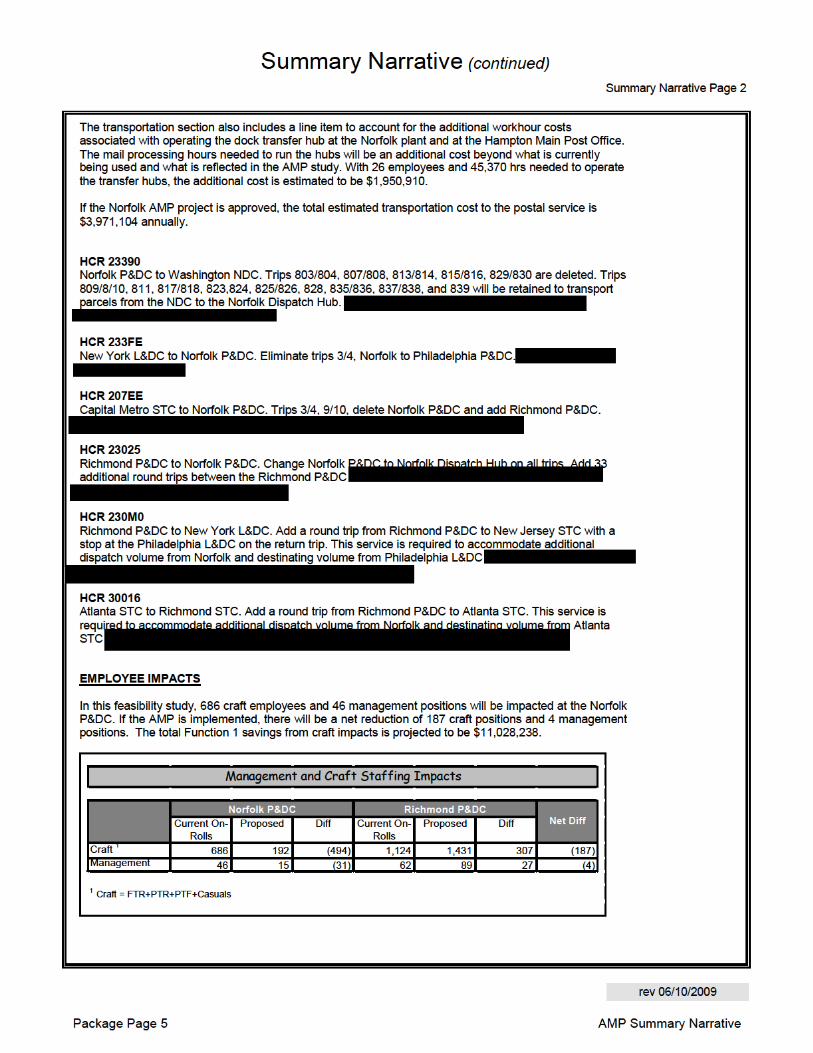
BACKGROUND The Richmond Performance Cluster with the assistance of the Capital Metro Area office have completedan Area Mail Processing (AMP) feasibility study for the consolidation of originating and destinating mailprocessing from Norfolk P&DC (ZIPs 233, 234, 235, 236 and 237) to Richmond VA P&DC (ZIPs 224,225, 228-232, 238-239 and 244). The Richmond P&DC is approximately 84 miles from the Norfolk P&DC. The Norfolk P&DC is a facility with approximately 232,981 square feet of space. The property is owned bythe United States Postal Service (USPS). The Norfolk P&DC and the Hampton Main Post Office will be used as a dock transfer hub. One APBS willbe left at the Norfolk P&DC as this facility will also be used to process outgoing and incoming Priority forthe Norfolk area. FINANCIAL SUMMARY The annual baseline data for this AMP feasibility study is taken from the period of July 1, 2010 – June 30, 2011. Financial savings proposed for the consolidation of an average daily volume of 2,469,039 FHP from the Norfolk P&DC into the Richmond P&DC are: Total First Year Savings $8,218,014 Total Annual Savings $9,995,138 A one-time cost of $1,777,124 will be incurred for the relocation of and site prep for mail processingequipment transferred from the Norfolk P&DC to the Richmond P&DC. CUSTOMER & SERVICE IMPACTS The Norfolk P&DC will be retained as the Norfolk Hub and Norfolk Post Office (Finance #51-6522). In addition, the Express (Dest &Orig) operation will be maintained in the hub along with completing customer MTECH requests. There will be no change to the current retail (window) operations or hours and availability times for the Norfolk PO (Finance #51-6522). PO Box customers will remain as current. Caller service and mail acceptance times/locations/hours will remain as current (Norfolk PO). No delivery and collection modifications are anticipated for the Norfolk Service Area. Local collection box pickup times will remain unchanged and a local postmark will continue to be available at the retail service locations. The resources necessary to perform the BMEU functions assigned to this unit are provided for in the Norfolk Post Office existing staffing and operations budget, Finance #51-6522. The additional drop shipments will be accommodated by expanding the drop shipmentwindow. TRANSPORTATION The transportation analysis is based on the assumption that the current Norfolk P&DC facility will be retained to serve as a processing facility for originating and destinating priority mail and a dispatch hub for the 233-237 service area. Full PVS operations will remain in Norfolk to support the dispatch hub along with establishing a hub operation at the Hampton Main Post Office. All current HCR routes serving NorfolkAO's will also be maintained. Existing HCR network contracts will be maintained to support outbound and inbound Priority operations in Norfolk. The proposed transportation to support the AMP will be operated at an increased annual cost of $2,020,193.
Package Page 4 AMP Summary Narrative


Last Saved:
Losing Facility Name and Type:Current 3D ZIP Code(s):
Miles to Gaining Facility:
Gaining Facility Name and Type:Current 3D ZIP Code(s):
rev 03/20/2008
224, 225, 228-232, 238, 244
MAP
Norfolk P&DC
Richmond P&DC
233 - 237
January 20, 2012
84
Package Page 8 AMP MAP

Overnight % Change All Others % Change Total % Change All % Change All % Change All % Change All % Change All % Change
UPGRADE
DOWNGRADE
TOTAL
NET UP+NO CHNG
VOLUME TOTAL
* - Periodical and Standard mail origin 3-digit ZIP Code to destination 3-digit ZIP Code volume is not available
Overnight % Change All Others % Change Total % Change All % Change All % Change All % Change All % Change All % Change
UPGRADE
DOWNGRADE
TOTAL
NET
Service Standard Impacts
PRI ALL CLASSESSTD *FCM PER *
Based on report prepared by Network Integration Support dated:
Last Saved:
PER STD
January 20, 2012
Losing Facility:
PSVC ALL CLASSES
rev 10/16/2009
Losing Facility 3D ZIP Code(s):
mm/dd/yyyy
Selected summary fields are transferred to the Executive Summary
Norfolk P&DC
233 - 237224, 225, 228-232, 238, 244Gaining Facility 3D ZIP Code(s):
Service Standard Changes - PairsFCM PRI
PSVC
Service Standard Changes - Average Daily Volume (data obtained from ODIS is derived from sampling and may vary from actual volume)
Package Page 9 AMP Service Standard Impacts

Last Saved: Stakeholder Notification Page 1
AMP Event: Start of Study
rev 07/16/2008
Norfolk P&DC
Stakeholders Notification Losing Facility:
January 20, 2012(WorkBook Tab Notification - 1)
Package Page 10 AMP Stakeholders Notification
Last Saved:
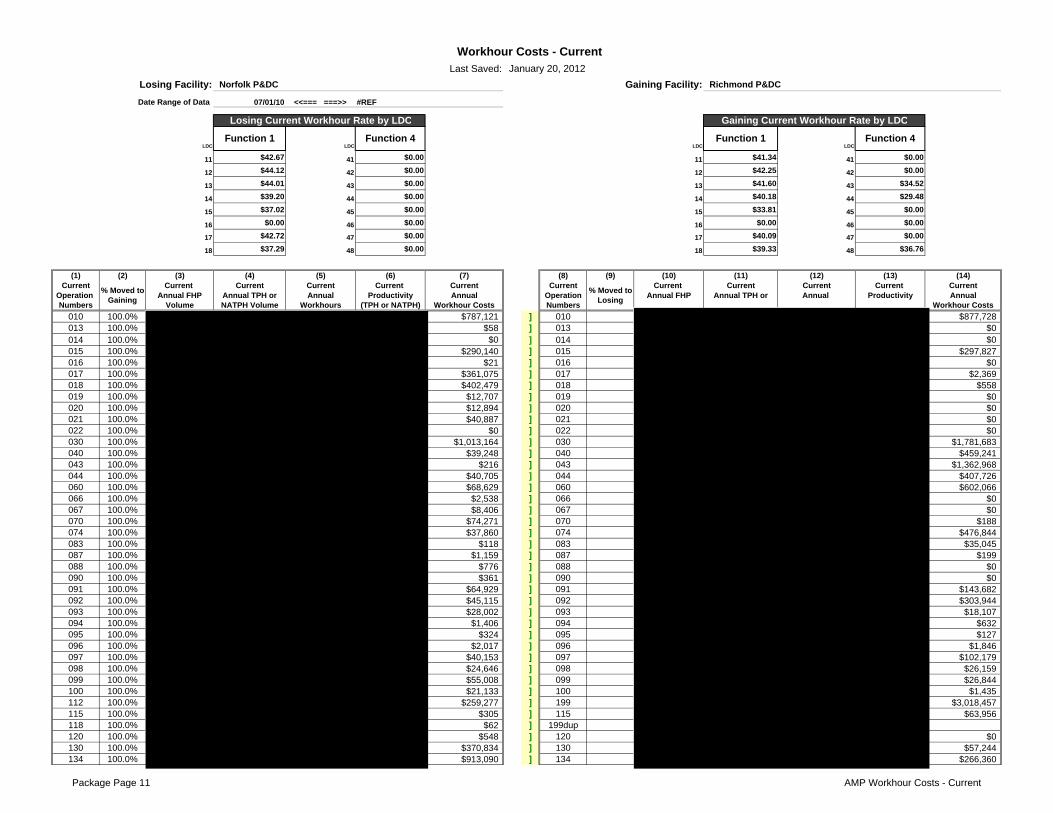
07/01/10 <<=== ===>> #REF
LDC LDC LDC LDC
11 $42.67 41 $0.00 11 $41.34 41 $0.00
12 $44.12 42 $0.00 12 $42.25 42 $0.00
13 $44.01 43 $0.00 13 $41.60 43 $34.52
14 $39.20 44 $0.00 14 $40.18 44 $29.48
15 $37.02 45 $0.00 15 $33.81 45 $0.00
16 $0.00 46 $0.00 16 $0.00 46 $0.00
17 $42.72 47 $0.00 17 $40.09 47 $0.00
18 $37.29 48 $0.00 18 $39.33 48 $36.76
(1) (2) (3) (4) (5) (6) (7) (8) (9) (10) (11) (12) (13) (14)Current Current Current Current Current Current Current Current Current Current Current Current
Operation Annual FHP Annual TPH or Annual Productivity Annual Operation Annual FHP Annual TPH or Annual Productivity AnnualNumbers Volume NATPH Volume Workhours (TPH or NATPH) Workhour Costs Numbers Workhour Costs
010 100.0% $787,121 ] 010 $877,728013 100.0% $58 ] 013 $0014 100.0% $0 ] 014 $0015 100.0% $290,140 ] 015 $297,827016 100.0% $21 ] 016 $0017 100.0% $361,075 ] 017 $2,369018 100.0% $402,479 ] 018 $558019 100.0% $12,707 ] 019 $0020 100.0% $12,894 ] 020 $0021 100.0% $40,887 ] 021 $0022 100.0% $0 ] 022 $0030 100.0% $1,013,164 ] 030 $1,781,683040 100.0% $39,248 ] 040 $459,241043 100.0% $216 ] 043 $1,362,968044 100.0% $40,705 ] 044 $407,726060 100.0% $68,629 ] 060 $602,066066 100.0% $2,538 ] 066 $0067 100.0% $8,406 ] 067 $0070 100.0% $74,271 ] 070 $188074 100.0% $37,860 ] 074 $476,844083 100.0% $118 ] 083 $35,045087 100.0% $1,159 ] 087 $199088 100.0% $776 ] 088 $0090 100.0% $361 ] 090 $0091 100.0% $64,929 ] 091 $143,682092 100.0% $45,115 ] 092 $303,944093 100.0% $28,002 ] 093 $18,107094 100.0% $1,406 ] 094 $632095 100.0% $324 ] 095 $127096 100.0% $2,017 ] 096 $1,846097 100.0% $40,153 ] 097 $102,179098 100.0% $24,646 ] 098 $26,159099 100.0% $55,008 ] 099 $26,844100 100.0% $21,133 ] 100 $1,435112 100.0% $259,277 ] 199 $3,018,457115 100.0% $305 ] 115 $63,956118 100.0% $62 ] 199dup120 100.0% $548 ] 120 $0130 100.0% $370,834 ] 130 $57,244134 100.0% $913,090 ] 134 $266,360
Losing Facility: Gaining Facility:
Date Range of Data
Function 1
Gaining Current Workhour Rate by LDC
Function 4
% Moved to Losing
% Moved to Gaining
Losing Current Workhour Rate by LDC
Function 4Function 1
January 20, 2012
Workhour Costs - Current
Norfolk P&DC Richmond P&DC
Package Page 11 AMP Workhour Costs - Current


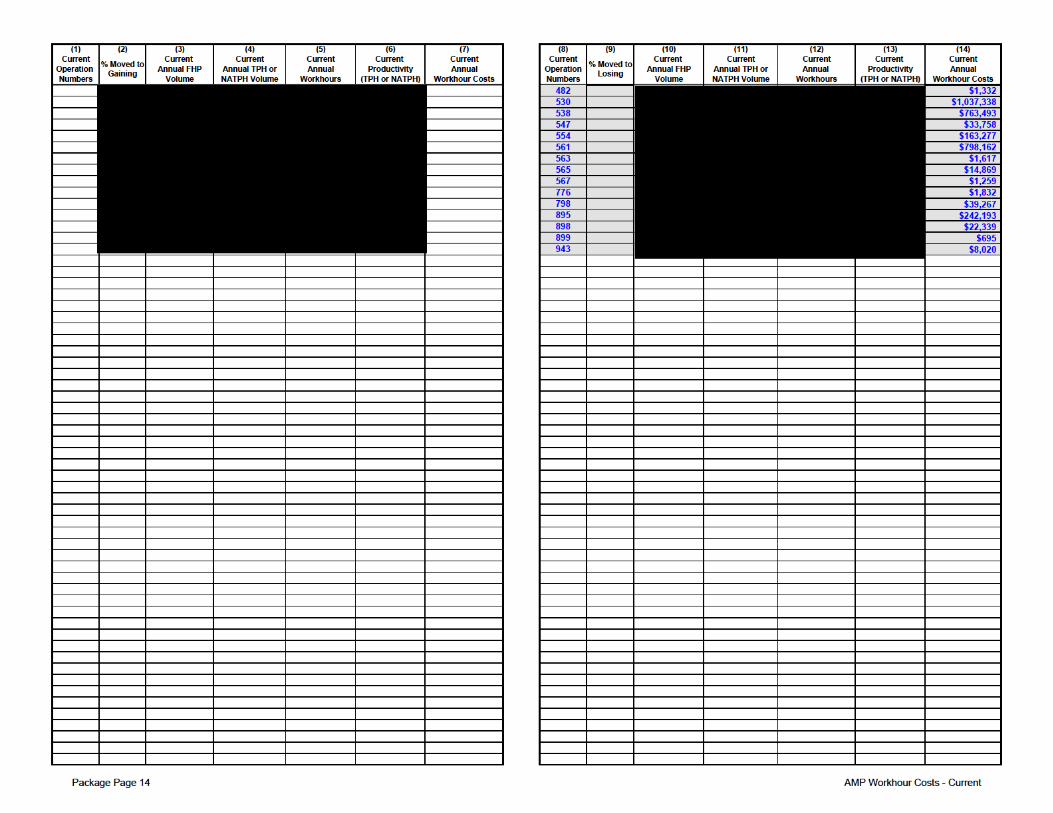

(1) (2) (3) (4) (5) (6) (7) (8) (9) (10) (11) (12) (13) (14)Current Current Current Current Current Current Current Current Current Current Current Current
Operation Annual FHP Annual TPH or Annual Productivity Annual Operation Annual FHP Annual TPH or Annual Productivity AnnualNumbers Volume NATPH Volume Workhours (TPH or NATPH) Workhour Costs Numbers Volume NATPH Volume Workhours (TPH or NATPH) Workhour Costs
% Moved to Losing
% Moved to Gaining
Package Page 15 AMP Workhour Costs - Current

(1) (2) (3) (4) (5) (6) (7) (8) (9) (10) (11) (12) (13) (14)Current Current Current Current Current Current Current Current Current Current Current Current
Operation Annual FHP Annual TPH or Annual Productivity Annual Operation Annual FHP Annual TPH or Annual Productivity AnnualNumbers Volume NATPH Volume Workhours (TPH or NATPH) Workhour Costs Numbers Volume NATPH Volume Workhours (TPH or NATPH) Workhour Costs
% Moved to Losing
% Moved to Gaining
Moved to Gain 765,402,199 1,960,216,644 741,215 2,645 $31,144,440 Impact to Gain 1,462,488,643 3,097,602,567 1,111,631 2,787 $45,291,251Impact to Lose 0 0 0 No Calc $0 Moved to Lose 0 0 0 No Calc $0Total Impact 765,402,199 1,960,216,644 741,215 2,645 $31,144,440 Total Impact 1,462,488,643 3,097,602,567 1,111,631 2,787 $45,291,251Non-impacted 29,418,199 52,037,650 103,464 503 $4,222,439 Non-impacted 2,665,135 6,639,476 86,215 77 $3,472,510
Gain Only 103,603,387 190,716,181 329,598 579 $13,535,763All 794,820,398 2,012,254,294 844,679 2,382 $35,366,880 All 1,568,757,165 3,294,958,224 1,527,444 2,157 $62,299,524
Impact to Gain 2,227,890,842 5,057,819,211 1,852,846 2,730 $76,435,691Impact to Lose 0 0 0 No Calc $0Total Impact 2,227,890,842 5,057,819,211 1,852,846 2,730 $76,435,691Non-impacted 32,083,334 58,677,126 189,679 309 $7,694,949
Gain Only 103,603,387 190,716,181 329,598 579 $13,535,763All 2,363,577,563 5,307,212,518 2,372,123 2,237 $97,666,404
.
(This number is carried forward to the bottom of AMP Worksheet Workhour Costs-Proposed )$97,666,404
Current FHP at Gaining Facility (Average Daily Volume) : 5,060,507 (This number is carried forward to AMP Worksheet Executive Summary )
(This number is carried forward to AMP Worksheet Executive Summary )
Combined Current Workhour Annual Workhour Costs :
2,469,039 Total FHP to be Transferred (Average Daily Volume) :
Totals
rev 06/11/2008
Comb Totals
Totals
Package Page 16 AMP Workhour Costs - Current

Last Saved:
Losing Facility: Gaining Facility:
(1) (2) (3) (4) (5) (6) (7) (8) (9) (10) (11) (12)Proposed Proposed Proposed Proposed Proposed Proposed Proposed Proposed Proposed Proposed Proposed ProposedOperation Annual FHP Annual TPH or Annual Productivity Annual Operation Annual FHP Annual TPH or Annual Productivity AnnualNumbers Volume NATPH Volume Workhours (TPH or NATPH) Workhour Costs Numbers Volume NATPH Volume Workhours (TPH or NATPH) Workhour Costs
010 $0 010 $1,616,317013 $0 013 $0014 $0 014 $0015 $0 015 $435,106016 $0 016 $19017 $0 017 $341,181018 $0 018 $378,222019 $0 019 $11,923020 $0 020 $6,050021 $0 021 $19,183022 $0 022 $0030 $0 030 $2,735,470040 $0 040 $484,482043 $0 043 $1,322,294044 $0 044 $435,960060 $0 060 $652,232066 $0 066 $7,336067 $0 067 $6,717070 $0 070 $74,018074 $0 074 $500,177083 $0 083 $35,170087 $0 087 $1,675088 $0 088 $0090 $0 090 $359091 $0 091 $177,841092 $0 092 $203,032093 $0 093 $96,739094 $0 094 $10,344095 $0 095 $6,828096 $0 096 $10,718097 $0 097 $162,975098 $0 098 $107,408099 $0 099 $206,090100 $0 100 $22,402112 $0 199 $2,535,095115 $0 115 $64,243118 $0 199dup $0120 $0 120 $257130 $0 130 $424,191134 $0 134 $739,818135 $0 135 $0136 $0 136 $42,266137 $0 137 $2,422,258140 $0 140 $6,961,415141 $0 141 $198,044142 $0 142 $49,385143 $0 143 $373,718144 $0 144 $512,068145 $0 144dup $0
Richmond P&DC
Workhour Costs - Proposed
Norfolk P&DC
January 20, 2012
Package Page 17 AMP Workhour Costs - Proposed


(1) (2) (3) (4) (5) (6) (7) (8) (9) (10) (11) (12)Proposed Proposed Proposed Proposed Proposed Proposed Proposed Proposed Proposed Proposed Proposed ProposedOperation Annual FHP Annual TPH or Annual Productivity Annual Operation Annual FHP Annual TPH or Annual Productivity AnnualNumbers Volume NATPH Volume Workhours (TPH or NATPH) Workhour Costs Numbers Volume NATPH Volume Workhours (TPH or NATPH) Workhour Costs
0 No Calc 0 No Calc0 No Calc 0 No Calc0 No Calc 0 No Calc0 No Calc 0 No Calc0 No Calc 0 No Calc0 No Calc 0 No Calc0 No Calc 0 No Calc0 No Calc 0 No Calc0 No Calc 0 No Calc0 No Calc 0 No Calc0 No Calc 0 No Calc0 No Calc 0 No Calc0 No Calc 0 No Calc0 No Calc 0 No Calc0 No Calc 0 No Calc0 No Calc 0 No Calc0 No Calc 0 No Calc0 No Calc 0 No Calc0 No Calc 0 No Calc0 No Calc 0 No Calc0 No Calc 0 No Calc0 No Calc 0 No Calc0 No Calc 0 No Calc0 No Calc 0 No Calc0 No Calc 0 No Calc0 No Calc 0 No Calc0 No Calc 0 No Calc0 No Calc 0 No Calc0 No Calc 0 No Calc0 No Calc 0 No Calc0 No Calc 0 No Calc0 No Calc 0 No Calc0 No Calc 0 No Calc0 No Calc 0 No Calc0 No Calc 0 No Calc0 No Calc 0 No Calc0 No Calc 0 No Calc0 No Calc 0 No Calc0 No Calc 0 No Calc0 No Calc 0 No Calc0 No Calc 0 No Calc0 No Calc 0 No Calc0 No Calc 0 No Calc0 No Calc 0 No Calc0 No Calc 0 No Calc0 No Calc 0 No Calc0 No Calc 0 No Calc0 No Calc 0 No Calc0 No Calc 0 No Calc0 No Calc 0 No Calc0 No Calc 0 No Calc0 No Calc 0 No Calc0 No Calc 0 No Calc0 No Calc 0 No Calc0 No Calc 0 No Calc
Package Page 21 AMP Workhour Costs - Proposed

(1) (2) (3) (4) (5) (6) (7) (8) (9) (10) (11) (12)Proposed Proposed Proposed Proposed Proposed Proposed Proposed Proposed Proposed Proposed Proposed ProposedOperation Annual FHP Annual TPH or Annual Productivity Annual Operation Annual FHP Annual TPH or Annual Productivity AnnualNumbers Volume NATPH Volume Workhours (TPH or NATPH) Workhour Costs Numbers Volume NATPH Volume Workhours (TPH or NATPH) Workhour Costs
0 No Calc 0 No Calc0 No Calc 0 No Calc0 No Calc 0 No Calc0 No Calc 0 No Calc0 No Calc 0 No Calc0 No Calc 0 No Calc0 No Calc 0 No Calc0 No Calc 0 No Calc0 No Calc 0 No Calc0 No Calc 0 No Calc0 No Calc 0 No Calc0 No Calc 0 No Calc0 No Calc 0 No Calc0 No Calc 0 No Calc0 No Calc 0 No Calc0 No Calc 0 No Calc0 No Calc 0 No Calc0 No Calc 0 No Calc0 No Calc 0 No Calc0 No Calc 0 No Calc0 No Calc 0 No Calc0 No Calc 0 No Calc0 No Calc 0 No Calc0 No Calc 0 No Calc0 No Calc 0 No Calc0 No Calc 0 No Calc0 No Calc 0 No Calc0 No Calc 0 No Calc0 No Calc 0 No Calc0 No Calc 0 No Calc0 No Calc 0 No Calc0 No Calc 0 No Calc0 No Calc 0 No Calc0 No Calc 0 No Calc0 No Calc 0 No Calc0 No Calc 0 No Calc0 No Calc 0 No Calc0 No Calc 0 No Calc0 No Calc 0 No Calc0 No Calc 0 No Calc0 No Calc 0 No Calc
Moved to Gain 0 74,846 66,532 1 $2,812,089 Impact to Gain 2,227,890,842 5,057,744,365 1,579,605 3,202 $64,299,472Impact to Lose 0 0 0 No Calc $0 Moved to Lose 0 0 0 No Calc $0Total Impact 0 74,846 66,532 1 $2,812,089 Total Impact 2,227,890,842 5,057,744,365 1,579,605 3,202 $64,299,472Non Impacted 29,418,199 52,037,650 103,424 503 $4,220,872 Non Impacted 2,665,135 6,639,476 68,146 97 $2,725,410
Gain Only 103,603,387 190,716,181 313,568 608 $12,873,541All 29,418,199 52,112,496 169,956 307 $7,032,962 All 2,334,159,364 5,255,100,022 1,961,319 2,679 $79,898,423
Package Page 22 AMP Workhour Costs - Proposed

(1) (2) (3) (4) (5) (6) (7) (8) (9) (10) (11) (12)Proposed Proposed Proposed Proposed Proposed Proposed Proposed Proposed Proposed Proposed Proposed ProposedOperation Annual FHP Annual TPH or Annual Productivity Annual Operation Annual FHP Annual TPH or Annual Productivity AnnualNumbers Volume NATPH Volume Workhours (TPH or NATPH) Workhour Costs Numbers Volume NATPH Volume Workhours (TPH or NATPH) Workhour Costs
Op# FHP TPH/NATPH Workhours Productivity Workhour Cost Op# FHP TPH/NATPH Workhours Productivity Workhour Cost232 892 )234
Totals 0 0 0 No Calc $0 Totals 0 0 (7093) No Calc ($293,219)
Impact to Gain 2,227,890,842 5,057,819,211 1,646,138 3,073 $67,111,562Combined Current Annual Workhour Cost : Impact to Lose 0 0 0 No Calc $0
Total Impact 2,227,890,842 5,057,819,211 1,646,138 3,073 $67,111,562Non-impacted 32,083,334 58,677,126 171,570 342 $6,946,282
Gain Only 103,603,387 190,716,181 313,568 608 $12,873,541Tot Before Adj 2,363,577,563 5,307,212,518 2,131,275 2,490 $86,931,385
Lose Adj 0 0 0 No Calc $0Gain Adj 0 0 -7,093 No Calc -$293,219
All 2,363,577,563 5,307,212,518 2,124,183 2,498 $86,638,166
Comb Current 2,363,577,563 5,307,212,518 2,372,123 2,237 $97,666,404Proposed 2,363,577,563 5,307,212,518 2,124,183 2,498 $86,638,166Change 0 0 (247,941) ($11,028,238)
Change % 0.0% 0.0% -10.5% -11.3%
rev 04/02/2009
(14) New Flow Adjustments at Gaining Facility(13) New Flow Adjustments at Losing Facility
$97,666,404
Proposed Annual Workhour Cost :(Total of Columns 6 and 12 on this page)
$86,638,166
Co
mb
To
tals
Cost Impact(This number equals the difference in the current and proposed workhour costs
above and is carried forward to the Executive Summary )
(This number brought forward from Workhour Costs - Current )
Function 1 Workhour Savings : $11,028,238
Minimum Function 1 Workhour Savings : $1,166,064(This number represents proposed workhour savings with no productivity improvements
applied to operations at the gaining facility)
Package Page 23 AMP Workhour Costs - Proposed

Last Saved:
to
515 0.0% 100.0% $4,123 ] 515 $893 515 $0 515 $893540 0.0% 100.0% $102 ] 540 $0 540 $0 540 $0566 100.0% $152,026 ] 566 $216,214 566 $0 566 $362,270570 0.0% 100.0% $89 ] 570 $0 570 $0 570 $0571 0.0% 100.0% $63,675 ] 571 $0 571 $0 571 $0581 73.0% $590,320 ] 581 $688,016 581 $159,386 581 $1,137,242582 100.0% $149,118 ] 582 $444,450 582 $0 582 $589,956617 100.0% $22 671 ] 617 $72 617 $0 617 $18 515624 0.0% 100.0% $427 ] 624 $48,186 624 $0 624 $48,186653 100.0% $1,227 ] 653 $186 653 $0 653 $1,359666 100.0% $27,576 ] 666 $0 666 $0 666 $27,576679 40.0% $157,365 ] 679 $105,172 679 $94,419 679 $156,380745 0.0% 100.0% $395,272 ] 745 $942,884 745 $0 745 $942,884747 0.0% 80.0% $1,723,815 ] 747 $3,469,542 747 $344,763 747 $3,469,542749 0.0% 100.0% $58,973 ] 749 $293,576 749 $0 749 $293,576750 0.0% 100.0% $4,763,297 ] 750 $6,003,400 750 $0 750 $6,003,400753 0.0% 50.0% $1,136,654 ] 753 $3,539,406 753 $568,327 753 $3,539,406754 0.0% 100.0% $122,133 ] 754 $0 754 $0 754 $0763 $157,288 763 $165 763 $157,288 763 $165765 $3,139,528 765 $2,938,388 765 $3,139,528 765 $2,938,388766 $3 240 614 766 $1 395 072 766 $3 240 614 766 $1 395 072
550 $2,754 550 $2,754616 $6,569 616 $6,569634 $951 634 $951665 $136,146 665 $136,146
Proposed Other Craft Workhours
Proposed Annual Workhours
Proposed Annual Workhour Cost ($)
Other Workhour Move Analysis
Norfolk P&DCLosing Facility: Gaining Facility: Richmond P&DC Date Range of Data: 06/30/1107/01/10
January 20, 2012
Proposed MODS
Operation Number
Proposed Annual Workhours
Current Other Craft Workhours
Current Annual Workhour Cost ($)
Current MODS
Operation Number
Percent Moved to Gaining
(%)
Current Annual Workhours
Current Annual Workhours
Reduction Due to EoS
(%)
Reduction Due to EoS
(%)
Proposed Annual Workhour Cost ($)
Gaining Facility Losing FacilityLosing Facility Gaining Facility
Current MODS
Operation Number
Percent Moved to
Losing (%)
Current Annual Workhour Cost ($)
Proposed MODS
Operation Number
Package Page 24 AMP Other Curr vs Prop

Package Page 25 AMP Other Curr vs Prop

210,015 $9,368,862 0 $0 Ops-Red 26,947 $1,166,896 Ops-Red 0 $00 $0 339 709 $15 751 999 Ops-Inc 0 $0 Ops-Inc 358 420 $16 591 186
153,969 $6,537,430 101,222 $4,480,046 Ops-Stay 153,969 $6,537,430 Ops-Stay 101,222 $4,480,046363,984 $15,906,292 440,932 $20,232,045 AllOps 180,916 $7,704,325 AllOps 459,643 $21,071,232
620 0.0% 100.0% $207 ] 620 $0 620 $0 620 $0630 0.0% 100.0% $201 ] 630 $0 630 $0 630 $0671 0.0% 100.0% $180,142 ] 671 $245,354 671 $0 671 $245,354698 100.0% $542,494 ] 698 $2,176,078 698 $0 698 $2,705,526699 100.0% $480,866 ] 699 $138,657 699 $0 699 $607,959700 30.0% $908,298 ] 700 $1,577,842 700 $635,808 700 $1,843,778758 50.0% $192,751 ] 759 $475,577 758 $96,375 759 $571,764759 28.0% $635,290 ] 759dup 759 $457,409 759dup922 0.0% 100.0% $128,432 ] 922 $142,724 922 $0 922 $142,724927 80.0% $437,158 ] 927 $657,275 927 $87,432 927 $998,591933 0.0% 100.0% $177,559 ] 933 $99,319 933 $0 933 $99,319951 0.0% 100.0% $886,213 ] 951 $1,197,656 951 $0 951 $1,197,656
679 $91,673 679 $91,673758 $185,286 758 $185,286953 $102,831 953 $102,831
Proposed MODS
Operation Number
Proposed Annual Workhours
Proposed All Supervisory WorkhoursLosing Facility
Current Annual Workhour Cost ($)
Proposed Annual Workhour Cost ($)
Proposed MODS
Operation Number
Proposed Annual Workhours
Proposed Annual Workhour Cost ($)
Current All Supervisory Workhours
Current Annual Workhour Cost ($)
Current Annual Workhours
Current MODS
Operation Number
Losing Facility Gaining Facility
Totals
Ops-ReducingOps-Increasing
Ops-StayingAll Operations
Percent (%) Moved to Losing
(%) Reduction
Due to EoS
Percent (%) Moved to Gaining
(%) Reduction
Due to EoS
Current Annual Workhours
Totals
Ops-ReducingOps-Increasing
Ops-StayingAll Operations
Gaining Facility
Current MODS
Operation Number
Package Page 26 AMP Other Curr vs Prop

Package Page 27 AMP Other Curr vs Prop

87 923 $4 569 611 0 $0 Ops-Red 25 782 $1 277 024 Ops-Red 0 $00 $0 130,718 $6,710,481 Ops-Inc 0 $0 Ops-Inc 169,166 $8,412,6700 $0 7,521 $379,790 Ops-Stay 0 $0 Ops-Stay 7,521 $379,790
87 923 $4 569 611 138 239 $7 090 272 AllOps 25 782 $1 277 024 AllOps 176 687 $8 792 461
781 100.0% $57 480 ] 781 $64 491 781 $0 781 $119 298783 100.0% $76,637 ] 783 $396,949 783 $0 783 $484,465789 $22,460 789 $0 789 $22,460 789 $0988 $9 248 988 $0 988 $9 248 988 $0
780 $0 780 $0787 $7,122 787 $7,122
3 975 $134 117 0 $0 Ops-Red 0 $0 Ops-Red 0 $00 $0 11,976 $461,440 Ops-Inc 0 $0 Ops-Inc 15,951 $603,763
741 $31,707 200 $7,122 Ops-Stay 741 $31,707 Ops-Stay 200 $7,1224 716 $165 824 12 176 $468 562 AllOps 741 $31 707 AllOps 16 151 $610 885
31 $337,324 31 $105,409 31 $251,707 31 $175,06032 $0 32 $0 32 $0 32 $033 $0 33 $0 33 $0 33 $034 $6,380,142 34 $4,333,461 34 $6,380,142 34 $4,333,46193 $22 460 93 $0 93 $22 460 93 $0Totals $6,739,925 Totals $4,438,869 Totals $6,654,308 Totals $4,508,520
$180 036 $105 244 $94 419 $174 895$6,380,142 $4,333,461 $6,380,142 $4,333,461
Proposed Annual Workhours
Proposed Annual Workhour Cost ($)
Transportation - PVS
LDCProposed Annual
WorkhoursLDC
Proposed MODS
Operation Number
Proposed Annual Workhours
Ops 765, 766 (34)
Proposed Annual Workhour Cost ($)
Transportation - PVS
Proposed Annual Workhour Cost ($)
Proposed MODS
Operation Number
Proposed Annual Workhours
Proposed Annual Workhour Cost ($)
Totals
Ops-ReducingOps-Increasing
Ops-StayingAll Operations
(%) Reduction
Due to EoS
Current Annual Workhours
Current Annual Workhour Cost ($)
Transportation - PVS
Totals
Ops-ReducingOps-Increasing
Ops-Staying
Ops-Reducing
Percent (%) Moved to Gaining
Losing Facility
Ops 617, 679, 764 (31)Subset for Trans-PVS
Tab
Losing Facility
Losing Facility Gaining Facility
TotalsOps-Increasing
Ops-Staying
Totals
Ops 765, 766 (34)
Ops-Reducing
All Operations
Current Workhours for LDCs Common to & Shared between Supv & Craft Proposed Workhours for LDCs Common to & Shared between Supv & Craft
Current MODS
Operation Number
Gaining Facility
Gaining Facility
Ops 617, 679, 764 (31)
Ops 765, 766 (34)
Ops 617, 679, 764 (31)
All Operations
Percent (%) Moved to Losing
Gaining Facility Losing Facility
Current Annual Workhour Cost ($)
LDCCurrent Annual
Workhours
Current Annual Workhour Cost
($)
Current MODS
Operation Number
(%) Reduction
Due to EoS
Grouped Subtotals for Transportation, Maintenance, Supervision & Flow Adjustments, along with Facility and Combined Summaries
Ops-IncreasingOps-Staying
All Operations
Current Annual Workhours
Subset for Trans-PVS
TabOps 617, 679, 764 (31)
Transportation - PVS
LDCCurrent Annual
Workhours
Current Annual Workhour Cost
($)
Ops 765, 766 (34)
Package Page 28 AMP Other Curr vs Prop

36 $4 763 297 36 $6 003 400 36 $0 36 $6 003 40037 $1,258,787 37 $3,539,406 37 $568,327 37 $3,539,40638 $1,782,788 38 $3,763,118 38 $344,763 38 $3,763,11839 $395 699 39 $998 590 39 $0 39 $998 59093 $76,637 93 $396,949 93 $0 93 $484,465Totals $8,277,208 Totals $14,701,464 Totals $913,090 Totals $14,788,980
01 $128,432 01 $142,724 01 $0 01 $142,72410 $2,369,224 10 $4,549,852 10 $723,240 10 $6,155,85420 $0 20 $0 20 $0 20 $030 $828,041 30 $752,536 30 $553,784 30 $848,72335 $1,063,772 35 $1,399,806 35 $0 35 $1,399,80640 $0 40 $0 40 $0 40 $050 $0 50 $0 50 $0 50 $060 $0 60 $0 60 $0 60 $070 $0 70 $0 70 $0 70 $080 $180,142 80 $245,354 80 $0 80 $245,35481 $0 81 $0 81 $0 81 $088 $0 88 $0 88 $0 88 $0Totals $4,569,611 Totals $7,090,272 Totals $1,277,024 Totals $8,792,461
Annual Workhours Annual Dollars Annual Workhours Annual Dollars Annual Workhours Annual Dollars % Change Dollars Change Percent Change
59,135 $2,634,369 0 $0 57,114 $2,575,036 -3.4% ($59,333) -2.3%254,662 $10,998,882 0 $0 254,662 $10,982,916 0.0% ($15,966) -0.1%503,146 $22,978,672 151,756 $7,109,143 492,566 $22,811,213 -2.1% ($167,459) -0.7%226,162 $11,659,883 0 $0 198,821 $10,069,485 -12.1% ($1,590,398) -13.6%
4,864 $160,800 0 $0 4,864 $158,127 0.0% ($2,673) -1.7%1,047,970 $48,432,606 151,756 $7,109,143 1,008,027 $46,596,777 -3.8% ($1,835,828) -3.8%
LDC LDC 39 745 (979) ($40 907) 38 749 78,293 $3,442,362 36 750 105,039 $5,147,144 Before 456,623 $20,641,727 Before 591,346 $27,790,878 37 753 (30 597) ($1 439 456) After 207 438 $9 013 057 After 652 480 $30 474 578 Adj 0 $0 Adj 151,756 $7,109,143 AfterTot 207,438 $9,013,057 AfterTot 804,236 $37,583,720 Change (249,185) ($11,628,671) Change 212,890 $9,792,842 % Diff -54.6% -56 3% % Diff 36 0% 35.2%
Total Adj 0 $0 Total Adj 151,756 $7,109,143 Before 1,047,970 $48,432,606After 859,918 $39,487,634
Adj 151 756 $7 109 143AfterTot 1 011 674 $46 596 777Change (36,295) ($1,835,828)% Diff -3 5% -3.8%
Supervisory
LDCProposed Annual
WorkhoursProposed Annual
Workhour Cost ($)
Proposed Annual Workhour Cost ($)LDC LDC
Current Annual Workhours
Current Annual Workhour Cost
($)
Maintenance
Proposed Annual Workhour Cost
($)
Special Adjustments at Gaining Site
Maintenance
Current Annual Workhour Cost
($)
Summary by Sub-GroupSpecial Adjustments -
Combined -
Gaining Facility SummaryProposed Annual Workhour Cost
($)
Proposed MODS
Operation Number
Combined Summary
Proposed Annual Workhours
Proposed Annual Workhour Cost
($)
Proposed Annual Workhour Cost
($)
Proposed Annual Workhours
Proposed MODS
Operation Number
Proposed Annual Workhours
LDC
Proposed Annual Workhours
Losing Facility Summary
Current Annual Workhours
Maintenance
Proposed Annual Workhour Cost ($)
Proposed Annual WorkhoursLDC
Proposed Annual Workhours
Maintenance
Supervisor Summary Supervisor Summary
LDCCurrent Annual
Workhours
Current Annual Workhour Cost
($)LDC
Current Annual Workhours
Current Annual Workhour Cost
($)
Supervisory
LDCProposed Annual
WorkhoursProposed Annual
Workhour Cost ($)
Summary by FacilitySpecial Adjustments at Losing Site
0Supv/Craft Joint Ops (note 4)
Total (39,943)
0(10,580)(27,341)
Maintenance Ops (note 3)
Transportation Ops (note 2)
ChangeProposed + Special Adjustments - Combined -Current - Combined
Workhour Change
(2,021)
4) less Ops going to Maintenance' Tabs
'Other Craft' Ops (note 1)
Notes:1) less Ops going to 'Trans-PVS' & 'Maintenance' Tabs
2) going to Trans-PVS tab
3) going to Maintenance tab
Supervisory Ops
Package Page 29 AMP Other Curr vs Prop

rev 06/17/2008
Package Page 30 AMP Other Curr vs Prop

Last Saved:
Losing Facility:Data Extraction Date: 09/20/11
(2) (3) (4) (5) (6)
LevelCurrent Auth
StaffingCurrent On-Rolls
Proposed Staffing
Difference
1 PCES-01 1 1 0 -1
2 EAS-24 1 1 0 -1
3 EAS-23 1 1 0 -1
4 EAS-22 4 4 1 -3
5 EAS-21 2 2 0 -2
6 EAS-21 2 2 0 -2
7 EAS-19 1 1 0 -1
8 EAS-18 2 1 1 0
9 EAS-18 1 1 0 -1
10 EAS-17 2 1 1 0
11 EAS-17 21 18 7 -11
12 EAS-17 7 6 1 -5
13 EAS-17 5 5 4 -1
14 EAS-16 1 1 0 -1
15 EAS-12 1 1 0 -1
16171819202122232425262728293031
Finance Number:
MGR MAINTENANCE
MGR IN-PLANT SUPPORT
MGR DISTRIBUTION OPERATIONS
MGR MAINTENANCE OPERATIONS
OPERATIONS INDUSTRIAL ENGINEER (FI
MGR MAINTENANCE OPERATIONS SUPPT
SECRETARY (FLD)
NETWORKS SPECIALIST
Management Positions
NETWORKS SPECIALIST
OPERATIONS SUPPORT SPECIALIST
OPERATIONS SUPPORT SPECIALIST
SUPV DISTRIBUTION OPERATIONS
Line
(1)
Position Title
PLANT MANAGER (3)
Staffing - Management
516523
January 20, 2012
Norfolk P&DC
SUPV MAINTENANCE OPERATIONS
SUPV TRANSPORTATION OPERATIONS
Package Page 30 AMP Staffing - PCES/EAS

444546474849505152535455565758596061626364656667686970717273747576777879
52 46 15 (31)
Retirement Eligibles: 18 Position Loss: 31
Totals
Package Page 31 AMP Staffing - PCES/EAS

Gaining Facility:Data Extraction Date: 09/20/11
(13) (14) (15) (16) (17)
LevelCurrent Auth
StaffingCurrent On-Rolls
Proposed Staffing
Difference
1 PCES-01 1 1 1 0
2 EAS-25 1 1 1 0
3 EAS-24 1 1 1 0
4 EAS-24 1 1 1 0
5 EAS-22 5 4 8 4
6 EAS-21 3 2 3 1
7 EAS-21 3 1 3 2
8 EAS-20 1 1 1 0
9 EAS-20 1 1 1 0
10 EAS-20 1 1 1 0
11 EAS-19 1 1 1 0
12 EAS-19 1 1 1 0
13 EAS-19 1 1 1 0
14 EAS-18 1 1 2 1
15 EAS-18 1 1 2 1
16 EAS-17 3 3 4 1
17 EAS-17 35 27 40 13
18 EAS-17 9 8 9 1
19 EAS-17 3 3 4 1
20 EAS-16 2 2 3 1
21 EAS-12 1 0 1 1
22232425262728293031323334
SUPV MAINTENANCE OPERATIONS
SUPV TRANSPORTATION OPERATIONS
NETWORKS SPECIALIST
SECRETARY (FLD)
NETWORKS SPECIALIST
OPERATIONS SUPPORT SPECIALIST
OPERATIONS SUPPORT SPECIALIST
SUPV DISTRIBUTION OPERATIONS
OPERATIONS SUPPORT SPECIALIST
MAINTENANCE ENGINEERING SPECIALIST
MGR FIELD MAINT OPRNS (LEAD)
MGR MAINTENANCE OPERATIONS SUPPT
MGR MAINTENANCE OPERATIONS
OPERATIONS INDUSTRIAL ENGINEER (FI
MGR MAINT ENGINEERING SUPPORT
MGR TRANSPORTATION/NETWORKS
MGR IN-PLANT SUPPORT
MGR DISTRIBUTION OPERATIONS
MGR MAINTENANCE (LEAD)
MGR DISTRIBUTION OPERATIONS
SR PLANT MANAGER (2)Line Position Title
(12)
Management Positions
Finance Number: 517649
Richmond P&DC
Package Page 32 AMP Staffing - PCES/EAS

474849505152535455565758596061626364656667686970717273747576777879
76 62 89 27
Retirement Eligibles: 15 Position Loss: (27)
4
Total
rev 11/05/2008
Total PCES/EAS Position Loss: (This number carried forward to the Executive Summary )
Package Page 33 AMP Staffing - PCES/EAS

Losing Facility: 516523
(1) (2) (3) (4) (5) (6)
Craft Positions
Function 1 - Clerk 34 1 269 304 27 (277)Function 4 - Clerk 0 0 1 1 2 1Function 1 - Mail Handler 8 5 168 181 64 (117)Function 4 - Mail Handler 0 0 0 4 4
Function 1 & 4 Sub-Total 42 6 438 486 97 (389)Function 3A - Vehicle Service 8 0 76 84 81 (3)Function 3B - Maintenance 6 0 100 106 13 (93)Functions 67-69 - Lmtd/Rehab/WC 0 5 5 0 (5)Other Functions 0 0 5 5 1 (4)
Total 56 6 624 686 192 (494)
Retirement Eligibles: 241
Gaining Facility: 517649
(7) (8) (9) (10) (11) (12)
Craft Positions
Function 1 - Clerk 57 0 388 445 493 48Function 1 - Mail Handler 37 44 339 420 605 185
Function 1 Sub-Total 94 44 727 865 1,098 233Function 3A - Vehicle Service 6 0 52 58 54 (4)Function 3B - Maintenance 3 0 182 185 263 78Functions 67-69 - Lmtd/Rehab/WC 0 7 7 7 0Other Functions 0 0 9 9 9 0
Total 103 44 977 1,124 1,431 307
Retirement Eligibles: 329
187
(13) Notes:
rev 11/05/2008
Total On-Rolls
(This number carried forward to the Executive Summary )
Casuals/PSEs On-Rolls
Data Extraction Date:
Norfolk P&DC
Part Time On-Rolls
Full Time On-Rolls
Staffing - Craft
Difference
Difference
Last Saved: January 20, 2012
Data Extraction Date: 09/20/11
Casuals/PSEs On-Rolls
09/20/11
Total Proposed
Finance Number:
Richmond P&DC Finance Number:
Total Craft Position Loss:
Total Proposed
Part Time On-Rolls
Full Time On-Rolls
Total On-Rolls
Package Page 34 AMP Staffing - Craft

Losing Facility: Gaining Facility:
Date Range of Data: :
(1) (2) (3) (4) (5) (6)
Workhour Activity Current Cost Proposed Cost Difference Workhour Activity Current Cost Proposed Cost Difference
LDC 36Mail Processing
Equipment$ 4,763,297 $ 0 $ (4,763,297) LDC 36
Mail Processing Equipment
$ 6,003,400 $ 6,003,400 $ 0
LDC 37 Building Equipment $ 1,258,787 $ 568,327 $ (690,460) LDC 37 Building Equipment $ 3,539,406 $ 3,539,406 $ 0
LDC 38 Building Services (Custodial Cleaning)
$ 1,782,788 $ 344,763 $ (1,438,025) LDC 38 Building Services (Custodial Cleaning)
$ 3,763,118 $ 3,763,118 $ 0
LDC 39Maintenance
Operations Support$ 395,699 $ 0 $ (395,699) LDC 39
Maintenance Operations Support
$ 998,590 $ 998,590 $ 0
LDC 93Maintenance
Training$ 76,637 $ 0 $ (76,637) LDC 93
Maintenance Training
$ 396,949 $ 484,465 $ 87,516
Workhour Cost Subtotal $ 8,277,208 $ 913,090 $ (7,364,118) Workhour Cost Subtotal $ 14,701,464 $ 14,788,980 $ 87,516
Other Related Maintenance & Facility Costs
Current Cost Proposed Cost DifferenceOther Related Maintenance &
Facility Costs Current Cost Proposed Cost Difference
TotalMaintenance Parts, Supplies &
Facility Utilities$ 1,637,366 $ 274,996 $ (1,362,370) Total
Maintenance Parts, Supplies & Facility Utilities
$ 3,052,857 $ 3,297,086 $ 244,229
Adjustments (from "Other Curr vs Prop" tab)
$ 0 Adjustments (from "Other Curr vs Prop" tab)
$ 7,109,143
Grand Total $ 9,914,574 $ 1,188,086 $ (8,726,488) Grand Total $ 17,754,321 $ 25,195,209 $ 7,440,888
$1,285,600 (This number carried forward to the Executive Summary )
(7) Notes:
Annual Maintenance Savings:
rev 04/13/2009
MaintenanceLast Saved:
Norfolk P&DC Richmond P&DC
January 20, 2012
Jul-01-2010 Jun-30-2011
Package Page 35 AMP Maintenance


23:00 0:00
0:30
1 2 3 4 5 6 7 8 9 10 11 12 13 14Current Current Current Proposed Proposed Proposed Current Current Current Proposed Proposed Proposed
Route Annual Annual Cost per Annual Annual Cost per Route Annual Annual Cost per Annual Annual Cost perNumbers Mileage Cost Mile Mileage Cost Mile Numbers Mileage Cost Mile Mileage Cost Mile
23390 1,532,879 $1,810,775 $1.18 207EE 393,940 $493,989 $1.25233FE 433,675 $702,180 $1.62 23025 544,150 $770,886 $1.42
Hub Cost $0.00 230M0 456,859 $617,262 $1.3530016 878,834 $1,492,723 $1.70
Transportation - HCR
Orig & Dest CET for OGP:
CT for Outbound Dock:
Type of Distribution to Consolidate:
Date of HCR Data File:
CET for cancellations:
Last Saved: January 20, 2012
Losing Facility: Norfolk P&DC Richmond P&DCGaining Facility:
Package Page 37 AMP Transportation - HCR

1 2 3 4 5 6 7 8 9 10 11 12 13 14Current Current Current Proposed Proposed Proposed Current Current Current Proposed Proposed Proposed
Route Annual Annual Cost per Annual Annual Cost per Route Annual Annual Cost per Annual Annual Cost perNumbers Mileage Cost Mile Mileage Cost Mile Numbers Mileage Cost Mile Mileage Cost Mile
Package Page 38 AMP Transportation - HCR

1 2 3 4 5 6 7 8 9 10 11 12 13 14Current Current Current Proposed Proposed Proposed Current Current Current Proposed Proposed Proposed
Route Annual Annual Cost per Annual Annual Cost per Route Annual Annual Cost per Annual Annual Cost perNumbers Mileage Cost Mile Mileage Cost Mile Numbers Mileage Cost Mile Mileage Cost Mile
($1,008,374) ($2,978,696)
Total HCR Transportation Savings:
Other Changes
(+/-)
173,460 171,423
Moving to Gain (-)
Proposed Trip
Impacts
Current Losing
Proposed ResultTrips from Gaining
Other Changes
(+/-)
HCR Annual Savings (Losing Facility): HCR Annual Savings (Gaining Facility):
Proposed Trip Impacts
173,460 0 0 0 0
rev 11/05/2008
Current Gaining
($3,987,069)
171,4230
Proposed ResultTrips from
Losing
0
Moving to Lose (-)
<<== (This number is summed with Total from 'Trans-PVS' and carried forward to the Executive Summary as Transportation Savings )
Package Page 39 AMP Transportation - HCR
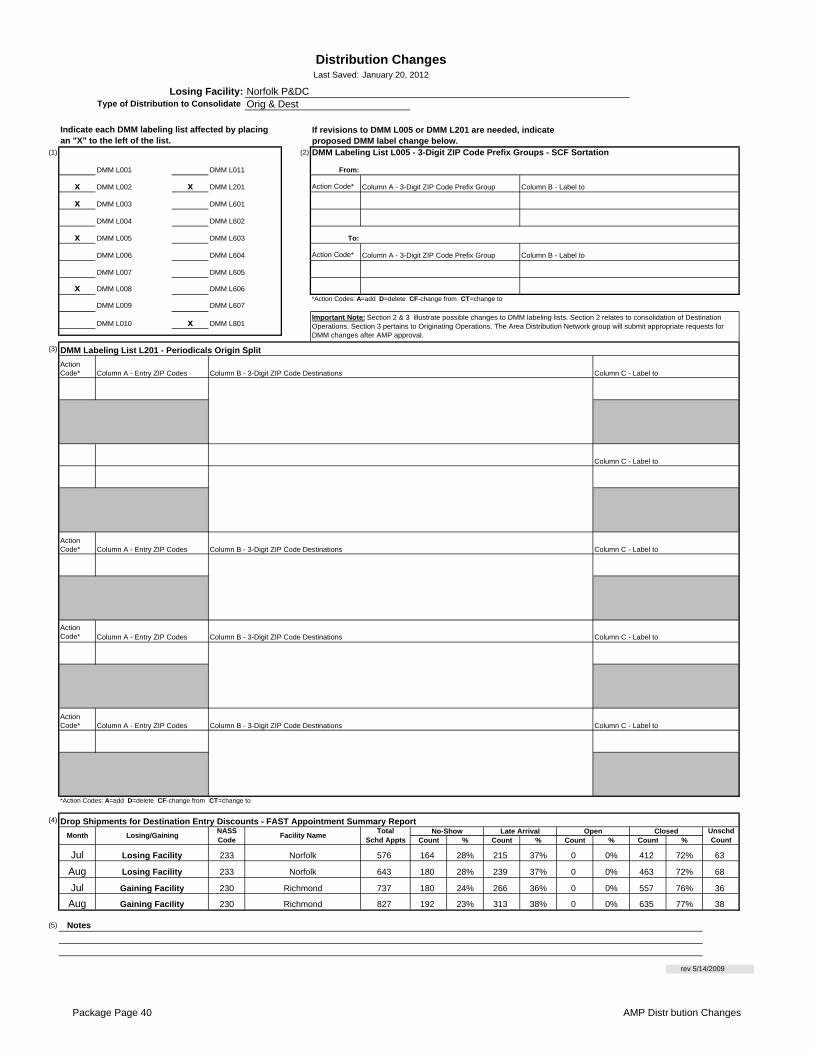
Orig & Dest
(1) (2)
DMM L011 From:
x x DMM L201 Action Code* Column A - 3-Digit ZIP Code Prefix Group
x DMM L601
DMM L602
x DMM L603 To:
DMM L604 Action Code* Column A - 3-Digit ZIP Code Prefix Group
DMM L605
x DMM L606
DMM L607
x DMM L801
(3)
Action Code*
Action Code*
Action Code*
Action Code*
(4)
Count % Count % Count % Count %
Jul 233 576 164 28% 215 37% 0 0% 412 72% 63
Aug 233 643 180 28% 239 37% 0 0% 463 72% 68
Jul 230 737 180 24% 266 36% 0 0% 557 76% 36
Aug 230 827 192 23% 313 38% 0 0% 635 77% 38
(5) Notes
Column A - Entry ZIP Codes Column B - 3-Digit ZIP Code Destinations Column C - Label to
Column C - Label to
DMM Labeling List L201 - Periodicals Origin Split
Column A - Entry ZIP Codes Column B - 3-Digit ZIP Code Destinations Column C - Label to
Gaining Facility Richmond
Gaining Facility Richmond
Unschd Count
Losing Facility Norfolk
Losing Facility Norfolk
No-Show Late Arrival Open Closed
*Action Codes: A=add D=delete CF-change from CT=change to
Column B - Label to
rev 5/14/2009
Drop Shipments for Destination Entry Discounts - FAST Appointment Summary Report
Month Losing/GainingNASS Code
Facility NameTotal
Schd Appts
DMM Labeling List L005 - 3-Digit ZIP Code Prefix Groups - SCF Sortation
Column B - Label to
Distribution Changes
Indicate each DMM labeling list affected by placing an "X" to the left of the list.
Losing Facility:Type of Distribution to Consolidate
If revisions to DMM L005 or DMM L201 are needed, indicate proposed DMM label change below.
Last Saved: January 20, 2012
Norfolk P&DC
DMM L003
DMM L004
DMM L001
DMM L002
DMM L009
DMM L010
DMM L005
DMM L006
DMM L007
DMM L008
Column C - Label to
*Action Codes: A=add D=delete CF-change from CT=change to
Important Note: Section 2 & 3 illustrate possible changes to DMM labeling lists. Section 2 relates to consolidation of Destination Operations. Section 3 pertains to Originating Operations. The Area Distribution Network group will submit appropriate requests for DMM changes after AMP approval.
Column A - Entry ZIP Codes Column B - 3-Digit ZIP Code Destinations Column C - Label to
Column A - Entry ZIP Codes Column B - 3-Digit ZIP Code Destinations
Package Page 40 AMP Distr bution Changes

Losing Facility: Gaining Facility:
(1) (2) (3) (4) (5) (6) (7) (8)
Equipment EquipmentType TypeAFCS 5 0 (5) AFCS 8 8 0 (5)
AFCS200 AFCS200
AFSM - ALL 3 0 (3) AFSM - ALL 4 5 1 (2) $141,064
APPS APPS 1 2 1 $1,628,000
CIOSS 2 0 (2) CIOSS 2 2 0 (2)
CSBCS CSBCS
DBCS 22 0 (22) DBCS 27 28 1 (21) $8,060
DBCS-OSS DBCS-OSS
DIOSS 3 0 (3) DIOSS 9 9 0 (3)
FSS FSS 3 3 0 $0
SPBS 2 1 (1) SPBS 1 1 0 (1)
UFSM UFSM
FC / MICRO MARK 1 0 (1) FC / MICRO MARK 1 1 0 (1) $0
ROBOT GANTRY ROBOT GANTRY
HSTS / HSUS HSTS / HSUS 2 2 0 $0
LCTS / LCUS 1 0 (1) LCTS / LCUS 1 1 0 (1)
LIPS LIPS
MPBCS-OSS MPBCS-OSS
TABBER TABBER
PIV PIV
LCREM 1 0 (1) LCREM 1 1 0 (1)
(9) Notes:
Data Extraction Date:
Proposed Number
January 20, 2012MPE Inventory
MPE updated based on final HQ approved equipment set.
Norfolk P&DC Richmond P&DC
Current Number
DifferenceEquipment
ChangeRelocation
Costs
Last Saved:
Current Number
rev 03/04/2008
(This number is carried forward to Space Evaluation and Other Costs )
Proposed Number
Difference
Mail Processing Equipment Relocation Costs from Losing to Gaining Facility: $1,777,124
01/09/12
Package Page 41 AMP MPE Inventory

Last Saved:
3-Digit ZIP Code: 234 3-Digit ZIP Code: 235
1. Collection Points Mon. - Fri. Sat. Mon. - Fri. Sat. Mon. - Fri. Sat. Sat.
44 91 44 3 63 140 49
96 109 155 0 107 105 99
76 0 66 0 137 3 5
216 200 265 3 307 248 153
2. How many collection boxes are designated for "local delivery"?
3. How many "local delivery" boxes will be removed as a result of AMP? 0
4.
Quarter/FY Percent
Q1 / 2011 67.0%
Q2 / 2011 79.0%
Q3 / 2011 66.0%
Q4 / 2011 50.0%
5. 6.
Start End Start End Start End Start End
Monday 8:30 17:00 8:30 17:00 Monday 10:00 18:00 10:00 18:00
Tuesday 8:30 17:00 8:30 17:00 Tuesday 10:00 18:00 10:00 18:00
Wednesday 8:30 17:00 8:30 17:00 Wednesday 10:00 18:00 10:00 18:00
Thursday 8:30 17:00 8:30 17:00 Thursday 10:00 18:00 10:00 18:00
Friday 8:30 17:00 8:30 17:00 Friday 10:00 18:00 10:00 18:00
Saturday closed closed closed closed Saturday closed closed closed closed
7.
8. Notes:
9.
Line 1
Line 2
Number picked up before 1 p.m.
Business (Bulk) Mail Acceptance Hours
Richmond P&DC
208
106
60
Losing Facility:
5-Digit ZIP Code:Data Extraction Date:
3-Digit ZIP Code: 233
Mon. - Fri.
42
Customer Service Issues
Current Proposed
Number picked up after 5 p.m.
Number picked up between 1-5 p.m.
Total Number of Collection Points
Delivery Performance Report
Retail Unit Inside Losing Facility (Window Service Times)
3-Digit ZIP Code: 236
Current
rev 6/18/2008
23501
Can customers obtain a local postmark in accordance with applicable policies in the Postal Operations Manual?
Gaining Facility:
What postmark will be printed on collection mail?
Proposed
% Carriers returning before 5 p.m.
January 20, 2012
Norfolk P&DC
Current CurrentCurrent
QVC volume is picked up by Norfolk transporation and arrives at Norfolk BMEU at 4:30pm on Saturday
Current
Sandston, VA 23150
Package Page 42 AMP Customer Service Issues

Last Saved:
1.
2. Lease Information. (If not leased skip to 3 below.)
3.
4. Planned use for acquired space from approved AMP
5. Facility Costs
(This number shown below under One-Time Costs section.
6. Savings Information
(This number carried forward to the Executive Summary )
7. Notes
(This number carried forward to Executive Summary )
Total One-Time Costs:
Remote Encoding Center Cost per 1000
Enter annual lease cost:
Enter the total interior square footage of the facility:Enter gained square footage expected with the AMP:
Enter lease options/terms:
Current Square Footage
Enter lease expiration date:
(from above)
232,9810
The Norfolk P & DC will be used as a Collection/Dispatch Hub ,Retail Office, PO, BMEU, VMF. In addition, the Express (Dest&Orig) operation will be maintained in the hub along with completing customer MTECH requests.
Enter any projected one-time facility costs:
Gaining Facility:Losing Facility:
Mail Processing Equipment Relocation Costs: (from MPE Inventory )
Space Savings ($):
One-Time Costs
Employee Relocation Costs:
$1,777,124
Space Evaluation and Other Costs
Street Address:City, State ZIP:
Losing Facility:
Space Evaluation
Affected FacilityFacility Name:
January 20, 2012
Norfolk P&DC
NORFOLK P & DC
Norfolk P&DC Richmond P&DC
$0
$1,777,124
600 CHURCH STNORFOLK, VA 23501-9908
Facility Costs:
Package Page 43 AMP Space Evaluation and Other Costs