Embed Size (px)
Citation preview

Geographic Analysis of San Marcos Housing Affordability

TexGIS EmployeesManager: Chase Chapman
Assistant Manager: Ryan Hilliard
GIS Analyst: Marques Green
Web Master: Jason Snyder

Introduction
Affordable housing in San Marcos, TX is in short supply.
Housing is unavailable for certain income levels.
The ratios between rent-occupied and owner-occupied housing are disproportional.
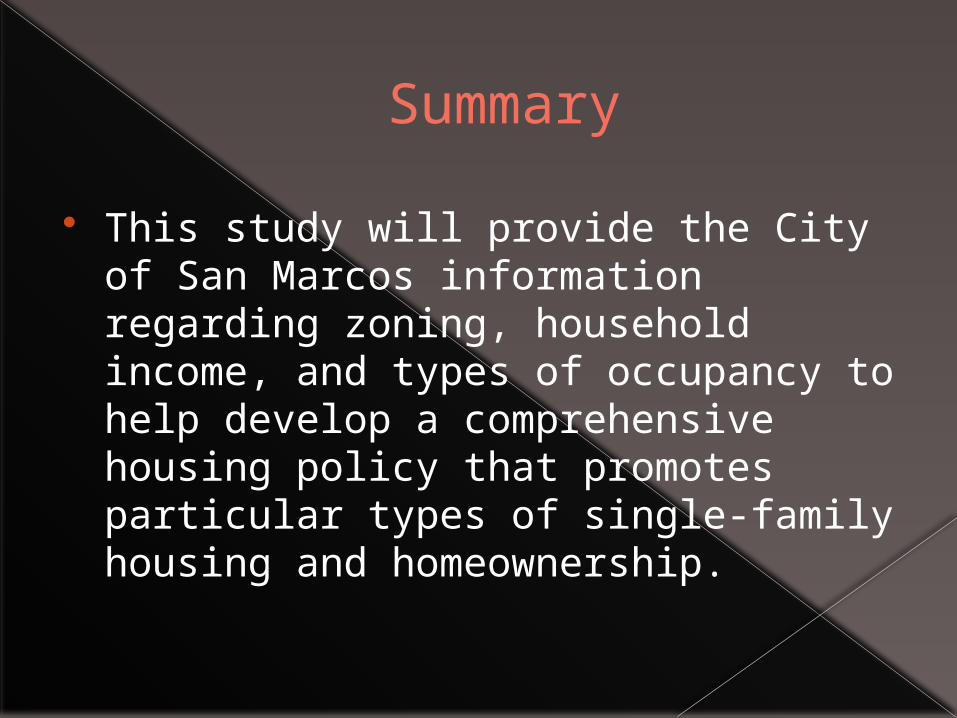
Summary
This study will provide the City of San Marcos information regarding zoning, household income, and types of occupancy to help develop a comprehensive housing policy that promotes particular types of single-family housing and homeownership.

Median Sales Price/Effective Interest Rate/Median Income
Source: Jeff Allen, Minneapolis Area Association of Realtors

Purpose
Analyze housing values and income distributions in the San Marcos area.
Compare the housing values of renter-occupied units with those of owner-occupied units.
Conclude whether the housing supply in San Marcos meets the economic make-up of its residents.
Analyze neighborhood associations to see their impact on their respective housing values.
The results of this study will aid the city in developing a comprehensive housing policy.

Scope
The geographic extent of our study area is the San Marcos city limits, in particular, the several neighborhoods within the city. We will look at data between 2000 and present in particular.
Retrieved Feb. 23, 2009 from http://www.texfiles.com/sanmarcostexas/leftA.jpg

Housing Category Thresholds
Housing Category Lower Limit Value Upper Limit Value
Entry (50% - 80% AMI) $82,400 $131,800
Workforce (80% - 120% AMI) 131,800 $164,700
Upper-Level (120% - 150% AMI) $164,700 $197,700
Executive(more than 150% AMI) $197,700 UnlimitedArea Median Family Income (AMI)

Data
San Marcos› City Limits› Zoning› Land Parcels› Neighborhoods› Mobile Homes› County Boundaries
Census Data› 2000

Data Continued
Tax Data› 2008› Home Values


Methodology
Compare housing values between different neighborhoods and among renter and owner-occupied housing.
Compare this information with census data, mainly average household income, to see if the current San Marcos housing stock fits with its residents.
Conclude whether neighborhood associations have an effect on their respective housing values.
Analyze the effect renter-occupied housing has on surrounding housing values.
All of our findings will be displayed on a website and with color-coded maps displaying homes with their market values in accordance with their respective categories (SF-R, SF-11, SF-6, SF-4.5, TH, PH-ZL, PDD).
All of our analysis will be done using ArcGIS.

Market ValueSample

Timetable
ID Project Name Owner Days Start End 26-Jan 2-Feb 9-Feb 16-Feb 2-Mar 9-Mar 16-Mar 30-Mar 6-Apr 20-Apr 27-Apr 11-May
1.0 Housing TexGIS 105 26-Jan ####
1.1 Initial Meeting TexGIS 1 26-Jan ####1.1.1 Define Group 7 28-Jan ####1.1.2 Define Group 7 2-Feb ####1.1.3 Determined Group 7 4-Feb ####
1.2 Data TexGIS 86 4-Feb ####1.2.1 Received Data Group 7 5-Feb ####1.2.2 Data Group 7 6-Feb ####1.2.3 Data Analysis Group 86 7-Feb ####
1.3 Project TexGIS 93 7-Feb ####1.3.1 Project Group 19 4-Feb ####1.3.2 Proposal Due Group 1 23-Feb ####1.3.3 Proposal Group 2 25-Feb ####1.3.4 Proposal Group 1 2-Mar ####1.3.5 Progress Group 2 6-Apr ####1.3.6 Journals Due Group 1 4-May ####

Budget
Data CollectionManager: (8 hours/week * 5 weeks) 40/hr.Assistant Manager: (7 hours/week * 5 weeks) 35/hr.Developers: (10 hours/week * 3 weeks * 2 consultants) 60/hr. Total Hours 135Hourly Pay $25.00Total $3375.00
Pre-Processing DataManager: (5 hours/week * 2 weeks) 10/hr.Assistant Manager: (7 Hours/week * 2 weeks) 14/hr.Developers: (10 hours/week * 4 weeks * 2 consultants) 80/hr.Web Master: (7 hours/week * 3 weeks * 1 consultant) 21/hr.Total Hours 125Hourly Pay $25.00Total $3125.00
Data IntegrationManager: (5 hours/week * 3 weeks) 15/hr.Assistant Manager: (7 hours/week * 3 weeks) 21/hr.Developers: (10 hours/week * 3 weeks * 1 consultant) 30/hr.Web Master: (7 hours/week *3 weeks * 1 consultant) 21/hr.Total Hours 87Hourly Pay $25.00Total $2175.00

Budget cont…
Website DevelopmentWebmaster: (3 hours/ week * 6 weeks * 1 consultant) 18/hr. Hourly Pay $30.00 Total $540.00
System ManagementProject Manager: (5 hours/week * 10 weeks)Total Hours 50/hr.Hourly Pay $35.00Pay $1750.00Assistant Project Manager: (3 hours/week * 10 weeks)Total Hours 35/hr.Hourly Pay $30.00Pay $1050.00Total $2800.00
Equipment Costs (for 10 weeks)Supplies ($150/workstation * 4 workstations) $600.00Maintenance ($125/workstation * 4 workstations) $500.00Depreciation ($12,000 [Total value of equipment] / 36 $833.33(equipment life in months) *2.5 (months equipment will be in use for project) Total Equipment Costs $1934.00

Budget cont…
Data Purchased Data $2500.00› Software License for 10 weeks $5000.00› Software License (Manifold) $625.00Total Data Costs $8125.00
Travel Expenses 200 Miles @ .38 cents/mile $76.00
TOTAL PROJECT
COST $22,150.00

Final Deliverables
Report Poster CD
› Final Report› Maps and Final Poster› Data› Resources› Sources› Metadata
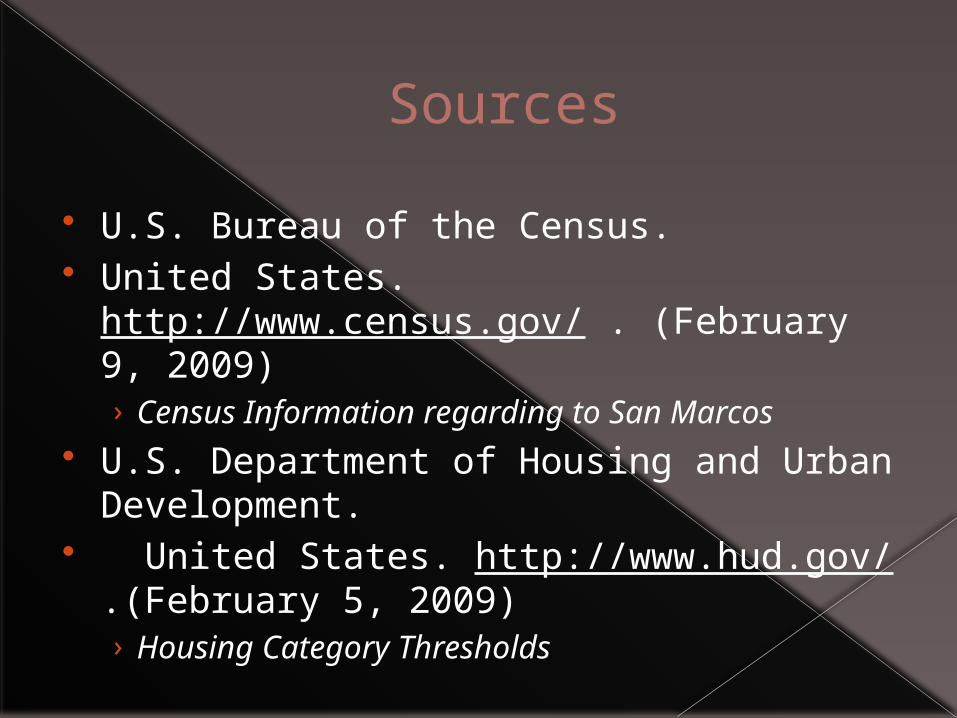
Sources
U.S. Bureau of the Census. United States. http://www.census.gov/ .
(February 9, 2009)› Census Information regarding to San Marcos
U.S. Department of Housing and Urban Development.
United States. http://www.hud.gov/ .(February 5, 2009)› Housing Category Thresholds

Sources Continued
U.S. Urban Land Institute. United States. http://www.uli.org/ .
(2009)› Definition of Low-Income Families
Inflation Data http://www.inflationdata.com/inflation/
Inflation_Rate/CurrentInflation.asp› Inflation rates and the state of economy

Progress
Isolated SF housing from data› Categorized based on predetermined value
thresholds Formulated a plan of action to
categorize and analyze our data

Conclusion
Inadequate affordable housing in San Marcos is a growing concern of the local government.
Our study stands to help develop a housing policy that garners affordable and owner-occupied housing.

Participation
Chase Chapman› Purpose› Scope› Data › Methodology› Assemble proposalRyan Hilliard› References› TimelineJason Snyder› Logo› Budget› MapsMarques Green› Summary› Implications› Conclusion› Income Inflation Rates

Questions?