Embed Size (px)
Citation preview

)-A228 571 NASARI/RD 90-177
FINAL REPORT
ORBIT TRANSFER ROCKET ENGINE
TECHNOLOGY PROGRAM
INTEGRATED CONTROLS AND HEALTH MONITORINGFIBEROPTIC SHAFT MONITOR FINAL REPORT
TASK E.5
Prepared by
P. Coleman, H. Darejeh, AND J. J. CollinsROCKWELL INTERNATIONAL CORPORATION
Rocketdyne Division
Prepared for
NA'r'- IAL AERONAUTICS AND SPACE ADMINISTRATION
November 1989
DTwCNASA-Lewis Research Center f ELECT E
Contract NAS3-23773 bOCT2 2 1 3
G. P. Richter, Project Manager Ed
CKETDYNE DIVISION OF ROCKWELL INTERNATIONAL CORPORATION6633 Canoga Avenue; Canoga Park, CA 91303
. .. , I.. . ;

1. Report No. 2. Government Accession No. 3. Recipients Catalog No.CR1 852101
4. Title and Subtitle 5. Report Date
Integrated Controls & Health Monitoring November 1989Fiberoptic Shaft Monitor Final Report 6. Performing Organization CodeTask E.5, Amendment 3
8. Performing Organization Report No.7. Author (s) RI/RD90-177
P. Coleman, J. Collins, H. Darejeh 10. Work Unit No.
9. Performing Organization Name and Address
Rockwell International - Rocketdyne Division 11 or Grant No.6633 Canoga Ave. . ContractNAS3-23773Canoga Park, CA 91303 13. Type of Report and Period Covered
12. Sponsoring agency Name and Address NASA Contract Final ReportNational Aeronautics and Space Administration 14. Sponsoring Agency CodeLewis Research Center, Cleveland, OH 44135
15. Supplementary Notes
NASA LeRC Task Monitor was Marc G. Millis
16. Abstract
Recent work has been carried out on development optical technology to providereal time monitoring of shaft speed, shaft axial displacement and shaft orbit of theOTVE hydrostatic bearing tester. Results show shaft axial displacement can beoptically measured (at the same time as shaft orbital motion and speed) to within0.3 mills by two fiberoptic deflectometers. This paper presents the final results ofthis condition monitoring development effort
17. Key words (Suggested by uthor (s) L . 18. Distribution Statement
" Condition mdnitoring, shaft position analyzer,optical shaft monitor~deflectometer uses, Unclassified - unlimitedfotometer uses, shaft proximetry.
19. Security Classif. (of this report) 20. Security Classif. (of this report) 21. No. of Pages 22. Price*
Unclassified Unclassified 19
For sale by the National Technical Information Service, Springfield, Virginia 22151

INTEGRATED CONTROL HEALTH MONITORING
FIBEROPTIC SHAFT MONITORING FINAL REPORT
FOREWORD
This document represents the final report to the National Aeronautics andSpace Administration for work performed under Task Order E.5 to Contract NAS3-23773. This task addressed an Integrated Controls and Health Monitoring(ICHM) technology requirement for the Orbit Transfer Rocket EngineTechnology Program. This is a summary report with all material discussedherein presented to NASA program personnel at oral presentations or in thecontractually required monthly program reports during active work on the task.
At Rocketdyne, the principle investigators were Messrs. P. Coleman,H. Darejeh, and J. Collins. Mr. R. P. Pauckert was the Program Manager, andMr. T. J. Harmon was the Project Engineer. The NASA LeRC Task Monitor wasMarc G. Millis.
Accession For
NTIS GRA&I w rlDTIC TA'BUnannounced 0
• "Justif1' I cz.tio 1--
By_Distr-ibutlor/
Availability Codes
Avail and/o;ist Speoa
RI/RD 90-177

Table of Contents
Summary 1
Introduction 2
Technical Description 3
Lab Testing 8
Future Issues 14
Conclusions 15
iiRI/RD 90-177

List of Figures
EiLre
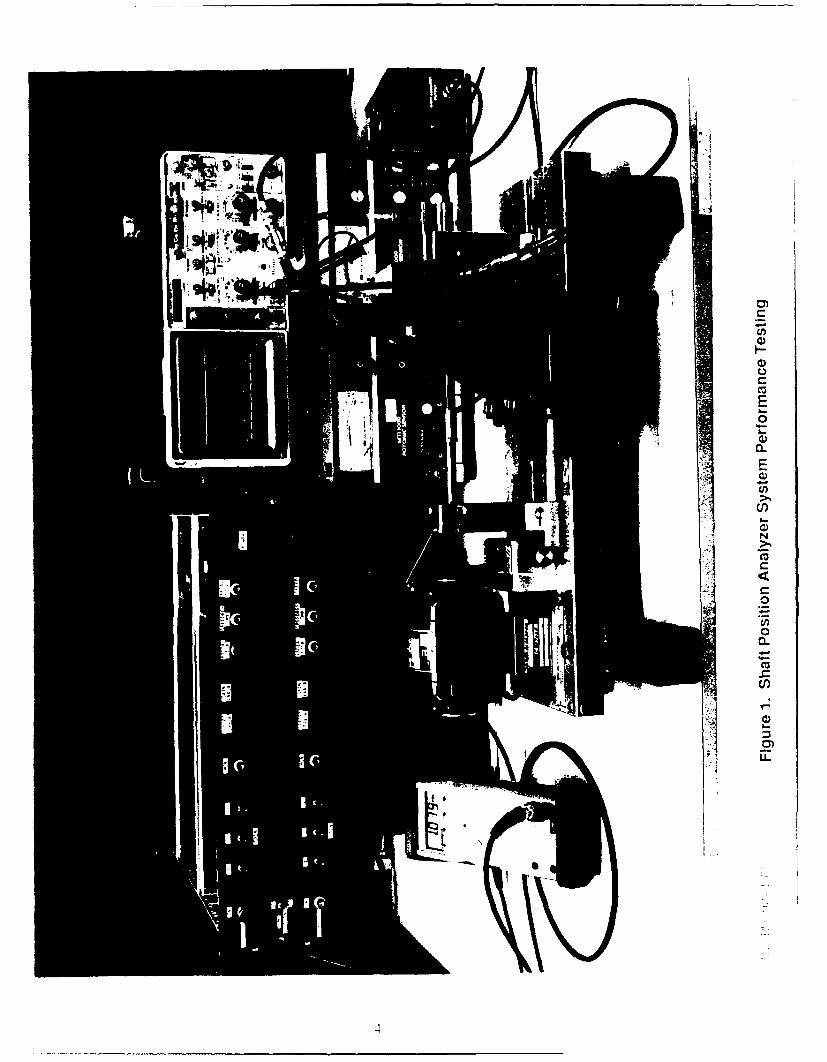
1 Soft Position Analyses System Performance Testing 4
2 Target Disk Surface Pattern 5
3 Probe View of Pattern 5
4 Close-up View of Target Disk and Surface Pattern 6
5 Optical Shaft Speed/Displacement Monitor 8
6 Cryogenic Pressure Testing System 9
7 Rotating Demonstrator schematic Hardware Configuration 11
8 Radial Displacement 12
9 Averaged Axial Displacement 13
i i i
RI/RD 90-177
Summary
Shaft dynamic behavior is a critical parameter in evaluating rocket engineturbopump component condition. Wear, erosion, spalling, pitting, and othersurface degradation processes result in measurable changes to shaft dynamicmotion. The measurement and interpretation of characteristic shaft motions canprovide vital data for determining which components may be degrading, and towhat extent the degradation has progressed.
This report describes the development of a turbopump shaft monitoringsystem using fiberoptic sensors. The system is intended to monitor shaft axialdisplacement, shaft orbit and shaft speed at up to 200,000 rpm. To providethese optical measurements, a method was developed to use a surface patternon the shaft to modulate light as a function of shaft axial and radial motion, andspeed. A fiberoptic deflectometer was adapted for use as the optical sensor. Asuitable pattern was found to be eight triangles of non-reflective material whosechange of reflectivity from that of shiny titanium shaft modulates the light in-tensity received by the deflectometer. This modulation in light intensity and theassociated time periods of the change in intensity indicate shaft axial and radialposition and shaft speed. Extraction of these measurements is accomplishedby a signal processing unit. The signal processor was designed to take theoutput of two orthogonal fiberoptic deflectometers which view this p3ttern, andto provide real-time voltages related to the amplitude of x,y and z motions, aswell as speed.
The project required:
* adaptation of the deflectometers to be used as the optical pickup
" development of a technique for economically applying a precisionpattern on the shaft
• selection of an appropriate shaft surface treatment for placement of thepattern
• development of an electronic signal analyzer to process the modulateddeflectometer signal for extraction of the shaft motion and speedinformation
Performance Tests Summary:
1. An evaluation was done of metallized fiberoptic probe tips sealed withsolder, and of standard deflectometer probe tips made by MechanicalTechnology Inc. (MTI). The standard MTI production probe tips weremanufactured with epoxies: Crest 810A&B, M-Bond 43B, and Hexcel3124. The metallized tips and the Crest 81 OA&B tips were pressure-testedat Rocketdyne to determine leakage at the interface between the fiber
RI/RD 90-177
bundle and the stainless steel ferrule. Hexcel 3124 was also pressuretested at a separate pressure joint in conjunction with other tests.
2. Laboratory tests of the shaft position monitor were carried out using twostandard laboratory 1/8" fiberoptic probes (by MTI) viewing a 2-inchdiameter Titanium disk spinning on a fabricated benchtop tester at up to10,000 rpm.
Results
1. Hexcel 3124 was selected as the adhesive sealant of choice for bondingthe deflectometer probe fibers for use in the LH2 environment. Specialheavy-duty, thick-walled probe tips were added to provide probe rigiditywhile a small fiber bundle diameter was selected to lower the susceptibilityof the fiber to slippage when the face is exposed to high pressure.
2. An electronics analyzer was designed and built to work with the opticalsignal to provide the following shaft motion sensitivity:
Axial motion: 140 millivolts/mil ± 0.34 mils over a range of 30 milsRadial motion: 8.72 millivolts/mil ±0.05 mils over a range of 50 mils.
Conclusion
The fiberoptic shaft monitor has been developed to provide real-timemeasurement of vital turbopump shaft dynamic parameters. Precise knowledgeof the turboshaft's dynamic motion will be of high value in the interpretation andconelation of measurement data from other sensors for the determination of thecondition of critical turbopump components.
Introduction
Accurate measurement of shaft speed, and shaft axial and radial motion isessential in turbopump performance studies. Also, knowledge of shaft motionhistory during normal operation may provide crucial information in thedetermination of probability of wear and possible reusability and fitness ofbearings and seal surfaces in the rotating turbopump stack. In high speedrocket engine turbopumps that perform up to 200,000 rpm, however, themeasurement response rates and shaft motion tolerances are outside the abili-ties of traditional commercial shaft monitoring devices. Thus, the developmentof a precision optical shaft monitoring system may be a crucial element in thedevelopment of a viable engine condition monitoring system.
This program is aimed at developing an optical shaft monitor to providehigh precision motion measurement (on the order of tens of micro-inchsensitivity) over a wide dynamic range. Also, this system will provide both axialand radial motion, as well as speed from the analysis of the output of two opticalsensors placed perpendicular to the shaft. This system eliminates the need for
2RI/RD 90-177
two of the four ports that would normally be required in the turbopump to makethese shaft motion measurements: two ports for radial motion, one port forspeed, and one port on the shaft end to monitor axial motion. Furthermore, thissystem provides a way of measuring shaft axial motion without interfering withthe geometry of the pump outlet area (typically wrapped around the pump endof a combined power/pump shaft) or with the turbine inlet area (at the other endof the shaft).
In previous work prior to this contract, the feasibility of measuring shaftmotion (x,y,z) and speed by monitoring special patterns on the shaft wasexperimentally validated in the lab. Also, a photo-reduction technique formaking a high resolution stencil for the pattern on the shaft was evolved andtested. Finally, a titanium surface treatment called Tiodizing was selected andtested. This program builds upon this previous work and takes on the tasks ofadapting the optical sensors to the cryogenic conditions of the hydrostatic bear-ing tester as well as developing a demonstration electronic signal processor todecode the shaft data.
Although this analyzer was built to process signals from a pair of fiberopticsensors, laboratory experiments have shown that other sensor approaches incombination with a shaped plated strip on the shaft can also be made to workquite well. For example, with proper shaft surface deposits and machining,either a ferromagnetic torquemeter or an inductive or capacitive proximeter canbe adapted to work with this processing technique, although with reducedspeed, sensitivity and range. The shaft dynamic motion analyzer is intended tobe part of a comprehensive condition monitoring system for reusable rocketengine turt opumps.
In addition to higher precision, reliability, and improved sensitivity anddynamic range of an optical shaft monitor, this measurement system requiresfewer sensor ports than conventional sensor approaches for obtaining thesesame shaft motion measurements. Also, conventional inductive and capacitiveproximetry sensors usually require special machined notches on the shaft toprovide measurement, distance calibration and revolution counting. Suchnotches on a high speed shaft might cause performance degrading turbulencein liquid hydrogen. Thus the optical sensor approach, that did not requirechanges to the shaft circumferential geometry, was selected. The resulting shaftposition analyzer system that was developed in this program is shown inFigure 1.
Technical Description
The sensors are configured to detect changes in reflected optical energyfrom a triangular pattern on a one-inch diameter shaft (see Figure 2). Onesensor is positioned normal to the shaft in a horizontal (x) position; the secondsensor is positioned normal to the shaft in the vertical (y) position. The absolute
3RI/RD 90-177
IL-
1 4-
air,

Sensor #1
Sensor #2
Figure 2 Target disk surface pattern
axial (z) position of the sensor relative to the center of the triangular pattern onthe shaft is indicated by the ratio of the periods of light and dark patternsdetected on the shaft. Shaft velocity is detected as the rate of detectedtriangular patterns. Radial position on a relative scale may be determined frommeasurement of the magnitude of changes in reflected light intensity created bythe triangular pattern in each axis (see Figures 3 & 4).
1/16 Inch DeflectometerB Probe tip
qAI i I0.786 In PuIsewidth 0.786 I ulsewldth
0.125 In 0.125 InNo displacement of Displacement ofdeflectometer defiectometer
Figure 3 Probe view of pattern
5RI/RD 90-177

CI-04-4-0
000
Cl)
C0
U)
0
0
0.
U)0C)
0I..
0)ir
NN
0
:'a.
6

The triangular pattern on the shaft has eight identical symmetric trianglesplaced end to end along the circumferential surface of the shaft. The height ofthe triangles in the direction parallel to the axis of the shaft is nominally 0.125inch. The initial focal point of each optical sensor is positioned to the nominalaxial midpoint of the triangular pattern. The measured axial position from thesignal conditioning unit indicates the absolute deviation of the focal point of thesensor from the exact midpoint of the triangular pattern on the shaft. The rangeof axial measurement is nominally about 30 mils. The measured resolution(minimum resolvable motion increment) is nominally 0.030 mils at shaft speedsup to 10,000 rpm. Since the measurement is based on the ratio between thelight and dark patterns, the resolution is expected to be relatively unchanged upto the frequency response limit of the deflectometers (about 140,000 rpm).
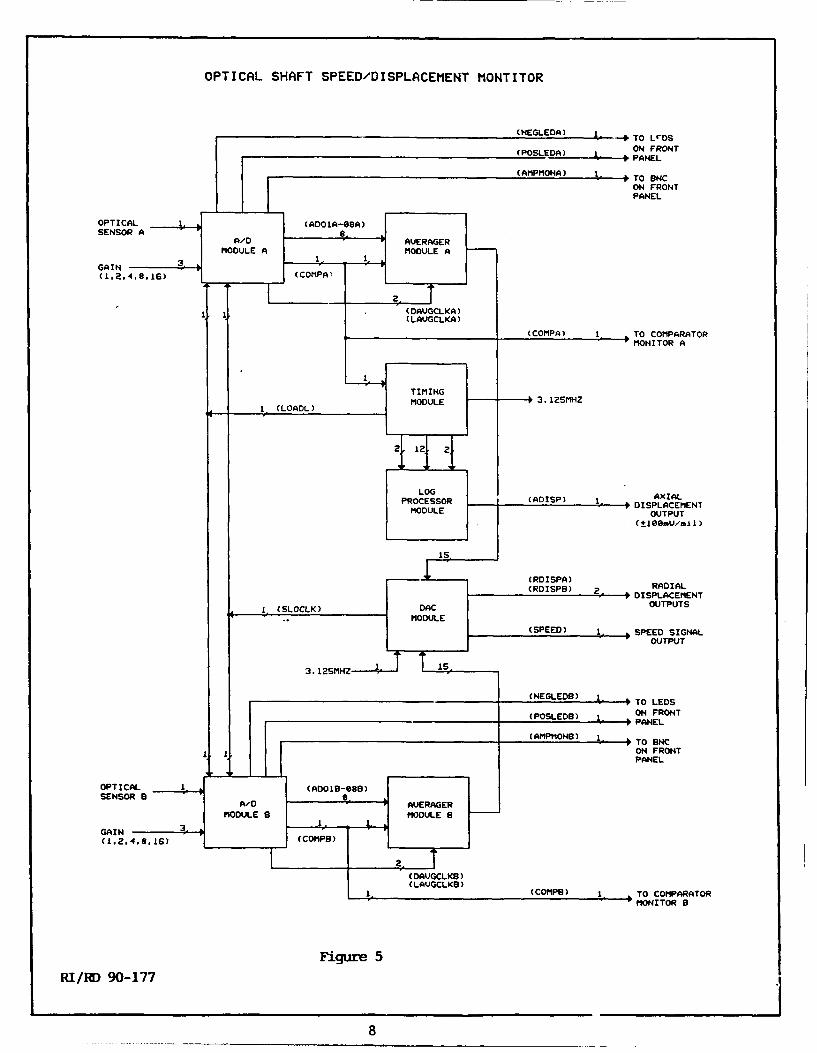
Each sensor output is DC coupled to the input amplifier in the signalconditioning unit (see Figure 5). The gain and input offset are set by theoperator for maximum sensitivity with no indication of gain or offset errors.When properly adjusted, the amplifier output will fluctuate approximatelysymmetrically about 2.5 volts. When the amplifier is set as described above, aDC reference is automatically set in the signal conditioning unit, relative to theintensity of reflected light when the sensor encounters the dark portion of thetriangular pattern. Radial position, on a relative scale, is determined bymeasurement of the average intensity of reflected light (relative to the DC ref-erence) when the sensor encounters the light portion of the rectangular pattern.Radial position measurements are updated 16 times per shaft revolution.
The range of the radial measurement is about 50 mils, based upon thebackslope output calibration curves of the deflectometers used. The measuredminimum resolution of radial motion is at least better than 25 micro-inches, atspeeds up to 10,000 rpm, which is the limit of our benchtop speed and motionmeasurement capability.
The minimum resolution of deflectometers is generally limited by theelectronic noise level of the deflectometer amplifier. However, the shaft monitoranalyzer averages out a significant portion of the random instrument noise, andthus extends the useful resolution to a much lower value than is otherwiseexpected. Thus, we expect the actual resolution of this system to be closer to ±5micro-inches up to ttre frequency response limit of the optical deflectometers(about 140,000 rpm). The analog signal from each optical sensor is convertedto digital form by a flash encoder with a 0 to 5 volt range. If the signal goesnegative or exceeds the range of the flash encoder, LED indicators on the frontpanel warn the operator of "offset" or "gain" error. One digital peak detectorsearches for the maximum signal level and a second digital peak detectorsearches for the minimum signal level. An arithmetic unit computes a valuemidway between the minimum and maximum levels and outputs this value inanalog form as a reference for the comparitor that detects the transitions fromthe light and dark regions of the triangular pattem.
The comparitor output for each signal channel and the digital values fromthe flash encoder for each signal channel are processed with pipeline parallel
7RI/RD 90-177
OPTICAL SHAFT SPEED/DISPLACEMENT MONTITOR
(NEGLEDA) -TO LrDS
(POSEDA)ON FRONT(POSEDA)~ ~PANEL
(AMPMONA) 1- TO BNC
ON FRONT
PANEL
GA IN
____________________ COMP) I TO COMPARATOR(COMPA)MONITOR A
LOG AXIALPROCESSOR ___ (ADISP) IDISPLACEMENT
MODULEOUTPUT(±100mU'mii)
(RDISPA) RDA
(RDISPB) 20 I DISPLACEMENT
1. (SOCLK DACOUTPUTS
(SPEED) I. SPEED SIGNALOUTPUT
_______ (EGLEOB) I b TO LEDS(POSLDS) -, bON FRONT(POLED) ~ I PANEL
(AMPMONB) 10 0 TO BNCON FRONT
1 1 PANEL
GAIN
(COMPS) I TO COMPARATORMONITOR 8
Figure 5
RI/I() 90-177
8
arithmetic circuits to obtain the required measurements of speed, axial andradial position. Results are converted to analog form for use by the operator.The prototype model does not include a computer interface module. Futuremodels should use a remote computer for automatic control, scaling, displayand data recording.
Lab Testing
Construction of the fiberoptic probes was crucial to the successfulcryogenic operation of the sensors. The major factor in the production of thesensors by MTI was the choice of sealant for the interstices between the fibersand the interface between the stainless steel ferrule and the fiber bundle.Rocketdyne ME&T personnel recommended three possible cryogenic sealant/epoxies that might fit the requirements for operation of the fiberoptic probe:Crest 31OA&B, M Bond-43B, and Hexcel 3124. Also, a metallized fiber bundlethat had been sealed with solder was proposed by Spectran Fberopticscompany as a possible general purpose construction solution suitable for mostof our demanding cryogenic applications (LOX as well as LH2). Spectranprovided samples to MTI for the manufacture of test probes which wereprovided to us at no cost for testing. Several fiber bundles with epoxy sealantswere tested, as were the metallized fiber bundles.
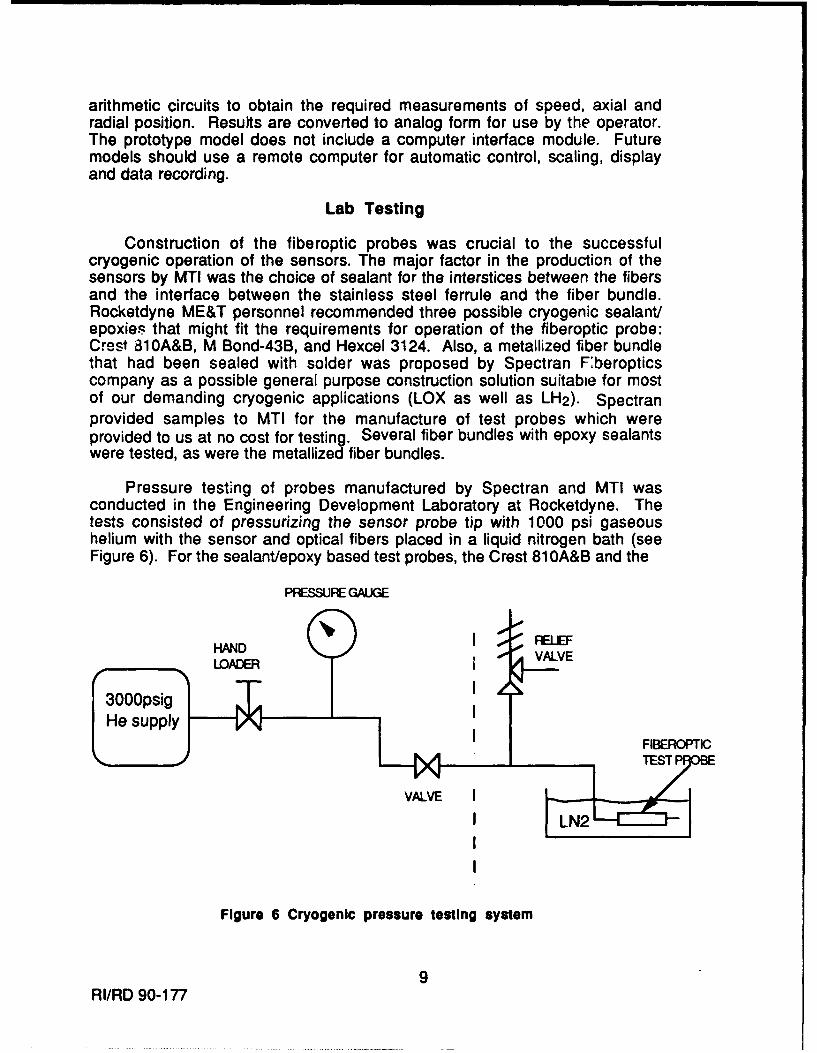
Pressure testing of probes manufactured by Spectran and MTI wasconducted in the Engineering Development Laboratory at Rocketdyne. Thetests consisted of pressurizing the sensor probe tip with 1000 psi gaseoushelium with the sensor and optical fibers placed in a liquid nitrogen bath (seeFigure 6). For the sealant/epoxy based test probes, the Crest 81 OA&B and the
PRESSURE GAUGE
HAND RELIEF
LHe supplyj
FIBEROPlIC
VALVE I
Figure 6 Cryogenic pressure testing system
9RI/RD 90-177

M Bond-43B were both found to be inadequate for the probe manufactureprocess. Crest 81OA&B had insufficient bonding strength at room temperature,and the fibers shattered during the final surface finishing process. M Bond-43Bwas too thin to fill the interstitial pores between the fibers, and thus failed theleak test. Finally, although no sample probes were made with Hexcel 3124, wedid use this bonding material to provide a joint seal in the pressure test; it wasfound to have good room temperature working consistency and providedadequate high pressure seal in the cryogen. The metallized Spectran probesleaked between the fiber bundle and the stainless steel ferrule whenpressurized to 400 psi. On inspection it was deduced that the flux in the solderhad left voids which provided a leak path. Also, the solder had not adhered tothe stainless steel outer ferrule. This technique might work if a non-flux solderwere used and if the outer ferrule were made of a material more compatible tosolder adherence (for example Inconel). Choice of solder could be expanded,or brazing techniques could even be used if the metallized fibers were made ofa material with higher temperature resistance. Since it could potentially reducecosts to instrument future cryogenic applications for the deflectometers if an off-the-shelf ruggedized deflectometer could be evolved, it would be worthwhile topursue inexpensive metallized fiber soldering or brazing techniques in futureprograms.
To serve this program's schedule and budget, Hexcel 3124 was selectedas an adequate choice of sealant for the deflectometer construction. Ourselection of this material was based on substantial previous experience withHexcel 3124 in and around LH 2 environments as well as observedperformance adjunctive to the process of testing the other probes. A finisheddeflectometer probe made by MTI with Hexcel 3124 was tested with 1000 psigaseous Helium at ambient and liquid nitrogen temperatures. No leaks wereobserved in the fiberoptic probe, although the teflon seal in the fixture holdingthe probe leaked in LN2 . These tests were repeated several times yielding thesame results. After these pressure tests, the deflectometer was connected to itselectronics module and functioned normally.
Because the main criteria for construction of the deflectometer probes wassurvivability in a pressurized LH2 environment, and because cost containmentwas crucial, the probes were manufactured by MTI on a best effort basis. Thus,while the manufacturer did attain the survivability criteria, the as-deliveredfrequency responses of each of the four purchased deflectometers weresomewhat less than the original target value (60 KHz) requested; the deliveredinstruments ranged from 27 KHz to 40 KHz. These reduced frequencyresponses will limit the operating range of this demonstration shaft monitoringsystem to about 140,000 rpm.
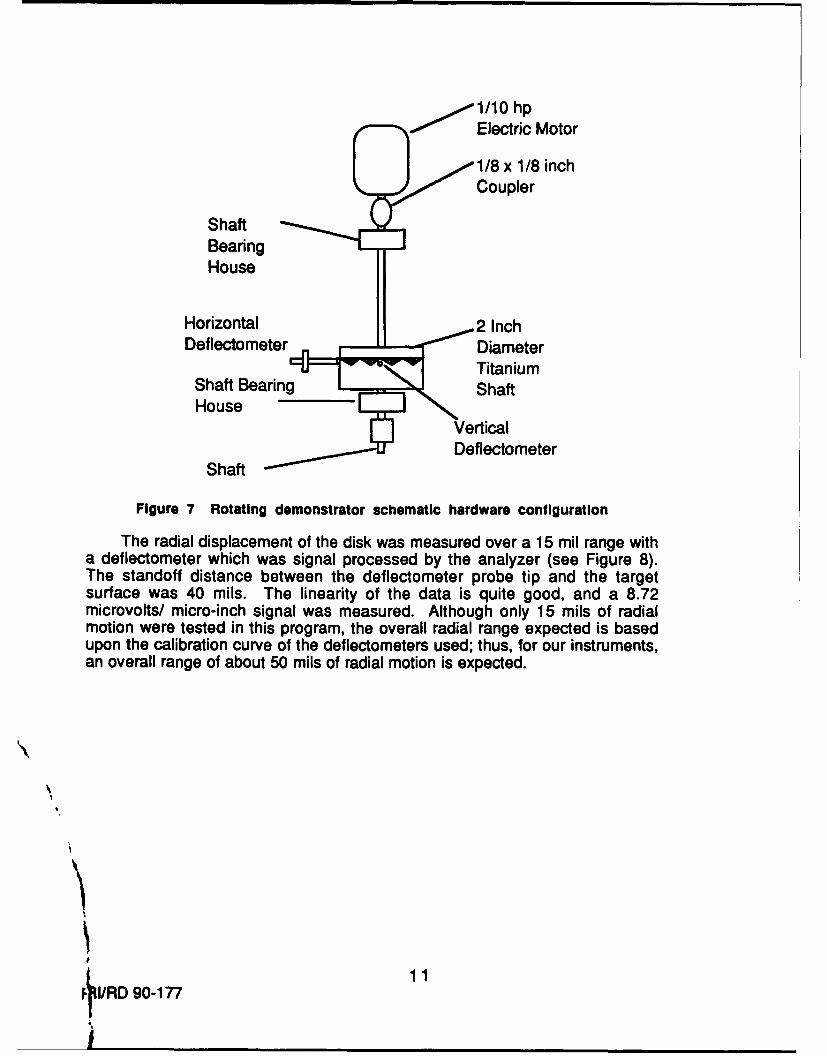
In order to test the shaft position analyzer on a rotating system, two generalpurpose calibrating fiberoptic deflectometers were positioned orthogonally tothe surface pattern on a target titanium disk on a lab rotating demonstrator (seeFigure 7).
10RI/RD 90-177
1/10 hpElectric Motor
1/8 x 1/8 inchCoupler
ShaftBearingHouse
Horizontal 2 InchDeflectometer Diameter~Titanium
Shaft BearingHouse
[] VerticalDeflectometer
Shaft
Figure 7 Rotating demonstrator schematic hardware configuration
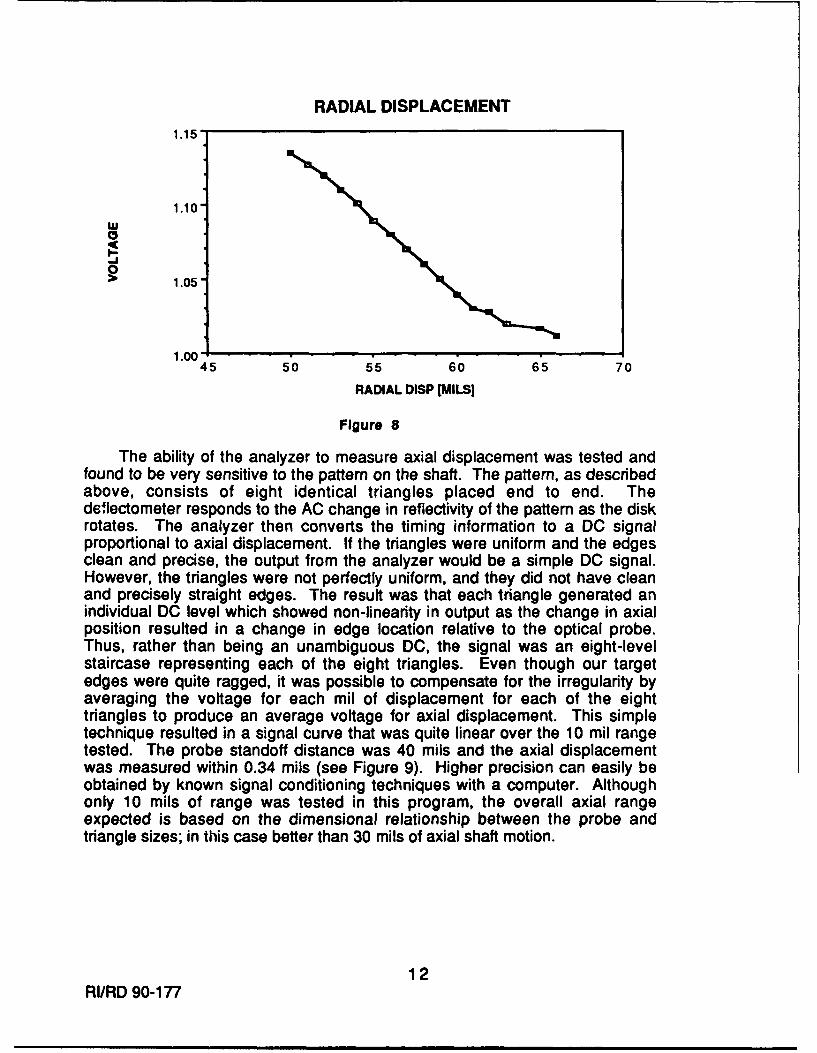
The radial displacement of the disk was measured over a 15 mil range witha deflectometer which was signal processed by the analyzer (see Figure 8).The standoff distance between the deflectometer probe tip and the targetsurface was 40 mils. The linearity of the data is quite good, and a 8.72microvolts/ micro-inch signal was measured. Although only 15 mils of radialmotion were tested in this program, the overall radial range expected is basedupon the calibration curve of the deflectometers used; thus, for our instruments,an overall range of about 50 mils of radial motion is expected.
NI
FVRD 90-177 1
RADIAL DISPLACEMENT1.15'
1.10W
..1
1.051
1.00
45 50 55 60 65 70
RADIAL DISP [MILS]
Figure 8
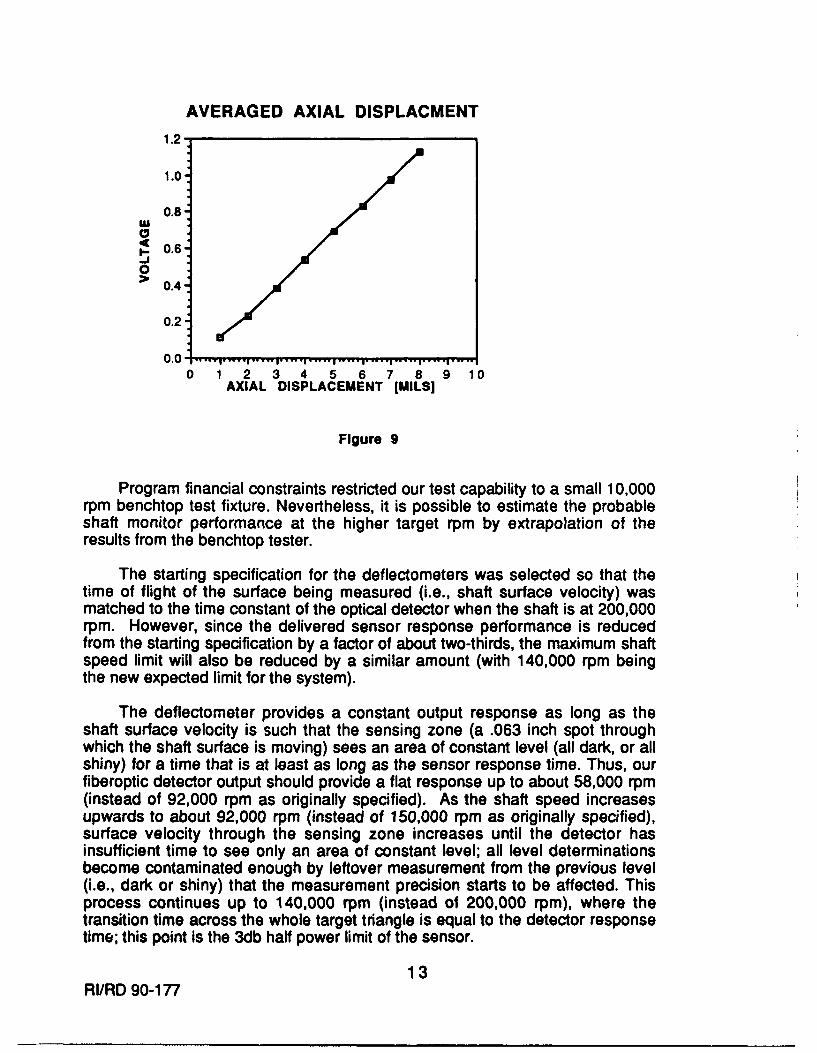
The ability of the analyzer to measure axial displacement was tested andfound to be very sensitive to the pattern on the shaft. The pattern, as describedabove, consists of eight identical triangles placed end to end. Thedeflectometer responds to the AC change in reflectivity of the pattern as the diskrotates. The analyzer then converts the timing information to a DC signalproportional to axial displacement. If the triangles were uniform and the edgesclean and precise, the output from the analyzer would be a simple DC signal.However, the triangles were not perfectly uniform, and they did not have cleanand precisely straight edges. The result was that each triangle generated anindividual DC level which showed non-linearity in output as the change in axialposition resulted in a change in edge location relative to the optical probe.Thus, rather than being an unambiguous DC, the signal was an eight-levelstaircase representing each of the eight triangles. Even though our targetedges were quite ragged, it was possible to compensate for the irregularity byaveraging the voltage for each mil of displacement for each of the eighttriangles to produce an average voltage for axial displacement. This simpletechnique resulted in a signal curve that was quite linear over the 10 mil rangetested. The probe standoff distance was 40 mils and the axial displacementwas measured within 0.34 mils (see Figure 9). Higher precision can easily beobtained by known signal conditioning techniques with a computer. Althoughonly 10 mils of range was tested in this program, the overall axial rangeexpected is based on the dimensional relationship between the probe andtriangle sizes; in this case better than 30 mils of axial shaft motion.
12RI/RD 90-177
AVERAGED AXIAL DISPLACMENT
1.2
1.0
0.8
- 0.6
0> 0.4
0.2
0.01 . 1 1 ..................... I I I I0 1 2 3 4 5 6 7 8 9 10
AXIAL DISPLACEMENT [MILS]
Figure 9
Program financial constraints restricted our test capability to a small 10,000rpm benchtop test fixture. Nevertheless, it is possible to estimate the probableshaft monitor performance at the higher target rpm by extrapolation of theresults from the benchtop tester.
The starting specification for the deflectometers was selected so that thetime of flight of the surface being measured (i.e., shaft surface velocity) wasmatched to the time constant of the optical detector when the shaft is at 200,000rpm. However, since the delivered sensor response performance is reducedfrom the starting specification by a factor of about two-thirds, the maximum shaftspeed limit will also be reduced by a similar amount (with 140,000 rpm beingthe new expected limit for the system).
The deflectometer provides a constant output response as long as theshaft surface velocity is such that the sensing zone (a .063 inch spot throughwhich the shaft surface is moving) sees an area of constant level (all dark, or allshiny) for a time that is at least as long as the sensor response time. Thus, ourfiberoptic detector output should provide a flat response up to about 58,000 rpm(instead of 92,000 rpm as originally specified). As the shaft speed increasesupwards to about 92,000 rpm (instead of 150,000 rpm as originally specified),surface velocity through the sensing zone increases until the detector hasinsufficient time to see only an area of constant level; all level determinationsbecome contaminated enough by leftover measurement from the previous level(i.e., dark or shiny) that the measurement precision starts to be affected. Thisprocess continues up to 140,000 rpm (instead of 200,000 rpm), where thetransition time across the whole target triangle is equal to the detector responsetime; this point is the 3db half power limit of the sensor.
13RI/RD 90-177
The slight degradation in sensor precision described above should haveonly a small effect on the radial measurement, and probably will beunnoticeable in its effect on the axial measurement. The analyzer signalconditioner includes circuitry that interpolates points between measurementsand synthesizes additional measurements to improve the processor samplingstatistics; this also smooths the apparent continuity of motion in shaftmeasurements. One of the effects of this provision is to maintain the radialmotion sensitivity of the shaft monitor, with only a slight sacrifice in precision.The slight decrease in precision becomes advantageous for axial motiondetermination since it diminishes the sensitivity to non-uniformity in the targetedges.
A data display and plotting code compatible with the output of this analyzerhas been developed under another project that will allow test engineers toaccumulate and display a time history plot of the shaft orbital motion data fromthis system during use in tests.
Future Issues
Some of the main issues that will need to be addressed in the futureinclude compensation for two-phase flow perturbations, issues concerningpattern quality and placement on the shaft, alterations in the target surfacereflectance after installation, and computer interfacing. These subjects arediscussed in the following paragraphs.
Wherever possible, the measurement environment where optic sensorsare to be used should be designed so that two-phase flow is not present. Ifoptical sensors must be used in an environment where bubbles can occur in thefluid media, the signal data can be perturbed by random occlusion of the lightpath as the bubbles pass between the fiberoptic sensor and the target surface.These occlusions would be manifested as sudden decrease events in lightintensity which could confuse the processing electronics in the analyzer. Someimmunity to the effects of the perturbations could be acquired by phaselock looptracking and signal gating, by signal conditioning with pattern recognition toexclude questionable data, and by the addition of sensors to provide "voting"capability so that data that is not coherent with shaft motion is excluded.
The shaft monitor is sensitive to target pattem irregularity, edge roughness,and surface finish. Increased precision in target uniformity can be achieved bycareful development of the target stencil or mask so that all of the triangles areprecisely uniform. A large-scale drawing can be produced on a draftingcomputer, and photographically reduced to the dimensions needed for the shaftsurface treatment mask stencil. Better methods need to be developed forcopying the stencil onto a media that can serve as a mask for the selectedsurface treatment. Outlining the target triangle edges with a machined scribeline might increase the sharpness in the demarcation edge between the darkand the shiny areas of the target; this could substantially improve the axialmotion measurement precision, although it might introduce reflectance
14RI/RD 90-177
variables that would need to be processed out. Surface finish of the target areamust be polished to a roughness level that is less than the minimum detectabledistance increment. For most applications a finish of about ± 10 micro-inchesinsures that surface irregularities will not interfere with the measurement.Where high radial motion precision is needed, a finish of ±2 micro-inches maybe desirable.
Degradation of the finished (shiny) surfaces may occur due to oxidation bythe fluid media, contamination with solvent residues, and from dirt or oil fromhandling. Mechanical scratching of the high finish surfaces can degrade thereflectance significantly. This commonly occurs during shaft installation byscraping against other components or by rough handling. The finish can alsobe seriously degraded by misguided attempts at polishing with inappropriatetissues and cloth; once the finish is prepared, it should only be touched withoptical grade lens tissue, and even then with extreme care. Finally, one of themost common sources of scratching and gouging of the target finish is fromdirect contact with the deflectometer probe face, especially during calibration.
Many of the adjustment and calibration features of this instrument systemare inefficient and difficult, and should be managed by a computer interfacemodule. Such an interface would be modelled on our previous similarprocessing controllers, and should not prove difficult or expensive to construct.The typical approach would include provisions for data acquisition on allchannels, and special processing for pattern recognition, and shaft clocking.
Conclusions
The shaft position analyzer has been successfully developed to measureshaft speed, shaft axial and shaft radial displacement with a pair of opticalsensors. Laboratory tests demonstrated the system operates up tomeasurement expectations in a tester at speeds up to 10,000 rpm. The opticalsensors have been constructed for use in a 200,000 rpm LH2 environment, and,except for probe pressure environment leak checks which will be done in thenear future, the system is ready for use in its targeted turbomachinery tests.
Recommendations for Future Technology Development
1. The next development stage for the shaft analyzer system would be theinclusion of a computer interface to allow direct interaction between theanalyzer and a data storage/analysis/display computer.
2. Develop alternative methods of low-cost fiber metallization and soldering(or brazing) leading to a relatively inexpensive off-the-shelf fiber bundlemethodology that would reduce deflectometer costs in cryogenicturbopump test applications.
15RI/RD 90-177