Embed Size (px)
Citation preview
A subset of alternative investments that incorporate all investment strategies run with an orientation to producing primariloy absolute returns using largely marketable securities
A private and unregisterd investment pool that employs sophisticated hedging and arbitrage techniques to trade in the corporate equity markets
“Hedge funds are investment pools that are relatively unconstrained in what they do. They are relatively unregulated (for now), charge very high fees, will not necessarily give you your money back when you want it, and will generally not tell you what they do. They are supposed to make money all the time, and when they fail at this, their inestors redeem and go to someone else who has recently been making money. Every three or four years, they deliver a one-in-a-hundred-year flood.”
The first hedge fund was set up by Alfred W. Jones 1949 Used short sales, leverage and fees Converted from general partnership to limited
partnership in 1952 Publicized in 1966 in article in Fortune magazine
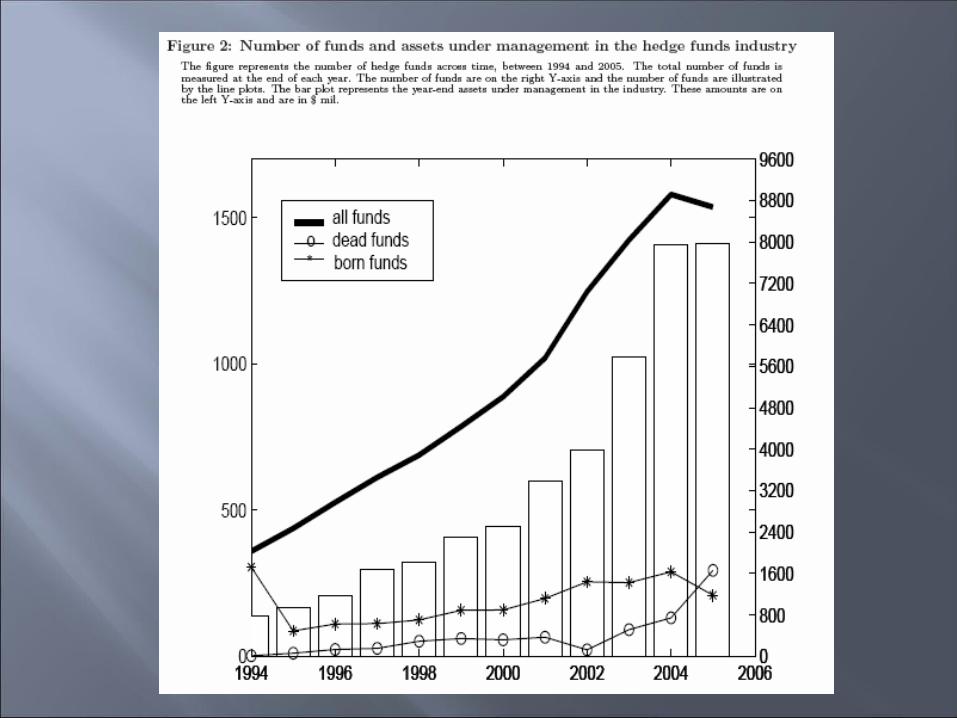
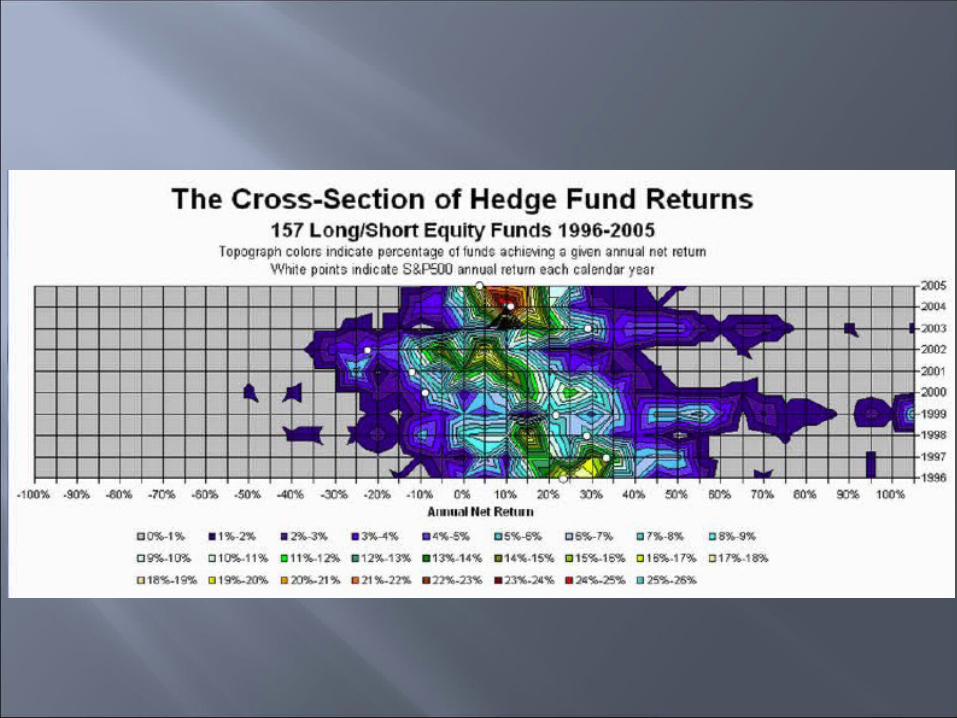
Growth from 1986-1993 and following collapse of tech bubble in 2002 Hedge funds did relatively well in 2000 - 2002
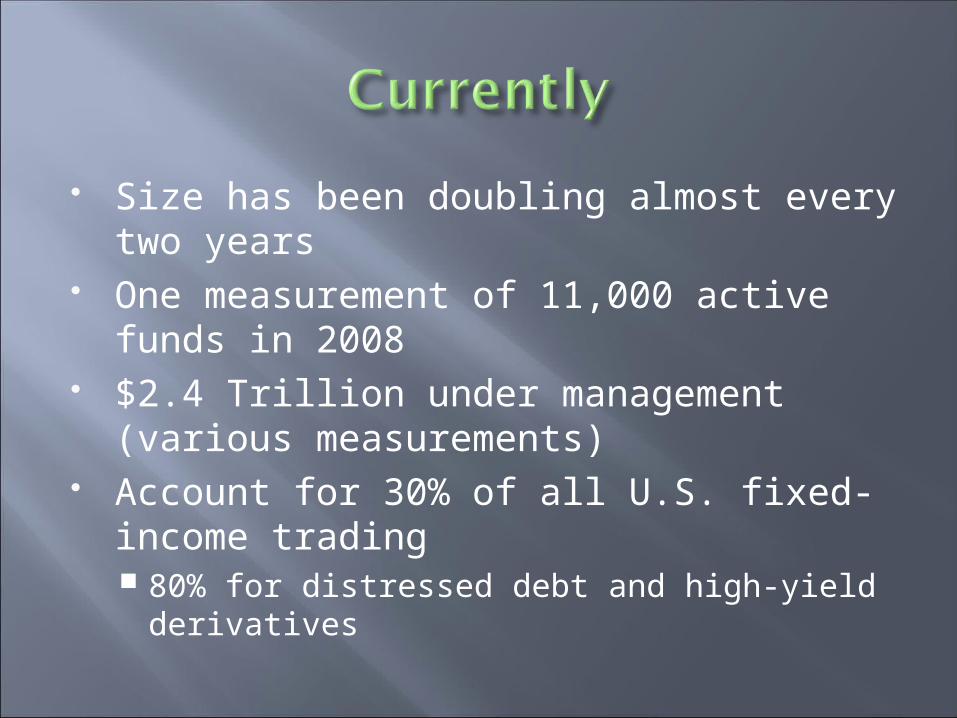
Size has been doubling almost every two years
One measurement of 11,000 active funds in 2008
$2.4 Trillion under management (various measurements)
Account for 30% of all U.S. fixed-income trading 80% for distressed debt and high-yield
derivatives
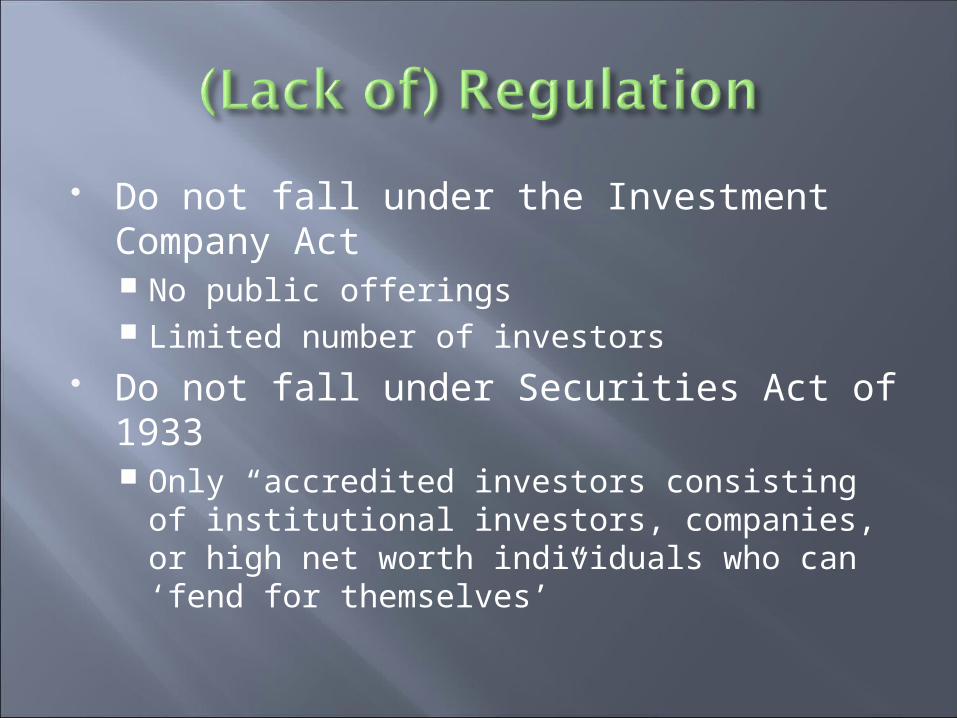
Do not fall under the Investment Company Act No public offerings Limited number of investors
Do not fall under Securities Act of 1933 Only “accredited investors consisting of
institutional investors, companies, or high net worth individuals who can ‘fend for themselves’”
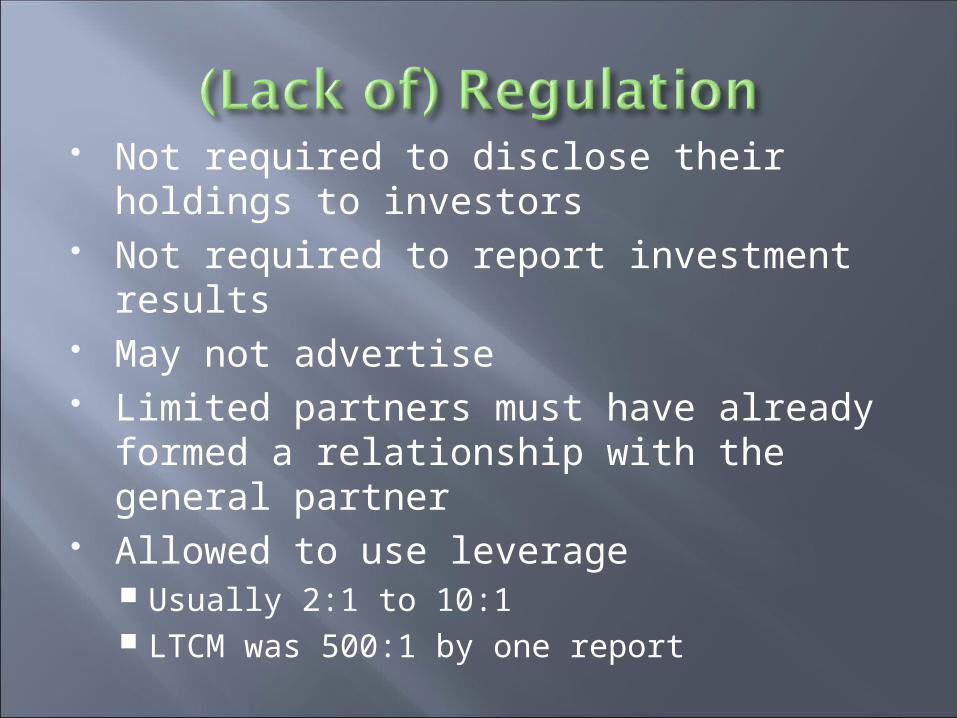
Not required to disclose their holdings to investors
Not required to report investment results May not advertise Limited partners must have already
formed a relationship with the general partner
Allowed to use leverage Usually 2:1 to 10:1 LTCM was 500:1 by one report
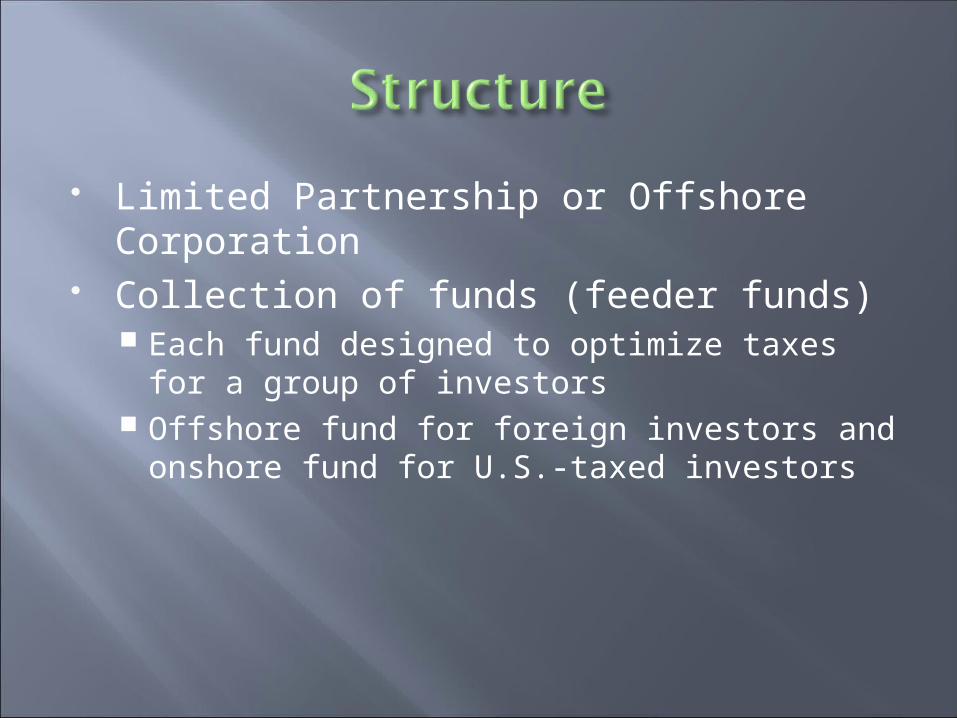
Limited Partnership or Offshore Corporation
Collection of funds (feeder funds) Each fund designed to optimize taxes for a
group of investors Offshore fund for foreign investors and
onshore fund for U.S.-taxed investors
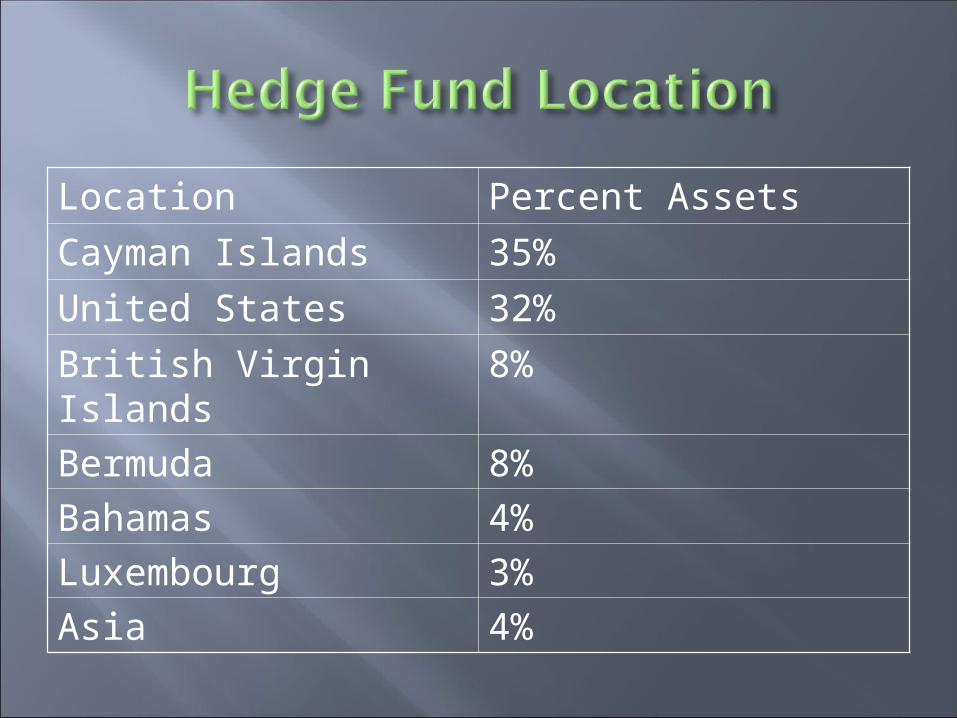
Location Percent Assets
Cayman Islands 35%
United States 32%
British Virgin Islands 8%
Bermuda 8%
Bahamas 4%
Luxembourg 3%
Asia 4%
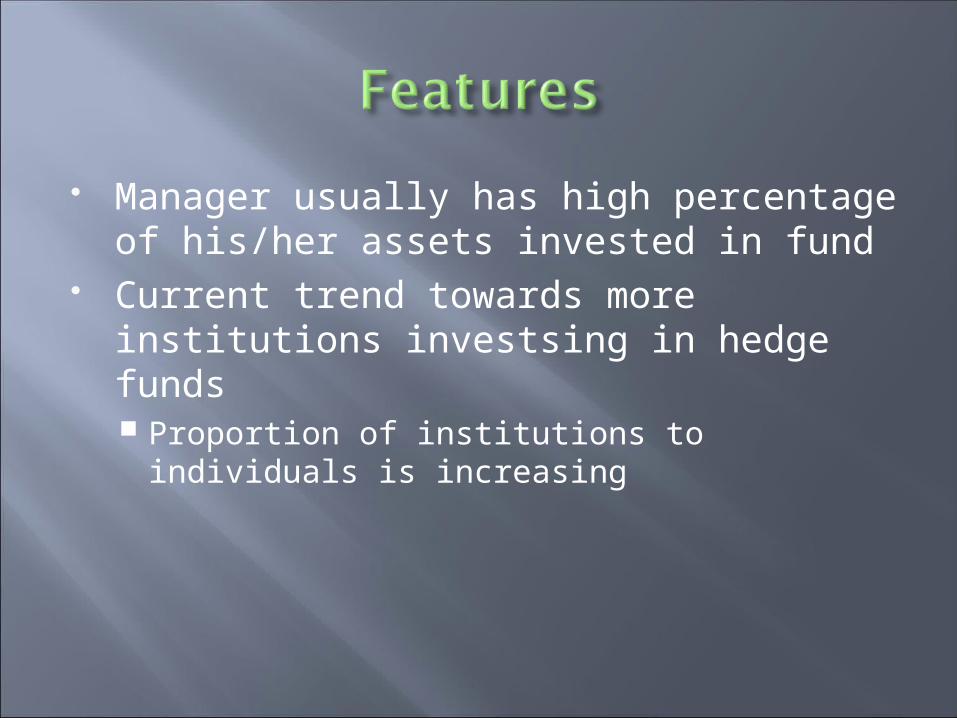
Manager usually has high percentage of his/her assets invested in fund
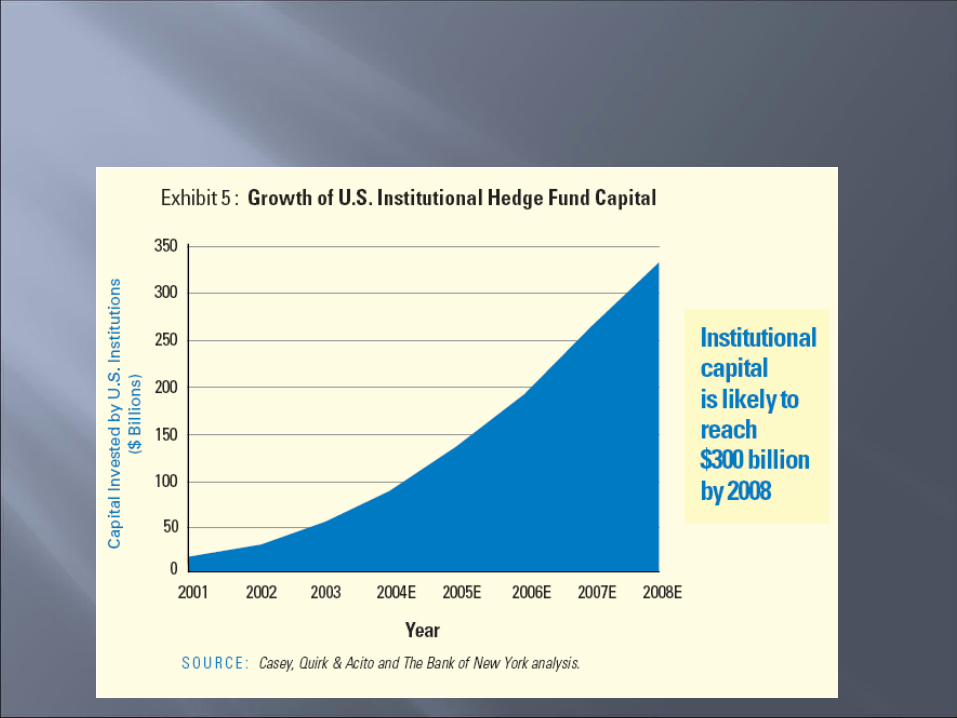
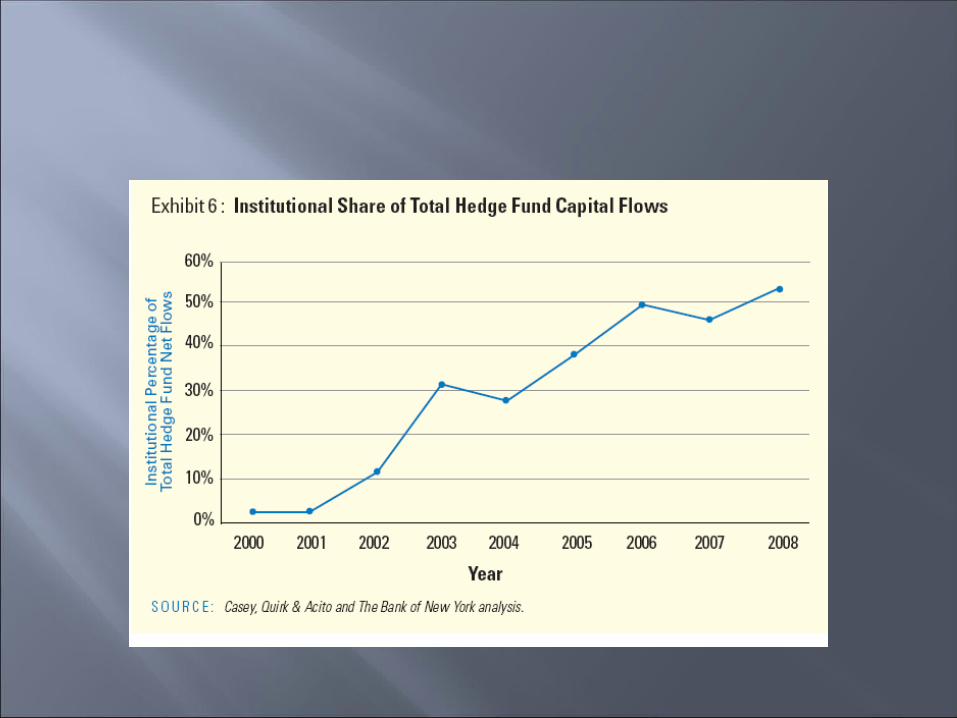
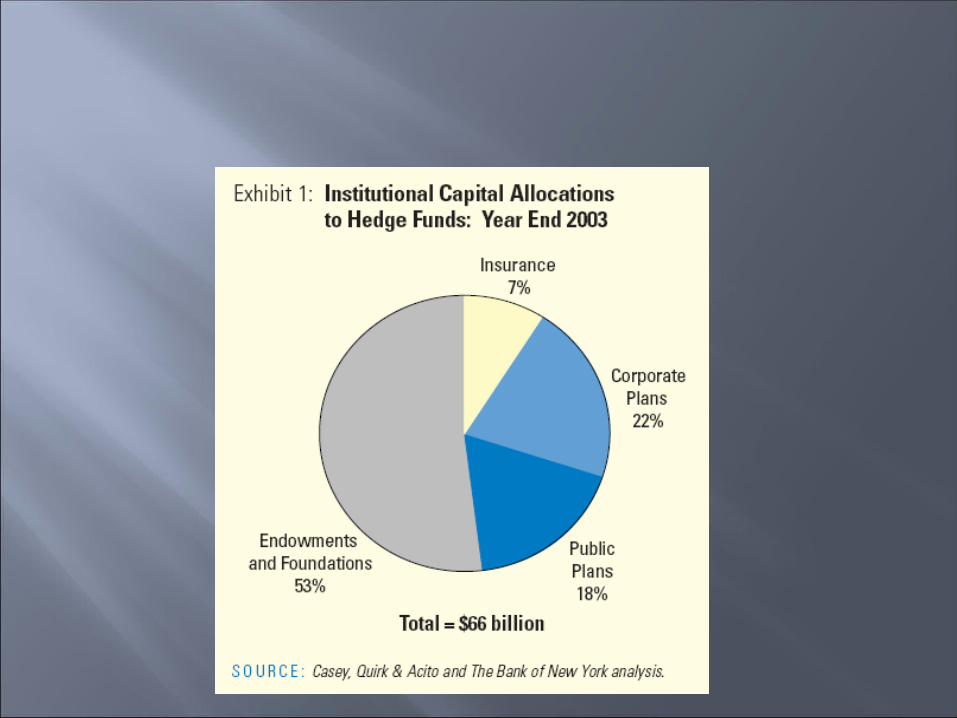
Current trend towards more institutions investsing in hedge funds Proportion of institutions to individuals is
increasing
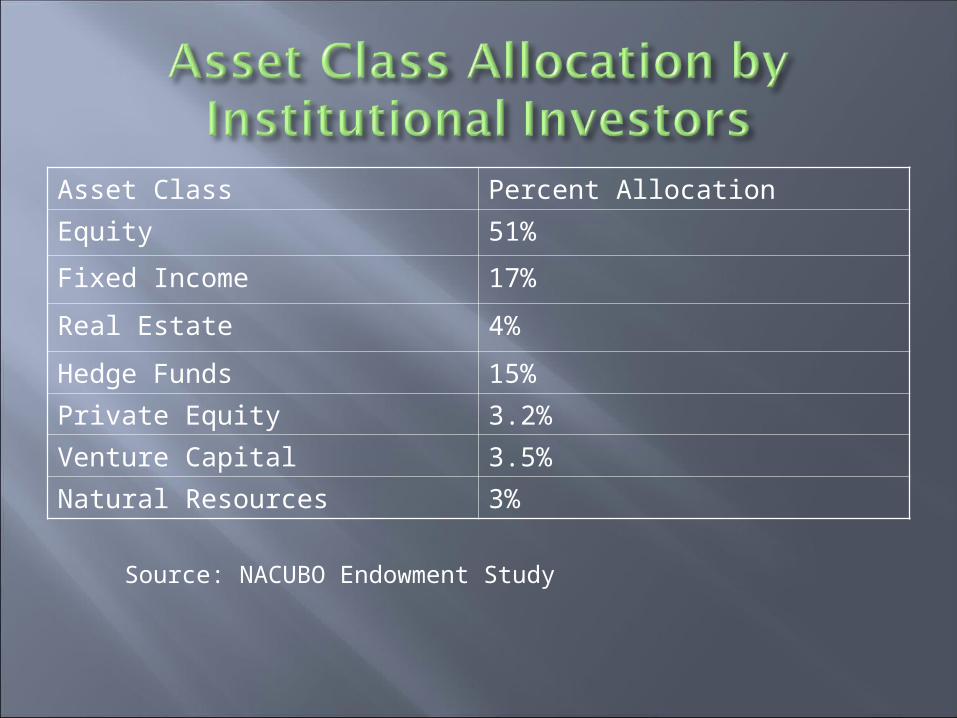
Asset Class Percent Allocation
Equity 51%
Fixed Income 17%
Real Estate 4%
Hedge Funds 15%
Private Equity 3.2%
Venture Capital 3.5%
Natural Resources 3%
Source: NACUBO Endowment Study
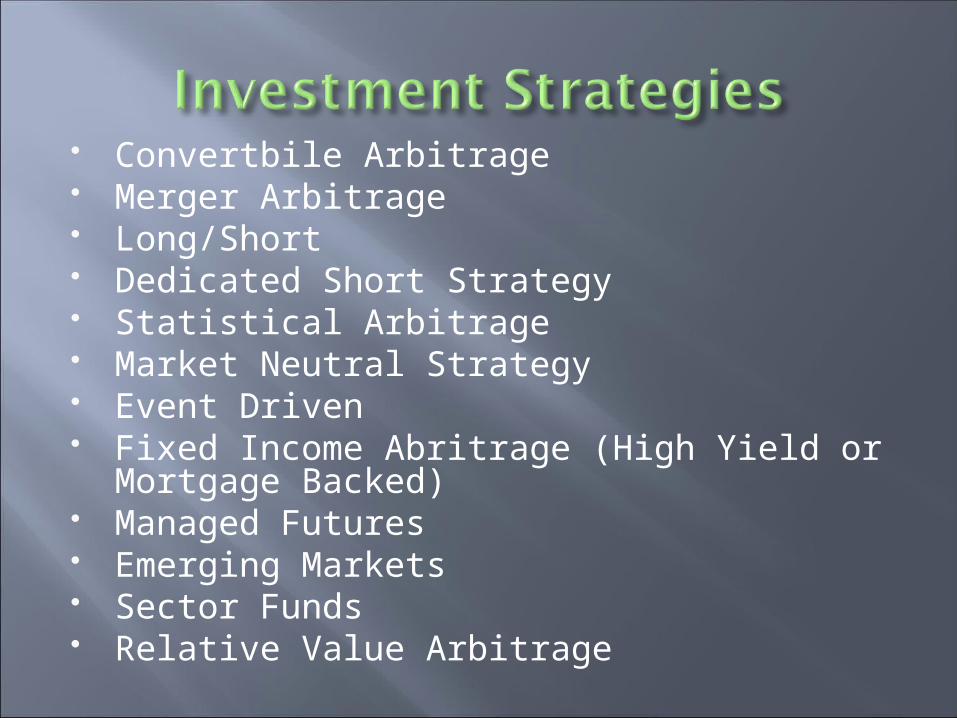
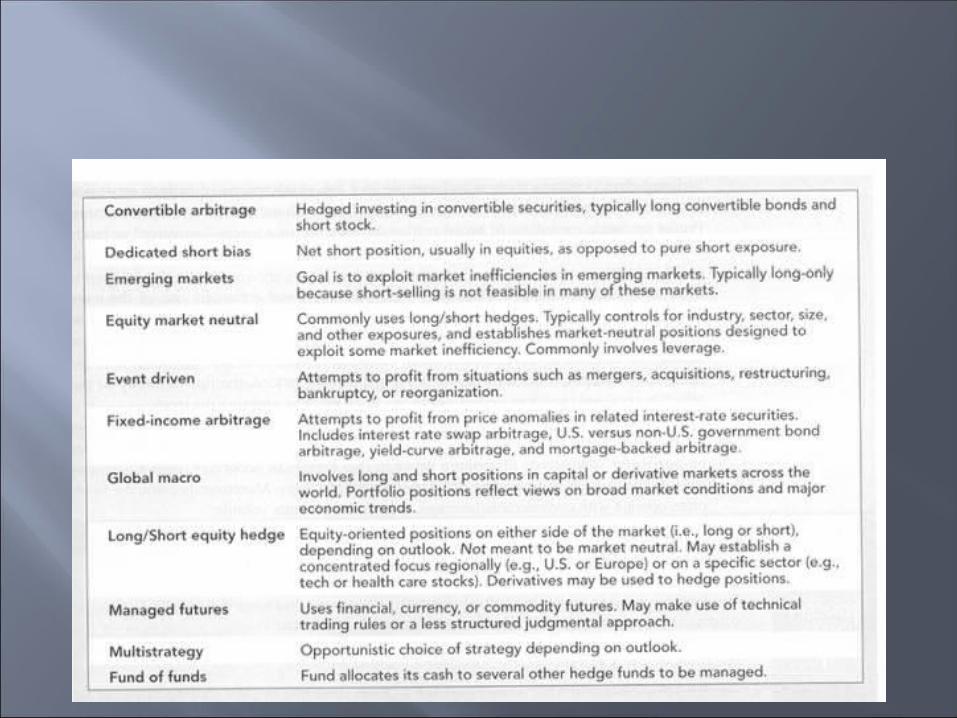
Convertbile Arbitrage Merger Arbitrage Long/Short Dedicated Short Strategy Statistical Arbitrage Market Neutral Strategy Event Driven Fixed Income Abritrage (High Yield or
Mortgage Backed) Managed Futures Emerging Markets Sector Funds Relative Value Arbitrage
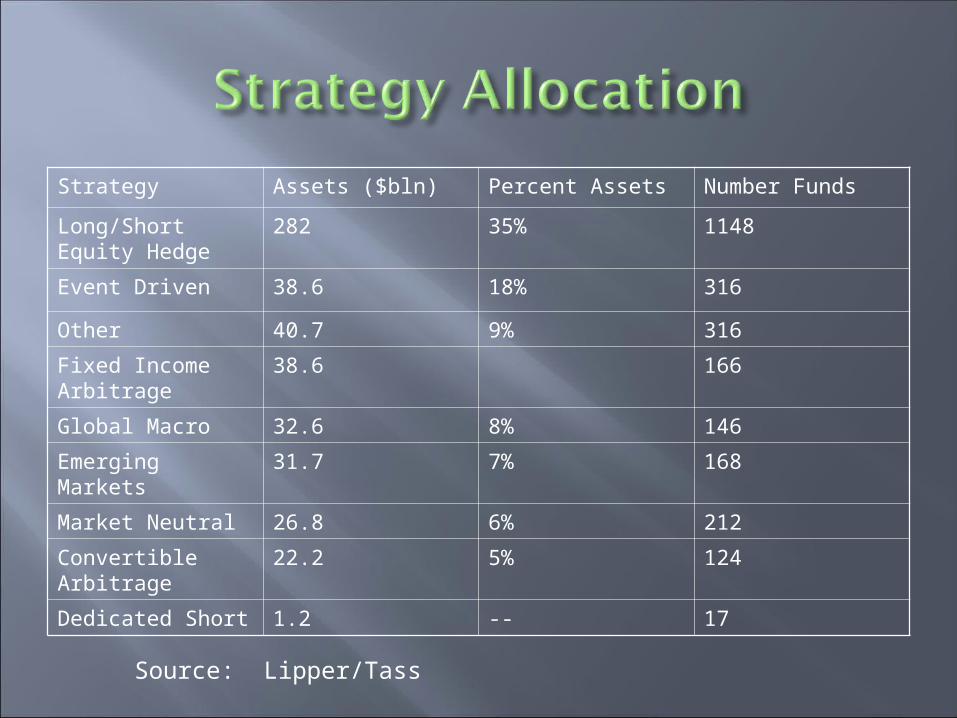
Strategy Assets ($bln) Percent Assets Number Funds
Long/Short Equity Hedge
282 35% 1148
Event Driven 38.6 18% 316
Other 40.7 9% 316
Fixed Income Arbitrage
38.6 166
Global Macro 32.6 8% 146
Emerging Markets 31.7 7% 168
Market Neutral 26.8 6% 212
Convertible Arbitrage
22.2 5% 124
Dedicated Short 1.2 -- 17
Source: Lipper/Tass
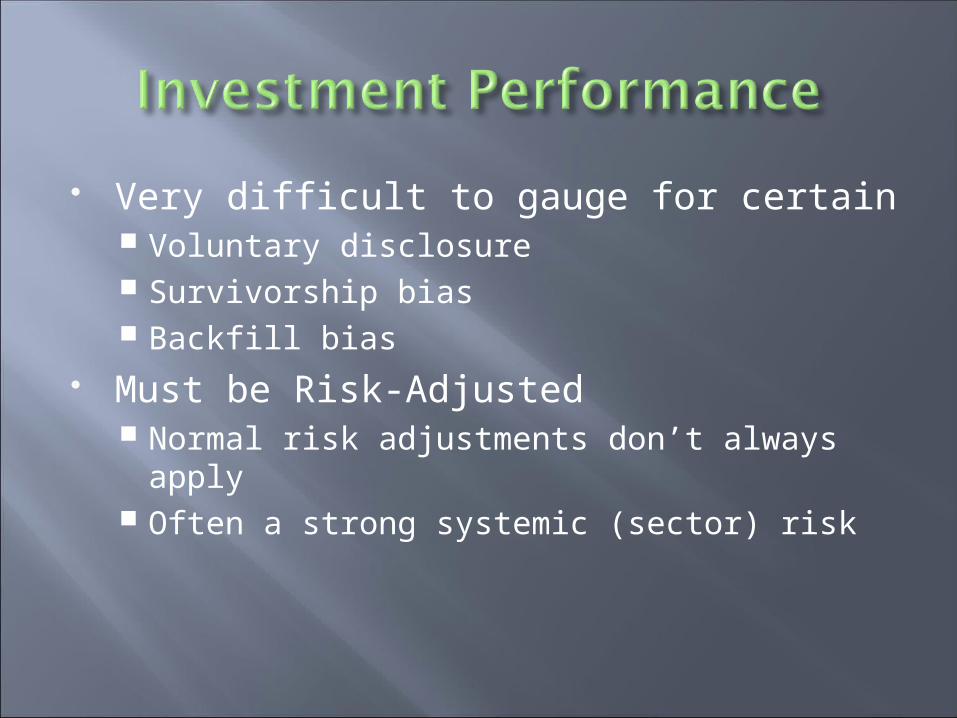
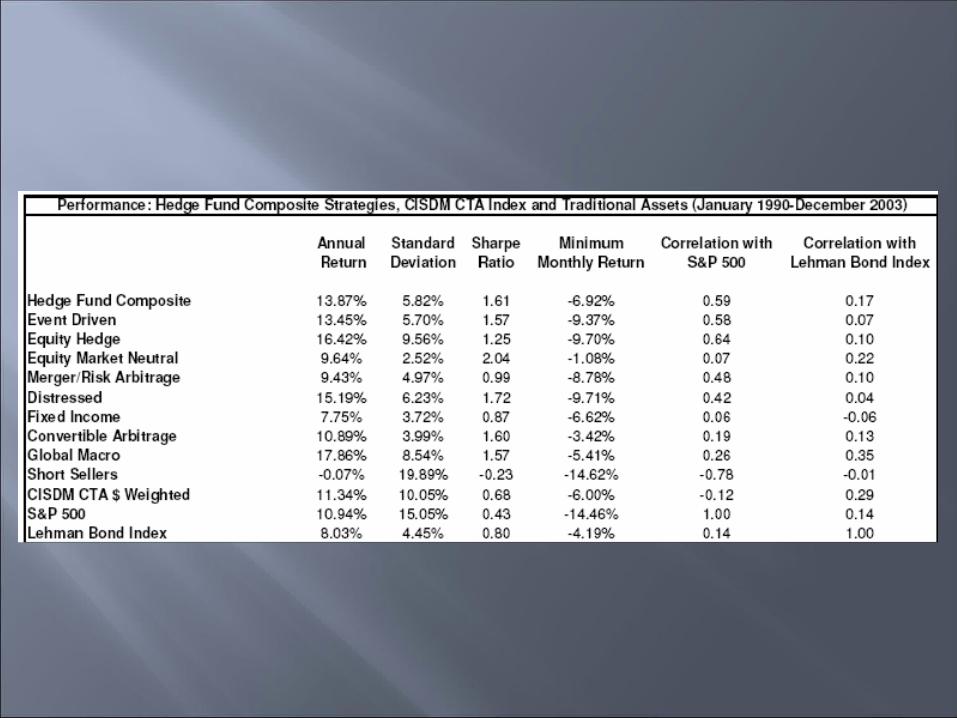
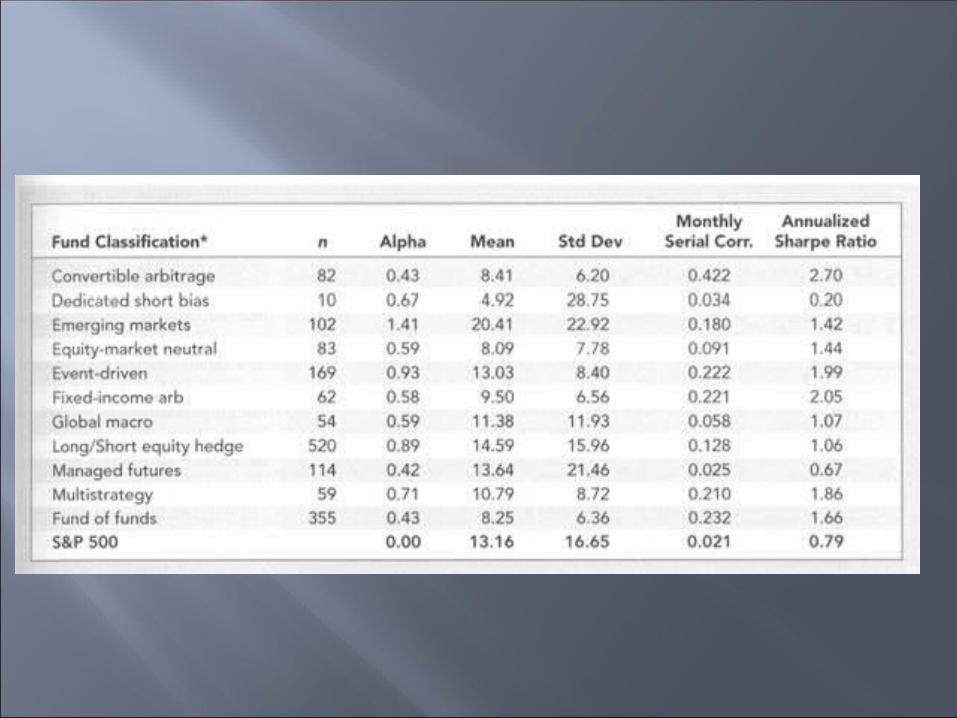
Very difficult to gauge for certain Voluntary disclosure Survivorship bias Backfill bias
Must be Risk-Adjusted Normal risk adjustments don’t always apply Often a strong systemic (sector) risk
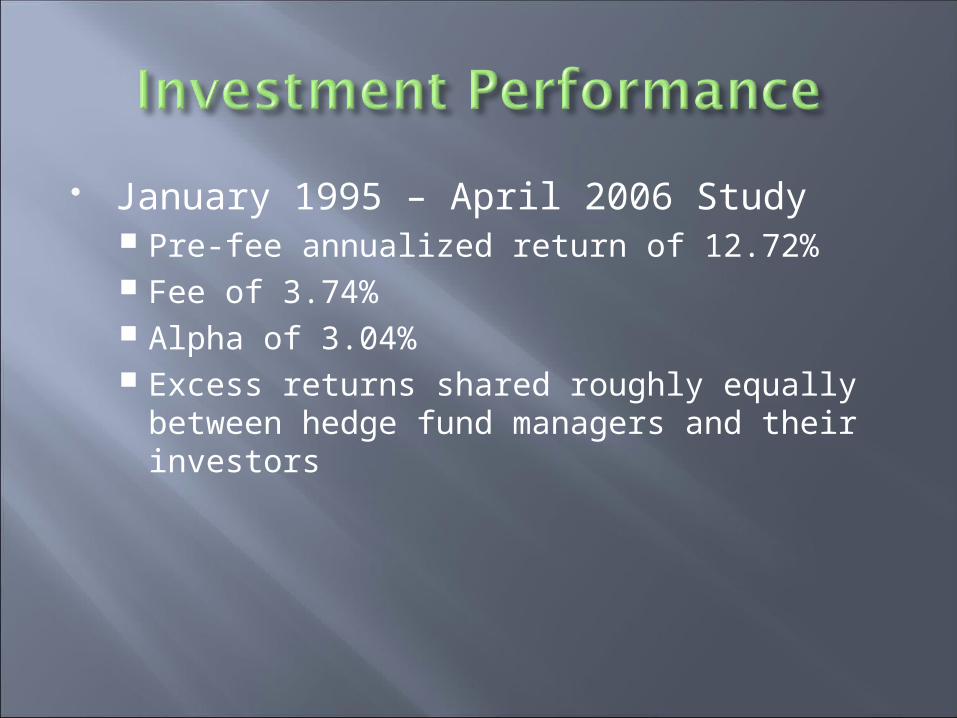
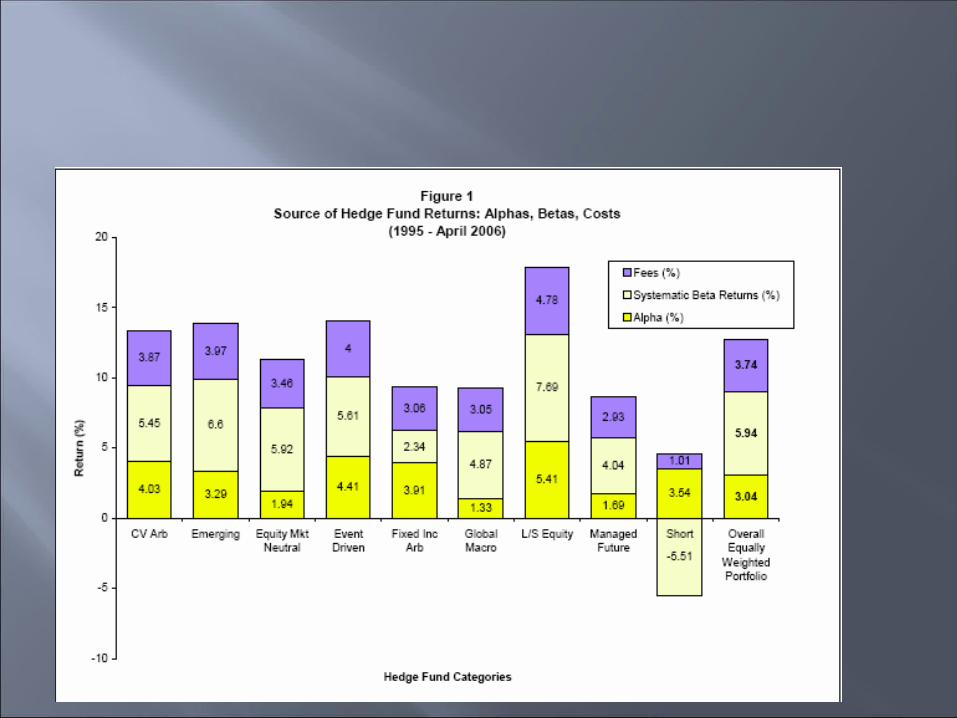
January 1995 – April 2006 Study Pre-fee annualized return of 12.72% Fee of 3.74% Alpha of 3.04% Excess returns shared roughly equally
between hedge fund managers and their investors
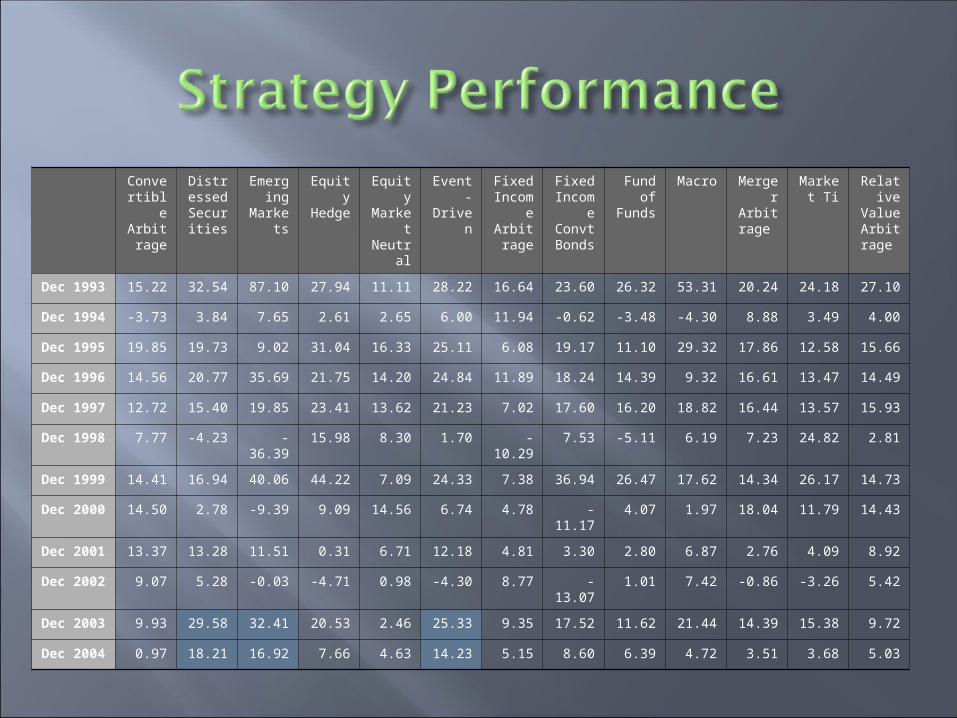
Convertible
Arbitrage
Distressed
Securities
Emerging
Markets
Equity Hedge
Equity Market Neutra
l
Event-Driven
Fixed Incom
e Arbitra
ge
Fixed Incom
e Convt
Bonds
Fund of
Funds
Macro Merger Arbitra
ge
Market Ti
Relative
Value Arbitra
ge
Dec 1993 15.22 32.54 87.10 27.94 11.11 28.22 16.64 23.60 26.32 53.31 20.24 24.18 27.10
Dec 1994 -3.73 3.84 7.65 2.61 2.65 6.00 11.94 -0.62 -3.48 -4.30 8.88 3.49 4.00
Dec 1995 19.85 19.73 9.02 31.04 16.33 25.11 6.08 19.17 11.10 29.32 17.86 12.58 15.66
Dec 1996 14.56 20.77 35.69 21.75 14.20 24.84 11.89 18.24 14.39 9.32 16.61 13.47 14.49
Dec 1997 12.72 15.40 19.85 23.41 13.62 21.23 7.02 17.60 16.20 18.82 16.44 13.57 15.93
Dec 1998 7.77 -4.23 -36.39 15.98 8.30 1.70 -10.29 7.53 -5.11 6.19 7.23 24.82 2.81
Dec 1999 14.41 16.94 40.06 44.22 7.09 24.33 7.38 36.94 26.47 17.62 14.34 26.17 14.73
Dec 2000 14.50 2.78 -9.39 9.09 14.56 6.74 4.78 -11.17 4.07 1.97 18.04 11.79 14.43
Dec 2001 13.37 13.28 11.51 0.31 6.71 12.18 4.81 3.30 2.80 6.87 2.76 4.09 8.92
Dec 2002 9.07 5.28 -0.03 -4.71 0.98 -4.30 8.77 -13.07 1.01 7.42 -0.86 -3.26 5.42
Dec 2003 9.93 29.58 32.41 20.53 2.46 25.33 9.35 17.52 11.62 21.44 14.39 15.38 9.72
Dec 2004 0.97 18.21 16.92 7.66 4.63 14.23 5.15 8.60 6.39 4.72 3.51 3.68 5.03
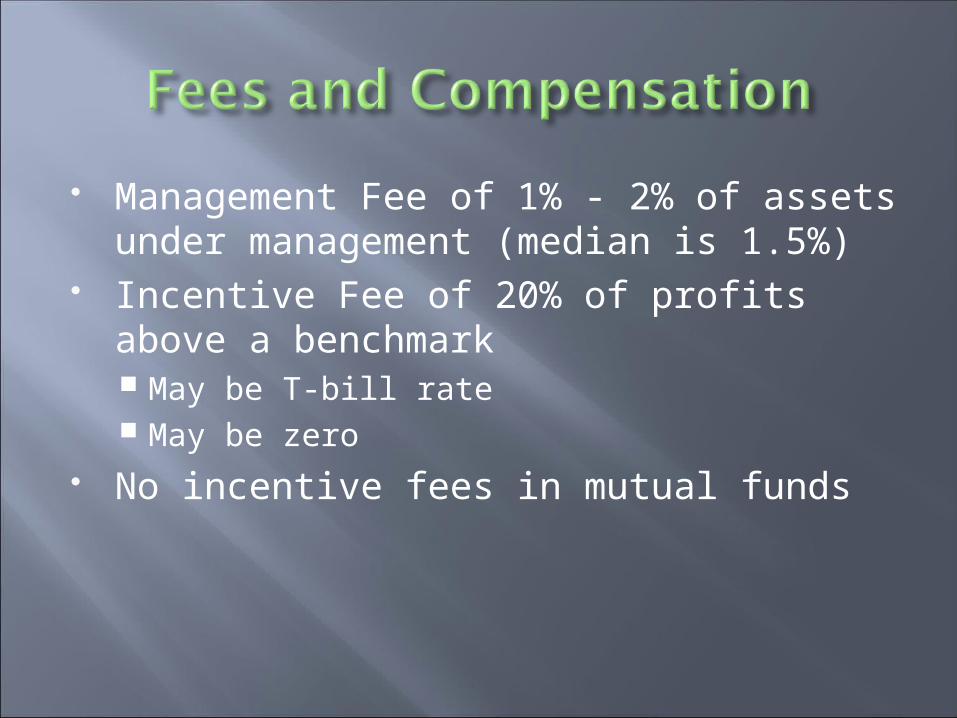
Management Fee of 1% - 2% of assets under management (median is 1.5%)
Incentive Fee of 20% of profits above a benchmark May be T-bill rate May be zero
No incentive fees in mutual funds
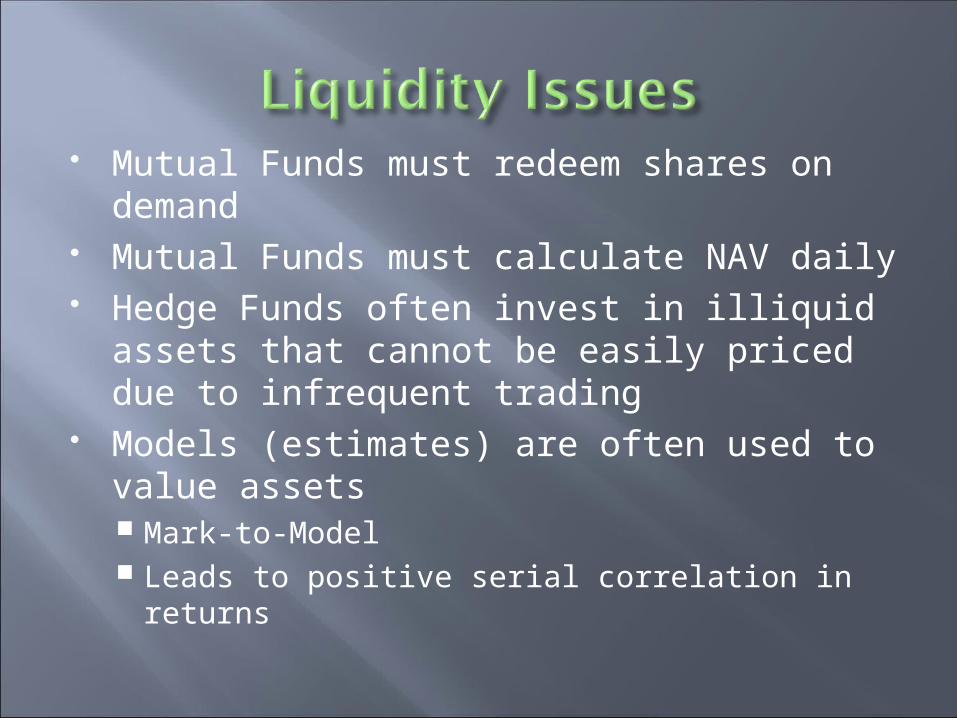
Mutual Funds must redeem shares on demand
Mutual Funds must calculate NAV daily Hedge Funds often invest in illiquid
assets that cannot be easily priced due to infrequent trading
Models (estimates) are often used to value assets Mark-to-Model Leads to positive serial correlation in returns
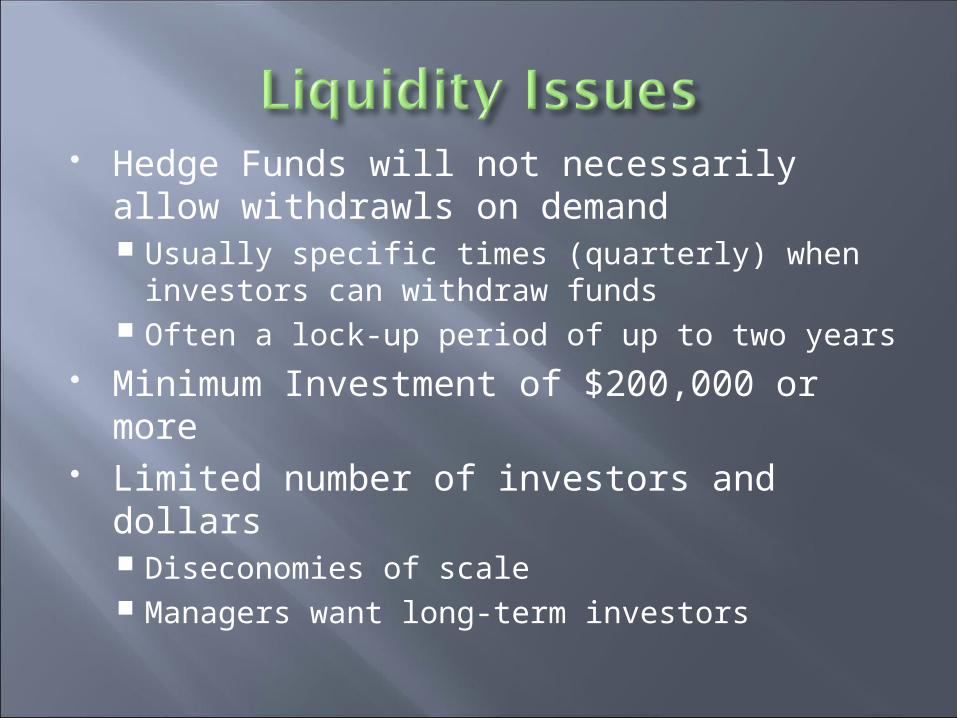
Hedge Funds will not necessarily allow withdrawls on demand Usually specific times (quarterly) when
investors can withdraw funds Often a lock-up period of up to two years
Minimum Investment of $200,000 or more
Limited number of investors and dollars Diseconomies of scale Managers want long-term investors
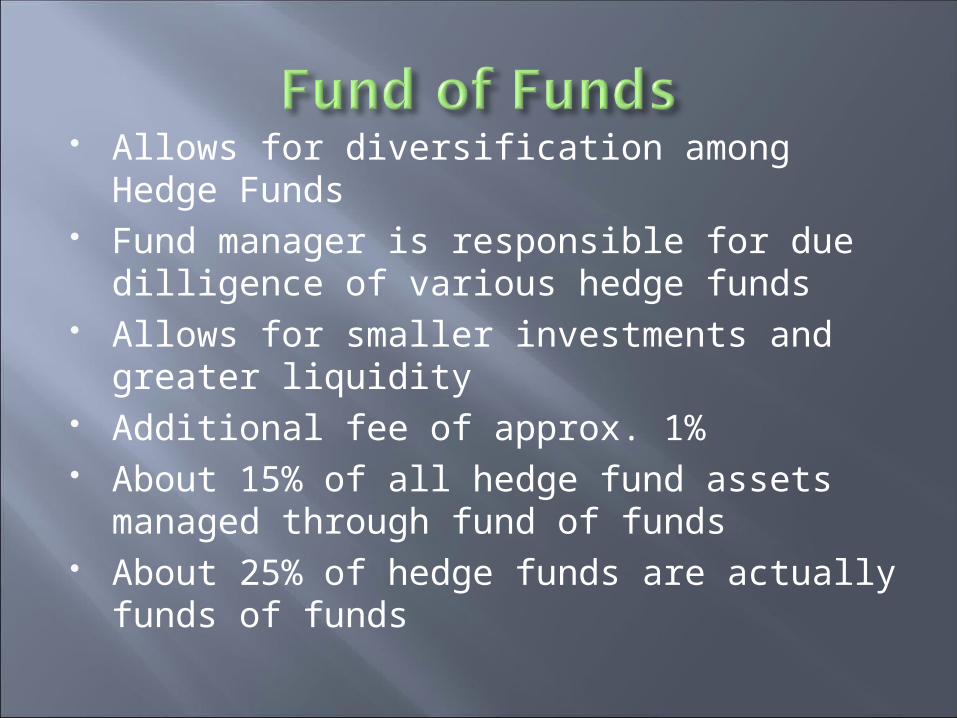
Allows for diversification among Hedge Funds
Fund manager is responsible for due dilligence of various hedge funds
Allows for smaller investments and greater liquidity
Additional fee of approx. 1% About 15% of all hedge fund assets
managed through fund of funds About 25% of hedge funds are actually
funds of funds
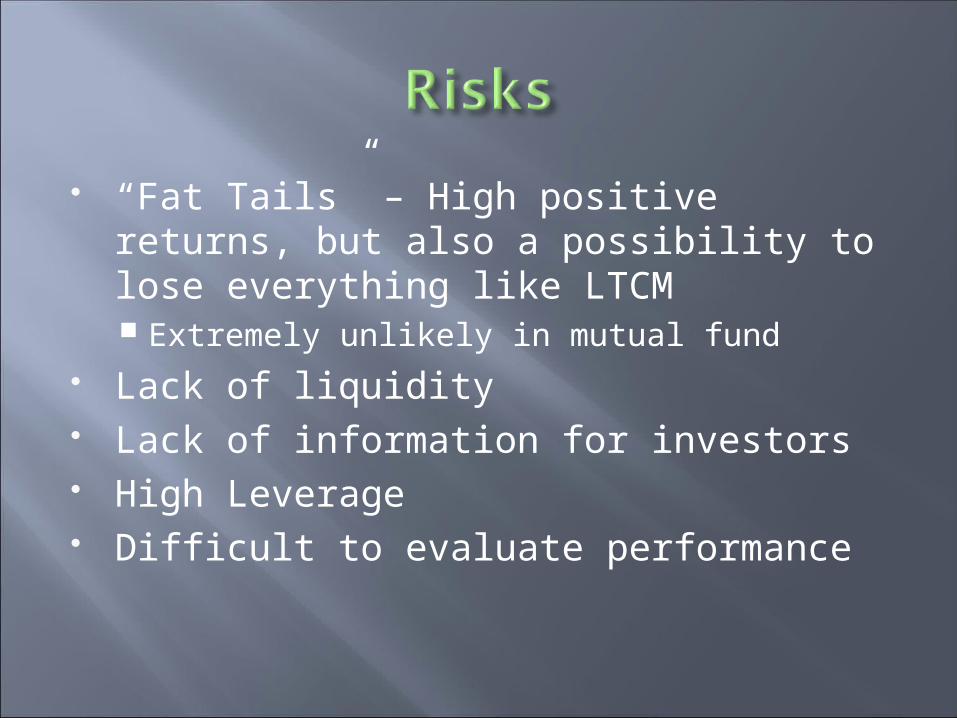
“Fat Tails” – High positive returns, but also a possibility to lose everything like LTCM Extremely unlikely in mutual fund
Lack of liquidity Lack of information for investors High Leverage Difficult to evaluate performance
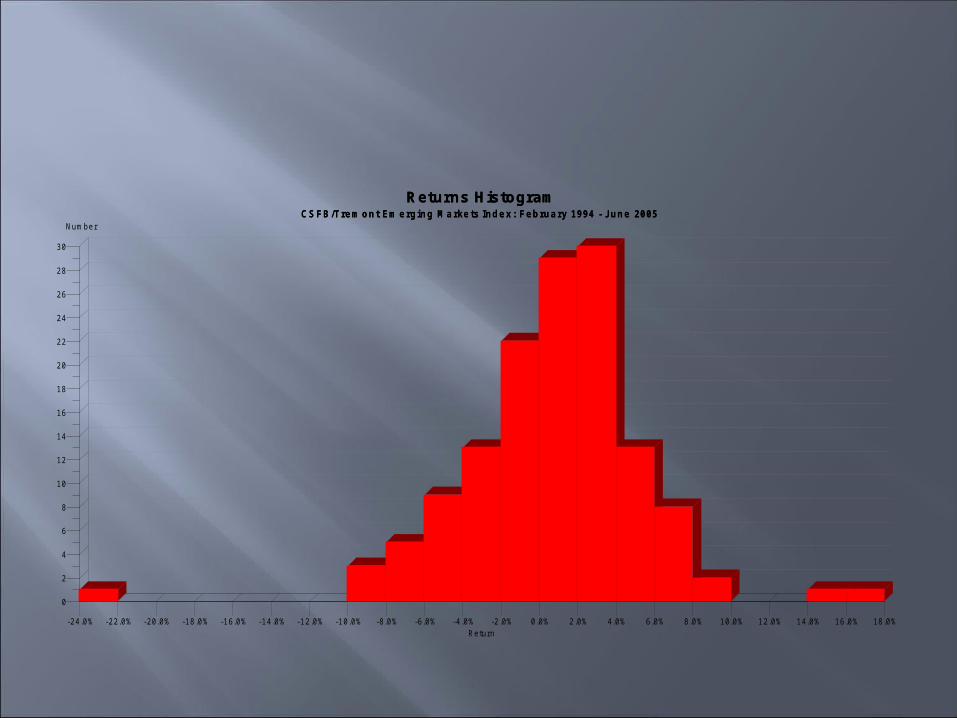
CS F B/T re m on t Em e rg in g M a rke ts In de x : F e b rua ry 1994 - Ju ne 2005Returns Histogram
Return
NumberCS F B/T re m on t Em e rg in g M a rke ts In de x : F e b rua ry 1994 - Ju ne 2005
Returns Histogram
-24.0% 18.0%-22.0% -20.0% -18.0% -16.0% -14.0% -12.0% -10.0% -8.0% -6.0% -4.0% -2.0% 0.0% 2.0% 4.0% 6.0% 8.0% 10.0% 12.0% 14.0% 16.0%
0
30
2
4
6
8
10
12
14
16
18
20
22
24
26
28
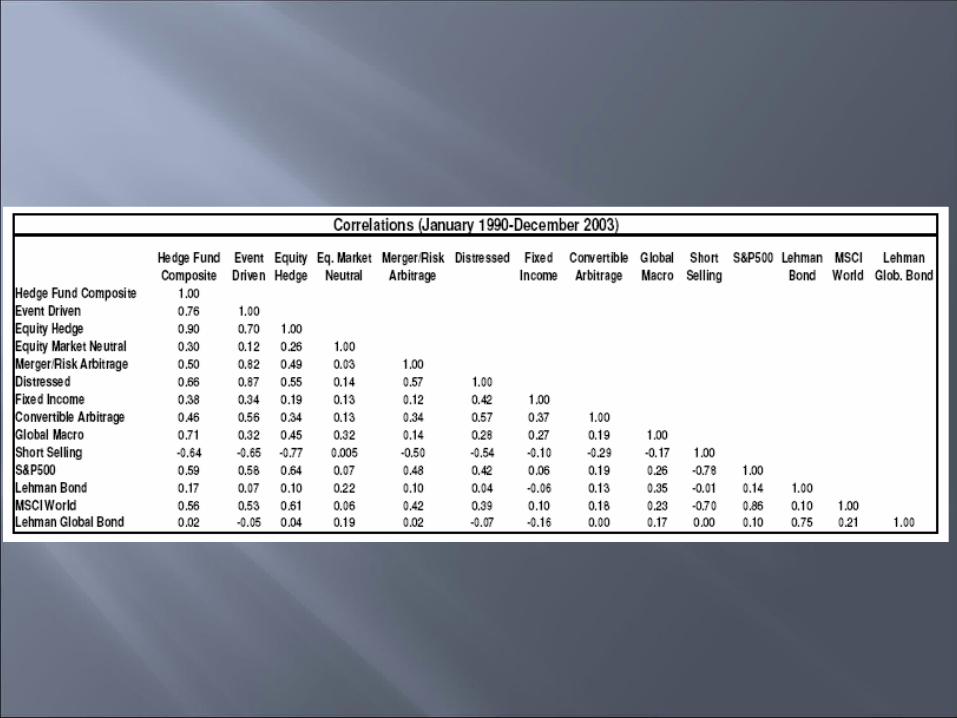

Style Correlations
Distressed EmergingMarkets
EquityMarketneutral Even Multi Fixed Income Macro HF Index Futures FoF
Distressed Index 1 0.5823 0.363 0.9357 0.7509 0.3117 0.3161 0.5796 -0.1267 0.661
Emerging Markets Index 0.5823 1 0.2464 0.6653 0.6665 0.2751 0.419 0.6535 -0.0991 0.7399
Equity Market Neutral Index 0.363 0.2464 1 0.3918 0.3658 0.1133 0.2098 0.3364 0.1231 0.4441
Event Driven Index 0.9357 0.6653 0.3918 1 0.9317 0.3881 0.3824 0.6691 -0.1741 0.7577
Multi-Strategy Index 0.7509 0.6665 0.3658 0.9317 1 0.4289 0.4279 0.6878 -0.1948 0.7616
Fixed Income Arbitrage Index 0.3117 0.2751 0.1133 0.3881 0.4289 1 0.4541 0.4476 -0.0685 0.426
Global Macro Index 0.3161 0.419 0.2098 0.3824 0.4279 0.4541 1 0.8587 0.2445 0.6453
Hedge Fund Index 0.5796 0.6535 0.3364 0.6691 0.6878 0.4476 0.8587 1 0.1264 0.9082
Managed Futures Index -0.1267 -0.0991 0.1231 -0.1741 -0.1948 -0.0685 0.2445 0.1264 1 0.1171
Fund of Funds 0.661 0.7399 0.4441 0.7577 0.7616 0.426 0.6453 0.9082 0.1171 1
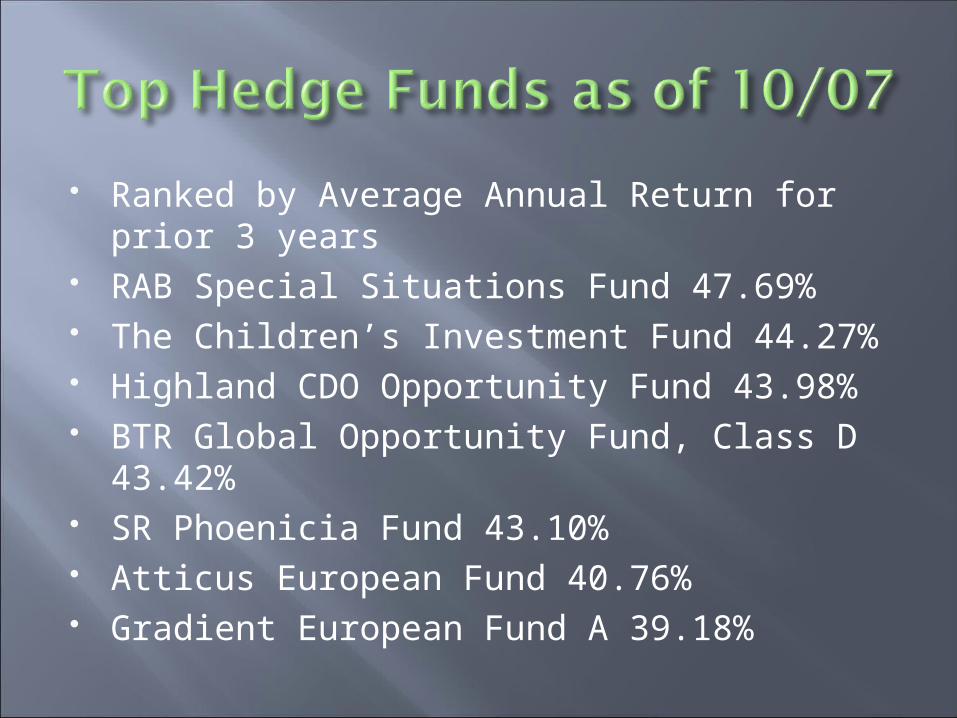
Ranked by Average Annual Return for prior 3 years
RAB Special Situations Fund 47.69% The Children’s Investment Fund 44.27% Highland CDO Opportunity Fund 43.98% BTR Global Opportunity Fund, Class D
43.42% SR Phoenicia Fund 43.10% Atticus European Fund 40.76% Gradient European Fund A 39.18%
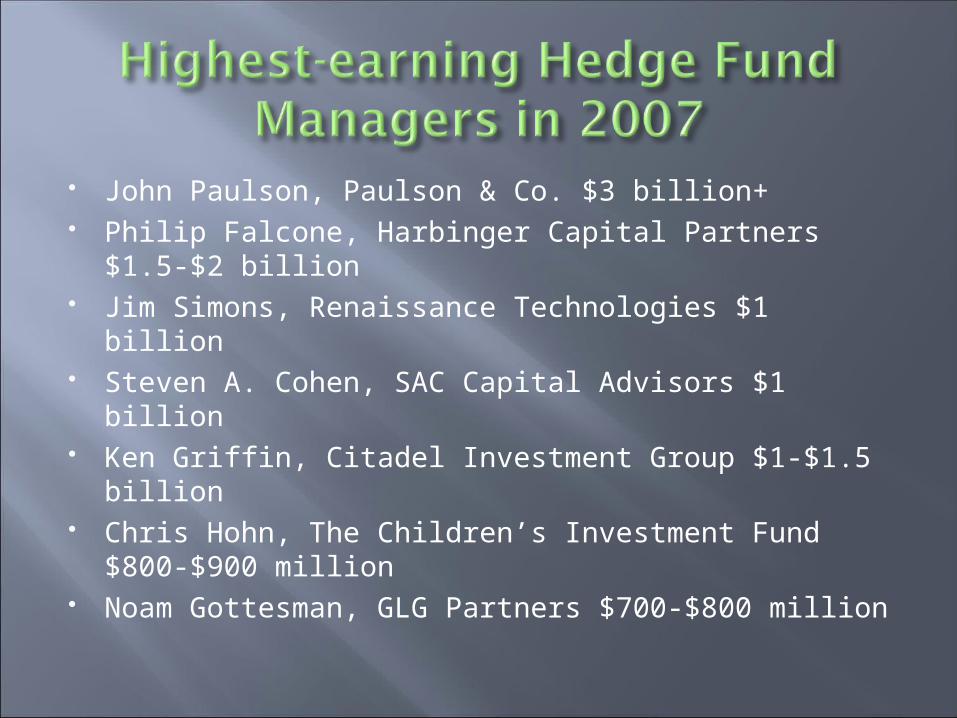
John Paulson, Paulson & Co. $3 billion+ Philip Falcone, Harbinger Capital Partners $1.5-
$2 billion Jim Simons, Renaissance Technologies $1 billion Steven A. Cohen, SAC Capital Advisors $1 billion Ken Griffin, Citadel Investment Group $1-$1.5
billion Chris Hohn, The Children’s Investment Fund
$800-$900 million Noam Gottesman, GLG Partners $700-$800
million
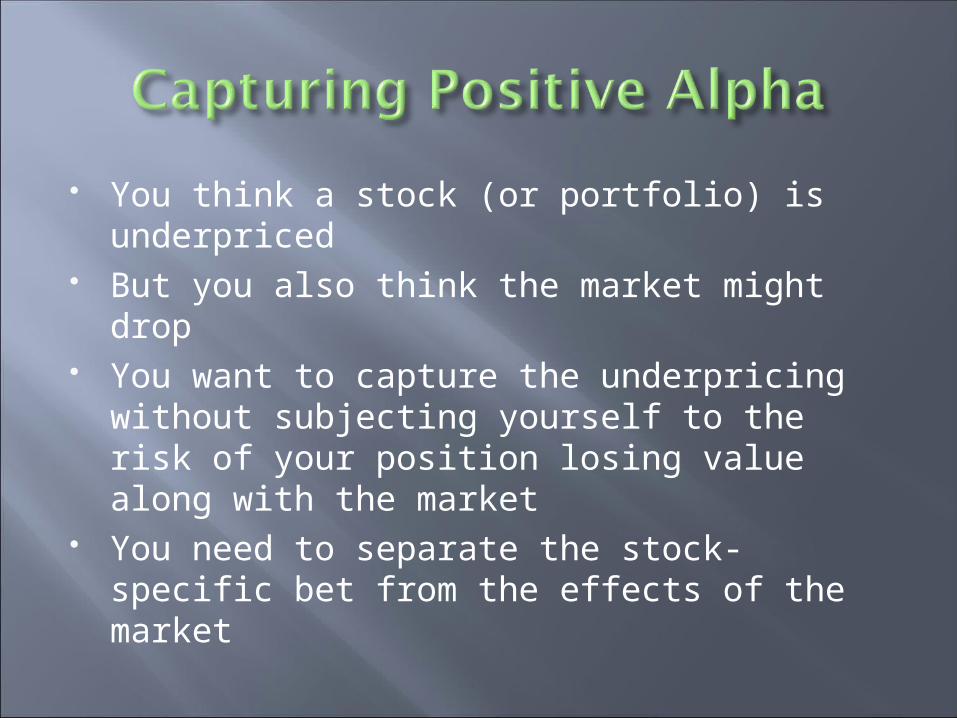
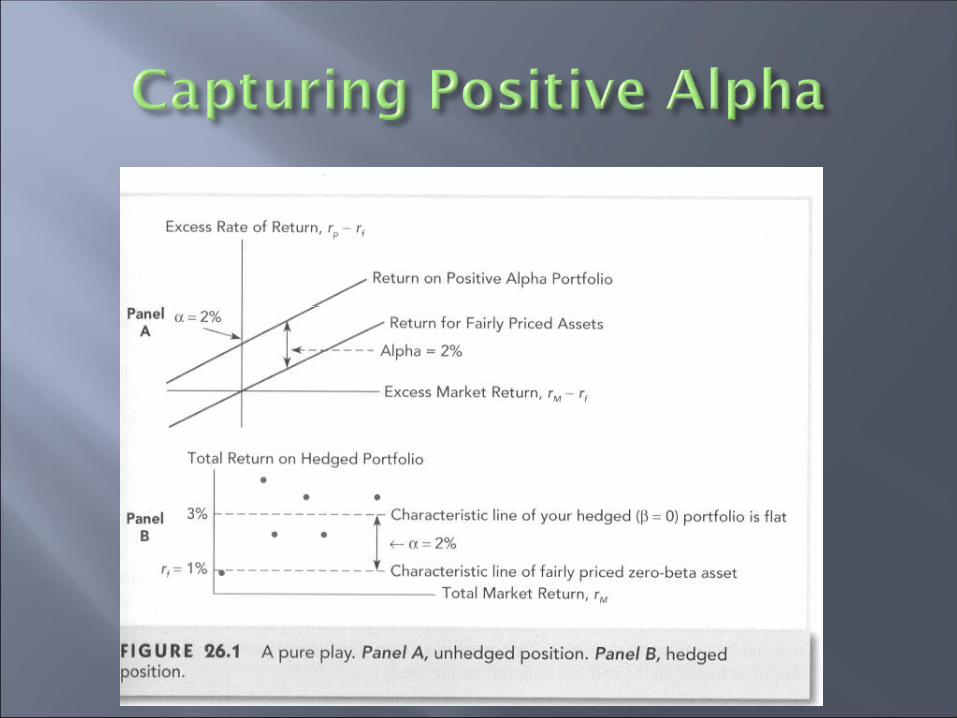
You think a stock (or portfolio) is underpriced
But you also think the market might drop You want to capture the underpricing
without subjecting yourself to the risk of your position losing value along with the market
You need to separate the stock-specific bet from the effects of the market
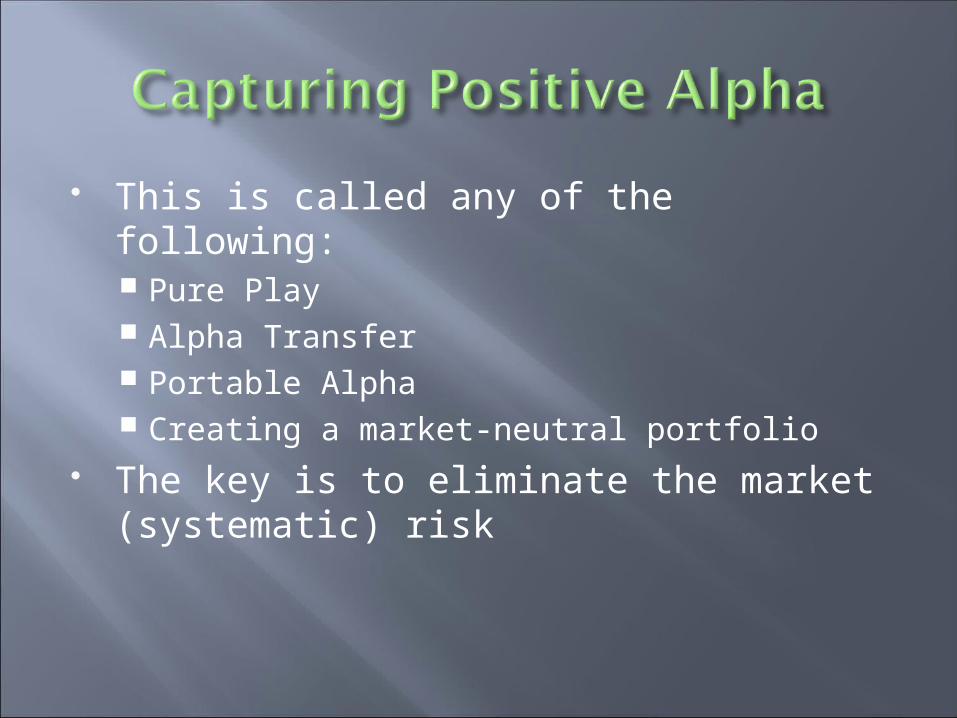
This is called any of the following: Pure Play Alpha Transfer Portable Alpha Creating a market-neutral portfolio
The key is to eliminate the market (systematic) risk
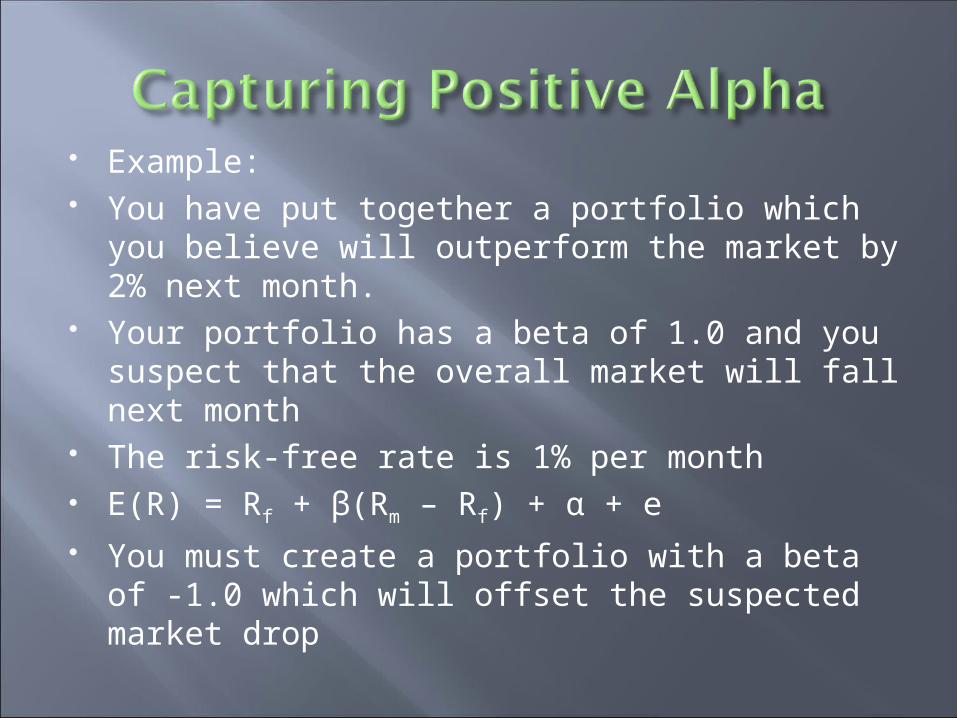
Example: You have put together a portfolio which you
believe will outperform the market by 2% next month.
Your portfolio has a beta of 1.0 and you suspect that the overall market will fall next month
The risk-free rate is 1% per month E(R) = Rf + β(Rm – Rf) + α + e You must create a portfolio with a beta of -1.0
which will offset the suspected market drop
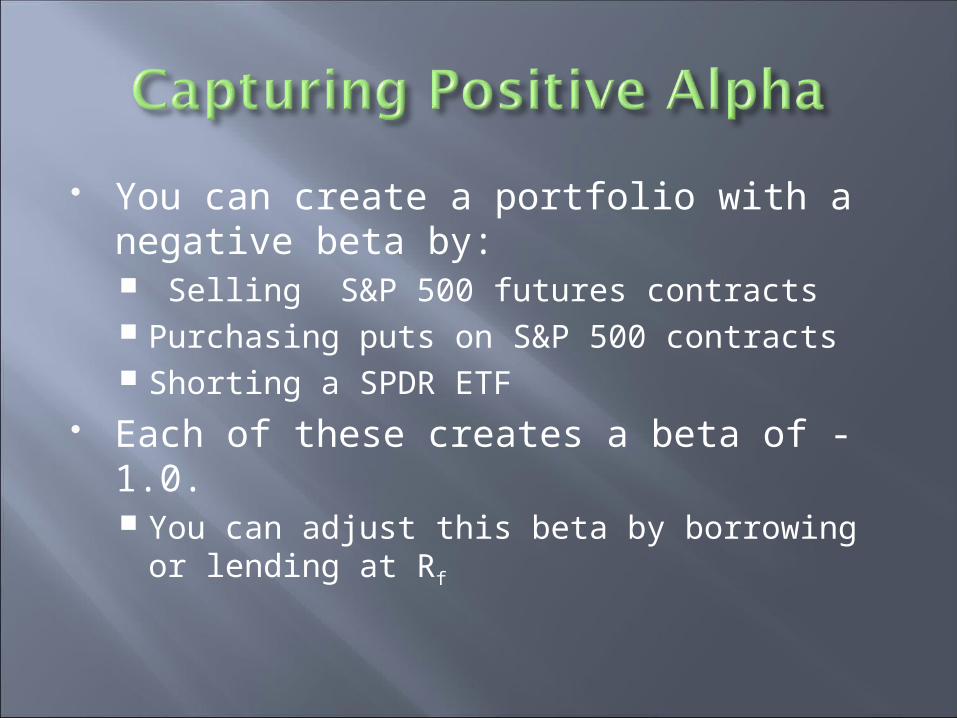
You can create a portfolio with a negative beta by: Selling S&P 500 futures contracts Purchasing puts on S&P 500 contracts Shorting a SPDR ETF
Each of these creates a beta of -1.0. You can adjust this beta by borrowing or
lending at Rf
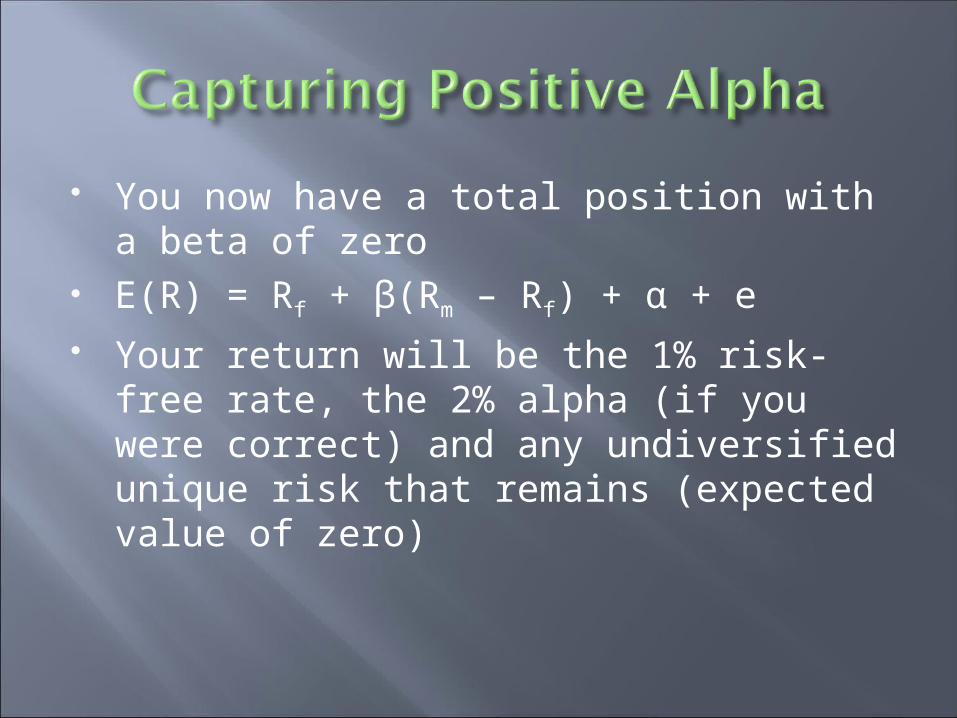
You now have a total position with a beta of zero
E(R) = Rf + β(Rm – Rf) + α + e Your return will be the 1% risk-free rate,
the 2% alpha (if you were correct) and any undiversified unique risk that remains (expected value of zero)


![Surface Temperature Change: A Closer Look at United States ... · 2 The GISS analysis of Hansen et al. [1999] did not incorporate adjustments to the large subset of the U.S. stations](https://img.pdfslide.us/doc/110x75/5cab3b0288c993e6068cf176/surface-temperature-change-a-closer-look-at-united-states-2-the-giss-analysis.jpg)