Embed Size (px)
Citation preview
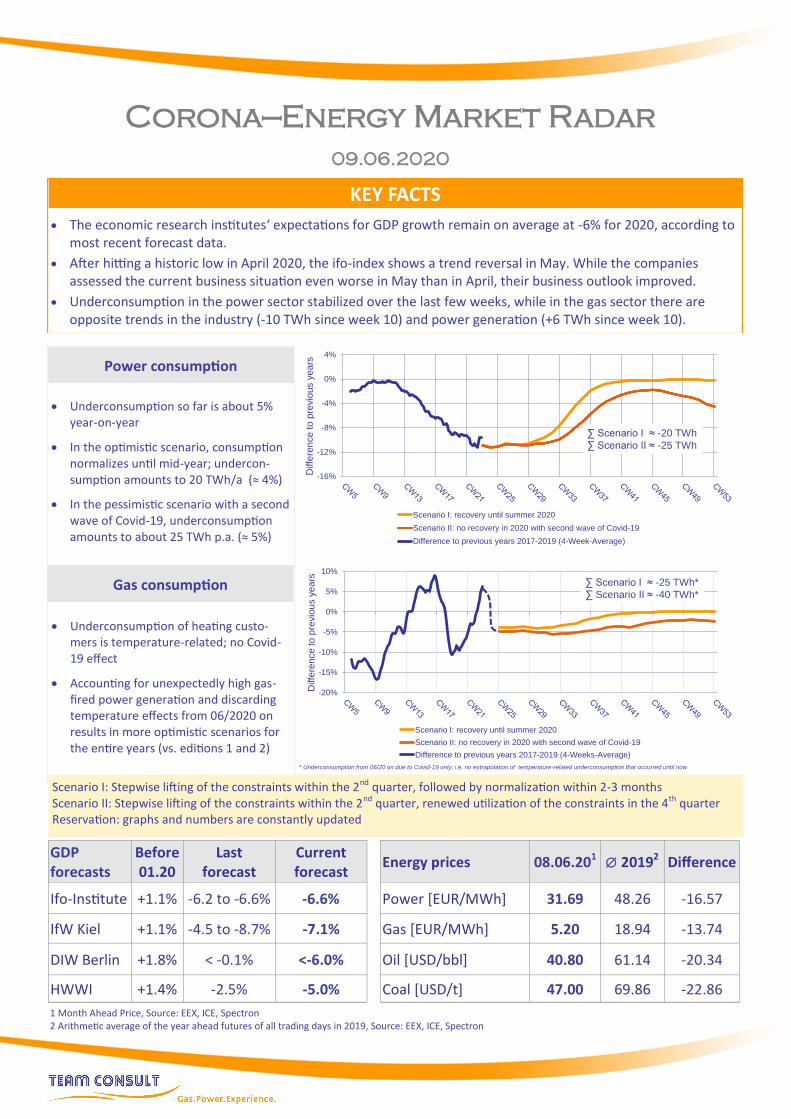
Corona—Energy Market Radar
09.06.2020
The economic research institutes‘ expectations for GDP growth remain on average at -6% for 2020, according to most recent forecast data.
After hitting a historic low in April 2020, the ifo-index shows a trend reversal in May. While the companies assessed the current business situation even worse in May than in April, their business outlook improved.
Underconsumption in the power sector stabilized over the last few weeks, while in the gas sector there are opposite trends in the industry (-10 TWh since week 10) and power generation (+6 TWh since week 10).
KEY FACTS
GDP forecasts
Before 01.20
Last forecast
Energy prices 08.06.201 20192 Difference Current forecast
Ifo-Institute +1.1% -6.2 to -6.6% Power [EUR/MWh] 31.69 48.26 -16.57 -6.6%
IfW Kiel +1.1% -4.5 to -8.7% Gas [EUR/MWh] 5.20 18.94 -13.74 -7.1%
DIW Berlin +1.8% < -0.1% Oil [USD/bbl] 40.80 61.14 -20.34 <-6.0%
HWWI +1.4% -2.5% Coal [USD/t] 47.00 69.86 -22.86 -5.0%
1 Month Ahead Price, Source: EEX, ICE, Spectron 2 Arithmetic average of the year ahead futures of all trading days in 2019, Source: EEX, ICE, Spectron
Underconsumption so far is about 5% year-on-year
In the optimistic scenario, consumption normalizes until mid-year; undercon-sumption amounts to 20 TWh/a (≈ 4%)
In the pessimistic scenario with a second wave of Covid-19, underconsumption amounts to about 25 TWh p.a. (≈ 5%)
Power consumption
Underconsumption of heating custo-mers is temperature-related; no Covid-19 effect
Accounting for unexpectedly high gas-fired power generation and discarding temperature effects from 06/2020 on results in more optimistic scenarios for the entire years (vs. editions 1 and 2)
Gas consumption
Scenario I: Stepwise lifting of the constraints within the 2nd quarter, followed by normalization within 2-3 months Scenario II: Stepwise lifting of the constraints within the 2nd quarter, renewed utilization of the constraints in the 4th quarter Reservation: graphs and numbers are constantly updated
* Underconsumption from 06/20 on due to Covid-19 only; i.e. no extrapolation of temperature-related underconsumption that occurred until now
-20%
-15%
-10%
-5%
0%
5%
10%
Diffe
ren
ce
to
pre
vio
us y
ea
rs
Scenario I: recovery until summer 2020
Scenario II: no recovery in 2020 with second wave of Covid-19
Difference to previous years 2017-2019 (4-Weeks-Average)
∑ Scenario I ≈ -25 TWh*
∑ Scenario II ≈ -40 TWh*
-16%
-12%
-8%
-4%
0%
4%
Diffe
ren
ce
to
pre
vio
us y
ea
rs
Scenario I: recovery until summer 2020
Scenario II: no recovery in 2020 with second wave of Covid-19
Difference to previous years 2017-2019 (4-Week-Average)
∑ Scenario I ≈ -20 TWh
∑ Scenario II ≈ -25 TWh
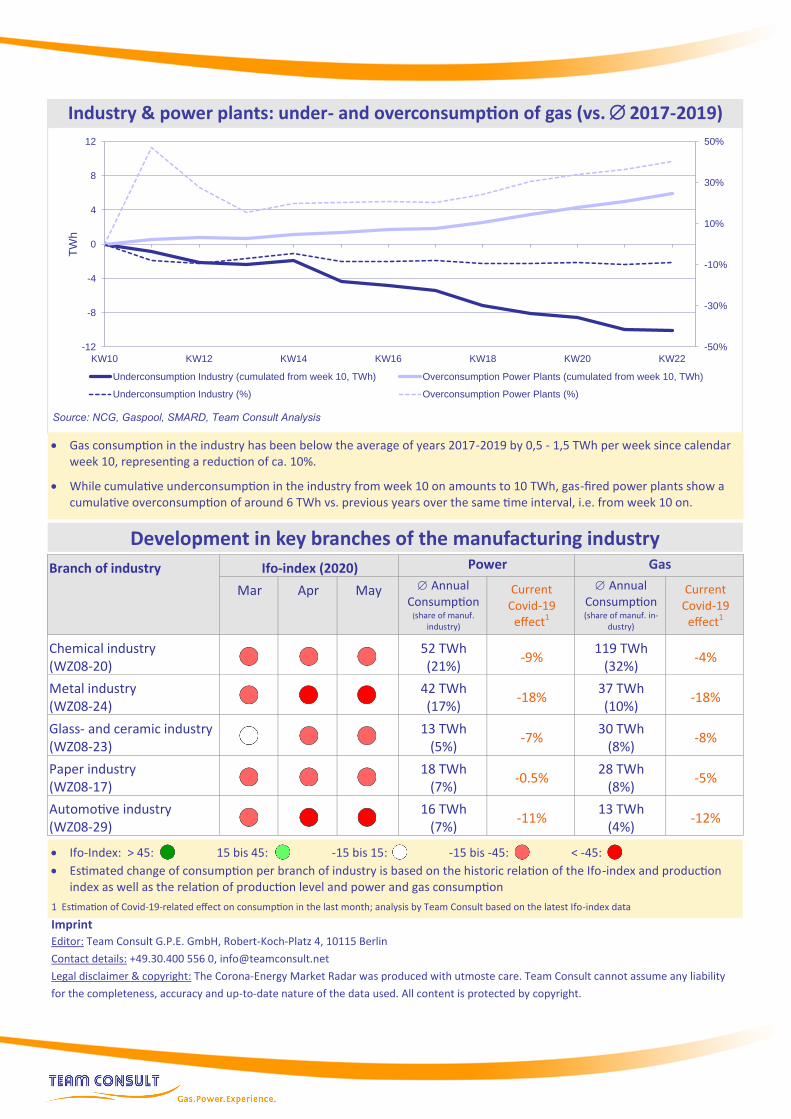
Industry & power plants: under- and overconsumption of gas (vs. 2017-2019)
Source: NCG, Gaspool, SMARD, Team Consult Analysis
Gas consumption in the industry has been below the average of years 2017-2019 by 0,5 - 1,5 TWh per week since calendar week 10, representing a reduction of ca. 10%.
While cumulative underconsumption in the industry from week 10 on amounts to 10 TWh, gas-fired power plants show a cumulative overconsumption of around 6 TWh vs. previous years over the same time interval, i.e. from week 10 on.
Branch of industry Ifo-index (2020) Power Gas
Mar Apr May Annual Consumption
(share of manuf. industry)
Current Covid-19
effect1
Annual Consumption (share of manuf. in-
dustry)
Current Covid-19
effect1
Chemical industry (WZ08-20)
52 TWh (21%)
-9% 119 TWh
(32%) -4%
Metal industry (WZ08-24)
42 TWh (17%)
-18% 37 TWh (10%)
-18%
Glass- and ceramic industry (WZ08-23)
13 TWh
(5%) -7%
30 TWh (8%)
-8%
Paper industry (WZ08-17)
18 TWh
(7%) -0.5%
28 TWh (8%)
-5%
Automotive industry (WZ08-29)
16 TWh
(7%) -11%
13 TWh (4%)
-12%
Development in key branches of the manufacturing industry
Ifo-Index: > 45: 15 bis 45: -15 bis 15: -15 bis -45: < -45:
Estimated change of consumption per branch of industry is based on the historic relation of the Ifo-index and production index as well as the relation of production level and power and gas consumption
1 Estimation of Covid-19-related effect on consumption in the last month; analysis by Team Consult based on the latest Ifo-index data
Imprint Editor: Team Consult G.P.E. GmbH, Robert-Koch-Platz 4, 10115 Berlin
Contact details: +49.30.400 556 0, [email protected]
Legal disclaimer & copyright: The Corona-Energy Market Radar was produced with utmoste care. Team Consult cannot assume any liability
for the completeness, accuracy and up-to-date nature of the data used. All content is protected by copyright.
-50%
-30%
-10%
10%
30%
50%
-12
-8
-4
0
4
8
12
KW10 KW12 KW14 KW16 KW18 KW20 KW22
TW
h
Underconsumption Industry (cumulated from week 10, TWh) Overconsumption Power Plants (cumulated from week 10, TWh)
Underconsumption Industry (%) Overconsumption Power Plants (%)