Embed Size (px)
Citation preview
Security Analysis, Agency Costs and UK Firm Characteristics
John A. Doukas, Phillip J. McKnight, and Christos Pantzalis*
May 18th , 2001
Abstract
In this paper we examine the monitoring activity of security analysis from the manager-shareholder conflict perspective. Using a unique data set of more than 400 UK firms tracked by security analysts over the 1999-2000 period, our preliminary evidence supports the view that security analysis acts as a monitoring mechanism in reducing agency costs for the three measures of agency costs employed by this paper. More importantly, we also find that security analysts are more effective in reducing managerial non-value maximising behaviour for smaller firms than for larger firms supporting the supposition that as firms grow in size and become more complex, the monitoring activity of security analysis becomes less effective. In addition, we find that security analysis has a positive and significant impact on firm value for smaller as opposed to larger firms.
*Author affiliation is alphabetical: Department of Finance, School of Business and Public Administration, Old Dominion University, Norfolk, VA 23529-0218, Tel:(757) 683-5521, Fax:(757) 683-5639, E-mail: [email protected] Distinguished Senior Research Fellow, Cardiff Business School, Cardiff, UK; Department of Accounting and Finance, Cardiff Business School, Cardiff, UK CF10 3EU, Tel: 02920 876804, Fax: 02920 87 E-mail [email protected]; Department of Finance, College of Business Administration, University of South Florida, Tampa, FL 33620-5500, Tel:(813) 974-6326, Fax:(813) 974-3030, E-mail: [email protected], respectively. Phillip J. McKnight
1
1. Introduction Does security analysis act as a monitoring mechanism in reducing agency costs, and if so, to what extent
is its effectiveness related to the characteristics of the firm? These two questions remain largely
unanswered. Despite the numerous studies on the information content and valuation effects of analysts’
forecasts, there is little understanding about the monitoring activity of security analysis in the presence of
potential agency costs across firms with different characteristics.1 To the best of our knowledge, there is
no direct evidence on whether security analysis reduces agency costs associated with the separation of
ownership and control of the firm.2 If security analysis, as predicted by Jensen and Meckling (1976),
exerts positive influence on firm value by restricting managers’ non-value maximising activities, it should
decrease agency costs. This entails a direct testing of the relation between security analysis and agency
costs.3
This investigation into the monitoring role of security analysts is also motivated by recent studies which
document that the size of a firm can abate shareholder value (Doukas, Kim and Pantzalis (2000).
Although size may be conventional wisdom, the mechanism through which it destroys firm value is less
1Moyer, Chatfield and Sisneros (1989), for example, show that the demand for the monitoring activity of
security analysis is positively related to the informational demands of investors. Therefore, they conjecture that security analysis reduces agency costs arising from the separation of ownership from control.
2 Brennan and Subrahmanyam (1995) argue that the social benefits of security analysis remain largely unexplored.
3While the valuation effects of security analysis may indirectly reveal the monitoring role of security analysts, it is very likely that they will be masked with other effects such as the increased liquidity of the firm’s equity and broader investor-recognition arising from analysts’ coverage. Merton (1987) argues that a firm benefits when additional investors are made aware of its existence because this increases the liquidity of the firm’s equity. Brennan and Hughes (1991) and Chung and Jo (1996) also argue that investors tend to trade only securities of which they are cognisant.
2
understood. It is generally believed that larger firms fail to increase shareholder value because of over
investment and agency costs (Jensen (1986), Stulz (1990), Denis, Denis and Sarin (1997) among
others) as well as because of internal capital market inefficiencies (Lamont (1997), Shin and Stulz
(1998), Rajan, Servaes and Zingales (2000)). In this paper, we examine the extent to which security
analysis following UK firms, as an external monitoring mechanism, has failed to monitor the managerial
conduct of larger firms in the sense of reducing agency costs arising from informational asymmetries.
Because of greater cost, the complexity of gathering and analysing data for larger firms (Bhushan
(1989)), the monitoring activity of security analysis is predicted to be less effective for larger than
smaller. Aware of the information acquisition burdens, higher costs and limitations faced by analysts in
evaluating cash flows of larger firms, many of these corporations have issued tracking stocks. The
tracking stock innovation itself and the related empirical evidence raise also the question of whether the
monitoring activity of security analysis is uniform across firms with significant size divergences.4
2. Research Objective
Corporate managers have many personal objectives that are not always consistent with shareholder
value maximisation. While many papers have examined the effectiveness of various internal and external
disciplinary mechanisms in terms of restricting managers’ non-value-maximising conduct in a US
context, security analysis, as an agency cost monitoring device, has been largely unexplored in the UK.
In the US, the only study to examine this issue is that by Doukas, Kim and Pantzalis (2000). This is
4 Logue, Seward and Walsh (1996), and Gilson, Healy, Noe and Palepu (1998) find that financial analyst
coverage and quality of analyst coverage, measured by analyst forecast errors, increase following the issuance of tracking stock. Billett and Mauer (1998), however, find that the introduction of tracking stocks conveys information about the firm’s internal capital market and its new corporate structure.

3
surprising in light of the fact that security analysts’ earnings forecasts are widely used by investors in their
investment decisions and that they exert a greater influence on stock prices than historical measures of
growth. As a result of the above argument, the objectives of this paper are threefold. First, we will
examine directly whether security analysis acts as a monitoring mechanism in restricting agency-related
costs arising from the separation of ownership and control in UK publicly traded firms. Second, we will
investigate whether the effectiveness of the monitoring activity of security analysis is related to the size of
the firm. Finally, we will examine the implications that security analysis has on firm valuation.
3. Background
Recently, several researchers have examined the determinants (Bhushan (1989) and Moyer, Chartfield,
and Sisneros (1989), and Brennan and Hughes (1991)) and the valuation effects (Chung and Jo (1996))
of security analysis. While these studies provide interesting insights about security analysts, they do not
directly examine the effects of security analysis on the agency conflict between managers and
shareholders. Perhaps the only study to examine this issue directly is that provided by Doukas et al
(2000) of which was in a US environment. Doukas et al found that security analyst acts as a monitoring
mechanism in reducing agency costs associated with the manager-shareholder conflict. Their study also
found that firm value was a positive function of security analysis. Furthermore, the positive impact of
security analysis on market value was more pronounced in the case of focused firms compared to
industrially diversified firms. Their findings indicate that larger firms tend to be more diversified, complex
operations and therefore more prone to agency costs. Thus, monitoring by security analysts is less
effective for larger firms compared to small firms.

4
The findings of Doukas et al’s study are interesting, however, the relative efficiency of security analysts’
services across firms with significant size difference has been overlooked in a UK context. Needless to
say, these issues acquire extra significance when we consider security analysis in different societies,
especially that in the UK which, although mirrors the US in many ways, diverges in others (i.e. general
accepted accounting principals, individual risk preferences). This, therefore, raises an intriguing question
as to the extent to which these findings by Doukas et al are culturally bounded. If indeed it is shown that
the monitoring activity of security analysis helps to reduce agency costs, then such information may be of
enormous value to both UK investors and shareholders in making prudent investment decisions.
4. Agency Theory and Hypothesis
Jensen and Meckling (1976), argue that the monitoring activity of security analysis helps to reduce
agency costs associated with the separation of ownership and control by restricting the non-value-
maximising behaviour of managers. This implies, then, that agency costs should decline as a result of the
monitoring activity of security analysts. We set out to address this issue first. Our research is initially
designed to test whether security analysis serves as an external monitoring device in terms of reducing
agency costs (i.e., restricting managers’ non-value-maximising behaviour) analogous to other internal
and external monitoring mechanisms such as independent boards of directors, bond-ratings, investment
banks and takeovers. Furthermore, since non-value-maximising conduct by managers is more likely to
occur in larger (often multi-divisional) rather than smaller (often focused) firms, we also investigate
whether the monitoring effectiveness of security analysis is related to size of the firm.5
5 Agency costs associated with overinvestment activity may also arise from managerial compensation that
is tied to firm size (Jensen and Murphy (1990)), or from the managers’ desire to become indispensable to the firm

5
We hypothesise that the monitoring effectiveness of security analysts is lower for smaller than larger
firms because larger firms are more complex organisations to be assessed and monitored by analysts.
As a result, they are more likely to be subject to greater agency costs than smaller firms. Consequently,
analysing security analysts’ monitoring of managerial activity puts the manager-shareholder conflict to a
new test, whereas it allows us to examine the relative monitoring efficiency of security analysts across
firms with significant size differences. Finally, this study will also address the extent to which the
valuation effects of security analysis is expected to vary according to smaller versus larger firms, as a
result of having access to more timely, accurate, and reliable information regarding the firm.6
5. Sample Selection, Methodology, and Variable Measurement
5.1 Sample Selection
The sample of this study covers the 1999 to 2000 period. Firms must also be listed in the Barra’s
Global Estimates and Hemscott’s Company Guide database. Furthermore, we use analyst coverage
(Barra) data (i.e., the number of analysts following each firm which provide earnings-per-share
estimates) available each year for the one year-, two years-, and three years-ahead forecasting
horizons.7 Other data sources include FAME (Financial Analysis Made Easy), and DataStream.
The descriptive statistics of the financial and ownership structure characteristics of the sample
are reported in Table 1. The last column lists the t [Wilcoxon rank sum z] – statistics for the mean
(Shleifer and Vishny (1989)), to increase their power and prestige (Jensen (1986), Stulz (1990)), or to reduce the risk of their personal wealth portfolios (Amihud and Lev (1981)).
6 Increased public awareness of the firm due to firm’s coverage by analysts can also result in increased
volume of trading and in higher market valuation (Merton (1987), and Brennan and Hughes (1991)).
7See also Chung and Jo (1996).
6
[median] difference tests between the smaller 30th percentile firms and those larger firms greater than the
30th percentile. The means [medians] and standard deviations for the smaller and larger firm samples,
are also reported in Table 1. The last column lists the [t-statistics] for the (mean) [error] difference tests
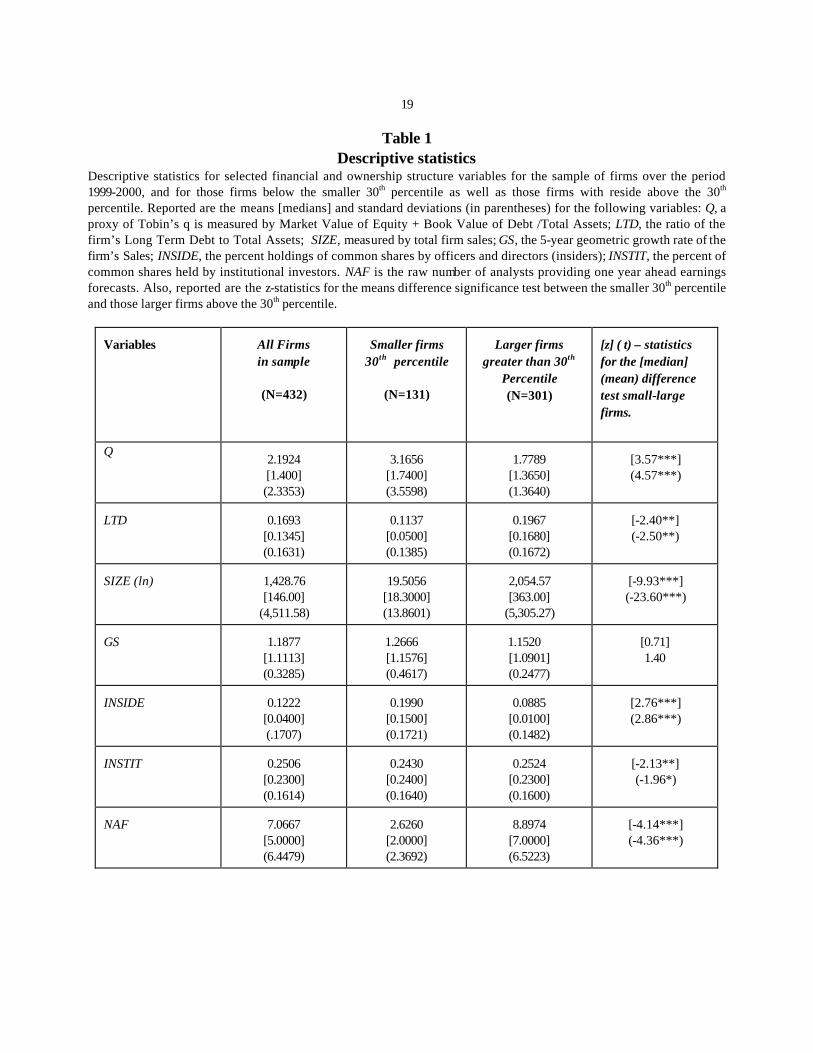
between the smaller and larger firm samples. On average, larger firms have significantly lower Tobin’s q
values (Q) and sales growth rates (GS). Smaller firms have lower Long-Term debt ratios (LTD), and
Total Annual Sales (SIZE). The mean difference tests indicate that there are significant differences in
terms of ownership structure characteristics across smaller and larger firms. Smaller firms exhibit, on
average, higher insider ownership (INSIDE) and slightly lower institutional ownership (INSTIT) in
comparison to larger firms.
The means [medians] difference tests between smaller and larger firms reveal that the number of analysts
following (NAF) larger firms is on average significantly higher compared to analysts following smaller
firms. If the number of analysts is a proxy for the total expenditures on information acquisition about a
firm (Bhushan (1989)), this result suggests in general that more resources are spent for acquisition of
private information for larger than smaller firms.8 This also implies that the demand for forecast services
may be greater for larger than smaller firms. Our evidence suggests that the higher cost of information
acquisition associated with larger firms is outweighed by the strong demand for information generated by
analysts for such firms. Therefore, the fact that more information is generated by security analysts for
larger and, in many instances, diversified firms coupled with the documented evidence that these firms
8 In this paper we do not deal explicitly with issues of “free riding” , “resale of analyst services”, and “salary
differences among analysts”.

7
are trading at a discount in comparison to smaller firms, raises concerns about the monitoring role of
security analysis as well.
[Insert Table 1 About Here]
5.2 Empirical methodology
One of the most basic predictions of the monitoring theory of security analysis is that firms that are
followed by more analysts should be subject to lower agency costs. Empirically, this predicts a negative
relation between agency costs (AGENCY ) and the number of analysts following (NAF) each firm in our
sample. We examine the relation between three alternative measures of agency costs and analyst
coverage by estimating a series of regressions. We therefore estimate the following regression equation
to test the relationship between agency cost and our explanatory variables.
AGENCY = αα 0 + αα 1RNAF + αα 2RNAFxDUM + αα 3 INSIDE + αα 4INSIDE2 + αα 5INSTIT +
αα 6LTD + αα 7LTD 2+ αα 8 SIZE
Since the above equation examines the monitoring effects of security analysis on agency costs, it tells us
very little about the effects of security analysts on firm value. Thus, we estimate the following regression
equation to test the relationship between firm value (FV) and the number of analyst following (NAF) the
firm.
8
FV = αα 0 + αα 1RNAF + αα 2RNRNAFxDUM + αα 3 INSIDE + αα 4INSIDE2 + αα 5INSTIT + αα 6LTD
+ αα 7 LTD2+ αα 8SIZE
5.3 Variable measurement
AGENCY is the interaction of the firm’s growth opportunities and its free cash flows. The growth
opportunities are measured using three alternative dummy variables. The first indicator variable takes the
value of one if the firm’s Tobin’s q (Q-based) is less than the sample median (i.e., poorly managed firm)
and the value of zero otherwise. The second agency cost measure takes the value of one if the firm’s
five-year growth of sales (GS) is less than the sample median and the value of zero otherwise. Finally, a
third agency cost measure, operating expense (OE) standardised by total annual sales, takes the value
of one if the OE ratio is greater than the sample median and the value of zero otherwise (Ang, Cole, and
Lin; 2000). Following Lehn and Poulsen (1989), free cash flows are measured as Operating Income
before Depreciation minus the sum of Taxes plus Interest Expense and Dividends paid, standardised by
Total Assets. Therefore, given the level of corporate free cash flows, firms with low (high) growth
opportunities are expected to be subject to high (low) agency costs. Poorly managed firms are more
likely to be susceptible to higher agency costs than well managed firms and consequently waste free
cash flows in negative NPV projects while well managed firms are expected to be involved in value
maximising activities where free cash flows are not expected to be wasted. Specifically, a high value for
the interactive AGENCY variable would be indicative of a firm with high agency costs arising from the
existence of high free cash flows at the discretion of its managers and being poorly managed.

9
NAF is analyst’s coverage or number of analysts following a firm and provide earnings-per-share
forecasts. Unlike previous studies, in this study we use a residual analyst coverage variable (RNAF)).
This is obtained by regressing the log (1+ the number of analyst following (NAF) on the log of firm size,
measured by total sales, rather than using the raw number of analysts. Following Hong, Lim, and Stein
(2000), we do so because an extra analyst may matter more if a firm is tracked by few than by many
analysts. Furthermore, it is well known that firm size and analyst coverage is positively related. Hence,
the residual analysts coverage measure will purge any size effects that the raw number of analysts could
capture alone. As for the monitoring activity of security analysts, if it reduces managerial misconduct, a
negative relation is predicted between agency costs and the number of security analysts following a firm.
If security analysis, on the other hand, is less effective in limiting managerial non-value-maximising
behaviour for larger than smaller firms, it is predicted that the coefficient of the interactive term should be
statistically insignificant. We, therefore, introduce an interaction term between security analysts and the
size dummy, RNAFxDUM. The coefficient of the interactive term provides a direct estimate of the
differential impact security analysis has on the agency cost measures between larger and smaller firms. In
short, our objective here is to determine whether the monitoring effects of security analysis differ
between smaller and larger firms. The regression analysis is repeated across all three forecasting
horizons.
A set of control variables that characterise the firm’s ownership structure, leverage, and size are also
used in the analysis. The INSIDE variable used in the analysis measures the percent of common shares
held by insiders (i.e. managers and members of the board of directors). The greater the ownership
dispersion of the firm the greater the non-value-maximising conduct by managers, and therefore, the
10
greater the agency costs. The use of INSIDE is intended to capture the aligned interests between
insiders and shareholders. Therefore, it is expected that the larger the ownership stakes by insiders the
lower the agency costs. The squared term, INSIDE2 , is also used to account for possible non-linear
insider ownership effects on agency costs (i.e., non-value maximizing behaviour by entrenched
managers). Furthermore, agency conflicts between managers and shareholders are likely to be mitigated
through the monitoring activities of institutional investors. The INSTIT measure, then, is used as the
percent of shares held by institutional investors. Institutional ownership would indicate the extent of
outside monitoring of managerial behaviour. However, institutional shareholders may be ineffective
monitors because they have little time or resources to devote to active monitoring beyond that of under-
performing firms in which they have large equity stakes ( Berle (1959), Pound (1988)). LTD is the book
value of Long-Term Debt divided by the book value of the Total Assets. This variable is used to control
for the monitoring role of debt on managers’ discretion over free cash flows. It is anticipated that the
agency cost measures should be inversely related to the fraction of debt in the firm’s capital structure.
However, monitoring provided by debt holders may not be effective until the debt level reaches a critical
threshold. This is examined with the inclusion of the squared LTD variable in the analysis. SIZE is the
firm’s Total Annual Sales. Since agency conflicts are more pronounced in larger organisations, a positive
relation between size and agency costs is expected.
6. Results
6.1 Agency Costs

11
Table 2 provides empirical evidence regarding the relation between agency costs, AGENCY, and
analysts coverage, RNAF, across three forecasting horizons. The coefficients found in Panel A for the
RNAF variable are 0.004 (t-value of .661), 0.004 (t-value of .728), and -0.008 (t-value of –1.549) for
the one-year, two-year and three-year forecasting horizons, respectively. The coefficients were,
however, insignificant suggesting that RNAF exerts little influence on reducing agency costs all firms.
On the contrary, once the firms were segregated by size, RNAF x DUM, became negative and
statistically significant for all agency cost variables, suggesting that the monitoring role of security analysis
is much more pronounced for smaller rather than larger firms. As evidenced by Table 2, the coefficients
for Panel A (Q-based agency cost measure) are –0.026 (t-value of –3.152), -0.023 (t-value of –
2.685), and -0.024 (t-value of –1.630) for the one-year, two-year and three-year forecasting horizons,
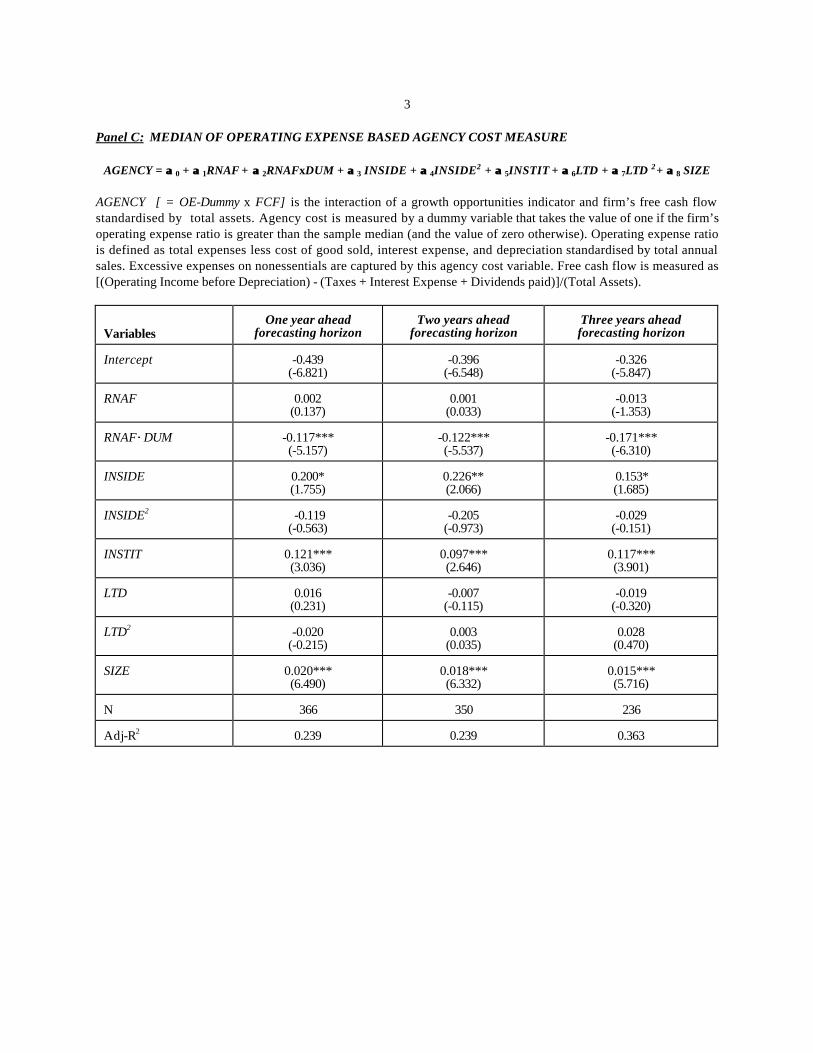
respectively. Moreover, results provide by Panel B (median growth of sales-based agency cost
measure) and Panel C (median growth of operating expense-based agency cost measure) are also
robust and appear to be insensitive to the measure of agency cost used.
Consistent with our hypothesis, these results imply that security analysts exert substantially greater
influence on reducing agency costs for smaller rather than larger firms. One plausible agency-based
explanation is that monitoring of larger firms is met with much difficulty given the size and complexity of
many firms and their accompanying information asymmetries. Alternatively, our evidence could also
imply that the monitoring activity of security analysis has failed to curtail internal capital market
inefficiencies and overinvestment activity in larger firms.

12
The coefficients of the control variables are also presented in Table 2. The coefficient of the INSIDE
variable was significant and negative for all NAF forecasting horizons in Panel C (and one forecasting
horizon in Panel B). This finding supports Jensen and Meckling’s (1976) convergence of interest
argument that at low levels of managerial ownership, managers are not inclined to divert resources away
from value maximisation. Moreover, although not significant, the negative squared INSIDE variable
indicates that inside ownership may have curve-linear effects on agency costs. These results support the
view that high levels of inside ownership, driven by non-convergence of interests between inside and
outside owners of the firm, and managerial equity ownership entrenchment motives, are associated with
high agency costs. Equally as important is the INSTIT variable which also suggests that institutional
ownership may be associated with higher agency costs. The LTD term and squared term of LTD for all
panels in Table 2 were insignificant suggesting that debtholders play no role in monitoring managerial
conduct.
[Insert Table 2 About Here]
6.2 Firm Value
While the evidence suggests that the monitoring effects of security analysis are considerably greater for
smaller rather than larger firms, the extent to which it is related to firm value is not known. To determine
the effects of security analysis on firm value, we use two measures of value; 1) Tobin’s q (Q) and 2)
Excess Market Value (EMV). A set of control variables is also employed which often characterise the

13
firm.9 Furthermore, in order to determine the extent to which security analysis impacts firm size, we
introduce a size dummy, RNAFxDUM, to segregate between smaller and larger firms.
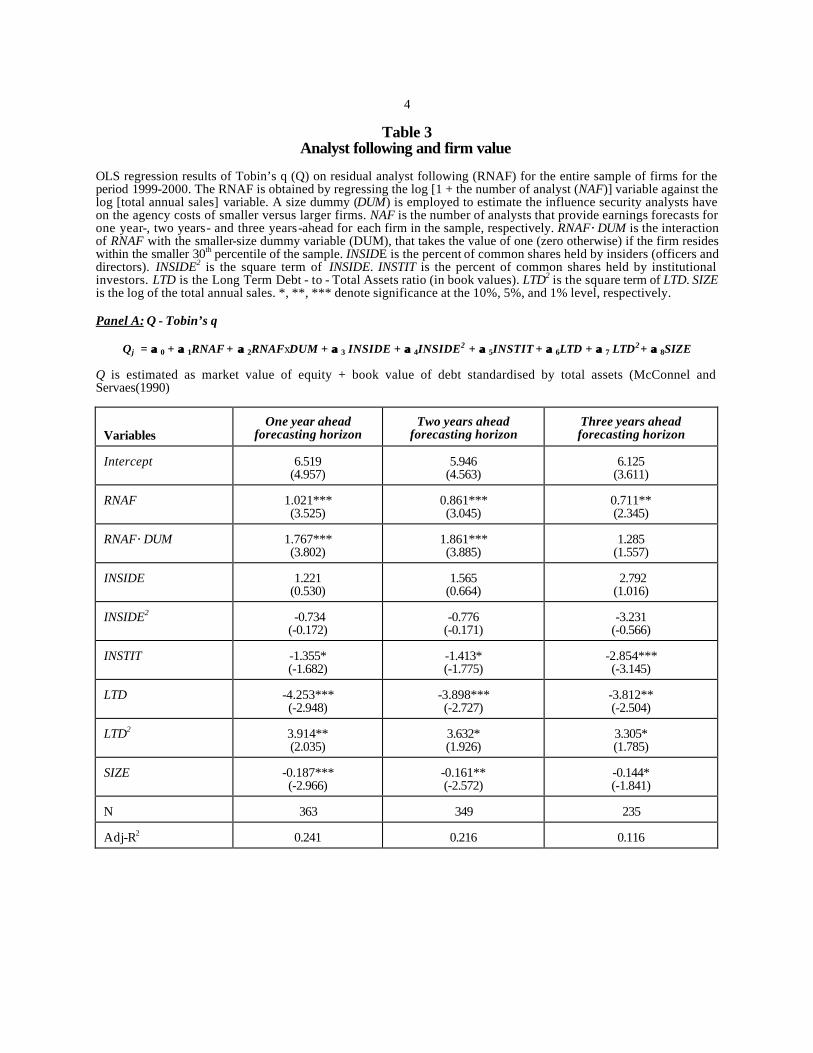
Table 3 includes Panel’s A and B which present regression results for both measures of firm value. As
expected, the coefficient of the number of security analysts following variable, RNAF, is positive and
statistically significant for all forecasting horizons. The coefficients for Q (Panel A) and the NAF variable
are 1.021 (with t-value of 3.525), 0.861 (with t-value of 3.045), 0.711 (with t-value of 2.345) for the
one-year, two-year and three-year forecasting horizons, respectively. Consistent with the conjecture of
Jensen and Meckling (1976) and the evidence of Chung and Jo (1996), these results suggest that
security analysis has a positive impact on firm value by monitoring managerial non-value maximising
behaviour and reducing information asymmetries between insiders and outside investors. Furthermore,
the coefficients of the interactive variable for Q and RNAFxDUM are also positive and statistically
significant, 1.767 (with t-value of 3.802), 1.861 (with t-value of 3.855), 1.285 (with t-value of 1.557)
for the one-year, two-year and three-year forecasting horizons, respectively. The coefficients for EMV
and RNAF found in Panel B are similar and appear to be insensitive to the measure of firm value used.
The evidence suggest that security analysis has much greater monitoring effect on smaller rather than
larger firms further suggesting that information asymmetries between a firms investor relations
department and security analysts of smaller firms is less visible than larger ones.
9 Tobin’s q is measured by [Market Value of Equity + Book Value Debt]/Total Assets in conjunction with
McConnell and Servaes, 1990. The q values are estimated after the announcement of actual earnings forecasted by security analysts.

14
The sign of the coefficients of the control variables are basically as expected. The coefficient of the
INSIDE and the squared INSIDE variables are generally statistically insignificant for all three forecasting
horizons with each measure of firm value. However, the sign of the coefficient of institutional ownership
variable, INSTIT, is negative and statistically significant for all three forecasting horizons and each
measure of firm value. This indicates that firm value is a decreasing function of institutional ownership
consistent with the findings reported in Table 2 which regards to institutional shareholders do not
increase firm value by restricting agency costs associated with managerial misconduct. This result
confirms that institutional ownership of the firm sides with managers rather than monitoring managerial
misconduct probably because of special relations that may exist between institutions and the managers
of the firm (Pound, 1988). The negative and significant coefficient of the squared term of LTD,
however, suggests that debt’s monitoring role becomes binding above a critical threshold. The negative
coefficient of the SIZE variable implies that firm value is adversely affected by size.
We conclude that the value of security analysis falls when size of the firm increases and the monitoring of
larger firms by security analysts fails to add shareholder value mainly because of the difficulty to
discipline managerial non-value-maximising behaviour in these firms. Disentangling operating
inefficiencies and asymmetries of information associated with larger firms may not only be difficult but
costly as well. Hence, it can be argued that the limitations of security analysis in monitoring managerial
misconduct in larger-complex firms may be another reason why larger firms tend to trade at discounts
with respect to smaller firms.
[Insert Table 3 About Here]

15
7. Summary and Conclusions
We have examined directly whether security analysis acts as a monitoring mechanism in restricting
agency-related costs arising from the separation of ownership and control in UK publicly traded
companies. Moreover, we also investigated the extent to which the effectiveness of the monitoring
activity of security analysis is related to size of the firm. Finally, we investigated the impact of security
analysis on the firm using two different valuation measures.
These findings provide empirical support for the notion that security analysis is considerably less
effective in restricting managers’ non-value maximising behaviour for larger rather than smaller firms.
Interestingly, while our empirical results indicate that firm value is a positive function of security analysis,
security analysis seems to exert greater influence on the value of smaller rather than larger firms. Hence,
our findings suggest that the usefulness of security analysis diminishes with the industrial diversification of
the firm. Overall, our findings are in support of the notion that the monitoring limitations of security
analysis may be another reason why larger firms trade at discounts in comparison to smaller firms.

16
References
Amihud, Y., and B. Lev, 1981, Risk reduction as a managerial motive for conglomerate mergers. The Bell Journal of Economics 12: 605-617. Ang, J., R. Cole, J. Lin, 2000, Agency Costs and Ownership Structure. Journal of Finance 55: 81-106.
Berle , A., 1959, Power without property : A new development in American political economy, New York: Harcout Brace and World. Berger, P., and E. Ofek, 1995, Diversification’s effect on firm value. Journal of Financial Economics 37: 39-65. Bhushan, R, 1989, Firm characteristics and analyst following, Journal of Accounting and Economics 37; 39-65 Billett, M., and S. Mauer,1998, Diversification and the value of internal capital markets: The case of tracking stock, Working paper (South Methodist University, Dallas,TX). Brennan, M., and A. Subrahmanyam, 1995, Investment analysis and price formation in security markets. Journal of Financial Economics 38: 361-381. Brennan, M., and P.Hughes, 1991, Stock prices and the supply of information. Journal of Finance 46: 1665-1691. Chung, K. H., and H. Jo, 1996, The impact of security analysts’ monitoring and marketing functions on the market value of firms. Journal of Financial and Quantitative Analysis 31: 493-512. Chung, K. H., and S. W. Pruitt, 1994, A simple approximation of Tobin’s q. Financial Management 23 (3): 70-74. Comment, R., and G. A. Jarrell, 1995, Corporate focus and stock returns. Journal of Financial Economics 37: 67-87. Dennis, D. J., D. K. Dennis, and A. Sarin, 1997, Agency problems, equity ownership, and corporate diversification. Journal of Finance 52: 135-160. Doukas, J.A., C. Kim, and C. Pantzalis, 2000, Security Analysis, Agency Costs and Firm Characteristics. Financial Analysts Journal, 56: 222-222.

17
Gilson, S.C., P. M. Healy, C. F. Noe, and K. G. Palepu, 1998, Information effects of spin-offs, equity carve-outs, and targeted stock offerings, Working paper (Harvard University, Boston, MA). Harris, M., C.H. Kriebel, and A. Raviv, 1982, Asymmetric information, incentives, and intrafirm resource allocation. Management Science 28: 604-620. Jensen, M. C., 1986, Agency costs of free cash flow, corporate finance and takeovers. American Economic Review 76: 323-329. Jensen, M. C., and W. H. Meckling, 1976, Theory of the firm: Managerial behavior, agency costs and ownership structure. Journal of Financial Economics 3: 305-360. Jensen, M. C., and K. J. Murphy, 1990, Performance pay and top management incentives. Journal of Political Economy 98: 225-264. Lamont, O., 1997, Cash flow and investment: Evidence from internal capital markets, Journal of Finance 52: 83-109. Lang, L. H. P., and R. M. Stulz, 1994, Tobin’s q, corporate diversification and firm performance. Journal of Political Economy 102: 1248-1280. Lehn, K., and A. Poulsen, 1989, Free cash flow and stock holder gains in going private transactions, Journal of Finance 44, 771-789. Lindenberg, E. B. and S.A. Ross, 1981, Tobin’s q ratio and industrial organization. Journal of Business 54: 1-32 Logue, D.E., J.K.Seward, and J.P.Walsh, 1996, Rearranging residual claims: A case for targeted stock, Financial Management 25,43-61. McConnell, J., and H. Servaes, 1990, Additional evidence on equity ownership and corporate value. Journal of Financial Economics 27: 595-612. McConnell, J., and H. Servaes, 1995, Equity ownership and the two faces of debt. Journal of Financial Economics 39:131-157. Merton, R., 1987, A simple model of capital market equilibrium with incomplete information. Journal of Finance 42: 483-510. Moyer, R. C., R. E. Chatfield, and P. M. Sisneros, 1989, Security analyst monitoring activity: Agency costs and information demands. Journal of Financial and Quantitative Analysis 24: 503-512.

18
Nanda, V., and M. P. Narayanan, 1997, Disentangling value: Misvaluation and the scope of the firm. University of Michigan Business School. Working paper. Pound, J,1988, Proxy contests and the efficiency of shareholder oversight, Journal of Financial Economics 20: 237-265. Rajan, R., H. Servaes, and L. Zingales, 2000, The cost of diversity: The diversification discount and inefficient investment, Journal of Finance, 55, 35-80. Servaes, H., 1996, The value of diversification during the conglomerate merger wave, Journal of Finance, 1201-1225. Shin, H.H and R.Stulz, 1998, Are internal capital markets efficient? Quarterly Journal of Economics 113, 531-552. Shleifer, A. and R. Vishny,1989, Managerial entrenchment: The case of manager-specific investments. Journal of Financial Economics 25: 123-139. Stulz, R. M., 1990, Managerial discretion and optimal financing policies. Journal of Financial Economics 26: 3-27.
19
Table 1 Descriptive statistics
Descriptive statistics for selected financial and ownership structure variables for the sample of firms over the period 1999-2000, and for those firms below the smaller 30th percentile as well as those firms with reside above the 30th percentile. Reported are the means [medians] and standard deviations (in parentheses) for the following variables: Q, a proxy of Tobin’s q is measured by Market Value of Equity + Book Value of Debt /Total Assets; LTD, the ratio of the firm’s Long Term Debt to Total Assets; SIZE, measured by total firm sales; GS, the 5-year geometric growth rate of the firm’s Sales; INSIDE, the percent holdings of common shares by officers and directors (insiders); INSTIT, the percent of common shares held by institutional investors. NAF is the raw number of analysts providing one year ahead earnings forecasts. Also, reported are the z-statistics for the means difference significance test between the smaller 30th percentile and those larger firms above the 30th percentile.
Variables
All Firms in sample
(N=432)
Smaller firms
30th percentile
(N=131)
Larger firms
greater than 30th Percentile (N=301)
[z] ( t) – statistics for the [median] (mean) difference test small-large firms.
Q 2.1924 [1.400] (2.3353)
3.1656
[1.7400] (3.5598)
1.7789
[1.3650] (1.3640)
[3.57***] (4.57***)
LTD
0.1693
[0.1345] (0.1631)
0.1137
[0.0500] (0.1385)
0.1967
[0.1680] (0.1672)
[-2.40**] (-2.50**)
SIZE (ln)
1,428.76 [146.00]
(4,511.58)
19.5056
[18.3000] (13.8601)
2,054.57 [363.00]
(5,305.27)
[-9.93***] (-23.60***)
GS
1.1877
[1.1113] (0.3285)
1.2666
[1.1576] (0.4617)
1.1520
[1.0901] (0.2477)
[0.71] 1.40
INSIDE
0.1222
[0.0400] (.1707)
0.1990
[0.1500] (0.1721)
0.0885
[0.0100] (0.1482)
[2.76***] (2.86***)
INSTIT
0.2506
[0.2300] (0.1614)
0.2430
[0.2400] (0.1640)
0.2524
[0.2300] (0.1600)
[-2.13**] (-1.96*)
NAF
7.0667
[5.0000] (6.4479)
2.6260
[2.0000] (2.3692)
8.8974
[7.0000] (6.5223)
[-4.14***] (-4.36***)

1
Table2
Agency costs, firm size and the monitoring role of security analysis
OLS regression results of three alternative agency cost (AGENCY) measures on residual analyst following (RNAF) for the entire sample of firms for the period 1999-2000. The RNAF is obtained by regressing the log [1 + the number of analyst (NAF)] variable against the log [total annual sales] variable . A size dummy (DUM) is employed to estimate the influence security analysts have on the agency costs of smaller versus larger firms. NAF is the number of analysts that provide earnings forecasts for the one year-, two years- and three years-ahead for each firm in the sample, respectively. RNAF×DUM is the interaction of RNAF with the smaller-size dummy variable (DUM), that takes the value of one (zero otherwise) if the firm resides within the smaller 30th percentile of the sample. INSIDE is the percent of common shares held by insiders (officers and directors). INSIDE2 is the square term of INSIDE. INSTIT is the percent of common shares held by institutional investors. LTD is the Long Term Debt - to - Total Assets ratio (in book values). LTD2 is the square term of LTD. SIZE is the log of the total annual sales. *, **, *** denote significance at the 10%, 5%, and 1% level, respectively. Panel A: MEDIAN Q-BASED AGENCY COST MEASURE
AGENCY = αα 0 + αα 1RNAF + αα 2RNAFxDUM + αα 3 INSIDE + αα 4INSIDE2 + αα 5INSTIT + αα 6LTD + αα 7LTD 2+ αα 8 SIZE
AGENCY [ = Qdummy x FCF] is the interaction of a growth opportunities indicator and firm’s free cash flow standardized by size. Poor growth opportunities are measured by a dummy variable that takes the value of one if the firm’s Tobin’s q is less than the median of the sample (and the value of zero otherwise). Free cash flow is measured as [(Operating Income before Depreciation) - (Taxes + Interest Expense + Dividends paid)]/(Total Assets).
Variables
One year ahead
forecasting horizon
Two years ahead
forecasting horizon
Three years ahead forecasting horizon
Intercept
0.013
(0.597)
0.006
(0.277)
0.040
(1.285) RNAF
0.004
(0.661)
0.004
(0.728)
-0.008
(-1.549) RNAF×DUM
-0.026*** (-3.152)
-0.023*** (-2.685)
-0.024* (-1.630)
INSIDE
-0.037
(-0.919)
-0.054
(-1.296)
-0.073 (-1.384)
INSIDE2
0.054 (0.725)
0.088
(1.086)
0.069
(0.594) INSTIT
0.033** (2.360)
0.032** (2.301)
0.014
(0.678) LTD
-0.020
(-0.789)
-0.023
(-0.918)
-0.026
(-0.945) LTD2
-0.006
(-0.192)
-0.019
(-0.060)
0.003
(0.092) SIZE
0.001
(0.397)
0.001
(0.756)
-0.006
(-0.389) N
337
324
222
Adj-R2
0.051
0.043
0.050
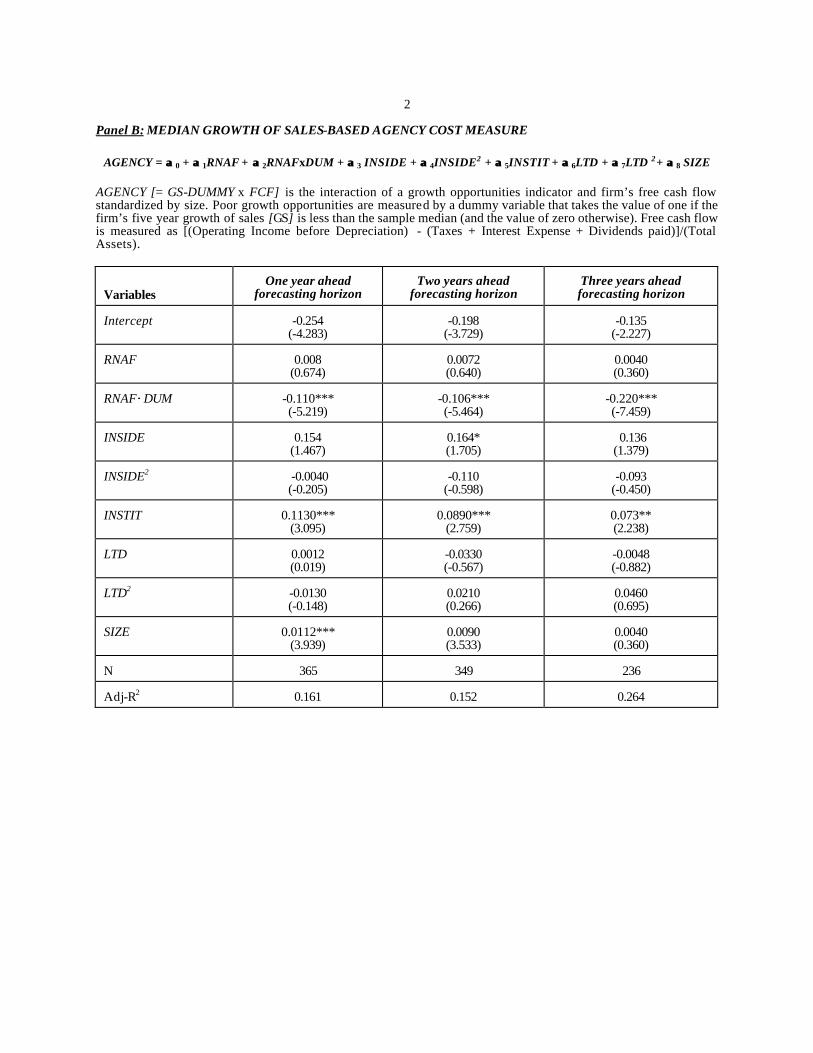
2 Panel B: MEDIAN GROWTH OF SALES-BASED AGENCY COST MEASURE
AGENCY = αα 0 + αα 1RNAF + αα 2RNAFxDUM + αα 3 INSIDE + αα 4INSIDE2 + αα 5INSTIT + αα 6LTD + αα 7LTD 2+ αα 8 SIZE
AGENCY [= GS-DUMMY x FCF] is the interaction of a growth opportunities indicator and firm’s free cash flow standardized by size. Poor growth opportunities are measured by a dummy variable that takes the value of one if the firm’s five year growth of sales [GS] is less than the sample median (and the value of zero otherwise). Free cash flow is measured as [(Operating Income before Depreciation) - (Taxes + Interest Expense + Dividends paid)]/(Total Assets).
Variables
One year ahead
forecasting horizon
Two years ahead
forecasting horizon
Three years ahead forecasting horizon
Intercept
-0.254
(-4.283)
-0.198
(-3.729)
-0.135
(-2.227) RNAF
0.008
(0.674)
0.0072 (0.640)
0.0040 (0.360)
RNAF×DUM
-0.110*** (-5.219)
-0.106*** (-5.464)
-0.220*** (-7.459)
INSIDE
0.154
(1.467)
0.164* (1.705)
0.136 (1.379)
INSIDE2
-0.0040 (-0.205)
-0.110
(-0.598)
-0.093
(-0.450) INSTIT
0.1130***
(3.095)
0.0890***
(2.759)
0.073** (2.238)
LTD
0.0012 (0.019)
-0.0330 (-0.567)
-0.0048 (-0.882)
LTD2
-0.0130 (-0.148)
0.0210 (0.266)
0.0460 (0.695)
SIZE
0.0112***
(3.939)
0.0090 (3.533)
0.0040 (0.360)
N
365
349
236
Adj-R2
0.161
0.152
0.264
3
Panel C: MEDIAN OF OPERATING EXPENSE BASED AGENCY COST MEASURE
AGENCY = αα 0 + αα 1RNAF + αα 2RNAFxDUM + αα 3 INSIDE + αα 4INSIDE2 + αα 5INSTIT + αα 6LTD + αα 7LTD 2+ αα 8 SIZE
AGENCY [ = OE-Dummy x FCF] is the interaction of a growth opportunities indicator and firm’s free cash flow standardised by total assets. Agency cost is measured by a dummy variable that takes the value of one if the firm’s operating expense ratio is greater than the sample median (and the value of zero otherwise). Operating expense ratio is defined as total expenses less cost of good sold, interest expense, and depreciation standardised by total annual sales. Excessive expenses on nonessentials are captured by this agency cost variable. Free cash flow is measured as [(Operating Income before Depreciation) - (Taxes + Interest Expense + Dividends paid)]/(Total Assets).
Variables
One year ahead
forecasting horizon
Two years ahead
forecasting horizon
Three years ahead forecasting horizon
Intercept
-0.439
(-6.821)
-0.396
(-6.548)
-0.326
(-5.847) RNAF
0.002
(0.137)
0.001
(0.033)
-0.013
(-1.353) RNAF×DUM
-0.117*** (-5.157)
-0.122*** (-5.537)
-0.171*** (-6.310)
INSIDE
0.200* (1.755)
0.226** (2.066)
0.153* (1.685)
INSIDE2
-0.119 (-0.563)
-0.205
(-0.973)
-0.029
(-0.151) INSTIT
0.121*** (3.036)
0.097*** (2.646)
0.117*** (3.901)
LTD
0.016
(0.231)
-0.007
(-0.115)
-0.019
(-0.320) LTD2
-0.020
(-0.215)
0.003
(0.035)
0.028
(0.470) SIZE
0.020*** (6.490)
0.018*** (6.332)
0.015*** (5.716)
N
366
350
236
Adj-R2
0.239
0.239
0.363
4
Table 3 Analyst following and firm value
OLS regression results of Tobin’s q (Q) on residual analyst following (RNAF) for the entire sample of firms for the period 1999-2000. The RNAF is obtained by regressing the log [1 + the number of analyst (NAF)] variable against the log [total annual sales] variable. A size dummy (DUM) is employed to estimate the influence security analysts have on the agency costs of smaller versus larger firms. NAF is the number of analysts that provide earnings forecasts for one year-, two years- and three years-ahead for each firm in the sample, respectively. RNAF×DUM is the interaction of RNAF with the smaller-size dummy variable (DUM), that takes the value of one (zero otherwise) if the firm resides within the smaller 30th percentile of the sample. INSIDE is the percent of common shares held by insiders (officers and directors). INSIDE2 is the square term of INSIDE. INSTIT is the percent of common shares held by institutional investors. LTD is the Long Term Debt - to - Total Assets ratio (in book values). LTD2 is the square term of LTD. SIZE is the log of the total annual sales. *, **, *** denote significance at the 10%, 5%, and 1% level, respectively. Panel A: Q - Tobin’s q
Qj = αα 0 + αα 1RNAF + αα 2RNAFxDUM + αα 3 INSIDE + αα 4INSIDE2 + αα 5INSTIT + αα 6LTD + αα 7 LTD2+ αα 8SIZE Q is estimated as market value of equity + book value of debt standardised by total assets (McConnel and Servaes(1990)
Variables
One year ahead
forecasting horizon
Two years ahead
forecasting horizon
Three years ahead forecasting horizon
Intercept
6.519
(4.957)
5.946
(4.563)
6.125
(3.611) RNAF
1.021*** (3.525)
0.861*** (3.045)
0.711** (2.345)
RNAF×DUM
1.767*** (3.802)
1.861*** (3.885)
1.285
(1.557) INSIDE
1.221
(0.530)
1.565
(0.664)
2.792 (1.016)
INSIDE2
-0.734 (-0.172)
-0.776
(-0.171)
-3.231
(-0.566) INSTIT
-1.355* (-1.682)
-1.413* (-1.775)
-2.854*** (-3.145)
LTD
-4.253*** (-2.948)
-3.898*** (-2.727)
-3.812** (-2.504)
LTD2
3.914** (2.035)
3.632* (1.926)
3.305* (1.785)
SIZE
-0.187*** (-2.966)
-0.161** (-2.572)
-0.144* (-1.841)
N
363
349
235
Adj-R2
0.241
0.216
0.116
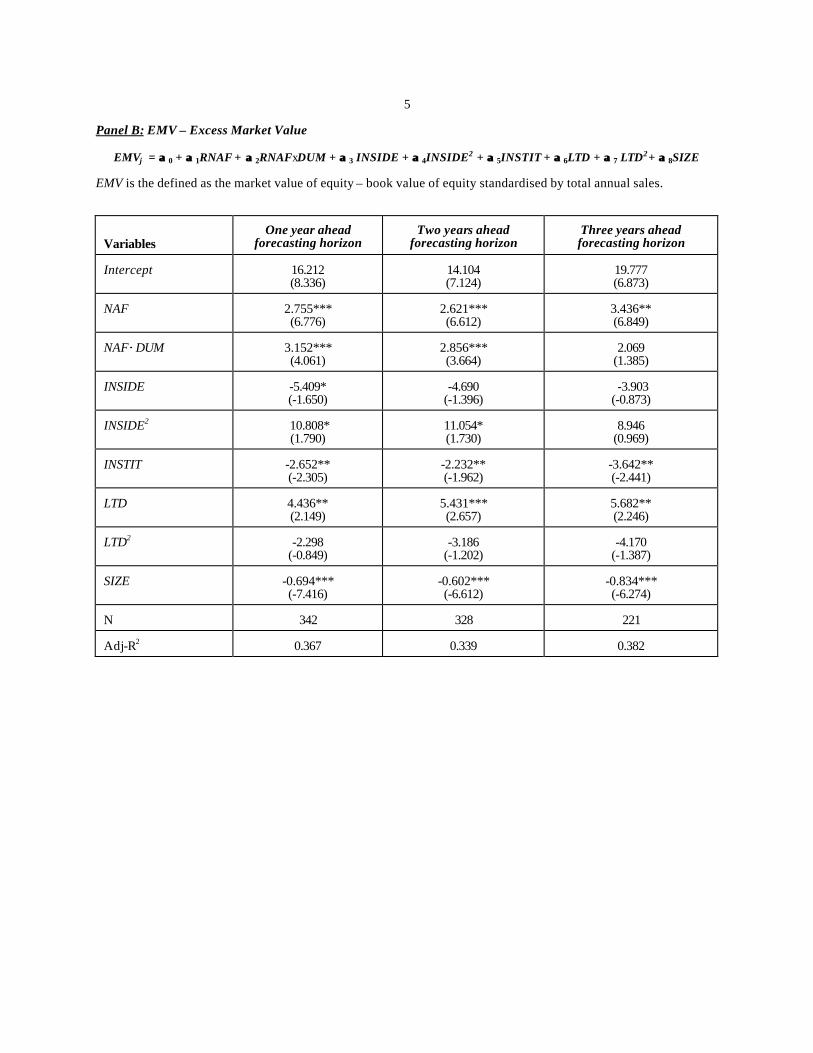
5 Panel B: EMV – Excess Market Value
EMVj = αα 0 + αα 1RNAF + αα 2RNAFxDUM + αα 3 INSIDE + αα 4INSIDE2 + αα 5INSTIT + αα 6LTD + αα 7 LTD2+ αα 8SIZE EMV is the defined as the market value of equity – book value of equity standardised by total annual sales.
Variables
One year ahead
forecasting horizon
Two years ahead
forecasting horizon
Three years ahead forecasting horizon
Intercept
16.212 (8.336)
14.104 (7.124)
19.777 (6.873)
NAF
2.755*** (6.776)
2.621*** (6.612)
3.436** (6.849)
NAF×DUM
3.152*** (4.061)
2.856*** (3.664)
2.069
(1.385) INSIDE
-5.409* (-1.650)
-4.690
(-1.396)
-3.903 (-0.873)
INSIDE2
10.808* (1.790)
11.054* (1.730)
8.946
(0.969) INSTIT
-2.652** (-2.305)
-2.232** (-1.962)
-3.642** (-2.441)
LTD
4.436** (2.149)
5.431*** (2.657)
5.682** (2.246)
LTD2
-2.298
(-0.849)
-3.186
(-1.202)
-4.170
(-1.387) SIZE
-0.694*** (-7.416)
-0.602*** (-6.612)
-0.834*** (-6.274)
N
342
328
221
Adj-R2
0.367
0.339
0.382