Embed Size (px)
Citation preview

9th SSIAB Workshop, Avignon - May 9-11, 2012
Testing of mark independence for markedpoint patternsMari MyllymäkiDepartment of Biomedical Engineering and Computational ScienceAalto [email protected]
Deviation and envelope tests for marked point patternsMari Myllymäki ([email protected])
2/22
Outline
The talk is based on the paper
P. Grabarnik, M. Myllymäki and D. Stoyan (2011). Correcttesting of mark independence for marked point patterns.Ecological Modelling 222, 3888–3894.
and discussesI the conventional envelope testI the refined envelope testI the deviation test
through two marked point pattern data examples.
Deviation and envelope tests for marked point patternsMari Myllymäki ([email protected])
3/22
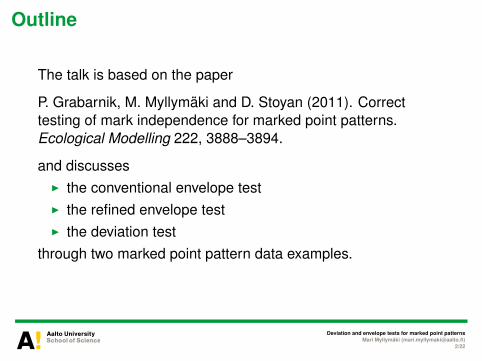
Data examplesTharandter Wald: These data observed ina 56 m × 38 m rectangle come from aNorway spruce forest in Saxony(Germany).
Circles are proportional to the diameters oftrees at breast height (=marks).
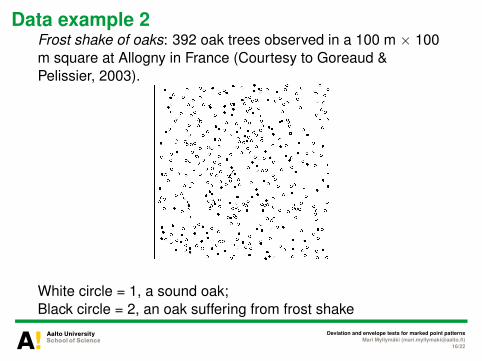
Frost shake of oaks: 392 oak treesobserved in a 100 m × 100 m square atAllogny in France (Courtesy to Goreaud &Pelissier, 2003).
White circle = 1, a sound oak;Black circle = 2, an oak suffering from frostshake
Deviation and envelope tests for marked point patternsMari Myllymäki ([email protected])
4/22
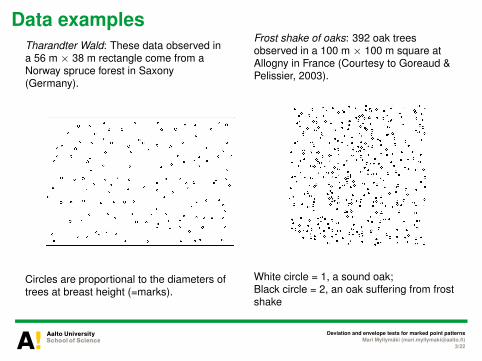
Our question here:
are the marks independently assigned for the points in anoriginally non-marked point pattern?
“Random labeling”hypothesis
Deviation and envelope tests for marked point patternsMari Myllymäki ([email protected])
5/22
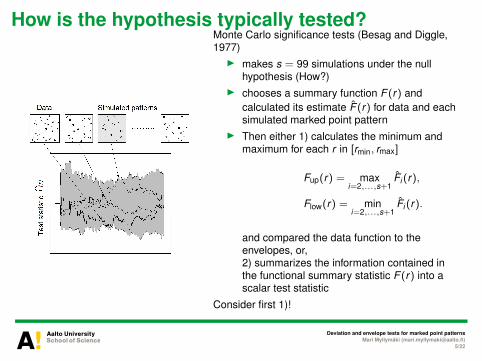
How is the hypothesis typically tested?Monte Carlo significance tests (Besag and Diggle,1977)
I makes s = 99 simulations under the nullhypothesis (How?)
I chooses a summary function F (r) andcalculated its estimate F̂ (r) for data and eachsimulated marked point pattern
I Then either 1) calculates the minimum andmaximum for each r in [rmin, rmax]
Fup(r) = maxi=2,...,s+1
F̂i (r),
Flow(r) = mini=2,...,s+1
F̂i (r).
and compared the data function to theenvelopes, or,2) summarizes the information contained inthe functional summary statistic F (r) into ascalar test statistic
Consider first 1)!
Deviation and envelope tests for marked point patternsMari Myllymäki ([email protected])
6/22
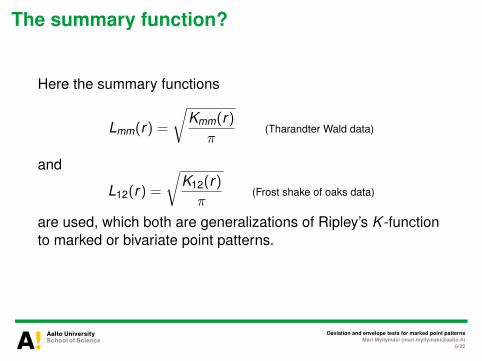
The summary function?
Here the summary functions
Lmm(r) =
√Kmm(r)π
(Tharandter Wald data)
and
L12(r) =
√K12(r)π
(Frost shake of oaks data)
are used, which both are generalizations of Ripley’s K -functionto marked or bivariate point patterns.
Deviation and envelope tests for marked point patternsMari Myllymäki ([email protected])
7/22
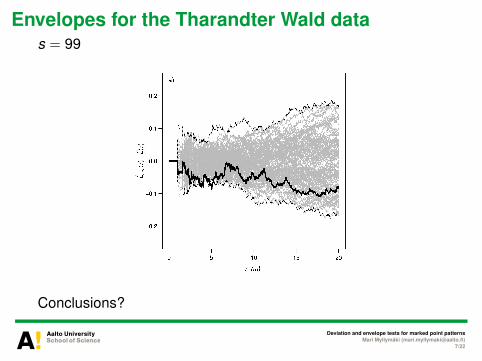
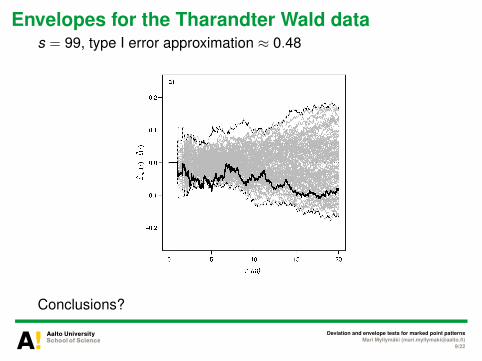
Envelopes for the Tharandter Wald datas = 99
Conclusions?
Deviation and envelope tests for marked point patternsMari Myllymäki ([email protected])
8/22
Problem of the envelope testThe spatial correlations are inspected for a range of distancessimultaneously.
I Ripley (1977)I introduced envelope testsI mentioned that the frequence of committing the type I error
in the envelope test may be higher than for a singledistance test
I Diggle (1979, 2003)I proposed the deviation test
I Loosmore and Ford (2006)I adopted the deviation testI demonstrated the multiple testing problem of envelope test
by estimating the type I error probability by simulation forthe complete spatial randomness hypothesis based on thenearest neighbour distance distribution function
I rejected the envelope test
Deviation and envelope tests for marked point patternsMari Myllymäki ([email protected])
9/22
Envelopes for the Tharandter Wald datas = 99, type I error approximation ≈ 0.48
Conclusions?
Deviation and envelope tests for marked point patternsMari Myllymäki ([email protected])
10/22
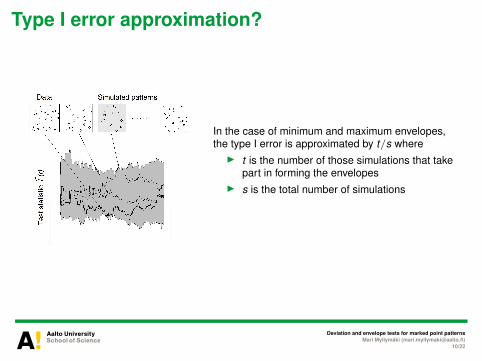
Type I error approximation?
In the case of minimum and maximum envelopes,the type I error is approximated by t/s where
I t is the number of those simulations that takepart in forming the envelopes
I s is the total number of simulations

Deviation and envelope tests for marked point patternsMari Myllymäki ([email protected])
11/22
Towards the refined envelope test
A natural way to make the envelope method valid, i.e. to obtaina reasonable type I error, is to increase the number ofsimulations from which the envelopes are calculated.
Deviation and envelope tests for marked point patternsMari Myllymäki ([email protected])
12/22
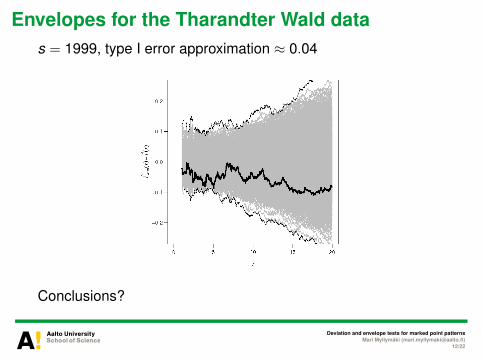
Envelopes for the Tharandter Wald datas = 1999, type I error approximation ≈ 0.04
Conclusions?
Deviation and envelope tests for marked point patternsMari Myllymäki ([email protected])
13/22
The refined envelope test
The refined testing procedure = the envelope test, whereI the type I error probability is evaluated and taken into
account in making conclusionsI if the choice of the number of simulations s leads to an
unacceptably large type I error, s can be increased so thatthe type I error comes close to a desired value
The refined envelope test is then a rigorous statistical tool.
Deviation and envelope tests for marked point patternsMari Myllymäki ([email protected])
14/22
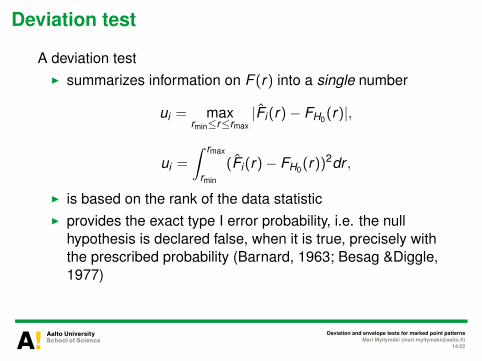
Deviation test
A deviation testI summarizes information on F (r) into a single number
ui = maxrmin≤r≤rmax
|F̂i(r)− FH0(r)|,
ui =
∫ rmax
rmin
(F̂i(r)− FH0(r))2dr ,
I is based on the rank of the data statisticI provides the exact type I error probability, i.e. the null
hypothesis is declared false, when it is true, precisely withthe prescribed probability (Barnard, 1963; Besag &Diggle,1977)
Deviation and envelope tests for marked point patternsMari Myllymäki ([email protected])
15/22
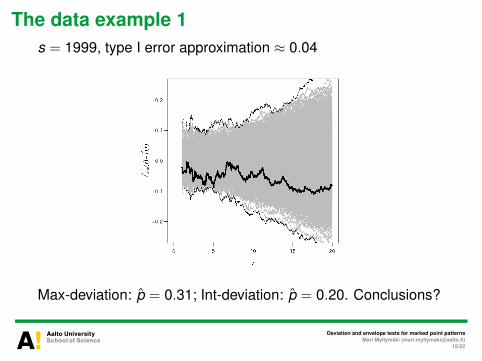
The data example 1s = 1999, type I error approximation ≈ 0.04
Max-deviation: p̂ = 0.31; Int-deviation: p̂ = 0.20. Conclusions?
Deviation and envelope tests for marked point patternsMari Myllymäki ([email protected])
16/22
Data example 2Frost shake of oaks: 392 oak trees observed in a 100 m × 100m square at Allogny in France (Courtesy to Goreaud &Pelissier, 2003).
White circle = 1, a sound oak;Black circle = 2, an oak suffering from frost shake
Deviation and envelope tests for marked point patternsMari Myllymäki ([email protected])
17/22
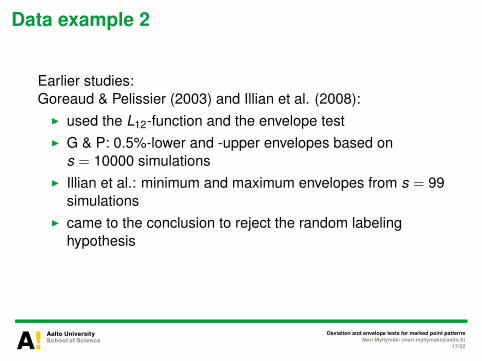
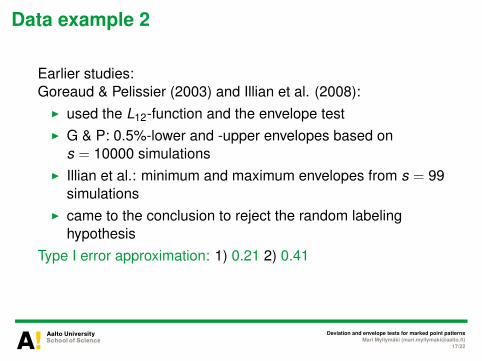
Data example 2
Earlier studies:Goreaud & Pelissier (2003) and Illian et al. (2008):
I used the L12-function and the envelope testI G & P: 0.5%-lower and -upper envelopes based on
s = 10000 simulationsI Illian et al.: minimum and maximum envelopes from s = 99
simulationsI came to the conclusion to reject the random labeling
hypothesis
Deviation and envelope tests for marked point patternsMari Myllymäki ([email protected])
17/22
Data example 2
Earlier studies:Goreaud & Pelissier (2003) and Illian et al. (2008):
I used the L12-function and the envelope testI G & P: 0.5%-lower and -upper envelopes based on
s = 10000 simulationsI Illian et al.: minimum and maximum envelopes from s = 99
simulationsI came to the conclusion to reject the random labeling
hypothesisType I error approximation: 1) 0.21 2) 0.41
Deviation and envelope tests for marked point patternsMari Myllymäki ([email protected])
18/22
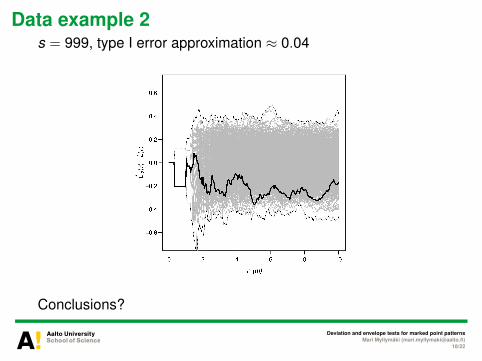
Data example 2s = 999, type I error approximation ≈ 0.04
Conclusions?
Deviation and envelope tests for marked point patternsMari Myllymäki ([email protected])
18/22
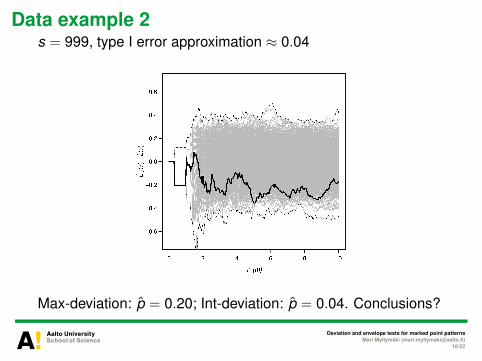
Data example 2s = 999, type I error approximation ≈ 0.04
Max-deviation: p̂ = 0.20; Int-deviation: p̂ = 0.04. Conclusions?
Deviation and envelope tests for marked point patternsMari Myllymäki ([email protected])
19/22
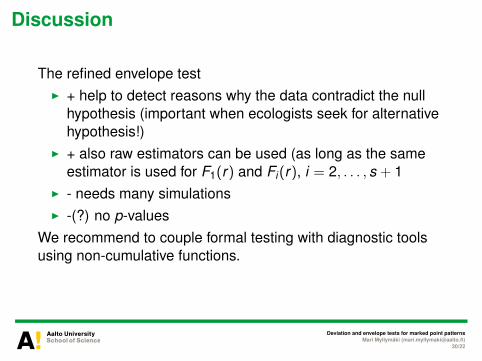
Discussion
The deviation testI + do not need so many simulationsI + p-values can be easily estimatedI + different formsI - says only little about the reason of rejectionI - says nothing on the scales at which there is behavior of
F (r) leading to rejectionI - performance depends on the behavior of the variance of
F (r) over the range of chosen distances (→ moresophisticated edge correction methods, Ho & Chiu, 2006)
Deviation and envelope tests for marked point patternsMari Myllymäki ([email protected])
20/22
Discussion
The refined envelope testI + help to detect reasons why the data contradict the null
hypothesis (important when ecologists seek for alternativehypothesis!)
I + also raw estimators can be used (as long as the sameestimator is used for F1(r) and Fi(r), i = 2, . . . , s + 1
I - needs many simulationsI -(?) no p-values
We recommend to couple formal testing with diagnostic toolsusing non-cumulative functions.
Deviation and envelope tests for marked point patternsMari Myllymäki ([email protected])
21/22
References
I Barnard, G.A., 1963. Discussion of paper by M.S. Bartlett. J. R. Stat. Soc. B25,294.
I Besag, J., Diggle,P. J., 1977. Simple Monte Carlo tests for spatial pattern. Appl.Stat. 26, 327–333.
I Goreaud, F., Pélissier, R., 2003. Avoiding misinterpretation of biotic interactionswith the intertype K12-function: Population independence vs. random labellinghypotheses. J. Veg. Science 14, 681–692.
I P. Grabarnik, M. Myllymäki and D. Stoyan. Correct testing of mark independencefor marked point patterns. Ecol. Mod. 222, 3888–3894.
I Ho, L.P., Chiu, S.N., 2006. Testing the complete spatial randomness by Diggle’stest without an arbitrary upper limit. J. Stat. Comp. Simul. 76, 585–591.
I Illian, J., Penttinen, A., Stoyan, H., Stoyan, D., 2008. Statistical Analysis andModelling of Spatial Point Patterns. Wiley, Chichester.
I Loosmoore, N.B., Ford, E.D., 2006. Statistical inference using the G or K pointpattern spatial statistics. Ecology 87, 1925–1931.
I Ripley, B.D., 1977. Modelling of spatial patterns. J. R. Stat. Soc. B 39, 172–192.

Deviation and envelope tests for marked point patternsMari Myllymäki ([email protected])
22/22
Thank you!


![Séminaire Université de Southampton [0.2cm] THE WONDERS OF …€¦ · THE WONDERS OF THE POST-NEWTONIAN Luc Blanchet Gravitation et Cosmologie (GR"CO) Institut d’Astrophysique](https://img.pdfslide.us/doc/110x75/5f0c63667e708231d435279a/sminaire-universit-de-southampton-02cm-the-wonders-of-the-wonders-of-the.jpg)
![UCB CS294-88: Declarative Design [0.2cm] Chisel Overviewinst.eecs.berkeley.edu/~cs294-88/sp13/lectures/chisel-review.pdf · UCB CS294-88: Declarative Design Chisel Overview Jonathan](https://img.pdfslide.us/doc/110x75/60417694dde8db15be43b6a8/ucb-cs294-88-declarative-design-02cm-chisel-cs294-88sp13lectureschisel-reviewpdf.jpg)
![Structured Reactive Programming with Polymorphic …Structured Reactive Programming with Polymorphic Temporal Tiles Author-0.5cm [width=2cm]Poset-Transparent.png 0.2cm S. Archipoff](https://img.pdfslide.us/doc/110x75/5f0f74c67e708231d4444051/structured-reactive-programming-with-polymorphic-structured-reactive-programming.jpg)


![@let@token [0.2cm]Optimal Feature Extraction and Feature ...tccls.computer.org/wp-content/uploads/2017/12/ICIIBMS_2017_Optimal... · Mazilu Mazilu Guerin Niazmand Bachlin Kwon Delval](https://img.pdfslide.us/doc/110x75/5e56c9d93ef7fb50ff580f88/lettoken-02cmoptimal-feature-extraction-and-feature-tccls-mazilu-mazilu.jpg)
![The role of water in[0.2cm] planet formation · c 2019,DjoekeSchoonenberg contact: djoekeschoonenberg@gmail.com ISBN:978-94-6323-827-4 CoverdesignbyHuubRutjes PrintedbyGildeprint](https://img.pdfslide.us/doc/110x75/5f5a08ae7abb6e02c651e3da/the-role-of-water-in02cm-planet-formation-c-2019djoekeschoonenberg-contact.jpg)


![COMBISTOP - Industrial Clutch Parts Ltd7 COMBISTOP 38 W Rmax [J] and a second friction surface of casting. Depend-Permissible friction W Rmax [J] depending on the switching frequency](https://img.pdfslide.us/doc/110x75/5ea4f550099f4a2e255da6c9/combistop-industrial-clutch-parts-ltd-7-combistop-38-w-rmax-j-and-a-second-friction.jpg)


![ALLSTEPS: Curriculum-driven Learning of Stepping Stone Skillsvan/papers/2020-allsteps/allsteps-arxiv-smal… · and pitch to lie in the intervals [rmin,rmax], [−ψmax,ψmax], and](https://img.pdfslide.us/doc/110x75/5f42a88e75edf16239485c15/allsteps-curriculum-driven-learning-of-stepping-stone-skills-vanpapers2020-allstepsallsteps-arxiv-smal.jpg)

![Neural Network Techniques [0.2cm] in Dependency Parsingclcl.unige.ch/slides_pour_Nivre/Geneva5.pdf · Neural Network Techniques I Empirical results have improved substantially since](https://img.pdfslide.us/doc/110x75/601efb94750b226b2f1dfc83/neural-network-techniques-02cm-in-dependency-neural-network-techniques-i-empirical.jpg)


![BonnCell [0.2cm] Automatic Layout of Leaf Cells](https://img.pdfslide.us/doc/110x75/58536bbf1a28abfa398ee5ad/bonncell-02cm-automatic-layout-of-leaf-cells.jpg)