Embed Size (px)
Citation preview
240
241
Envi
ro
nm
Enta
l a
nd
infr
ast
ru
ctu
rEs
En
gin
EEr
ing
Phd
Yea
rboo
k | 2
013
Chair:Prof. Fernando Sansò
DOCTORAL PROGRAM IN ENvIRONMENTAL AND INfRAsTRuCTuREs ENGINEERING
The Doctorate in Environmental and Infrastructure Engineering has been formed in the academic year 2008/2009 as a result of an effort of the previous departmental doctorates to merge their subjects in a culturally unified vision, where the environment is the common background.In this sense water, its physical behaviour in a natural and in a built context, is a primary constituent of the environment and it is therefore object of investigation of different groups of research looking at theoretical and numerical fluidynamic aspects, to the interaction water-solid earth, describing the flow of water in a natural catchment and projecting civil constructions to properly and sustainably exploit this fundamental resource.Next to this item is the study of the geological setting in which water flows and with which it interacts, including the creation and possible mitigation of hydrological risks.Indeed water is one of the basic vehicles through which pollution created by human activity is spread in nature and preserving its quality is one of the fundamental issues of environmental engineering. Not to be forgotten, the same problem has to be confronted with air and its quality, as well as with soil pollution due to solid pollutants, and solid waste management.One activity which is then interacting with such problems, is that of transportation infrastructures, construction and management, including traffic risks and regulation.Finally all the environmental problems treated are in fact seated on the surface of the earth or in its immediate surrounding, above and below. Such items as earth observation from different platforms, surveying and monitoring the earth surface by various sensors, are therefore just natural in the training of scientists for the environment.All that is reflected in the structure of the doctorate which is organized over 5 research areas, namely: Hydraulic engineering, Hydrology, hydraulic structures, water resources and coastal engineering, Environmental technologies, Transport infrastructures, Geomatics.Accordingly the PhD students first of all do follow a joint curriculum which is composed by a course supplied by the PhD School of Politecnico and deals with very general items, and then three specific courses tailored on the methods that have to be applied in all branches of our doctorate, namely “statistical analysis of environmental data”, which comprise the arguments of “Monte Carlo Markov Chain” methods and “Risk assessment”, and “numerical methods”.
Then each specific area has its own courses and seminars:
Hydraulic engineering ∙ Fluid mechanics ∙ Underground waters ∙ Thermofluidynamics
Hydrology, hydraulic structures, water resources and coastal engineering ∙ Hydro geostatistics ∙ Urban hydrology ∙ Hydrology of mountainous areas
Environmental technologies ∙ Environmental chemistry and biology ∙ Environmental monitoring lab ∙ Models and control of environmental systems ∙ Reactors for the Environment
Transport infrastructures ∙ Transportations mathematical models ∙ Road construction materials ∙ Experimental and Lab methods ∙ Structural safety and risk management ∙ Geological risks ∙ Urban infrastructures hydrogeology
Geomatics ∙ Positioning ∙ Advanced GIS ∙ Photogrammetry and Image Analysis ∙ Physical and spatial geodesy ∙ Data analysis and human sciences
Not to be mentioned seminars, conferences, congresses, workshops at specialistic and international level are normal constituents of the curriculum of our PhD students.
ADvIsORy BOARD
Nicolas Bernet - LBE – INRA – Narbonne Basil Psarianos - NTUA – National Technical University of Athens
Paolo Burlando - ETH – Zurigo Fabio Radicioni - Università di Perugia
Ismael Colomina - Istituto de Geomatica - Barcelona Paolo Ruffo - ENI
Athanasios Dermanis - Aristoteles University - Thessaloniki
Xavier Sanchez-Vila - Politechnical University of Catalonia – Barcelona
Roberto Fanelli - Istituto Mario Negri – Milano Eric Wood - Princeton University - USA
Renzo Gorini - SEA – Società Esercizi Aeroportuali - Milano
sChOLARshIP sPONsORsBreda Iterchimica Pibiviesse
CTG – Italcementi Leica Geosystems
GeneralStrade Metropolitana Milanese
DOCTORAL PROGRAM BOARD
Francesco Ballio Michele Giugliano Giuseppe Passoni
Riccardo Barzaghi Alberto Guadagnini Maria Cristina Rulli
Barbara Betti Enrico Larcan Fernando Sansò
Gianfranco Becciu Stefano Malavasi Sabrina Saponaro
Roberto Canziani Federica Migliaccio Laura Scesi
Maurizio Crispino Luigi Mussio Renato Vismara
Carlo De Michele Monica Papini
242
243
Envi
ro
nm
Enta
l a
nd
infr
ast
ru
ctu
rEs
En
gin
EEr
ing
Phd
Yea
rboo
k | 2
013structure and the mechanical
properties of the material. The experimental investigation carried out during this PhD in two full-scale WTE plants shows that the recovery of aluminium from the incineration residues increases proportionally to aluminium thickness in the tested materials. About 81% of the aluminium in the cans can be recovered from the bottom ash and then recycled as secondary aluminium, but this amount decreases to 51% when trays are considered, 27% for a mix of aluminium and poly-laminated foils and 47% for paper-laminated foils. Foils (Al thickness 10-42 μm) and trays (50 μm) are characterised by lower aluminium recovery yields if compared with beverage cans (90-250 μm), due to a stronger fragmentation on the combustion grate and thus the formation of smaller lumps that are lost within the fine fractions. These values also suggest that the paper used in the paper-laminated foil improves the mechanical strength of the aluminium foil. In the residual waste, aluminium can be present as packaging or as other materials (like pots etc). The amount of aluminium recoverable from the bottom ash is therefore influenced by the waste composition and, thus, by the efficiency of the separated collection applied upstream within the waste management system. Considering the typical composition of the unsorted waste in Northern Italy, only 26-37% of the Al fed to the furnace of the incineration plant can be recovered from the bottom ash. This corresponds to an amount of secondary aluminium potentially producible
equal to about 21-23% of the aluminium fed to the furnace. These values refer to a situation where most of the aluminium in the residual waste concentrates in the fine fraction of the bottom ash (< 1 mm) and cannot be recovered, since it consists mainly of flexible packaging like the foil. Where the separated collection of waste is less efficient, like in other Italian regions, the amount of aluminium in the residual waste can be higher and also its composition can be different, with a prevailing presence of rigid packaging materials. This may result in a greater amount of aluminium potentially recoverable from the ash.
Aluminium recovery from the ash is particularly difficult when the lumps produced during the combustion process are smaller than 5 mm. In fact, standard eddy current separators (ECS) show an average recovery rate of 30%, which drops from almost 100% for particles larger than 20 mm to virtually zero for particle size between 5 and 12 mm, depending on the number of screening steps and on the plant layout and complexity. To reach higher recovery rate it is necessary to adopt advanced systems such as wet ECS, magnetic separator and backward operating ECS, included within advanced bottom ash treatment plants comprising several stages of sieving and crushing. The analysis of the bottom ash < 4 mm sampled in a Swedish WTE bottom ash treatment plant showed that only 3% of the total aluminium in the ash, corresponding to about 21% of the metallic aluminium, can be
potentially recovered from the ash and recycled as secondary aluminium, also when advanced technologies are adopted. Despite the modest amount of aluminium in the fine fraction, improving metal recovery from such a fraction, by including a grinding stage and advanced ECS in the plant layout, is economical advantageous. In fact, aluminium recovery yield can increase by about 200% with a direct advantage of about 2 Euros per ton of treated bottom ash.
Based on the recovery efficiency previously reported, a forecasting model was developed, aimed at evaluating the amount of aluminium scraps potentially recoverable in Italy in the years 2015 and 2020. The results show that about 16,300-24,900 tonnes of aluminium might be recovered in 2015 and this amount will increase at 19,300-34,600 tonnes in 2020. This corresponds to an amount of secondary aluminium potentially producible included between 11,300-17,300 tonnes in 2015 and 13,400-24,000 tonnes in 2020. Considering that the bottom ash treatment plants currently installed in Italy have a capacity less than half of what will be needed in the future, a good opportunity of development is present in our country.
ALuMINIuM RECOvERy fROM MsWI BOTTOM Ash
About 4,600,000 tonnes of municipal waste have been incinerated in Italy in 2009, with the production of about 1,200,000 tonnes of bottom ash. The growing cost of landfilling and the need for reducing the exploitation of natural resources have promoted in the last few years in Europe a fervent research activity on bottom ash treatments aimed at the recovery of metals and at the reuse of the inert fraction, essentially in the cement and concrete industry, as well as in road construction.These considered treatments are physical, chemical or thermal ones, such as: ∙ Physical separation of the fine (more polluted) fraction with screens or drums;
∙ Extraction of metals through magnetic and eddy current separators;
∙ Washing with water or chemical solvents to remove soluble heavy metals and salts;
∙ Ageing process to promote the transformation of bottom ash constituents into more thermodynamically stable forms;
∙ Addition of Al (III) or Fe (III) salts and cements or other bonding agents to reduce the metal mobility through leaching;
∙ Vitrification or sintering to immobilize heavy metals into an amorphous glassy phase.
Whatever treatment is used, the
recovery of ferrous and non-ferrous metals is an essential step, for both the environmental advantage of metal scraps recycling and the reduction of the negative effects that metals have in some applications including road construction and concrete production. Furthermore, the sale of metal scraps represents a significant source of income for bottom ash treatment plants.Despite metals recovery is a common practice, the correct design of the treatment plant is a hard task, since it requires to know how much aluminium is in the ash and what are its main characteristics, in terms of dimensional classification of the lumps and of their quality, expressed by the oxidation level and the presence of other non-ferrous metals.
During the work for this PhD, three areas regarding aluminium recovery from the bottom ash were explored:The aluminium behaviour in waste-to-energy furnaces. Aluminium mass balance in waste-to-energy plants was experimentally investigated, allowing to estimate the actual amount of aluminium present in the bottom ash in the metallic form, i.e. its recoverable form;The recovery of aluminium from the bottom ash fine fraction (< 5 mm);
The perspective for aluminium recovery from bottom ash in Italy in the next 10-20 years.
The estimation of the aluminium mass balance in the furnace of waste-to-energy plants and of its partitioning in the residues of the combustion process is fundamental to assess the actual amount of aluminium that can be recovered from the bottom ash. In fact, current technologies are able to recover only the aluminium fragments bigger than 1 mm. In addition, during the combustion process, the scraps contained in the waste undergo degradation and oxidation processes that determine a loss of their recoverable mass from the bottom ash. Thus, the knowledge of the oxidation level of the aluminium in the combustion residues is another necessary information, currently not well known. According to the CEN standard on energy recovery (EN 13431:2004), thin gauge aluminium foil (up to 50 µm thick) shall be considered recoverable in the form of energy, meaning that it is subjected to full oxidation. However, detailed quantitative experimental estimates are not available. The extent of the fragmentation and oxidation processes that take place during combustion is strictly related to the
Laura Biganzoli - Supervisor: Mario Grosso
244
245
Envi
ro
nm
Enta
l a
nd
infr
ast
ru
ctu
rEs
En
gin
EEr
ing
Phd
Yea
rboo
k | 2
013of additives was carried out
considering two methods of compaction. The type of modification is extremely important since the behavior of the final product (the modified bitumen) must justify the higher performance and the economical investment. In simple words, dosage and modifying procedure must be calibrated depending on the specific situation hence the nature of additive and the modification plan. This part includes also a discussion on the volumetric parameters traditionally associated to the compacted specimens in accordance to the SUPERPAVE mix design protocol. Considering compacted specimens, the volume occupied by each element was measured, trying to understand the compaction grade as well to the dispersion of additives. In particular the dispersion among aggregates and the interaction with the bitumen matrix were fundamental to define volumes of compacted specimens. Finally a deep evaluation of mixture volumetric was required in order to satisfy the mechanical requirements expected from a modified bitumen. In particular air voids content, percentage of binder and volume fraction of additive were chosen as key parameters for reaching such aim. The third part focused on the stiffness of asphalt concrete in order to estimate both the load-induced and thermal stress distribution in asphalt pavements. The determination of such parameter may include troubles both in theoretical than practical sense. The evaluation of mechanical parameters, even the most used as stiffness
modulus |E*|, must be carefully computed in accordance to precise conditions of load and temperature. This part includes the results from two of most used parameters in flexible pavements design: Indirect Tensile Strength (ITS) and Dynamic Stiffness Modulus |E*|. Indirect Tensile Stiffness Test (ITST) and Four Point Bending Test (4-PBT) were conducted on twelve asphalt mixtures for binder layers at several condition of temperature and frequencies. Master curves of Stiffness were then extrapolated from experimental data using two theoretical models from literature. Finally data of ITS was compared in order to deepen the dependence of modified asphalt on additives dosage and type. The fourth part deepened the fatigue resistance of asphalt mixtures in comparison with conventional asphalt mixtures. Fatigue testing were performed with indirect tensile test apparatus under controlled stress mode of loading (ITFT) and four point bending equipment under controlled strain mode (4-PBFT). In addition a comparing analysis of the fatigue resistance within different methods was carried on. Fatigue life was defined using the classical approach when the number of cycles reaches the double of initial deformation (number of cycle to failure N
f). It has also been defined in terms of different methods based on dissipated energy: total dissipated energy (WTOT), ratio of dissipated energy change (RDEC) and plateau value (PV). Finally, this part offers an analysis of different methods in evaluation of the fatigue resistance of
modified asphalt concretes.The fifth and last part examines the evolution of rutting (permanent deformation) on modified asphalt mixtures. Rutting tests were performed by the mean of a wheel tracking device (WTD) with a moving rubbed wheel. All mixtures were tested at 30 °C and 60 °C under a fixed loading frequency. Results were defined as the rut depth at ten thousand passes and slope of rut-cycle curve in accordance to the European Standards. An analyses based on a new approach for adapting the existing model from the U.S. project NCHRP 1-37A was also proposed. Obtained results from rutting tests were used for calibrating the predicting models from M-EPDG Guide 2002. In particular regression coefficients were fitted using a non linear regression analysis based on experimental data. Elastic deformations were computed assuming a simplified bi-layered homogeneous-isotropic-elastic system to represent the asphalt slab in the metal mould of the WTD. The goodness of calibration was expressed in terms of minimized Summed square error (SSE) and correlation index R2 between measured and experimental data.
INCREAsING PERfORMANCE Of AsPhALT CONCRETE usING fIBERs AND POLyMERs
The most commonly used pavement type in the world is hot-mix asphalt (HMA), which is typically characterized by its mix design and production method. HMA can be classified according to aggregate gradation, binder type, and binder modification. In particular binder grade and chemical behavior are fundamental in design flexible pavements. In road engineering there are several engineering properties of bituminous materials that are of interest. Some of the most used are: fatigue resistance, rutting resistance, dynamic stiffness and rheological behavior. In this sense asphalt modification is widely used in road infrastructure to reduce fatigue cracking and rutting phenomena. The best known form of binder improvement is by means of polymer modification therefore also fibers of some types are often added to the asphalt mixtures. The effects on bitumen are dependent of the modifier even if the general improvements include: changes in the viscoelasticity of binder, increases dynamic modulus, reduce moisture susceptibility, rutting resistance, freeze-thaw and fatigue resistance. It is generally known that viscoelastic properties of bitumen changes on temperature and frequency (of load) so obtainable results
may varies in a very wide domain of values. Since most of the bitumens are physically, chemically and mechanically different, the easiest way to characterized such heterogeneous material is by means of standard parameters. In this sense worldwide standards include a series of methods to obtain mechanical parameters from theoretical models but a wide panorama of possible situations may occur when design a pavement containing bitumen. The present dissertation deepens the nature and the behavior of modified bitumens in respect to five main parts. The first part deepens the most basic distinction and similarities among the rheological properties of polymer-modified bitumens (PMBs) and fiber-modified bitumens (FMBs). The analysis includes a wide overview of the traditional requirements for road bitumens in terms of laboratory results. Dynamic shear rheometer (DSR), steady shear viscometer and classic road tests on bitumens were carried out. Several combinations of pure bitumens, ethyl-vinyl-acetate (EVA) and different types of fibers were used to produce modified bitumens. In this sense a standard mixing protocol was developed using a traditional rotational mixer. Classical tests included penetration and
Ring&Ball. On the other hand rotational viscometer and DSR were adopted for studying the rheology of binders over a wide range of conditions. The core of the analysis focuses on the rheological behavior especially on linear viscoelastic behavior, as measured by the frequency dependent storage G’, and loss moduli G’’, on the viscosity h, and on the flow curves. In these terms, the behavior FMBs and PMBs were investigated in order to establish the role of polymer inside the bituminous suspension and the effect of fibers as additive. Experimental results from PMBs were elaborated using the theories of suspension and colloids in order to extract the behavior of the polymer inside the bitumen at various dosages. Finally an electronic microscope was used to take some pictures of the distribution of particles of polymer inside the bitumen. Images were compared to analytical results in the hope of validating the numerical results. The second part concerns the characterization of modified asphalt concrete through compaction and volumetric parameters from Shear Gyratory Compactor (SGC) and Roller Compactor. Starting from the optimum design blend of aggregate and the optimum dosage of bitumen a wide evaluation on the influence
Claudio Brovelli - Supervisors: M. Crispino, P.A.A. Pereira
246
247
Envi
ro
nm
Enta
l a
nd
infr
ast
ru
ctu
rEs
En
gin
EEr
ing
Phd
Yea
rboo
k | 2
013
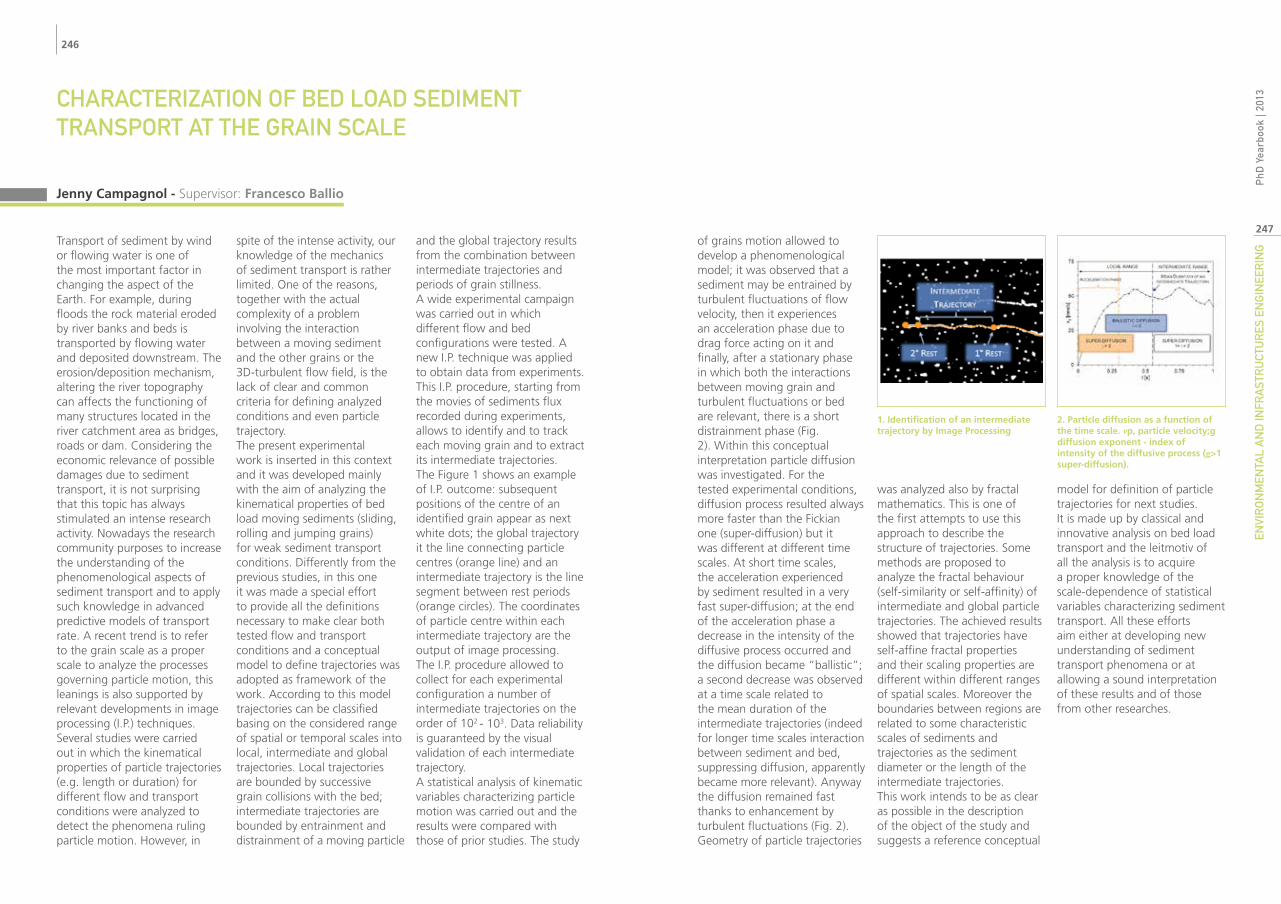
of grains motion allowed to develop a phenomenological model; it was observed that a sediment may be entrained by turbulent fluctuations of flow velocity, then it experiences an acceleration phase due to drag force acting on it and finally, after a stationary phase in which both the interactions between moving grain and turbulent fluctuations or bed are relevant, there is a short distrainment phase (Fig. 2). Within this conceptual interpretation particle diffusion was investigated. For the tested experimental conditions, diffusion process resulted always more faster than the Fickian one (super-diffusion) but it was different at different time scales. At short time scales, the acceleration experienced by sediment resulted in a very fast super-diffusion; at the end of the acceleration phase a decrease in the intensity of the diffusive process occurred and the diffusion became “ballistic”; a second decrease was observed at a time scale related to the mean duration of the intermediate trajectories (indeed for longer time scales interaction between sediment and bed, suppressing diffusion, apparently became more relevant). Anyway the diffusion remained fast thanks to enhancement by turbulent fluctuations (Fig. 2).Geometry of particle trajectories
was analyzed also by fractal mathematics. This is one of the first attempts to use this approach to describe the structure of trajectories. Some methods are proposed to analyze the fractal behaviour (self-similarity or self-affinity) of intermediate and global particle trajectories. The achieved results showed that trajectories have self-affine fractal properties and their scaling properties are different within different ranges of spatial scales. Moreover the boundaries between regions are related to some characteristic scales of sediments and trajectories as the sediment diameter or the length of the intermediate trajectories.This work intends to be as clear as possible in the description of the object of the study and suggests a reference conceptual
model for definition of particle trajectories for next studies. It is made up by classical and innovative analysis on bed load transport and the leitmotiv of all the analysis is to acquire a proper knowledge of the scale-dependence of statistical variables characterizing sediment transport. All these efforts aim either at developing new understanding of sediment transport phenomena or at allowing a sound interpretation of these results and of those from other researches.
ChARACTERIzATION Of BED LOAD sEDIMENT TRANsPORT AT ThE GRAIN sCALE
Transport of sediment by wind or flowing water is one of the most important factor in changing the aspect of the Earth. For example, during floods the rock material eroded by river banks and beds is transported by flowing water and deposited downstream. The erosion/deposition mechanism, altering the river topography can affects the functioning of many structures located in the river catchment area as bridges, roads or dam. Considering the economic relevance of possible damages due to sediment transport, it is not surprising that this topic has always stimulated an intense research activity. Nowadays the research community purposes to increase the understanding of the phenomenological aspects of sediment transport and to apply such knowledge in advanced predictive models of transport rate. A recent trend is to refer to the grain scale as a proper scale to analyze the processes governing particle motion, this leanings is also supported by relevant developments in image processing (I.P.) techniques. Several studies were carried out in which the kinematical properties of particle trajectories (e.g. length or duration) for different flow and transport conditions were analyzed to detect the phenomena ruling particle motion. However, in
spite of the intense activity, our knowledge of the mechanics of sediment transport is rather limited. One of the reasons, together with the actual complexity of a problem involving the interaction between a moving sediment and the other grains or the 3D-turbulent flow field, is the lack of clear and common criteria for defining analyzed conditions and even particle trajectory.The present experimental work is inserted in this context and it was developed mainly with the aim of analyzing the kinematical properties of bed load moving sediments (sliding, rolling and jumping grains) for weak sediment transport conditions. Differently from the previous studies, in this one it was made a special effort to provide all the definitions necessary to make clear both tested flow and transport conditions and a conceptual model to define trajectories was adopted as framework of the work. According to this model trajectories can be classified basing on the considered range of spatial or temporal scales into local, intermediate and global trajectories. Local trajectories are bounded by successive grain collisions with the bed; intermediate trajectories are bounded by entrainment and distrainment of a moving particle
and the global trajectory results from the combination between intermediate trajectories and periods of grain stillness.A wide experimental campaign was carried out in which different flow and bed configurations were tested. A new I.P. technique was applied to obtain data from experiments. This I.P. procedure, starting from the movies of sediments flux recorded during experiments, allows to identify and to track each moving grain and to extract its intermediate trajectories. The Figure 1 shows an example of I.P. outcome: subsequent positions of the centre of an identified grain appear as next white dots; the global trajectory it the line connecting particle centres (orange line) and an intermediate trajectory is the line segment between rest periods (orange circles). The coordinates of particle centre within each intermediate trajectory are the output of image processing. The I.P. procedure allowed to collect for each experimental configuration a number of intermediate trajectories on the order of 102 - 103. Data reliability is guaranteed by the visual validation of each intermediate trajectory.A statistical analysis of kinematic variables characterizing particle motion was carried out and the results were compared with those of prior studies. The study
Jenny Campagnol - Supervisor: Francesco Ballio
1. Identification of an intermediate trajectory by Image Processing
2. Particle diffusion as a function of the time scale. vp, particle velocity;g diffusion exponent - index of intensity of the diffusive process (g>1 super-diffusion).
248
249
Envi
ro
nm
Enta
l a
nd
infr
ast
ru
ctu
rEs
En
gin
EEr
ing
Phd
Yea
rboo
k | 2
013
illustrated and discussed.The solution of the upscaled model is presented and a quantitative analysis of the effects of various simplification strategies in the context of a simple illustrative example is provided. The latter involves solute transport within a plane channel characterized by a uniform aperture under steady-state flow conditions. While this simplified geometry is not fully representative of complex porous media structures, it enables one to clearly show the way pore scale features propagate to DRMT/MRMT models. We provide an assessment of the influence of all the terms included in the our upscaled two-equation model. Our results show that a DRMT model can reproduce the solution of our upscaled model with a reasonable accuracy for the scenario analyzed, provided that advection is retained also in the immobile region.Our results and observations may provide a useful basis to (a) interpret studies of uncertainty propagation, inverse modeling and parameter estimation related to DRMT and MRMT models, and/or (b) assess the key elements underpinning the potential/ability of DRMT/MRMT models to interpret upscaled results stemming from pore scale transport simulation or laboratory experiments and exhibiting non-Fickian behavior.
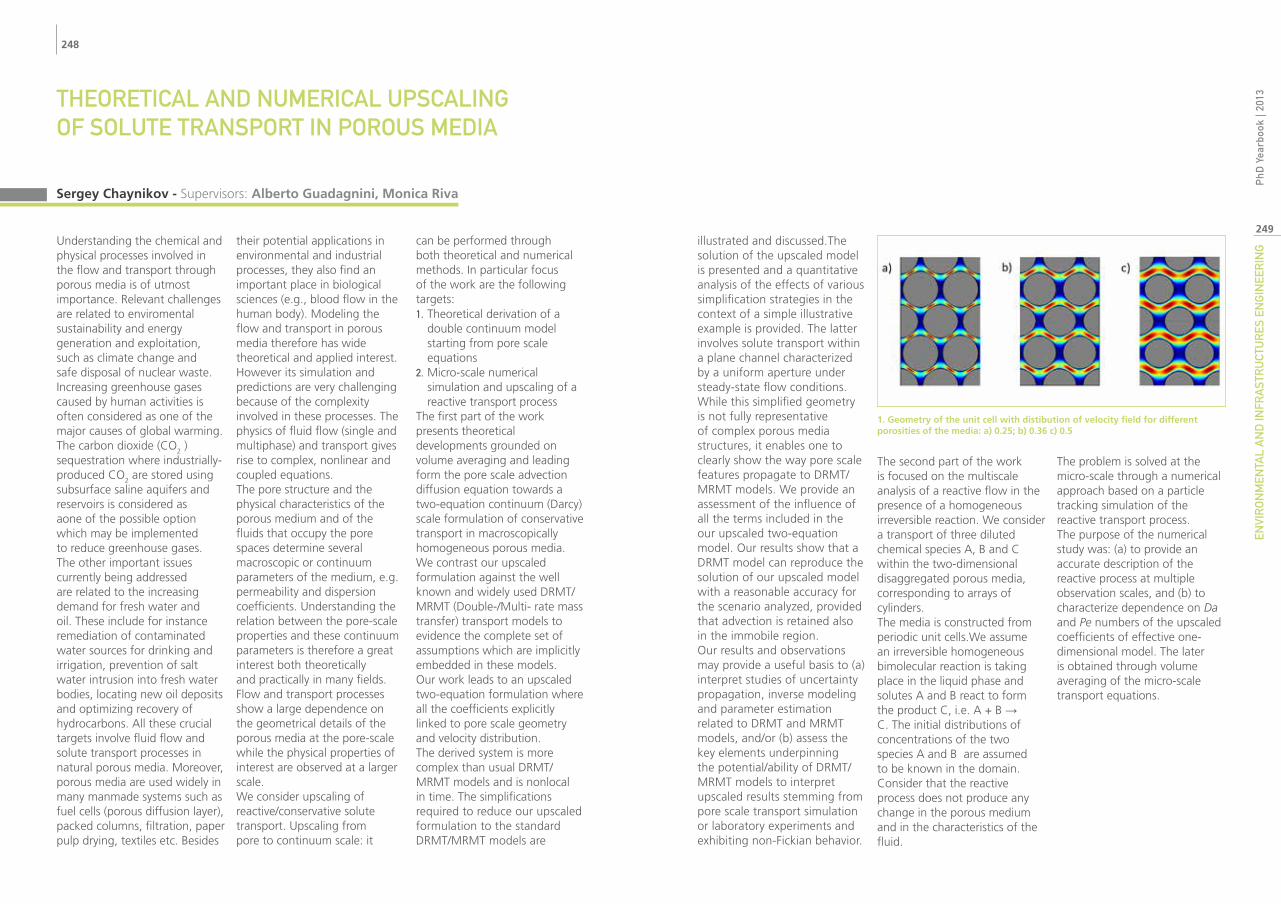
The second part of the work is focused on the multiscale analysis of a reactive flow in the presence of a homogeneous irreversible reaction. We consider a transport of three diluted chemical species A, B and C within the two-dimensional disaggregated porous media, corresponding to arrays of cylinders.The media is constructed from periodic unit cells.We assume an irreversible homogeneous bimolecular reaction is taking place in the liquid phase and solutes A and B react to form the product C, i.e. A + B → C. The initial distributions of concentrations of the two species A and B are assumed to be known in the domain. Consider that the reactive process does not produce any change in the porous medium and in the characteristics of the fluid.
The problem is solved at the micro-scale through a numerical approach based on a particle tracking simulation of the reactive transport process. The purpose of the numerical study was: (a) to provide an accurate description of the reactive process at multiple observation scales, and (b) to characterize dependence on Da and Pe numbers of the upscaled coefficients of effective one-dimensional model. The later is obtained through volume averaging of the micro-scale transport equations.
ThEORETICAL AND NuMERICAL uPsCALING Of sOLuTE TRANsPORT IN POROus MEDIA
Understanding the chemical and physical processes involved in the flow and transport through porous media is of utmost importance. Relevant challenges are related to enviromental sustainability and energy generation and exploitation, such as climate change and safe disposal of nuclear waste. Increasing greenhouse gases caused by human activities is often considered as one of the major causes of global warming. The carbon dioxide (CO2 ) sequestration where industrially-produced CO2 are stored using subsurface saline aquifers and reservoirs is considered as aone of the possible option which may be implemented to reduce greenhouse gases. The other important issues currently being addressed are related to the increasing demand for fresh water and oil. These include for instance remediation of contaminated water sources for drinking and irrigation, prevention of salt water intrusion into fresh water bodies, locating new oil deposits and optimizing recovery of hydrocarbons. All these crucial targets involve fluid flow and solute transport processes in natural porous media. Moreover, porous media are used widely in many manmade systems such as fuel cells (porous diffusion layer), packed columns, filtration, paper pulp drying, textiles etc. Besides
their potential applications in environmental and industrial processes, they also find an important place in biological sciences (e.g., blood flow in the human body). Modeling the flow and transport in porous media therefore has wide theoretical and applied interest. However its simulation and predictions are very challenging because of the complexity involved in these processes. The physics of fluid flow (single and multiphase) and transport gives rise to complex, nonlinear and coupled equations. The pore structure and the physical characteristics of the porous medium and of the fluids that occupy the pore spaces determine several macroscopic or continuum parameters of the medium, e.g. permeability and dispersion coefficients. Understanding the relation between the pore-scale properties and these continuum parameters is therefore a great interest both theoretically and practically in many fields. Flow and transport processes show a large dependence on the geometrical details of the porous media at the pore-scale while the physical properties of interest are observed at a larger scale. We consider upscaling of reactive/conservative solute transport. Upscaling from pore to continuum scale: it
can be performed through both theoretical and numerical methods. In particular focus of the work are the following targets:1. Theoretical derivation of a
double continuum model starting from pore scale equations
2. Micro-scale numerical simulation and upscaling of a reactive transport process
The first part of the work presents theoretical developments grounded on volume averaging and leading form the pore scale advection diffusion equation towards a two-equation continuum (Darcy) scale formulation of conservative transport in macroscopically homogeneous porous media. We contrast our upscaled formulation against the well known and widely used DRMT/MRMT (Double-/Multi- rate mass transfer) transport models to evidence the complete set of assumptions which are implicitly embedded in these models. Our work leads to an upscaled two-equation formulation where all the coefficients explicitly linked to pore scale geometry and velocity distribution. The derived system is more complex than usual DRMT/MRMT models and is nonlocal in time. The simplifications required to reduce our upscaled formulation to the standard DRMT/MRMT models are
Sergey Chaynikov - Supervisors: Alberto Guadagnini, Monica Riva
1. Geometry of the unit cell with distibution of velocity field for different porosities of the media: a) 0.25; b) 0.36 c) 0.5
250
251
Envi
ro
nm
Enta
l a
nd
infr
ast
ru
ctu
rEs
En
gin
EEr
ing
Phd
Yea
rboo
k | 2
013subject to some constraints.
The non-standard use of the simplex method consists in defining constraints on model covariance function in order to obtain the best fit on the correspondent empirical ones. Further constraints are applied so to have coherence with model degree variances to prevent possible solutions without physical meaning. The chosen objective function to be minimized consists in the sum of the degree variances adapted satisfying all the constraints defined. This is an iterative procedure where for each iteration constraints are strengthened until the best possible fit between model and empirical functions is reached. The results obtained during the test phase of this new methodology of modeling covariance function for local applications show great improvements respect to the software packages available until now.Covariance functions also give an indication on the correlation length of data. This is another important aspect that was introduced in the new implemented LSC program. In fact for each computation point there is a down sampling process such as only observation points with significant correlation contribute to the prediction process. The amplitude of the data cap around each point depends on the correlation lengths highlighted by the modeled covariance functions. In this way, the LSC estimation procedure is speed up because only significantly correlated data are used in the computations. This “windowed solution” allow to combine a great number
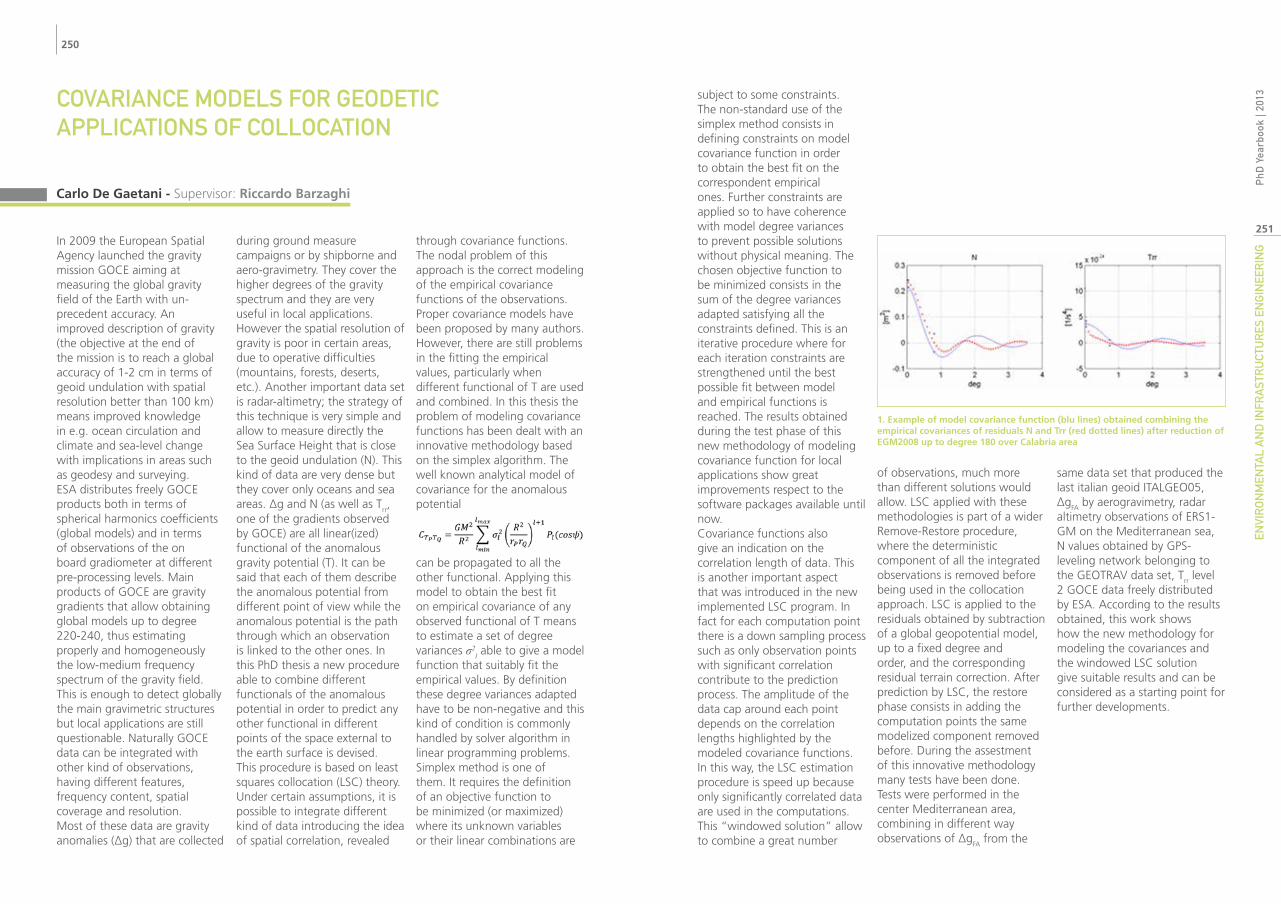
of observations, much more than different solutions would allow. LSC applied with these methodologies is part of a wider Remove-Restore procedure, where the deterministic component of all the integrated observations is removed before being used in the collocation approach. LSC is applied to the residuals obtained by subtraction of a global geopotential model, up to a fixed degree and order, and the corresponding residual terrain correction. After prediction by LSC, the restore phase consists in adding the computation points the same modelized component removed before. During the assestment of this innovative methodology many tests have been done. Tests were performed in the center Mediterranean area, combining in different way observations of ∆g
FA from the
same data set that produced the last italian geoid ITALGEO05, ∆gFA by aerogravimetry, radar altimetry observations of ERS1-GM on the Mediterranean sea, N values obtained by GPS-leveling network belonging to the GEOTRAV data set, Trr level 2 GOCE data freely distributed by ESA. According to the results obtained, this work shows how the new methodology for modeling the covariances and the windowed LSC solution give suitable results and can be considered as a starting point for further developments.
COvARIANCE MODELs fOR GEODETIC APPLICATIONs Of COLLOCATION
In 2009 the European Spatial Agency launched the gravity mission GOCE aiming at measuring the global gravity field of the Earth with un-precedent accuracy. An improved description of gravity (the objective at the end of the mission is to reach a global accuracy of 1-2 cm in terms of geoid undulation with spatial resolution better than 100 km) means improved knowledge in e.g. ocean circulation and climate and sea-level change with implications in areas such as geodesy and surveying. ESA distributes freely GOCE products both in terms of spherical harmonics coefficients (global models) and in terms of observations of the on board gradiometer at different pre-processing levels. Main products of GOCE are gravity gradients that allow obtaining global models up to degree 220-240, thus estimating properly and homogeneously the low-medium frequency spectrum of the gravity field. This is enough to detect globally the main gravimetric structures but local applications are still questionable. Naturally GOCE data can be integrated with other kind of observations, having different features, frequency content, spatial coverage and resolution. Most of these data are gravity anomalies (∆g) that are collected
during ground measure campaigns or by shipborne and aero-gravimetry. They cover the higher degrees of the gravity spectrum and they are very useful in local applications. However the spatial resolution of gravity is poor in certain areas, due to operative difficulties (mountains, forests, deserts, etc.). Another important data set is radar-altimetry; the strategy of this technique is very simple and allow to measure directly the Sea Surface Height that is close to the geoid undulation (N). This kind of data are very dense but they cover only oceans and sea areas. ∆g and N (as well as T
rr, one of the gradients observed by GOCE) are all linear(ized) functional of the anomalous gravity potential (T). It can be said that each of them describe the anomalous potential from different point of view while the anomalous potential is the path through which an observation is linked to the other ones. In this PhD thesis a new procedure able to combine different functionals of the anomalous potential in order to predict any other functional in different points of the space external to the earth surface is devised. This procedure is based on least squares collocation (LSC) theory. Under certain assumptions, it is possible to integrate different kind of data introducing the idea of spatial correlation, revealed
through covariance functions. The nodal problem of this approach is the correct modeling of the empirical covariance functions of the observations. Proper covariance models have been proposed by many authors. However, there are still problems in the fitting the empirical values, particularly when different functional of T are used and combined. In this thesis the problem of modeling covariance functions has been dealt with an innovative methodology based on the simplex algorithm. The well known analytical model of covariance for the anomalous potential
can be propagated to all the other functional. Applying this model to obtain the best fit on empirical covariance of any observed functional of T means to estimate a set of degree variances σ2
l able to give a model function that suitably fit the empirical values. By definition these degree variances adapted have to be non-negative and this kind of condition is commonly handled by solver algorithm in linear programming problems. Simplex method is one of them. It requires the definition of an objective function to be minimized (or maximized) where its unknown variables or their linear combinations are
Carlo De Gaetani - Supervisor: Riccardo Barzaghi
1. Example of model covariance function (blu lines) obtained combining the empirical covariances of residuals N and Trr (red dotted lines) after reduction of EGM2008 up to degree 180 over Calabria area
252
253
Envi
ro
nm
Enta
l a
nd
infr
ast
ru
ctu
rEs
En
gin
EEr
ing
Phd
Yea
rboo
k | 2
013analysing the topological
relations of each object with the others and their internal relations.A routine called “spatial cutting” has been created in order to select only the data to be analysed. Data have a dynamic nature which is
defined by two attributes: the existence date and the analysis date. This solution is able to represent discrete states; the representation of a continuous process should be modelled with form descriptors, which are definitely more complex (and not applied in this context). Finally, two significant case studies have been analysed to test the performance of the implemented system: the historical town of Montepulciano (SI) and the Mušutište church (Kosovo). The choice of these experimental examples has some crucial reasons. Montepulciano shows a particular topography, with a considerably variable altitude and a high building density. The Mušutište church is a religious and historical building which was destroyed approximately ten years ago, whose reconstruction represents an important step for remembering and forgetting at
once the history of a political and religious conflict. Data have been collected in cooperation with other researchers and professors. In the case studies analysed, no particular problems have emerged with regards to the hypotheses presented throughout the research.
The final part of the research focuses on some open questions which have not yet been solved, with a view to possible future developments: faces partially overlapping other faces; bodies’ walls and façades (if defined only by base and roof); line nodes (230 possible cases have been identified); aerial and subterranean lines whose projection on the ground level
crosses its lines and areas; other objects defined by their features. In the future, it would be interesting to conduct a study on a smaller scale, district – based example, so that the physical dimensions of entities are closer to the conventional cartographic symbols. Finally, it must be noted
that the current commercial programs are only able to manage 2D entities, while nowadays objects are mostly 3D. By using these concepts and many support tools it is possible to describe, memorise, update and manage 3D spatial information.
3D OBjECT MODELLING AND RECONsTRuCTION Of TOPOLOGIEs AND BOuNDARIEs
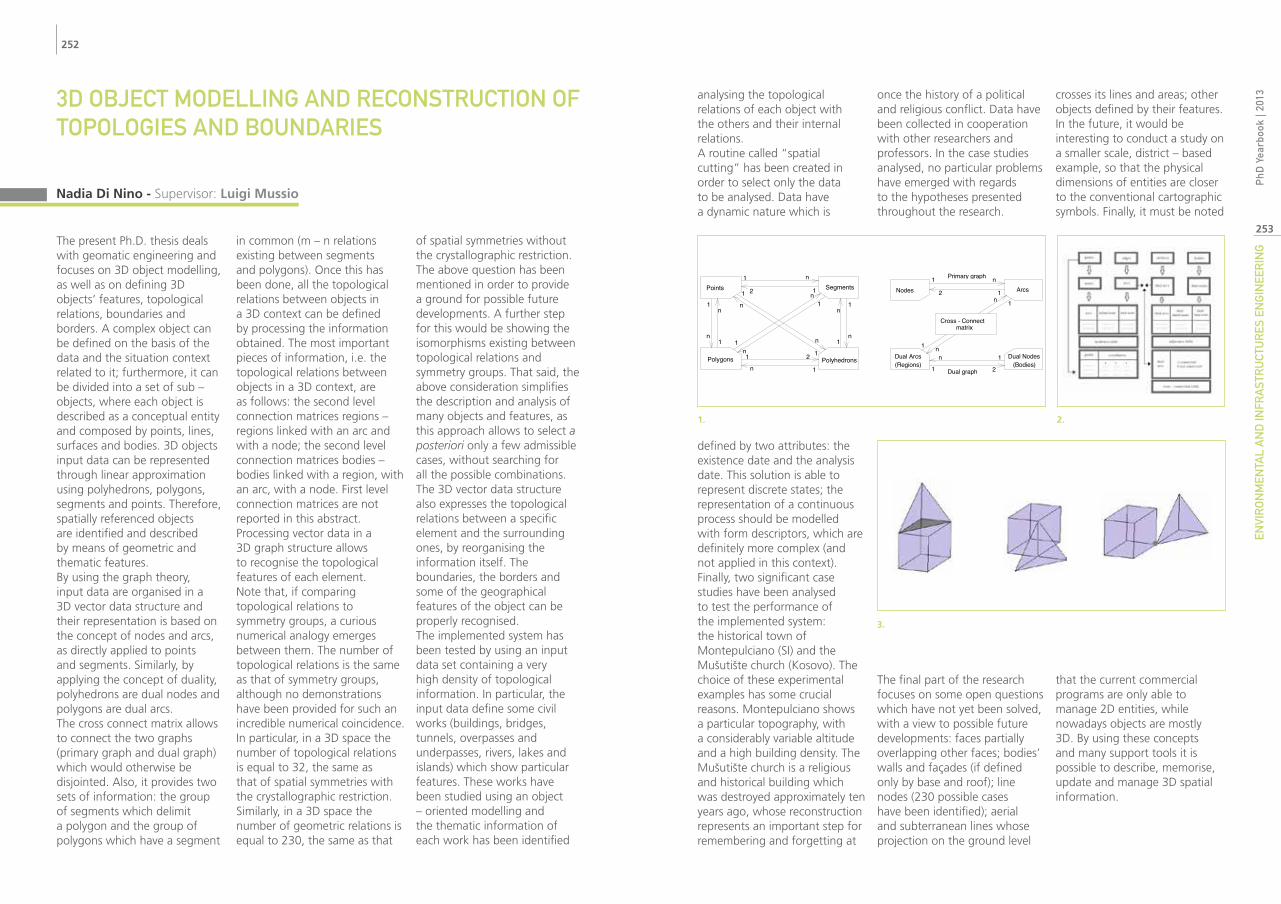
The present Ph.D. thesis deals with geomatic engineering and focuses on 3D object modelling, as well as on defining 3D objects’ features, topological relations, boundaries and borders. A complex object can be defined on the basis of the data and the situation context related to it; furthermore, it can be divided into a set of sub – objects, where each object is described as a conceptual entity and composed by points, lines, surfaces and bodies. 3D objects input data can be represented through linear approximation using polyhedrons, polygons, segments and points. Therefore, spatially referenced objects are identified and described by means of geometric and thematic features. By using the graph theory, input data are organised in a 3D vector data structure and their representation is based on the concept of nodes and arcs, as directly applied to points and segments. Similarly, by applying the concept of duality, polyhedrons are dual nodes and polygons are dual arcs.The cross connect matrix allows to connect the two graphs (primary graph and dual graph) which would otherwise be disjointed. Also, it provides two sets of information: the group of segments which delimit a polygon and the group of polygons which have a segment
in common (m – n relations existing between segments and polygons). Once this has been done, all the topological relations between objects in a 3D context can be defined by processing the information obtained. The most important pieces of information, i.e. the topological relations between objects in a 3D context, are as follows: the second level connection matrices regions – regions linked with an arc and with a node; the second level connection matrices bodies – bodies linked with a region, with an arc, with a node. First level connection matrices are not reported in this abstract.Processing vector data in a 3D graph structure allows to recognise the topological features of each element.Note that, if comparing topological relations to symmetry groups, a curious numerical analogy emerges between them. The number of topological relations is the same as that of symmetry groups, although no demonstrations have been provided for such an incredible numerical coincidence. In particular, in a 3D space the number of topological relations is equal to 32, the same as that of spatial symmetries with the crystallographic restriction. Similarly, in a 3D space the number of geometric relations is equal to 230, the same as that
of spatial symmetries without the crystallographic restriction. The above question has been mentioned in order to provide a ground for possible future developments. A further step for this would be showing the isomorphisms existing between topological relations and symmetry groups. That said, the above consideration simplifies the description and analysis of many objects and features, as this approach allows to select a posteriori only a few admissible cases, without searching for all the possible combinations. The 3D vector data structure also expresses the topological relations between a specific element and the surrounding ones, by reorganising the information itself. The boundaries, the borders and some of the geographical features of the object can be properly recognised. The implemented system has been tested by using an input data set containing a very high density of topological information. In particular, the input data define some civil works (buildings, bridges, tunnels, overpasses and underpasses, rivers, lakes and islands) which show particular features. These works have been studied using an object – oriented modelling and the thematic information of each work has been identified
Nadia Di Nino - Supervisor: Luigi Mussio
Points Segments
PolyhedronsPolygons
1 n
1n
21
2 1
1
n
n
1
1
n
n
1
n
1
1
n
1
n
n
1
Nodes Arcs
Dual Arcs
1 n
1 2
n 1
2 1n
1
1
n
Primary graph
Dual graph
Cross - Connectmatrix
Dual Nodes(Bodies)(Regions)
1.
3.
2.
254
255
Envi
ro
nm
Enta
l a
nd
infr
ast
ru
ctu
rEs
En
gin
EEr
ing
Phd
Yea
rboo
k | 2
013
project manager will be able to identify hidden stakeholders, meet them starting from the early stage of the project, and manage their expectations all project long. This will cause requests for changes coming from emerging stakeholders in advanced stages of projects (mainly committees of citizens and shopkeepers not identified at the beginning) to decrease, saving a huge amount of public money. We have also analysed the Communication Management, which is fundamental for the success of such projects, underlining that the early involvement of all stakeholders in the decision making process is a key issue to avoid changes in the late stages of the execution phase in urban projects, in particular referring to citizens and associations. In complex projects the importance of communications is crucial, and should be delegated to a professional, part of the project management team, who will be responsible to define both the strategic and the tactical level (day by day) of communication management. This will help in the stakeholder expectation management, decreasing disputes and, as a consequence, the number of requests for changes in advanced stages of the project, and so saving a huge amount of public money,
as mentioned before.Finally we analysed Risk and Contract Management, pointing out that the risks related to technology maturity and life-cycle maintenance should be completely transferred to the contractor, otherwise very significant extra-costs could emerge in the execution phase. This means that the contract between the buyer of the system and the seller must contain a clause that involves defined costs not only for construction, but for maintenance, too, for the whole operational life-cycle of the system. Moreover, we want to point out that the risk related to technology maturity is worth the cost of the project itself, because if the technology used in the system is owned only by the seller and it is not a standard, the bankruptcy of this subject would cause the system to stop operating: what would happen if a seller of innovative guided bus go out of business after the putting into service of such a system? Nobody else could provide spare parts, or (and this would be the best case) a new subject could take over the firm of the seller. This would cause all maintenance contracts to be renegotiated in favour of the new party, because the buyer would have no choice than accepting the conditions imposed by the new party, otherwise
the system would go out of service. If applied, our advices can significantly contribute to reduce the complexity of urban transportation projects and environment, helping to take decisions during project execution when new problems emerge, and concur to the overall success of projects.The result which comes out from this thesis is a new approach to large transportation projects management. We outlined a new paradigm for project management, whose traditional project management, also called linear or Newtonian, is a subset. The second level of project management allows to manage large projects when complexity is at an high level and the classic project management doesn’t provide effective methods and tools. In addition, we defined 4 practical proposal enabling project managers of such kind of projects to improve the overall project performance. Being executive, we had the opportunity to test the findings in a project management environments, to tune them, and, finally, to have positive feedback from the project teams involved.
LARGE TRANsPORTATION PROjECT MANAGEMENT: A NON-LINEAR APPROACh
This thesis addresses many issues management-related in large transportation projects. They have been collected in the last three years analysing many cases study in Europe and Worldwide. We chose to include in this thesis only the most relevant to support our findings, even if all of them gave a contribution to the conception of this work. The cases are analysed following a common descriptive scheme, adapted in the contents according to the specific characteristics and to the specific findings. In addition, it has never been possible to access to all information we wanted (asked for): for this reason the case studies are never perfectly symmetric, but in all cases they provide the information needed for the findings and conclusion provided. For each issue identified, at least a case study has been provided to point out the issue itself and to support the solution proposed. The result of what discussed in the thesis is a list of recommendations for future urban and technologically advanced transportation projects.In the first section me analysed and criticized the classic project management theory. For those who are usual with the classic project management, it is clear that there is a consolidated way to look at the project, which is the one presented in the
Project Management Body Of Knowledge (PMBOK): linear, step-by-step, reductionistic, comfortable, and effective in many cases. This approach is based on the definition of all activities required to fulfil the scope of the project within a given time and budget. This approach, which is effective in many cases, gives some trouble if used to manage large projects, in general because it is not always possible to predict all issues in the project, and many issues emerge as unexpected risks during the project execution, requiring replanning, reworks and showing many feedback processes and internal and external interdependences. This situation shows clearly signs of complex behaviour, as the behaviour exhibited by physical systems in the chaos theory. This complexity makes more and more difficult to foresee trends and consequences of actions, and the so called “butterfly effect” (a small change at one place of a system result in large differences to a later state) become a reality in front of us. If we refer to management, these phenomena require a new approach, which will result as a new paradigm in management, in which traditional management stays applicable only to small (or simple) projects, but the general theory about project management is different
and take into account non-linear effect due to chaos theory.The first concrete proposal we made is about a wide cost and benefit analysis, including both direct and indirect costs and benefits. The direct transport benefits are efficiency related and thus can be included into conventional CBA. Also wider economic benefits, when existing (i.e. the benefits due to Keynesian policies in stagnating economies), can be included into CBA because promoting efficiency. The other drivers (land rent generation, promoters’ interests, urban planning tools or Keynesian arguments in absence of recession conditions) are not promoting efficiency; rather, they involve distributive considerations. Finally, when the main driver to infrastructure building is the Keynesian one, the assessment should not be limited to transport sector only or to a single project, but should consider among the alternatives the economy as a whole.We suggested the possibility to apply the organizational networks mapping, which is usually made at company or department level, for urban transportation projects, in order to define the relationships among stakeholders not directly involved in the project and to be able to better reply to issues emerging during the project execution phase. As a result, the
Edoardo Favari - Supervisor: Roberto Maja
256
257
Envi
ro
nm
Enta
l a
nd
infr
ast
ru
ctu
rEs
En
gin
EEr
ing
Phd
Yea
rboo
k | 2
013
hydraulic characteristics of the network, hydraulic analysis method);
∙ the minimum and maximum size for a single DMA, Cmin and CMAX, usually expressed in terms of number of customer connections per districts;
∙ the minimum pressure required to ensure the delivery of water to the customers.
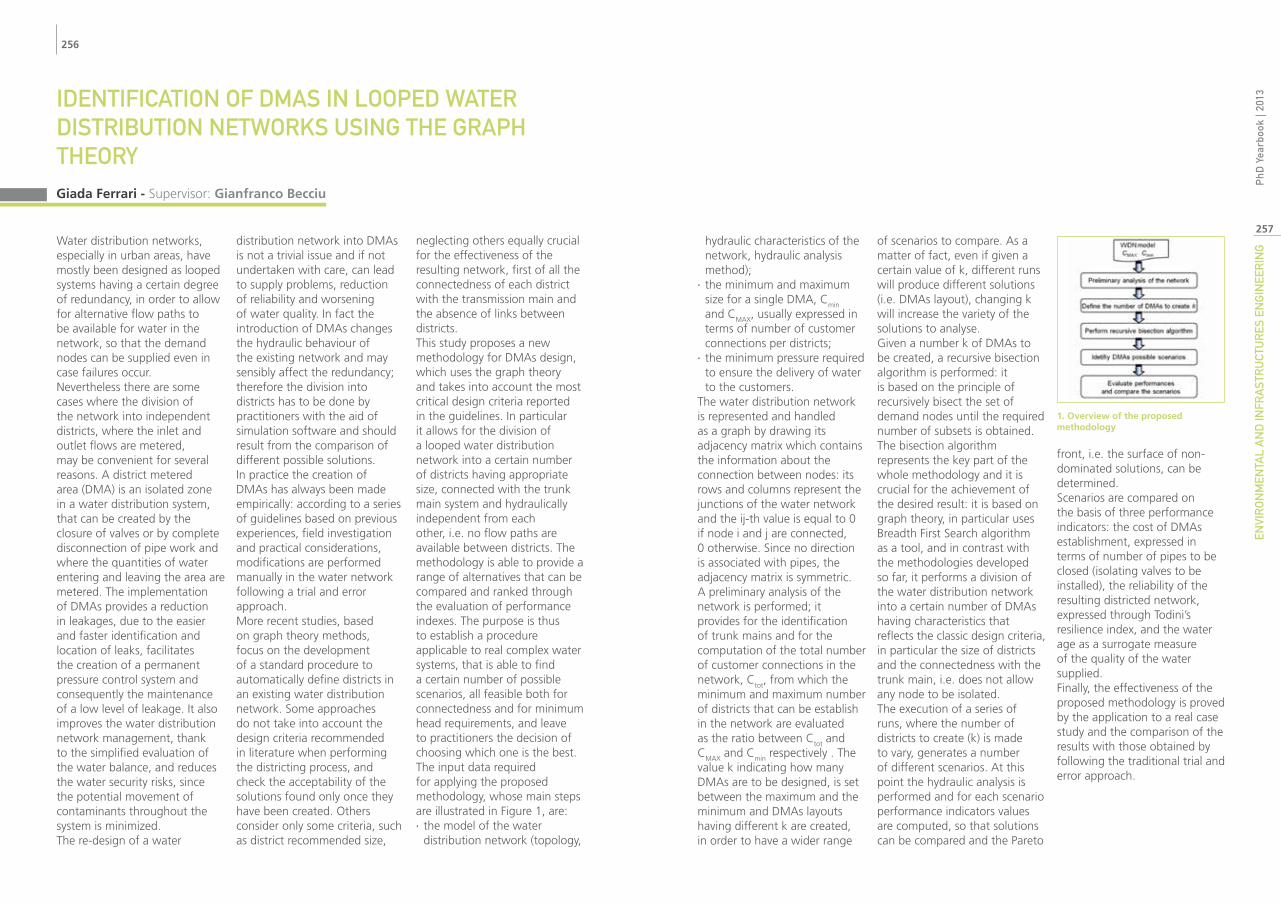
The water distribution network is represented and handled as a graph by drawing its adjacency matrix which contains the information about the connection between nodes: its rows and columns represent the junctions of the water network and the ij-th value is equal to 0 if node i and j are connected, 0 otherwise. Since no direction is associated with pipes, the adjacency matrix is symmetric.A preliminary analysis of the network is performed; it provides for the identification of trunk mains and for the computation of the total number of customer connections in the network, C
tot, from which the minimum and maximum number of districts that can be establish in the network are evaluated as the ratio between Ctot and CMAX and Cmin respectively . The value k indicating how many DMAs are to be designed, is set between the maximum and the minimum and DMAs layouts having different k are created, in order to have a wider range
of scenarios to compare. As a matter of fact, even if given a certain value of k, different runs will produce different solutions (i.e. DMAs layout), changing k will increase the variety of the solutions to analyse.Given a number k of DMAs to be created, a recursive bisection algorithm is performed: it is based on the principle of recursively bisect the set of demand nodes until the required number of subsets is obtained. The bisection algorithm represents the key part of the whole methodology and it is crucial for the achievement of the desired result: it is based on graph theory, in particular uses Breadth First Search algorithm as a tool, and in contrast with the methodologies developed so far, it performs a division of the water distribution network into a certain number of DMAs having characteristics that reflects the classic design criteria, in particular the size of districts and the connectedness with the trunk main, i.e. does not allow any node to be isolated.The execution of a series of runs, where the number of districts to create (k) is made to vary, generates a number of different scenarios. At this point the hydraulic analysis is performed and for each scenario performance indicators values are computed, so that solutions can be compared and the Pareto
front, i.e. the surface of non-dominated solutions, can be determined.Scenarios are compared on the basis of three performance indicators: the cost of DMAs establishment, expressed in terms of number of pipes to be closed (isolating valves to be installed), the reliability of the resulting districted network, expressed through Todini’s resilience index, and the water age as a surrogate measure of the quality of the water supplied.Finally, the effectiveness of the proposed methodology is proved by the application to a real case study and the comparison of the results with those obtained by following the traditional trial and error approach.
IDENTIfICATION Of DMAs IN LOOPED WATER DIsTRIBuTION NETWORks usING ThE GRAPh ThEORy
Water distribution networks, especially in urban areas, have mostly been designed as looped systems having a certain degree of redundancy, in order to allow for alternative flow paths to be available for water in the network, so that the demand nodes can be supplied even in case failures occur.Nevertheless there are some cases where the division of the network into independent districts, where the inlet and outlet flows are metered, may be convenient for several reasons. A district metered area (DMA) is an isolated zone in a water distribution system, that can be created by the closure of valves or by complete disconnection of pipe work and where the quantities of water entering and leaving the area are metered. The implementation of DMAs provides a reduction in leakages, due to the easier and faster identification and location of leaks, facilitates the creation of a permanent pressure control system and consequently the maintenance of a low level of leakage. It also improves the water distribution network management, thank to the simplified evaluation of the water balance, and reduces the water security risks, since the potential movement of contaminants throughout the system is minimized. The re-design of a water
distribution network into DMAs is not a trivial issue and if not undertaken with care, can lead to supply problems, reduction of reliability and worsening of water quality. In fact the introduction of DMAs changes the hydraulic behaviour of the existing network and may sensibly affect the redundancy; therefore the division into districts has to be done by practitioners with the aid of simulation software and should result from the comparison of different possible solutions.In practice the creation of DMAs has always been made empirically: according to a series of guidelines based on previous experiences, field investigation and practical considerations, modifications are performed manually in the water network following a trial and error approach. More recent studies, based on graph theory methods, focus on the development of a standard procedure to automatically define districts in an existing water distribution network. Some approaches do not take into account the design criteria recommended in literature when performing the districting process, and check the acceptability of the solutions found only once they have been created. Others consider only some criteria, such as district recommended size,
neglecting others equally crucial for the effectiveness of the resulting network, first of all the connectedness of each district with the transmission main and the absence of links between districts.This study proposes a new methodology for DMAs design, which uses the graph theory and takes into account the most critical design criteria reported in the guidelines. In particular it allows for the division of a looped water distribution network into a certain number of districts having appropriate size, connected with the trunk main system and hydraulically independent from each other, i.e. no flow paths are available between districts. The methodology is able to provide a range of alternatives that can be compared and ranked through the evaluation of performance indexes. The purpose is thus to establish a procedure applicable to real complex water systems, that is able to find a certain number of possible scenarios, all feasible both for connectedness and for minimum head requirements, and leave to practitioners the decision of choosing which one is the best.The input data required for applying the proposed methodology, whose main steps are illustrated in Figure 1, are: ∙ the model of the water distribution network (topology,
Giada Ferrari - Supervisor: Gianfranco Becciu
1. Overview of the proposed methodology
258
259
Envi
ro
nm
Enta
l a
nd
infr
ast
ru
ctu
rEs
En
gin
EEr
ing
Phd
Yea
rboo
k | 2
013
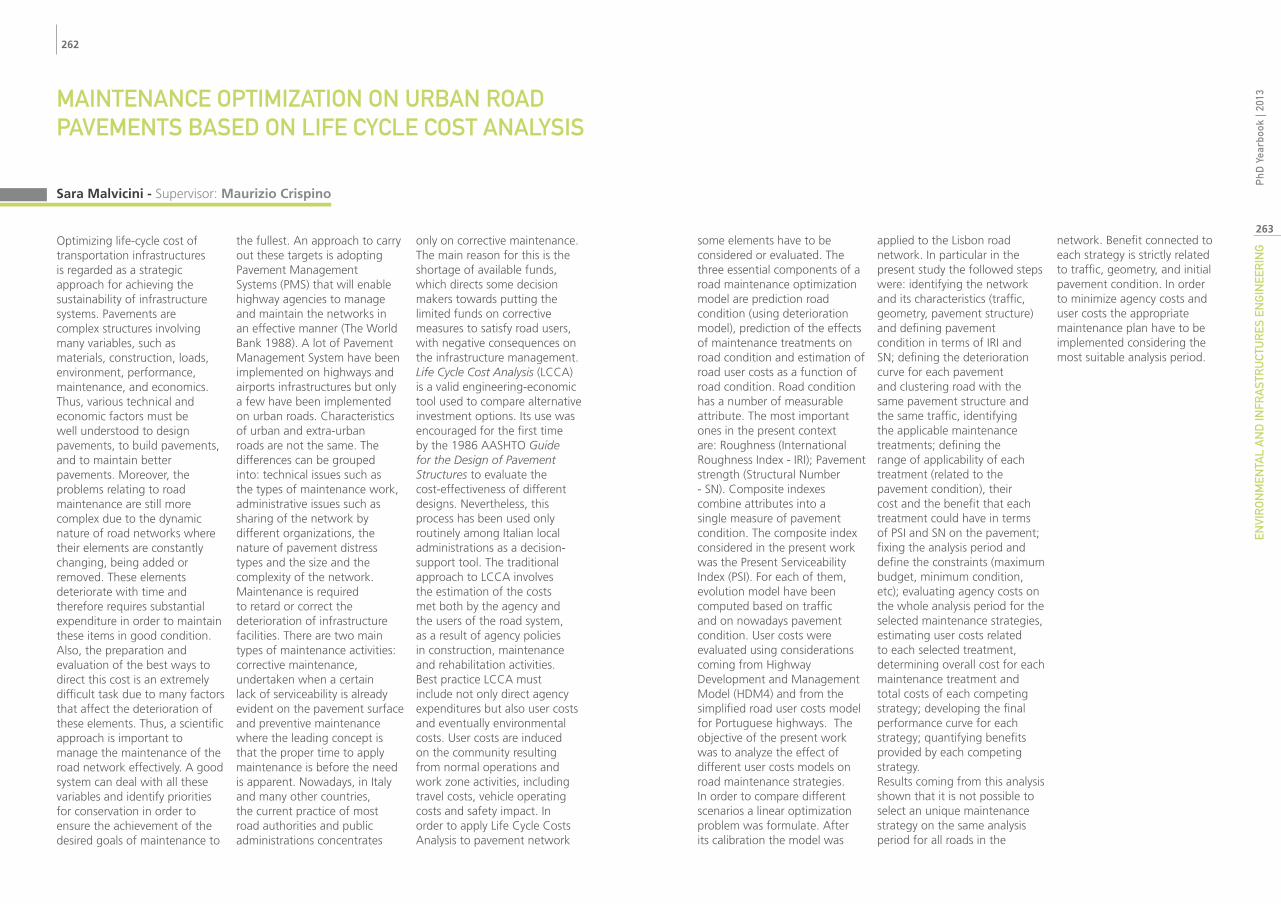
obtain the vertical delimitation of the point cloud if it represents a structure or an aquifer. The relational matching is also applied to obtain the diagram of the areas automatically if the input point cloud represents an infrastructure. To do so, Delaunay triangulation must be applied previously.It is possible to connect a set of points with triangles. There are many possible triangulations; the adopted one in this dissertation is Delaunay triangulation. The disadvantage is that this procedure is not robust. That is the reason why the input data must be checked before analyzing the data.If the point cloud does not have any holes, Delaunay triangulation perfectly works. On the contrary, it is not possible to directly apply Delaunay triangulation so adaptations have to be done. The software
checks if the middle point of the side of the triangle is inside the closed path, on the perimeter or outside the closed path. If it is inside the two contours or on the perimeters, the software keeps it, otherwise the line is deleted. If the input point cloud represents a concave body, Delaunay triangulation does not work. The software checks if the middle point of the side of the triangle is inside the closed path, on the perimeter or outside the closed path. If it is inside or on the perimeter, the software keeps it, otherwise the side is deleted.Delaunay triangulation has is applied to the structure in two different directions: vertically to create a row surface and horizontally to create continuous models, one for each horizontal cluster. Delaunay triangulation is also applied to the infrastructure to calculate the area of the
surface comprised of the space between the points connected using the relational matching. Delaunay triangulation is applied to the aquifer to create a row surface for each cluster and to obtain the perimetration.The Brückner profile analysis is consists in the calculation of cut and fill volumes of soil. This profile is obtained by integrating the area diagram for two consecutive airport sections. It is possible to divide each section into two triangles with Delaunay triangulation and to obtain the re of each triangle with stabilized Erone formula.
3D MODELING: sTRuCTuREs, INfRAsTRuCTuREs, AquIfERs AND shRuBs
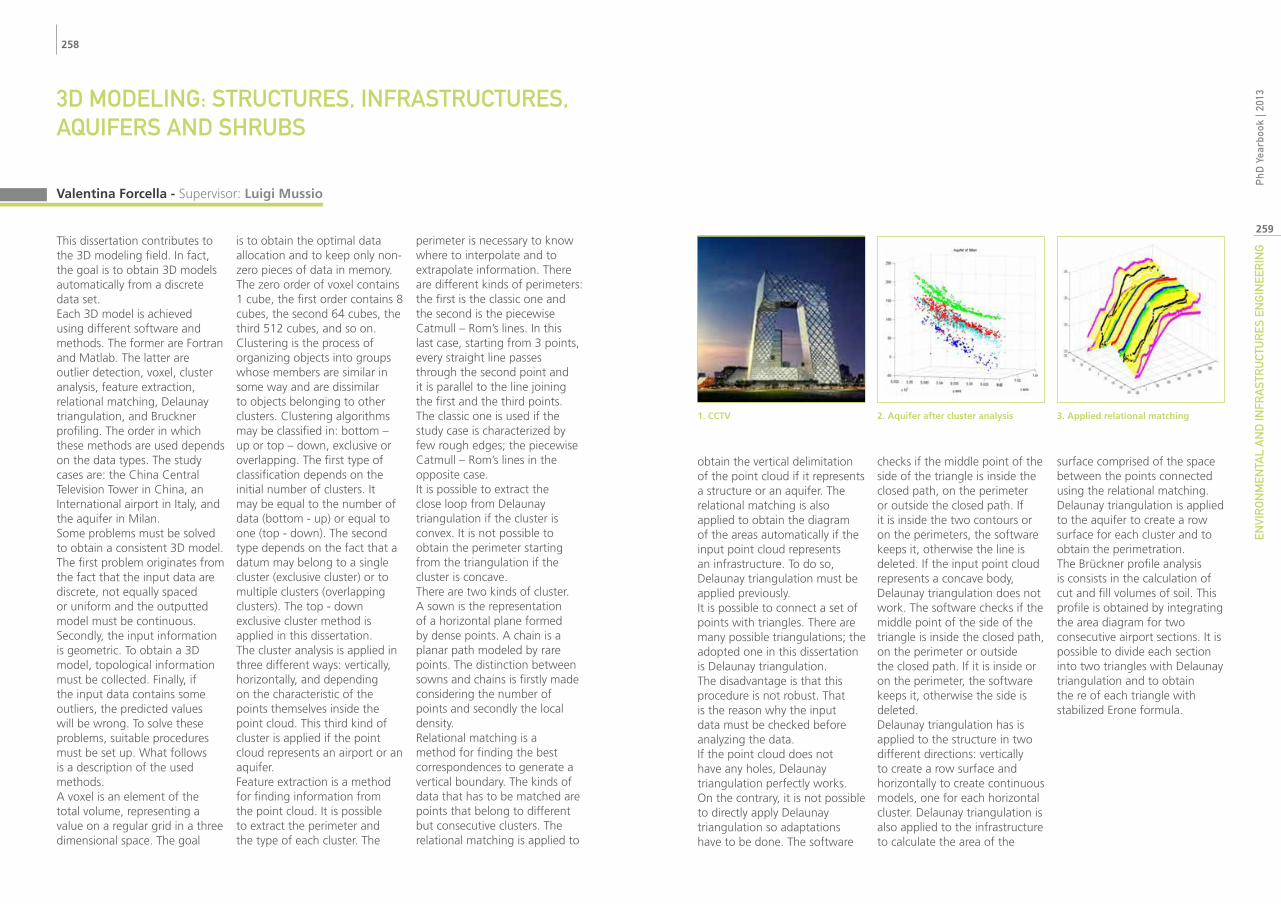
This dissertation contributes to the 3D modeling field. In fact, the goal is to obtain 3D models automatically from a discrete data set.Each 3D model is achieved using different software and methods. The former are Fortran and Matlab. The latter are outlier detection, voxel, cluster analysis, feature extraction, relational matching, Delaunay triangulation, and Bruckner profiling. The order in which these methods are used depends on the data types. The study cases are: the China Central Television Tower in China, an International airport in Italy, and the aquifer in Milan.Some problems must be solved to obtain a consistent 3D model. The first problem originates from the fact that the input data are discrete, not equally spaced or uniform and the outputted model must be continuous. Secondly, the input information is geometric. To obtain a 3D model, topological information must be collected. Finally, if the input data contains some outliers, the predicted values will be wrong. To solve these problems, suitable procedures must be set up. What follows is a description of the used methods.A voxel is an element of the total volume, representing a value on a regular grid in a three dimensional space. The goal
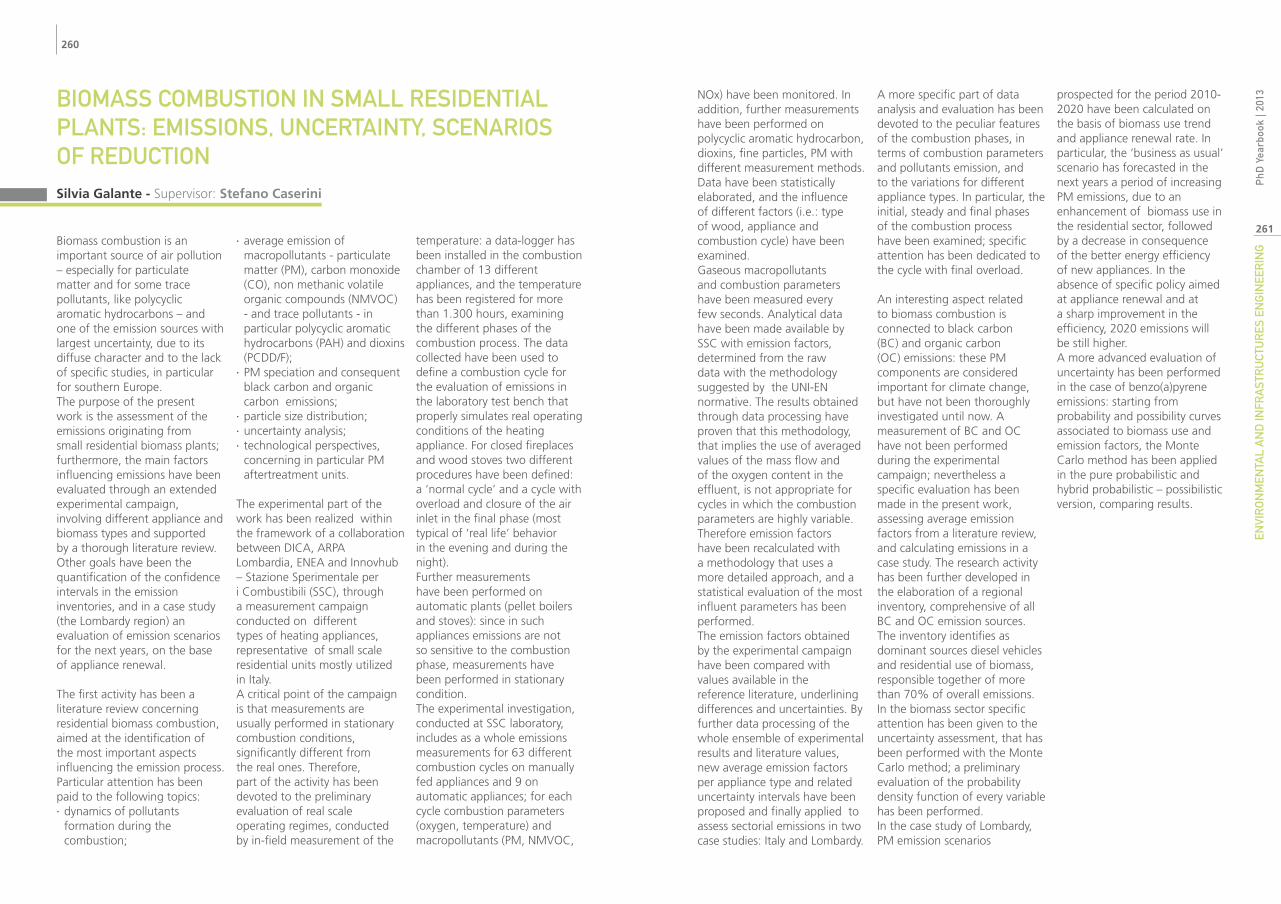
is to obtain the optimal data allocation and to keep only non-zero pieces of data in memory. The zero order of voxel contains 1 cube, the first order contains 8 cubes, the second 64 cubes, the third 512 cubes, and so on.Clustering is the process of organizing objects into groups whose members are similar in some way and are dissimilar to objects belonging to other clusters. Clustering algorithms may be classified in: bottom – up or top – down, exclusive or overlapping. The first type of classification depends on the initial number of clusters. It may be equal to the number of data (bottom - up) or equal to one (top - down). The second type depends on the fact that a datum may belong to a single cluster (exclusive cluster) or to multiple clusters (overlapping clusters). The top - down exclusive cluster method is applied in this dissertation.The cluster analysis is applied in three different ways: vertically, horizontally, and depending on the characteristic of the points themselves inside the point cloud. This third kind of cluster is applied if the point cloud represents an airport or an aquifer.Feature extraction is a method for finding information from the point cloud. It is possible to extract the perimeter and the type of each cluster. The
perimeter is necessary to know where to interpolate and to extrapolate information. There are different kinds of perimeters: the first is the classic one and the second is the piecewise Catmull – Rom’s lines. In this last case, starting from 3 points, every straight line passes through the second point and it is parallel to the line joining the first and the third points. The classic one is used if the study case is characterized by few rough edges; the piecewise Catmull – Rom’s lines in the opposite case.It is possible to extract the close loop from Delaunay triangulation if the cluster is convex. It is not possible to obtain the perimeter starting from the triangulation if the cluster is concave.There are two kinds of cluster. A sown is the representation of a horizontal plane formed by dense points. A chain is a planar path modeled by rare points. The distinction between sowns and chains is firstly made considering the number of points and secondly the local density.Relational matching is a method for finding the best correspondences to generate a vertical boundary. The kinds of data that has to be matched are points that belong to different but consecutive clusters. The relational matching is applied to
Valentina Forcella - Supervisor: Luigi Mussio
3. Applied relational matching1. CCTV 2. Aquifer after cluster analysis
260
261
Envi
ro
nm
Enta
l a
nd
infr
ast
ru
ctu
rEs
En
gin
EEr
ing
Phd
Yea
rboo
k | 2
013NOx) have been monitored. In
addition, further measurements have been performed on polycyclic aromatic hydrocarbon, dioxins, fine particles, PM with different measurement methods.Data have been statistically elaborated, and the influence of different factors (i.e.: type of wood, appliance and combustion cycle) have been examined.Gaseous macropollutants and combustion parameters have been measured every few seconds. Analytical data have been made available by SSC with emission factors, determined from the raw data with the methodology suggested by the UNI-EN normative. The results obtained through data processing have proven that this methodology, that implies the use of averaged values of the mass flow and of the oxygen content in the effluent, is not appropriate for cycles in which the combustion parameters are highly variable. Therefore emission factors have been recalculated with a methodology that uses a more detailed approach, and a statistical evaluation of the most influent parameters has been performed.The emission factors obtained by the experimental campaign have been compared with values available in the reference literature, underlining differences and uncertainties. By further data processing of the whole ensemble of experimental results and literature values, new average emission factors per appliance type and related uncertainty intervals have been proposed and finally applied to assess sectorial emissions in two case studies: Italy and Lombardy.
A more specific part of data analysis and evaluation has been devoted to the peculiar features of the combustion phases, in terms of combustion parameters and pollutants emission, and to the variations for different appliance types. In particular, the initial, steady and final phases of the combustion process have been examined; specific attention has been dedicated to the cycle with final overload.
An interesting aspect related to biomass combustion is connected to black carbon (BC) and organic carbon (OC) emissions: these PM components are considered important for climate change, but have not been thoroughly investigated until now. A measurement of BC and OC have not been performed during the experimental campaign; nevertheless a specific evaluation has been made in the present work, assessing average emission factors from a literature review, and calculating emissions in a case study. The research activity has been further developed in the elaboration of a regional inventory, comprehensive of all BC and OC emission sources. The inventory identifies as dominant sources diesel vehicles and residential use of biomass, responsible together of more than 70% of overall emissions. In the biomass sector specific attention has been given to the uncertainty assessment, that has been performed with the Monte Carlo method; a preliminary evaluation of the probability density function of every variable has been performed.In the case study of Lombardy, PM emission scenarios
prospected for the period 2010-2020 have been calculated on the basis of biomass use trend and appliance renewal rate. In particular, the ‘business as usual’ scenario has forecasted in the next years a period of increasing PM emissions, due to an enhancement of biomass use in the residential sector, followed by a decrease in consequence of the better energy efficiency of new appliances. In the absence of specific policy aimed at appliance renewal and at a sharp improvement in the efficiency, 2020 emissions will be still higher.A more advanced evaluation of uncertainty has been performed in the case of benzo(a)pyrene emissions: starting from probability and possibility curves associated to biomass use and emission factors, the Monte Carlo method has been applied in the pure probabilistic and hybrid probabilistic – possibilistic version, comparing results.
BIOMAss COMBusTION IN sMALL REsIDENTIAL PLANTs: EMIssIONs, uNCERTAINTy, sCENARIOs Of REDuCTION
Biomass combustion is an important source of air pollution – especially for particulate matter and for some trace pollutants, like polycyclic aromatic hydrocarbons – and one of the emission sources with largest uncertainty, due to its diffuse character and to the lack of specific studies, in particular for southern Europe.The purpose of the present work is the assessment of the emissions originating from small residential biomass plants; furthermore, the main factors influencing emissions have been evaluated through an extended experimental campaign, involving different appliance and biomass types and supported by a thorough literature review. Other goals have been the quantification of the confidence intervals in the emission inventories, and in a case study (the Lombardy region) an evaluation of emission scenarios for the next years, on the base of appliance renewal.
The first activity has been a literature review concerning residential biomass combustion, aimed at the identification of the most important aspects influencing the emission process. Particular attention has been paid to the following topics: ∙ dynamics of pollutants formation during the combustion;
∙ average emission of macropollutants - particulate matter (PM), carbon monoxide (CO), non methanic volatile organic compounds (NMVOC) - and trace pollutants - in particular polycyclic aromatic hydrocarbons (PAH) and dioxins (PCDD/F);
∙ PM speciation and consequent black carbon and organic carbon emissions;
∙ particle size distribution; ∙ uncertainty analysis; ∙ technological perspectives, concerning in particular PM aftertreatment units.
The experimental part of the work has been realized within the framework of a collaboration between DICA, ARPA Lombardia, ENEA and Innovhub – Stazione Sperimentale per i Combustibili (SSC), through a measurement campaign conducted on different types of heating appliances, representative of small scale residential units mostly utilized in Italy.A critical point of the campaign is that measurements are usually performed in stationary combustion conditions, significantly different from the real ones. Therefore, part of the activity has been devoted to the preliminary evaluation of real scale operating regimes, conducted by in-field measurement of the
temperature: a data-logger has been installed in the combustion chamber of 13 different appliances, and the temperature has been registered for more than 1.300 hours, examining the different phases of the combustion process. The data collected have been used to define a combustion cycle for the evaluation of emissions in the laboratory test bench that properly simulates real operating conditions of the heating appliance. For closed fireplaces and wood stoves two different procedures have been defined: a ‘normal cycle’ and a cycle with overload and closure of the air inlet in the final phase (most typical of ‘real life’ behavior in the evening and during the night).Further measurements have been performed on automatic plants (pellet boilers and stoves): since in such appliances emissions are not so sensitive to the combustion phase, measurements have been performed in stationary condition.The experimental investigation, conducted at SSC laboratory, includes as a whole emissions measurements for 63 different combustion cycles on manually fed appliances and 9 on automatic appliances; for each cycle combustion parameters (oxygen, temperature) and macropollutants (PM, NMVOC,
Silvia Galante - Supervisor: Stefano Caserini
262
263
Envi
ro
nm
Enta
l a
nd
infr
ast
ru
ctu
rEs
En
gin
EEr
ing
Phd
Yea
rboo
k | 2
013
some elements have to be considered or evaluated. The three essential components of a road maintenance optimization model are prediction road condition (using deterioration model), prediction of the effects of maintenance treatments on road condition and estimation of road user costs as a function of road condition. Road condition has a number of measurable attribute. The most important ones in the present context are: Roughness (International Roughness Index - IRI); Pavement strength (Structural Number - SN). Composite indexes combine attributes into a single measure of pavement condition. The composite index considered in the present work was the Present Serviceability Index (PSI). For each of them, evolution model have been computed based on traffic and on nowadays pavement condition. User costs were evaluated using considerations coming from Highway Development and Management Model (HDM4) and from the simplified road user costs model for Portuguese highways. The objective of the present work was to analyze the effect of different user costs models on road maintenance strategies. In order to compare different scenarios a linear optimization problem was formulate. After its calibration the model was
applied to the Lisbon road network. In particular in the present study the followed steps were: identifying the network and its characteristics (traffic, geometry, pavement structure) and defining pavement condition in terms of IRI and SN; defining the deterioration curve for each pavement and clustering road with the same pavement structure and the same traffic, identifying the applicable maintenance treatments; defining the range of applicability of each treatment (related to the pavement condition), their cost and the benefit that each treatment could have in terms of PSI and SN on the pavement; fixing the analysis period and define the constraints (maximum budget, minimum condition, etc); evaluating agency costs on the whole analysis period for the selected maintenance strategies, estimating user costs related to each selected treatment, determining overall cost for each maintenance treatment and total costs of each competing strategy; developing the final performance curve for each strategy; quantifying benefits provided by each competing strategy.Results coming from this analysis shown that it is not possible to select an unique maintenance strategy on the same analysis period for all roads in the
network. Benefit connected to each strategy is strictly related to traffic, geometry, and initial pavement condition. In order to minimize agency costs and user costs the appropriate maintenance plan have to be implemented considering the most suitable analysis period.
MAINTENANCE OPTIMIzATION ON uRBAN ROAD PAvEMENTs BAsED ON LIfE CyCLE COsT ANALysIs
Optimizing life-cycle cost of transportation infrastructures is regarded as a strategic approach for achieving the sustainability of infrastructure systems. Pavements are complex structures involving many variables, such as materials, construction, loads, environment, performance, maintenance, and economics. Thus, various technical and economic factors must be well understood to design pavements, to build pavements, and to maintain better pavements. Moreover, the problems relating to road maintenance are still more complex due to the dynamic nature of road networks where their elements are constantly changing, being added or removed. These elements deteriorate with time and therefore requires substantial expenditure in order to maintain these items in good condition. Also, the preparation and evaluation of the best ways to direct this cost is an extremely difficult task due to many factors that affect the deterioration of these elements. Thus, a scientific approach is important to manage the maintenance of the road network effectively. A good system can deal with all these variables and identify priorities for conservation in order to ensure the achievement of the desired goals of maintenance to
the fullest. An approach to carry out these targets is adopting Pavement Management Systems (PMS) that will enable highway agencies to manage and maintain the networks in an effective manner (The World Bank 1988). A lot of Pavement Management System have been implemented on highways and airports infrastructures but only a few have been implemented on urban roads. Characteristics of urban and extra-urban roads are not the same. The differences can be grouped into: technical issues such as the types of maintenance work, administrative issues such as sharing of the network by different organizations, the nature of pavement distress types and the size and the complexity of the network.Maintenance is required to retard or correct the deterioration of infrastructure facilities. There are two main types of maintenance activities: corrective maintenance, undertaken when a certain lack of serviceability is already evident on the pavement surface and preventive maintenance where the leading concept is that the proper time to apply maintenance is before the need is apparent. Nowadays, in Italy and many other countries, the current practice of most road authorities and public administrations concentrates
only on corrective maintenance. The main reason for this is the shortage of available funds, which directs some decision makers towards putting the limited funds on corrective measures to satisfy road users, with negative consequences on the infrastructure management.Life Cycle Cost Analysis (LCCA) is a valid engineering-economic tool used to compare alternative investment options. Its use was encouraged for the first time by the 1986 AASHTO Guide for the Design of Pavement Structures to evaluate the cost-effectiveness of different designs. Nevertheless, this process has been used only routinely among Italian local administrations as a decision-support tool. The traditional approach to LCCA involves the estimation of the costs met both by the agency and the users of the road system, as a result of agency policies in construction, maintenance and rehabilitation activities. Best practice LCCA must include not only direct agency expenditures but also user costs and eventually environmental costs. User costs are induced on the community resulting from normal operations and work zone activities, including travel costs, vehicle operating costs and safety impact. In order to apply Life Cycle Costs Analysis to pavement network
Sara Malvicini - Supervisor: Maurizio Crispino
264
265
Envi
ro
nm
Enta
l a
nd
infr
ast
ru
ctu
rEs
En
gin
EEr
ing
Phd
Yea
rboo
k | 2
013EDDy COvARIANCE MEAsuREMENTs IN ThE PO
vALLEy: REPREsENTATIvENEss AND ACCuRACy
This PhD work is mainly focused on researching utilities for increasing the micrometeorological flux reliabilities. Micrometeorological stations, which use the eddy covariance technique to estimate turbulent fluxes in the surface layer, are generally located in different agricultural fields to assess evapotranspiration and carbon dioxide fluxes between soil (or vegetation) and atmosphere. Evapotranspiration and carbon dioxide fluxes of the SVAT (Soil – Vegetation – ATmosphere systems), have to be correctly estimated if a sustainable and parsimonious water resources management would be made. Moreover energy and mass balances model outputs (e.g. latent heat flux and soil moisture) can be compared with micrometeorological measurements, if and only if micrometeorological data are rigorously processed and their qualities are assessed.Micrometeorological technique was born about 30 years ago and, subsequently, a large contribution about data corrections was rapidly given by many scientists. However, many aspects about measurement proprieties and flux reliabilities are only now investigated. In the first part of this work, starting from high frequency measurements of the three wind components and carbon dioxide/
water concentrations, eddy covariance data are processed using an open source program and the results are compared with those obtained by a simple software implemented at the Politecnico of Milan for averaged data for real time water management. Thanks to this comparison the main correction procedures which have to be necessarily implemented to obtain reliable turbulent fluxes from micrometeorological data, are shown.The reliability of the micrometeorological measurements is usually assessed with the energy balance closure. Moreover, the use of energy data to validate land surface models requires that the conservation of the energy balance closure is satisfied. However, the unbalance problem is an important issue which has not yet been resolved. In the second part of this work, many aspects which could cause underestimation in turbulent flux measurements are shown. The factors which could influence the energy balance colure are separately investigated and the energy balance closure improvements or worsening are shown in order to understand the number of factors which could play a fundament role into energy balance closure problem. One of these problems is represented by flux scale
proprieties. In fact, net radiation, latent, sensible and ground heat fluxes (which represent the four components of the energy balance) have different representative source areas which covers different sectors of the field: from few centimeters for ground heat flux, to a hectare for latent and sensible heat fluxes. Therefore, several errors in energy balance closure can be related to the difficulty to match footprint area of eddy covariance fluxes with the source areas of the instruments which measure net radiation and ground heat flux. In the third part of this work, representative source area for turbulent fluxes measured by eddy covariance station is investigated through modeling and experimental campaigns in totally different field situations: bare and vegetated soils. A revisited simple method based on mobile and fixed eddy covariance stations is found to be helpful in intra-field spatial variability investigations of turbulent fluxes also over homogeneous canopy such us maize fields. The results of these experiments lead to interesting improvements about turbulent flux representative source area knowledge increasing literature results.
Daniele Masseroni - Supervisor: Marco Mancini
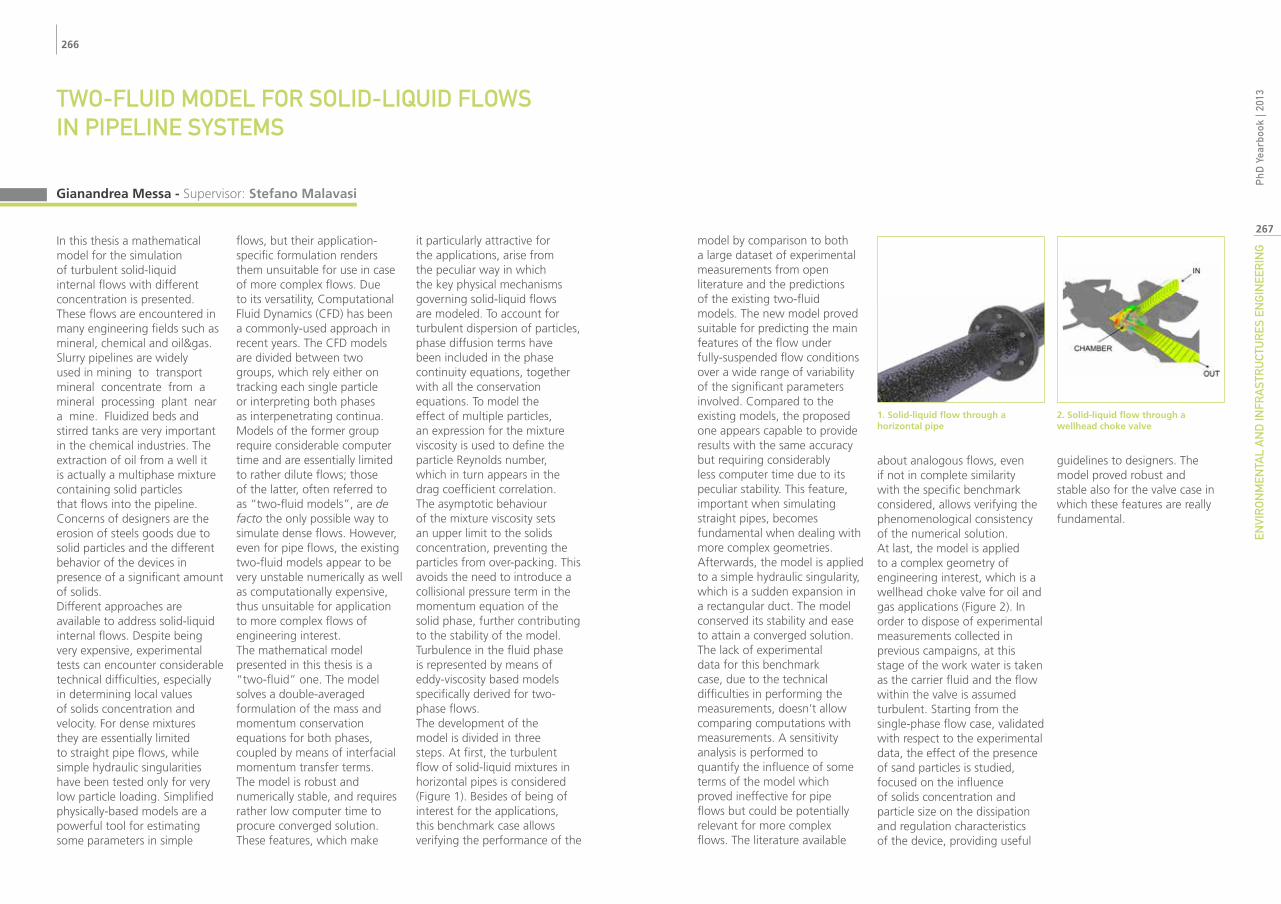
266
267
Envi
ro
nm
Enta
l a
nd
infr
ast
ru
ctu
rEs
En
gin
EEr
ing
Phd
Yea
rboo
k | 2
013
model by comparison to both a large dataset of experimental measurements from open literature and the predictions of the existing two-fluid models. The new model proved suitable for predicting the main features of the flow under fully-suspended flow conditions over a wide range of variability of the significant parameters involved. Compared to the existing models, the proposed one appears capable to provide results with the same accuracy but requiring considerably less computer time due to its peculiar stability. This feature, important when simulating straight pipes, becomes fundamental when dealing with more complex geometries.Afterwards, the model is applied to a simple hydraulic singularity, which is a sudden expansion in a rectangular duct. The model conserved its stability and ease to attain a converged solution. The lack of experimental data for this benchmark case, due to the technical difficulties in performing the measurements, doesn’t allow comparing computations with measurements. A sensitivity analysis is performed to quantify the influence of some terms of the model which proved ineffective for pipe flows but could be potentially relevant for more complex flows. The literature available
about analogous flows, even if not in complete similarity with the specific benchmark considered, allows verifying the phenomenological consistency of the numerical solution.At last, the model is applied to a complex geometry of engineering interest, which is a wellhead choke valve for oil and gas applications (Figure 2). In order to dispose of experimental measurements collected in previous campaigns, at this stage of the work water is taken as the carrier fluid and the flow within the valve is assumed turbulent. Starting from the single-phase flow case, validated with respect to the experimental data, the effect of the presence of sand particles is studied, focused on the influence of solids concentration and particle size on the dissipation and regulation characteristics of the device, providing useful
guidelines to designers. The model proved robust and stable also for the valve case in which these features are really fundamental.
TWO-fLuID MODEL fOR sOLID-LIquID fLOWs IN PIPELINE sysTEMs
In this thesis a mathematical model for the simulation of turbulent solid-liquid internal flows with different concentration is presented. These flows are encountered in many engineering fields such as mineral, chemical and oil&gas. Slurry pipelines are widely used in mining to transport mineral concentrate from a mineral processing plant near a mine. Fluidized beds and stirred tanks are very important in the chemical industries. The extraction of oil from a well it is actually a multiphase mixture containing solid particles that flows into the pipeline. Concerns of designers are the erosion of steels goods due to solid particles and the different behavior of the devices in presence of a significant amount of solids.Different approaches are available to address solid-liquid internal flows. Despite being very expensive, experimental tests can encounter considerable technical difficulties, especially in determining local values of solids concentration and velocity. For dense mixtures they are essentially limited to straight pipe flows, while simple hydraulic singularities have been tested only for very low particle loading. Simplified physically-based models are a powerful tool for estimating some parameters in simple
flows, but their application-specific formulation renders them unsuitable for use in case of more complex flows. Due to its versatility, Computational Fluid Dynamics (CFD) has been a commonly-used approach in recent years. The CFD models are divided between two groups, which rely either on tracking each single particle or interpreting both phases as interpenetrating continua. Models of the former group require considerable computer time and are essentially limited to rather dilute flows; those of the latter, often referred to as “two-fluid models”, are de facto the only possible way to simulate dense flows. However, even for pipe flows, the existing two-fluid models appear to be very unstable numerically as well as computationally expensive, thus unsuitable for application to more complex flows of engineering interest.The mathematical model presented in this thesis is a “two-fluid” one. The model solves a double-averaged formulation of the mass and momentum conservation equations for both phases, coupled by means of interfacial momentum transfer terms. The model is robust and numerically stable, and requires rather low computer time to procure converged solution. These features, which make
it particularly attractive for the applications, arise from the peculiar way in which the key physical mechanisms governing solid-liquid flows are modeled. To account for turbulent dispersion of particles, phase diffusion terms have been included in the phase continuity equations, together with all the conservation equations. To model the effect of multiple particles, an expression for the mixture viscosity is used to define the particle Reynolds number, which in turn appears in the drag coefficient correlation. The asymptotic behaviour of the mixture viscosity sets an upper limit to the solids concentration, preventing the particles from over-packing. This avoids the need to introduce a collisional pressure term in the momentum equation of the solid phase, further contributing to the stability of the model. Turbulence in the fluid phase is represented by means of eddy-viscosity based models specifically derived for two-phase flows.The development of the model is divided in three steps. At first, the turbulent flow of solid-liquid mixtures in horizontal pipes is considered (Figure 1). Besides of being of interest for the applications, this benchmark case allows verifying the performance of the
Gianandrea Messa - Supervisor: Stefano Malavasi
2. Solid-liquid flow through a wellhead choke valve
1. Solid-liquid flow through a horizontal pipe
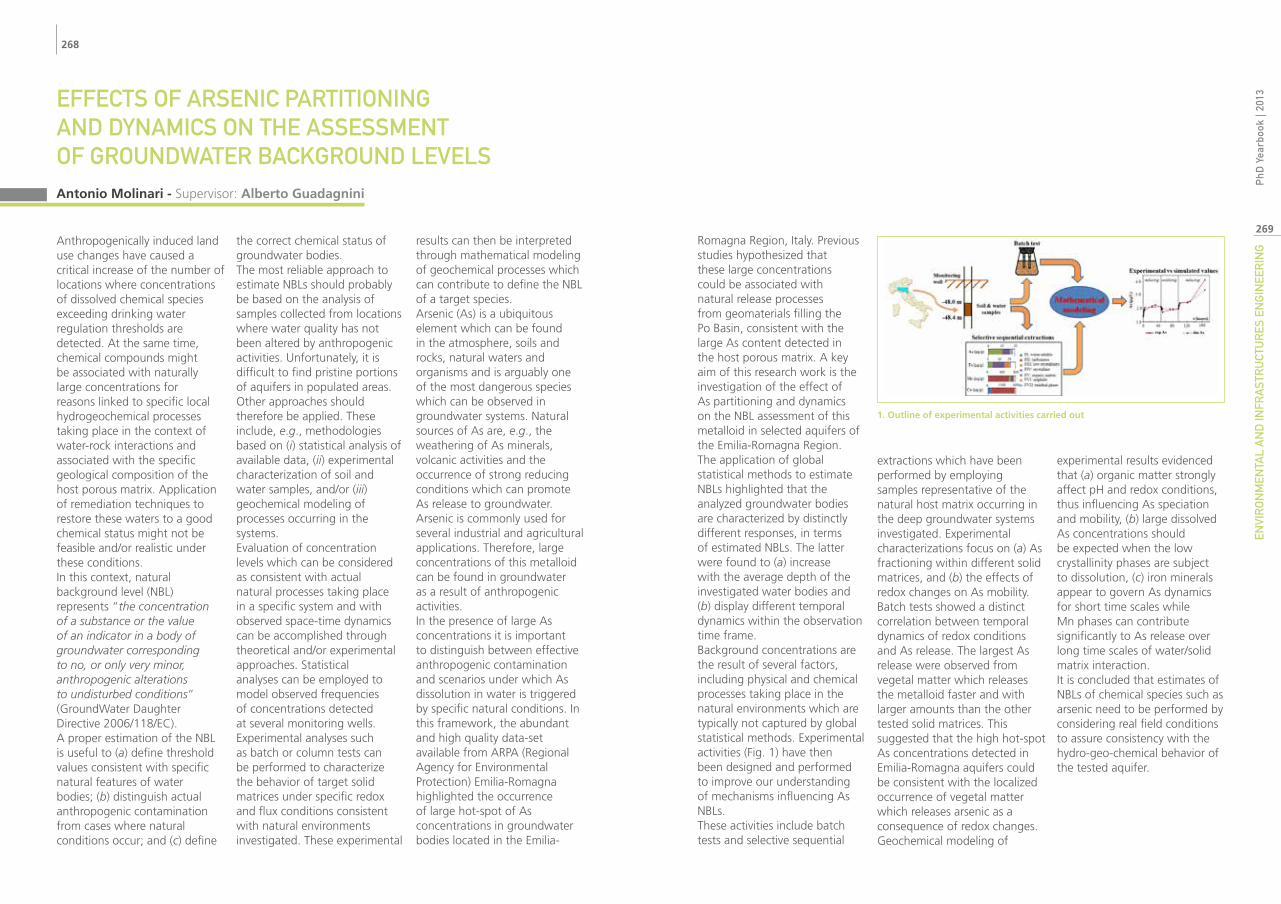
268
269
Envi
ro
nm
Enta
l a
nd
infr
ast
ru
ctu
rEs
En
gin
EEr
ing
Phd
Yea
rboo
k | 2
013
Romagna Region, Italy. Previous studies hypothesized that these large concentrations could be associated with natural release processes from geomaterials filling the Po Basin, consistent with the large As content detected in the host porous matrix. A key aim of this research work is the investigation of the effect of As partitioning and dynamics on the NBL assessment of this metalloid in selected aquifers of the Emilia-Romagna Region.The application of global statistical methods to estimate NBLs highlighted that the analyzed groundwater bodies are characterized by distinctly different responses, in terms of estimated NBLs. The latter were found to (a) increase with the average depth of the investigated water bodies and (b) display different temporal dynamics within the observation time frame.Background concentrations are the result of several factors, including physical and chemical processes taking place in the natural environments which are typically not captured by global statistical methods. Experimental activities (Fig. 1) have then been designed and performed to improve our understanding of mechanisms influencing As NBLs.These activities include batch tests and selective sequential
extractions which have been performed by employing samples representative of the natural host matrix occurring in the deep groundwater systems investigated. Experimental characterizations focus on (a) As fractioning within different solid matrices, and (b) the effects of redox changes on As mobility. Batch tests showed a distinct correlation between temporal dynamics of redox conditions and As release. The largest As release were observed from vegetal matter which releases the metalloid faster and with larger amounts than the other tested solid matrices. This suggested that the high hot-spot As concentrations detected in Emilia-Romagna aquifers could be consistent with the localized occurrence of vegetal matter which releases arsenic as a consequence of redox changes. Geochemical modeling of
experimental results evidenced that (a) organic matter strongly affect pH and redox conditions, thus influencing As speciation and mobility, (b) large dissolved As concentrations should be expected when the low crystallinity phases are subject to dissolution, (c) iron minerals appear to govern As dynamics for short time scales while Mn phases can contribute significantly to As release over long time scales of water/solid matrix interaction.It is concluded that estimates of NBLs of chemical species such as arsenic need to be performed by considering real field conditions to assure consistency with the hydro-geo-chemical behavior of the tested aquifer.
EffECTs Of ARsENIC PARTITIONING AND DyNAMICs ON ThE AssEssMENT Of GROuNDWATER BACkGROuND LEvELs
Anthropogenically induced land use changes have caused a critical increase of the number of locations where concentrations of dissolved chemical species exceeding drinking water regulation thresholds are detected. At the same time, chemical compounds might be associated with naturally large concentrations for reasons linked to specific local hydrogeochemical processes taking place in the context of water-rock interactions and associated with the specific geological composition of the host porous matrix. Application of remediation techniques to restore these waters to a good chemical status might not be feasible and/or realistic under these conditions.In this context, natural background level (NBL) represents “the concentration of a substance or the value of an indicator in a body of groundwater corresponding to no, or only very minor, anthropogenic alterations to undisturbed conditions” (GroundWater Daughter Directive 2006/118/EC).A proper estimation of the NBL is useful to (a) define threshold values consistent with specific natural features of water bodies; (b) distinguish actual anthropogenic contamination from cases where natural conditions occur; and (c) define
the correct chemical status of groundwater bodies.The most reliable approach to estimate NBLs should probably be based on the analysis of samples collected from locations where water quality has not been altered by anthropogenic activities. Unfortunately, it is difficult to find pristine portions of aquifers in populated areas. Other approaches should therefore be applied. These include, e.g., methodologies based on (i) statistical analysis of available data, (ii) experimental characterization of soil and water samples, and/or (iii) geochemical modeling of processes occurring in the systems.Evaluation of concentration levels which can be considered as consistent with actual natural processes taking place in a specific system and with observed space-time dynamics can be accomplished through theoretical and/or experimental approaches. Statistical analyses can be employed to model observed frequencies of concentrations detected at several monitoring wells. Experimental analyses such as batch or column tests can be performed to characterize the behavior of target solid matrices under specific redox and flux conditions consistent with natural environments investigated. These experimental
results can then be interpreted through mathematical modeling of geochemical processes which can contribute to define the NBL of a target species.Arsenic (As) is a ubiquitous element which can be found in the atmosphere, soils and rocks, natural waters and organisms and is arguably one of the most dangerous species which can be observed in groundwater systems. Natural sources of As are, e.g., the weathering of As minerals, volcanic activities and the occurrence of strong reducing conditions which can promote As release to groundwater. Arsenic is commonly used for several industrial and agricultural applications. Therefore, large concentrations of this metalloid can be found in groundwater as a result of anthropogenic activities.In the presence of large As concentrations it is important to distinguish between effective anthropogenic contamination and scenarios under which As dissolution in water is triggered by specific natural conditions. In this framework, the abundant and high quality data-set available from ARPA (Regional Agency for Environmental Protection) Emilia-Romagna highlighted the occurrence of large hot-spot of As concentrations in groundwater bodies located in the Emilia-
Antonio Molinari - Supervisor: Alberto Guadagnini
1. Outline of experimental activities carried out
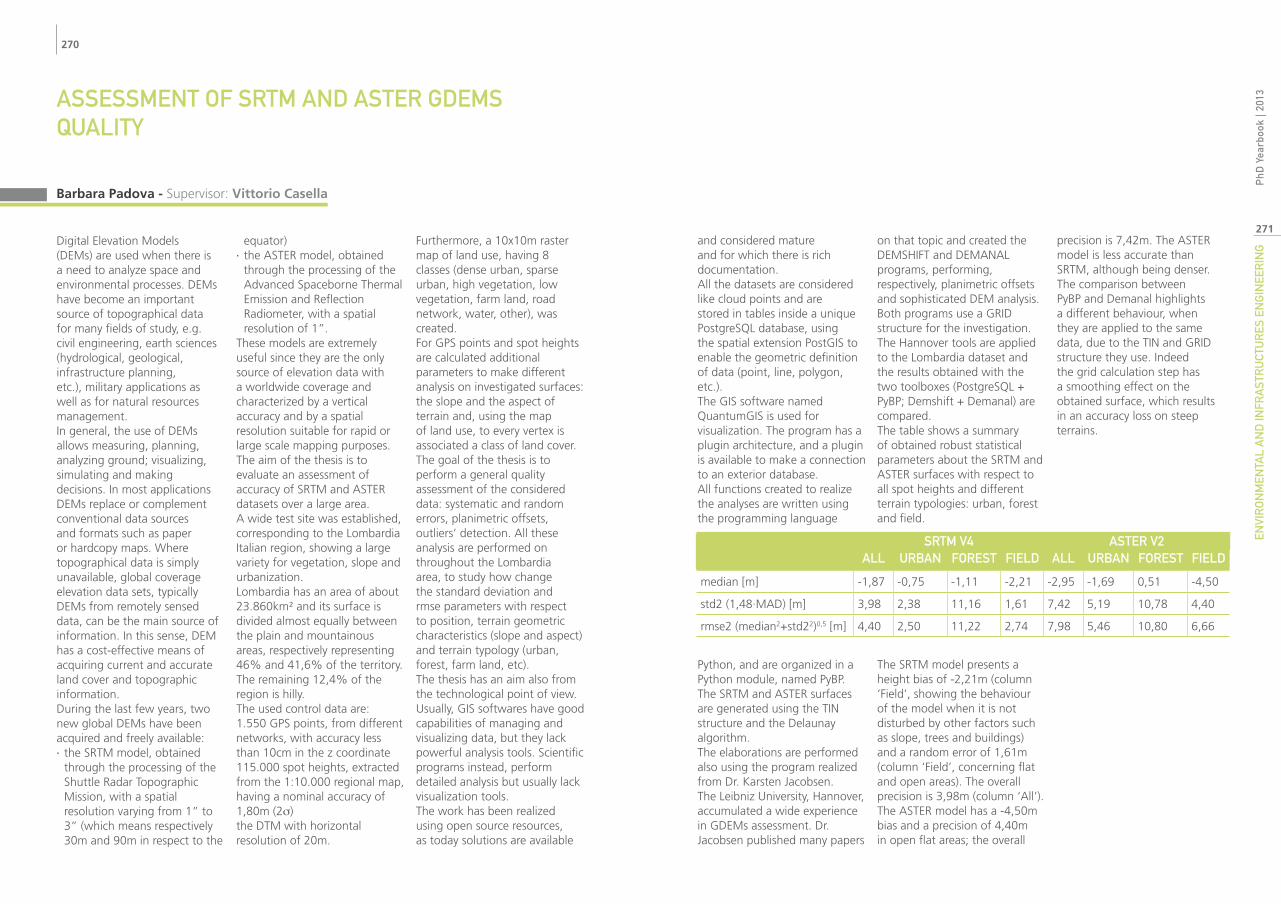
270
271
Envi
ro
nm
Enta
l a
nd
infr
ast
ru
ctu
rEs
En
gin
EEr
ing
Phd
Yea
rboo
k | 2
013
and considered mature and for which there is rich documentation.All the datasets are considered like cloud points and are stored in tables inside a unique PostgreSQL database, using the spatial extension PostGIS to enable the geometric definition of data (point, line, polygon, etc.).The GIS software named QuantumGIS is used for visualization. The program has a plugin architecture, and a plugin is available to make a connection to an exterior database.All functions created to realize the analyses are written using the programming language
Python, and are organized in a Python module, named PyBP.The SRTM and ASTER surfaces are generated using the TIN structure and the Delaunay algorithm.The elaborations are performed also using the program realized from Dr. Karsten Jacobsen.The Leibniz University, Hannover, accumulated a wide experience in GDEMs assessment. Dr. Jacobsen published many papers
on that topic and created the DEMSHIFT and DEMANAL programs, performing, respectively, planimetric offsets and sophisticated DEM analysis. Both programs use a GRID structure for the investigation. The Hannover tools are applied to the Lombardia dataset and the results obtained with the two toolboxes (PostgreSQL + PyBP; Demshift + Demanal) are compared.The table shows a summary of obtained robust statistical parameters about the SRTM and ASTER surfaces with respect to all spot heights and different terrain typologies: urban, forest and field.
The SRTM model presents a height bias of -2,21m (column ‘Field’, showing the behaviour of the model when it is not disturbed by other factors such as slope, trees and buildings) and a random error of 1,61m (column ‘Field’, concerning flat and open areas). The overall precision is 3,98m (column ‘All’).The ASTER model has a -4,50m bias and a precision of 4,40m in open flat areas; the overall
precision is 7,42m. The ASTER model is less accurate than SRTM, although being denser.The comparison between PyBP and Demanal highlights a different behaviour, when they are applied to the same data, due to the TIN and GRID structure they use. Indeed the grid calculation step has a smoothing effect on the obtained surface, which results in an accuracy loss on steep terrains.
AssEssMENT Of sRTM AND AsTER GDEMs quALITy
Digital Elevation Models (DEMs) are used when there is a need to analyze space and environmental processes. DEMs have become an important source of topographical data for many fields of study, e.g. civil engineering, earth sciences (hydrological, geological, infrastructure planning, etc.), military applications as well as for natural resources management.In general, the use of DEMs allows measuring, planning, analyzing ground; visualizing, simulating and making decisions. In most applications DEMs replace or complement conventional data sources and formats such as paper or hardcopy maps. Where topographical data is simply unavailable, global coverage elevation data sets, typically DEMs from remotely sensed data, can be the main source of information. In this sense, DEM has a cost-effective means of acquiring current and accurate land cover and topographic information.During the last few years, two new global DEMs have been acquired and freely available: ∙ the SRTM model, obtained through the processing of the Shuttle Radar Topographic Mission, with a spatial resolution varying from 1” to 3” (which means respectively 30m and 90m in respect to the
equator) ∙ the ASTER model, obtained through the processing of the Advanced Spaceborne Thermal Emission and Reflection Radiometer, with a spatial resolution of 1”.
These models are extremely useful since they are the only source of elevation data with a worldwide coverage and characterized by a vertical accuracy and by a spatial resolution suitable for rapid or large scale mapping purposes.The aim of the thesis is to evaluate an assessment of accuracy of SRTM and ASTER datasets over a large area.A wide test site was established, corresponding to the Lombardia Italian region, showing a large variety for vegetation, slope and urbanization.Lombardia has an area of about 23.860km² and its surface is divided almost equally between the plain and mountainous areas, respectively representing 46% and 41,6% of the territory. The remaining 12,4% of the region is hilly.The used control data are:1.550 GPS points, from different networks, with accuracy less than 10cm in the z coordinate115.000 spot heights, extracted from the 1:10.000 regional map, having a nominal accuracy of 1,80m (2s)the DTM with horizontal resolution of 20m.
Furthermore, a 10x10m raster map of land use, having 8 classes (dense urban, sparse urban, high vegetation, low vegetation, farm land, road network, water, other), was created.For GPS points and spot heights are calculated additional parameters to make different analysis on investigated surfaces: the slope and the aspect of terrain and, using the map of land use, to every vertex is associated a class of land cover.The goal of the thesis is to perform a general quality assessment of the considered data: systematic and random errors, planimetric offsets, outliers’ detection. All these analysis are performed on throughout the Lombardia area, to study how change the standard deviation and rmse parameters with respect to position, terrain geometric characteristics (slope and aspect) and terrain typology (urban, forest, farm land, etc).The thesis has an aim also from the technological point of view. Usually, GIS softwares have good capabilities of managing and visualizing data, but they lack powerful analysis tools. Scientific programs instead, perform detailed analysis but usually lack visualization tools.The work has been realized using open source resources, as today solutions are available
Barbara Padova - Supervisor: Vittorio Casella
sRTM v4 AsTER v2ALL uRBAN fOREsT fIELD ALL uRBAN fOREsT fIELD
median [m] -1,87 -0,75 -1,11 -2,21 -2,95 -1,69 0,51 -4,50
std2 (1,48∙MAD) [m] 3,98 2,38 11,16 1,61 7,42 5,19 10,78 4,40
rmse2 (median2+std22)0,5 [m] 4,40 2,50 11,22 2,74 7,98 5,46 10,80 6,66
272
273
Envi
ro
nm
Enta
l a
nd
infr
ast
ru
ctu
rEs
En
gin
EEr
ing
Phd
Yea
rboo
k | 2
013contaminants present and their
degree of biodegradation. The results of a study done with the employ of both isotopic fingerprinting and microbial studies offered us a possible solution, because microbial data strengthened the conclusions drawn using only the chemical approach, underlining the mutual influence between the chemical and the microbiological aspects. Considering these results, it was decided to plan a laboratory study with the goal to define a valuable survey instrument, built by coupling compositional and microbial fingerprinting and useful in resolving uncertainties related to the usual procedures applied to characterize the polluted sites. The microbial fingerprinting is the study of the microbial population of the site; the presence of different bacterial strains depends on the environmental conditions and then on the type of contamination present. As consequence, the community composition will vary in relation with the contaminants biodegradation occurring. Through the T-RFLP (Terminal Restriction Fragment Length Polymorphism) analysis on microbial DNA, a chromatogram whereas each peak corresponds to a bacterial strain is obtained. The experiment was planned with the aim to study the biodegradation of gasoline and diesel, once released in the environment, defining which physical-chemical parameters most affect the action of microorganisms in this process. In this sense, we have focused on some parameters that have been already recognized in
the literature as factors that largely effect/limit natural attenuation (i.e. granulometry of the soil, organic matter and concentration of the contaminant) and two other parameters (i.e. presence of mixtures of contamination and salinity).The environmental conditions investigated were reproduced in soil/water microcosms prepared in sealed serum bottles and sampled at four different times (T0=0 days; T1=10 days; T2=70 days; T3=140 days). For each parameters a different number of levels was investigated, specifically two levels for the granulometry (50-50% gravel-sand; 50-50% sand-silt), for the salinity (0.45g/L and 4g/L concentration of sodium chloride), for the organic matter (f
oc=0.002 and foc=0.02) and for the concentration of pollutants (100ppm and 1000ppm). The parameter mixtures was investigated at three levels (100% diesel fuel; 100% gasoline fuel; 50% gasoline+50% diesel). To get the covering of all the combination of variables (parameters) it was employed a fractionated experimental design, reaching a total number of 96 microcosms (24 for each sampling time).At each sampling time, both water and soil were sampled. The samples from the microcosms containing gasoline were analyzed at the GC-MS to verify the presence of its typical volatile organic compounds (VOCs) and to determine their concentrations. With the same instrument but with a different analytical protocol, samples from microcosms containing diesel were analyzed to determine the presence of
semivolatile and non-volatile compounds characteristic of this refinery product. A series of ratios, indicative of the state of degradation of the contaminants, such as B+T/E+X (B=benzene, T=toluene, E=ethylbenzene, X=xylenes) for gasoline and C
17/pristane, C18/phytane for diesel were determined.Soil samples from the all microcosms were also used to determine the composition of the microbial communities, by T-RFLP analyses.The data obtained showed a trend in biodegradation of the contaminants and after elaboration through the program “R” indicated a good correlation between the parameters statistically significant in both the methods used (compositional and microbial fingerprinting). The parameters mainly significant were the contaminant concentrations and the time of sampling. Surprisingly, the salinity was not significant but we suspect that this result is due to the concentrations used. Moreover, the result obtained on a detailed analysis of the T-RFLP profiles showed trend in the communities that might be a useful information for the construction of a survey instrument coupling the two methods. In fact, the profiles change with the changing in contaminant concentration and in particular, at T2, there is an increase of two specific strains in microcosms containing gasoline. This increase correspond at the major decrease in the concentration of the BTEX.
APPLICATION Of hyDROGEOChEMICAL METhODs Of INvEsTIGATION (fINGERPRINTING) TO CONTAMINATED sITEs
Thousands of chemicals are daily employed in our society and many of them can be detected in all the compartments of the environment. Contaminants of particular interest, within this PhD project, are the refined products of crude oil widely used as fuels in cars, aircrafts and ships; for heating and electricity generation, as lubricants in machinery; as asphalt for road and in the production of plastics. Refined products contain complex mixtures of hydrocarbons and non-hydrocarbons (nitrogen-, sulfur- oxygen- and metal containing compounds) and their chemical, physical (i.e. API Gravity and sulfur content), and compositional (such as ratio pristane/phytane and percentage of benzothiophenes) properties vary with the different geographical origin. For this reason, a database of the main characteristics and of the chromatographic profiles of the different worldwide crude oils imported in Italy has been created during this PhD project. Moreover, once in the environment these contaminants are subjected to several weathering processes (physical, chemical and biological) that have as consequence the alteration of their composition and thus of their chromatograms (or fingerprints). Particular interest within this project is
focused on biodegradation, a biological process, occurring naturally but not in all the environmental conditions, in which microorganisms metabolize organic pollutants to inorganic material such as carbon dioxide methane, water and inorganic salts. The different compounds contained in the refined products are more or less susceptible to biodegradation due to their chemical structures. For this reason it is possible to define a temporal sequence starting from the n-alkanes (more susceptible) to the terpanes (less susceptible), leading to the possibility to evaluate compositional changes of the whole contaminant mixture, during the time. This is the core of the analytical methodology called “compositional fingerprinting”, based on the use of a gas chromatography – mass spectrometry (GC-MS). The same evaluation can be reached studying the changes in the isotopic signature of stable isotopes of elements such as carbon, by the analyses performed at the gas chromatography – isotope-ratio mass spectrometry (GC-IRMS). Both the two techniques allow to the identification of the source of contamination among different possible sources and the determination of degradative effects on it. The compositional
methodology pursues these aims by the analysis of the composition of contaminants evaluating the presence and the abundance of individual compounds. The isotopic technique, instead, analyze the differences in the ratio between rare and abundant stable isotopes of a specific chemical element, such as 13C/12C in the case of carbon. The stable isotopes do not decay, but weathering processes can select one isotope over the other, such as during biodegradation, where the weaker 12C-X bonds are broken by microorganisms more easily then the 13C-X bonds, leading to an increase in the value of the ratio.Focusing our attention on compositional fingerprinting, it is important to mention that there are several ratios to measure the biodegradation degree, such as, for diesel, n-C17/pristane and n-C18/phytane, whereas n-alkanes (n-C17 and n-C18) are correlated to the isoprenoids pristane and phytane. This because bacteria preferentially consume the n–alkanes leading to a relative enrichment in abundances of isoprenoids that are less susceptible to biodegradation. During this project, the compositional fingerprinting has been applied to different cases with occasional difficulties in defining exactly the
Ilaria Pietrini - Supervisor: Luca Alberti
contaminants present and their degree of biodegradation. The results of a study done with the employ of both isotopic fingerprinting and microbial studies offered us a possible solution, because microbial data strengthened the conclusions drawn using only the chemical approach, underlining the mutual influence between the chemical and the microbiological aspects. Considering these results, it was decided to plan a laboratory study with the goal to define a valuable survey instrument, built by coupling compositional and microbial fingerprinting and useful in resolving uncertainties related to the usual procedures applied to characterize the polluted sites. The microbial fingerprinting is the study of the microbial population of the site; the presence of different bacterial strains depends on the environmental conditions and then on the type of contamination present. As consequence, the community composition will vary in relation with the contaminants biodegradation occurring. Through the T-RFLP (Terminal Restriction Fragment Length Polymorphism) analysis on microbial DNA, a chromatogram whereas each peak corresponds to a bacterial strain is obtained. The experiment was planned with the aim to study the biodegradation of gasoline and diesel, once released in the environment, defining which physical-chemical parameters most affect the action of microorganisms in this process. In this sense, we have focused on some parameters that have been already recognized in
the literature as factors that largely effect/limit natural attenuation (i.e. granulometry of the soil, organic matter and concentration of the contaminant) and two other parameters (i.e. presence of mixtures of contamination and salinity).The environmental conditions investigated were reproduced in soil/water microcosms prepared in sealed serum bottles and sampled at four different times (T0=0 days; T1=10 days; T2=70 days; T3=140 days). For each parameters a different number of levels was investigated, specifically two levels for the granulometry (50-50% gravel-sand; 50-50% sand-silt), for the salinity (0.45g/L and 4g/L concentration of sodium chloride), for the organic matter (f
oc=0.002 and foc=0.02) and for the concentration of pollutants (100ppm and 1000ppm). The parameter mixtures was investigated at three levels (100% diesel fuel; 100% gasoline fuel; 50% gasoline+50% diesel). To get the covering of all the combination of variables (parameters) it was employed a fractionated experimental design, reaching a total number of 96 microcosms (24 for each sampling time).At each sampling time, both water and soil were sampled. The samples from the microcosms containing gasoline were analyzed at the GC-MS to verify the presence of its typical volatile organic compounds (VOCs) and to determine their concentrations. With the same instrument but with a different analytical protocol, samples from microcosms containing diesel were analyzed to determine the presence of
semivolatile and non-volatile compounds characteristic of this refinery product. A series of ratios, indicative of the state of degradation of the contaminants, such as B+T/E+X (B=benzene, T=toluene, E=ethylbenzene, X=xylenes) for gasoline and C
17/pristane, C18/phytane for diesel were determined.Soil samples from the all microcosms were also used to determine the composition of the microbial communities, by T-RFLP analyses.The data obtained showed a trend in biodegradation of the contaminants and after elaboration through the program “R” indicated a good correlation between the parameters statistically significant in both the methods used (compositional and microbial fingerprinting). The parameters mainly significant were the contaminant concentrations and the time of sampling. Surprisingly, the salinity was not significant but we suspect that this result is due to the concentrations used. Moreover, the result obtained on a detailed analysis of the T-RFLP profiles showed trend in the communities that might be a useful information for the construction of a survey instrument coupling the two methods. In fact, the profiles change with the changing in contaminant concentration and in particular, at T2, there is an increase of two specific strains in microcosms containing gasoline. This increase correspond at the major decrease in the concentration of the BTEX.
APPLICATION Of hyDROGEOChEMICAL METhODs Of INvEsTIGATION (fINGERPRINTING) TO CONTAMINATED sITEs
Thousands of chemicals are daily employed in our society and many of them can be detected in all the compartments of the environment. Contaminants of particular interest, within this PhD project, are the refined products of crude oil widely used as fuels in cars, aircrafts and ships; for heating and electricity generation, as lubricants in machinery; as asphalt for road and in the production of plastics. Refined products contain complex mixtures of hydrocarbons and non-hydrocarbons (nitrogen-, sulfur- oxygen- and metal containing compounds) and their chemical, physical (i.e. API Gravity and sulfur content), and compositional (such as ratio pristane/phytane and percentage of benzothiophenes) properties vary with the different geographical origin. For this reason, a database of the main characteristics and of the chromatographic profiles of the different worldwide crude oils imported in Italy has been created during this PhD project. Moreover, once in the environment these contaminants are subjected to several weathering processes (physical, chemical and biological) that have as consequence the alteration of their composition and thus of their chromatograms (or fingerprints). Particular interest within this project is
focused on biodegradation, a biological process, occurring naturally but not in all the environmental conditions, in which microorganisms metabolize organic pollutants to inorganic material such as carbon dioxide methane, water and inorganic salts. The different compounds contained in the refined products are more or less susceptible to biodegradation due to their chemical structures. For this reason it is possible to define a temporal sequence starting from the n-alkanes (more susceptible) to the terpanes (less susceptible), leading to the possibility to evaluate compositional changes of the whole contaminant mixture, during the time. This is the core of the analytical methodology called “compositional fingerprinting”, based on the use of a gas chromatography – mass spectrometry (GC-MS). The same evaluation can be reached studying the changes in the isotopic signature of stable isotopes of elements such as carbon, by the analyses performed at the gas chromatography – isotope-ratio mass spectrometry (GC-IRMS). Both the two techniques allow to the identification of the source of contamination among different possible sources and the determination of degradative effects on it. The compositional
methodology pursues these aims by the analysis of the composition of contaminants evaluating the presence and the abundance of individual compounds. The isotopic technique, instead, analyze the differences in the ratio between rare and abundant stable isotopes of a specific chemical element, such as 13C/12C in the case of carbon. The stable isotopes do not decay, but weathering processes can select one isotope over the other, such as during biodegradation, where the weaker 12C-X bonds are broken by microorganisms more easily then the 13C-X bonds, leading to an increase in the value of the ratio.Focusing our attention on compositional fingerprinting, it is important to mention that there are several ratios to measure the biodegradation degree, such as, for diesel, n-C17/pristane and n-C18/phytane, whereas n-alkanes (n-C17 and n-C18) are correlated to the isoprenoids pristane and phytane. This because bacteria preferentially consume the n–alkanes leading to a relative enrichment in abundances of isoprenoids that are less susceptible to biodegradation. During this project, the compositional fingerprinting has been applied to different cases with occasional difficulties in defining exactly the
Ilaria Pietrini - Supervisor: Luca Alberti
274
275
Envi
ro
nm
Enta
l a
nd
infr
ast
ru
ctu
rEs
En
gin
EEr
ing
Phd
Yea
rboo
k | 2
013to their gas-to-particle origin,
either from nucleation during cooling and dilution of vehicle exhaust or from photochemical nucleation. Differently, good correlations between number concentration of larger particles (60 < dp < 300 nm) and BC indicate that these particles are primary emission from traffic. To further analyse the relation between PNC measured at a monitoring station and local particle sources, three years data of simultaneous measurement of PNC, PNSD and vertical UFP fluxes measured at a sub-urban site in Helsinki, Finland, were analysed. At present, Eddy-Covariance (EC) measurements of vertical particle fluxes are performed in few cities worldwide representing a promising tool to further investigate air pollution in the urban environment. Vertical UFP fluxes confirm traffic emission as the most important sources of UFP in urban area. The comparative analysis of particle fluxes and concentration, demonstrates that PNSD with a mode in the size range 20-40 nm are more affected by local traffic emissions whereas the mode shifts towards larger sizes when the contribution of distant sources is more evident. Using EC data, particle number emission factors (EF) for a mixed vehicle fleet were estimated and a linear inverse relationship between emission factor and ambient temperature is found. The observed relation agrees with what observed at a traffic exposed site in Po valley where increasing concentrations of nucleation mode particles (dp<30nm) are found for decreasing ambient temperature. These
results highlight the influence of ambient temperature on nucleation processing occurring during cooling and dilution of vehicle exhaust immediately after their released in the atmosphere. The personal exposure to particles in transport microenvironment was investigated by means of experimental campaigns performed at two cities, both Milan and Piacenza, located in Po Valley. PM , UFP and BC exposure concentrations were measured using portable instruments while travelling with different mode of transport. Exposure concentrations are found to vary significantly between transport modes, with PM mass and PNC varying in different ways. The highest values of PM mass concentration are found for subway and bus mode indicating the presence of local sources (i.e. mechanical abrasion, self-pollution, re-suspension). Differently, the highest levels of UFP number concentration characterize either open-air modes (bike and walk) or car mode depending on the type of vehicle considered. The type of car and air ventilation settings in fact are found to play a major role on car passenger exposure to particle, with very high UFP and BC levels measured inside aged car not equipped with air conditioning system. The proximity to traffic significantly affects cyclist and pedestrian exposure to UFP and BC. The separation of the cycle lane from the vehicle lane with a row of parallel parking is observed to provide a reduction of about 1-2 times in UFP and BC exposure concentration, while a reduction
of about 2-4 times is observed choosing a cycle path through a park. Pedestrian exposure concentrations to UFP and BC along trafficked roads are about 1.5-3 and 2.5-5 times higher than those in green areas. On the other hand, cyclist and pedestrian exposure to PM mass is not influenced by proximity to traffic.Besides giving information on UFP levels in Po Valley, the result of the thesis provide information on the relationship between particle sources and UFP levels in urban environments. Such information may constitute valuable knowledge for air quality modelling and particle dispersion studies in urban environments. In particular, the estimated particle number emission factors (EF) for a mixed vehicle fleet and the derived relationship with ambient temperature constitute important input information for air quality modelling. These results show the eddy covariance technique as a useful method to study local particle sources. Furthermore, the study points out the main factors affecting exposure concentration to particle during travelling providing quantitative information that maybe applied in exposure studies as well as to represent valuable information to orient traffic management and mitigation policies.
INvEsTIGATION Of AMBIENT LEvELs AND PERsONAL ExPOsuRE TO fINE AND uLTRAfINE PARTICLEs IN uRBAN ENvIRONMENTs
Atmospheric aerosol particles cause negative effects on human health and urban areas act as hotspots for health risks as both particle sources and human population are concentrated in these areas. Emerging epidemiological and toxicological evidence indicates UltraFine Particles (UFP, particle diameter dp<0.1 µm) to be more toxic than larger particles because of their higher number and surface area per given mass and because of their higher deposition probability in the deep lung region. UFP account for the majority of ambient particles in terms of number, yet they contribute little to the overall particulate mass, thus dedicated measurement of Particle Number Concentration (PNC) with additional information provided by the Particle Number Size Distribution (PNSD) are needed to study UFP. Despite measurements of PNC and PNSD have been implemented both in urban areas and remote sites during the last decade, the knowledge on urban UFP appears still limited compared with the complexity of the phenomenon. For instance, scarce evidence exists on UFP levels in areas like Po Valley, Italy, a well-known air pollution hotspot in Europe. Moreover, the comprehension of the relationship between particle sources and ambient
UFP levels is incomplete. PNC and PNSD measurement at fixed station are necessary to investigate particle sources and atmospheric behaviours, however they may not be representative of the actual exposure of the population. Recent studies suggest that, due to the proximity to traffic emissions, exposure to high particle concentration occurs in transport microenvironments. Therefore information on particle concentrations in these microenvironments are needed for reliable assessment of population exposure. To address these limitations in knowledge, this thesis presents a comprehensive investigation on fine and ultrafine particle in urban environments. Two are the main objectives: (1) To provide information on ambient levels of UFP, their sources and atmospheric behaviour in urban area; (2) To provide information on the personal exposure to fine and ultrafine particles in transport microenvironment, that is in indoor/outdoor environments directly affected by emissions from means of transport. To this purpose, measurements of PNC and PNSD were performed at three different sites: a traffic exposed, an urban background and a rural site located in Po Valley during different periods from April 2011 to November 2012. In addition,
a short-term campaign for the measurement of Black Carbon (BC), tracer of combustion related particles, was performed at the traffic exposed site. Traffic emissions are indicated as the most important source of UFP in urban area. Higher PNC are found for traffic exposed site than for urban background and rural site. Considering size segregated PNC, contrasts between sites are found to increase with decreasing particle size. UFP show to be strongly affected by the contribution of local sources (i.e. traffic emission), whereas concentrations of larger particles appear mainly influenced by regional background. Urban sites exhibit a well-defined PNC diurnal cycle influenced by traffic intensity and atmospheric mixing height, whereas any clear diurnal cycle is observed at the rural site. Moreover, secondary particles formed via photochemical nucleation also contribute to PNC measured at urban sites during warm months as highlighted by the occurrence of a midday peak in PNC. All sites display a seasonal variation of PNC with higher values during cold months. Joint analysis of PNC, SD and BC data shows that the concentration of nucleation mode particles (dp < 30nm) may exhibit a temporal variability different from that of primary vehicle emissions due
Giovanna Ripamonti - Supervisor: Giovanni Lonati
276
277
Envi
ro
nm
Enta
l a
nd
infr
ast
ru
ctu
rEs
En
gin
EEr
ing
Phd
Yea
rboo
k | 2
013the technology, pretreatments
should be tested in continuous reactors, not only regarding the methane enhancement but also considering the energetic, economic and environmental assessments. In this context, the main objectives of the PhD thesis are: 1) to evaluate the effect of different pretreatment strategies (mechanical, thermal, alkaline, enzymatic, fungal and combination of them) on chemical composition and methane production of two lignocellulosic substrates (wheat straw and one variety of sorghum); 2) to evaluate the influence of six varieties of sorghum on alkaline pretreatment performances; 3) to evaluate the applicability and implementation of a pretreatment method in a continuous reactor system. To this purpose, mechanical (through milling at 2-0.25 mm of particle size reductions), alkaline (at different NaOH dosages), thermal (between 40°C and 160°C), enzymatic (both with commercial enzymes and fungal enzymatic extracts) and combination of them were performed. Chemical and infra red spectroscopy (FTIR) analyses were also performed in order to characterize untreated and pretreated samples and to evaluate the effect of such pretreatment on their compositional and structural features. Biochemical Methane Potential (BMP) batch tests were performed in order to valuate the effect of each pretreatment method on methane production potential. Finally, the benefit provided by the best pretreatment condition obtained in batch test, for
one variety of sorghum, was validated in an anaerobic semi-continuous reactor. Methane yields of 269±22 NmL
CH4/gVS and 204±17 NmLCH4/gVS, were found for untreated ensiled sorghum forage and wheat straw, respectively. Results about pretreatments showed that all treatments tested led to a solubilisation of cellulose, hemicelluloses and lignin for both substrates, with more or less success. As for mechanical pretreatment performed on ensiled sorghum forage, the main conclusion is that milling did not improve methane production nor anaerobic digestion kinetics (kh = 0.11±0.01 d-1) between 2 and 0.25 mm of particle size reduction. On the contrary, by adding sodium hydroxide, an increase in both methane yield (20%) and kinetic constants (up to 53%) was observed, due to the effect of the alkaline agent (10 gNaOH/100gTS), but these results were not significantly influenced by the particle size reduction. Biological pretreatments, performed with commercial enzymatic preparations (xylanase, endo and eso-glucanase), led to a solubilisation of cellulose and hemicelluloses, thus enhancing methane production of both substrates (12% and 40%, for sorghum and wheat straw, respectively). On the contrary, biological pretreatments performed with an enzymatic extract of a fungal strain, did not improve methane production, probably because it did not affect the structure of the substrates. Among alkaline, thermal and thermo-alkaline pretreatments, the highest lignin reduction, compared to
untreated samples, was found by applying pretreatments at 100°C with 10 gNaOH/100gTS dosage (49% and 44% for sorghum and wheat straw, respectively). This led to the highest increase in methane yield, compared to the untreated substrate (32% and 67% for sorghum and wheat straw, respectively). However, as for sorghum, the same methane increase was observed at lower temperature (T = 40°C) with the same alkaline dosage (10 gNaOH/100gTS). For this reason, this pretreatment condition, as the best, was chosen to be validated in a semi-continuous anaerobic reactor. Interestingly, it was observed that alkaline pretreatment performance can be affected by the substrate variety. Indeed, in the case of five varieties of sorghum different from the previous one tested, alkaline pretreatment did not have an influence on methane yields, but it had only a benefit effect on the hydrolysis step, by accelerating the kinetic. Finally, results from anaerobic continuous reactors showed that an alkaline pretreatment step, prior to the anaerobic digestion of ensiled sorghum forage, can have a benefit effect both in enhancing methane production (an increase of 25% on methane production was observed) and in giving more stability to the anaerobic digestion process.
PhysICAL, ChEMICAL AND BIOLOGICAL PRETREATMENTs TO ENhANCE BIOGAs PRODuCTION fROM LIGNOCELLuLOsIC suBsTRATEs
Nowadays some 85% of the world’s overall energy supply is derived from fossil fuels, which contribute to many environmental damages, the main being global warming. Current energy policies address the use of renewable energy sources (i.e. wind, solar, hydraulic, geothermal, and biomasses) in order to reduce greenhouse gas emissions, as well as to increase energy security. In this context, lignocellulosic substrates (i.e. agricultural residues and energy crops) can offer a potential for the production of biofuels (i.e. bioethanol, biogas and biohydrogen). Among them, the production of methane through anaerobic digestion has different advantages as compared to bioethanol production or biohydrogen through dark fermentation. Firstly, contrarily to bioethanol, derived only from cellulose fermentation, biohydrogen and methane can be produced through the conversion of both cellulose and hemicelluloses fractions, with higher energy potential recovery than biohydrogen. Secondly, compared to bioethanol (used only as liquid fuel), methane, once purified and compressed, can be injected in natural gas grid to be used as vehicle fuel or for municipal uses; it can be also used to produce heat and electricity, through cogeneration
(Combined Heat Power) systems. Finally, contrarily to residues produced by bioethanol and biohydrogen processes which need to be treated, those of anaerobic digestion, called digestates, are mainly composed of stabilised organic materials which can be enriched in nitrogen and phosphorus and can thus be used as fertilisers for the agricultural substrates growth. The main challenge in using lignocellulosic substrates, such as agricultural residues and energy crops, for biogas production, is their structure and composition. Crop biomasses mainly consist of cellulose, hemicelluloses and lignin, which vary quantitatively and qualitatively according to the plant origin. Despite cellulose and hemicelluloses are degradable by anaerobic microorganisms, during anaerobic digestion, some compositional and structural features (i.e. the presence of lignin, the crystalline structure of cellulose and its accessible surface area) can limit their degradation. Thus, various methods of pre-treatment, originally investigated for the production of second generation bioethanol, have been quite applied in order to alter the structure of lignocellulosic substrates, facilitating their enzymatic hydrolysis and consequent to enhance
their methane production. Pretreatments are normally divided into three categories: physical (i.e. mechanical, ultrasound, microwaves, steam explosion, liquid hot water…), chemical (i.e. alkaline, acidic, oxidative, ionic liquids, wet oxidation, inorganic salts,) and biological (enzymatic, fungal) or their combination. In literature, pretreatment categories were applied with more or less success to enhance methane production of a wide range of lignocellulosic substrates. Nevertheless, the high variability of pretreatment conditions, methods and results, even when similar substrates are compared, suggest that no definite consensus on their effectiveness for the improvement of the anaerobic biodegradability of agro-wastes and energy crops has yet been attained. Thus, a comparison between many different types of pretreatment applied on the same substrate can be useful in order to define the best pretreatment strategy for a single substrate. Moreover, due to the high variability of methane potential and pretreatments results, depending not only on substrate type but also in crop variety, the same pretreatment has to be tested on other lignocellulosic substrates with different chemical and structural composition. To finish, for a future scale-up of
Cecilia Sambusiti - Supervisor: Francesca Malpei
278
279
Envi
ro
nm
Enta
l a
nd
infr
ast
ru
ctu
rEs
En
gin
EEr
ing
Phd
Yea
rboo
k | 2
013The server side such as Map
Server and GeoServer they are available to share, add, convert and edit geospatial data on the Internet via open standard eg: WMS, WFS, WCS, etc. The client side is supported by many frameworks such as Openlayers, Mapfish, etc, they are almost satisfying the basic tool for implementing Web-GIS in client side.To fulfill the requisite of Web-GIS needs istSOS and ZOO-Project software. The istSOS is Senser Observation Service (SOS) software, istSOS not only implements the core profile including: GetCapabilities, GetObservation, DescribeSensor, but it also processes the transactional profile such as RegisterSensor, InsertObservation. ZOO-Project includes ZOO Kernel and ZOO Service Provider. ZOO Kernel makes possible to create, manage and chain WPS 1.0.0 compliant Web Services.
WEB-GIS IMPLEMENTATIONThis section presents a Decision System and an Intelligent Geoportal for North Vietnam based on Web Service allowing users to investigate satellite rainfall by means of a direct comparison and of the Revised Universal Soil Loss Equation (RUSLE) model. The comparison method uses data from Precipitation Estimation from PERSIANN and rain gauges (RG)
Intelligent GeoportalIntelligent Geoportal was implemented based on WMS, WFS and SOS. Historical series of rainfall, discharge, and etc from 1956 to 2004 measured by gauges/sensors at hydrological or hydro-meteorological stations are registered into SOS system by
using transactional profile. Users can request any type of data at any time periods; requests are answered by means of maps, text and statistics charts. ZOO-Project can be used to access the data in the database inside PostgreSQL system and then calculate all statistics indexes (media, standard deviation, etc).
Decision Support System: Interpolation and visualizationWPS can access data by connecting to the PostgreSQL. From 19 rainfall gauges data set, it is possible to estimate rainfall spatial distribution (RSD) within an area. GRASS software package can be invoked from ZOO service provider to implement interpolation RSD. Visualization of the PERSIANN data, this method presents the new enhancement of ZOO Project: its support for Standard Web Services Outputs. ZOO-Kernel handle the WMS, WFS and WCS publication automatically by using open source library for accessing raster and vector properties and the MapServer library for publishing Standard Web Services. The client can then access the output data by requesting MapServer as a WMS, a WFS or a WCS server.
Comparisons between rain gauges and PERSIANN dataTwo database sources exist one for rain gauge RG data and the other one for the PERSIANN one. By accessing two data sets through database, a WPS service was created to connect database and to analyze the correlation and percentage of simultaneous rain or no-rain between them.
Soil loss computationThe RUSLE is product of R (rainfall-runoff), K (the soil
erodibility), L (slope length); S (slope steepness); C (soil loss ratio); P (ratio of soil loss based on contouring and vegetation covers) factors.In the system, LS, C, K, P factors were derived from Atlas-Vietnam maps in the years 2000/2004 and DEM images. WPS is able to query the two database sources (PERSIANN and RG) and invoke GRASS functions in order to use r.mapcalc to calculate soil erosion maps and to report all the results. All processes were made available based on GRASS-based WPS.
CONCLUSION Intelligent Geoportal and its DSS named HDI4NVN. The aim is not only to improve WebGIS existing but also to extend functionality such as: supporting numerous base maps, visualization under the form of maps, tables and charts of sensor data series corresponding to long periods of time. The correlations in short time (daily interval) are extremely low. However, the correlation of month accumulation between gauge and PERSIANN data almost indicates strong linear relationship (the correlation coefficients of the 19 stations are larger than 0.7). The best correlation corresponds to year 2002, at Tuan Giao station, and it is about 0.95. Applying RUSLE in the study area with the two datasets, the difference in percentage varies from 0.02% to 0.04%. In our future work we would like to select and apply some hydraulic models to enrich the functionalities of the DSS and, at the same time, to continue to investigate the PERSIANN dataset.
hDI4NvN– hyDROLOGICAL DATA INfRAsTRuCTuRE fOR NORTh vIETNAM
INTRODUCTIONThe purpose of this synthesis is to summarize the major of theory, method, implementation and experiments those are focus in the dissertation. The structure of dissertation includes: ∙ The purpose of the study; ∙ Data used; ∙ Web-GIS and its components; ∙ Open Geospatial Consortium (OGC) standards;
∙ Open Source frameworks; ∙ Intelligent Geoportal and Decision Support System implementations;
∙ Conclusion
PURPOSE OF THE STUDY This section presents an overview about study area (the north of Vietnam) where exists many type of natural disasters in the fast. The objective of this chapter turns around an importance of the Spatial Data Infrastructure (SDI), Geoportal, Intelligent Geoportal and Decision support system (DSS). A Geoportal can understand as a website to be an entry point to geographic contents on the web. Intelligent Geoportal was mentioned as a Geoportal that provides complex functionality through user interface for a user in a specific application domain. In addition, some of the best recent Geoportals are also mentioned in this chapter. GIS tools are now commonly used in Spatial Decision Support System (SDSS) for many models such as
hydrologic, landslide, flood, and so on.Finally, this section presents motivations in order to explain why it needs to build Intelligent Geoportal (IG) for study area and Decision Support System integrated inside IG.
DATA USED This section presents about data used and how to process them. Data used including two distinct sub-groups, the former group can be named the remote sensed data (RS) and GIS (Geographic Information System) data, the second group consists of measured data.Group 1: Remote Sensed Data includes Landsat TM, Landsat ETM+, ASTER, SRTM, precipitation data from PERSIANN data (Precipitation Estimation from Remotely Sensed Information using Artificial Neural Networks);GIS data contains stations, roads, rainfall iso-line, contour lines, provinces, soil map, forest cover map, etc. Group 2: Measuring data was issued by the Institute of Water Resources Planning of Vietnam (WRP), they include rainfall, evaporation, discharge, water level, and inflow and reservoir data from 1956 to 2004/2008 in daily.
WEB-GISThe important components of the Web-GIS was concentrated
in this section, they are combined of two technologies: Internet technology and Geographic Information System (GIS). Not only fundamental of internet technology such as HTTP, TCP/IP, URL, HTML is presented in this section, but also Web-GIS strategy including client/server architecture, common gateway interfaces (CGI) model, client-server interactive, client and server side are clarified.
OGC STANDARDS Numerous of OGC web services are mentioned in this section. The most used OGC standard such as Web Map Service (WMS) for providing maps of geo-referenced data over internet, Web Feature Service (WFS) provides an interface allowing requests for geographical features across the web. Beside these “classic” services, the almost new OGC Sensor Web Enablement (SWE) defines opportunities for connecting in real-time heterogeneous sensors over the internet. Furthermore, OGC Web Processing Service is also presented as interoperability standards providing rules for standardizing input and output data.
OGC FRAMWORKS The goal of this chapter explores about Open Source Software (OSS) frameworks and libraries.
Truong Xuan Quang - Supervisor: Maria Antonia Brovelli
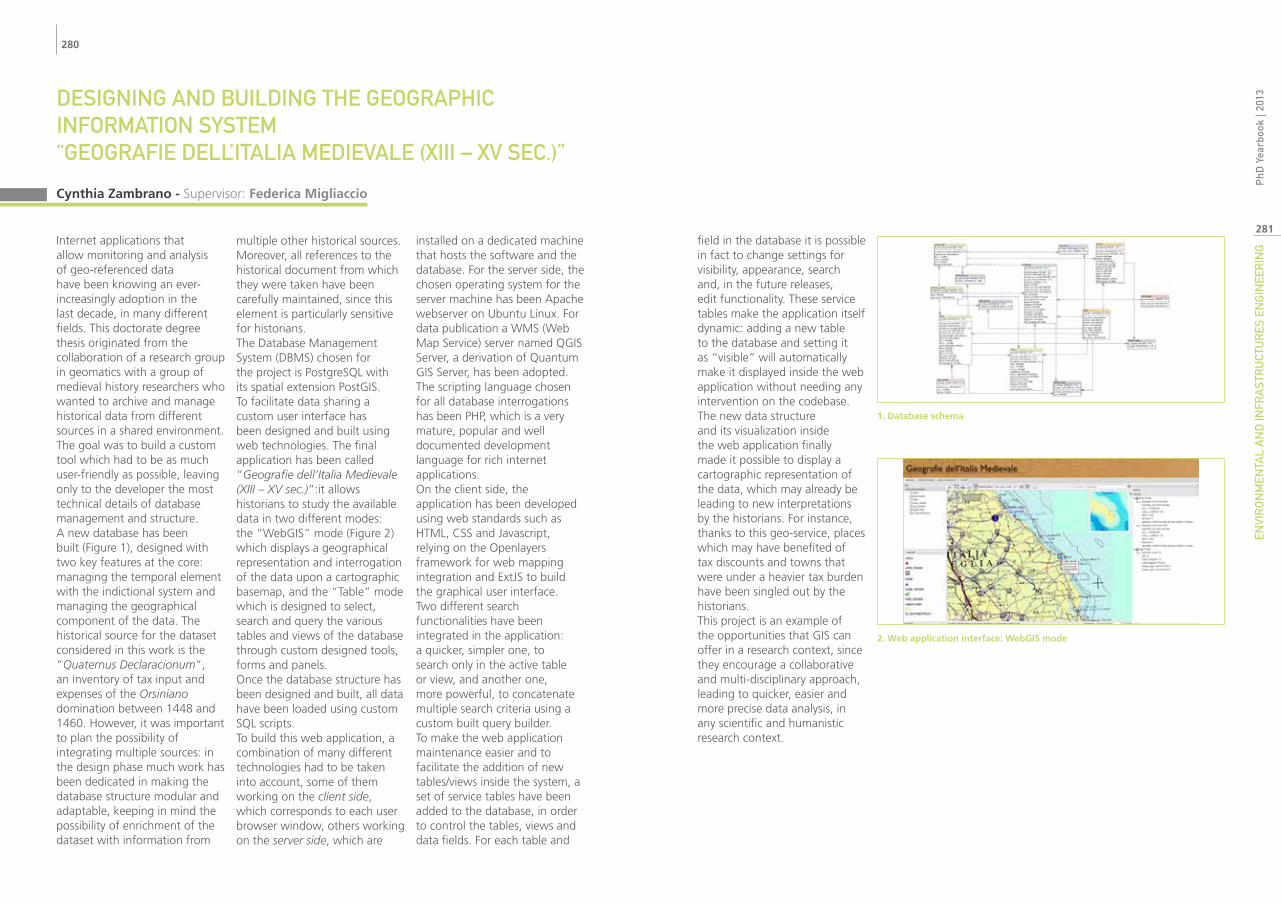
280
281
Envi
ro
nm
Enta
l a
nd
infr
ast
ru
ctu
rEs
En
gin
EEr
ing
Phd
Yea
rboo
k | 2
013
field in the database it is possible in fact to change settings for visibility, appearance, search and, in the future releases, edit functionality. These service tables make the application itself dynamic: adding a new table to the database and setting it as “visible” will automatically make it displayed inside the web application without needing any intervention on the codebase.The new data structure and its visualization inside the web application finally made it possible to display a cartographic representation of the data, which may already be leading to new interpretations by the historians. For instance, thanks to this geo-service, places which may have benefited of tax discounts and towns that were under a heavier tax burden have been singled out by the historians.This project is an example of the opportunities that GIS can offer in a research context, since they encourage a collaborative and multi-disciplinary approach, leading to quicker, easier and more precise data analysis, in any scientific and humanistic research context.
DEsIGNING AND BuILDING ThE GEOGRAPhIC INfORMATION sysTEM “GEOGRAfIE DELL’ITALIA MEDIEvALE (xIII – xv sEC.)”
Internet applications that allow monitoring and analysis of geo-referenced data have been knowing an ever-increasingly adoption in the last decade, in many different fields. This doctorate degree thesis originated from the collaboration of a research group in geomatics with a group of medieval history researchers who wanted to archive and manage historical data from different sources in a shared environment. The goal was to build a custom tool which had to be as much user-friendly as possible, leaving only to the developer the most technical details of database management and structure. A new database has been built (Figure 1), designed with two key features at the core: managing the temporal element with the indictional system and managing the geographical component of the data. The historical source for the dataset considered in this work is the “Quaternus Declaracionum”, an inventory of tax input and expenses of the Orsiniano domination between 1448 and 1460. However, it was important to plan the possibility of integrating multiple sources: in the design phase much work has been dedicated in making the database structure modular and adaptable, keeping in mind the possibility of enrichment of the dataset with information from
multiple other historical sources. Moreover, all references to the historical document from which they were taken have been carefully maintained, since this element is particularly sensitive for historians. The Database Management System (DBMS) chosen for the project is PostgreSQL with its spatial extension PostGIS. To facilitate data sharing a custom user interface has been designed and built using web technologies. The final application has been called “Geografie dell’Italia Medievale (XIII – XV sec.)”:it allows historians to study the available data in two different modes: the “WebGIS” mode (Figure 2) which displays a geographical representation and interrogation of the data upon a cartographic basemap, and the “Table” mode which is designed to select, search and query the various tables and views of the database through custom designed tools, forms and panels.Once the database structure has been designed and built, all data have been loaded using custom SQL scripts. To build this web application, a combination of many different technologies had to be taken into account, some of them working on the client side, which corresponds to each user browser window, others working on the server side, which are
installed on a dedicated machine that hosts the software and the database. For the server side, the chosen operating system for the server machine has been Apache webserver on Ubuntu Linux. For data publication a WMS (Web Map Service) server named QGIS Server, a derivation of Quantum GIS Server, has been adopted.The scripting language chosen for all database interrogations has been PHP, which is a very mature, popular and well documented development language for rich internet applications.On the client side, the application has been developed using web standards such as HTML, CSS and Javascript, relying on the Openlayers framework for web mapping integration and ExtJS to build the graphical user interface.Two different search functionalities have been integrated in the application: a quicker, simpler one, to search only in the active table or view, and another one, more powerful, to concatenate multiple search criteria using a custom built query builder.To make the web application maintenance easier and to facilitate the addition of new tables/views inside the system, a set of service tables have been added to the database, in order to control the tables, views and data fields. For each table and
Cynthia Zambrano - Supervisor: Federica Migliaccio
1. Database schema
2. Web application interface: WebGIS mode


![[XLS]mcdonline.gov.inmcdonline.gov.in/tri/edmc_mcdportal//content/Beat List... · Web view1 1 240 51900302 2 2 240 51900303 3 3 240 51900295 4 4 240 51900277 5 5 240 51900279 6 6](https://img.pdfslide.us/doc/110x75/5afe96fd7f8b9a994d8f3340/xls-listweb-view1-1-240-51900302-2-2-240-51900303-3-3-240-51900295-4-4-240.jpg)