Embed Size (px)
Citation preview
© 2020 RSM US LLP. All Rights Reserved. © 2020 RSM US LLP. All Rights Reserved.
© 2020 RSM US LLP. All Rights Reserved.
RSM ECONOMIC OUTLOOK The state of the economy as businesses reopen
June 18, 2020

© 2020 RSM US LLP. All Rights Reserved.
Presenter
3
New York, NY
+1 212 372 1502
Kevin DepewDeputy Chief Economist, National Industry Analyst Program Leader
© 2020 RSM US LLP. All Rights Reserved.
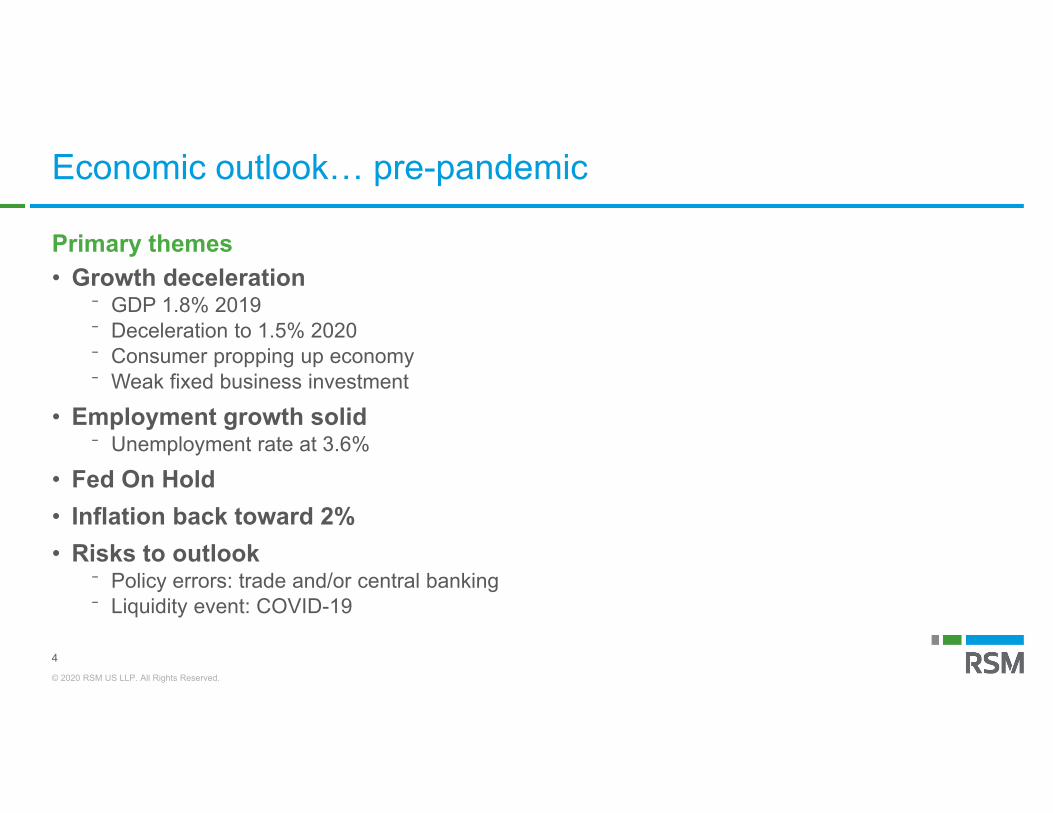
Economic outlook… pre-pandemic
Primary themes• Growth deceleration
⁻ GDP 1.8% 2019⁻ Deceleration to 1.5% 2020⁻ Consumer propping up economy⁻ Weak fixed business investment
• Employment growth solid⁻ Unemployment rate at 3.6%
• Fed On Hold• Inflation back toward 2% • Risks to outlook
⁻ Policy errors: trade and/or central banking⁻ Liquidity event: COVID-19
4
© 2020 RSM US LLP. All Rights Reserved.
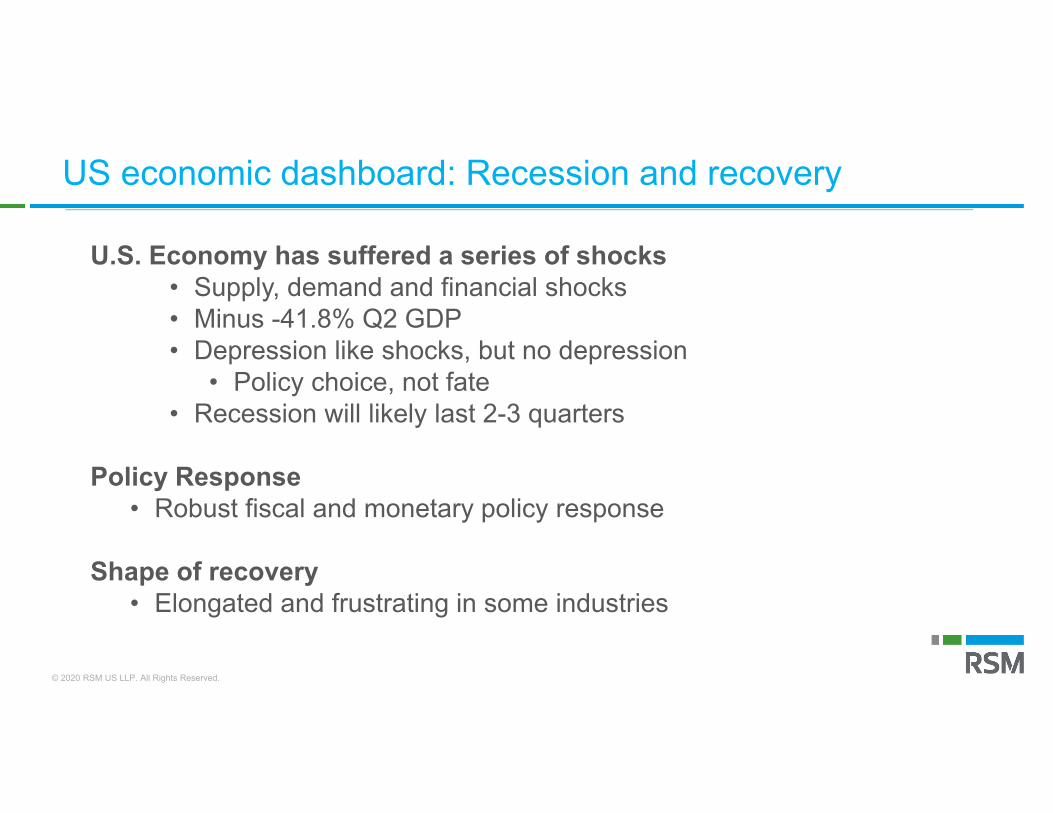
US economic dashboard: Recession and recovery
U.S. Economy has suffered a series of shocks• Supply, demand and financial shocks• Minus -41.8% Q2 GDP • Depression like shocks, but no depression
• Policy choice, not fate • Recession will likely last 2-3 quarters
Policy Response• Robust fiscal and monetary policy response
Shape of recovery• Elongated and frustrating in some industries
© 2020 RSM US LLP. All Rights Reserved.
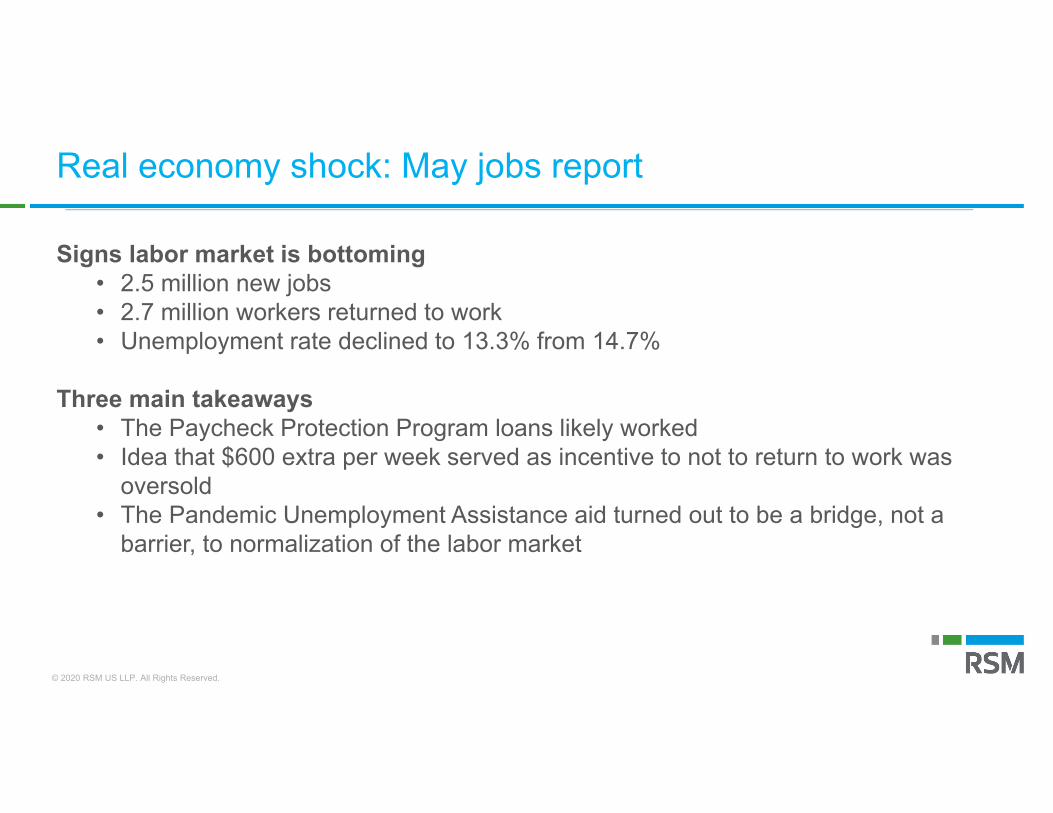
Real economy shock: May jobs report
Signs labor market is bottoming• 2.5 million new jobs• 2.7 million workers returned to work• Unemployment rate declined to 13.3% from 14.7%
Three main takeaways• The Paycheck Protection Program loans likely worked• Idea that $600 extra per week served as incentive to not to return to work was
oversold• The Pandemic Unemployment Assistance aid turned out to be a bridge, not a
barrier, to normalization of the labor market
© 2020 RSM US LLP. All Rights Reserved.
7
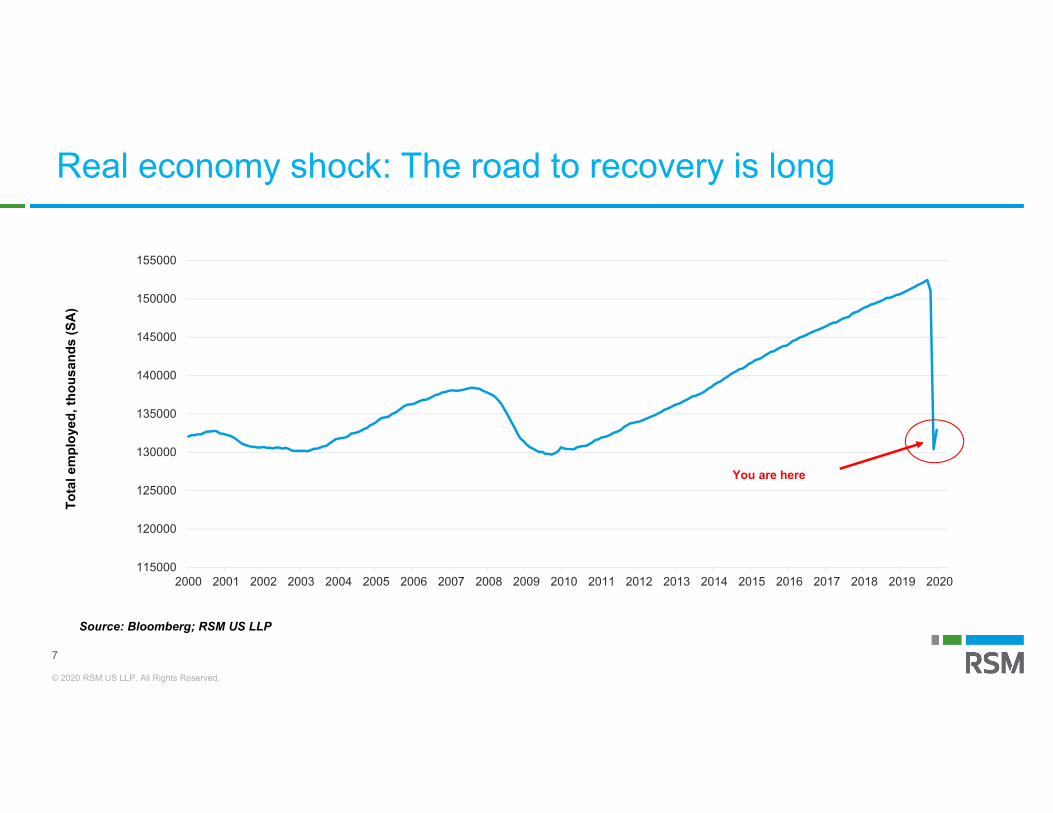
115000
120000
125000
130000
135000
140000
145000
150000
155000
2000 2001 2002 2003 2004 2005 2006 2007 2008 2009 2010 2011 2012 2013 2014 2015 2016 2017 2018 2019 2020
Tota
lem
ploy
ed, t
hous
ands
(SA
)
Source: Bloomberg; RSM US LLP
You are here
Real economy shock: The road to recovery is long
© 2020 RSM US LLP. All Rights Reserved.
Real economy shock: Labor market
Labor market shock• 60 million jobs at risk• Damage implies -40% Q2 GDP
Initial jobless claims• 45.7 million jobs lost in 13 weeks• About 27.2% of those who held jobs prior to the pandemic have filed for
unemployment
Unemployment• ~20-25% peak in 2020, returning to ~10% by year’s end
© 2020 RSM US LLP. All Rights Reserved.
9
0
10
20
30
40
50
60
70
80
90
100
0
100
200
300
400
500
600
700
800
900
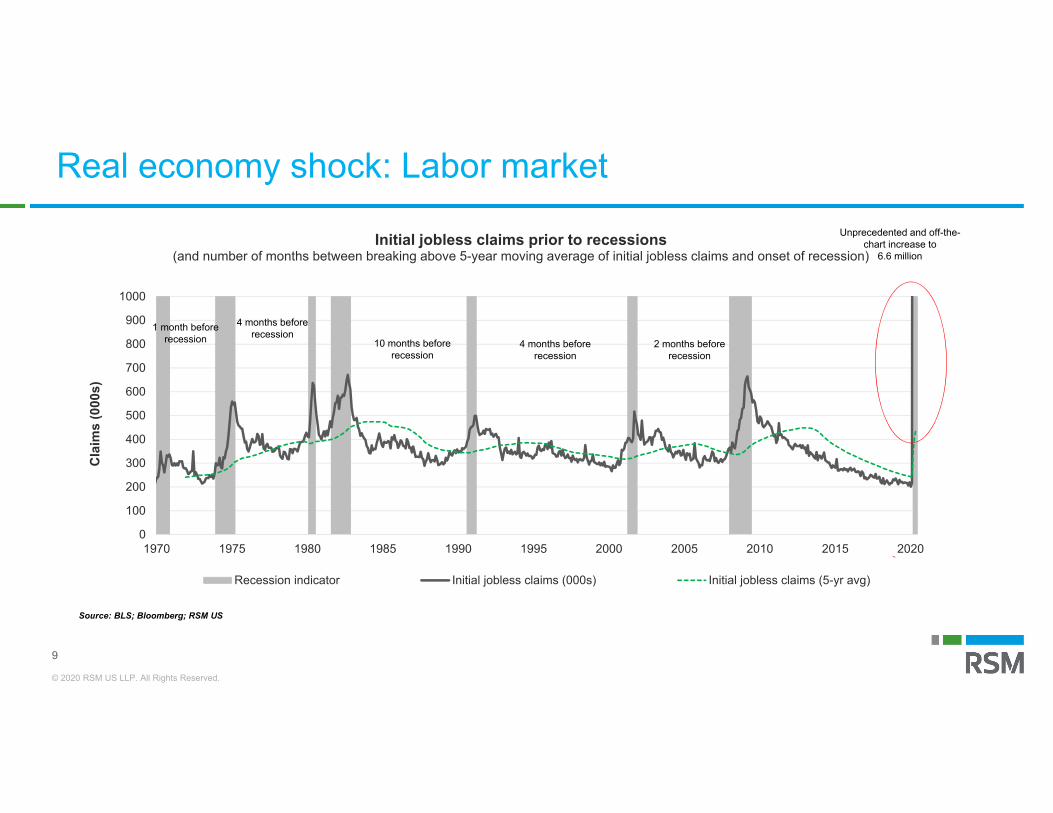
1000
1970 1975 1980 1985 1990 1995 2000 2005 2010 2015 2020
Cla
ims
(000
s)
Initial jobless claims prior to recessions(and number of months between breaking above 5-year moving average of initial jobless claims and onset of recession)
Recession indicator Initial jobless claims (000s) Initial jobless claims (5-yr avg)
Source: BLS; Bloomberg; RSM US
10 months beforerecession
4 months beforerecession
2 months beforerecession
4 months beforerecession
1 month beforerecession
Unprecedented and off-the-chart increase to
6.6 million
Real economy shock: Labor market
© 2020 RSM US LLP. All Rights Reserved.
10
Real economy shock: Labor market
0
10
20
30
40
50
60
70
80
90
100
0
5,000
10,000
15,000
20,000
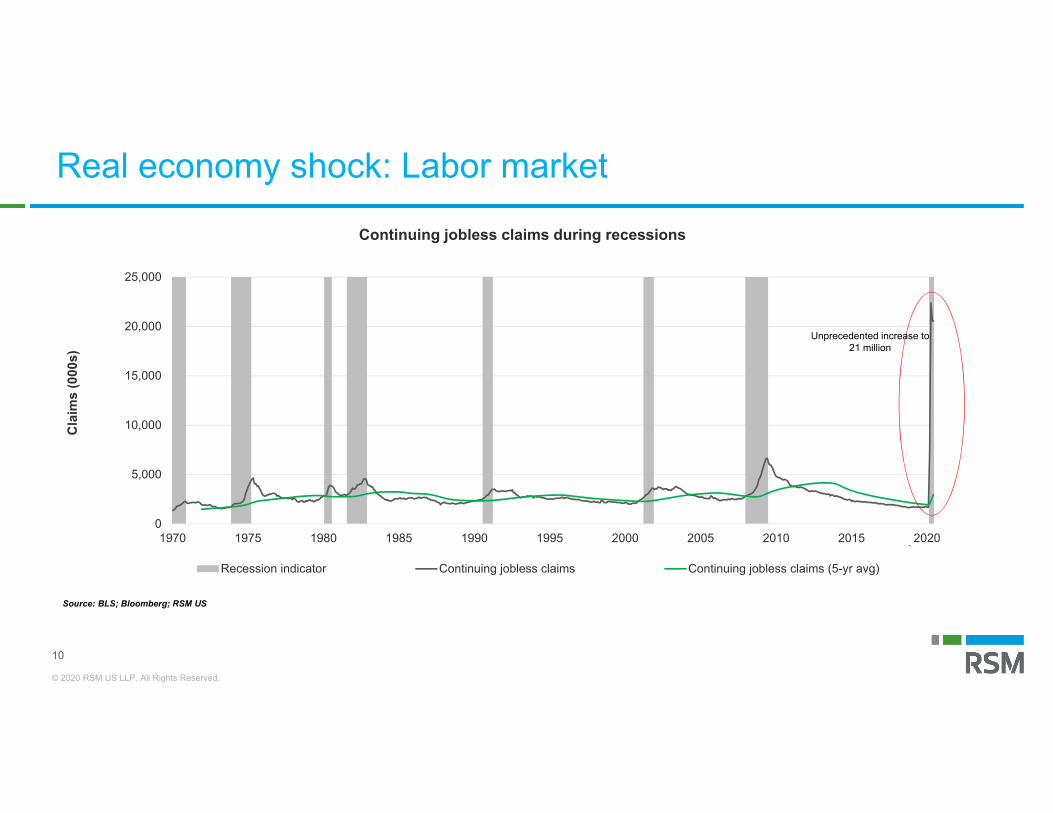
25,000
1970 1975 1980 1985 1990 1995 2000 2005 2010 2015 2020
Cla
ims
(000
s)
Continuing jobless claims during recessions
Recession indicator Continuing jobless claims Continuing jobless claims (5-yr avg)
Source: BLS; Bloomberg; RSM US
Unprecedented increase to21 million
© 2020 RSM US LLP. All Rights Reserved.
Real GDP implications
11
-60
-40
-20
0
20
40
60
80
100-6
-4
-2
0
2
4
6
8
10
1970 1975 1980 1985 1990 1995 2000 2005 2010 2015 2020
Initial Jobless Claim
s (YOY %
)
Rea
l GD
P (Y
OY
%)
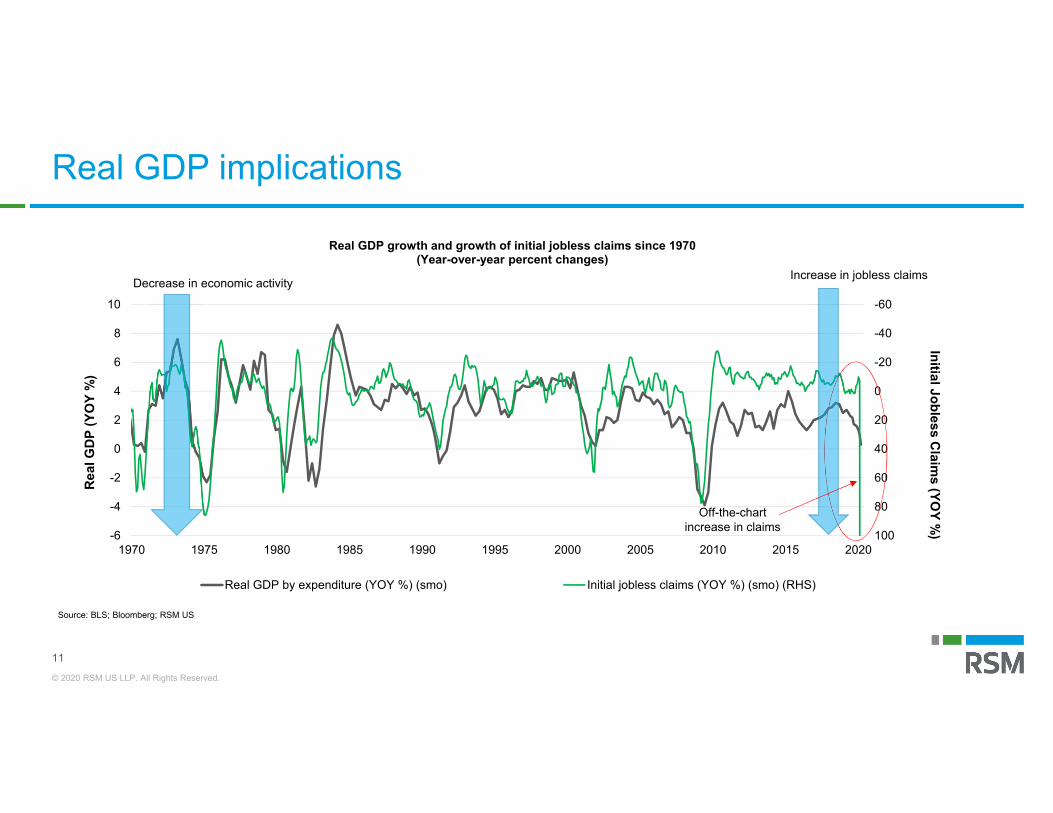
Real GDP growth and growth of initial jobless claims since 1970(Year-over-year percent changes)
Real GDP by expenditure (YOY %) (smo) Initial jobless claims (YOY %) (smo) (RHS)
Source: BLS; Bloomberg; RSM US
Decrease in economic activityIncrease in jobless claims
Off-the-chartincrease in claims
© 2020 RSM US LLP. All Rights Reserved.
Polling question
Assuming a full reopening of the economy, do you anticipate changing your attitude toward shopping and spending ?
a) No change; I will shop and spend the same as beforeb) I may be slightly more cautious c) I intend to permanently change my shopping and spending behavior
12
© 2020 RSM US LLP. All Rights Reserved.
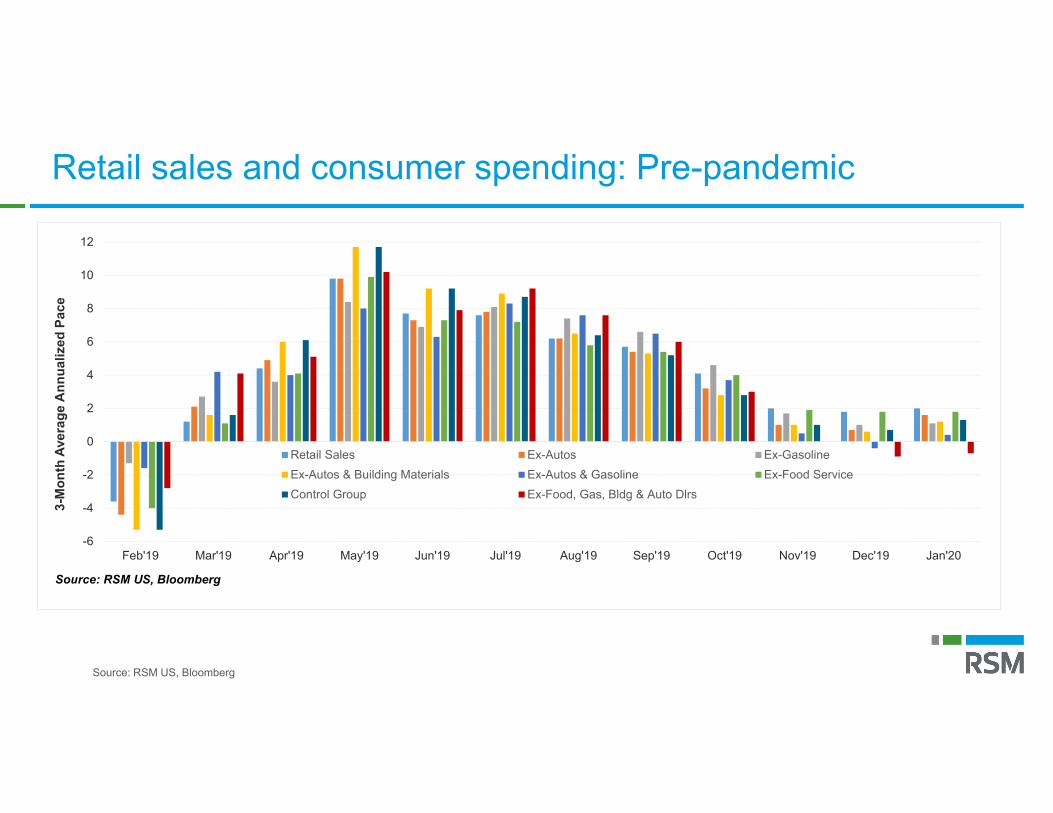
Retail sales and consumer spending: Pre-pandemic
13Source: RSM US, Bloomberg
-6
-4
-2
0
2
4
6
8
10
12
Feb'19 Mar'19 Apr'19 May'19 Jun'19 Jul'19 Aug'19 Sep'19 Oct'19 Nov'19 Dec'19 Jan'20
3-M
onth
Ave
rage
Ann
ualiz
ed P
ace
Retail Sales Ex-Autos Ex-GasolineEx-Autos & Building Materials Ex-Autos & Gasoline Ex-Food ServiceControl Group Ex-Food, Gas, Bldg & Auto Dlrs
Source: RSM US, Bloomberg
© 2020 RSM US LLP. All Rights Reserved.
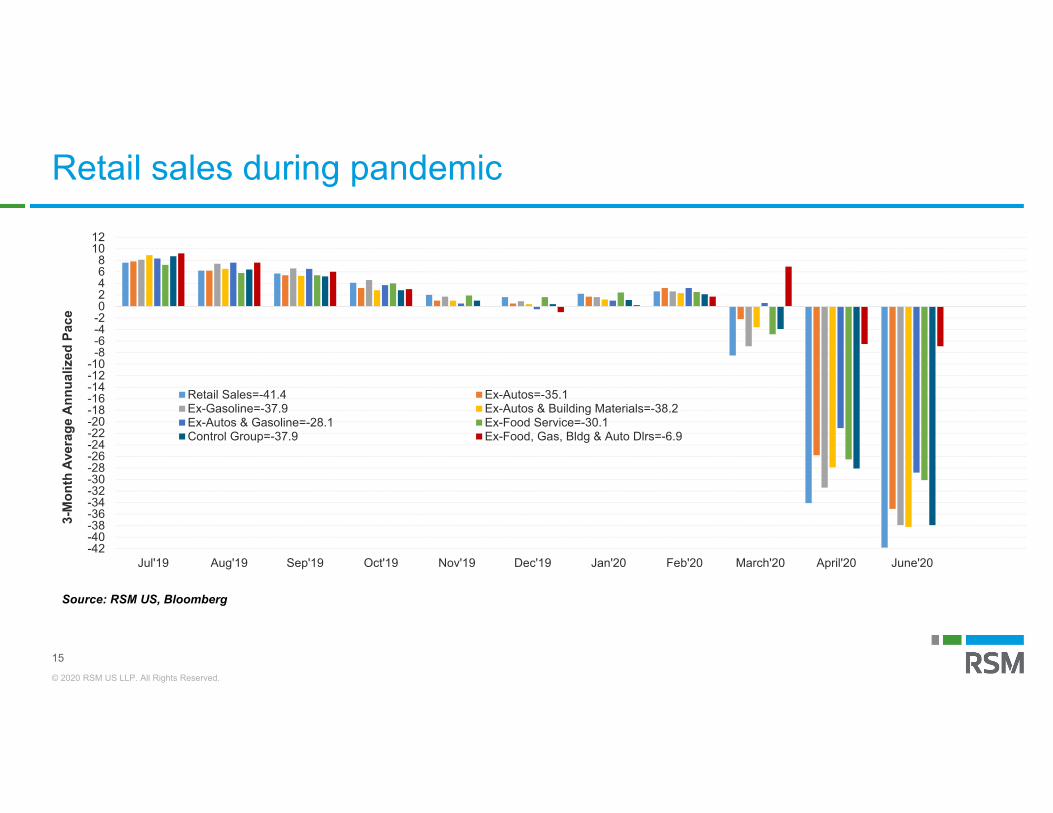
Retail sales
A welcome report…⁻ 17.7% increase in topline retail sales⁻ Largest month-over-month increase in record
But…⁻ Increase in retail sales captures one-time return of pent-up demand⁻ Three-month average annualized pace remains at -41.4%⁻ Retail sales report captures ~29% of consumption; services accounts for
the rest
14
© 2020 RSM US LLP. All Rights Reserved.
Retail sales during pandemic
15
-42-40-38-36-34-32-30-28-26-24-22-20-18-16-14-12-10
-8-6-4-202468
1012
Jul'19 Aug'19 Sep'19 Oct'19 Nov'19 Dec'19 Jan'20 Feb'20 March'20 April'20 June'20
3-M
onth
Ave
rage
Ann
ualiz
ed P
ace
Retail Sales=-41.4 Ex-Autos=-35.1Ex-Gasoline=-37.9 Ex-Autos & Building Materials=-38.2Ex-Autos & Gasoline=-28.1 Ex-Food Service=-30.1Control Group=-37.9 Ex-Food, Gas, Bldg & Auto Dlrs=-6.9
Source: RSM US, Bloomberg
© 2020 RSM US LLP. All Rights Reserved.
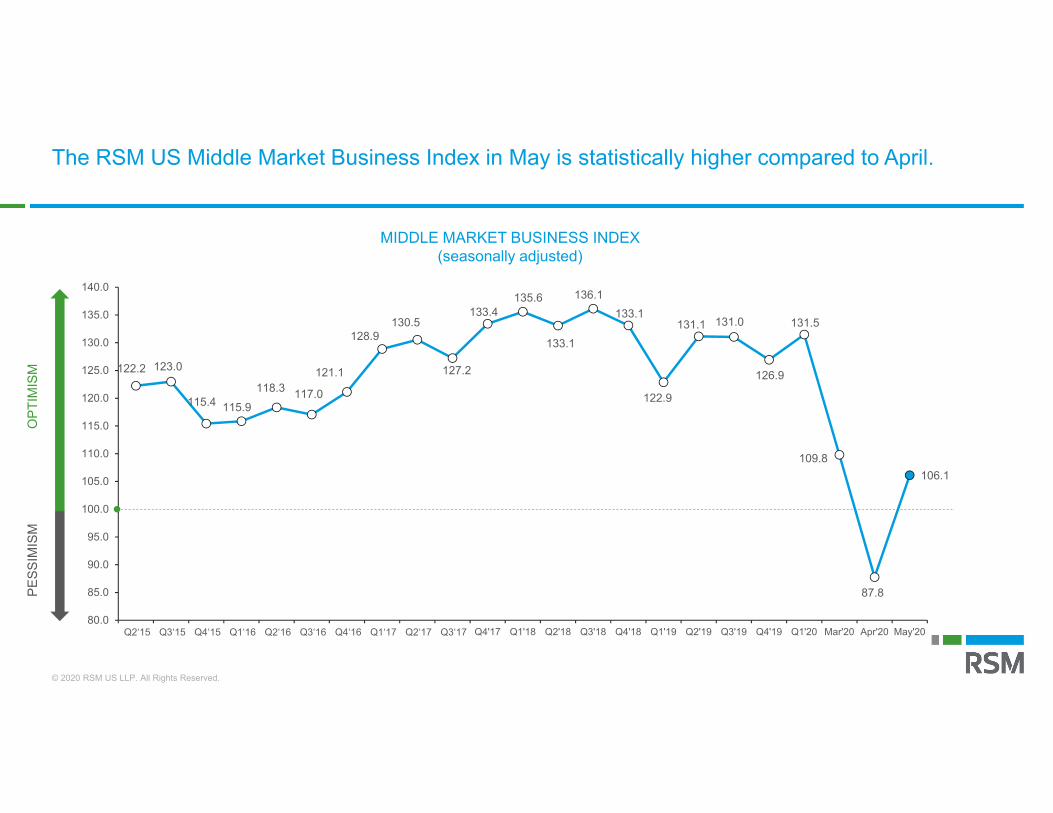
The RSM US Middle Market Business Index in May is statistically higher compared to April.
MIDDLE MARKET BUSINESS INDEX(seasonally adjusted)
122.2 123.0
115.4 115.9118.3 117.0
121.1
128.9130.5
127.2
133.4135.6
133.1
136.1133.1
122.9
131.1 131.0
126.9
131.5
109.8
87.8
106.1
80.0
85.0
90.0
95.0
100.0
105.0
110.0
115.0
120.0
125.0
130.0
135.0
140.0
Q2‘15 Q3‘15 Q4‘15 Q1‘16 Q2‘16 Q3‘16 Q4‘16 Q1‘17 Q2‘17 Q3‘17 Q4'17 Q1'18 Q2'18 Q3'18 Q4'18 Q1'19 Q2'19 Q3'19 Q4'19 Q1'20 Mar'20 Apr'20 May'20
PESS
IMIS
MO
PTIM
ISM
© 2020 RSM US LLP. All Rights Reserved.
Polling question
What are your expectations regarding the general economy over the next six months? Do you expect the general economy will…
a) Increaseb) Remain unchangedc) Worsen
17
© 2020 RSM US LLP. All Rights Reserved.
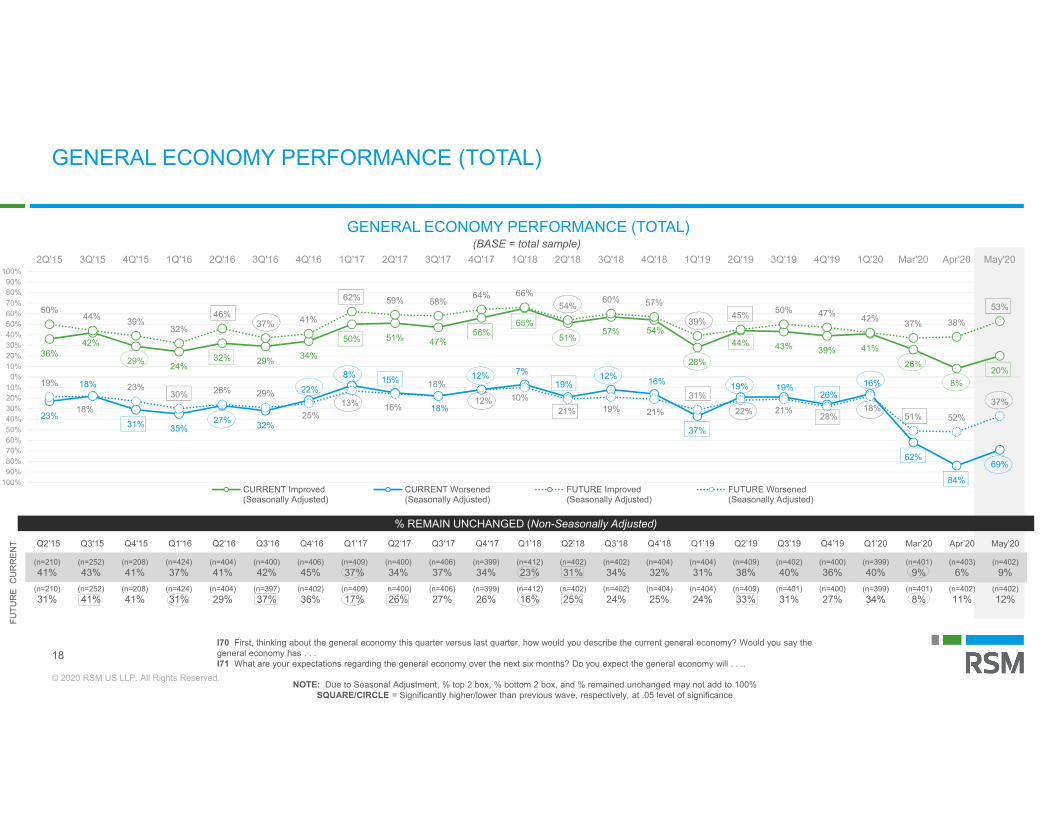
GENERAL ECONOMY PERFORMANCE (TOTAL)
18
36%42%
29% 24%32% 29% 34%
50% 51% 47%56%
65%51%
57% 54%
28%
44% 43% 39% 41%
26%
8%20%
23%
18%
31% 35%27% 32%
22%8% 15%
18%
12% 7%19%
12% 16%
37%
19% 19%26%
16%
62%
84%
69%
50%44% 39%
32%46%
37% 41%
62% 59% 58%64% 66%
54%60% 57%
39%45% 50% 47% 42% 37% 38%
53%
19%
18%
23%30% 26% 29%
25%13% 16%
18%
12% 10%21% 19% 21%
31%
22% 21%28%
18%51% 52%
37%
100%90%80%70%60%50%40%30%20%10%
0%10%20%30%40%50%60%70%80%90%
100%2Q'15 3Q'15 4Q'15 1Q'16 2Q'16 3Q'16 4Q'16 1Q'17 2Q'17 3Q'17 4Q'17 1Q'18 2Q'18 3Q'18 4Q'18 1Q'19 2Q'19 3Q'19 4Q'19 1Q'20 Mar'20 Apr'20 May'20
GENERAL ECONOMY PERFORMANCE (TOTAL)
CURRENT Improved(Seasonally Adjusted)
CURRENT Worsened(Seasonally Adjusted)
FUTURE Improved(Seasonally Adjusted)
FUTURE Worsened(Seasonally Adjusted)
Q2‘15 Q3‘15 Q4‘15 Q1‘16 Q2‘16 Q3‘16 Q4‘16 Q1‘17 Q2‘17 Q3‘17 Q4‘17 Q1’18 Q2’18 Q3’18 Q4’18 Q1’19 Q2’19 Q3’19 Q4’19 Q1’20 Mar’20 Apr’20 May’20
(n=210) (n=252) (n=208) (n=424) (n=404) (n=400) (n=406) (n=409) (n=400) (n=406) (n=399) (n=412) (n=402) (n=402) (n=404) (n=404) (n=409) (n=402) (n=400) (n=399) (n=401) (n=403) (n=402)41% 43% 41% 37% 41% 42% 45% 37% 34% 37% 34% 23% 31% 34% 32% 31% 38% 40% 36% 40% 9% 6% 9%
(n=210) (n=252) (n=208) (n=424) (n=404) (n=397) (n=402) (n=409) n=400) (n=406) (n=399) (n=412) (n=402) (n=402) (n=404) (n=404) (n=409) (n=401) (n=400) (n=399) (n=401) (n=402) (n=402)31% 41% 41% 31% 29% 37% 36% 17% 26% 27% 26% 16% 25% 24% 25% 24% 33% 31% 27% 34% 8% 11% 12%
% REMAIN UNCHANGED (Non-Seasonally Adjusted)
(BASE = total sample)
I70 First, thinking about the general economy this quarter versus last quarter, how would you describe the current general economy? Would you say the general economy has . . .I71 What are your expectations regarding the general economy over the next six months? Do you expect the general economy will . . ..
NOTE: Due to Seasonal Adjustment, % top 2 box, % bottom 2 box, and % remained unchanged may not add to 100%SQUARE/CIRCLE = Significantly higher/lower than previous wave, respectively, at .05 level of significance
FUTU
RE
CU
RR
ENT
© 2020 RSM US LLP. All Rights Reserved.
Polling question
If you had to work remotely for an extended period of time, how much longer do you think you could effectively perform your job duties from home?
a) One monthb) Two monthsc) Three monthsd) Indefinitely
19
© 2020 RSM US LLP. All Rights Reserved.
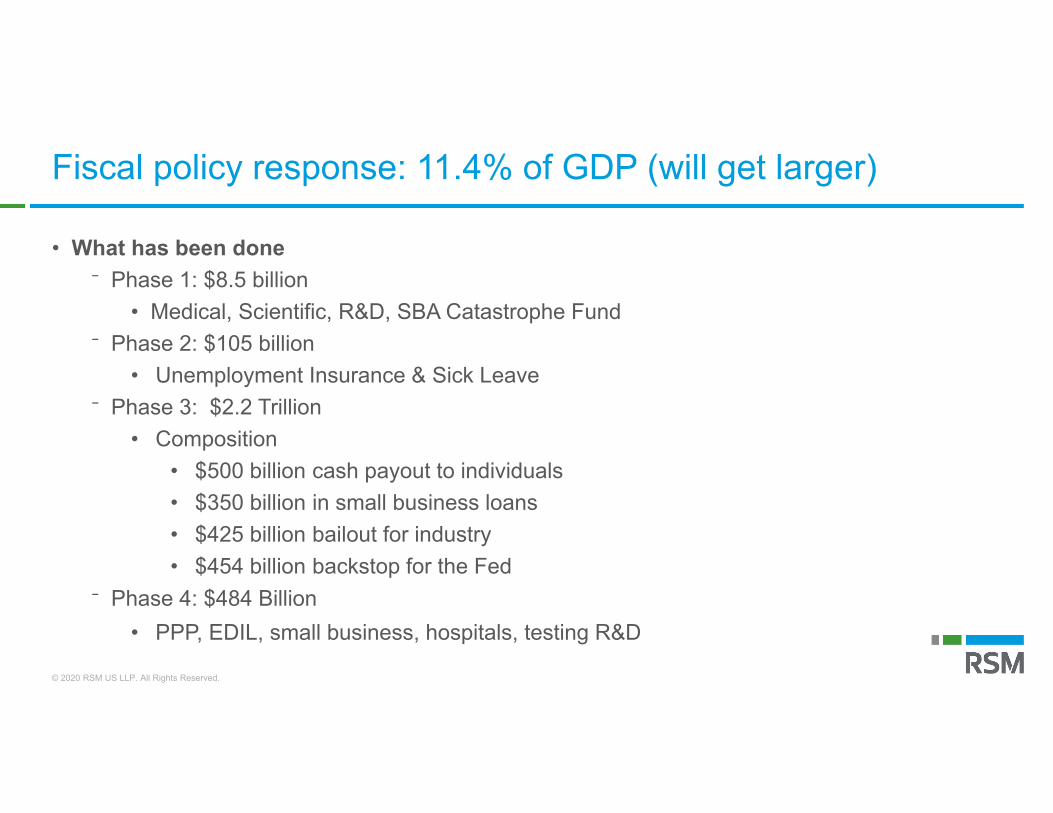
Fiscal policy response: 11.4% of GDP (will get larger)
• What has been done⁻ Phase 1: $8.5 billion
• Medical, Scientific, R&D, SBA Catastrophe Fund⁻ Phase 2: $105 billion
• Unemployment Insurance & Sick Leave⁻ Phase 3: $2.2 Trillion
• Composition• $500 billion cash payout to individuals• $350 billion in small business loans• $425 billion bailout for industry• $454 billion backstop for the Fed
⁻ Phase 4: $484 Billion • PPP, EDIL, small business, hospitals, testing R&D
© 2020 RSM US LLP. All Rights Reserved.
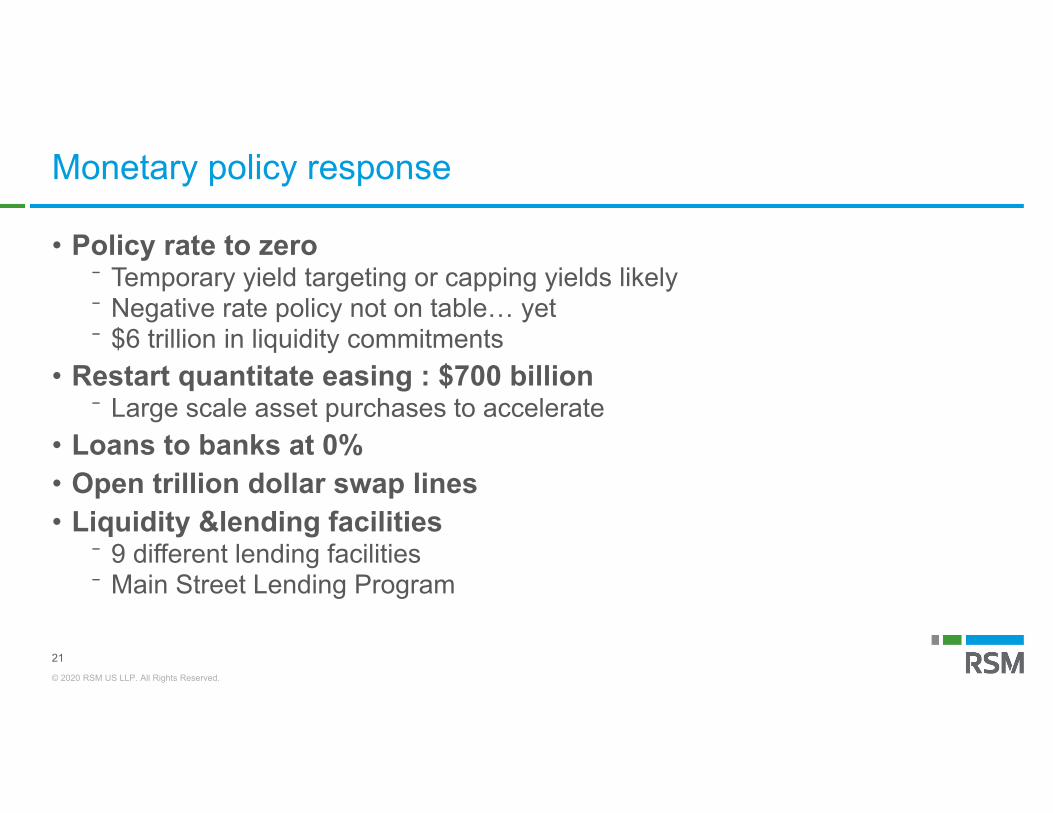
Monetary policy response
• Policy rate to zero⁻ Temporary yield targeting or capping yields likely ⁻ Negative rate policy not on table… yet⁻ $6 trillion in liquidity commitments
• Restart quantitate easing : $700 billion⁻ Large scale asset purchases to accelerate
• Loans to banks at 0%• Open trillion dollar swap lines• Liquidity &lending facilities
⁻ 9 different lending facilities⁻ Main Street Lending Program
21
© 2020 RSM US LLP. All Rights Reserved.
Polling question
How ready are you to return to working from the office?a) I prefer to return the officeb) I prefer to continue working from home
22
© 2020 RSM US LLP. All Rights Reserved.
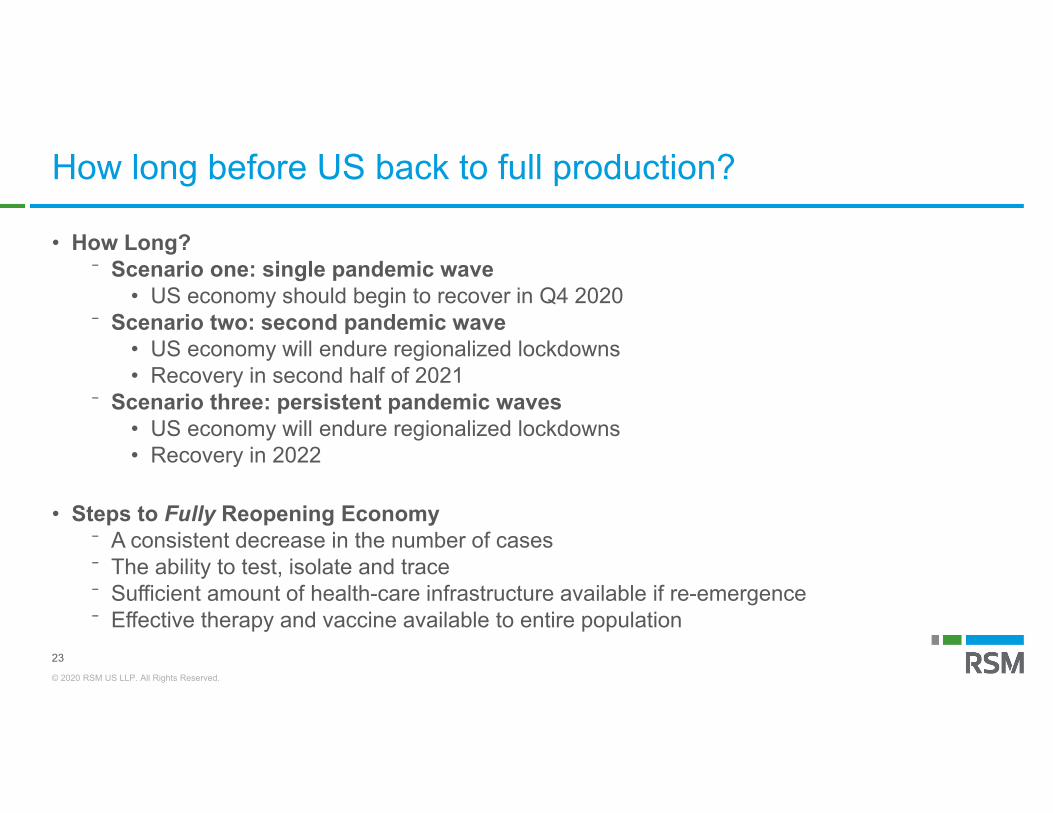
How long before US back to full production?
• How Long?⁻ Scenario one: single pandemic wave
• US economy should begin to recover in Q4 2020⁻ Scenario two: second pandemic wave
• US economy will endure regionalized lockdowns• Recovery in second half of 2021
⁻ Scenario three: persistent pandemic waves• US economy will endure regionalized lockdowns• Recovery in 2022
• Steps to Fully Reopening Economy⁻ A consistent decrease in the number of cases⁻ The ability to test, isolate and trace⁻ Sufficient amount of health-care infrastructure available if re-emergence⁻ Effective therapy and vaccine available to entire population
23
© 2020 RSM US LLP. All Rights Reserved.
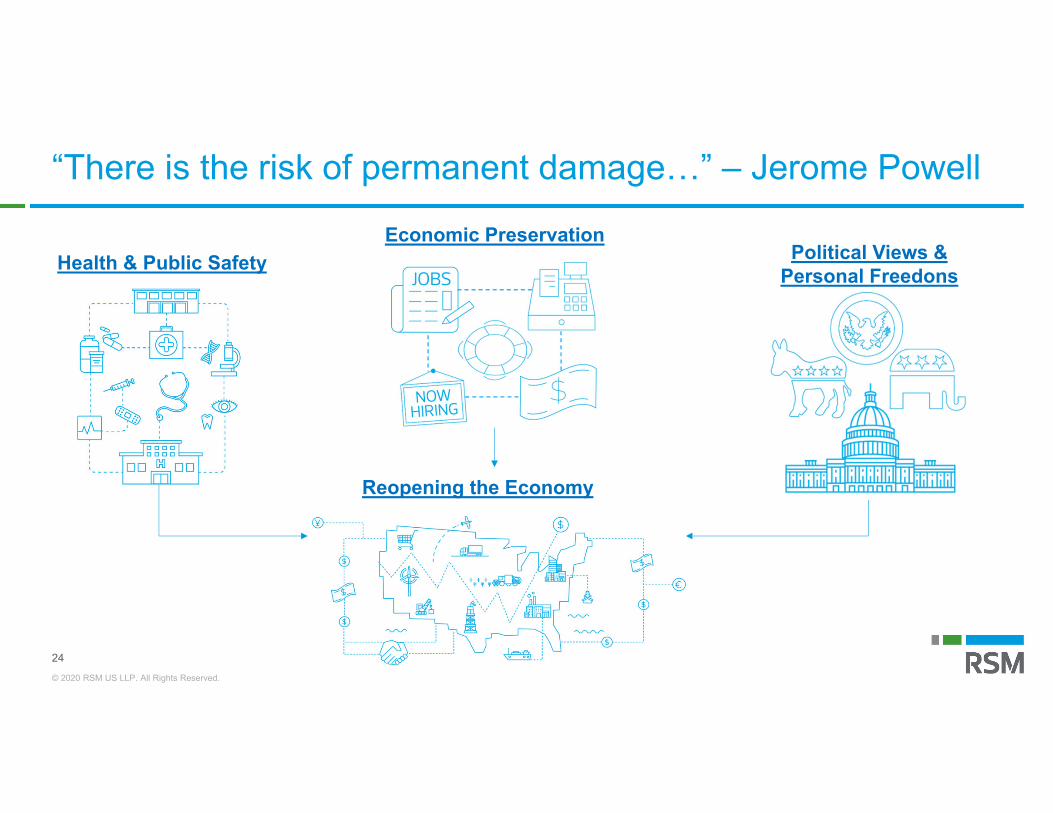
“There is the risk of permanent damage…” – Jerome Powell
24
Health & Public SafetyEconomic Preservation
Political Views & Personal Freedons
Reopening the Economy
© 2020 RSM US LLP. All Rights Reserved.
25
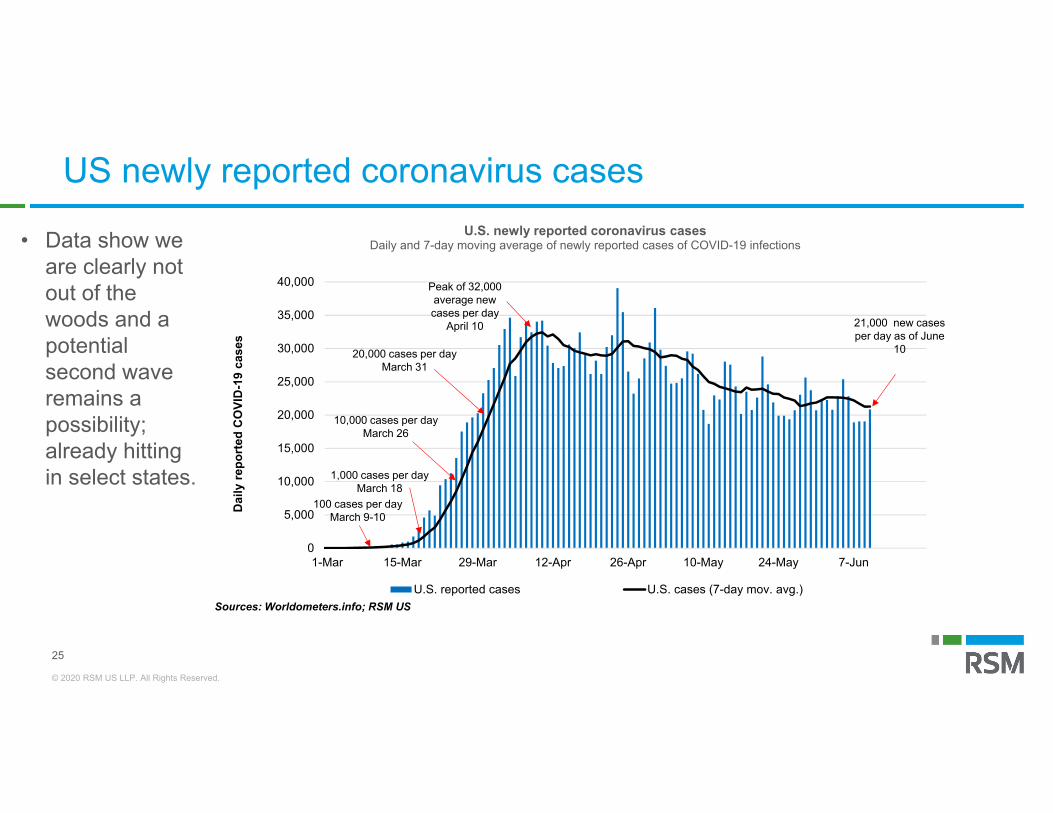
US newly reported coronavirus cases
• Data show we are clearly not out of the woods and a potential second wave remains a possibility; already hitting in select states.
0
5,000
10,000
15,000
20,000
25,000
30,000
35,000
40,000
1-Mar 15-Mar 29-Mar 12-Apr 26-Apr 10-May 24-May 7-Jun
Dai
ly re
port
ed C
OVI
D-1
9 ca
ses
U.S. newly reported coronavirus casesDaily and 7-day moving average of newly reported cases of COVID-19 infections
U.S. reported cases U.S. cases (7-day mov. avg.)Sources: Worldometers.info; RSM US
Peak of 32,000 average newcases per day
April 10
1,000 cases per day March 18
10,000 cases per day March 26
20,000 cases per day March 31
21,000 new cases per day as of June
10
100 cases per day March 9-10
© 2020 RSM US LLP. All Rights Reserved.
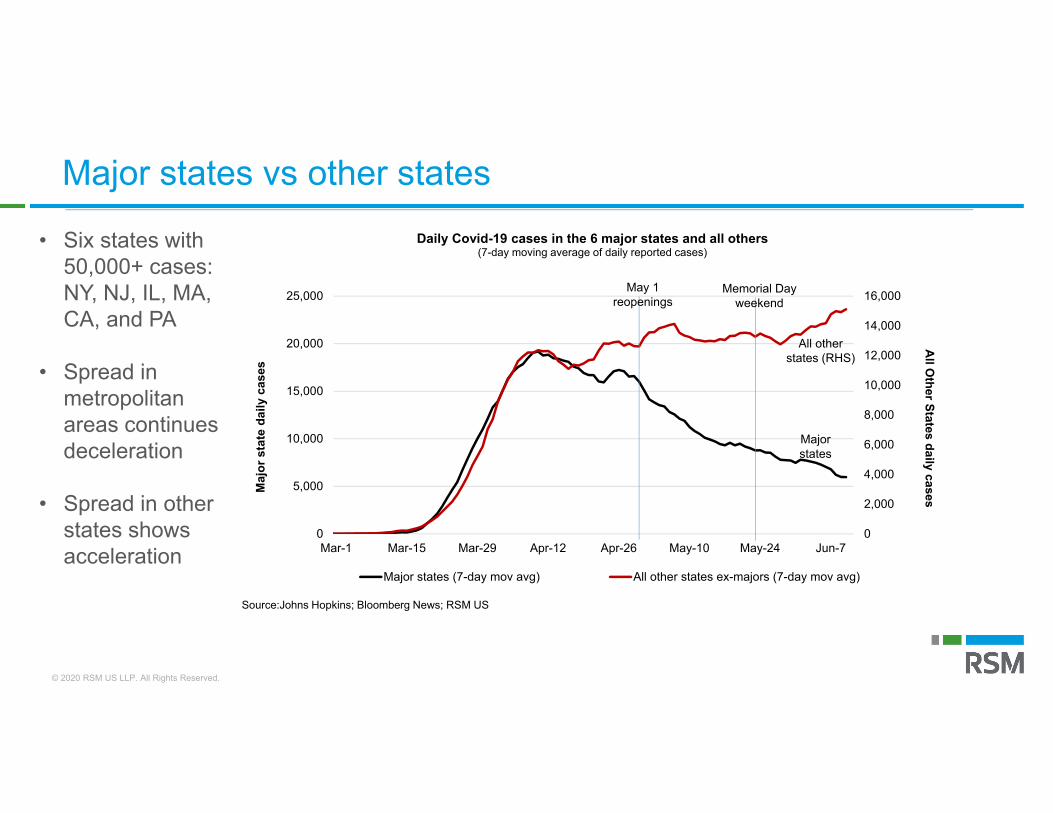
Major states vs other states
• Six states with 50,000+ cases: NY, NJ, IL, MA, CA, and PA
• Spread in metropolitan areas continues deceleration
• Spread in other states shows acceleration
0
2,000
4,000
6,000
8,000
10,000
12,000
14,000
16,000
0
5,000
10,000
15,000
20,000
25,000
Mar-1 Mar-15 Mar-29 Apr-12 Apr-26 May-10 May-24 Jun-7
All O
ther States daily casesMaj
or s
tate
dai
ly c
ases
Daily Covid-19 cases in the 6 major states and all others (7-day moving average of daily reported cases)
Major states (7-day mov avg) All other states ex-majors (7-day mov avg)
Source:Johns Hopkins; Bloomberg News; RSM US
Majorstates
All other states (RHS)
May 1reopenings
Memorial Dayweekend
© 2020 RSM US LLP. All Rights Reserved.
State
Out
door
/rec
Ret
ail
Food
/drin
kG
room
ing
Ente
rtain
men
tW
orsh
ipIn
dust
ries
Colorado 2 2 2 1 2 0 2Idaho 2 1.5 1.5 1.5 0 1 0
Montana 2 2 0 2 0 2 2Utah 2 2 2 2 0 0 0
Wyoming 2 2 2 2 0 1 2Alaska 2 2 0 0 0 0 2
Arizona 2 2 2 2 0 0 0California 0 2 0 0 0 0 0
Hawaii 2 2 0 2 0 2 2Nevada 2 2 0 0 0 0 2Oregon 1.5 1.5 0 0 0 1.5 1.5
Washington 1.5 1.5 0 0 0 0 0
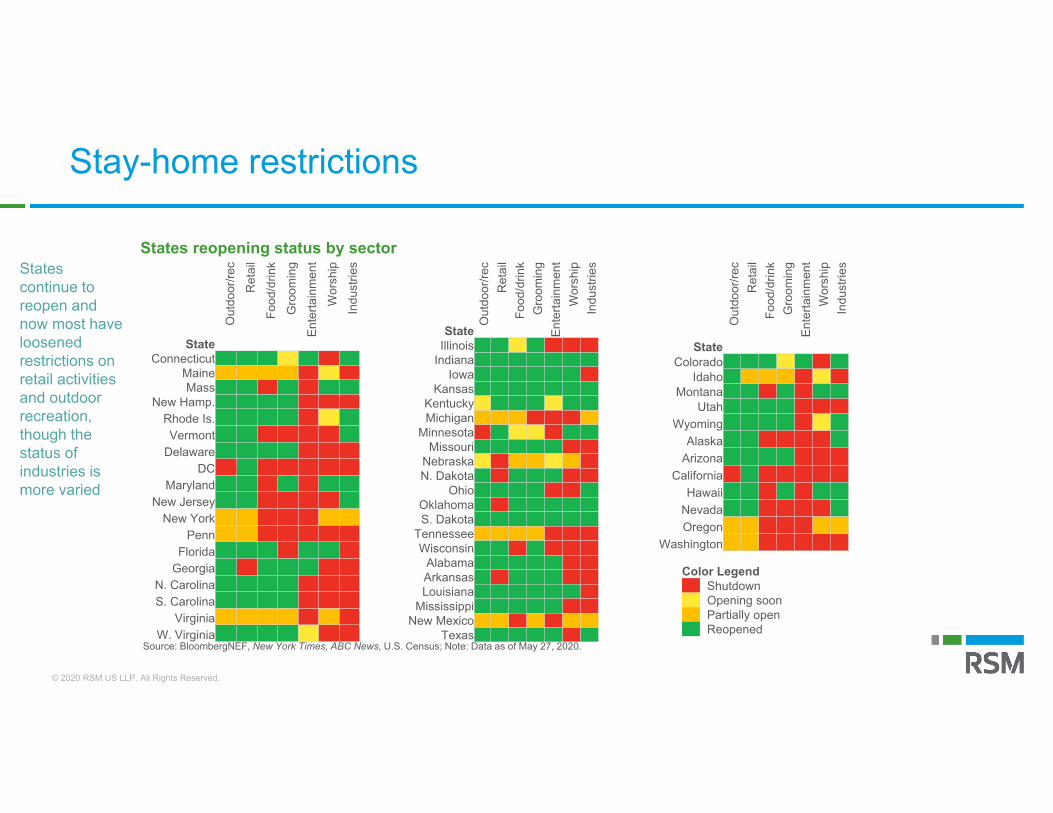
Stay-home restrictions
States reopening status by sector
Source: BloombergNEF, New York Times, ABC News, U.S. Census; Note: Data as of May 27, 2020.
Color Legend0 Shutdown 1 Opening soon
1.5 Partially open2 Reopened
State
Out
door
/rec
Ret
ail
Food
/drin
kG
room
ing
Ente
rtain
men
tW
orsh
ipIn
dust
ries
Connecticut 2 2 2 1 2 0 2Maine 1.5 1.5 1.5 1.5 0 1 0Mass 2 2 0 2 0 2 2
New Hamp. 2 2 2 2 0 0 0Rhode Is. 2 2 2 2 0 1 2Vermont 2 2 0 0 0 0 2
Delaware 2 2 2 2 0 0 0DC 0 2 0 0 0 0 0
Maryland 2 2 0 2 0 2 2New Jersey 2 2 0 0 0 0 2
New York 1.5 1.5 0 0 0 1.5 1.5Penn 1.5 1.5 0 0 0 0 0
Florida 2 2 2 0 2 2 0Georgia 2 0 2 2 2 0 0
N. Carolina 2 2 2 2 0 0 0S. Carolina 2 2 2 2 0 0 0
Virginia 1.5 1.5 1.5 1.5 0 1.5 0W. Virginia 2 2 2 2 1 0 0
State
Out
door
/rec
Ret
ail
Food
/drin
kG
room
ing
Ente
rtain
men
tW
orsh
ipIn
dust
ries
Illinois 2 2 1 2 0 0 0Indiana 2 2 2 2 2 2 2
Iowa 2 2 2 2 2 2 0Kansas 2 2 2 2 2 2 2
Kentucky 1 2 2 2 1 2 2Michigan 1.5 1.5 1.5 0 0 0 1.5
Minnesota 0 2 1 1 0 2 2Missouri 2 2 2 2 2 0 0
Nebraska 1 0 1.5 1.5 1 1.5 0N. Dakota 2 0 2 2 2 0 0
Ohio 2 2 2 2 0 0 2Oklahoma 2 0 2 2 2 2 2S. Dakota 2 2 2 2 2 2 2
Tennessee 1.5 1.5 1.5 1.5 0 0 0Wisconsin 2 2 0 2 0 0 0
Alabama 2 2 2 2 2 0 0Arkansas 2 0 2 2 2 0 0Louisiana 2 2 2 2 2 2 0
Mississippi 2 2 2 2 2 0 0New Mexico 1.5 1.5 0 1.5 0 1.5 1.5
Texas 2 2 2 2 2 0 2
States continue to reopen and now most have loosened restrictions on retail activities and outdoor recreation, though the status of industries is more varied
© 2020 RSM US LLP. All Rights Reserved.
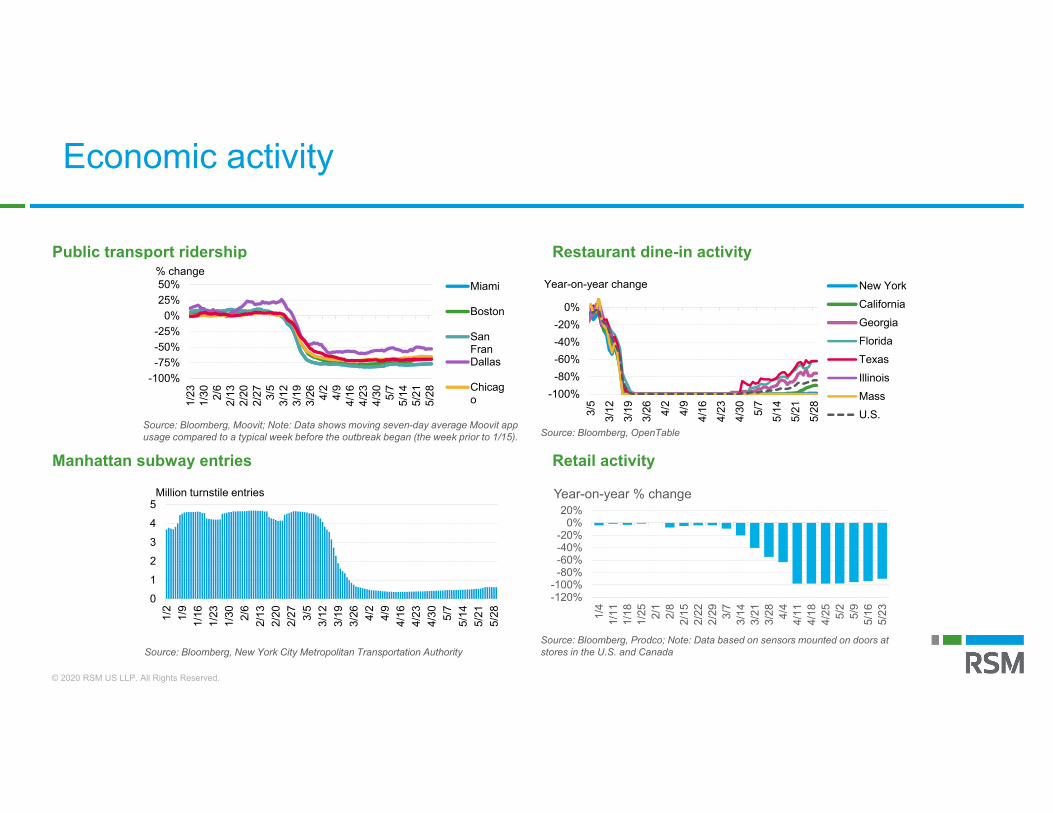
Public transport ridership Restaurant dine-in activity
Manhattan subway entries Retail activity
Economic activity
Source: Bloomberg, OpenTableSource: Bloomberg, Moovit; Note: Data shows moving seven-day average Moovit app usage compared to a typical week before the outbreak began (the week prior to 1/15).
Source: Bloomberg, New York City Metropolitan Transportation Authority
-120%-100%-80%-60%-40%-20%
0%20%
1/4
1/11
1/18
1/25 2/1
2/8
2/15
2/22
2/29 3/7
3/14
3/21
3/28 4/4
4/11
4/18
4/25 5/2
5/9
5/16
5/23
Year-on-year % change
Source: Bloomberg, Prodco; Note: Data based on sensors mounted on doors at stores in the U.S. and Canada
0
1
2
3
4
5
1/2
1/9
1/16
1/23
1/30 2/6
2/13
2/20
2/27 3/5
3/12
3/19
3/26 4/2
4/9
4/16
4/23
4/30 5/7
5/14
5/21
5/28
Million turnstile entries
-100%-75%-50%-25%
0%25%50%
1/23
1/30 2/6
2/13
2/20
2/27 3/5
3/12
3/19
3/26 4/2
4/9
4/16
4/23
4/30 5/7
5/14
5/21
5/28
% changeMiami
Boston
SanFranDallas
Chicago -100%
-80%-60%-40%-20%
0%
3/5
3/12
3/19
3/26 4/
24/
94/
164/
234/
30 5/7
5/14
5/21
5/28
Year-on-year change New YorkCaliforniaGeorgiaFloridaTexasIllinoisMassU.S.
© 2020 RSM US LLP. All Rights Reserved.
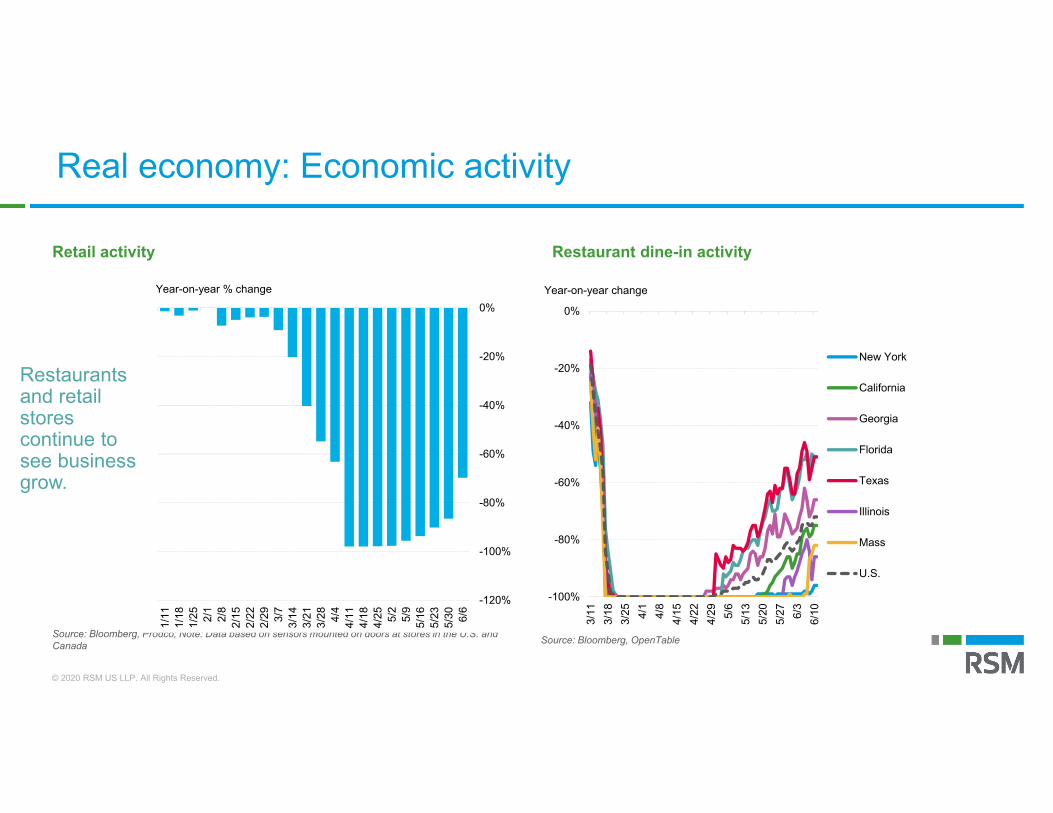
Source: Bloomberg, Prodco; Note: Data based on sensors mounted on doors at stores in the U.S. and Canada
Retail activity Restaurant dine-in activity
Restaurants and retail stores continue to see business grow.
Source: Bloomberg, OpenTable
RTRFIMTD Index
-100%
-80%
-60%
-40%
-20%
0%
3/11
3/18
3/25 4/1
4/8
4/15
4/22
4/29 5/6
5/13
5/20
5/27 6/3
6/10
Year-on-year change
New York
California
Georgia
Florida
Texas
Illinois
Mass
U.S.
-120%
-100%
-80%
-60%
-40%
-20%
0%
6/6
5/30
5/23
5/165/
95/
24/
254/
184/
114/4
3/28
3/21
3/143/
72/
292/
222/
152/8
2/1
1/25
1/18
1/11
Year-on-year % change
Real economy: Economic activity
© 2020 RSM US LLP. All Rights Reserved.
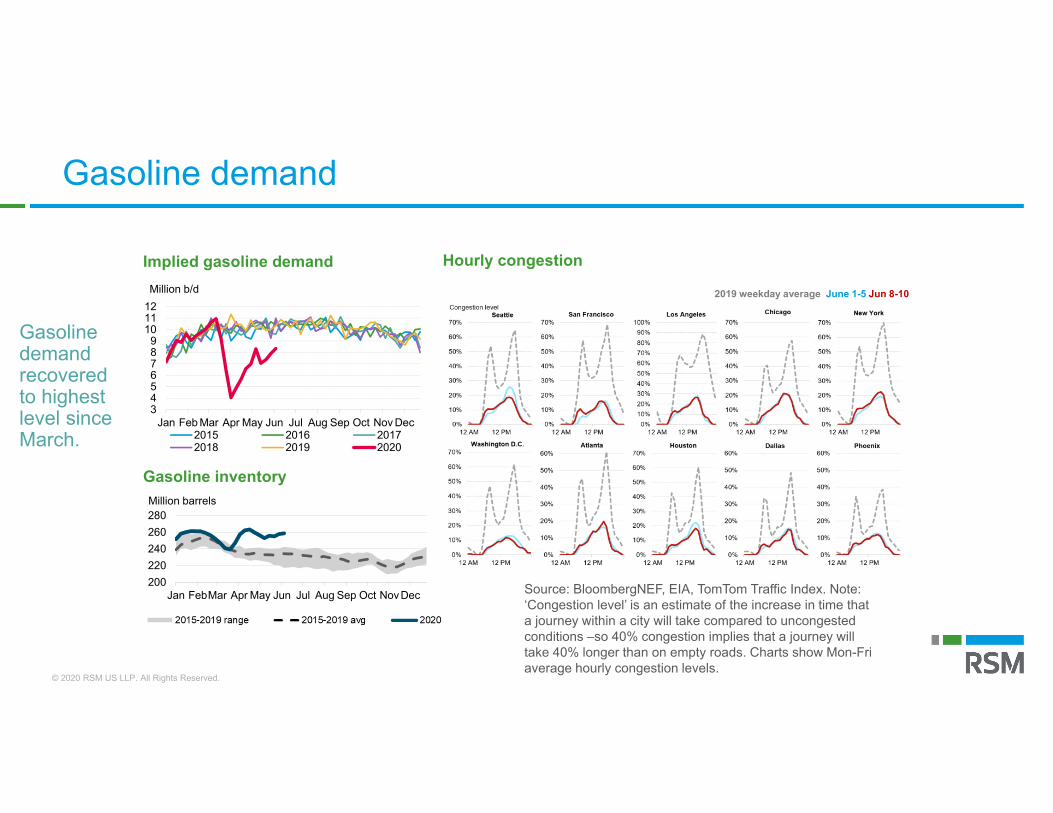
Source: BloombergNEF, EIA, TomTom Traffic Index. Note: ‘Congestion level’ is an estimate of the increase in time that a journey within a city will take compared to uncongested conditions –so 40% congestion implies that a journey will take 40% longer than on empty roads. Charts show Mon-Fri average hourly congestion levels.
Gasoline demand recovered to highest level since March.
2019 weekday average June 1-5 Jun 8-10
Implied gasoline demand Hourly congestion
Gasoline inventory
200220240260280
Jan FebMar Apr May Jun Jul Aug Sep Oct NovDec
Million barrels
3456789
101112
Jan Feb Mar Apr May Jun Jul Aug Sep Oct Nov Dec
Million b/d
2015 2016 20172018 2019 2020
Gasoline demand
© 2020 RSM US LLP. All Rights Reserved.
Polling question
When will you be comfortable flying again? a) Right nowb) Pretty soonc) Not until there is a Covid-19 vaccine
31
© 2020 RSM US LLP. All Rights Reserved.
30
32
34
36
38
40
42
44
46
48
50
Jan
Feb
Mar Apr
May Jun
Jul
Aug
Sep
Oct
Nov
Dec
Million barrels
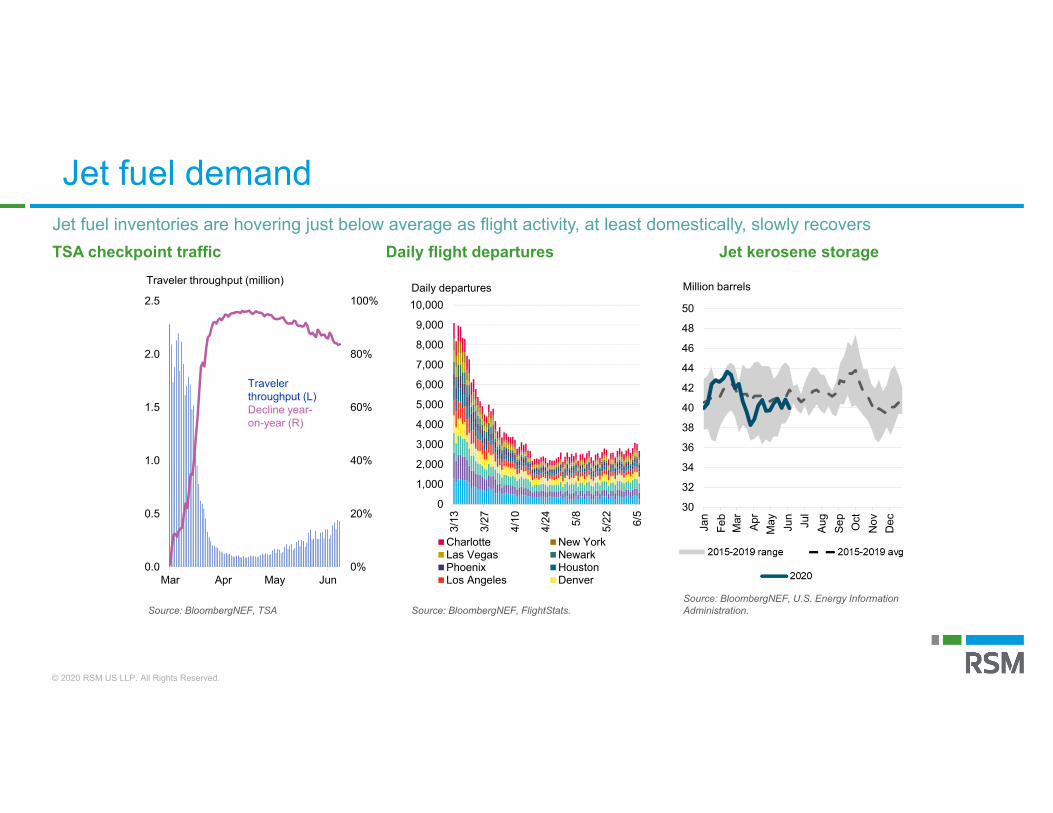
TSA checkpoint traffic Daily flight departures Jet kerosene storageJet fuel inventories are hovering just below average as flight activity, at least domestically, slowly recovers
Source: BloombergNEF, TSA Source: BloombergNEF, FlightStats. Source: BloombergNEF, U.S. Energy Information Administration.
0
1,000
2,000
3,000
4,000
5,000
6,000
7,000
8,000
9,000
10,000
3/13
3/27
4/10
4/24 5/8
5/22 6/5
Daily departures
Charlotte New YorkLas Vegas NewarkPhoenix HoustonLos Angeles Denver
0%
20%
40%
60%
80%
100%
0.0
0.5
1.0
1.5
2.0
2.5
Mar Apr May Jun
Traveler throughput (million)
Traveler throughput (L)Decline year-on-year (R)
Jet fuel demand
© 2020 RSM US LLP. All Rights Reserved.
Source: BloombergNEF, FlightStats
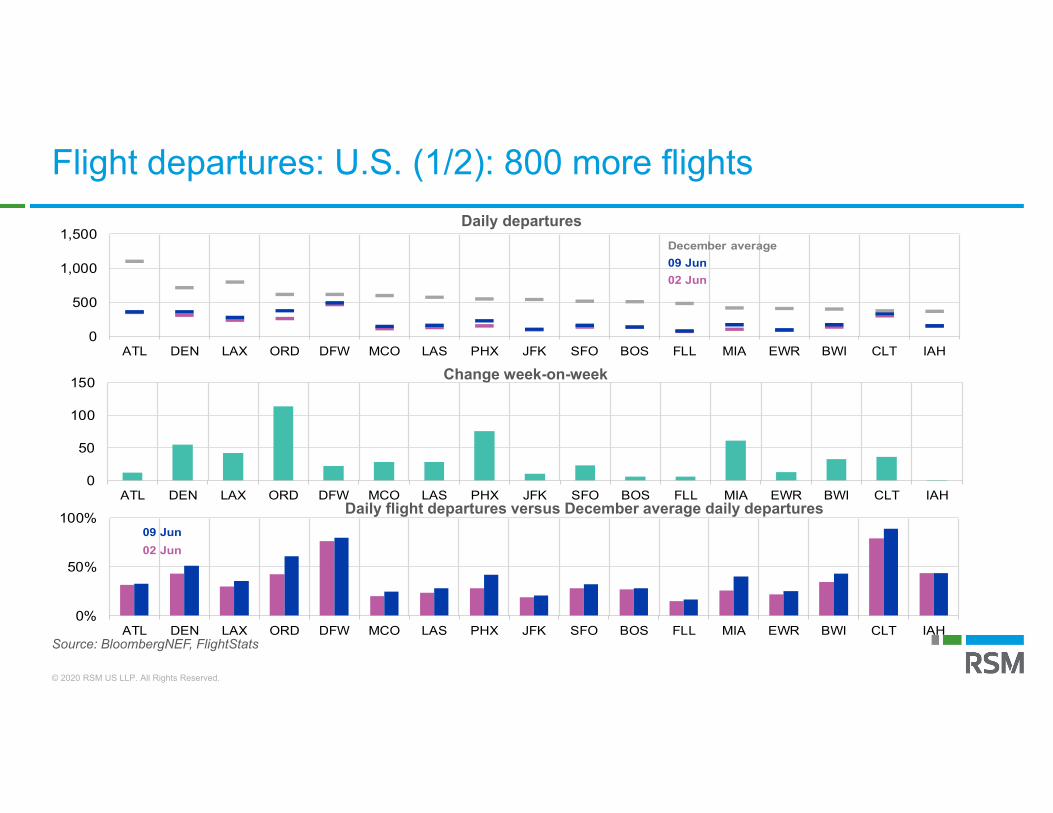
Flight departures: U.S. (1/2): 800 more flights
Daily flight departures versus December average daily departures
Change week-on-week
Daily departures
0
500
1,000
1,500
ATL DEN LAX ORD DFW MCO LAS PHX JFK SFO BOS FLL MIA EWR BWI CLT IAH
09 Jun02 Jun
December average
0
50
100
150
ATL DEN LAX ORD DFW MCO LAS PHX JFK SFO BOS FLL MIA EWR BWI CLT IAH
0%
50%
100%
ATL DEN LAX ORD DFW MCO LAS PHX JFK SFO BOS FLL MIA EWR BWI CLT IAH
09 Jun02 Jun
© 2020 RSM US LLP. All Rights Reserved.
Source: BloombergNEF, FlightStats
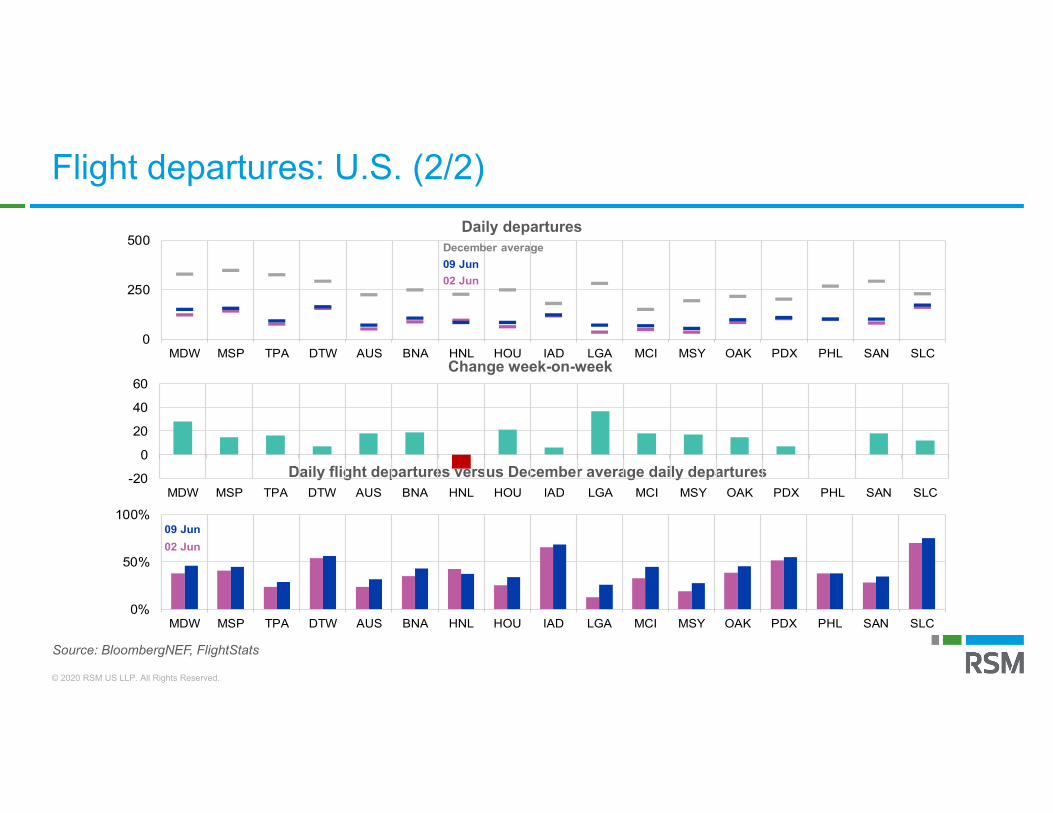
Flight departures: U.S. (2/2)
Daily flight departures versus December average daily departures
Change week-on-week
Daily departures
0
250
500
MDW MSP TPA DTW AUS BNA HNL HOU IAD LGA MCI MSY OAK PDX PHL SAN SLC
09 Jun02 Jun
December average
-20
0
20
40
60
MDW MSP TPA DTW AUS BNA HNL HOU IAD LGA MCI MSY OAK PDX PHL SAN SLC
0%
50%
100%
MDW MSP TPA DTW AUS BNA HNL HOU IAD LGA MCI MSY OAK PDX PHL SAN SLC
09 Jun02 Jun
© 2020 RSM US LLP. All Rights Reserved.
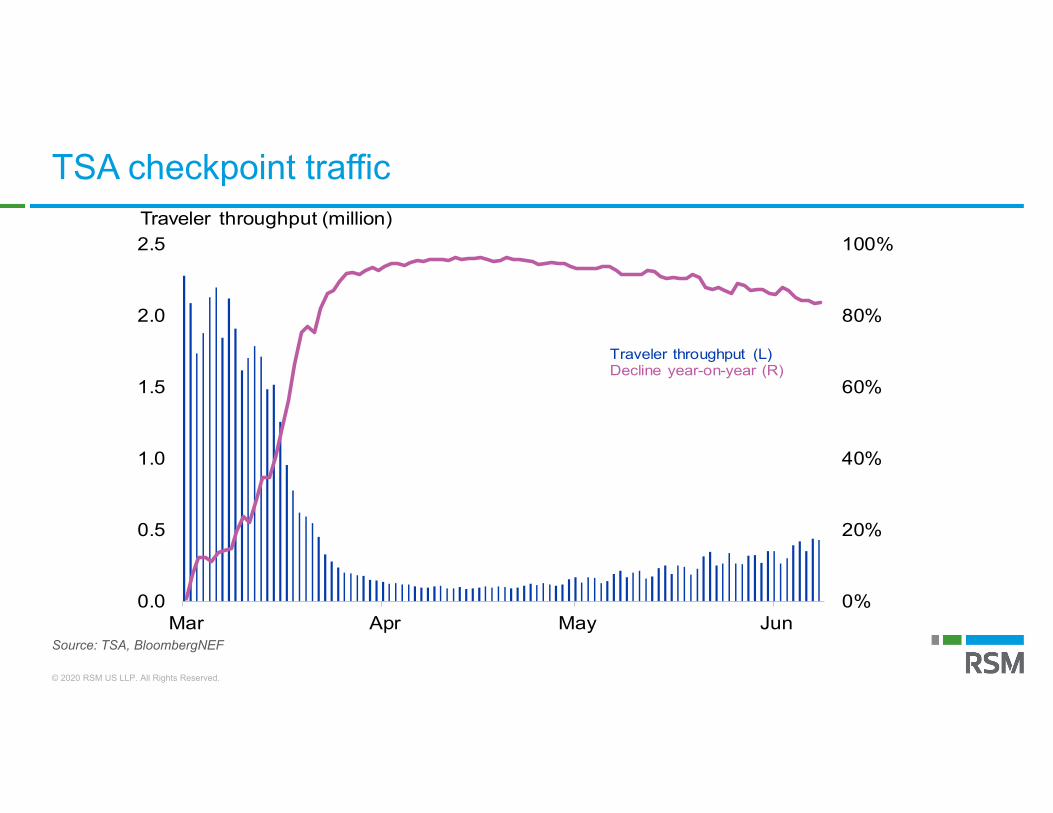
Source: TSA, BloombergNEF
TSA checkpoint traffic
0%
20%
40%
60%
80%
100%
0.0
0.5
1.0
1.5
2.0
2.5
Mar Apr May Jun
Traveler throughput (million)
Traveler throughput (L)Decline year-on-year (R)
© 2020 RSM US LLP. All Rights Reserved.
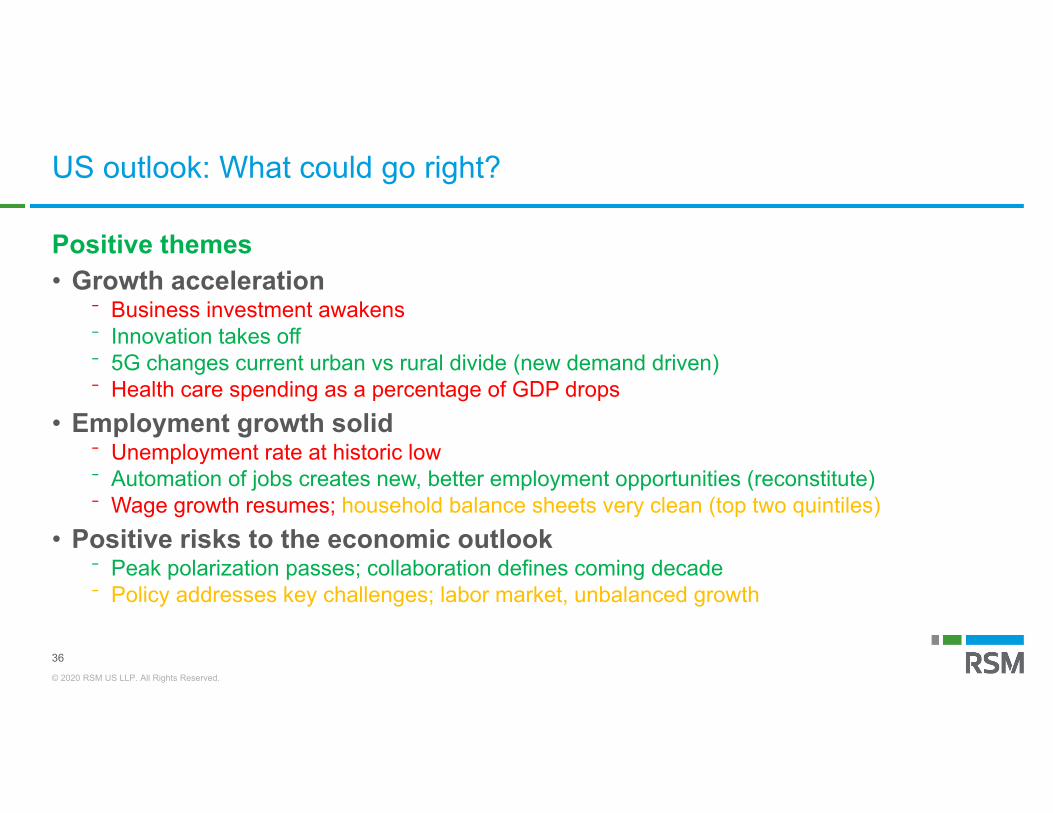
US outlook: What could go right?
Positive themes• Growth acceleration
⁻ Business investment awakens⁻ Innovation takes off⁻ 5G changes current urban vs rural divide (new demand driven)⁻ Health care spending as a percentage of GDP drops
• Employment growth solid⁻ Unemployment rate at historic low⁻ Automation of jobs creates new, better employment opportunities (reconstitute)⁻ Wage growth resumes; household balance sheets very clean (top two quintiles)
• Positive risks to the economic outlook⁻ Peak polarization passes; collaboration defines coming decade⁻ Policy addresses key challenges; labor market, unbalanced growth
36
© 2020 RSM US LLP. All Rights Reserved.
Thank you!
• For more information on these topics and more, visit our Coronavirus Resource Center, updated on a daily basis.
© 2020 RSM US LLP. All Rights Reserved.
This document contains general information, may be based on authorities that are subject to change, and is not a substitute for professional advice or services. This document does not constitute audit, tax, consulting, business, financial, investment, legal or other professional advice, and you should consult a qualified professional advisor before taking any action based on the information herein. RSM US LLP, its affiliates and related entities are not responsible for any loss resulting from or relating to reliance on this document by any person. Internal Revenue Service rules require us to inform you that this communication may be deemed a solicitation to provide tax services. This communication is being sent to individuals who have subscribed to receive it or who we believe would have an interest in the topics discussed.
RSM US LLP is a limited liability partnership and the U.S. member firm of RSM International, a global network of independent audit, tax and consulting firms. The member firms of RSM International collaborate to provide services to global clients, but are separate and distinct legal entities that cannot obligate each other. Each member firm is responsible only for its own acts and omissions, and not those of any other party. Visit rsmus.com/aboutus for more information regarding RSM US LLP and RSM International.
RSM, the RSM logo and the power of being understood are registered trademarks of RSM International Association.
© 2020 RSM US LLP. All Rights Reserved.
RSM US LLP
AddressCityPhone
+1 800 274 3978rsmus.com
38