Embed Size (px)
Citation preview

© 2018 HDR Architecture, Inc., all rights reserved.© 2018 HDR Architecture, Inc., all rights reserved.© 2018 HDR Architecture, Inc., all rights reserved.© 2018 HDR, Inc., all rights reserved.© 2018 HDR, Inc., all rights reserved.© 2018 HDR, Inc., all rights reserved.© 2018 HDR, Inc., all rights reserved.
© 2018 HDR, Inc., all rights reserved.
December 11, 2019
BRIDGE PRICING PROJECT SUMMARY
INTRODUCTION TO PROJECT
PROJECT APPROACH
RESULTS
CONCLUSIONS
01 INTRODUCTION TO PROJECT
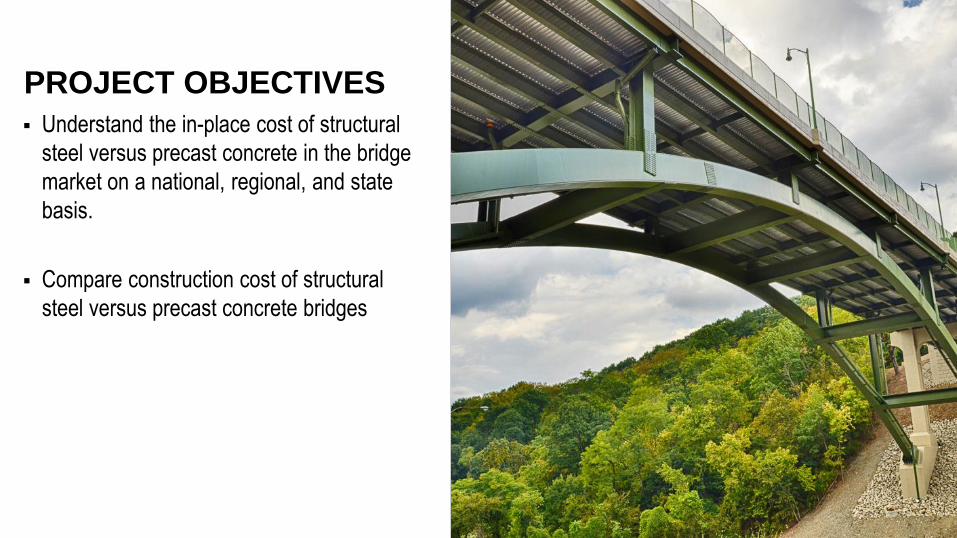
Understand the in-place cost of structural
steel versus precast concrete in the bridge
market on a national, regional, and state
basis.
Compare construction cost of structural
steel versus precast concrete bridges
PROJECT OBJECTIVES

Focus of the project
Structural steel and concrete bridges
New and replacement structures
Bridges let by State Departments of
Transportation
Projects constructed after 2013
Design-Bid-Build delivery approach
PROJECT SCOPE
02 PROJECT APPROACH
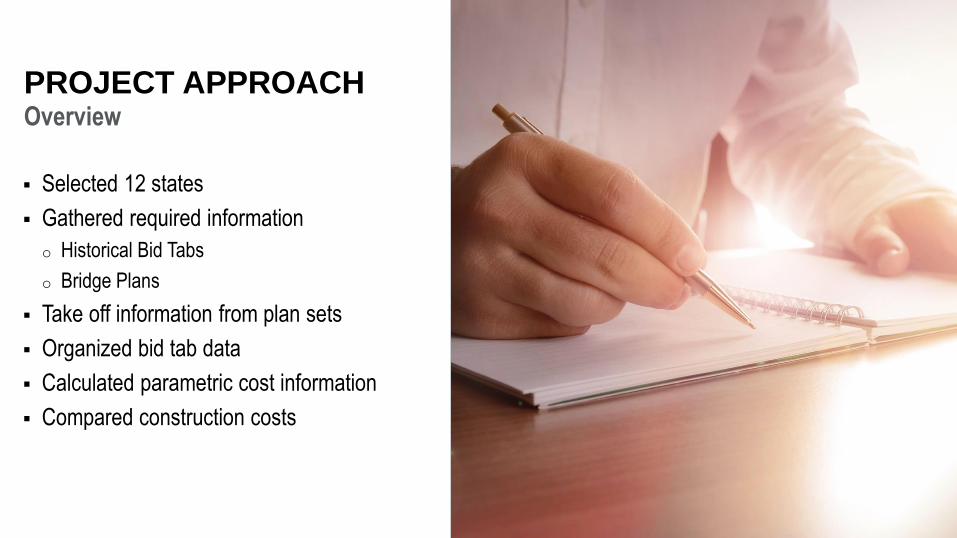
Overview
Selected 12 states
Gathered required information
o Historical Bid Tabs
o Bridge Plans
Take off information from plan sets
Organized bid tab data
Calculated parametric cost information
Compared construction costs
PROJECT APPROACH
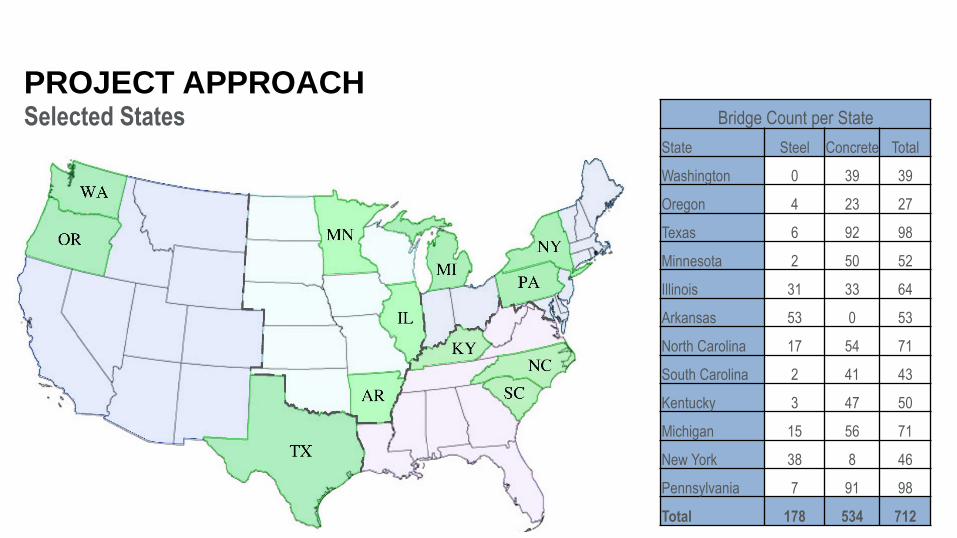
Selected States
PROJECT APPROACHBridge Count per State
State Steel Concrete Total
Washington 0 39 39
Oregon 4 23 27
Texas 6 92 98
Minnesota 2 50 52
Illinois 31 33 64
Arkansas 53 0 53
North Carolina 17 54 71
South Carolina 2 41 43
Kentucky 3 47 50
Michigan 15 56 71
New York 38 8 46
Pennsylvania 7 91 98
Total 178 534 712
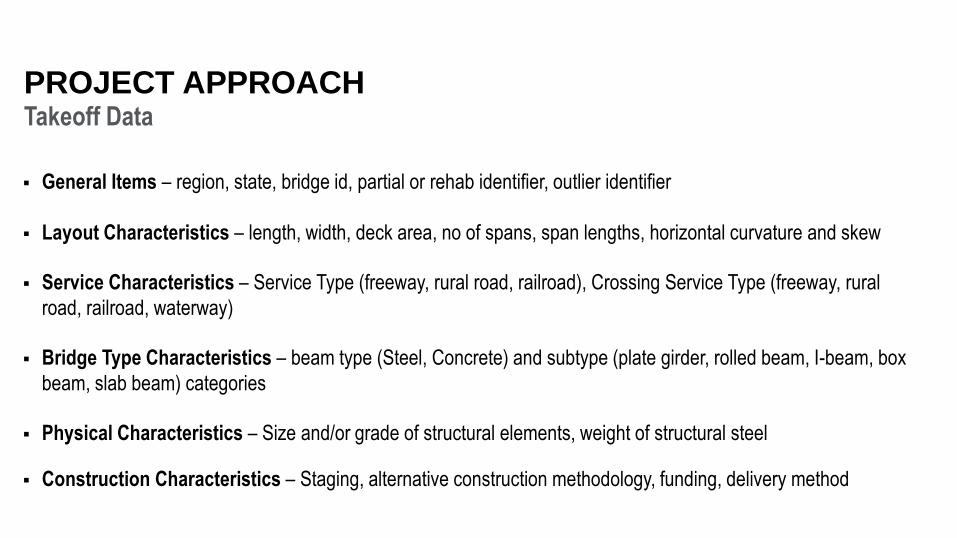
Takeoff Data
General Items – region, state, bridge id, partial or rehab identifier, outlier identifier
Layout Characteristics – length, width, deck area, no of spans, span lengths, horizontal curvature and skew
Service Characteristics – Service Type (freeway, rural road, railroad), Crossing Service Type (freeway, rural
road, railroad, waterway)
Bridge Type Characteristics – beam type (Steel, Concrete) and subtype (plate girder, rolled beam, I-beam, box
beam, slab beam) categories
Physical Characteristics – Size and/or grade of structural elements, weight of structural steel
Construction Characteristics – Staging, alternative construction methodology, funding, delivery method
PROJECT APPROACH
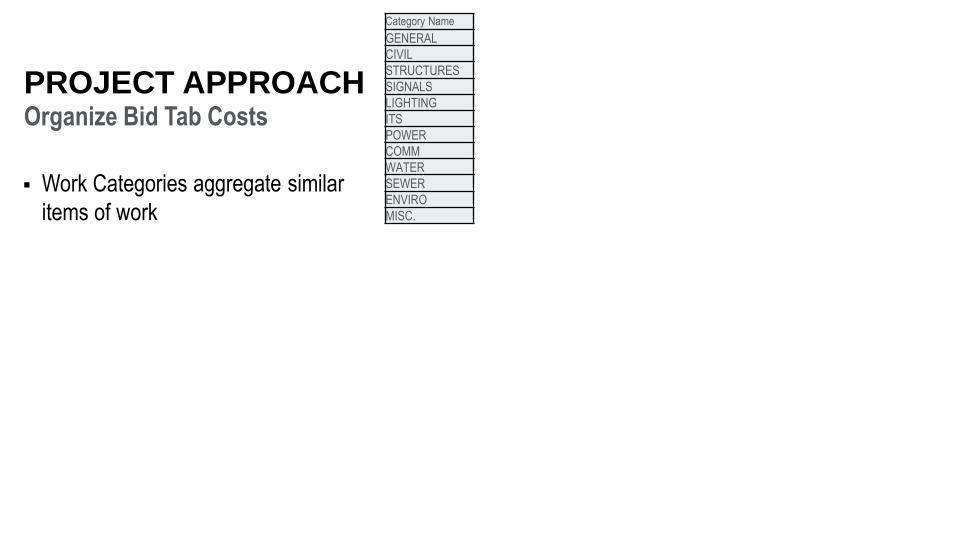
Organize Bid Tab Costs
Work Categories aggregate similar
items of work
PROJECT APPROACH
Category Name
GENERAL
CIVIL
STRUCTURES
SIGNALS
LIGHTING
ITS
POWER
COMM
WATER
SEWER
ENVIRO
MISC.
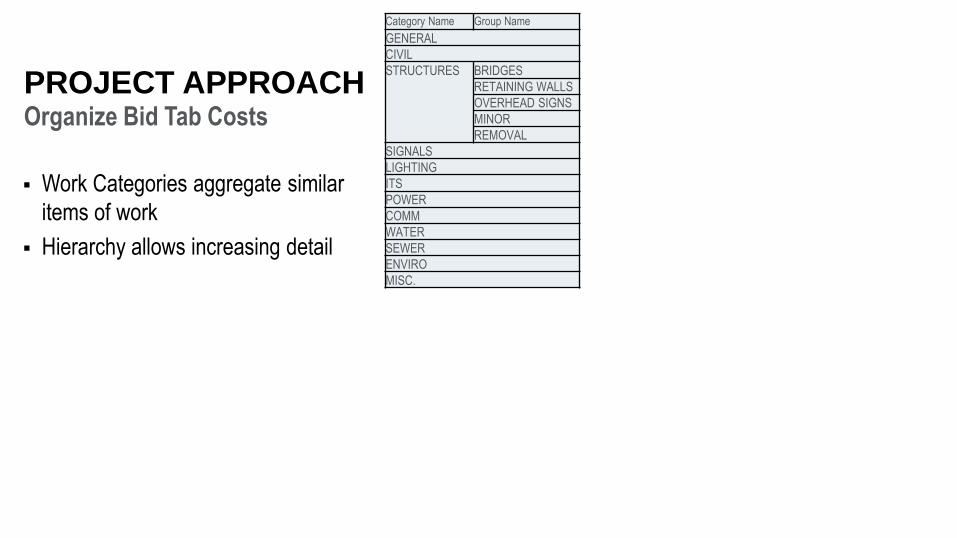
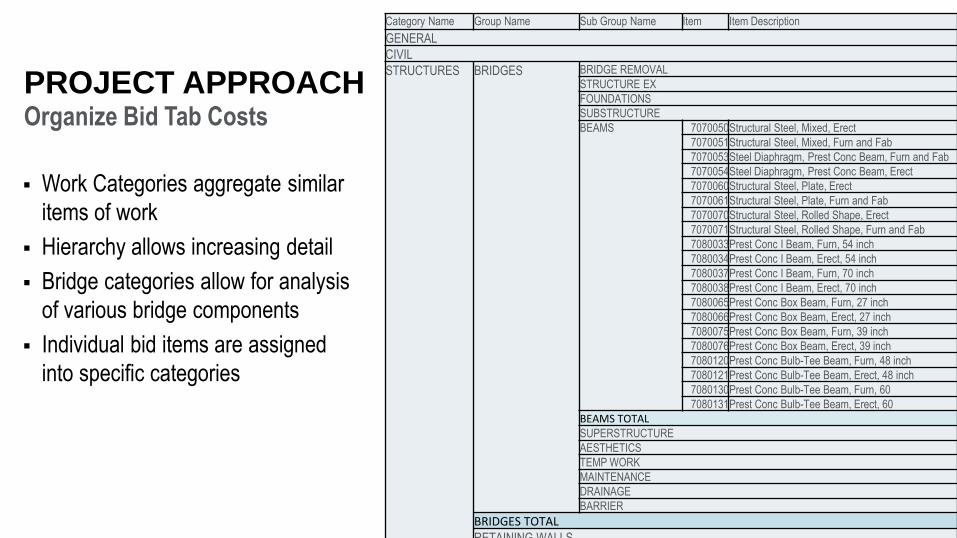
Organize Bid Tab Costs
Work Categories aggregate similar
items of work
Hierarchy allows increasing detail
PROJECT APPROACH
Category Name Group Name
GENERAL
CIVIL
STRUCTURES BRIDGES
RETAINING WALLS
OVERHEAD SIGNS
MINOR
REMOVAL
SIGNALS
LIGHTING
ITS
POWER
COMM
WATER
SEWER
ENVIRO
MISC.
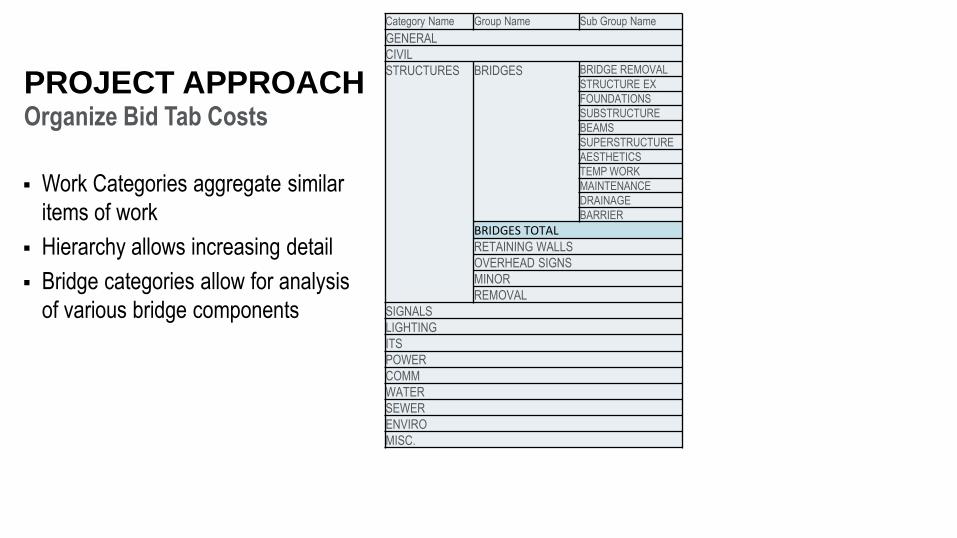
Organize Bid Tab Costs
Work Categories aggregate similar
items of work
Hierarchy allows increasing detail
Bridge categories allow for analysis
of various bridge components
PROJECT APPROACH
Category Name Group Name Sub Group Name
GENERAL
CIVIL
STRUCTURES BRIDGES BRIDGE REMOVAL
STRUCTURE EX
FOUNDATIONS
SUBSTRUCTURE
BEAMS
SUPERSTRUCTURE
AESTHETICS
TEMP WORK
MAINTENANCE
DRAINAGE
BARRIER
BRIDGES TOTAL
RETAINING WALLS
OVERHEAD SIGNS
MINOR
REMOVAL
SIGNALS
LIGHTING
ITS
POWER
COMM
WATER
SEWER
ENVIRO
MISC.
Organize Bid Tab Costs
Work Categories aggregate similar
items of work
Hierarchy allows increasing detail
Bridge categories allow for analysis
of various bridge components
Individual bid items are assigned
into specific categories
PROJECT APPROACH
Category Name Group Name Sub Group Name Item Item Description
GENERAL
CIVIL
STRUCTURES BRIDGES BRIDGE REMOVAL
STRUCTURE EX
FOUNDATIONS
SUBSTRUCTURE
BEAMS 7070050Structural Steel, Mixed, Erect
7070051Structural Steel, Mixed, Furn and Fab
7070053Steel Diaphragm, Prest Conc Beam, Furn and Fab
7070054Steel Diaphragm, Prest Conc Beam, Erect
7070060Structural Steel, Plate, Erect
7070061Structural Steel, Plate, Furn and Fab
7070070Structural Steel, Rolled Shape, Erect
7070071Structural Steel, Rolled Shape, Furn and Fab
7080033Prest Conc I Beam, Furn, 54 inch
7080034Prest Conc I Beam, Erect, 54 inch
7080037Prest Conc I Beam, Furn, 70 inch
7080038Prest Conc I Beam, Erect, 70 inch
7080065Prest Conc Box Beam, Furn, 27 inch
7080066Prest Conc Box Beam, Erect, 27 inch
7080075Prest Conc Box Beam, Furn, 39 inch
7080076Prest Conc Box Beam, Erect, 39 inch
7080120Prest Conc Bulb-Tee Beam, Furn, 48 inch
7080121Prest Conc Bulb-Tee Beam, Erect, 48 inch
7080130Prest Conc Bulb-Tee Beam, Furn, 60
7080131Prest Conc Bulb-Tee Beam, Erect, 60
BEAMS TOTALSUPERSTRUCTURE
AESTHETICS
TEMP WORK
MAINTENANCE
DRAINAGE
BARRIER
BRIDGES TOTAL
RETAINING WALLS
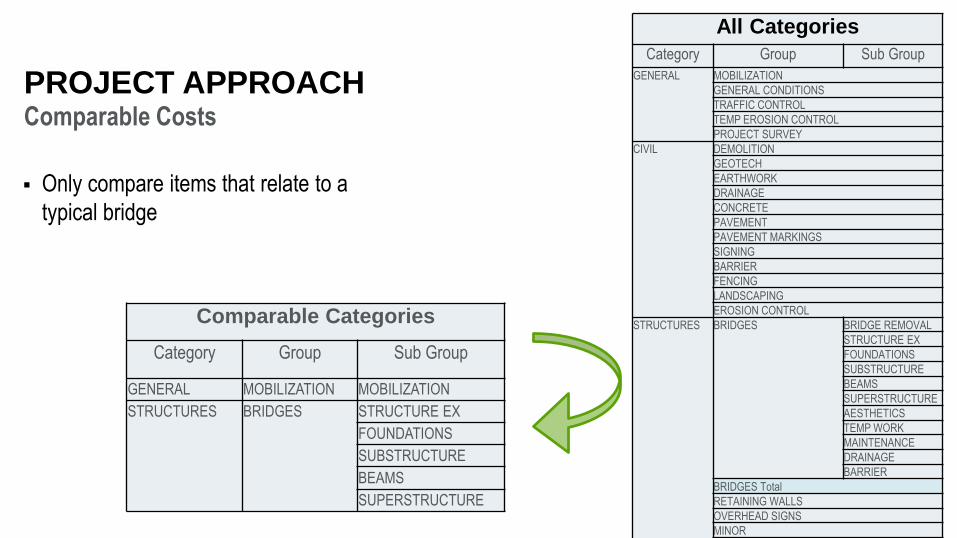
Comparable Costs
Only compare items that relate to a
typical bridge
PROJECT APPROACH
All Categories
Category Group Sub Group
GENERAL MOBILIZATION
GENERAL CONDITIONS
TRAFFIC CONTROL
TEMP EROSION CONTROL
PROJECT SURVEY
CIVIL DEMOLITION
GEOTECH
EARTHWORK
DRAINAGE
CONCRETE
PAVEMENT
PAVEMENT MARKINGS
SIGNING
BARRIER
FENCING
LANDSCAPING
EROSION CONTROL
STRUCTURES BRIDGES BRIDGE REMOVAL
STRUCTURE EX
FOUNDATIONS
SUBSTRUCTURE
BEAMS
SUPERSTRUCTURE
AESTHETICS
TEMP WORK
MAINTENANCE
DRAINAGE
BARRIER
BRIDGES Total
RETAINING WALLS
OVERHEAD SIGNS
MINOR
REMOVAL
Comparable Categories
Category Group Sub Group
GENERAL MOBILIZATION MOBILIZATION
STRUCTURES BRIDGES STRUCTURE EX
FOUNDATIONS
SUBSTRUCTURE
BEAMS
SUPERSTRUCTURE
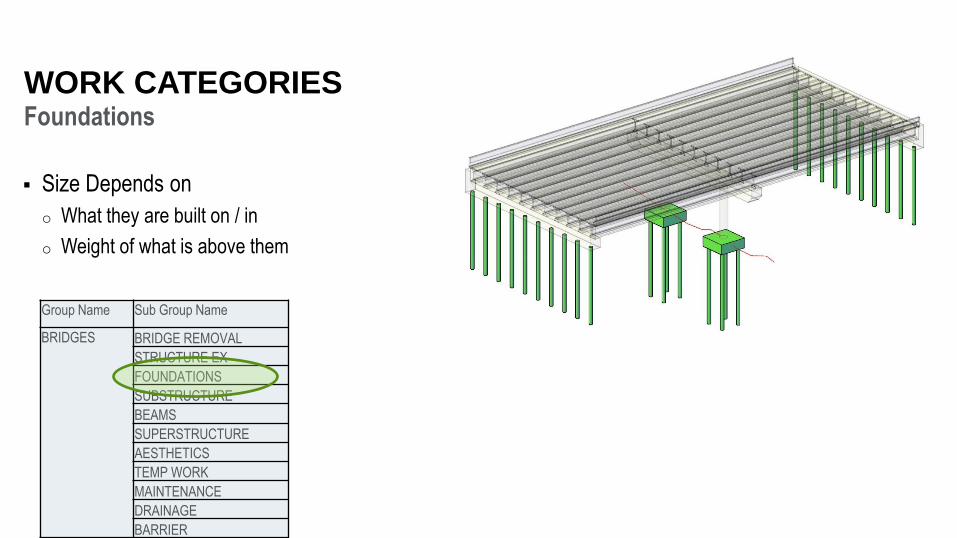
Foundations
Size Depends on
o What they are built on / in
o Weight of what is above them
WORK CATEGORIES
Group Name Sub Group Name
BRIDGES BRIDGE REMOVAL
STRUCTURE EX
FOUNDATIONS
SUBSTRUCTURE
BEAMS
SUPERSTRUCTURE
AESTHETICS
TEMP WORK
MAINTENANCE
DRAINAGE
BARRIER
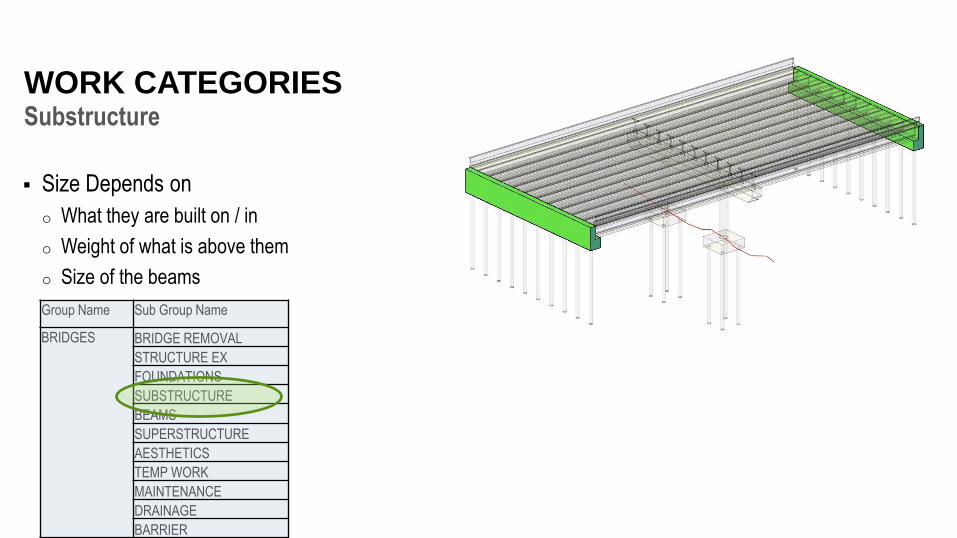
Substructure
Size Depends on
o What they are built on / in
o Weight of what is above them
o Size of the beams
WORK CATEGORIES
Group Name Sub Group Name
BRIDGES BRIDGE REMOVAL
STRUCTURE EX
FOUNDATIONS
SUBSTRUCTURE
BEAMS
SUPERSTRUCTURE
AESTHETICS
TEMP WORK
MAINTENANCE
DRAINAGE
BARRIER
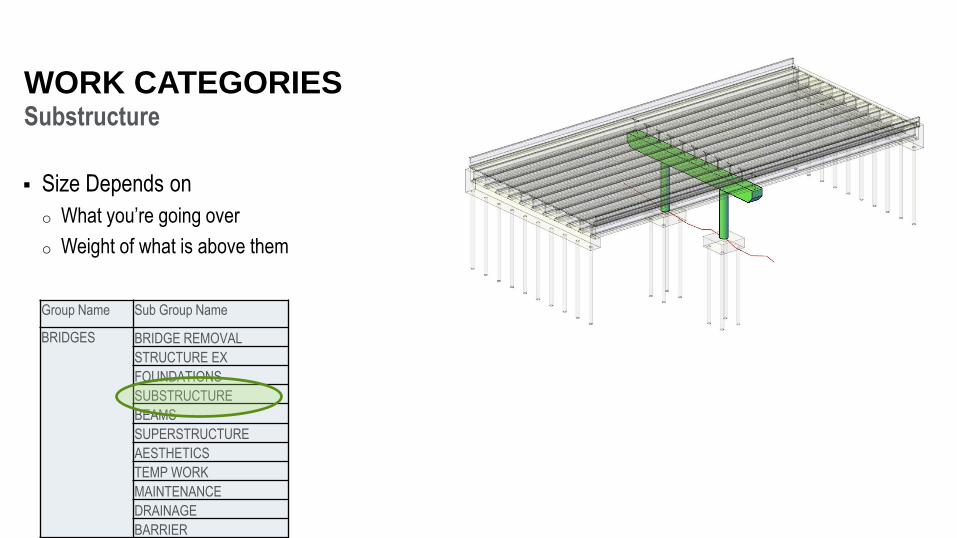
Substructure
Size Depends on
o What you’re going over
o Weight of what is above them
WORK CATEGORIES
Group Name Sub Group Name
BRIDGES BRIDGE REMOVAL
STRUCTURE EX
FOUNDATIONS
SUBSTRUCTURE
BEAMS
SUPERSTRUCTURE
AESTHETICS
TEMP WORK
MAINTENANCE
DRAINAGE
BARRIER
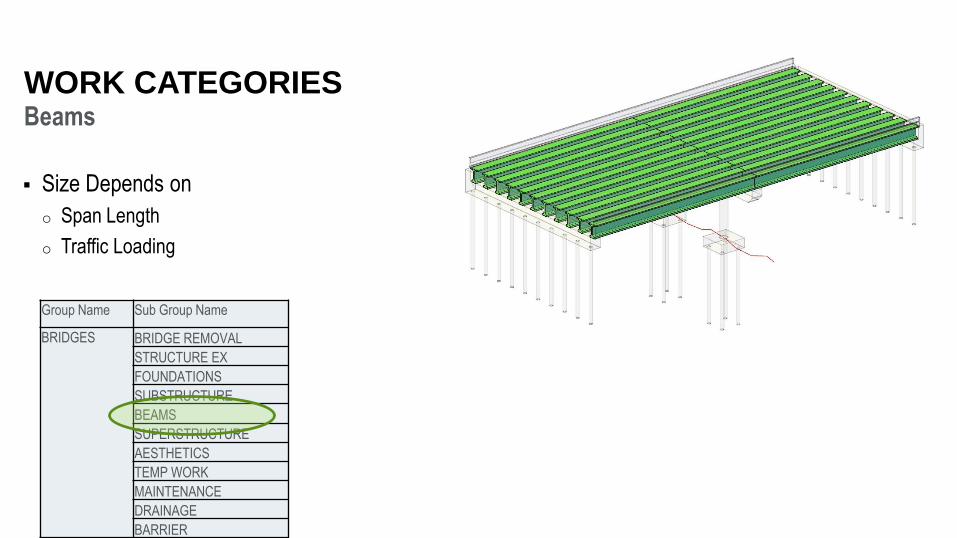
Beams
Size Depends on
o Span Length
o Traffic Loading
WORK CATEGORIES
Group Name Sub Group Name
BRIDGES BRIDGE REMOVAL
STRUCTURE EX
FOUNDATIONS
SUBSTRUCTURE
BEAMS
SUPERSTRUCTURE
AESTHETICS
TEMP WORK
MAINTENANCE
DRAINAGE
BARRIER
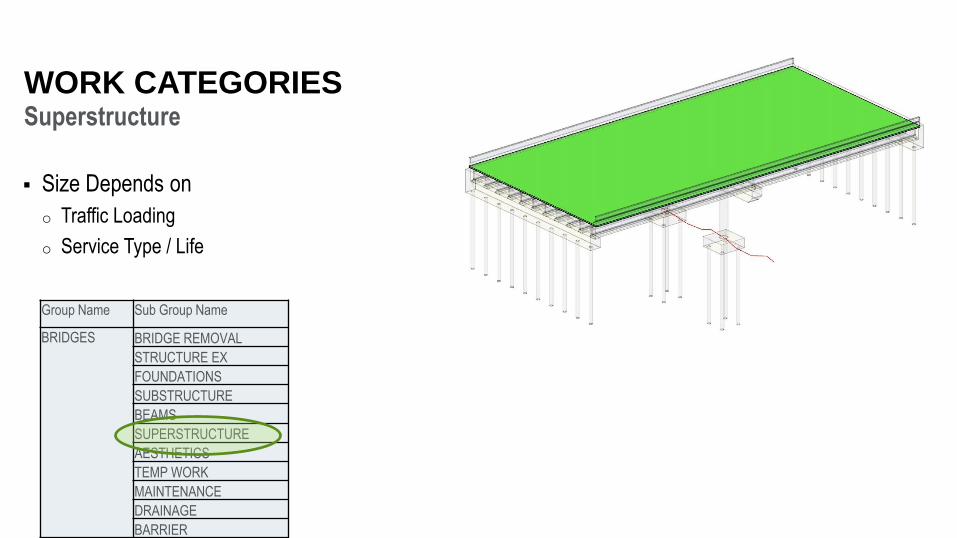
Superstructure
Size Depends on
o Traffic Loading
o Service Type / Life
WORK CATEGORIES
Group Name Sub Group Name
BRIDGES BRIDGE REMOVAL
STRUCTURE EX
FOUNDATIONS
SUBSTRUCTURE
BEAMS
SUPERSTRUCTURE
AESTHETICS
TEMP WORK
MAINTENANCE
DRAINAGE
BARRIER

Comparable Costs
Generate costs for consistent bridge elements across all samples
Compare costs not only at bottom line, but within sub categories
WORK CATEGORIES
Comparable Categories
Category Group Sub Group Cost / SF
GENERAL MOBILIZATION MOBILIZATION $18.85
STRUCTURES BRIDGES STRUCTURE EX $14.66
FOUNDATIONS $17.57
SUBSTRUCTURE $21.35
BEAMS $70.35
SUPERSTRUCTURE $30.69TOTAL COST $173.47
ADJUSTMENTS
Steel Bridges versus Concrete Bridges
Necessary to escalate project costs from past years to consistent base year for comparison
Goal to introduce the least amount of variability as possible in calculation
o Due to variability in data available and approach used from state to state
Explore potential differences between concrete and steel bridges that might make escalation
rates different for each
ESCALATION
Approach
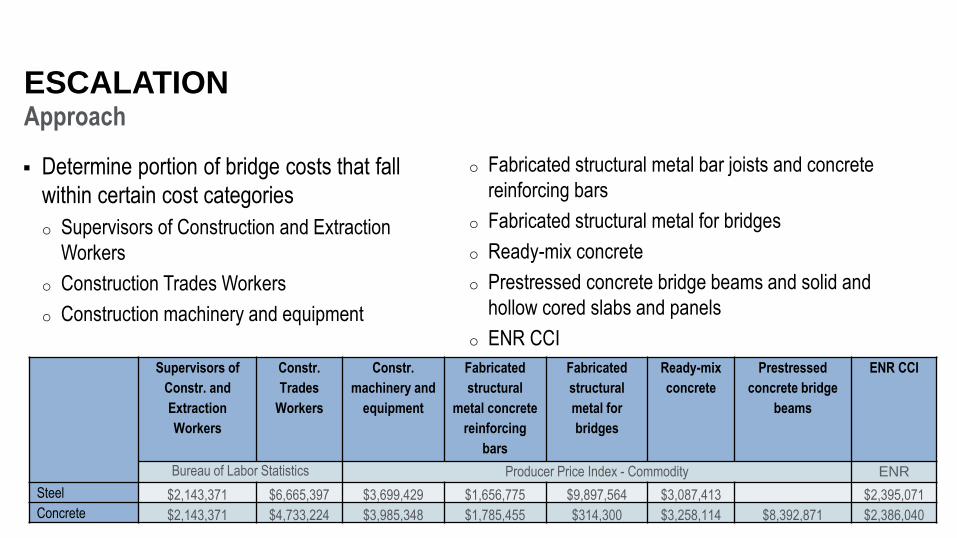
Determine portion of bridge costs that fall
within certain cost categories
o Supervisors of Construction and Extraction
Workers
o Construction Trades Workers
o Construction machinery and equipment
o Fabricated structural metal bar joists and concrete
reinforcing bars
o Fabricated structural metal for bridges
o Ready-mix concrete
o Prestressed concrete bridge beams and solid and
hollow cored slabs and panels
o ENR CCI
ESCALATION
Supervisors of
Constr. and
Extraction
Workers
Constr.
Trades
Workers
Constr.
machinery and
equipment
Fabricated
structural
metal concrete
reinforcing
bars
Fabricated
structural
metal for
bridges
Ready-mix
concrete
Prestressed
concrete bridge
beams
ENR CCI
Bureau of Labor Statistics Producer Price Index - Commodity ENR
Steel $2,143,371 $6,665,397 $3,699,429 $1,656,775 $9,897,564 $3,087,413 $2,395,071
Concrete $2,143,371 $4,733,224 $3,985,348 $1,785,455 $314,300 $3,258,114 $8,392,871 $2,386,040
Approach
ESCALATION
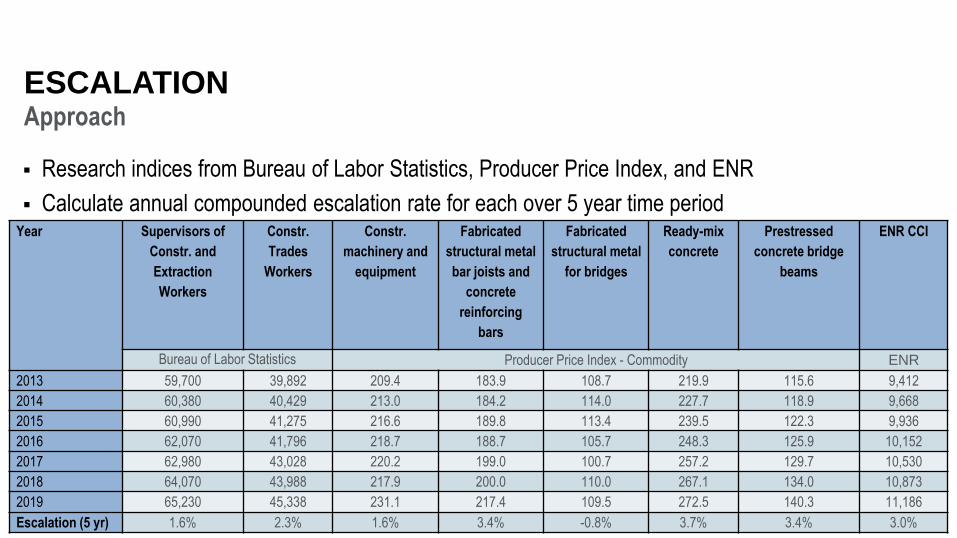
Research indices from Bureau of Labor Statistics, Producer Price Index, and ENR
Calculate annual compounded escalation rate for each over 5 year time periodYear Supervisors of
Constr. and
Extraction
Workers
Constr.
Trades
Workers
Constr.
machinery and
equipment
Fabricated
structural metal
bar joists and
concrete
reinforcing
bars
Fabricated
structural metal
for bridges
Ready-mix
concrete
Prestressed
concrete bridge
beams
ENR CCI
Bureau of Labor Statistics Producer Price Index - Commodity ENR
2013 59,700 39,892 209.4 183.9 108.7 219.9 115.6 9,412
2014 60,380 40,429 213.0 184.2 114.0 227.7 118.9 9,668
2015 60,990 41,275 216.6 189.8 113.4 239.5 122.3 9,936
2016 62,070 41,796 218.7 188.7 105.7 248.3 125.9 10,152
2017 62,980 43,028 220.2 199.0 100.7 257.2 129.7 10,530
2018 64,070 43,988 217.9 200.0 110.0 267.1 134.0 10,873
2019 65,230 45,338 231.1 217.4 109.5 272.5 140.3 11,186
Escalation (5 yr) 1.6% 2.3% 1.6% 3.4% -0.8% 3.7% 3.4% 3.0%
Approach
ESCALATION
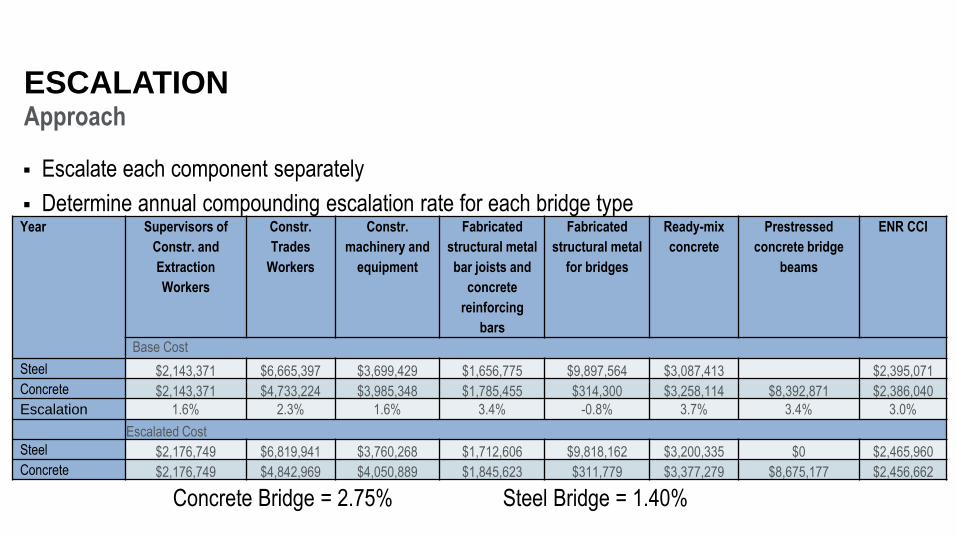
Escalate each component separately
Determine annual compounding escalation rate for each bridge typeYear Supervisors of
Constr. and
Extraction
Workers
Constr.
Trades
Workers
Constr.
machinery and
equipment
Fabricated
structural metal
bar joists and
concrete
reinforcing
bars
Fabricated
structural metal
for bridges
Ready-mix
concrete
Prestressed
concrete bridge
beams
ENR CCI
Base Cost
Steel $2,143,371 $6,665,397 $3,699,429 $1,656,775 $9,897,564 $3,087,413 $2,395,071
Concrete $2,143,371 $4,733,224 $3,985,348 $1,785,455 $314,300 $3,258,114 $8,392,871 $2,386,040
Escalation 1.6% 2.3% 1.6% 3.4% -0.8% 3.7% 3.4% 3.0%
Escalated Cost
Steel $2,176,749 $6,819,941 $3,760,268 $1,712,606 $9,818,162 $3,200,335 $0 $2,465,960
Concrete $2,176,749 $4,842,969 $4,050,889 $1,845,623 $311,779 $3,377,279 $8,675,177 $2,456,662
Concrete Bridge = 2.75% Steel Bridge = 1.40%
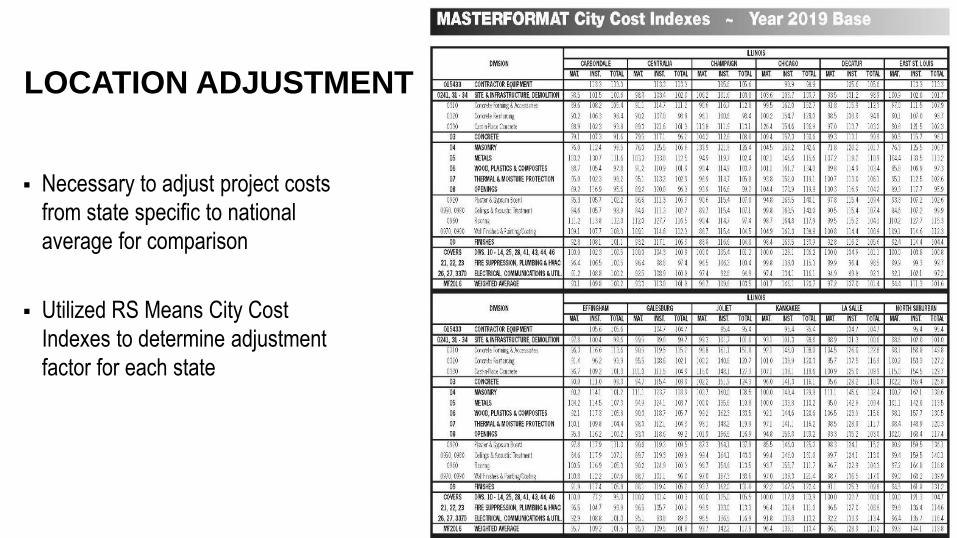
Necessary to adjust project costs
from state specific to national
average for comparison
Utilized RS Means City Cost
Indexes to determine adjustment
factor for each state
LOCATION ADJUSTMENT
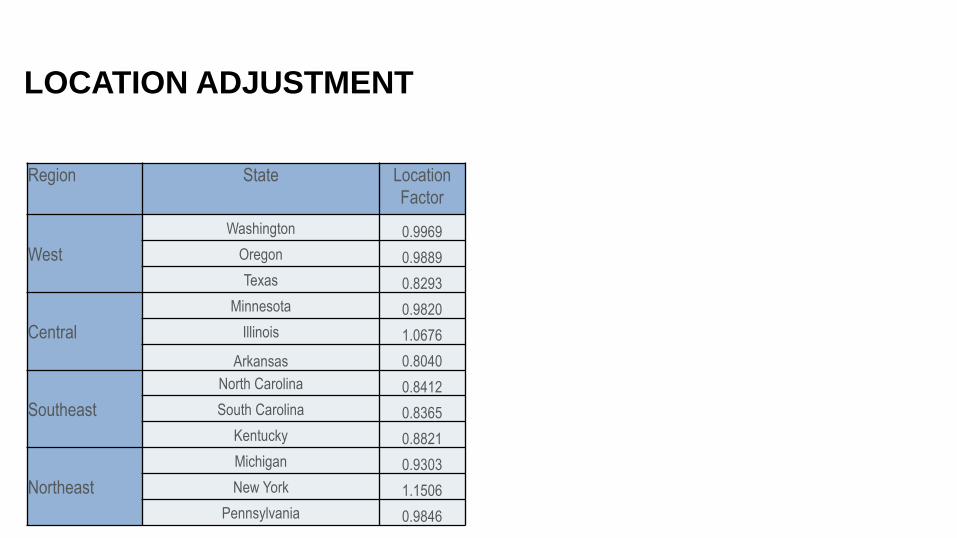
LOCATION ADJUSTMENT
Region State Location
Factor
West
Washington 0.9969
Oregon 0.9889
Texas 0.8293
Central
Minnesota 0.9820
Illinois 1.0676
Arkansas 0.8040
Southeast
North Carolina 0.8412
South Carolina 0.8365
Kentucky 0.8821
Northeast
Michigan 0.9303
New York 1.1506
Pennsylvania 0.9846
OUTLIERS
Definition – where cost of bridge is greater than 3 times the difference between the third
quartile and first quartile.
Calculated at state level for each bridge subtype
Removed outliers from calculation of results prior to comparison
03 RESULTS
KEY PARAMETERS
KEY PARAMETERS
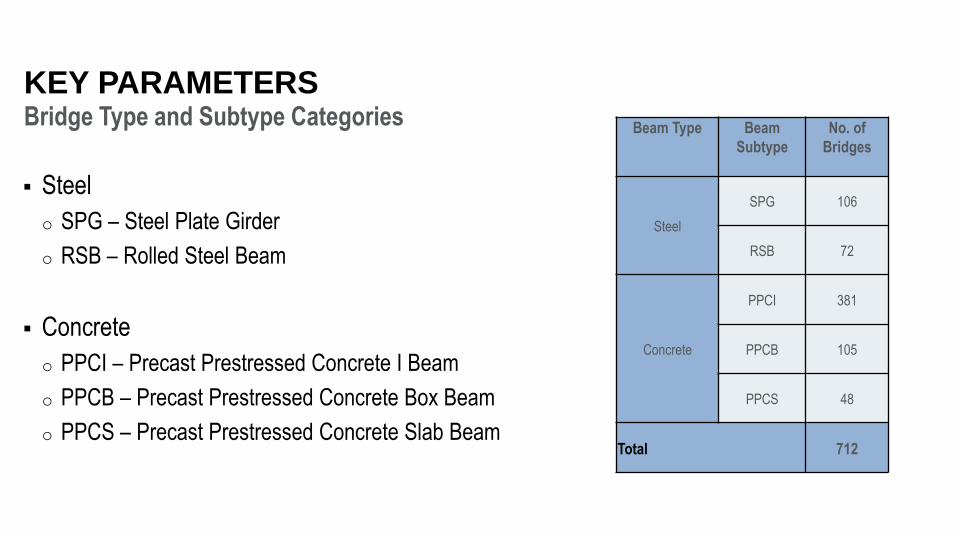
Steel
o SPG – Steel Plate Girder
o RSB – Rolled Steel Beam
Concrete
o PPCI – Precast Prestressed Concrete I Beam
o PPCB – Precast Prestressed Concrete Box Beam
o PPCS – Precast Prestressed Concrete Slab Beam
Bridge Type and Subtype CategoriesBeam Type Beam
Subtype
No. of
Bridges
Steel
SPG 106
RSB 72
Concrete
PPCI 381
PPCB 105
PPCS 48
Total 712
KEY PARAMETERS
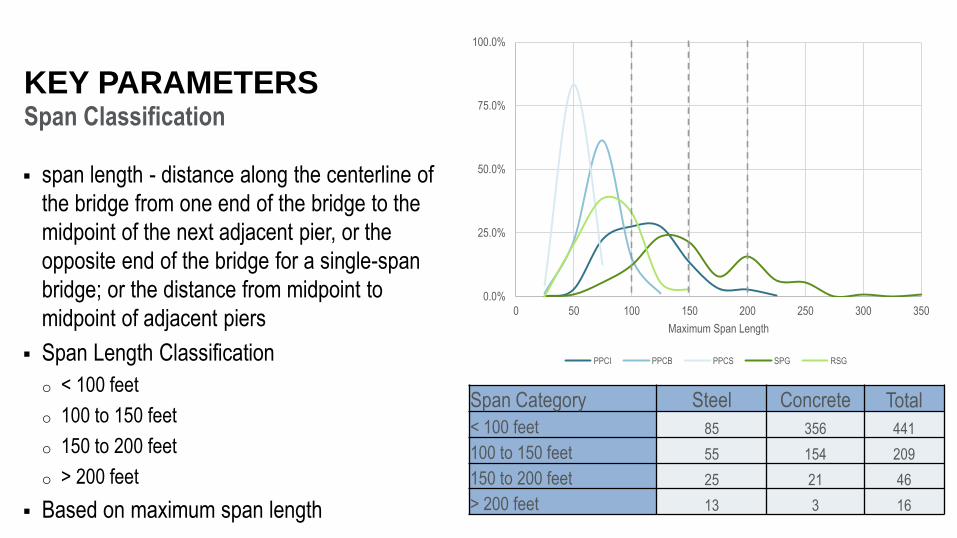
span length - distance along the centerline of
the bridge from one end of the bridge to the
midpoint of the next adjacent pier, or the
opposite end of the bridge for a single-span
bridge; or the distance from midpoint to
midpoint of adjacent piers
Span Length Classification
o < 100 feet
o 100 to 150 feet
o 150 to 200 feet
o > 200 feet
Based on maximum span length
Span Classification
0.0%
25.0%
50.0%
75.0%
100.0%
0 50 100 150 200 250 300 350
Maximum Span Length
PPCI PPCB PPCS SPG RSG
Span Category Steel Concrete Total
< 100 feet 85 356 441
100 to 150 feet 55 154 209
150 to 200 feet 25 21 46
> 200 feet 13 3 16
KEY PARAMETERS
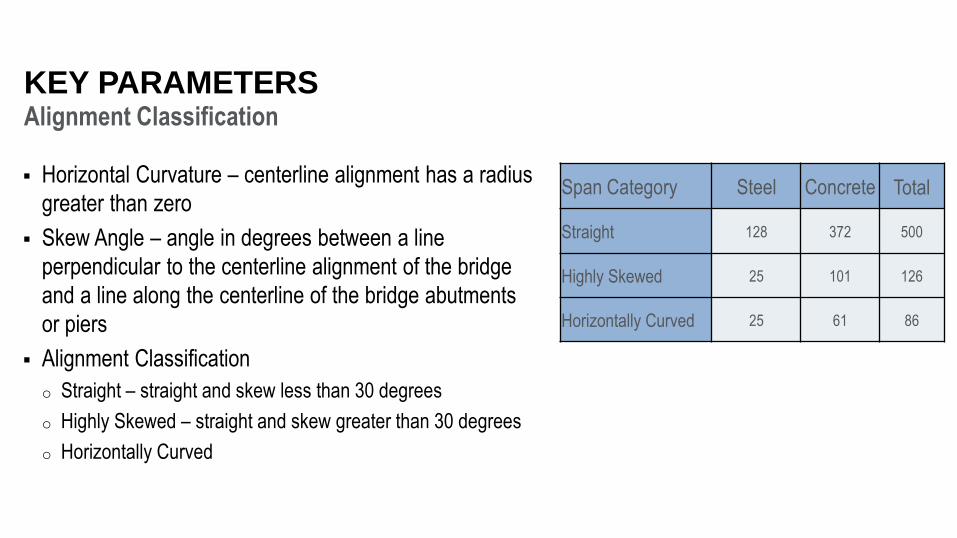
Horizontal Curvature – centerline alignment has a radius
greater than zero
Skew Angle – angle in degrees between a line
perpendicular to the centerline alignment of the bridge
and a line along the centerline of the bridge abutments
or piers
Alignment Classification
o Straight – straight and skew less than 30 degrees
o Highly Skewed – straight and skew greater than 30 degrees
o Horizontally Curved
Alignment Classification
Span Category Steel Concrete Total
Straight 128 372 500
Highly Skewed 25 101 126
Horizontally Curved 25 61 86
$0
$100
$200
$300
$400
$500
$600
SPG RSB PPCI PPCB PPCS
Steel Concrete
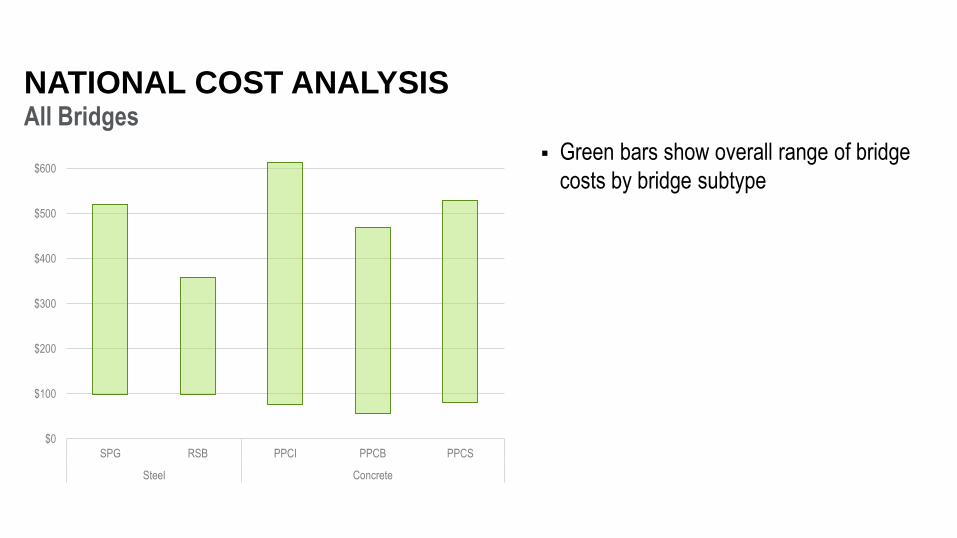
All Bridges
NATIONAL COST ANALYSIS
Green bars show overall range of bridge
costs by bridge subtype
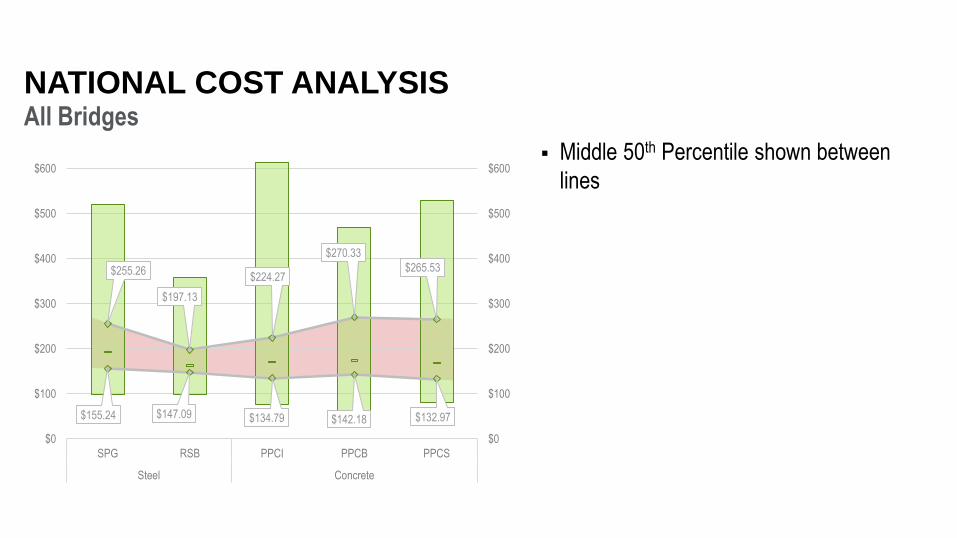
$155.24 $147.09 $134.79 $142.18 $132.97
$255.26
$197.13
$224.27
$270.33
$265.53
$0
$100
$200
$300
$400
$500
$600
$0
$100
$200
$300
$400
$500
$600
SPG RSB PPCI PPCB PPCS
Steel Concrete
All Bridges
NATIONAL COST ANALYSIS
Middle 50th Percentile shown between
lines
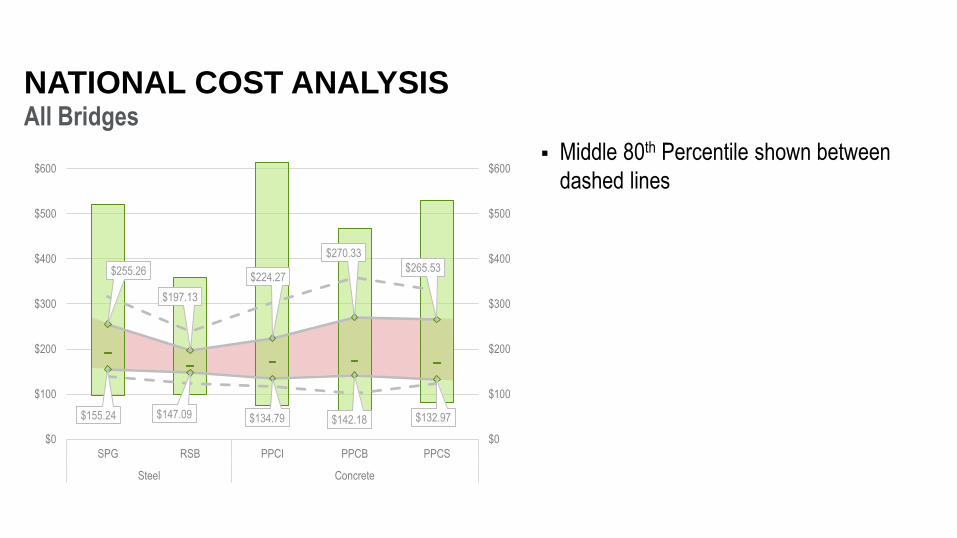
All Bridges
NATIONAL COST ANALYSIS
Middle 80th Percentile shown between
dashed lines
$155.24 $147.09 $134.79 $142.18 $132.97
$255.26
$197.13
$224.27
$270.33
$265.53
$0
$100
$200
$300
$400
$500
$600
$0
$100
$200
$300
$400
$500
$600
SPG RSB PPCI PPCB PPCS
Steel Concrete
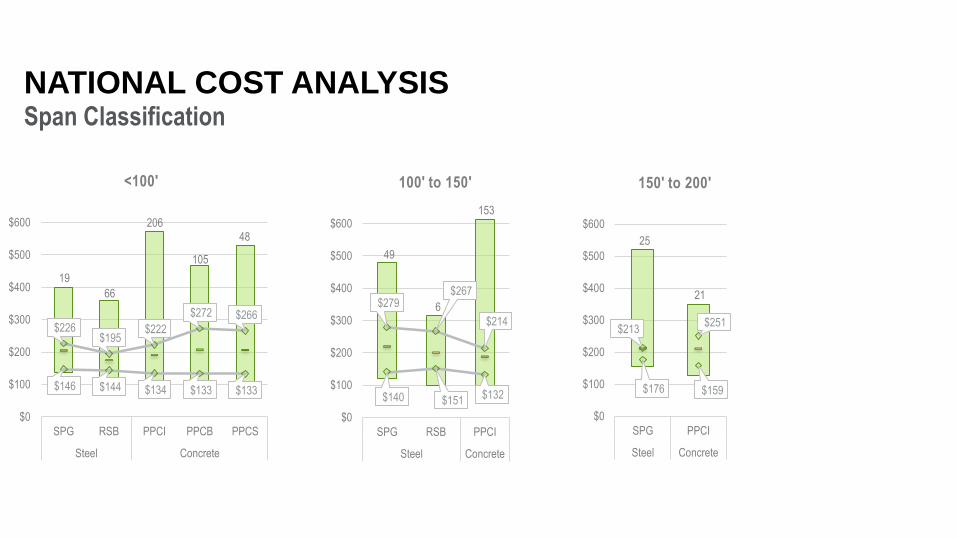
Span Classification
NATIONAL COST ANALYSIS
$146 $144 $134 $133 $133
$226 $195
$222
$272 $266
19
66
206
105
48
$0
$100
$200
$300
$400
$500
$600
SPG RSB PPCI PPCB PPCS
Steel Concrete
<100'
$140 $151 $132
$279 $267
$214
49
6
153
$0
$100
$200
$300
$400
$500
$600
SPG RSB PPCI
Steel Concrete
100' to 150'
$176 $159
$213 $251
25
21
$0
$100
$200
$300
$400
$500
$600
SPG PPCI
Steel Concrete
150' to 200'
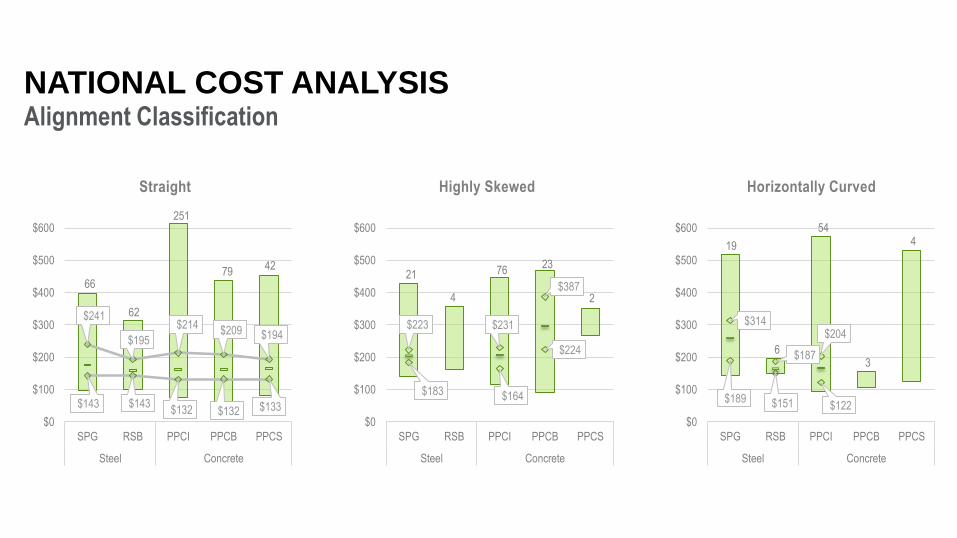
Alignment Classification
NATIONAL COST ANALYSIS
$143 $143 $132 $132 $133
$241
$195
$214 $209 $194
66
62
251
79 42
$0
$100
$200
$300
$400
$500
$600
SPG RSB PPCI PPCB PPCS
Steel Concrete
Straight
$183 $164
$224
$223 $231
$387 21
4
76 23
2
$0
$100
$200
$300
$400
$500
$600
SPG RSB PPCI PPCB PPCS
Steel Concrete
Highly Skewed
$189 $151 $122
$314
$187
$204
19
6
54
3
4
$0
$100
$200
$300
$400
$500
$600
SPG RSB PPCI PPCB PPCS
Steel Concrete
Horizontally Curved

04 KEY TAKEAWAYS
There is significant overlap in all bridge cost ranges, especially within the middle 50th percentile of projects
At the 75th Percentile - The most cost competitive bridge type is Rolled Steel Beam / The least cost competitive
bridge type is Concrete Box Beam
Steel Plate Girder and Concrete I-Beam bridge costs are consistently within a similar range for the middle 50th
percentile
Steel Plate Girder bridges are more cost competitive in the <100’ span classification than Box Beam and Slab Beam
bridges
Designers need to understand the current steel market as part of their bridge selection process
KEY TAKEAWAYS

QUESTIONS?