Embed Size (px)
Citation preview

© 2017 Neil Marshall Wilson

MECHANISTIC INSIGHTS INTO THE DIRECT SYNTHESIS OF H2O2 ON TRANSITION
METAL CATALYSTS
BY
NEIL MARSHALL WILSON
DISSERTATION
Submitted in partial fulfillment of the requirements
for the degree of Doctor of Philosophy in Chemical Engineering
in the Graduate College of the
University of Illinois at Urbana-Champaign, 2017
Urbana, Illinois
Doctoral Committee:
Assistant Professor David W. Flaherty, Chair
Professor Edmund G. Seebauer
Associate Professor Prashant K. Jain
Assistant Professor Damien S. Guironnet

ii
ABSTRACT
H2O2 is less environmentally impactful than many industrial oxidants such as Cl2. The
auto-oxidation of anthraquinones is the current standard for industrial H2O2 production, however,
this process requires significant energy input due to the extensive purification and concentration
processes involved, making H2O2 cost-prohibitive for many oxidation processes. As a result,
there is clear motivation for less expensive and energy-demanding chemistries for H2O2
production, such as the direct synthesis of H2O2 (H2 + O2 → H2O2), the most promising
alternative to using anthraquinones. Unfortunately, the combustion of H2 is thermodynamically
favored over direct synthesis to H2O2 on most transition metal catalysts, and so significant
research has been directed towards improving catalyst selectivity towards H2O2 through various
methods. Despite significant research, the mechanism of this reaction, and the reasons for the
importance of seemingly unrelated factors (e.g., metal cluster size, solvent pH, alloying), have
remained unclear. The aim of this work is to provide a fundamental understanding of these
factors through rigorous experimental procedures and analysis.
Here, we propose a mechanism for H2O2 formation on Pd clusters consistent with steady-
state H2O2 and H2O formation rates measured as functions of reactant pressures and temperature,
and the interpretations of proton concentration effects. H2O2 forms by sequential proton-electron
transfer to O2 and OOH surface intermediates, whereas, H2O forms by O-O bond rupture within
OOH surface species. Direct synthesis, therefore, does not proceed by the Langmuir-
Hinshelwood mechanism often invoked. Rather, H2O2 forms by heterolytic reaction pathways
resembling the two electron oxygen reduction reaction (ORR), however, the chemical potential
of H2 replaces an external electrical potential as the thermodynamic driving force. Similar
iii
experimental procedures have shown that this proton-electron transfer mechanism is the same
also on AuPd and PdZn catalysts.
Among AuPd and PdZn catalysts, increases in the Au:Pd or Zn:Pd ratio leads to
simultaneous but unequal increases in the activation enthalpies (∆𝐻‡) for both H2O2 and H2O
formation, which must result from significant electronic changes to Pd by Au or Zn. Detailed
comparisons of these changes in ∆𝐻‡ for H2O2 and H2O production to H2O2 selectivities provide
compelling evidence that these electronic effects are primarily responsible for the high H2O2
selectivities commonly reported on bimetallic catalysts. Additionally, these results lack trends
that suggest ensemble effects contribute significantly to the increase in H2O2 selectivity observed
on bimetallic catalysts within the ranges of metal compositions tested here.
AgPt octahedra with dilute concentrations of surface Pt atoms were synthesized to test for
the presence of ensemble effects which presumably do not manifest until the active sites (i.e., Pt)
are sufficiently diluted with a metal which weakly binds O2 (i.e., Ag). Combining Pt with Ag
increases H2O2 selectivity and significantly modifies the electronic structure of Pt active sites,
which is reflected by a red shift in the ν(C=O) singleton frequency in 13CO, which is
accompanied by a significant decrease in ∆𝐻‡ values for H2O2 formation and a smaller decrease
for H2O formation. These combined results show that adding Ag to Pt increases H2O2 selectivity
by a combination of electronic modification of Pt atoms (likely due to tensile strain effects) and a
commensurate increase in the number of isolated Pt atoms that lack sufficiently large numbers of
Pt atoms to cleave O-O bonds to form H2O. Collectively, the results of these studies clarify many
previously reported phenomena and help to guide the rational design of selective catalysts for the
direct synthesis of H2O2.

iv
To My Parents

v
ACKNOWLEDGEMENTS
I would like to thank my advisor, Prof. David Flaherty, for his guidance, dedication, and
high spirits in times of difficulty. Without the strong example that he set and his high
expectations for excellence, I would not be the researcher that I am today. I would also like to
thank my labmates and colleagues who I am fortunate enough to have also as my friends.
Specifically, I would like to thank Dr. SiWei (Andy) Chang and Megan Witzke who I have had
the honor to work with the longest, as well as Pranjali Priyadrashini, Daniel Bregante, Yung-Tin
(Frank) Pan, and Johanna Schröder who have worked closely with me on this project in
particular. Additionally, I would like to thank (former) undergraduate researchers Rong Jiao,
Christine Rovani, and Luke Greenfield, who helped me both with the project and to grow as a
mentor. I would like to thank Michael (Hodge) Harland for his help building whatever I needed
to keep the project running smoothly and for always being someone I could talk to. Thank you to
John Rosheck and Kyle Webb for their high-quality work building or repairing various pieces of
research equipment. I would like to thank Rebecca Corman for proofreading this dissertation and
for being a continuous source of support. I am immensely grateful to all my friends and family
for believing in and supporting me during this time, particularly my parents Leslie and Barry
Wilson, who have always been there for me.
This work was supported by a research grant from the National Science Foundation
(CBET-15531377) and a departmental graduate student fellowship funded by the Dow Chemical
Company. This work was carried out in part in the Frederick Seitz Materials Research
Laboratory Central Research Facilities, University of Illinois.
vi
TABLE OF CONTENTS
CHAPTER 1: INTRODUCTION……………………………………………………..…….…....1
CHAPTER 2: MECHANISM FOR THE DIRECT SYNTHESIS OF H2O2 ON Pd CLUSTERS:
HETEROLYTIC REACTION PATHWAYS AT THE LIQUID-SOLID INTERFACE………..11
CHAPTER 3: DIRECT SYNTHESIS OF H2O2 ON Pd AND AuxPd1 CLUSTERS:
UNDERSTANDING THE EFFECTS OF ALLOYING Pd WITH Au……………………..…...48
CHAPTER 4: DIRECT SYNTHESIS OF H2O2 ON AgPt OCTAHEDRA: THE IMPORTANCE
OF Ag-Pt INTERACTIONS FOR HIGH H2O2 SELECTIVITY………………………………..87
CHAPTER 5: PdZn NANOPARTICLES AS A SELECTIVE CATALYST FOR THE DIRECT
SYNTHESIS OF H2O2………………………………………………...……………………….112
CHAPTER 6: CONCLUSIONS AND OUTLOOK…………………………………………...144
REFERENCES………………………………………………………………………………...155
APPENDIX A: SUPPLEMENTARY DATA AND ANALYSIS FOR CHAPTER 2…….......163
APPENDIX B: SUPPLEMENTARY DATA AND ANALYSIS FOR CHAPTER 3…….......188
APPENDIX C: SUPPLEMENTARY DATA AND ANALYSIS FOR CHAPTER 4…….......222
APPENDIX D: SUPPLEMENTARY DATA AND ANALYSIS FOR CHAPTER 5…….......237
1
CHAPTER 1
INTRODUCTIONi
1.1 H2O2 as a Green Oxidant to Replace Chlorine
Selective oxidations are used at the industrial scale in the manufacture of many familiar
products used today. The activation of strong C-H bonds in alkanes and the epoxidation of
alkenes by selective oxidants are involved in the synthesis of building block chemicals (e.g.,
ethylene oxide, propylene oxide, adipic acid) used to produce indispensable materials (e.g.,
polyurethane, nylon, polyethylene terephthalate).1,2 Oxidations are important also in the non-
destructive bleaching of paper,3 the disinfection of wastewater,4,5 and the deactivation of
chemical warfare agents.6 Many of these oxidations are currently accomplished through the use
of chlorinated oxidizers, however, their potential for severe environmental impact motivate the
replacement of Cl containing oxidants with those derived from O2 such as H2O2 (the focus of this
research) as well as O2 and O3, which are more environmentally benign. However, as discussed
below, there are significant environmental and economic barriers to overcome before chlorinated
oxidants can be replaced.
Chlorine containing compounds (e.g., Cl2, NaClO) are often used for oxidations3,4
because they are not only selective but also inexpensive and available in large quantities from the
chlor-alkali process. This well-established process converts brine (NaCl solution) into Cl2, H2,
and caustic soda (NaOH) by electrolysis and is practiced on an incredible scale (4.5·107 tons Cl
produced and 1.5·1011 kWh energy consumed annually).7,8 Consequently, the use of Cl has
become engrained in many industrial processes, such as oxidations, despite the difficulties and iThis chapter has been adapted from the following publication:
Wilson, N.M., Bregante, D.T., Priyadarshini, P., and Flaherty, D.W., Production and Use of H2O2 for Atom-
Efficient Functionalization of Hydrocarbons and Small Molecules, Catalysis, 2017, 29, 122-212
2
dangers associated with use and storage of large quantities of Cl.7,9 Cl can be insidious, and even
when proper care is taken, it may be released into the environment where it forms carcinogenic
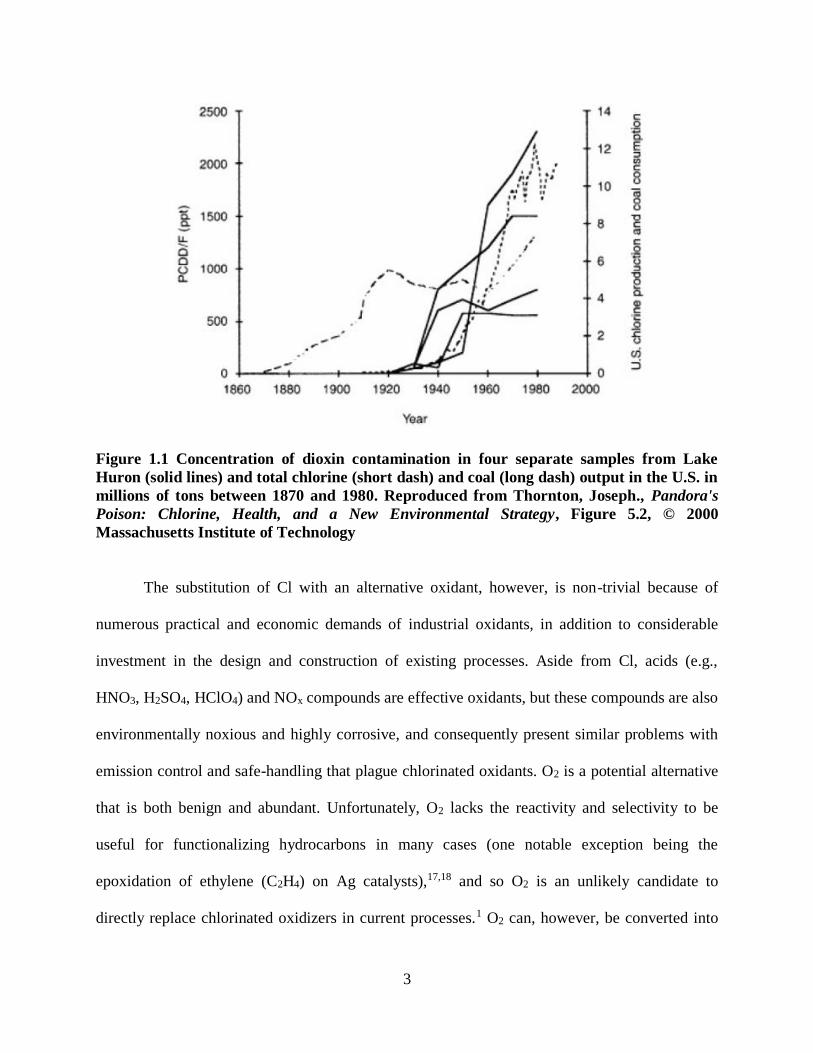
and corrosive residues (e.g., chlorinated dioxins, chloroform).10-12 Figure 1.1 shows that
environmental dioxin contamination near Lake Huron increased roughly in proportion to the
scale of the chlor-alkali industry in the United States during the past century. While there is
evidence for the negative impact of chlorine contamination (Fig. 1.1), there is still much that is
unknown about the scale and potential environmental impact of Cl contamination in the air and
soil.13,14 United States federal regulation standards require that potential contaminants be proven
undoubtedly hazardous prior to implementing regulatory actions (or changes in regulations),15
therefore, little governmental regulation has been put in place to limit environmental Cl
exposure. Currently, only 65% of all Cl consumed is used in the manufacture of Cl-containing
products (i.e., those that must necessarily use Cl, which include polyvinyl chloride (PVC),
inorganics such as HCl, chlorofluorocarbons, pesticides, etc.).15 Thus, nearly 35% of all Cl
produced is used needlessly in oxidations whose products do not contain Cl.15 Moreover,
demand for Cl2 (and not NaOH) drives the volume of production in the chlor-alkali industry.16
Finally, many Cl-mediated oxidations use basic solutions (e.g., NaOH) downstream to eliminate
Cl from intermediates but produce large amounts of salt and organic wastes. Consequently, these
processes are far from being atom-efficient and following the tenants of green chemistry. Thus,
large-scale implementation of alternative oxidants in industrial processes may dramatically
decrease the overall amount of Cl produced and thereby reduce its environmental impact.
3
Figure 1.1 Concentration of dioxin contamination in four separate samples from Lake
Huron (solid lines) and total chlorine (short dash) and coal (long dash) output in the U.S. in
millions of tons between 1870 and 1980. Reproduced from Thornton, Joseph., Pandora's
Poison: Chlorine, Health, and a New Environmental Strategy, Figure 5.2, © 2000
Massachusetts Institute of Technology
The substitution of Cl with an alternative oxidant, however, is non-trivial because of
numerous practical and economic demands of industrial oxidants, in addition to considerable
investment in the design and construction of existing processes. Aside from Cl, acids (e.g.,
HNO3, H2SO4, HClO4) and NOx compounds are effective oxidants, but these compounds are also
environmentally noxious and highly corrosive, and consequently present similar problems with
emission control and safe-handling that plague chlorinated oxidants. O2 is a potential alternative
that is both benign and abundant. Unfortunately, O2 lacks the reactivity and selectivity to be
useful for functionalizing hydrocarbons in many cases (one notable exception being the
epoxidation of ethylene (C2H4) on Ag catalysts),17,18 and so O2 is an unlikely candidate to
directly replace chlorinated oxidizers in current processes.1 O2 can, however, be converted into

4
more reactive species such as ozone or hydrogen peroxide. O3 is formed by exposing O2 to an
electrical discharge or UV-light, however, this method is both expensive and slow. Further, O3
tends to react non-specifically and is highly toxic.19 H2O2 is a strong oxidizer with significant
potential to replace Cl because H2O2 possesses desirable chemical selectivity, forms benign
byproducts (e.g., H2O), and is more safely stored and transported.19,20 Consequently, the volume
of H2O2 consumed has increased by a factor of five over a 20 year period (Table 1.1).
Unfortunately, the current cost of H2O2 ($52 kmol-1) is greater than that for Cl2 ($20 kmol-1),21
which together with stoichiometric arguments (i.e., one mole of Cl2 can oxidize two moles of
reactant while H2O2 can only oxidize one) demonstrates that economic considerations favor the
continued use of Cl2. Thus, the high cost of H2O2 is the predominant factor that has limited its
implementation in new chemical plants, therefore, reducing the cost of H2O2 is a necessary first
step to begin the process of replacing chlorinated oxidants.
Table 1.1 Consumption of H2O2 in North America in 103 t Use Area 1980 1990 1995 2000a
pulp and paper 32 144 340 410
textile 28 34 40 63
chemicalb 44 52 59 75
environmentalc 10 23 31 66
other 30 39 41 67
Total 144 292 511 681 aEstimate bIncludes captive use cIncludes mining industry
Recreated from Eul, W. Moeller, A. and Steiner, N., Hydrogen Peroxide, Kirk-Othmer Encyclopedia of Industrial
Chemical Technology, © 2004 John Wiley and Sons Inc.
1.2 Current H2O2 Production Methods
Currently more than 95% of all H2O2 is produced via the anthraquinone auto-oxidation
process (AO).20,22 This process is well-established and forms H2O2 with high selectivity (≥

5
99%),23 however, AO suffers from several economic and environmental drawbacks. AO requires
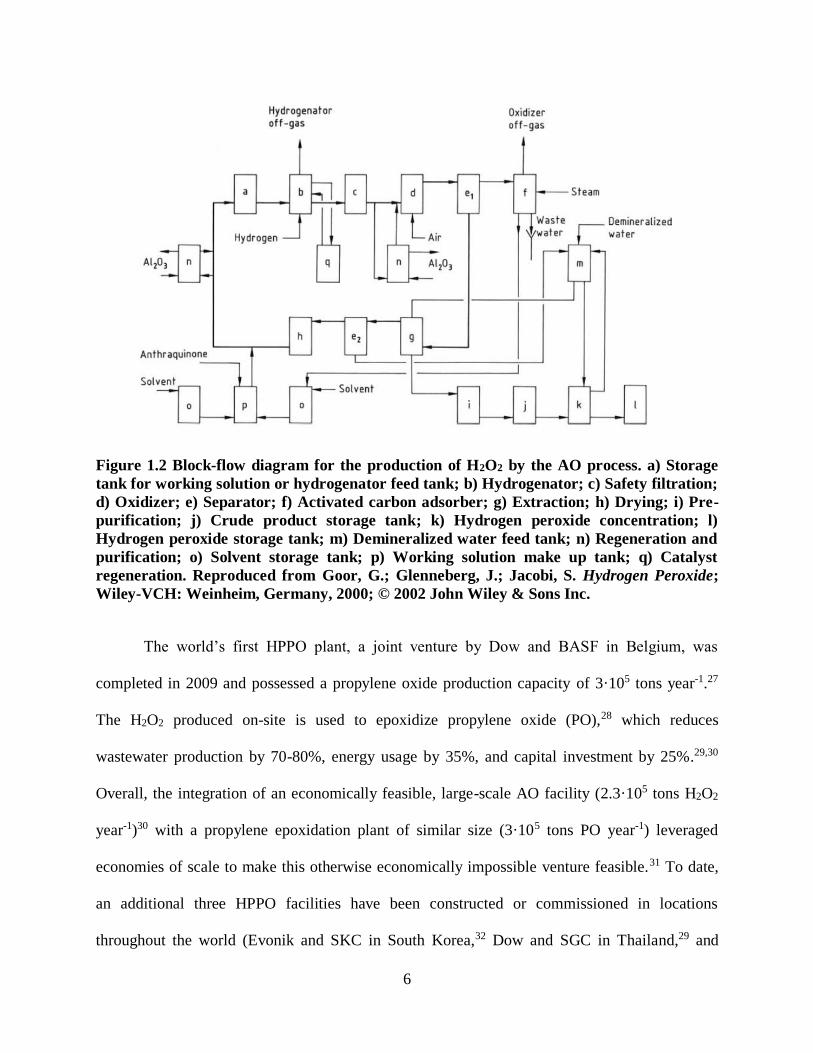
a significant number of unit operations (Figure 1.2).24 First, H2O2 forms as dilute solutions (0.8-
1.9 wt. %)20 in an organic solvent using two sequential reactors for the reduction and oxidation
of the anthraquinone substrate. Second, crude aqueous H2O2 solutions are generated by liquid-
liquid extraction (to 15-40 wt. %) and these are subsequently purified and concentrated by
energy-intensive distillation steps (to 50-70 wt. %).24 Additionally, the insolubility of
anthraquinones in aqueous solutions requires the use of hazardous organic solvents (e.g.,
benzene, xylene, alkyl phosphates).24 These requirements cause AO to only be economically
viable for large-scale production (> 4·104 tons yr-1),25 and therefore, make on-site production of
H2O2 (a desirable option for reducing transportation costs) infeasible in many applications. The
hydrogen peroxide – propylene oxide (HPPO) process is one notable exception which
demonstrates the potential for on-site H2O2 production to transform industrial oxidations.26
6
Figure 1.2 Block-flow diagram for the production of H2O2 by the AO process. a) Storage
tank for working solution or hydrogenator feed tank; b) Hydrogenator; c) Safety filtration;
d) Oxidizer; e) Separator; f) Activated carbon adsorber; g) Extraction; h) Drying; i) Pre-
purification; j) Crude product storage tank; k) Hydrogen peroxide concentration; l)
Hydrogen peroxide storage tank; m) Demineralized water feed tank; n) Regeneration and
purification; o) Solvent storage tank; p) Working solution make up tank; q) Catalyst
regeneration. Reproduced from Goor, G.; Glenneberg, J.; Jacobi, S. Hydrogen Peroxide;
Wiley-VCH: Weinheim, Germany, 2000; © 2002 John Wiley & Sons Inc.
The world’s first HPPO plant, a joint venture by Dow and BASF in Belgium, was
completed in 2009 and possessed a propylene oxide production capacity of 3·105 tons year-1.27
The H2O2 produced on-site is used to epoxidize propylene oxide (PO),28 which reduces
wastewater production by 70-80%, energy usage by 35%, and capital investment by 25%.29,30
Overall, the integration of an economically feasible, large-scale AO facility (2.3·105 tons H2O2
year-1)30 with a propylene epoxidation plant of similar size (3·105 tons PO year-1) leveraged
economies of scale to make this otherwise economically impossible venture feasible.31 To date,
an additional three HPPO facilities have been constructed or commissioned in locations
throughout the world (Evonik and SKC in South Korea,32 Dow and SGC in Thailand,29 and
7
Evonik and Uhde in China33). Such schemes are not currently possible at the smaller scales
typical of many other oxidation chemistries (e.g., paper bleaching,3 disinfection of
wastewater4,5), however, the development of an alternative to AO would enable the cost-effective
use of H2O2 as an oxidant for these small scale processes.
1.3 Alternative H2O2 Production Methods
Alternative approaches for the formation of H2O2, which do not face the challenges of
AO and might be feasible for small on-site facilities, include electrochemical O2 reduction,
photocatalytic O2 reduction, and direct synthesis of H2O2. The electrocatalytic two-electron
oxygen reduction reaction (ORR, O2 + 2H+ + 2e- → H2O2) is one alternative approach.34-37 This
reaction has the advantage that the chemical energy lost from non-selective H2 conversion to
H2O can be partially recovered as electrical energy,38 but the reaction is driven by applying an
electrical over-potential across a proton exchange membrane and requires corrosive alkali
solutions for proton conductivity.39 While electrochemical processes could possibly be scaled up,
they require electrical energy derived from a source higher in energy (e.g., chemical energy
derived from shale gas or renewable sources), therefore, direct use of chemical energy in the
form of H2 may be a more energy efficient method for producing H2O2. Another alternative
approach is the absorption of UV light by a semiconductor (typically TiO2), which leads to the
excitation of electrons to the conduction band and subsequent reduction of O2, followed by
reaction with protons from the solution to form H2O2.40,41 Unfortunately, photon-mediated
methods give low rates and produce only micromolar concentrations of H2O2, which are useful
primarily for environmental remediation of dilute contaminants in situ and other niche
applications. Therefore, photoelectrochemical H2O2 production is not easily intensified and
8
coupled with an industrial oxidation process. Similarly low H2O2 formation rates and yields
plague a number of other H2O2 synthesis approaches including electrical discharge (i.e., plasma)
driven reactions of O2 with H242 and the oxidation of CO in the presence of water and a catalyst
(CO + O2 + H2O → H2O2 + CO2).43
One of the most promising alternatives to the AO process is the direct synthesis of H2O2
(H2 + O2 → H2O2), which can achieve high yields (up to 10 wt. % H2O2),31 requires less energy
to operate than AO (i.e., fewer separation and concentration steps), and may be reasonably scaled
to small facilities for on-site use.25 The first patent for the direct synthesis of H2O244 was
published in 1914 (25 years prior to the first AO patent)45 by German scientists Hugo Henkel and
Walter Weber as a replacement for the electrolysis of ammonium sulfate (the primary method for
H2O2 formation at the time).25 Notably, the original patent identifies specific catalysts and
suggests process conditions that are still used today (e.g., Pd catalysts46 and aqueous solvents).
Despite these initial achievements, the process was never fully implemented at an industrial scale
primarily due to safety concerns about the explosive H2-O2 reactant mixtures25 and low
selectivities towards H2O2 on Pd catalysts (< 70%).47,48 Few patents for direct synthesis on Pd
catalysts have been filed and maintained subsequently, and many of these claim only moderate
selectivities (~ 70%) and require the use of potentially hazardous additives such as acids and
halides.49-52 As such, the most significant advancements in the industrial production of H2O2
include the integration of AO with other processes, such as the development of HPPO plants (see
Section 1.2.).30,53 The merits of such processes were recognized widely when the HPPO process
received a Presidential Green Chemistry Challenge Award in 201054 and underline the emerging
need for cheaper and environmentally benign industrial oxidants in order to both satisfy the
needs of a growing population and reduce the environmental impact of those processes. AO is,

9
however, only viable at large scales25 and therefore cannot fully meet the needs of many smaller
processes (e.g., pulp and paper bleaching, wastewater treatment) at cost-effective prices. Wide-
spread use of H2O2 will likely follow the development of significantly more selective catalysts
and efficient processes for the direct synthesis of H2O2.31 These considerations and the current
low price of shale gas, and related cost of H2 ($2.6 MBTU-1),55,56 motivate current interest in
improving the selectivity and practicality of the direct synthesis reaction.
This work focuses on improving the understanding of the direct synthesis of H2O2 on
various transition metal catalysts to facilitate the rational design of catalysts which are highly
selective to H2O2 and deliver profitable H2O2 formation rates at near-ambient reaction conditions
(e.g., > 300 K, < 200 kPa). The detailed mechanisms by which H2O2 (H2 + O2 → H2O2) forms
during direct synthesis is the subject of numerous studies over the past two decades.57-64 Despite
the significant research into the mechanism responsible for H2O2 formation during direct
synthesis, there is no consensus on the mechanism. In Chapter 2, the direct synthesis mechanism
is investigated in detail using elementary step analysis of rate data obtained at various reaction
conditions (e.g., reactant pressure, temperature, solvent identity). It has been shown extensively
that alloying Au with Pd can significantly increase both H2O2 selectivities and formation rates in
comparison with monometallic Pd.65-69 While this is a significant breakthrough in direct
synthesis research, the mechanistic or energetic reasons for these improvements are still the
subject of active research. In Chapter 3, AuPd catalysts with various ratios of Au:Pd are studied
by measuring their activation enthalpies and relating these values to changes in measured H2O2
selectivities and formation rates in an effort to better understand why alloying Pd with Au results
in such marked improvements to H2O2 selectivity. The beneficial effects of alloying Au with Pd
have been attributed to the inhibition of Pd hydride formation at reaction conditions.70 In Chapter
10
4 these effects are probed by studying AgPt octahedra catalysts, which cannot form a metal-
hydride at the mild conditions common to direct synthesis research. In addition, metal cluster
size has been shown to affect H2O2 selectivity.71 The fractional coverage of Pt on the AgPt
octahedra catalysts presented in Chapter 4 was controllable using pretreatments in either CO or
He, allowing for measurements on catalysts with different Ag:Pt ratios but identical shapes and
sizes. Since the identification of AuPd as the most promising direct synthesis catalyst, additional
Pd-metal combinations with less precious metals (e.g., -Sn, -Zn, -Co, -In, -Ga, -Ni) have been
shown to be effective for direct synthesis following specific alternating oxidation and reduction
pretreatments.72 In Chapter 5, PdZn is investigated as an alternative to AuPd for selective direct
synthesis. Specifically, the reasons for why PdZn is both selective and reactive towards H2O2 and
how the presence of unalloyed Pd within the catalyst can negatively influence selectivity. In
Chapter 6, concluding remarks for these combined works are provided and future directions are
suggested.
11
CHAPTER 2
MECHANISM FOR THE DIRECT SYNTHESIS OF H2O2 ON Pd CLUSTERS:
HETEROLYTIC REACTION PATHWAYS AT THE LIQUID-SOLID INTERFACEii
2.1 Introduction
Hydrogen peroxide (H2O2) is an effective and environmentally benign alternative to
chlorinated oxidizers (e.g., HClO, ClO2) commonly used to selectively oxidize organic
molecules (e.g., propylene), bleach pulp and paper, and treat wastewater.24 The primary
byproducts of the reactions between H2O2 and organic compounds are H2O and O2, therefore,
H2O2 is an appealing oxidant, which, unlike chlorinated oxidizers, does not produce toxic
chloroform, dioxins, and polychlorinated hydrocarbons.10,11 Yet, the current market cost of H2O2
is not competitive with chlorinated oxidizers, because the dominant method for H2O2 production
(anthraquinone auto-oxidation (AO))24 inherently requires energy-intensive separation and
concentration steps, and thus, has high capital and operating costs. In order for H2O2 to be more
widely used, costly separation steps must be eliminated,20 and therefore, its production cannot
involve anthraquinones. Rather, H2O2 needs to be produced by a radically different catalytic
chemistry.
The direct synthesis of H2O2 (H2 + O2→ H2O2) appears to be the most promising
alternative to AO.20,73 Direct synthesis does not involve organic substrates (i.e., anthraquinones),
uses greener solvents (e.g., H2O, CH3OH), and consequently, requires fewer separation steps and
much less energy to produce H2O2.20,74 Direct synthesis, however, suffers from low H2O2
selectivity, because significant amounts of H2O form by primary and secondary reactions that
irreversibly cleave the O-O bond46 of surface intermediates chemisorbed on transition metal
iiThis chapter has been adapted from the following publication:
Wilson, N.M. and Flaherty, D.W., Mechanism for the Direct Synthesis of H2O2 on Pd Clusters: Heterolytic Reaction
Pathways at the Liquid Solid Interface, J. Am. Chem. Soc., 2016, 138, 574-586
12
cluster catalysts.65,73,75-77 The greatest H2O2 selectivities are achieved on catalysts that cleave O-
O bonds at low rates78,79 but add hydrogen to O2* at high rates.76 Pd catalysts have higher H2O2
selectivities (60-75%) than Pt (5-20%)80 and give H2O2 formation rates nearly 100-fold greater
than those for Au.66,69 Yet Pd only gives such high selectivities in strongly acidic solvents (e.g.,
ethanol, 0.12 M H2SO4)80 containing halides (e.g., Cl-, Br-), which modify the reactivity of the Pd
surfaces in ways not fully understood.48,68,80-82 Researchers must develop catalysts that give
greater selectivities towards H2O2, without the need for solvents containing mineral acids and
halides, for direct synthesis to be more viable.24,82
Rational design of such catalysts requires fundamental, molecular-level knowledge of the
mechanism for H2O2 formation on metal clusters, however, the direct synthesis reaction is poorly
understood. H2O2 formation rates on Pd clusters depend strongly on several seemingly disparate
factors including the pH of the solvent,83-85 the presence (or absence) of halide co-adsorbates,84-87
and the size of the metal clusters.71,88 The manner by which these factors collectively determine
H2O2 selectivities and rates has not been resolved in previous studies. Protons (H+) have been
suggested to affect surface chemistry through indirect (i.e., electronic interactions)83 or by
directly participating in O2 reduction.64,86 The additions of mineral acids (e.g., HCl,83,89
H2SO4,80,83 H3PO4,
84,86 HNO384) to solvents for direct synthesis increase the concentrations of H+
and H2O2 selectivities, but they also introduce strongly binding anions (e.g., Cl-, SO42-, PO4
3-,
NO3-), which modify the electronic structure of metal clusters directly. To the best of our
knowledge, there are no direct measurements that implicate H+ in the direct synthesis of H2O2.
The addition of halides to Pd clusters in acidic ethanol (0.12 M H2SO4) increases H2O2
selectivities from 60 to 80%.83 These changes have been attributed to halide adsorption blocking
sites that promote O-O bond scission78,86,90,91 or reducing the density of states near the Fermi

13
level, and consequently making metal surfaces less reactive for O-O cleavage.91-95 H2O2
selectivities do increase when halides and acids are added to solvents for direct synthesis, yet,
these species are difficult to remove from the product stream. As such there is significant interest
in using other strategies to achieve high selectivities including alloying Pd with other metals
(e.g., Au)65,82 and controlling the size of the Pd clusters.71,88 PdAu alloy nanoclusters supported
on carbon give H2O2 selectivities (80%) much greater than those on Pd (42%) and H2O2
formation rates 100 times larger than for Au.82 In addition, studies over a narrow range of Pd
cluster sizes (3.4-4.2 nm) on SiO2 show that H2O2 selectivity increases modestly with increasing
cluster size.71 The mechanisms by which alloying or changes in the cluster size affect H2O2
selectivities remain unknown but are likely related to either ensemble effects (e.g., decreased
number of sites that rupture O-O bonds)78,96 or electronic effects (e.g., reduced electron back
donation from Pd into π* orbitals of the O-O bond).88,92 The uncertain explanations for the
effects of acids and cluster size, as well as the poorly understood connections between these
factors and the mechanism for H2O2 formation, impede rational design of improved catalysts for
direct synthesis.
In this study, we propose a mechanism for direct synthesis of H2O2 on Pd clusters which
is consistent with our measurements and with previously published observations, and which
provides guiding principles for the design of metal catalysts that will give greater selectivities
and formation rates for H2O2. Here, we report steady-state H2O2 and H2O formation rates on Pd
clusters (0.7-7 nm) and their dependence on the pressure of H2 (5-400 kPa) and O2 (25-400 kPa),
the protic or aprotic nature of the reaction solvent, and the concentration and identity of proton
donors over a range of relevant temperatures (273-305 K). Formation rates of both H2O2 and
H2O are sensitive to the H2 pressure but show no dependence on the O2 pressure. H2O2
14
selectivities and formation rates require that H+ are present in the solvent and increase slightly
with the addition of H+ donors (e.g., H2SO4, HCl, or H2CO3), while rates for H2O2 formation are
immeasurable (>103 times lower) in aprotic solvents. Collectively, these rate measurements are
inconsistent with previously proposed Langmuirian reaction mechanisms. Instead, these data
show that H2O2 is formed by kinetically relevant proton (from solvent molecules) - electron
(provided by heterolytic hydrogen oxidation, H2 ↔ 2H+ + 2e-) transfer to hydroperoxy surface
intermediates. This mechanism resembles that for the two electron oxygen reduction reaction
(ORR),97 however, both "half-reactions" occur on a single Pd cluster in the absence of an
electrical potential. Rather, gaseous H2 provides a chemical potential which drives O2 reduction.
These mechanistic conclusions agree also with measured activation enthalpies (∆𝐻‡) and the
differences in their values on 0.7, 3, and 7 nm Pd clusters. Values of ∆𝐻‡ for H2O2 formation
rates remain nearly constant (9 to 14 kJ mol-1) as the mean size of the Pd clusters increase,
however, ∆𝐻‡ for H2O formation increases noticeably (18 to 32 kJ mol-1). These comparisons
show that processes that form H2O2 (proton-electron transfer) are less sensitive to changes in the
electronic structure of Pd surfaces than those that create H2O (i.e., O-O bond dissociation), which
is consistent with prior research of the ORR and our mechanistic conclusions. The data and
interpretations suggest that greater H2O2 selectivities can be achieved when metal clusters, which
heterolytically dissociate H2 and bind O2 tightly enough to facilitate electron transfer, contact
solvents with high H+ concentrations. These findings will guide the development of productive
catalysts for the direct synthesis of H2O2 and help to advance the H2O2 use for production of
commodity chemicals.
15
2.2 Materials and Methods
2.2.1 Synthesis of Supported Pd Catalysts
Pd catalysts were prepared by strong electrostatic adsorption (SEA) of Pd precursors onto
silica,98 followed by oxidation and reduction to form metallic clusters. All gases used were
99.999% pure and supplied by S.J. Smith Co. unless otherwise stated. Silica (15 g, Sigma-
Aldrich, Davisil 646, 35-60 mesh) was added to 300 cm3 of deionized (DI) water (17.8 MΩ)
followed by the addition of 30 cm3 of 14.5 M NH4OH (Macron, 28-30% wt) in order to obtain a
solution pH greater than 11. In a separate beaker, 17.4 mg of Pd(NH3)4Cl2 (Sigma-Aldrich, >
99.99%) was added to 15 cm3 of DI water, and subsequently, this solution was added to the basic
solution containing silica. The resulting solution was stirred for 3 h, and then vacuum filtered to
recover the solids. The wet solids were rinsed with an additional 500 cm3 of DI water, vacuum
filtered, and then allowed to dry. The dried solids were heated to 573 K at 3 K min-1 and then
held at 573 K for 4 h in a flowing mixture of 20 kPa H2, 81 kPa He (100 cm3 min-1) with the
intent to reduce the Pd to metallic nanoclusters. Oxidative treatments in flowing dry air (Table
2.1) were used after the initial reduction to increase the average size of the Pd clusters. These
were followed by a second reductive treatment (573 K, 4 h, 20 kPa H2, 81 kPa He, 100 cm3
min-1) to form metallic Pd nanoclusters. After reduction, all samples were passivated at ambient
temperature by exposure to a flowing (500 cm3 min-1) mixture of 4 kPa O2, 97 kPa He for 0.5 h.
16
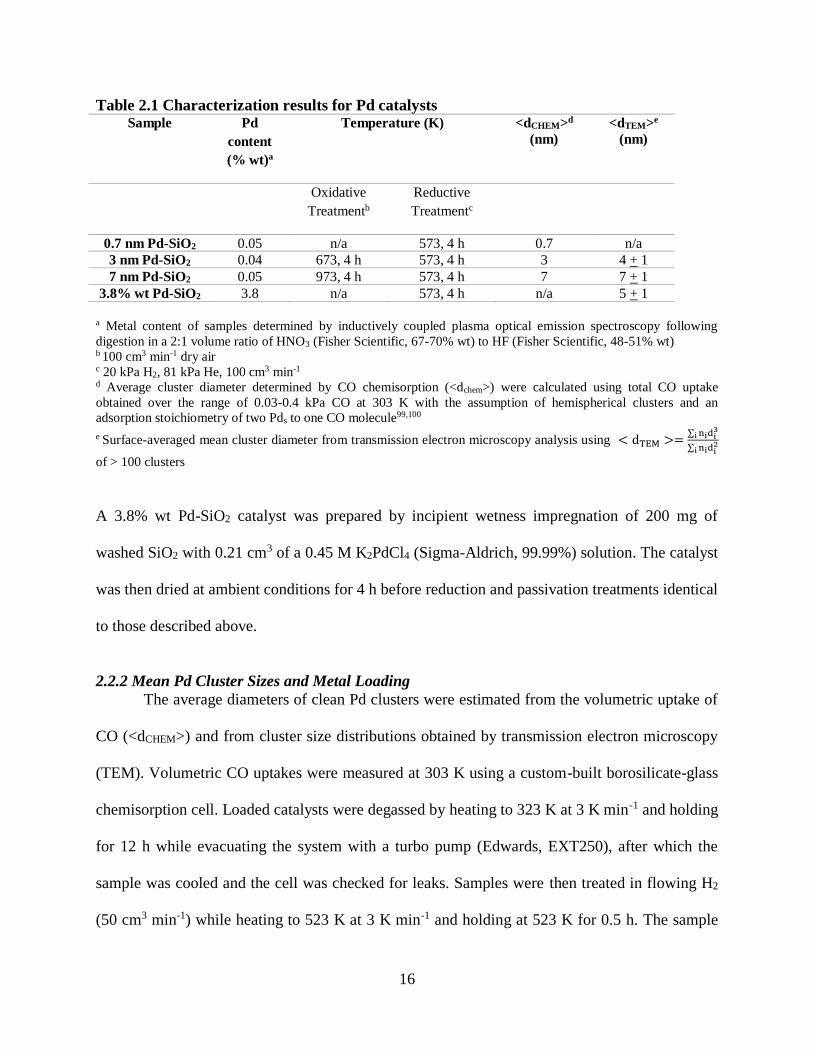
Table 2.1 Characterization results for Pd catalysts Sample Pd
content
(% wt)a
Temperature (K)
<dCHEM>d
(nm)
<dTEM>e
(nm)
Oxidative
Treatmentb
Reductive
Treatmentc
0.7 nm Pd-SiO2 0.05 n/a 573, 4 h 0.7 n/a
3 nm Pd-SiO2 0.04 673, 4 h 573, 4 h 3 4 + 1
7 nm Pd-SiO2 0.05 973, 4 h 573, 4 h 7 7 + 1
3.8% wt Pd-SiO2 3.8 n/a 573, 4 h n/a 5 + 1
a Metal content of samples determined by inductively coupled plasma optical emission spectroscopy following
digestion in a 2:1 volume ratio of HNO3 (Fisher Scientific, 67-70% wt) to HF (Fisher Scientific, 48-51% wt) b 100 cm3 min-1 dry air c 20 kPa H2, 81 kPa He, 100 cm3 min-1 d Average cluster diameter determined by CO chemisorption (<dchem>) were calculated using total CO uptake
obtained over the range of 0.03-0.4 kPa CO at 303 K with the assumption of hemispherical clusters and an
adsorption stoichiometry of two Pds to one CO molecule99,100
e Surface-averaged mean cluster diameter from transmission electron microscopy analysis using < dTEM >=∑ nidi
3i
∑ nidi2
i
of > 100 clusters
A 3.8% wt Pd-SiO2 catalyst was prepared by incipient wetness impregnation of 200 mg of
washed SiO2 with 0.21 cm3 of a 0.45 M K2PdCl4 (Sigma-Aldrich, 99.99%) solution. The catalyst
was then dried at ambient conditions for 4 h before reduction and passivation treatments identical
to those described above.
2.2.2 Mean Pd Cluster Sizes and Metal Loading
The average diameters of clean Pd clusters were estimated from the volumetric uptake of
CO (<dCHEM>) and from cluster size distributions obtained by transmission electron microscopy
(TEM). Volumetric CO uptakes were measured at 303 K using a custom-built borosilicate-glass
chemisorption cell. Loaded catalysts were degassed by heating to 323 K at 3 K min-1 and holding
for 12 h while evacuating the system with a turbo pump (Edwards, EXT250), after which the
sample was cooled and the cell was checked for leaks. Samples were then treated in flowing H2
(50 cm3 min-1) while heating to 523 K at 3 K min-1 and holding at 523 K for 0.5 h. The sample

17
was then evacuated at 523 K for 0.5 h using the turbo pump, and the cell was allowed to cool to
303 K under dynamic vacuum. The total amount of CO (S.J. Smith, 99.99%) adsorbed onto the
Pd clusters within each sample was determined by measuring volumetric uptakes between 0.03
and 0.4 kPa and extrapolating the linear portion of the isotherm to zero pressure. The number of
exposed Pd atoms (Pds) was determined by assuming a ratio of two Pds to one CO molecule.99,100
The mean cluster diameter for each sample was estimated from Pds and the total Pd loading by
assuming a hemispherical geometry and an atomic radius of 0.14 nm for Pd.
The distribution of cluster diameters was measured by bright-field TEM imaging (JEOL
2010 LaB6) of more than 100 clusters. Samples were prepared by grinding the catalyst to a fine
powder (< 200 mesh), which was then suspended in ethanol (Decon Laboratories Inc., 100%) by
gentle stirring and, loaded onto a Cu holey carbon TEM grid (200 mesh, Ted Pella Inc.). The wet
grids were dried at ambient conditions for at least 4 h. The surface area normalized average
cluster diameter (<dTEM>) for each catalyst was calculated using:
< dTEM > = ∑ nidi
3i
∑ nidi2
i (2.1)
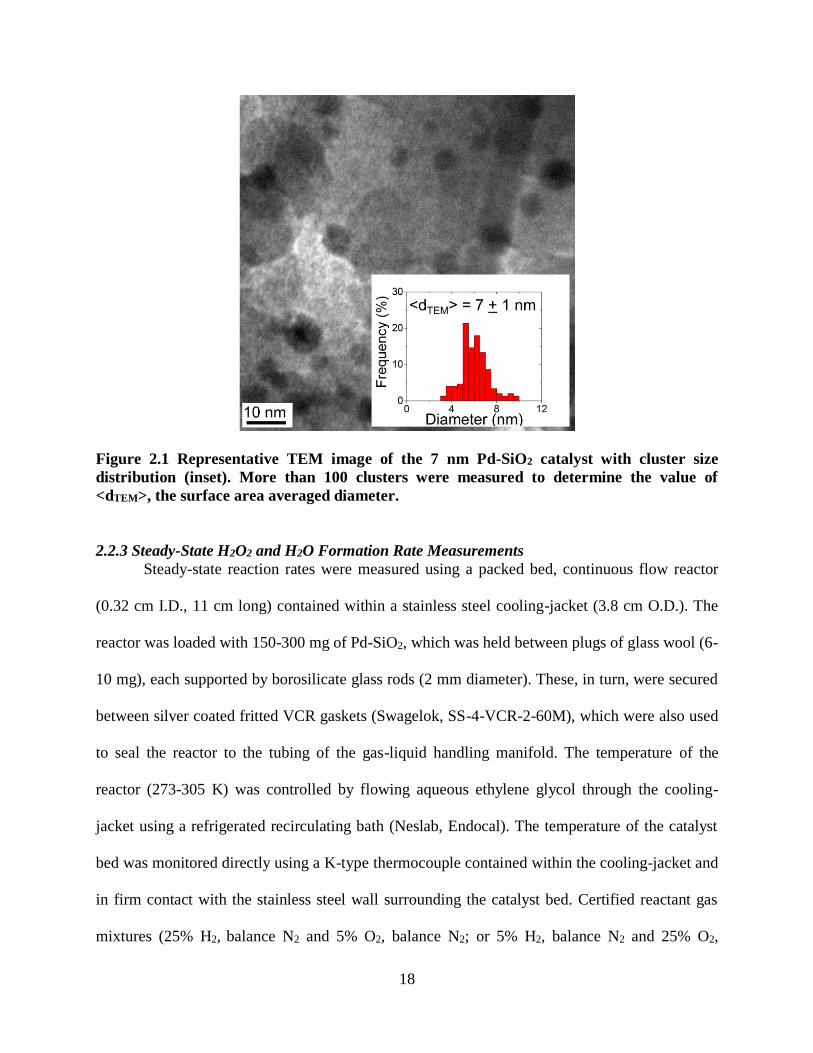
where ni is the number of clusters with diameter di. Figure 2.1 shows a representative TEM
image of the 7 nm Pd clusters, with the cluster diameter distribution as inset, and TEM images
for the other Pd catalyst are given in the Appendix (Fig. A.1). The diameters of the clusters
formed using only reductive treatments were too small (< 1 nm) to be measured accurately by
TEM. The values of <dTEM> and <dCHEM> agree closely for the 3 and 7 nm Pd clusters. The Pd
content of each sample was measured by inductively coupled plasma optical emission
spectroscopy (PerkinElmer, Optima 2000DV). The characterization results for all prepared
catalysts are shown in Table 2.1.
18
Figure 2.1 Representative TEM image of the 7 nm Pd-SiO2 catalyst with cluster size
distribution (inset). More than 100 clusters were measured to determine the value of
<dTEM>, the surface area averaged diameter.
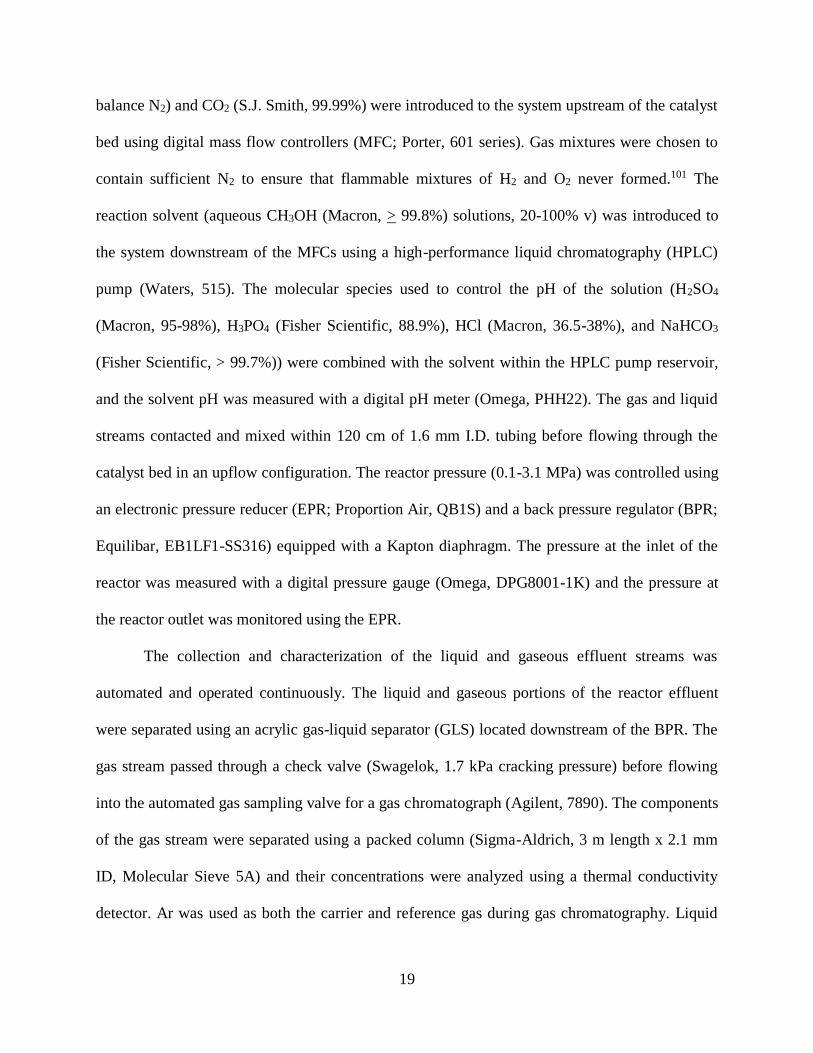
2.2.3 Steady-State H2O2 and H2O Formation Rate Measurements
Steady-state reaction rates were measured using a packed bed, continuous flow reactor
(0.32 cm I.D., 11 cm long) contained within a stainless steel cooling-jacket (3.8 cm O.D.). The
reactor was loaded with 150-300 mg of Pd-SiO2, which was held between plugs of glass wool (6-
10 mg), each supported by borosilicate glass rods (2 mm diameter). These, in turn, were secured
between silver coated fritted VCR gaskets (Swagelok, SS-4-VCR-2-60M), which were also used
to seal the reactor to the tubing of the gas-liquid handling manifold. The temperature of the
reactor (273-305 K) was controlled by flowing aqueous ethylene glycol through the cooling-
jacket using a refrigerated recirculating bath (Neslab, Endocal). The temperature of the catalyst
bed was monitored directly using a K-type thermocouple contained within the cooling-jacket and
in firm contact with the stainless steel wall surrounding the catalyst bed. Certified reactant gas
mixtures (25% H2, balance N2 and 5% O2, balance N2; or 5% H2, balance N2 and 25% O2,
19
balance N2) and CO2 (S.J. Smith, 99.99%) were introduced to the system upstream of the catalyst
bed using digital mass flow controllers (MFC; Porter, 601 series). Gas mixtures were chosen to
contain sufficient N2 to ensure that flammable mixtures of H2 and O2 never formed.101 The
reaction solvent (aqueous CH3OH (Macron, > 99.8%) solutions, 20-100% v) was introduced to
the system downstream of the MFCs using a high-performance liquid chromatography (HPLC)
pump (Waters, 515). The molecular species used to control the pH of the solution (H2SO4
(Macron, 95-98%), H3PO4 (Fisher Scientific, 88.9%), HCl (Macron, 36.5-38%), and NaHCO3
(Fisher Scientific, > 99.7%)) were combined with the solvent within the HPLC pump reservoir,
and the solvent pH was measured with a digital pH meter (Omega, PHH22). The gas and liquid
streams contacted and mixed within 120 cm of 1.6 mm I.D. tubing before flowing through the
catalyst bed in an upflow configuration. The reactor pressure (0.1-3.1 MPa) was controlled using
an electronic pressure reducer (EPR; Proportion Air, QB1S) and a back pressure regulator (BPR;
Equilibar, EB1LF1-SS316) equipped with a Kapton diaphragm. The pressure at the inlet of the
reactor was measured with a digital pressure gauge (Omega, DPG8001-1K) and the pressure at
the reactor outlet was monitored using the EPR.
The collection and characterization of the liquid and gaseous effluent streams was
automated and operated continuously. The liquid and gaseous portions of the reactor effluent
were separated using an acrylic gas-liquid separator (GLS) located downstream of the BPR. The
gas stream passed through a check valve (Swagelok, 1.7 kPa cracking pressure) before flowing
into the automated gas sampling valve for a gas chromatograph (Agilent, 7890). The components
of the gas stream were separated using a packed column (Sigma-Aldrich, 3 m length x 2.1 mm
ID, Molecular Sieve 5A) and their concentrations were analyzed using a thermal conductivity
detector. Ar was used as both the carrier and reference gas during gas chromatography. Liquid

20
samples were withdrawn from the GLS using an automated valve (Vici, 10 port valve), which
was configured to inject 0.4 cm3 of the effluent liquid and also 1 cm3 of a colorimetric indicator
solution (12 mM neocuproine, Sigma-Aldrich, > 98%; 8.3 mM CuSO4, Fisher Scientific, >
98.6%; 25% v ethanol, Decon Laboratories Inc., 100%)102 into glass vials held within an
automated fraction collector (Biorad, 2110). The concentration of H2O2 in each vial was
determined from its absorbance at 454 nm, measured using a spectrophotometer (Spectronic, 20
Genesys). The absorbance values were calibrated using solutions of known colorimetric indicator
solution with known H2O2 concentrations.
Primary rates of H2O2 and H2O formation were measured by avoiding artifacts introduced
by mass transport limitations and uncertainties from secondary H2O2 decomposition. To ensure
that the Madon-Boudart criterion103 was satisfied, H2 conversion was measured as a function of
gas residence time ((mol Pds s) (mol H2)-1) on catalysts with different metal loadings (0.025-0.5
wt. %) at high H2 pressure (400 kPa H2), where H2O2 and H2O formation rates were the greatest
(Fig. A.2). The H2 conversion at a given gas residence time did not depend on metal loading for
catalysts with Pd contents < 0.05% wt, indicating that intrapellet mass transport limitations did
not exist in this range of metal loading. H2O2 formation rates were measured as a function of
liquid residence time (2.1-4.2 s) over a range of temperatures (266-305 K) to examine the
significance of secondary decomposition of H2O2 (Fig. A.3). The H2O2 formation rate depended
strongly on the liquid residence time at temperatures greater than 281 K, indicating significant
secondary decomposition of H2O2. Mass transport restrictions and secondary decomposition of
H2O2 were avoided throughout this study by using 0.05% wt Pd catalyst, solvent flow rates of 10
cm3 min-1, and a reaction temperature of 277 K unless otherwise stated. The catalyst was
changed after each data set, typically on a daily basis, which prevented slow leaching of the Pd
21
from affecting the rate measurements significantly. After the catalyst was loaded, it was allowed
at least 6 h to stabilize under reaction conditions prior to data collection. Data was collected for
at least 1.5 h at each set of conditions to acquire multiple rate measurements at steady-state.
Reported rates comprise the mean values of at least six measurements and error bars represent
the standard deviation of these measurements.
2.2.4 Rate Measurements in Semi-batch Reactors
H2O2 formation rates were measured in protic and aprotic solvents using a 60 cm3
borosilicate glass semi-batch reactor (43.5 mm I.D.). The reactant gases entered through a fine
glass frit at the bottom of the reactor and were highly dispersed as they rose up through a
turbulent suspension of the catalyst and the solvent. The outlet at the top of the reactor was made
to be 3.5 mm I.D. to decrease the rate of solvent loss during each experiment. The reactor was
filled with 40 cm3 of either pure DI water (17.8 MΩ), methanol (Macron, > 99.8%), acetonitrile
(Fisher Scientific, 99.9%), dimethyl sulfoxide (Fisher Scientific, 99.9%), or propylene carbonate
(Sigma-Aldrich, 99.7%), which were all used as received. The reactant gas mixture (4.2 kPa H2,
4.2 kPa O2, balance N2) was introduced at a total flow rate of 60 cm3 min-1 and controlled using
variable area rotameters (Omega, FL-1461-S). The 3.8% wt Pd-SiO2 catalyst (20 mg) was added
to the reactor to initiate the reaction after the gas flow rate became stable. Liquid samples (0.4
cm3) were taken every 2-5 min in order to measure the concentration of H2O2 by the colorimetric
titration procedure described earlier (section 2.2.3), and the reaction was conducted at ambient
temperature (~295 K). The SEA prepared Pd catalysts were not used in the semi-batch reactor,
because the long Pd-liquid contact times (46 s gPd L-1 compared to 1.5·10-2 s gPd L-1 in the
plugged flow reactor), caused significant amounts of Pd to leach into the solution. Control
experiments showed that these dissolved Pd species interact with, and perhaps oxidize, the
22
colorimetric titrant such that the H2O2 concentration could not be measured accurately.
Therefore, the semi-batch experiments were conducted using the 3.8% wt Pd-SiO2 catalyst
prepared by incipient wetness impregnation (section 2.2.1), which contains trace amounts of Cl
that may reduce leaching.
2.3 Results and Discussion
2.3.1 Dependence of Rates on Reactant Pressures and Mechanistic Interpretation
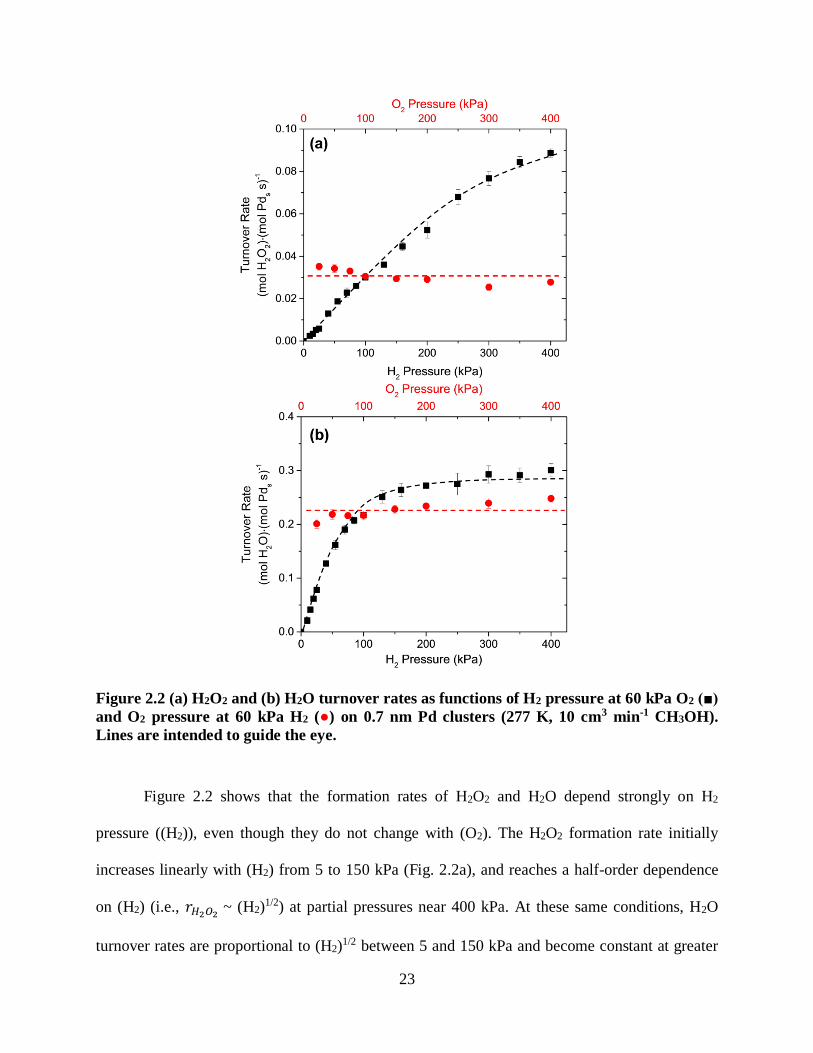
Figure 2.2 shows turnover rates for the formation of H2O2 (Fig. 2.2a) and H2O (Fig. 2.2b)
from the reduction of O2 on 0.7 nm Pd clusters as a function of H2 pressure (5-400 kPa H2, 60
kPa O2, 277 K) and O2 pressure (25-400 kPa O2, 60 kPa H2, 277 K). The H2O2 and H2O
formation rates do not depend on O2 pressure ((O2)), likely because the reactive surface sites are
saturated with O2-derived intermediates such as O2** (where ** and * denote η2 and η1 adsorbed
Pd surface intermediates, respectively) or hydroperoxy (OOH**) over the full range of (O2)
tested here (25-400 kPa). This interpretation is consistent with high heats of adsorption for
molecular oxygen onto H2O-saturated Pd (48-75 kJ mol-1)76,104 and Pt (39-47 kJ mol-1)105,106
surfaces (i.e., 2H2O* + O2 → O2** + 2H2O) even within liquid water. Presumably, reactive sites
on Pd surfaces would be covered by H2O* and rates would depend on the value of (O2) at
sufficiently low (O2). Calculated changes in the Gibbs free energy for H2O* displacement by O2
(-39 kJ mol-1)105 suggest, however, that metal surfaces are covered by O2** even at pressures
orders of magnitude less than the lowest (O2) tested here (25 kPa O2; Appendix, section A3).
23
Figure 2.2 (a) H2O2 and (b) H2O turnover rates as functions of H2 pressure at 60 kPa O2 (■)
and O2 pressure at 60 kPa H2 (●) on 0.7 nm Pd clusters (277 K, 10 cm3 min-1 CH3OH).
Lines are intended to guide the eye.
Figure 2.2 shows that the formation rates of H2O2 and H2O depend strongly on H2
pressure ((H2)), even though they do not change with (O2). The H2O2 formation rate initially
increases linearly with (H2) from 5 to 150 kPa (Fig. 2.2a), and reaches a half-order dependence
on (H2) (i.e., 𝑟𝐻2𝑂2 ~ (H2)1/2) at partial pressures near 400 kPa. At these same conditions, H2O
turnover rates are proportional to (H2)1/2 between 5 and 150 kPa and become constant at greater
24
pressures (Fig. 2.2b). These data (Fig. 2.2a) are consistent with the previously reported first-
order dependence of H2O2 formation rates on (H2), measured from 5 to 24 kPa H2 on silica
supported Pd clusters,83 yet that work did not observe changes in the (H2) dependence over the
small range of pressures tested. Mechanistic interpretations of those results could not disprove or
prove any of the proposed mechanisms for H2O2 formation,64,76,77,107 in part, because the range of
H2 pressures was limited, but also because formation rates for H2O were not reported.
H2O2 and H2O formation rates depend on the prevalent H2 and O2 pressures, because
changes in the partial pressure of the reactants change either the concentrations of species
involved in kinetically relevant steps, the identity of the most abundant reactive intermediates
(MARI), or both.92 The data shown in Figure 2.2 implies that the reactive sites are saturated with
O2-derived intermediates whose composition changes as (H2) increases. Oxygen isotope
labelling experiments show that H2O2 cannot be formed once the O-O bond of molecular O2
cleaves,46 therefore, the rate data (Fig. 2.2), together with this observation, suggest that the
MARI may be a species which contains an intact O-O bond (i.e., O2**, OOH**, or H2O2**). The
saturation of metal surfaces by such intermediates is consistent with in situ infrared spectroscopy
studies showing large coverages of O2** on Pt during the ORR at low potentials,108 and
interpretations of the effects of anions and bromide on ORR rates.109-111 In addition, the
dependence of both H2O2 and H2O formation rates on (H2) shows that H2-derived intermediates
participate in the kinetically relevant steps that form each product. Finally, the simultaneous
changes in the dependence of H2O2 and H2O formation rates on (H2) at ~150 kPa H2 suggest that
the average composition of the MARI increases by a single H-atom.
Langmuir-Hinshelwood mechanisms proposed for H2O2 formation,76,77,107 which involve
direct reduction of O2** by sequential reactions with H*-atoms bound to adjacent surface sites,

25
fail to describe these data (Fig. 2.2). Specifically, such mechanisms predict H2O2 formation rates
that are independent of (H2), depend inversely on (O2), or have a first-order dependence on (O2),
depending on the identity of the MARI (see Appendix, section A4 for derivation), which are
inconsistent with measured reaction rates (Fig. 2.2a). A two-site Langmuirian model, which
involves distinct sites for O2 and H adsorption could describe the data in Figure 2.2 (Appendix
A5), however, it would require that the sites capable of binding H*-atoms remain empty over the
entire range of H2 pressures (5-400 kPa). This assumption seems unlikely, because the heat of
adsorption of a H-atom on Pd (72 kJ mol-1), from calculated energies of H adsorption on Pd at
low H coverage112 and the homolytic bond dissociation energy of H2,113 is significantly higher
than that for H2O on Pd(111) (39 kJ mol-1).112 Additional evidence, which shows H2O2 forms
only in protic solvents (section 2.3.2), further suggests that this reaction occurs by a non-
Langmuirian mechanism. Thus, H2O2 appears to form by pathways that involve reactive
intermediates not present on the surface of Pd clusters.
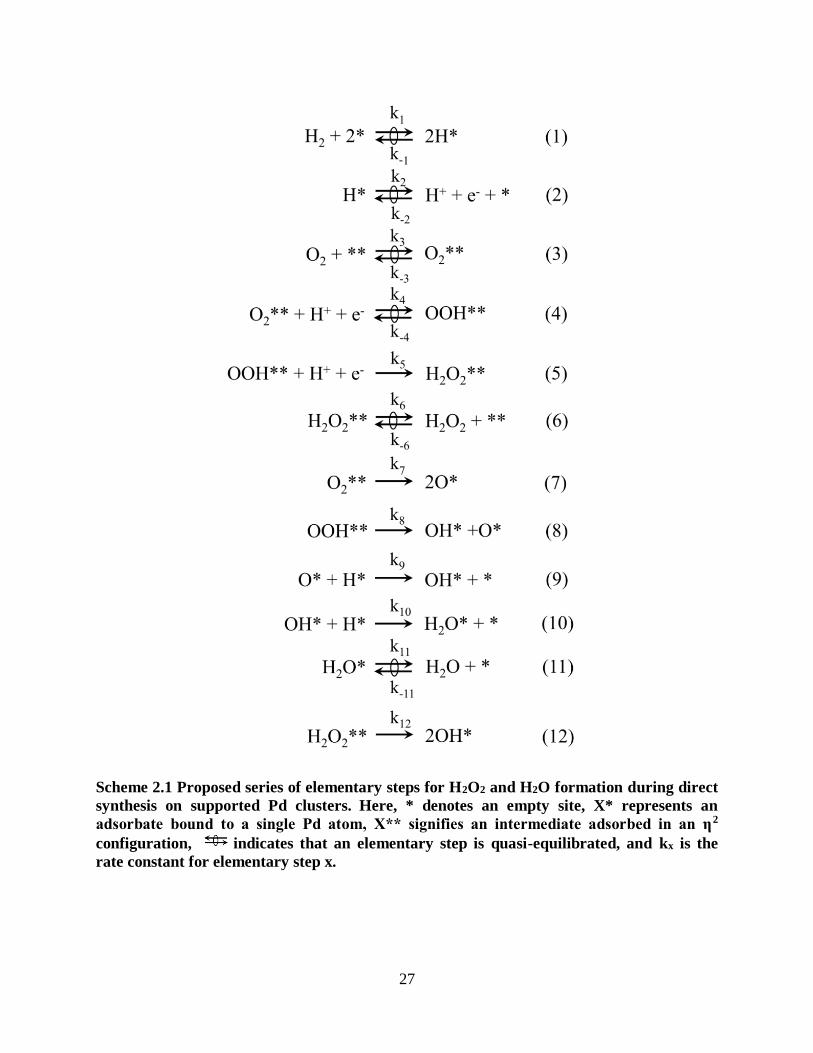
Scheme 2.1 shows a proposed series of elementary steps that are consistent with the
effects of H2 and O2 pressure on product formation rates on Pd clusters (Fig. 2.2), and on other
transition metal clusters,83,107,114 within liquid solvents. These steps involve bimolecular reactions
between liquid-phase species, namely H+, and chemisorbed surface intermediates. Dissociative
H2 adsorption (1) and heterolytic H* oxidation (2) steps as well as molecular adsorption of O2 (3)
and desorption of H2O2 (6) and H2O (11), are assumed to be quasi-equilibrated under all
conditions. These assumptions are based on free energies for O2 and H2 adsorption that become
negligible near saturation coverages115,116 and facile decomposition of H2O2 on Pd surfaces,73,78
which suggest that these species readily desorb and adsorb at rates greater than measured
turnover rates (1·10-3- 7·10-1 (Pds·s)-1). Subsequently, O2** undergoes either quasi-equilibrated
26
proton-electron transfer (4) to form hydroperoxy (OOH**) or irreversibly cleaves the O-O bond
(7) to form chemisorbed oxygen atoms (O*). Adsorbed OOH** then reacts by kinetically
relevant proton-electron transfer (5) to form H2O2** or dissociates by irreversible O-O rupture
(8). Finally, H2O2** desorbs to the liquid-phase (6) or dissociates (12) to form two hydroxyls
(OH*). Following the irreversible O-O bond rupture in O2** (7), OOH** (8), or H2O2** (12),
O* and OH* species hydrogenate (9, 10) to form H2O*, which then desorbs (11).
27
Scheme 2.1 Proposed series of elementary steps for H2O2 and H2O formation during direct
synthesis on supported Pd clusters. Here, * denotes an empty site, X* represents an
adsorbate bound to a single Pd atom, X** signifies an intermediate adsorbed in an η2
configuration, indicates that an elementary step is quasi-equilibrated, and kx is the
rate constant for elementary step x.
28
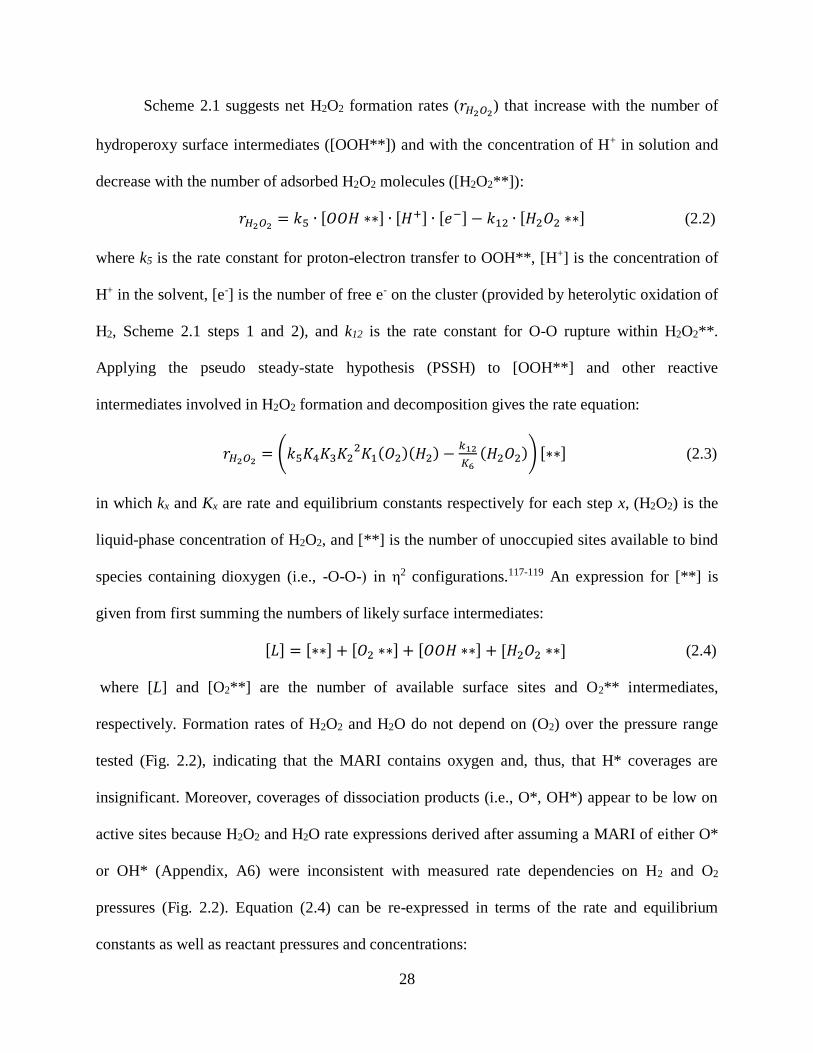
Scheme 2.1 suggests net H2O2 formation rates (𝑟𝐻2𝑂2) that increase with the number of
hydroperoxy surface intermediates ([OOH**]) and with the concentration of H+ in solution and
decrease with the number of adsorbed H2O2 molecules ([H2O2**]):
𝑟𝐻2𝑂2 = 𝑘5 ∙ [𝑂𝑂𝐻 ∗∗] ∙ [𝐻+] ∙ [𝑒−] − 𝑘12 ∙ [𝐻2𝑂2 ∗∗] (2.2)
where k5 is the rate constant for proton-electron transfer to OOH**, [H+] is the concentration of
H+ in the solvent, [e-] is the number of free e- on the cluster (provided by heterolytic oxidation of
H2, Scheme 2.1 steps 1 and 2), and k12 is the rate constant for O-O rupture within H2O2**.
Applying the pseudo steady-state hypothesis (PSSH) to [OOH**] and other reactive
intermediates involved in H2O2 formation and decomposition gives the rate equation:
𝑟𝐻2𝑂2 = (𝑘5𝐾4𝐾3𝐾22𝐾1(𝑂2)(𝐻2) −
𝑘12
𝐾6(𝐻2𝑂2)) [∗∗] (2.3)
in which kx and Kx are rate and equilibrium constants respectively for each step x, (H2O2) is the
liquid-phase concentration of H2O2, and [**] is the number of unoccupied sites available to bind
species containing dioxygen (i.e., -O-O-) in η2 configurations.117-119 An expression for [**] is
given from first summing the numbers of likely surface intermediates:
[𝐿] = [∗∗] + [𝑂2 ∗∗] + [𝑂𝑂𝐻 ∗∗] + [𝐻2𝑂2 ∗∗] (2.4)
where [L] and [O2**] are the number of available surface sites and O2** intermediates,
respectively. Formation rates of H2O2 and H2O do not depend on (O2) over the pressure range
tested (Fig. 2.2), indicating that the MARI contains oxygen and, thus, that H* coverages are
insignificant. Moreover, coverages of dissociation products (i.e., O*, OH*) appear to be low on
active sites because H2O2 and H2O rate expressions derived after assuming a MARI of either O*
or OH* (Appendix, A6) were inconsistent with measured rate dependencies on H2 and O2
pressures (Fig. 2.2). Equation (2.4) can be re-expressed in terms of the rate and equilibrium
constants as well as reactant pressures and concentrations:
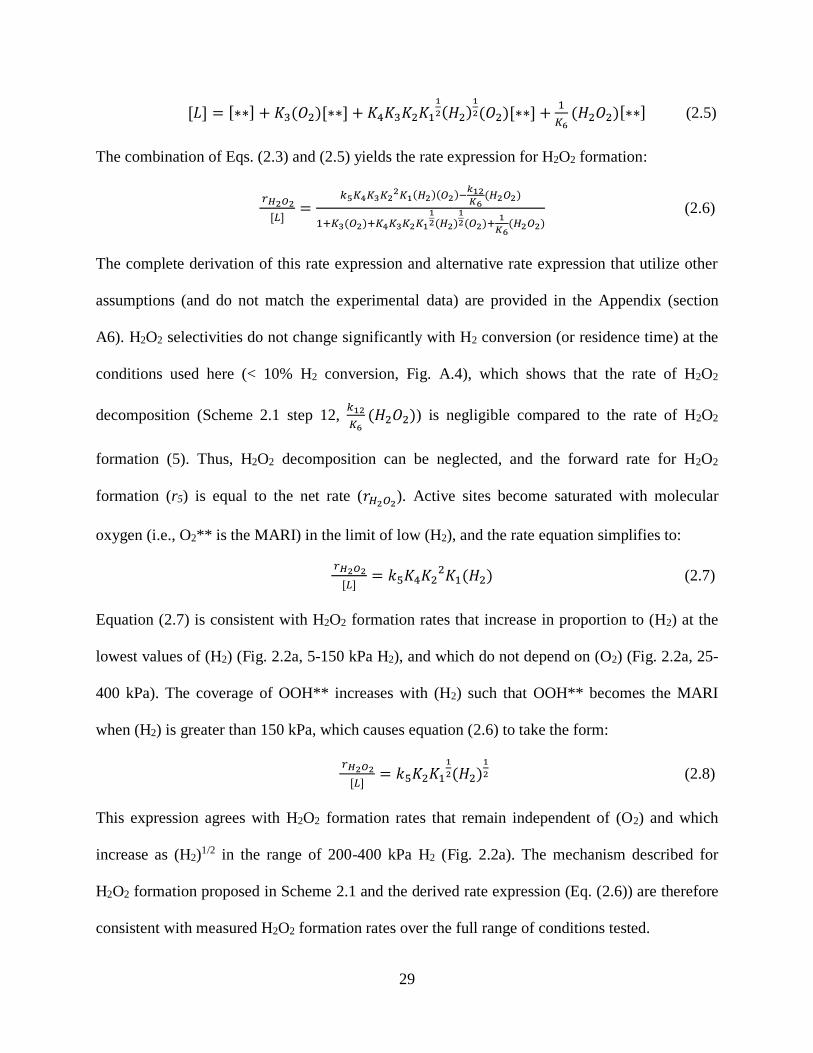
29
[𝐿] = [∗∗] + 𝐾3(𝑂2)[∗∗] + 𝐾4𝐾3𝐾2𝐾11
2(𝐻2)1
2(𝑂2)[∗∗] +1
𝐾6(𝐻2𝑂2)[∗∗] (2.5)
The combination of Eqs. (2.3) and (2.5) yields the rate expression for H2O2 formation:
𝑟𝐻2𝑂2
[𝐿]=
𝑘5𝐾4𝐾3𝐾22𝐾1(𝐻2)(𝑂2)−
𝑘12𝐾6(𝐻2𝑂2)
1+𝐾3(𝑂2)+𝐾4𝐾3𝐾2𝐾112(𝐻2)
12(𝑂2)+
1
𝐾6(𝐻2𝑂2)
(2.6)
The complete derivation of this rate expression and alternative rate expression that utilize other
assumptions (and do not match the experimental data) are provided in the Appendix (section
A6). H2O2 selectivities do not change significantly with H2 conversion (or residence time) at the
conditions used here (< 10% H2 conversion, Fig. A.4), which shows that the rate of H2O2
decomposition (Scheme 2.1 step 12, 𝑘12
𝐾6(𝐻2𝑂2)) is negligible compared to the rate of H2O2
formation (5). Thus, H2O2 decomposition can be neglected, and the forward rate for H2O2
formation (r5) is equal to the net rate (𝑟𝐻2𝑂2). Active sites become saturated with molecular
oxygen (i.e., O2** is the MARI) in the limit of low (H2), and the rate equation simplifies to:
𝑟𝐻2𝑂2
[𝐿]= 𝑘5𝐾4𝐾2
2𝐾1(𝐻2) (2.7)
Equation (2.7) is consistent with H2O2 formation rates that increase in proportion to (H2) at the
lowest values of (H2) (Fig. 2.2a, 5-150 kPa H2), and which do not depend on (O2) (Fig. 2.2a, 25-
400 kPa). The coverage of OOH** increases with (H2) such that OOH** becomes the MARI
when (H2) is greater than 150 kPa, which causes equation (2.6) to take the form:
𝑟𝐻2𝑂2
[𝐿]= 𝑘5𝐾2𝐾1
1
2(𝐻2)1
2 (2.8)
This expression agrees with H2O2 formation rates that remain independent of (O2) and which
increase as (H2)1/2 in the range of 200-400 kPa H2 (Fig. 2.2a). The mechanism described for
H2O2 formation proposed in Scheme 2.1 and the derived rate expression (Eq. (2.6)) are therefore
consistent with measured H2O2 formation rates over the full range of conditions tested.
30
Scheme 2.1 shows that the rate of H2O formation (𝑟𝐻2𝑂) equals the summed rates of
irreversible O-O bond scission78 within all dioxygen-containing surface species (i.e., O2**,
OOH**, and H2O2**) at steady-state. The rate of O-O bond scission in these three species is
given by:
𝑟𝐻2𝑂 = 𝑘7[𝑂2 ∗∗] + 𝑘8[𝑂𝑂𝐻 ∗∗] + 𝑘12[𝐻2𝑂2 ∗∗] (2.9)
which takes a new form after accounting for the quasi-equilibrated steps in Scheme 2.1:
𝑟𝐻2𝑂 = (𝑘7𝐾3(𝑂2) + 𝑘8𝐾4𝐾3𝐾2𝐾11
2(𝐻2)1
2(𝑂2) +𝑘12
𝐾6(𝐻2𝑂2)) [∗∗] (2.10)
Implementing the site balance yields the rate equation for H2O formation:
𝑟𝐻2𝑂
[𝐿]=𝑘7𝐾3(𝑂2)+𝑘8𝐾4𝐾3𝐾2𝐾1
12(𝐻2)
12(𝑂2)+
𝑘12𝐾6(𝐻2𝑂2)
1+𝐾3(𝑂2)+𝐾4𝐾3𝐾2𝐾112(𝐻2)
12(𝑂2)+
1
𝐾6(𝐻2𝑂2)
(2.11)
The rate of H2O formation by H2O2 decomposition (Scheme 2.1, step 12, 𝑘12
𝐾6(𝐻2𝑂2)) is
negligible, in comparison to H2O formation by O2** and OOH** decomposition, as already
discussed. Density functional theory calculations show that O-O bond dissociation barriers are >
40 kJ mol-1 lower in OOH** than for O2** on Pd surfaces,76,77,104 which agrees qualitatively with
homolytic bond dissociation energies (BDE) that are 230 kJ mol-1 greater for the O-O bond in
O2(g) than for that in ·OOH(g) radicals.120 Together these results imply that rate constants, and
likely rates, for OOH** dissociation may be much higher than those for O2** on Pd clusters. The
combination of these assumptions yields the following simplified rate expression:
𝑟𝐻2𝑂
[𝐿]=
𝑘8𝐾4𝐾3𝐾2𝐾112(𝐻2)
12(𝑂2)
1+𝐾3(𝑂2)+𝐾4𝐾3𝐾2𝐾112(𝐻2)
12(𝑂2)+
1
𝐾6(𝐻2𝑂2)
(2.12)
At low (H2) (< 150 kPa H2), O2** is the MARI and equation (2.12) becomes:
𝑟𝐻2𝑂
[𝐿]= 𝑘8𝐾4𝐾2𝐾1
1
2(𝐻2)1
2 (2.13)
31
and as seen for H2O2 formation rates, OOH** is the MARI at higher (H2) (200-400 kPa H2)
giving:
𝑟𝐻2𝑂
[𝐿]= 𝑘8 (2.14)
These simplified rate expressions (i.e., (2.13) and (2.14)) are consistent with H2O formation rates
that are constant for all (O2) and that transition from a half- to zero-order dependence on (H2) at
~150 kPa (Fig. 2.2b). These comparisons shows that O-O bond rupture occurs primarily within
OOH** surface intermediates, which agrees also with mechanistic predictions for the ORR
reaction on Pt surfaces.121,122
The rate equations for H2O2 (Eq. (2.6)) and H2O (Eq. (2.12)) formation suggest that the
selectivity towards H2O2 will increase with (H2) while remaining constant for all (O2) values.
These expectations are shown clearly when H2O2 selectivity is expressed as the ratio of H2O2 and
H2O formation rates (χ):
𝜒 =𝑟𝐻2𝑂2
𝑟𝐻2𝑂=𝑘5𝐾2𝐾1
12(𝐻2)
12
𝑘8 (2.15)
The value of χ does not depend on the identity of the MARI, because pathways for H2O2 and
H2O formation occur on the same active sites. Figure 2.3 shows that χ values increase as (H2)1/2
(Fig. 2.3a) and remain constant with (O2) (Fig. 2.3b) on 0.7 nm Pd clusters. These comparisons
show that the expression for χ is consistent with the rate data (Fig. 2.2). The interpretation of
these results shows that O-O bonds cleave at negligible rates in O2** and H2O2** intermediates
and that both H2O2 and H2O form on the same sites. The values of χ increase by a factor of two
on 0.7 nm Pd clusters as (H2) increases over the range 5-400 kPa (Fig. 2.3a) and demonstrate that
significant increases in selectivity can be achieved by increasing (H2). These findings (Fig. 2.3)
differ from previous studies that reported H2O2 selectivities that decreased with increasing H2/O2
reactant ratios,59,83,123 however, those studies did not discuss precautions taken to measure

32
primary formation rates for H2O2 and H2O and may include contributions from H2O2**
decomposition, which would complicate analysis.
Figure 2.3 Ratio of the formation of H2O2 to that for H2O (χ), as a function of (a) H2
pressure at 60 kPa O2 and (b) O2 pressure at 60 kPa H2 on 0.7 nm (■), 3 nm (●), and 7 nm
(▲) Pd clusters (277 K, 10 cm3 min-1 CH3OH). Lines are intended to guide the eye.
33
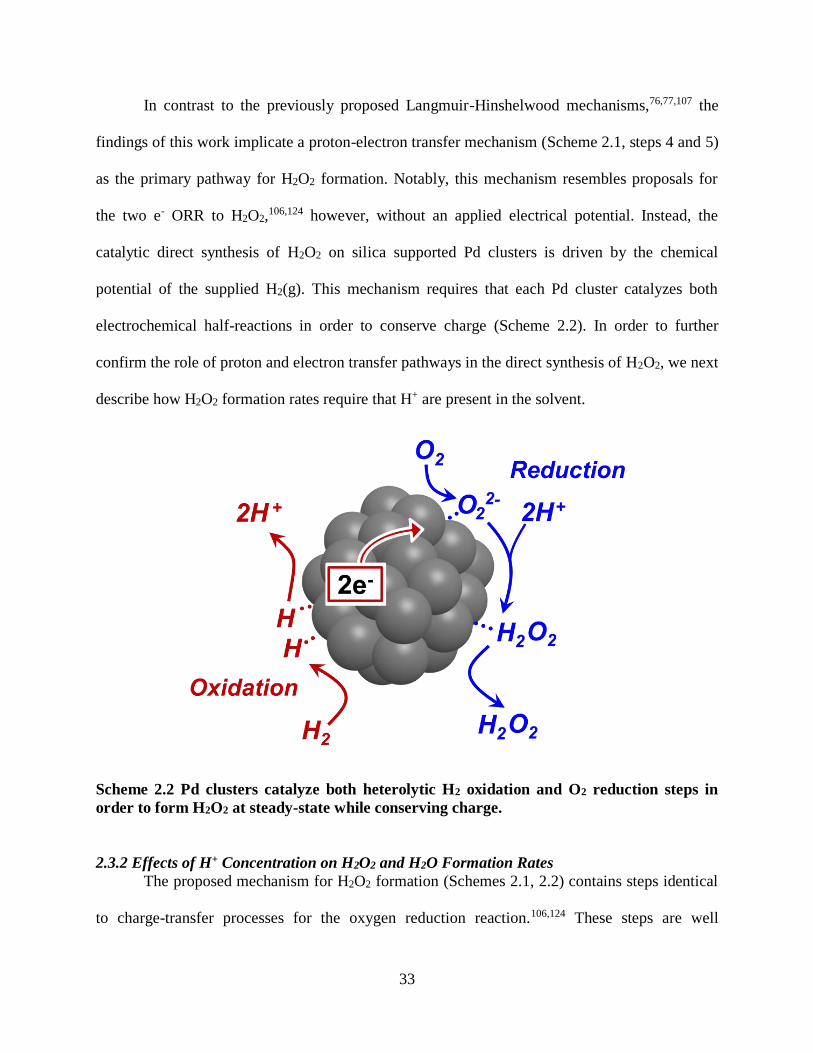
In contrast to the previously proposed Langmuir-Hinshelwood mechanisms,76,77,107 the
findings of this work implicate a proton-electron transfer mechanism (Scheme 2.1, steps 4 and 5)
as the primary pathway for H2O2 formation. Notably, this mechanism resembles proposals for
the two e- ORR to H2O2,106,124 however, without an applied electrical potential. Instead, the
catalytic direct synthesis of H2O2 on silica supported Pd clusters is driven by the chemical
potential of the supplied H2(g). This mechanism requires that each Pd cluster catalyzes both
electrochemical half-reactions in order to conserve charge (Scheme 2.2). In order to further
confirm the role of proton and electron transfer pathways in the direct synthesis of H2O2, we next
describe how H2O2 formation rates require that H+ are present in the solvent.
Scheme 2.2 Pd clusters catalyze both heterolytic H2 oxidation and O2 reduction steps in
order to form H2O2 at steady-state while conserving charge.
2.3.2 Effects of H+ Concentration on H2O2 and H2O Formation Rates
The proposed mechanism for H2O2 formation (Schemes 2.1, 2.2) contains steps identical
to charge-transfer processes for the oxygen reduction reaction.106,124 These steps are well
34
accepted when an electrical potential is applied between two metal electrodes separated by an
electrolyte, however, they are not commonly invoked to describe reactions at the surface of
nanoclusters supported on insulators (e.g., Pd-SiO2). Figure 2.4 shows that increases in the H2O2
concentration over time within a semi-batch reactor are much greater in protic solvents (e.g.,
methanol, water) than in aprotic solvents (e.g., acetonitrile, dimethyl sulfoxide, and propylene
carbonate) (4.2 kPa H2, 4.2 kPa O2, 295 K, 3.8% wt Pd-SiO2). Primary formation rates for H2O2
are calculated from the change in H2O2 concentration with time at the early stages of each
experiment (0-0.17 h) and the results are shown in Table 2.2 along with the pKa values and
dielectric constant for each solvent. These data (Fig. 2.4, Table 2.2) show that the H2O2 turnover
rates in protic solvents are at least 103 times greater than those in aprotic solvents (whose H2O2
turnover rates fall below the detection limit of the experiment, < 1.7∙10-6 (mol H2O2)(mol Pds
s)-1). Turnover rates depend on the protic-aprotic nature of the solvent but do not correlate with
the dielectric constants of the solvents (Table 2.2), which suggests that H2O2 formation is not
sensitive to solvent polarity. These data (Table 2.2) are completely consistent with our proposed
mechanism (Schemes 2.1, 2.2), moreover, these results cannot be explained by mechanisms for
direct synthesis that only involve elementary steps describing reactions between co-adsorbed
surface intermediates (e.g., O2* + H* → OOH* + *), which are not influenced by H+. We next
discuss rate measurements conducted as a function of H+ concentration using multiple H+ donors
and acceptors and interpret these data using the previously derived rate expressions (Eqs. (2.6)
and (2.12)) to clarify the role of mineral acids commonly used to increase H2O2 selectivities
during direct synthesis.83,84
35
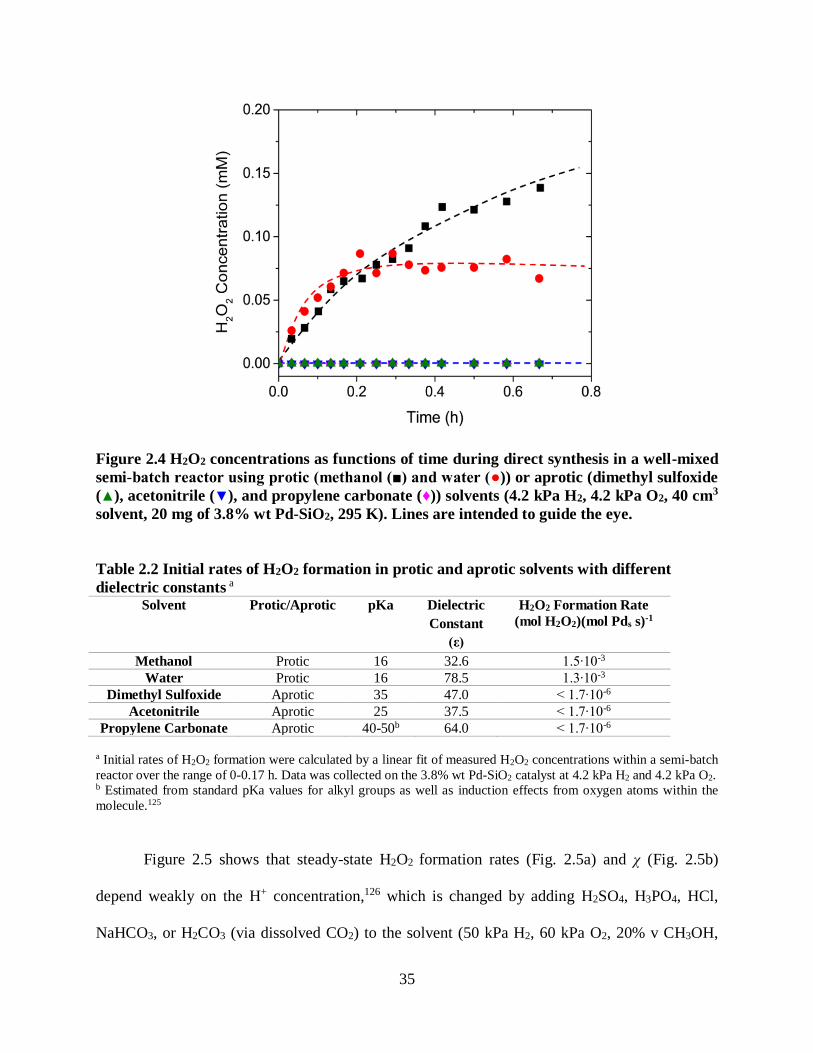
Figure 2.4 H2O2 concentrations as functions of time during direct synthesis in a well-mixed
semi-batch reactor using protic (methanol (■) and water (●)) or aprotic (dimethyl sulfoxide
(▲), acetonitrile (▼), and propylene carbonate (♦)) solvents (4.2 kPa H2, 4.2 kPa O2, 40 cm3
solvent, 20 mg of 3.8% wt Pd-SiO2, 295 K). Lines are intended to guide the eye.
Table 2.2 Initial rates of H2O2 formation in protic and aprotic solvents with different
dielectric constants a Solvent Protic/Aprotic pKa Dielectric
Constant
(ε)
H2O2 Formation Rate
(mol H2O2)(mol Pds s)-1
Methanol Protic 16 32.6 1.5∙10-3
Water Protic 16 78.5 1.3∙10-3
Dimethyl Sulfoxide Aprotic 35 47.0 < 1.7∙10-6
Acetonitrile Aprotic 25 37.5 < 1.7∙10-6
Propylene Carbonate Aprotic 40-50b 64.0 < 1.7∙10-6
a Initial rates of H2O2 formation were calculated by a linear fit of measured H2O2 concentrations within a semi-batch
reactor over the range of 0-0.17 h. Data was collected on the 3.8% wt Pd-SiO2 catalyst at 4.2 kPa H2 and 4.2 kPa O2. b Estimated from standard pKa values for alkyl groups as well as induction effects from oxygen atoms within the
molecule.125
Figure 2.5 shows that steady-state H2O2 formation rates (Fig. 2.5a) and χ (Fig. 2.5b)
depend weakly on the H+ concentration,126 which is changed by adding H2SO4, H3PO4, HCl,
NaHCO3, or H2CO3 (via dissolved CO2) to the solvent (50 kPa H2, 60 kPa O2, 20% v CH3OH,
36
277 K). Figure 2.5a demonstrates that formation rates for H2O2 increase with increasing H+
concentration (𝑟𝐻2𝑂2~[H+]0.1) and are similar at any given H+ concentration. These data are
qualitatively consistent with our proposed mechanism for H2O2 formation (Scheme 2.1), which is
shown by restating the simplified rate expressions for H2O2 formation (Eqs. (2.7) and (2.8)) in
terms of the H+ concentration. The quasi-equilibrated steps for heterolytic H2 oxidation (Scheme
2.1, steps (1) and (2)) show that the H2 pressure and the concentrations of H+ and free e- are
related by:
[𝐻+]2[𝑒−]2 = 𝐾22𝐾1(𝐻2) = 𝛼 (2.16)
where [H+] and [e-] are the proton and electron concentrations, respectively, and α is a constant
equal to the product of the equilibrium constants (𝐾22𝐾1) and the H2 pressure at the conditions of
these experiments (Fig. 2.5). Substitution of equation (2.16) into the rate equations for H2O2
formation yields a second-order dependence on both [H+] and [e-] when O2** is the MARI:
𝑟𝐻2𝑂2
[𝐿]= (𝑘5𝐾4) · [𝐻
+]2[𝑒−]2 (2.17)
and a first-order dependence on [H+] and [e-] when OOH** is the MARI:
𝑟𝐻2𝑂2
[𝐿]= (𝑘5𝐾2𝐾1
1
2) · [𝐻+][𝑒−] (2.18)
H2O2 formation rates are undetectable in the absence of an e- source (i.e., 0 kPa H2, Fig. 2.2),
even in solutions with a high [H+] (pH 3, 0.5 mM H2SO4 in H2O), which is in agreement with
equations (2.17) and (2.18) and previous measurements.83 The addition of proton donors (i.e.,
mineral acids) to the solvent gives a measurable increase in [H+] due to the dissociation of these
species:
[𝐻𝑋]𝐾𝐻𝑋↔ [𝐻+] + [𝑋−] (2.19)
37
where KHX is the equilibrium constant for acid dissociation and [HX] and [X-] are the
concentration of mineral acids and counter-ions in the solution, respectively. H2O2 formation
rates increase only slightly when proton donors are added to the solvent (𝑟𝐻2𝑂2~[H+]0.1, Fig.
2.5a), because [H+] and [e-] are inversely proportional to one another as dictated by the
equilibrium for heterolytic H2 oxidation (Eq. 2.16). Thus, the addition of acid increases [H+] by a
certain factor but simultaneously decreases [e-] by the same amount. Consequently, we attribute
the small increase in H2O2 formation rates to an electronic modification of the solution at the
liquid-solid interface induced by the presence of counter-ions (i.e., Cl-, SO42-, HCO3
-, H2PO4-),
which increase with the amount of acid added to the solvent. The H2O turnover rates show also a
weak inverse dependence on [H+] (𝑟𝐻2𝑂~[H+]-0.05) (Fig. A.5). The H2O formation rate does not
directly depend on [H+], therefore, these small changes should only reflect the adsorption of
counter-ions onto the Pd, which are likely present at low coverages.127-129 These results agree
with previous observations that strongly binding anions decrease H2O formation rates during
ORR, perhaps because the anions must be displaced from the surface prior to O-O bond
rupture.109-111 While directly implicating counter-ion adsorption with changes in selectivity is
beyond the scope of this work, in situ infrared spectroscopy could relate measured selectivities to
the surface coverage of counter-ions. Overall, the addition of proton donors increases the
selectivity towards H2O2 (i.e., χ, Fig. 2.5b) by both increasing H2O2 formation rates (Fig. 2.5a)
and decreasing H2O formation rates (Fig. A.5). These observed trends are the same for all
mineral acids tested, therefore, χ can be increased significantly (10-fold) by adding acids to the
system (10-9-10-2 M H+) with little dependence on the identity of the adsorbed counter-ion.
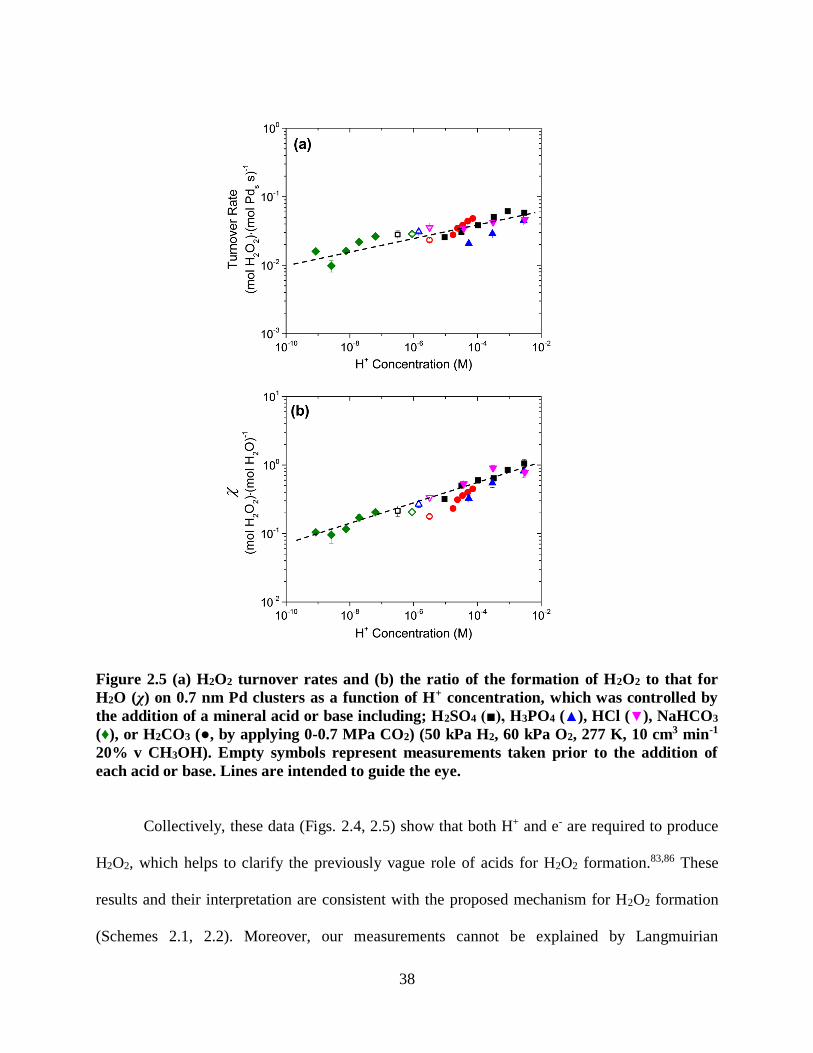
38
Figure 2.5 (a) H2O2 turnover rates and (b) the ratio of the formation of H2O2 to that for
H2O (χ) on 0.7 nm Pd clusters as a function of H+ concentration, which was controlled by
the addition of a mineral acid or base including; H2SO4 (■), H3PO4 (▲), HCl (▼), NaHCO3
(♦), or H2CO3 (●, by applying 0-0.7 MPa CO2) (50 kPa H2, 60 kPa O2, 277 K, 10 cm3 min-1
20% v CH3OH). Empty symbols represent measurements taken prior to the addition of
each acid or base. Lines are intended to guide the eye.
Collectively, these data (Figs. 2.4, 2.5) show that both H+ and e- are required to produce
H2O2, which helps to clarify the previously vague role of acids for H2O2 formation.83,86 These
results and their interpretation are consistent with the proposed mechanism for H2O2 formation
(Schemes 2.1, 2.2). Moreover, our measurements cannot be explained by Langmuirian
39
mechanisms that involve homolytic hydrogenation steps, occurring at one or even at two distinct
surface sites. These results explain also the reported benefits of using CO2 as a diluent during
direct synthesis of H2O2.31,69,130 H2CO3, formed following dissolution of CO2 in protic solvents,
provides HCO3- and CO3
2- counter-ions that may bind to Pd clusters and increase H2O2
selectivities, as shown above. Thus, high pressure CO2 can replace strong mineral acids (e.g.,
H2SO4, HCl) which are less environmentally benign. However, to be competitive with AO, direct
synthesis will require higher selectivities than what can be achieved here on 0.7 nm Pd-SiO2
from the addition of CO2 alone (31% H2O2 selectivity). In the next section, we show that higher
H2O2 selectivities are achieved when we decrease the extent of e- back donation to adsorbed
oxygen species by increasing the size of the Pd clusters.
2.3.3 Effects of Pd Cluster Size on Selectivities and Activation Enthalpies
Changes in the size of Pd clusters lead to changes in both H2O2 selectivities and turnover
rates that reflect significant differences between the electronic structures of Pd clusters caused, in
turn, by changes to the degree of coordinative saturation of surface atoms. Figure 2.3 shows that
values of χ increase monotonically with the size of Pd clusters at all H2 or O2 pressures, and 7 nm
Pd gives χ values that are more than three times greater than those for 0.7 nm Pd at all
conditions, which agrees qualitatively with comparisons between H2O2 selectivities for 3.4 and
4.2 nm Pd clusters on SiO2.71 In addition, H2O2 turnover rates are much larger on 7 nm Pd
clusters than those on 0.7 nm Pd (Figs. A.8a and 2.2a, respectively). The rate ratios for all Pd
clusters (Fig. 2.3) increase with a half-order dependence on (H2) and do not depend on (O2)
(Appendix, Fig. A.6 shows linearized rates). The change in H2O2 and H2O formation rates with
changes in (H2) and (O2) on 3 and 7 nm clusters (Figs. A.7 and A.8) are described accurately by
the mechanism (Scheme 2.1) and rate equations (Eqs. (2.6) and (2.12)) given earlier. These
40
differences in turnover rates and selectivities between Pd clusters of different sizes result,
therefore, from changes in the stability of surface intermediates and transition states and not from
differences between the mechanisms for H2O2 and H2O formation on clusters of different sizes.
The changes in the stability of reactive intermediates are reflected in the values of the apparent
activation enthalpies (∆H‡) and entropies (∆S‡) for these reactions, determined from
measurements of rates as a function of temperature.
Transition state theory proposes that reactant species (e.g., OOH*, and a H+-e- pair) exist
in equilibrium with the transition state (𝐻+˗𝑂𝑂𝐻 ∗∗‡) for a given elementary step.125 Close
agreement between measured H2O2 and H2O formation rates (Figs. 2.2, A.7, and A.8) and rate
expressions (Eqs. (2.6) and (2.12)) suggest that these reactant species also exist in quasi-
equilibrium with gaseous H2 and O2 reactants. These multiple equilibrated steps and the form of
equation (2.7), therefore, suggest that the transition states for H2O2 formation are equilibrated
also with chemisorbed oxygen (O2**) and H2, as shown in Scheme 2.3 and expressed in the
following reaction:
𝑂2 ∗∗ +𝐻2(𝑔)𝐾‡𝐻2𝑂2↔ 𝐻+˗𝑂𝑂𝐻 ∗∗‡ (2.20)
where 𝐾‡𝐻2𝑂2 is the transition state equilibrium constant for H2O2 formation. By using
conventions of transition state theory, the rate of H2O2 formation can be expressed in terms of
the number of transition state species ([𝐻+˗𝑂𝑂𝐻 ∗∗‡]):
𝑟𝐻2𝑂2
[𝐿]=𝑘𝐵𝑇
ℎ[𝐻+˗𝑂𝑂𝐻 ∗∗‡] (2.21)
where T is the temperature in Kelvin, and h and kB are Planck’s and Boltzmann’s constants,
respectively. The equilibrated nature of reaction (2.20), along with the observation that H2O2
formation is independent of (O2) (Fig. 2.2a) allow Eq. (2.21) to be re-expressed in terms of (H2)
and 𝐾‡𝐻2𝑂2:

41
𝑟𝐻2𝑂2
[𝐿]=𝑘𝐵𝑇
ℎ𝐾‡𝐻2𝑂2(𝐻2) (2.22)
The Appendix (section A10) contains equivalent expressions for H2O formation. Figure 2.6
shows calculated values for 𝐾‡𝐻2𝑂2 and 𝐾‡𝐻2𝑂 (Eqs. (2.22) and (A10.3)) as a function of inverse
temperature, and these values reflect only primary formation rates, calculated at zero H2
conversion by extrapolating rates measured as a function of residence time at every temperature
(Fig. A.3).
Scheme 2.3 Thermochemical cycle showing the changes in free energy at each step for the
direct synthesis of H2O2 (blue) and H2O (red) on Pd clusters. Changes in free energy are
shown for the heterolytic dissociation of H2 (∆𝑮𝑯𝟐), the protonation of O2** (∆𝑮𝑶𝑶𝑯) and
OOH** (∆𝑮𝑯−𝑶𝑶𝑯). The sum of these free energy differences corresponds to the measured
activation free energy for H2O2 formation on O2-saturated Pd clusters (𝜟𝑮‡𝑯𝟐𝑶𝟐). The
measured activation free energy for H2O formation (𝜟𝑮‡𝑯𝟐𝑶) corresponds to the sum of
∆𝑮𝑯𝟐, ∆𝑮𝑶𝑶𝑯, and the change in free energy for O-O bond scission in OOH** (∆𝑮𝑶−𝑶𝑯).
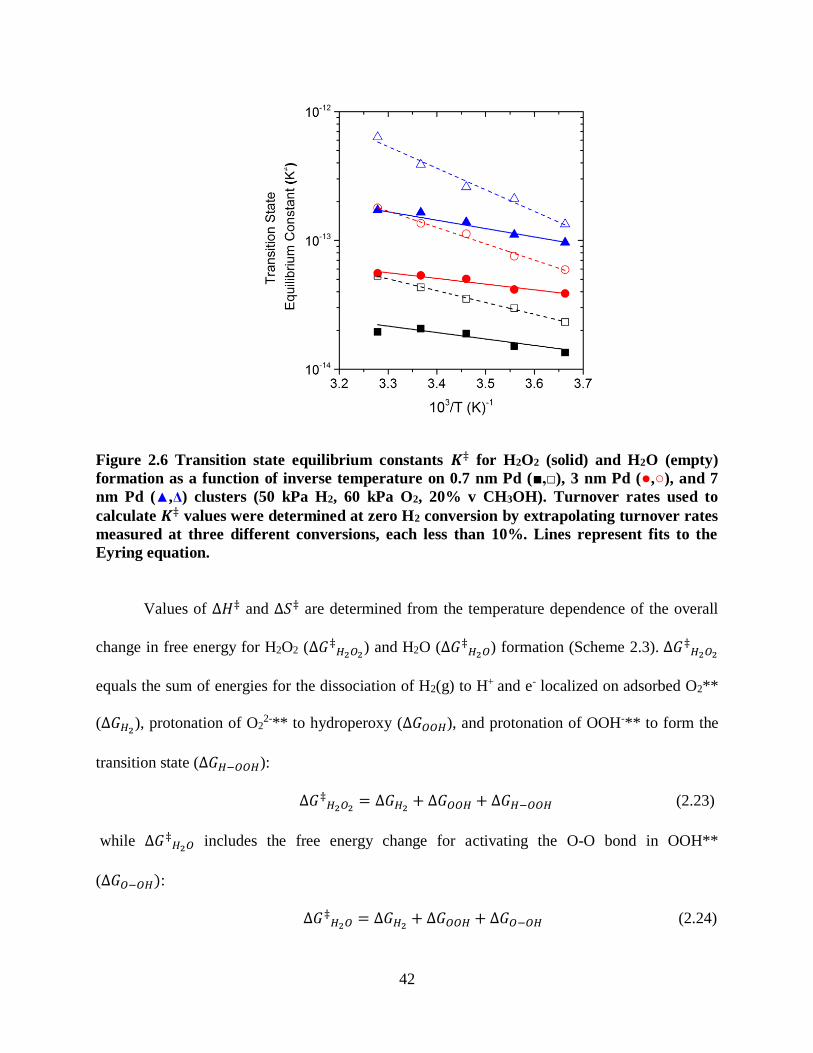
42
Figure 2.6 Transition state equilibrium constants 𝑲‡ for H2O2 (solid) and H2O (empty)
formation as a function of inverse temperature on 0.7 nm Pd (■,□), 3 nm Pd (●,○), and 7
nm Pd (▲,Δ) clusters (50 kPa H2, 60 kPa O2, 20% v CH3OH). Turnover rates used to
calculate 𝑲‡ values were determined at zero H2 conversion by extrapolating turnover rates
measured at three different conversions, each less than 10%. Lines represent fits to the
Eyring equation.
Values of ∆𝐻‡ and ∆𝑆‡ are determined from the temperature dependence of the overall
change in free energy for H2O2 (∆𝐺‡𝐻2𝑂2) and H2O (∆𝐺‡𝐻2𝑂) formation (Scheme 2.3). ∆𝐺‡𝐻2𝑂2
equals the sum of energies for the dissociation of H2(g) to H+ and e- localized on adsorbed O2**
(∆𝐺𝐻2), protonation of O22-** to hydroperoxy (∆𝐺𝑂𝑂𝐻), and protonation of OOH-** to form the
transition state (∆𝐺𝐻−𝑂𝑂𝐻):
∆𝐺‡𝐻2𝑂2 = ∆𝐺𝐻2 + ∆𝐺𝑂𝑂𝐻 + ∆𝐺𝐻−𝑂𝑂𝐻 (2.23)
while ∆𝐺‡𝐻2𝑂 includes the free energy change for activating the O-O bond in OOH**
(∆𝐺𝑂−𝑂𝐻):
∆𝐺‡𝐻2𝑂 = ∆𝐺𝐻2 + ∆𝐺𝑂𝑂𝐻 + ∆𝐺𝑂−𝑂𝐻 (2.24)
43
Lastly, transition state theory allows values of 𝐾‡𝑥 (Fig. 2.6) to be expressed in terms of ∆𝐺‡ as
well as ∆𝐻‡ and ∆𝑆‡ (from ∆𝐺‡ = ∆𝐻‡ − 𝑇∆𝑆‡):
𝐾‡𝑥 = 𝑒−𝛥𝐺‡𝑥𝑅𝑇 = 𝑒
−∆𝐻‡𝑥𝑅𝑇 ∙ 𝑒
∆𝑆‡𝑥𝑅 (2.25)
where R is the ideal gas constant and the subscript x indicates that the associated variable
corresponds to the formation of product x.
Table 2.3 shows values of ∆𝐻‡𝐻2𝑂2 and ∆𝐻‡𝐻2𝑂 for 0.7, 3, and 7 nm Pd clusters
calculated from 𝐾‡𝐻2𝑂2and 𝐾‡𝐻2𝑂 (Fig. 2.6) and Eq. (2.25). ∆𝐻‡𝐻2𝑂2 values increase from 9 to
14 + 2 kJ mol-1 as the mean sizes of Pd clusters increase, which shows that ∆𝐻‡𝐻2𝑂2 is weakly
sensitive to cluster size. These ∆𝐻‡𝐻2𝑂2values are similar to barriers for proton-electron transfer
steps on Pt electrocatalysts determined from DFT calculations (~10 kJ mol-1)131,132 and measured
experimentally (<15 kJ mol-1)133 as well as estimates (10-20 kJ mol-1) for other ORR
electrocatalysts.133-135 Such comparisons indicate that these charge-transfer processes depend
weakly on the coordinative saturation and the elemental identity of Group 8 metal surfaces. The
strong agreement between this work and these previous studies131-135 provides further evidence
that the mechanisms for direct synthesis of H2O2 are comparable to those for the electrochemical
ORR. Measured ∆𝐻‡𝐻2𝑂2 values are significantly lower than calculated barriers for
hydrogenation of molecular oxygen (77-109 kJ mol-1) on Pd,76,77 which shows that direct
synthesis of H2O2 should proceed predominantly by proton-electron transfer and not by
hydrogenation. Measured values for ∆𝐻‡𝐻2𝑂, in contrast, increase from 18 to 32 + 2 kJ mol-1 as
the mean diameters of Pd clusters increase from 0.7 to 7 nm (Table 2.3), and ∆𝐻‡𝐻2𝑂 clearly
depends on the coordinative saturation of the exposed Pd atoms. Notably, ∆𝐻‡𝐻2𝑂 on 7 nm Pd
clusters, whose surfaces primarily expose close-packed terraces,136 match activation energies
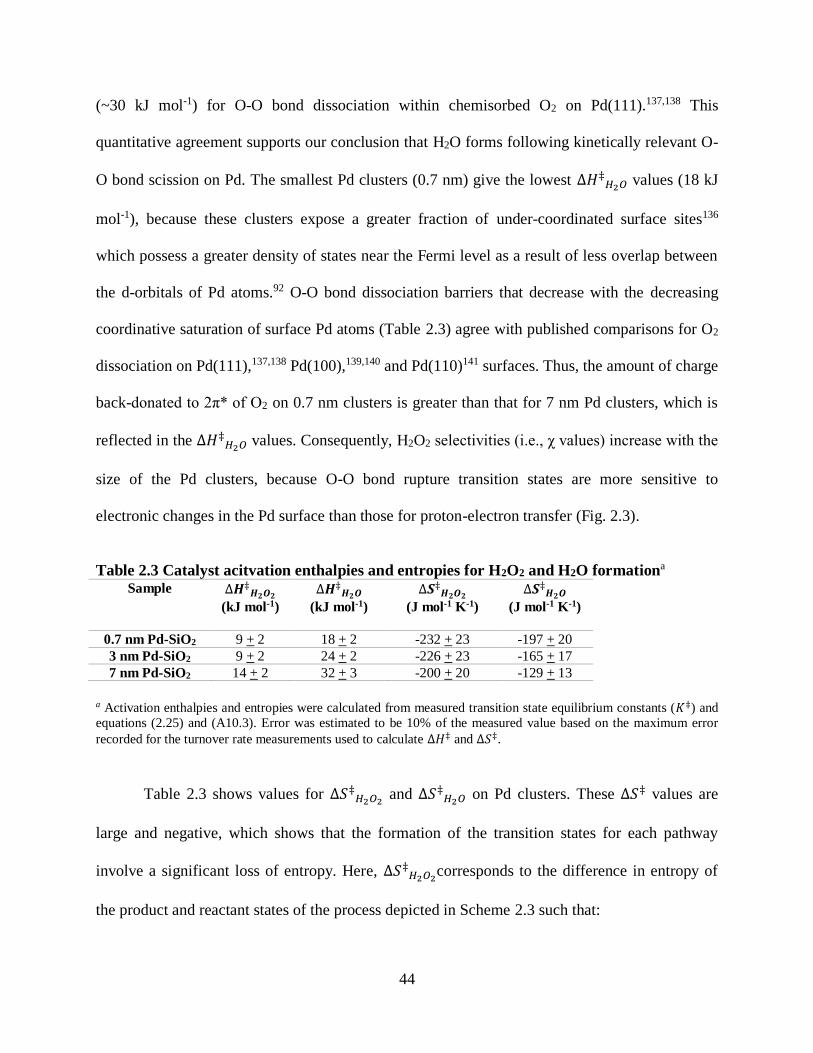
44
(~30 kJ mol-1) for O-O bond dissociation within chemisorbed O2 on Pd(111).137,138 This
quantitative agreement supports our conclusion that H2O forms following kinetically relevant O-
O bond scission on Pd. The smallest Pd clusters (0.7 nm) give the lowest ∆𝐻‡𝐻2𝑂 values (18 kJ
mol-1), because these clusters expose a greater fraction of under-coordinated surface sites136
which possess a greater density of states near the Fermi level as a result of less overlap between
the d-orbitals of Pd atoms.92 O-O bond dissociation barriers that decrease with the decreasing
coordinative saturation of surface Pd atoms (Table 2.3) agree with published comparisons for O2
dissociation on Pd(111),137,138 Pd(100),139,140 and Pd(110)141 surfaces. Thus, the amount of charge
back-donated to 2π* of O2 on 0.7 nm clusters is greater than that for 7 nm Pd clusters, which is
reflected in the ∆𝐻‡𝐻2𝑂 values. Consequently, H2O2 selectivities (i.e., χ values) increase with the
size of the Pd clusters, because O-O bond rupture transition states are more sensitive to
electronic changes in the Pd surface than those for proton-electron transfer (Fig. 2.3).
Table 2.3 Catalyst acitvation enthalpies and entropies for H2O2 and H2O formationa Sample ∆𝑯‡𝑯𝟐𝑶𝟐
(kJ mol-1)
∆𝑯‡𝑯𝟐𝑶
(kJ mol-1)
∆𝑺‡𝑯𝟐𝑶𝟐
(J mol-1 K-1)
∆𝑺‡𝑯𝟐𝑶
(J mol-1 K-1)
0.7 nm Pd-SiO2 9 + 2 18 + 2 -232 + 23 -197 + 20
3 nm Pd-SiO2 9 + 2 24 + 2 -226 + 23 -165 + 17
7 nm Pd-SiO2 14 + 2 32 + 3 -200 + 20 -129 + 13
a Activation enthalpies and entropies were calculated from measured transition state equilibrium constants (𝐾‡) and
equations (2.25) and (A10.3). Error was estimated to be 10% of the measured value based on the maximum error
recorded for the turnover rate measurements used to calculate ∆𝐻‡ and ∆𝑆‡.
Table 2.3 shows values for ∆𝑆‡𝐻2𝑂2 and ∆𝑆‡𝐻2𝑂 on Pd clusters. These ∆𝑆‡ values are
large and negative, which shows that the formation of the transition states for each pathway
involve a significant loss of entropy. Here, ∆𝑆‡𝐻2𝑂2corresponds to the difference in entropy of
the product and reactant states of the process depicted in Scheme 2.3 such that:
45
∆𝑆‡𝐻2𝑂2 = 𝑆𝐻2𝑂2‡ − 𝑆𝐻2 − 𝑆𝑂2∗∗ (2.26)
and a corresponding equation describes ∆𝑆‡𝐻2𝑂:
∆𝑆‡𝐻2𝑂 = 𝑆𝐻2𝑂‡ −1
2𝑆𝐻2 − 𝑆𝑂2∗∗ (2.27)
where 𝑆𝐻2𝑂2‡ and 𝑆𝐻2𝑂‡ are the entropies of the transition states for H2O2 and H2O formation,
respectively, while 𝑆𝐻2 and 𝑆𝑂2∗∗ are the entropies of H2 and O2**. Values of ∆𝑆‡𝐻2𝑂2 (-232 –
-200 J mol-1 K-1) and ∆𝑆‡𝐻2𝑂 (-197 – -129 J mol-1 K-1) are shown in Table 2.3.
For H2O2 formation, the difference between the entropies of the reactants (O2**, H2(g))
and that of the transition state (𝐻+˗𝑂𝑂𝐻 ∗∗‡) can be estimated roughly as being equal to the
translational and rotational entropy loss from binding H2(g) to O2** (i.e., 𝑆𝐻2, 131 J mol-1 K-1 at
101 kPa H2, 273 K142). The values of ∆𝑆‡𝐻2𝑂2 (Table 2.3), however, are much more negative (by
> 70 J mol-1 K-1) than the estimate from this simple approximation. These significant differences
suggest that additional entropy is lost, perhaps, as the hydrogen-bonded solvent reorganizes into
a lower energy configuration about the hydrophilic transition state,143 which forms at the
interface between water and the hydrophobic O2**-covered metal cluster.144 Such a process
would also be consistent with values of ∆𝑆‡𝐻2𝑂 that also reflect a much larger entropy loss (again
by >70 J mol-1 K-1) than estimated by the consumption of one-half of a H2(g) molecule.
Estimates for the exact entropic change caused by reorganization of the solvating molecules falls
beyond the scope of this study. Values of both ∆𝑆‡𝐻2𝑂2 and ∆𝑆‡𝐻2𝑂 become slightly more
positive (i.e., less entropy is lost) as the size of Pd clusters increase (Table 2.3). These changes
show that entropies of the transition states (i.e., 𝑆𝐻2𝑂2‡, 𝑆𝐻2𝑂‡) increase more with the size of Pd
clusters than the surface intermediate from which they form (i.e., 𝑆𝑂2∗∗), because 𝑆𝐻2 does not
depend on the size of Pd clusters. This comparison implies that the transition states gain more

46
translational mobility than does O2** as the coordinative saturation of the Pd surface atoms
increases.
These data and the interpretations presented here show that increasing the coordination of
Pd atoms at cluster surfaces increases the H2O2 selectivity (χ) by increasing ∆𝐻‡𝐻2𝑂 while only
slightly affecting ∆𝐻‡𝐻2𝑂2 values. The weak dependence of ∆𝐻‡𝐻2𝑂2 on the electronic structure
of the surface is consistent with the proposed mechanism for H2O2 formation (Schemes 2.1 and
2.2), because H2O2 forms by proton-electron transfer which involves liquid-phase reactants that
are insensitive to the electronic structure of the catalyst surface. In contrast, ∆𝐻‡𝐻2𝑂 depends on
the coordination of Pd surface atoms, because the propensity of surfaces to cleave O-O bonds
depends strongly on their electronic structure. The increase in ∆𝑆‡ values with cluster size show
that the transition state for H2O2 and H2O formation both become more mobile relative to O2**
as the size of Pd clusters increase.
2.4 Conclusions
Turnover rates for H2O2 and H2O formation were measured on silica supported Pd
clusters over a wide range of H2 and O2 pressures, and solvent H+ concentrations in the absence
of artifacts from mass transport and secondary decomposition of H2O2. These rates were
interpreted in order to evaluate the mechanism of direct synthesis. Experiments in solvents with
varying H+ concentrations (including aprotic solvents) demonstrated that protons are essential for
H2O2 formation, while the identity of the counter-ion is much less important. The dependence of
rates on H2 and O2 pressures were inconsistent with Langmuirian mechanisms, and instead
provided evidence for heterolytic reaction pathways similar to the two electron ORR. Together,
these data and their interpretations provided a complete mechanistic understanding of the direct
47
synthesis of H2O2 that is consistent with the data and implicates proton-electron transfer
elementary steps to form H2O2 and O-O bond scission in OOH** to form H2O. Calculated values
for ∆𝐻‡ and ∆𝑆‡ from measured H2O2 and H2O formation rates at varying temperatures show
that H2O formation is more sensitive to the surface electronic structure when compared to H2O2,
and therefore, selectivity can be increased by increasing the ratio of coordinated to under-
coordinated surface sites. Overall, these results can aid the rational design of inexpensive
catalysts that can selectively produce H2O2 by direct synthesis in an environmentally benign
manner.
48
CHAPTER 3
DIRECT SYNTHESIS OF H2O2 ON Pd AND AuxPd1 CLUSTERS: UNDERSTANDING
THE EFFECTS OF ALLOYING Pd WITH Auiii
3.1 Introduction
The direct synthesis of hydrogen peroxide (H2 + O2 → H2O2) has the potential to replace
the auto-oxidation (AO) of anthraquinones as the dominant method for industrial-scale H2O2
production, because direct synthesis avoids the extensive separation steps associated with
AO.20,25 Consequently, direct synthesis could reduce the economic burden of using H2O2 (a
green oxidant since the primary byproduct is H2O) for industrial oxidations over less expensive,
yet potentially hazardous oxidants such as Cl2. The direct synthesis reaction could also be used to
synthesize H2O2 in the same reactor in which it would be used as an oxidant, which would
reduce the number of concentration and purification steps typically involved in industrial H2O2
formation. The value of coupling H2O2 formation with an oxidation process within a single
facility has been demonstrated by the success of the hydrogen peroxide – propylene oxide
(HPPO) process.54 However, direct synthesis is currently not used at the industrial-scale
primarily due to poor H2O2 selectivity over the thermodynamically favored combustion of H2 to
H2O25,46,65 The potential benefits of using direct synthesis over AO are obvious, as such, research
efforts have focused on developing deeper understanding of the mechanism of this reaction and
the underlying reasons why the addition of specific promoter and the formation of alloys
improve H2O2 formation rates and selectivities.31,46,65,72,82,145-147
There is significant interest in developing Pd-based bimetallic clusters as alternatives to
the use of harmful additives for improving H2O2 selectivity. Numerous reaction variables are
iiiThis chapter has been adapted from the following publication:
Wilson, N.M., Priyadarshini, P., Kunz, S., and Flaherty, D.W., Direct Synthesis of H2O2 on Pd and AuxPd1 Clusters:
Understanding the Effects of Alloying Pd with Au, J. Catal., 2018, 357, 163-175

49
reported to impact H2O2 selectivity (e.g., halide coadsorbates,84,86,148 solvent identity,96,147
catalyst composition47,65), but the reasons for these changes are less than clear. As one example,
AuPd nanoparticles supported on carbon provide H2O2 selectivities as high as 98%, which are
significantly greater than the ~40% H2O2 selectivity seen for monometallic Pd under similar
conditions82 The fundamental manner by which the addition of Au affects this reaction is
currently under debate. Density functional theory (DFT) calculations, combined with Bader
charge analysis, suggest that increasing the number of adjacent Au atoms to Pd, broadens the
density of states near the Fermi level,149 which decreases the amount of e- back donation into the
π* orbital of the O-O bond in chemisorbed hydroperoxy (OOH**, where ** represents adsorbed
species in an η2 configuration).92,146 These changes likely increase barriers for O-O bond rupture
and subsequent H2O formation and perhaps also those for H2O2 formation (i.e., electronic
effects).46 On the other hand infrared spectroscopy of CO and kinetic measurements show that
adding Au to Pd clusters reduces the prevalence of groups of multiple, contiguous Pd atoms on
the catalyst surface,39,150,151 which in turn changes the distribution of active sites (i.e., ensemble
effects) among those that preferentially form H2O2 (e.g., monomers of Pd) and those that largely
produce H2O (e.g., groupings of multiple Pd atoms).149 Either ensemble or electronic effects may
cause increasing surface molar ratios of Au to Pd to yield greater H2O2 selectivities, which is
consistent with prior batch reactor studies of silica-supported AuPd clusters.66 Recently, we
presented experimental evidence that suggested monometallic Pd clusters facilitate proton-
electron transfer (PET) steps that reduce O2 to form H2O2 during direct synthesis and which was
inconsistent with the direct hydrogenation of O2 with surface H-atoms.146 These PET pathways
were not considered in previous computational investigations of direct synthesis nor the
corresponding predictions for how the addition of Au influences the elementary steps for H2O2
50
formation (assumed to involve direct hydrogenation of O2) in comparison to those for H2O
formation (O-O bond dissociation) over AuPd bimetallic catalysts.
In this study, we show that AuxPd1 (where x is the bulk averaged atomic ratio of Au to
Pd) cluster catalysts give greater selectivities for H2O2 than do monometallic Pd catalysts,
because the presence of Au increases barriers for the kinetically relevant steps that form H2O
more than for those steps that create H2O2. These conclusions are supported by steady-state H2O2
and H2O formation rates measured as functions of H2 and O2 pressure and temperature on both
Pd and AuxPd1 catalysts. Formation rates of H2O2 and H2O depend on H2 and O2 pressures in the
same manner on Pd and AuxPd1, as shown by comparable fits of the same rate expressions to
rates of H2O2 formation and H2O formation by both primary and secondary pathways for Pd and
AuxPd1 catalysts. Additionally, we found that H2O2 formation rates on both Pd and AuxPd1 were
at least orders of magnitude higher in a protic solvent than in an aprotic solvent, in which H2O2
formation rates were immeasurable. These observations suggest that PET is a necessary step in
the direct synthesis reaction and that H2O2 and H2O likely form by the same mechanisms on
AuxPd1 and Pd. Consequently, differences in H2O2 selectivity must arise from changes in the
geometric or electronic structure of the active sites. Activation enthalpies (∆𝐻‡) for both H2O2
and H2O formation increase with the Au composition of the clusters, and the difference between
H2O2 and H2O enthalpies on a given catalyst (∆∆𝐻‡) becomes larger with increasing ratio of Au
to Pd (an increase in ∆∆𝐻‡ values of 8 kJ mol-1 between Pd and Au7Pd1). Comparisons of
∆∆𝐻‡/T to measured ratios of the rates for H2O2 formation to those for H2O formation for each
catalyst demonstrate that electronic effects are primarily responsible for the greater H2O2
selectivities on catalysts with large Au:Pd ratios and result from changes in the grouping of Pd
atoms on the surface. These findings show that the alloying of Au with Pd increases H2O2

51
selectivities primarily by modifying the electronic structure of the active sites and not by
changing the ratios of unique sites that form either H2O2 or H2O or by changing the mechanism
of these reactions.
3.2 Methods and Materials Characterization
3.2.1 Synthesis of Supported Au, Pd, and AuxPd1 Catalysts
Au and AuxPd1 clusters were formed in solution using a colloidal technique,152 followed
by deposition of the colloidal solution onto silica and a subsequent reductive treatment. Briefly,
the Au precursor (HAuCl4·3H2O, Sigma-Aldrich, > 99.9%) was added to deionized (DI) water
(173-431 cm3, 17.8 MΩ) to obtain a solution with a Au concentration of 0.44 mM, which was
then heated to 333 K while stirring at 150 rpm. In a separate container, an aqueous reductant
solution containing 1.7 mM trisodium citrate dihydrate (Na2C6H5O7·2H2O, Sigma-Aldrich, >
99%), 0.37 mM tannic acid (C76H52O46, Sigma-Aldrich, > 99.99%), and 1.6 mM potassium
carbonate (K2CO3, Sigma-Aldrich, > 99.995%) was also heated to 333 K while stirring at 150
rpm. A quantity of the reductant solution (25% of the volume of the Au solution) was then added
to the Au solution, and the mixture was stirred at 150 rpm for 2 min before being removed from
the water bath and allowed to cool to ambient temperature over 12 h. The stable colloidal Au
particles formed were separated from the supernatant and concentrated by centrifugation (4.1·104
rpm, 2.0·107 m s-2; Beckman, XL-70) for 1 h. The supernatant was decanted and the
concentrated Au precipitate was re-dispersed by adding DI H2O to achieve a volume of 18 cm3.
AuxPd1 clusters were synthesized by adding 1 cm3 of a solution of K2PdCl4 (19-76 mM,
Sigma-Aldrich, 99.99%) to the Au colloid solution after centrifugation but prior to re-dispersion
in DI H2O. H2 was then bubbled (> 100 cm3 min-1) through the solution using a dispersion tube
for 1 min to promote the electroless deposition of metallic Pd onto the Au colloids. All gases

52
used were 99.999% pure and supplied by Airgas unless otherwise stated. For all compositions
(Au, Au1Pd1, Au7Pd1, and Au12Pd1), the re-dispersed metal colloidal solution was dripped onto
15 g of silica (Sigma-Aldrich, Davisil 646, 35-60 mesh) until the point of saturation. The wet
silica was then allowed to dry at ambient conditions for 1 h. These solids were heated to 573 K at
5 K min-1 and then held at 573 K for 4 h in a flowing H2/He mixture (40 kPa H2, 61 kPa He, 100
cm3 min-1) with the intent to remove organic residues and fully reduce the Au and AuxPd1.
Subsequently, the catalysts were cooled to ambient temperature and passivated by exposure to
dilute O2 (4 kPa O2, 97 kPa He, 500 cm3 min-1) for 0.5 h.
Pure Pd catalysts were synthesized by strong electrostatic adsorption (SEA) of a Pd
precursor onto silica, as previously described.98,146 Briefly, SEA of Pd was performed by adding
15 g of silica to a basic aqueous solution (pH > 11; 14.5 M NH4OH, Macron, 28-30 wt. %)
followed by 17.4 mg of Pd(NH3)4Cl2 (Sigma-Aldrich, > 99.99%) for the 7 nm Pd and 18.8 mg of
Pd(NO3)22H2O (Sigma-Aldrich, ~40% Pd basis) for the 0.6 nm Pd. The resulting mixture was
stirred by hand every 0.5 h over the course of 3 h to allow the Pd(NH3)42+ or Pd2+ species to
electrostatically adsorb onto the negatively charged silica surface. The solids were recovered,
rinsed with 500 cm3 of DI water, dried by vacuum filtration, and subsequently reduced by
heating to 573 K at 5 K min-1 and holding the sample at 573 K for 4 h (40 kPa H2, 61 kPa He,
100 cm3 min-1). The mean diameter of the 7 nm Pd clusters was increased from ~ 1 nm to 7 nm
(Table 3.1) by heating the reduced Pd-SiO2 sample at 5 K min-1 in flowing dry air (100 cm3 min-
1) to 973 K and holding for 4 h. This treatment was followed by a subsequent reductive treatment
at 573 K for 4 h (40 kPa H2, 61 kPa He, 100 cm3 min-1). All Pd, Au, and AuxPd1 catalysts were
stored in glass vials with reflective coverings within evacuated desiccators to minimize exposure
to ambient light and moisture.
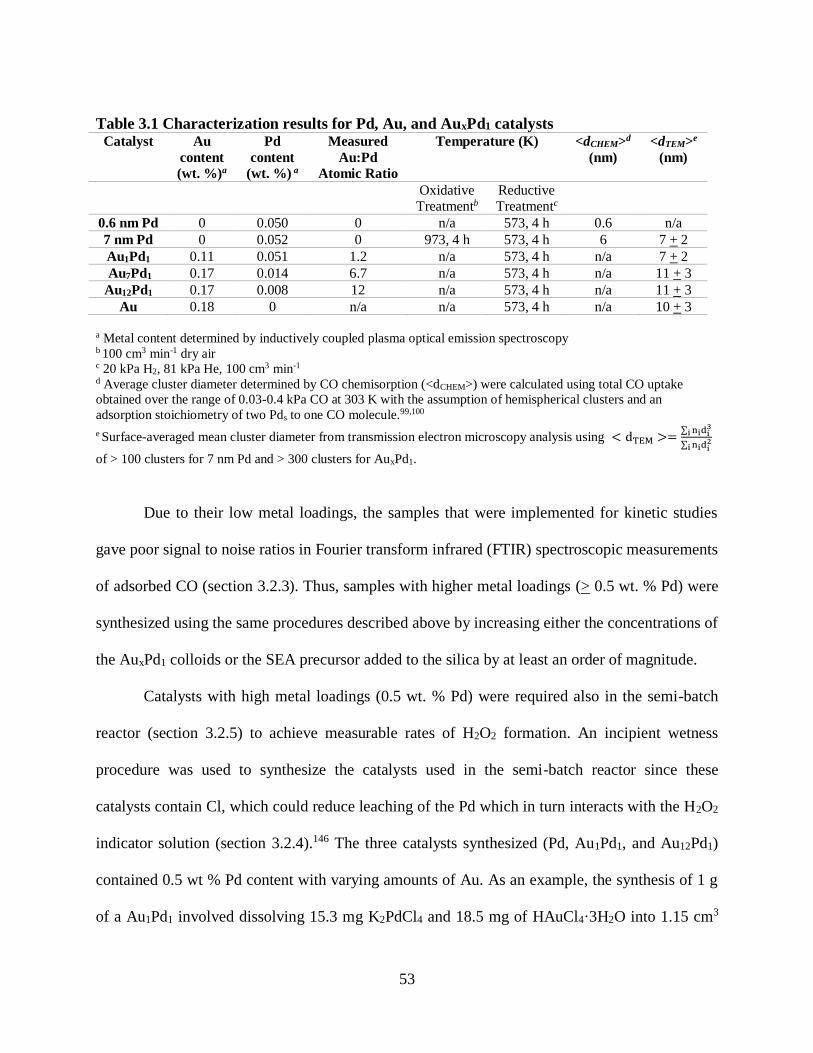
53
Table 3.1 Characterization results for Pd, Au, and AuxPd1 catalysts Catalyst Au
content
(wt. %)a
Pd
content
(wt. %) a
Measured
Au:Pd
Atomic Ratio
Temperature (K) <dCHEM>d
(nm)
<dTEM>e
(nm)
Oxidative Treatmentb
Reductive Treatmentc
0.6 nm Pd 0 0.050 0 n/a 573, 4 h 0.6 n/a
7 nm Pd 0 0.052 0 973, 4 h 573, 4 h 6 7 + 2
Au1Pd1 0.11 0.051 1.2 n/a 573, 4 h n/a 7 + 2
Au7Pd1 0.17 0.014 6.7 n/a 573, 4 h n/a 11 + 3
Au12Pd1 0.17 0.008 12 n/a 573, 4 h n/a 11 + 3
Au 0.18 0 n/a n/a 573, 4 h n/a 10 + 3
a Metal content determined by inductively coupled plasma optical emission spectroscopy b 100 cm3 min-1 dry air c 20 kPa H2, 81 kPa He, 100 cm3 min-1 d Average cluster diameter determined by CO chemisorption (<dCHEM>) were calculated using total CO uptake
obtained over the range of 0.03-0.4 kPa CO at 303 K with the assumption of hemispherical clusters and an
adsorption stoichiometry of two Pds to one CO molecule.99,100
e Surface-averaged mean cluster diameter from transmission electron microscopy analysis using < dTEM >=∑ nidi
3i
∑ nidi2
i
of > 100 clusters for 7 nm Pd and > 300 clusters for AuxPd1.
Due to their low metal loadings, the samples that were implemented for kinetic studies
gave poor signal to noise ratios in Fourier transform infrared (FTIR) spectroscopic measurements
of adsorbed CO (section 3.2.3). Thus, samples with higher metal loadings (> 0.5 wt. % Pd) were
synthesized using the same procedures described above by increasing either the concentrations of
the AuxPd1 colloids or the SEA precursor added to the silica by at least an order of magnitude.
Catalysts with high metal loadings (0.5 wt. % Pd) were required also in the semi-batch
reactor (section 3.2.5) to achieve measurable rates of H2O2 formation. An incipient wetness
procedure was used to synthesize the catalysts used in the semi-batch reactor since these
catalysts contain Cl, which could reduce leaching of the Pd which in turn interacts with the H2O2
indicator solution (section 3.2.4).146 The three catalysts synthesized (Pd, Au1Pd1, and Au12Pd1)
contained 0.5 wt % Pd content with varying amounts of Au. As an example, the synthesis of 1 g
of a Au1Pd1 involved dissolving 15.3 mg K2PdCl4 and 18.5 mg of HAuCl4·3H2O into 1.15 cm3
54
of DI H2O. The resultant solution was then added dropwise to 1 g of SiO2, which was then
heated to 573 K at 5 K min-1 and held at 573 K for 4 h (40 kPa H2, 61 kPa He, 100 cm3 min-1)
with the intent to reduce the metal salt and form metallic clusters.
3.2.2 Catalyst Characterization and Estimates for Site Counts
The average diameter of the pure Pd clusters prepared by SEA (0.6 and 7 nm) was
determined by volumetric uptake of CO (<dCHEM>), and transmission electron microscopy
(TEM) was used to determine cluster size distributions for all catalysts synthesized with the
exception of 0.6 nm Pd. The procedure used to measure the volumetric uptake of CO has been
described in more detail previously.146 Briefly, the total amount of adsorbed CO (Airgas,
99.99%) was determined at 303 K by measuring volumetric uptakes between 0.03 and 0.4 kPa
CO and extrapolating the linear portion of the isotherm to zero pressure. The number of exposed
Pd surface atoms (Pds) was estimated by assuming a 2:1 ratio of Pds to CO molecules.99,100 The
average cluster diameter could be determined from Pds by assuming a hemispherical cluster
geometry and a Pd atomic radius of 0.14 nm. Values of <dCHEM> for AuxPd1 samples cannot be
determined with confidence, because CO uptake values depend on both the diameter of the
clusters and the fraction of exposed metal atoms at surfaces that are Pd, which is unknown.153
The distribution of cluster diameters was obtained through bright-field TEM (JEOL 2010
LaB6) imaging of more than 100 clusters for each catalyst. Samples were prepared for TEM by
grinding each to a fine powder (< 200 mesh) and then gently dusting the powder onto Cu holey-
carbon TEM grids (200 mesh, Ted Pella Inc.). The surface area normalized cluster diameter
(<dTEM>) was calculated for each catalyst using the equation:
< 𝑑𝑇𝐸𝑀 >= ∑ 𝑛𝑖𝑑𝑖
3𝑖
∑ 𝑛𝑖𝑑𝑖2
𝑖 (3.1)

55
where ni is the number of clusters with diameter di. Figure 3.1 shows a representative TEM
image of the Au1Pd1 clusters and the distribution of the cluster diameters is shown as the inset.
Representative images for all other catalysts used can be found in the Appendix (Fig. B.1). The
size of the 0.6 nm Pd clusters were too small to measure accurately by TEM, and therefore, their
mean diameters were determined using only CO chemisorption. The values of <dTEM> and
<dCHEM> agree closely for the 7 nm Pd sample (Table 3.1), suggesting that the Pd clusters do not
have residual contaminants from the synthesis blocking their sites. The Au and Pd metal loading
for each catalyst was measured by inductively coupled plasma optical emission spectroscopy
(ICP-OES; PerkinElmer, Optima 2000DV).
Figure 3.1 Representative TEM image of Au1Pd1 catalyst with cluster size distribution
(inset). More than 300 clusters were measured to determine the value of <dTEM>, the
surface area averaged diameter.

56
The Pds value of AuxPd1 catalysts during direct synthesis of H2O2 were estimated using
the dispersion calculated from <dTEM> values and the bulk atomic ratio of Pd to Au (determined
from ICP-OES, Table 3.1) by assuming that Pd within each cluster migrated to the surface when
in the presence of a strongly binding reactant (e.g., O2) 151 either until all Pd had segregated to
the surface or until the surface was entirely covered by Pd atoms. The metal loading and average
cluster diameter characterization results for all catalysts used in this study for steady-state rate
measurements can be found in Table 3.1. Comparisons in this work will be made between
catalysts of similar cluster size (7-11 nm) unless otherwise stated.
Dark-field scanning transmission electron microscopy (STEM; JEOL 2010F EF-FEG) in
combination with energy-dispersive X-ray spectroscopy (EDS; Oxford Instruments, 6498) were
used to determine if Pd and Au coexisted within individual clusters. The same catalyst samples
used for TEM imaging were used for STEM/EDS. Figure 3.2 shows a representative STEM
image of a Au1Pd1 cluster along with the corresponding EDS map of Au and Pd. The EDS maps
show that Au and Pd atoms are found within the same cluster, which suggests that the elements
are mixed. Au and Pd were found to coexist in four additional Au1Pd1 clusters scanned as well as
in five Au7Pd1 and five Au12Pd1 clusters, which are presented in Appendix B along with EDS
maps of one pure Pd and one pure Au cluster (section B2). The AuxPd1 clusters appear to consist
of mixed Pd and Au, because monometallic Pd or Au clusters were not observed within the
AuxPd1 samples.
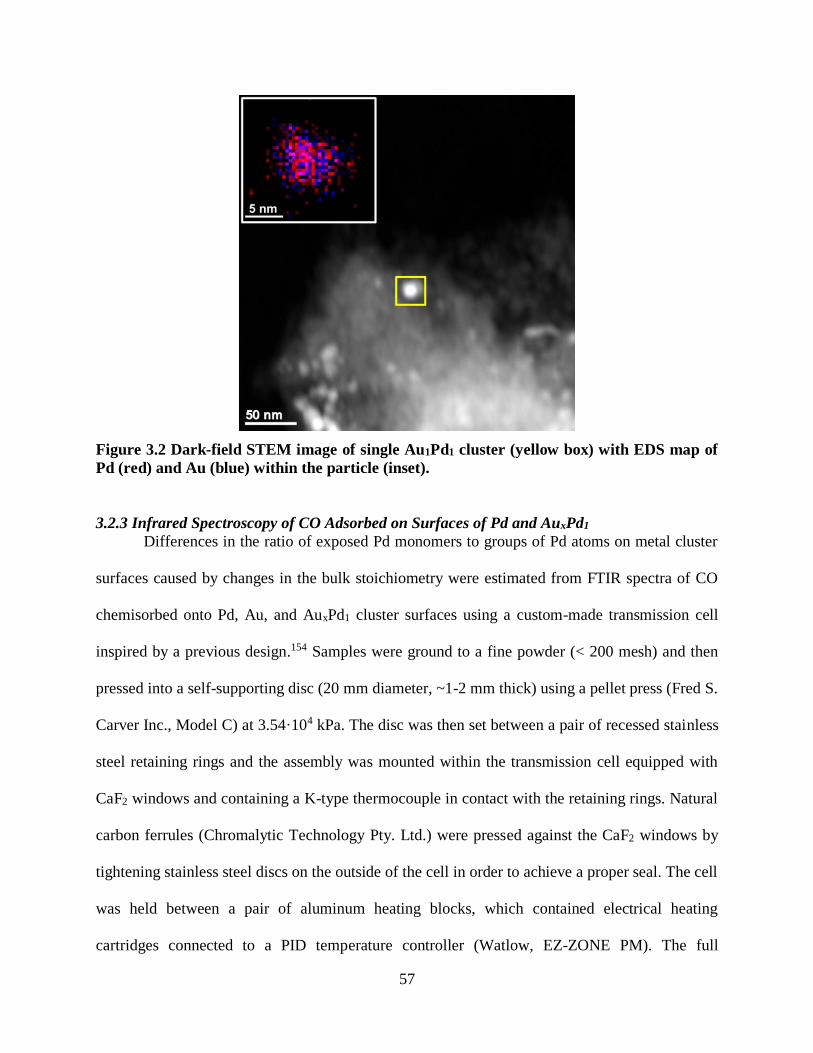
57
Figure 3.2 Dark-field STEM image of single Au1Pd1 cluster (yellow box) with EDS map of
Pd (red) and Au (blue) within the particle (inset).
3.2.3 Infrared Spectroscopy of CO Adsorbed on Surfaces of Pd and AuxPd1
Differences in the ratio of exposed Pd monomers to groups of Pd atoms on metal cluster
surfaces caused by changes in the bulk stoichiometry were estimated from FTIR spectra of CO
chemisorbed onto Pd, Au, and AuxPd1 cluster surfaces using a custom-made transmission cell
inspired by a previous design.154 Samples were ground to a fine powder (< 200 mesh) and then
pressed into a self-supporting disc (20 mm diameter, ~1-2 mm thick) using a pellet press (Fred S.
Carver Inc., Model C) at 3.54·104 kPa. The disc was then set between a pair of recessed stainless
steel retaining rings and the assembly was mounted within the transmission cell equipped with
CaF2 windows and containing a K-type thermocouple in contact with the retaining rings. Natural
carbon ferrules (Chromalytic Technology Pty. Ltd.) were pressed against the CaF2 windows by
tightening stainless steel discs on the outside of the cell in order to achieve a proper seal. The cell
was held between a pair of aluminum heating blocks, which contained electrical heating
cartridges connected to a PID temperature controller (Watlow, EZ-ZONE PM). The full
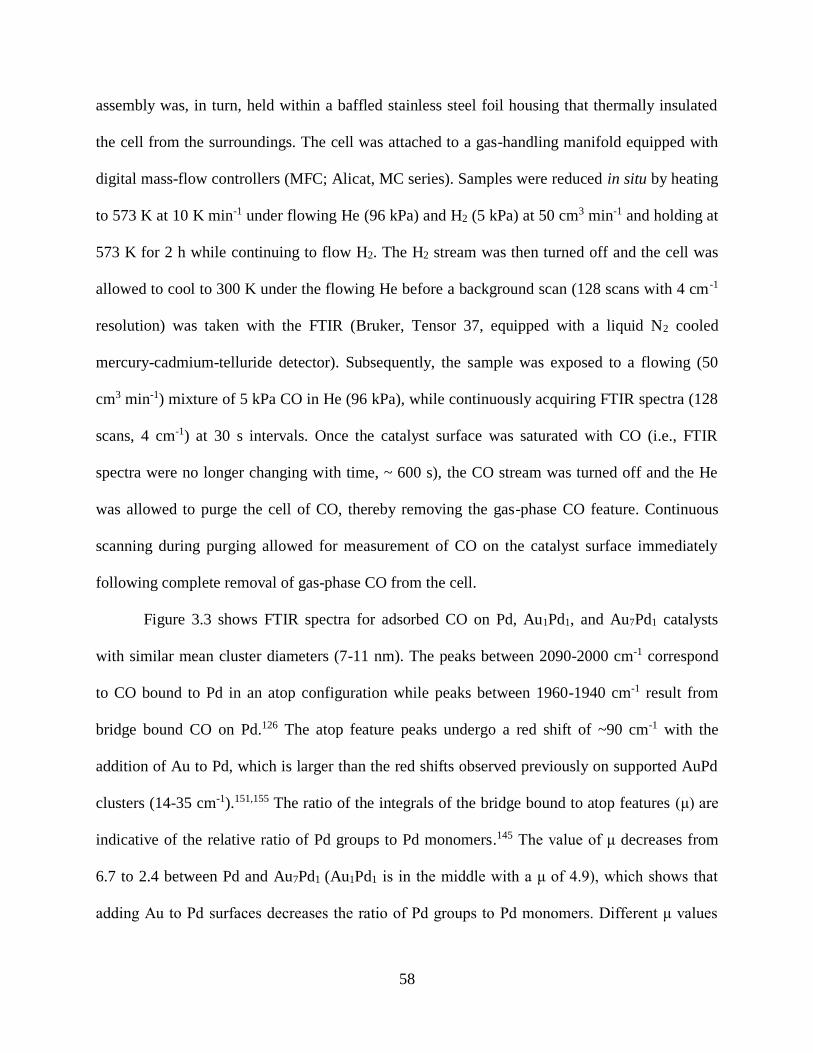
58
assembly was, in turn, held within a baffled stainless steel foil housing that thermally insulated
the cell from the surroundings. The cell was attached to a gas-handling manifold equipped with
digital mass-flow controllers (MFC; Alicat, MC series). Samples were reduced in situ by heating
to 573 K at 10 K min-1 under flowing He (96 kPa) and H2 (5 kPa) at 50 cm3 min-1 and holding at
573 K for 2 h while continuing to flow H2. The H2 stream was then turned off and the cell was
allowed to cool to 300 K under the flowing He before a background scan (128 scans with 4 cm -1
resolution) was taken with the FTIR (Bruker, Tensor 37, equipped with a liquid N2 cooled
mercury-cadmium-telluride detector). Subsequently, the sample was exposed to a flowing (50
cm3 min-1) mixture of 5 kPa CO in He (96 kPa), while continuously acquiring FTIR spectra (128
scans, 4 cm-1) at 30 s intervals. Once the catalyst surface was saturated with CO (i.e., FTIR
spectra were no longer changing with time, ~ 600 s), the CO stream was turned off and the He
was allowed to purge the cell of CO, thereby removing the gas-phase CO feature. Continuous
scanning during purging allowed for measurement of CO on the catalyst surface immediately
following complete removal of gas-phase CO from the cell.
Figure 3.3 shows FTIR spectra for adsorbed CO on Pd, Au1Pd1, and Au7Pd1 catalysts
with similar mean cluster diameters (7-11 nm). The peaks between 2090-2000 cm-1 correspond
to CO bound to Pd in an atop configuration while peaks between 1960-1940 cm-1 result from
bridge bound CO on Pd.126 The atop feature peaks undergo a red shift of ~90 cm-1 with the
addition of Au to Pd, which is larger than the red shifts observed previously on supported AuPd
clusters (14-35 cm-1).151,155 The ratio of the integrals of the bridge bound to atop features (μ) are
indicative of the relative ratio of Pd groups to Pd monomers.145 The value of μ decreases from
6.7 to 2.4 between Pd and Au7Pd1 (Au1Pd1 is in the middle with a μ of 4.9), which shows that
adding Au to Pd surfaces decreases the ratio of Pd groups to Pd monomers. Different μ values
59
also provide further evidence (in addition to Figure 3.2) that Pd and Au atoms coexist within the
same clusters. CO adsorption features were not detectable on Au12Pd1 catalysts, likely because
there are much fewer surface Pd atoms on these catalysts compared to Pd and Au1Pd1. Based on
statistical arguments, we would expect that the value of μ would continue to decrease with
increasing Au composition since there would be less Pd at the surface to form groups.
Figure 3.3 Infrared spectra of CO adsorbed on Pd (black; 0.5 wt. % Pd), Au1Pd1 (red; 0.5
wt. % Pd), and Au7Pd1 (blue; 0.014 wt. % Pd) obtained after saturating surfaces under
flowing CO (~ 15 min in 5 kPa CO, 96 kPa He, 303 K) and purging gas-phase CO with He
(101 kPa, 47.5 cm3 min-1, 303 K). Spectra are the average of 128 scans with a 4 cm-1
resolution. Peak heights were normalized by the atop bound CO feature at 2090-2000 cm-1.
3.2.4 Steady-state H2O2 and H2O Formation Rate Measurements
The plugged-flow reactor setup used to measure steady-state H2O2 and H2O formation
rates has been described in section 2.2.3. Briefly, a packed bed reactor (15 cm long, 0.5 cm inner
diameter) within a stainless steel cooling jacket was loaded with 150-1000 mg of catalyst, held
between glass wool and 4 mm diameter glass rods. The temperature of the reactor (273-337 K)
was monitored by a K-type thermocouple and controlled with a refrigerated recirculating bath
60
(Fisher Scientific, Isotemp). Certified reactant gas mixtures (25% H2, balance N2, and 5% O2,
balance N2; or 5% H2, balance N2, and 25% O2, balance N2) were introduced by digital MFCs
(Porter, 601 series). The gas mixtures were diluted with sufficient amounts of N2 such that
flammable mixtures of H2 and O2 could never form.101 The reaction solvent (aqueous methanol
(Macron, > 99.8%) solutions, 20% v/v) was fed downstream of the MFCs by a high-performance
liquid chromatography (HPLC) pump (SSI, M1 Class). The reactor pressure (0.1-3.1 MPa) was
controlled by an electronic pressure reducer (EPR; Proportion Air, QB1S) and a back-pressure
regulator (BPR; Equilibar, EB1LF1-SS316). The reactor inlet pressure was monitored with a
digital pressure gauge (Omega, DPG8001-1K). The gas-liquid effluent stream was separated
using a polyvinyl chloride gas liquid separator (GLS) downstream of the BPR. The components
of the gas stream were separated and analyzed by a gas-chromatograph (GC; Agilent, 7890)
equipped with a packed column (Sigma-Aldrich, 3 m length x 2.1 mm ID, Molecular Sieve 5A)
and a thermal conductivity detector (TCD), in which Ar was used as both the carrier and a
reference gas. Liquid samples were removed from the GLS by an electronically actuated ball
valve (Banjo Corp., LEV025PL). An electronic 10-port valve (Vici) was configured to inject 0.4
cm3 of the reaction solution and 1 cm3 of a colorimetric indicator solution (12 mM neocuproine,
Sigma-Aldrich, > 98%; 8.3 mM CuSO4, Fisher Scientific, > 98.6%; 25% v/v ethanol, Decon
Laboratories Inc., 100%) 156 into glass vials held within an automated fraction collector (Biorad,
2110). The concentration of H2O2 in each vial was determined using a spectrophotometer
(Spectronic, 20 Genesys; 454 nm) in combination with calibration curves obtained using
solutions of known H2O2 concentrations.
Rate measurements were conducted in the absence of artifacts from mass-transport
restrictions and without significant secondary reactions (e.g., H2O2 hydrogenation). Previous
61
experiments showed that the Madon-Boudart criteria103 are satisfied (i.e., intrapellet
concentration gradients are negligible) for the Pd-SiO2 catalysts used here in cases where the Pd
loading is equal to or less than 0.05 wt. %.146 AuxPd1 clusters used here contain 0.051 wt. % Pd
or less and give H2O2 and H2O formation rates per gram of catalyst (and per SiO2 particle) that
are lower than those for monometallic Pd catalysts, therefore, these bimetallic catalysts will not
suffer from mass transport restrictions. In addition, rates were typically measured at near
differential H2 conversion (< 10%) to minimize the influence of secondary reactions.
Periodically, H2 conversions did reach values as high as 25% at the greatest reaction
temperatures (while determining ∆𝐻‡ values) and at extreme H2 and O2 pressures, because the
total gas flow rate was usually kept constant to avoid changes in sensitivity factors of the
reactants within the TCD of the GC.
The influence of these changes in H2 conversion on rates and selectivities were measured
over the range of 3-32% conversion by calibrating the TCD response factors for each gas flow
used. Figure 3.4a shows that the H2O2 selectivity weakly depends on the H2 conversion on 0.6
nm Pd, 7 nm Pd, and Au7Pd1 catalysts over this range of conversions. Linear fits to these
selectivity measurements show that changes in H2O2 selectivity with conversion for 0.6 nm Pd (-
0.02 + 0.06), 7 nm Pd (-0.03 + 0.09) and Au7Pd1 (0.18 + 0.14) were negligible within the
uncertainty of the measurements with the exception of Au7Pd1 which showed a slight increase in
selectivity. Consequently, secondary decomposition of H2O2 does not influence or weaken the
conclusions drawn from these measurements. Figure 3.4b shows that H2O2 and H2O formation
rates decrease by at most 20-30% with increasing H2 conversion over this wide range of
conversion as a result of reactant (e.g., H2) depletion and the positive order dependence of rates
on H2 pressure (section 3.3.1). In order to make equitable comparisons that reflect the changes
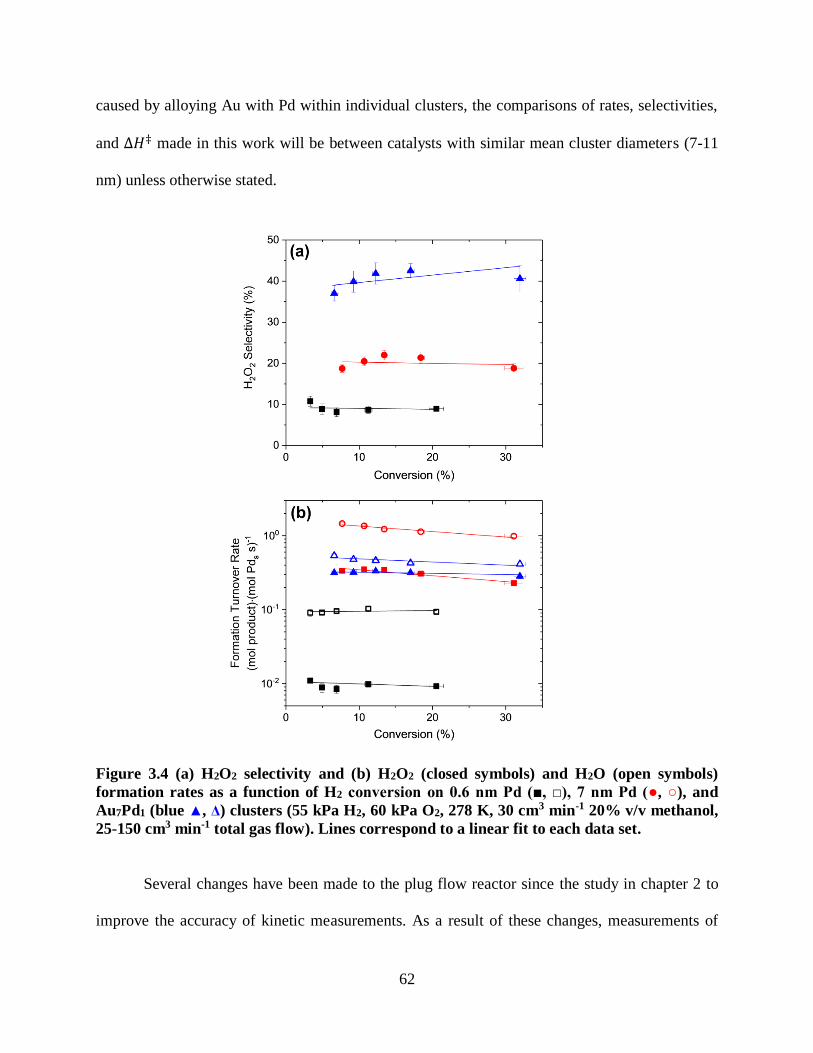
62
caused by alloying Au with Pd within individual clusters, the comparisons of rates, selectivities,
and ∆𝐻‡ made in this work will be between catalysts with similar mean cluster diameters (7-11
nm) unless otherwise stated.
Figure 3.4 (a) H2O2 selectivity and (b) H2O2 (closed symbols) and H2O (open symbols)
formation rates as a function of H2 conversion on 0.6 nm Pd (■, □), 7 nm Pd (●, ○), and
Au7Pd1 (blue ▲, Δ) clusters (55 kPa H2, 60 kPa O2, 278 K, 30 cm3 min-1 20% v/v methanol,
25-150 cm3 min-1 total gas flow). Lines correspond to a linear fit to each data set.
Several changes have been made to the plug flow reactor since the study in chapter 2 to
improve the accuracy of kinetic measurements. As a result of these changes, measurements of
63
∆𝐻‡ values and turnover rates are notably smaller than previously reported for small (0.6 nm)
and large (7 nm) Pd clusters. First, the reactor inner diameter was increased from 0.32 cm to 0.5
cm, which significantly reduced the pressure drop across the packed bed to less than 5% of the
set point (from values as large as 20%), which provides rate measurements at better defined
conditions. Second, we further reduced artifacts from secondary reactions, including
hydrogenation of H2O2 to H2O, by increasing the liquid flow rate from 10 cm3 min-1 to 30 cm3
min-1 during formation rate experiments. To quantify the significance of hydrogenation of H2O2
to H2O on rates, the conversion of H2O2 was measured at different temperatures, H2 pressures,
and liquid flow rates using a feed stream containing 1 mM H2O2 in aqueous methanol (Fig. B.6).
The conversion of H2O2 depends weakly on H2 pressure, but strongly on temperature and liquid
flow rate. To minimize artifacts from secondary reactions of H2O2, the flow rate of the liquid-
phase was held at 30 cm3 min-1 while measuring H2O2 and H2O formation rates. Notably, rate
constant and transition state equilibrium constants for hydrogenation of H2O2 (𝐾‡𝐻2𝑂2−𝐻) were
calculated using a packed bed reactor design equation to relate H2O2 conversion to the reaction
rates157 with the assumption that rates of hydrogenation are proportional to H2O2 concentration.
This assumption was confirmed through steady-state hydrogenation rates measured at different
H2O2 concentrations (Fig. B.7). As a result of the changes made to the reaction system,
measurements of ∆𝐻‡ and formation rate values were more accurate than those presented
previously and are systematically lower on the small (0.6 nm) and large (7 nm) Pd clusters.146
3.2.5 Rate Measurements in Semi-Batch Reactors
The effect of the protic and aprotic solvents on H2O2 formation rates were examined in a
semi-batch reactor. Initially, 60 cm3 of methanol (Macron, > 99.8%), 20% v/v methanol in DI
water (17.8 MΩ), or acetonitrile (Fisher Scientific, 99.9%) was added to a 100 cm3 three-neck
64
round bottom flask followed by the introduction of a reactant gas mixture (4.2 kPa H2, 4.2 kPa
O2, 92.9 kPa N2) through a gas dispersion tube. The flow rate of the gas stream was controlled by
a variable area rotameter (Omega, FL-1461-S). To initiate the reaction, 100 mg of a catalyst
(prepared by incipient wetness) was added to the reaction solution. The reaction mixture was
stirred continuously to minimize concentration gradients within the solvent, and a water-cooled
condenser column was used to decrease solvent loss during the experiment. Liquid samples (0.5
cm3) were taken every 5-20 minutes using a syringe equipped with a filter to separate the
catalysts particles from the liquid solvent. The H2O2 concentration of each aliquot was
determined by the colorimetric titration procedure described in section 3.2.4. The reaction was
conducted at ambient temperature (~ 295 K). Initial H2O2 formation rates were determined from
data collected using the semi-batch reactor by measuring the change in H2O2 concentration from
the linear portion of the concentration vs. time plots (i.e., < 0.25 h), which represents the
formation of H2O2 at the initial instant that the reaction begins.
3.3 Results and Discussion
3.3.1 Steady-State Rate Measurements and Analysis of the Reaction Mechanism
Figure 3.5 shows turnover rates for the formation of H2O2 (Fig. 3.5a) and H2O (Fig. 3.5b)
as a function of H2 pressure (25-400 kPa H2, 60 kPa O2, 278 K) on Pd, Au1Pd1, and Au12Pd1
catalysts. H2O2 formation rates initially increase in proportion with H2 pressure ((H2)) at the
lowest values of (H2) and adopt a sub-linear dependence at higher (H2) for all AuxPd1 catalysts
tested (Figure 3.5a). However, the (H2) value at which this change in the H2O2 formation rate
occurs increases with the Au content of the bimetallic catalysts. Specifically, Pd and Au1Pd1
catalysts maintain a nearly linear dependence on (H2) below 80 kPa H2 while rates increase
sharply with (H2) until 150 kPa H2 on Au12Pd1. H2O formation rates also increase sharply with
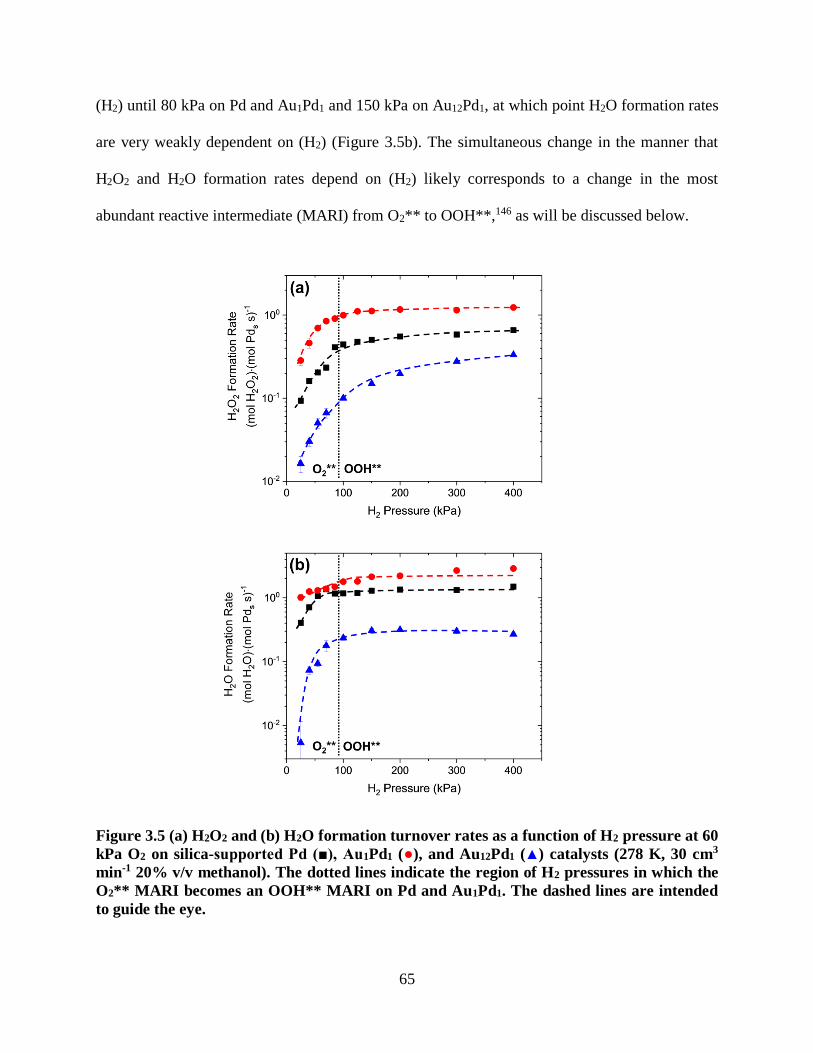
65
(H2) until 80 kPa on Pd and Au1Pd1 and 150 kPa on Au12Pd1, at which point H2O formation rates
are very weakly dependent on (H2) (Figure 3.5b). The simultaneous change in the manner that
H2O2 and H2O formation rates depend on (H2) likely corresponds to a change in the most
abundant reactive intermediate (MARI) from O2** to OOH**,146 as will be discussed below.
Figure 3.5 (a) H2O2 and (b) H2O formation turnover rates as a function of H2 pressure at 60
kPa O2 on silica-supported Pd (■), Au1Pd1 (●), and Au12Pd1 (▲) catalysts (278 K, 30 cm3
min-1 20% v/v methanol). The dotted lines indicate the region of H2 pressures in which the
O2** MARI becomes an OOH** MARI on Pd and Au1Pd1. The dashed lines are intended
to guide the eye.
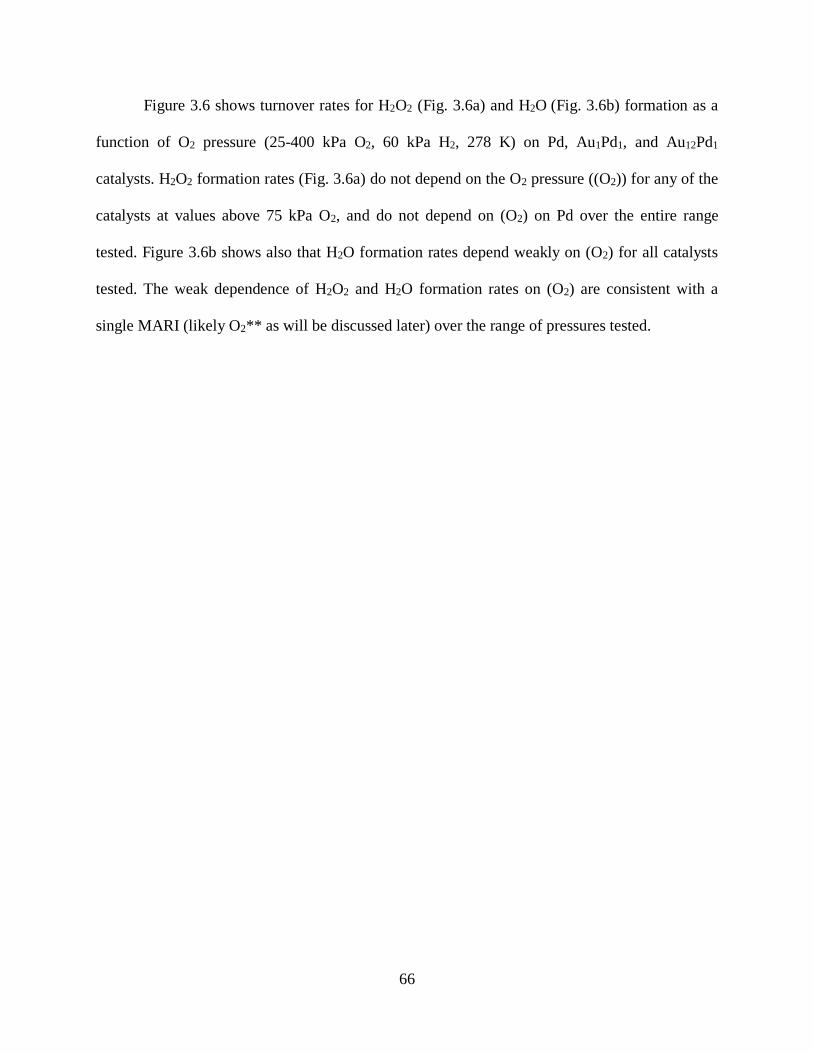
66
Figure 3.6 shows turnover rates for H2O2 (Fig. 3.6a) and H2O (Fig. 3.6b) formation as a
function of O2 pressure (25-400 kPa O2, 60 kPa H2, 278 K) on Pd, Au1Pd1, and Au12Pd1
catalysts. H2O2 formation rates (Fig. 3.6a) do not depend on the O2 pressure ((O2)) for any of the
catalysts at values above 75 kPa O2, and do not depend on (O2) on Pd over the entire range
tested. Figure 3.6b shows also that H2O formation rates depend weakly on (O2) for all catalysts
tested. The weak dependence of H2O2 and H2O formation rates on (O2) are consistent with a
single MARI (likely O2** as will be discussed later) over the range of pressures tested.
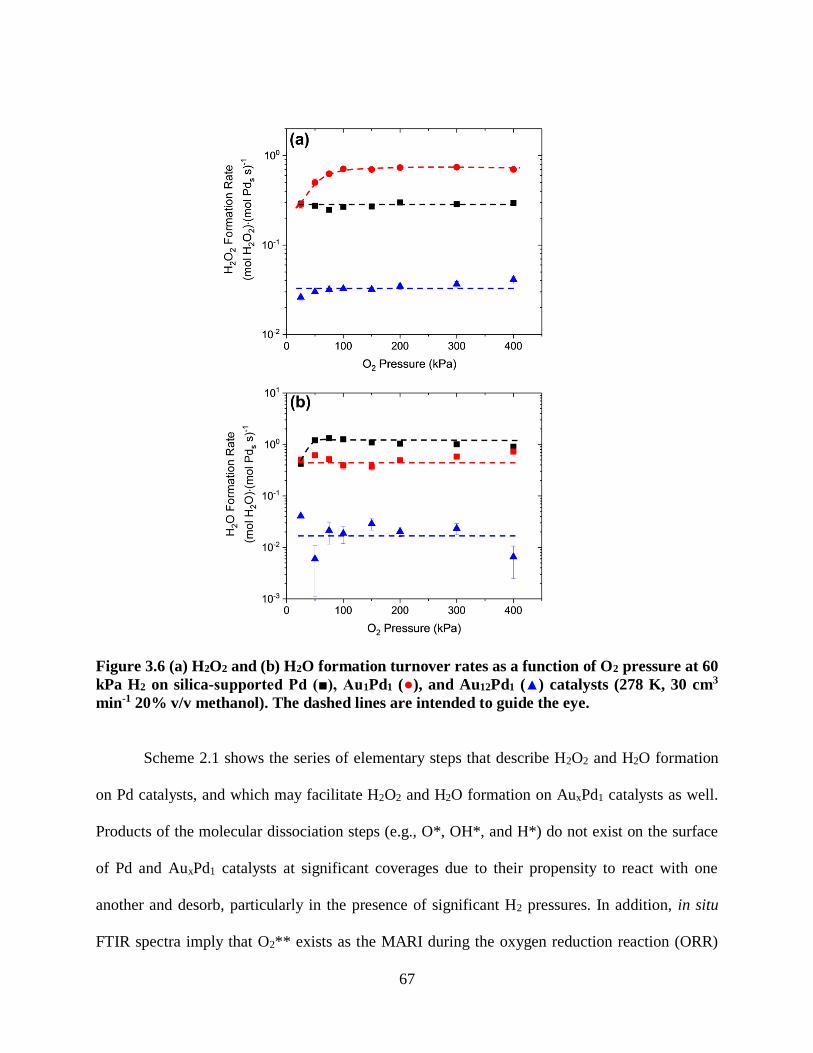
67
Figure 3.6 (a) H2O2 and (b) H2O formation turnover rates as a function of O2 pressure at 60
kPa H2 on silica-supported Pd (■), Au1Pd1 (●), and Au12Pd1 (▲) catalysts (278 K, 30 cm3
min-1 20% v/v methanol). The dashed lines are intended to guide the eye.
Scheme 2.1 shows the series of elementary steps that describe H2O2 and H2O formation
on Pd catalysts, and which may facilitate H2O2 and H2O formation on AuxPd1 catalysts as well.
Products of the molecular dissociation steps (e.g., O*, OH*, and H*) do not exist on the surface
of Pd and AuxPd1 catalysts at significant coverages due to their propensity to react with one
another and desorb, particularly in the presence of significant H2 pressures. In addition, in situ
FTIR spectra imply that O2** exists as the MARI during the oxygen reduction reaction (ORR)
68
on Pt surfaces at low potentials.158 Finally, the formation rates of H2O2 and H2O do not strongly
depend on O2 pressure (Figure 3.6), which indicates that the MARI must likely contain dioxygen
(and thus is not likely to be H*-atoms). For these reasons, the MARI is likely either empty sites,
or adsorbed O2**, OOH**, or H2O2**.
Previously, the kinetically relevant step for H2O2 formation was shown to be PET to
OOH** (Scheme 2.1, step 5). By applying the pseudo steady-state hypothesis to these
elementary steps and substituting rate and equilibrium constants as well as reactant pressures and
concentrations into the rate expression of the kinetically relevant step, an expression for the rate
of H2O2 formation ( 𝑟𝐻2𝑂2) was derived following a total site balance:
𝑟𝐻2𝑂2
[𝐿]=
𝑘5𝐾4𝐾3𝐾22𝐾1(𝐻2)(𝑂2)
1+𝐾3(𝑂2)+𝐾4𝐾3𝐾2𝐾112(𝐻2)
12(𝑂2)+
1
𝐾6(𝐻2𝑂2)
(3.2)
where [L] is the total number of surface sites (presumably Pds) and kx and Kx are the rate and
equilibrium constants for each elementary step x. When the MARI is O2**, equation (3.2)
simplifies to:
𝑟𝐻2𝑂2
[𝐿]= 𝑘5𝐾4𝐾2
2𝐾1(𝐻2) (3.3)
Similarly, if the MARI was OOH**, equation (3.2) would simplify to:
𝑟𝐻2𝑂2
[𝐿]= 𝑘5𝐾2𝐾1
1
2(𝐻2)1
2 (3.4)
Figure 3.5a shows a qualitative change in the dependence of 𝑟𝐻2𝑂2 on (H2) from about first-order
to approximately half-order (i.e., 𝑟𝐻2𝑂2~ (H2)0.5) for all three catalysts, suggesting a change in
the MARI from O2** to OOH**. The change in the MARI for Au12Pd1 happens at a higher (H2)
(150 kPa) than for Pd or Au1Pd1 (80 kPa). This indicates that the preference of Au12Pd1 to
stabilize O2** as the MARI, rather than OOH**, is greater than on the other clusters tested.
Experimental measurements of molecular and dissociative adsorption of O2 on Au(111) and Pd-
69
doped Au(111) surfaces together with DFT calculations show that O2 can only bind to Pd in
bimetallic AuPd systems and that the energy barrier for the dissociation of O2 on ensembles of
Pd atoms decreases from 107 to 62 kJ mol-1 as the sizes of the Pd ensembles increase from two
to six atoms.159 As such, the favorability of O2** on Au12Pd1 must stem from an electronic
interaction of the Au on the Pd. Equations (3.3) and (3.4) also suggest a weak dependence of the
H2O2 formation rate on (O2), which is reflected in Figure 3.6a. The increase in H2O2 formation
rates with (O2) on Au1Pd1 below 75 kPa O2 (Fig. 3.6a) could be consistent with a transition from
a ** MARI to an O2** MARI, yet this interpretation would require a similar change in the
dependence of H2O formation rates on (O2) at these conditions. If in fact, ** were the MARI at
the lowest (O2) values on Au1Pd1, the mechanistic interpretation would still be valid (Scheme
2.1).
Figure 3.5b shows that H2O turnover rates increase with an approximately half-order
dependence on (H2) until ~80 kPa H2, at which point H2O formation becomes independent of
(H2) for all three catalysts tested. As discussed previously, the mechanism for H2O formation on
Pd likely occurs by H-transfer to O* (Scheme 1, step 9) and OH* (Scheme 1, step 10) following
O-O bond cleavage in OOH** intermediates (Scheme 2.1, step 8)146, which is consistent with a
change in H2O formation rates from half to zero order with (H2) (Fig. 3.5b) and O-O bond
scission intrinsic energy barriers which are lower for OOH** than for O2** and H2O2** on
Pd(111) (Section B5).76,160 Applying the pseudo-steady state hypothesis to these elementary steps
as well as similar substitutions used for the derivation of equation 3.2 leads to the following
expression for the H2O formation rate ( 𝑟𝐻2𝑂):
𝑟𝐻2𝑂
[𝐿]=
𝑘8𝐾4𝐾3𝐾2𝐾112(𝐻2)
12(𝑂2)
1+𝐾3(𝑂2)+𝐾4𝐾3𝐾2𝐾112(𝐻2)
12(𝑂2)+
1
𝐾6(𝐻2𝑂2)
(3.5)

70
The details of this derivation and that for the rate expression for H2O2 formation (equation 3.2)
are shown in the Appendix (section B5). Sites that form H2O2 are assumed to also form H2O,
therefore the same MARI should be assumed for the same pressure conditions between Figures
3.5a and 3.5b (i.e., change from O2** to OOH**). In the limit of an O2** MARI, equation (3.5)
simplifies to:
𝑟𝐻2𝑂
[𝐿]= 𝑘8𝐾4𝐾2𝐾1
1
2(𝐻2)1
2 (3.6)
and for an OOH** saturated surface to:
𝑟𝐻2𝑂
[𝐿]= 𝑘8 (3.7)
The half order-dependence on (H2) in equation 3.6 and the zero-order dependence on (H2) in
equation 3.7, along with their mutual zero-order dependence on (O2), can be seen qualitatively
for all three catalysts in Figures 3.5b and 3.6b. The common H2O2 and H2O formation
dependencies on (H2) and (O2) on Pd, Au1Pd1, and Au12Pd1 (Figures 3.5 and 3.6) suggest that all
three catalysts produce H2O2 and H2O using the same set of elementary steps. To quantitatively
test this hypothesis, the rate expressions for H2O2 (equation 3.2) and H2O (equation 3.5)
formation were numerically fit to the formation rate data shown in Figures 3.5 and 3.6 (described
below).
Secondary conversion of H2O2 to H2O likely influences the measured formation rates of
H2O2 and H2O. Therefore, a rate expression for the hydrogenation of H2O2 ( 𝑟𝐻2𝑂2−𝐻; H2 + H2O2
→ 2H2O) was derived from the elementary steps in Scheme 2.1. By assuming that H2O2
hydrogenation occurs following the kinetically relevant scission of the O-O bond in H2O2**
(Scheme 2.1, step 12), the rate expression becomes:
𝑟𝐻2𝑂2−𝐻
[𝐿]=
𝑘12𝐾6(𝐻2𝑂2)
1+𝐾3(𝑂2)+𝐾4𝐾3𝐾2𝐾112(𝐻2)
12(𝑂2)+
1
𝐾6(𝐻2𝑂2)
(3.8)
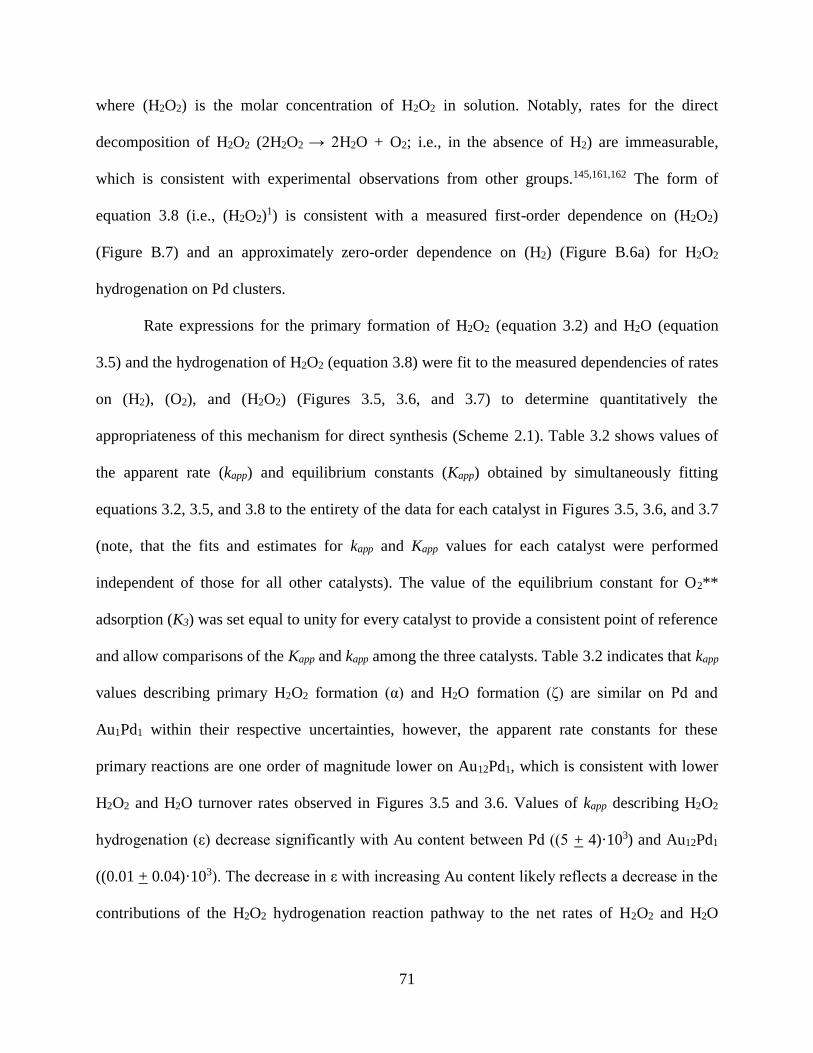
71
where (H2O2) is the molar concentration of H2O2 in solution. Notably, rates for the direct
decomposition of H2O2 (2H2O2 → 2H2O + O2; i.e., in the absence of H2) are immeasurable,
which is consistent with experimental observations from other groups.145,161,162 The form of
equation 3.8 (i.e., (H2O2)1) is consistent with a measured first-order dependence on (H2O2)
(Figure B.7) and an approximately zero-order dependence on (H2) (Figure B.6a) for H2O2
hydrogenation on Pd clusters.
Rate expressions for the primary formation of H2O2 (equation 3.2) and H2O (equation
3.5) and the hydrogenation of H2O2 (equation 3.8) were fit to the measured dependencies of rates
on (H2), (O2), and (H2O2) (Figures 3.5, 3.6, and 3.7) to determine quantitatively the
appropriateness of this mechanism for direct synthesis (Scheme 2.1). Table 3.2 shows values of
the apparent rate (kapp) and equilibrium constants (Kapp) obtained by simultaneously fitting
equations 3.2, 3.5, and 3.8 to the entirety of the data for each catalyst in Figures 3.5, 3.6, and 3.7
(note, that the fits and estimates for kapp and Kapp values for each catalyst were performed
independent of those for all other catalysts). The value of the equilibrium constant for O2**
adsorption (K3) was set equal to unity for every catalyst to provide a consistent point of reference
and allow comparisons of the Kapp and kapp among the three catalysts. Table 3.2 indicates that kapp
values describing primary H2O2 formation (α) and H2O formation (ζ) are similar on Pd and
Au1Pd1 within their respective uncertainties, however, the apparent rate constants for these
primary reactions are one order of magnitude lower on Au12Pd1, which is consistent with lower
H2O2 and H2O turnover rates observed in Figures 3.5 and 3.6. Values of kapp describing H2O2
hydrogenation (ε) decrease significantly with Au content between Pd ((5 + 4)·103) and Au12Pd1
((0.01 + 0.04)·103). The decrease in ε with increasing Au content likely reflects a decrease in the
contributions of the H2O2 hydrogenation reaction pathway to the net rates of H2O2 and H2O
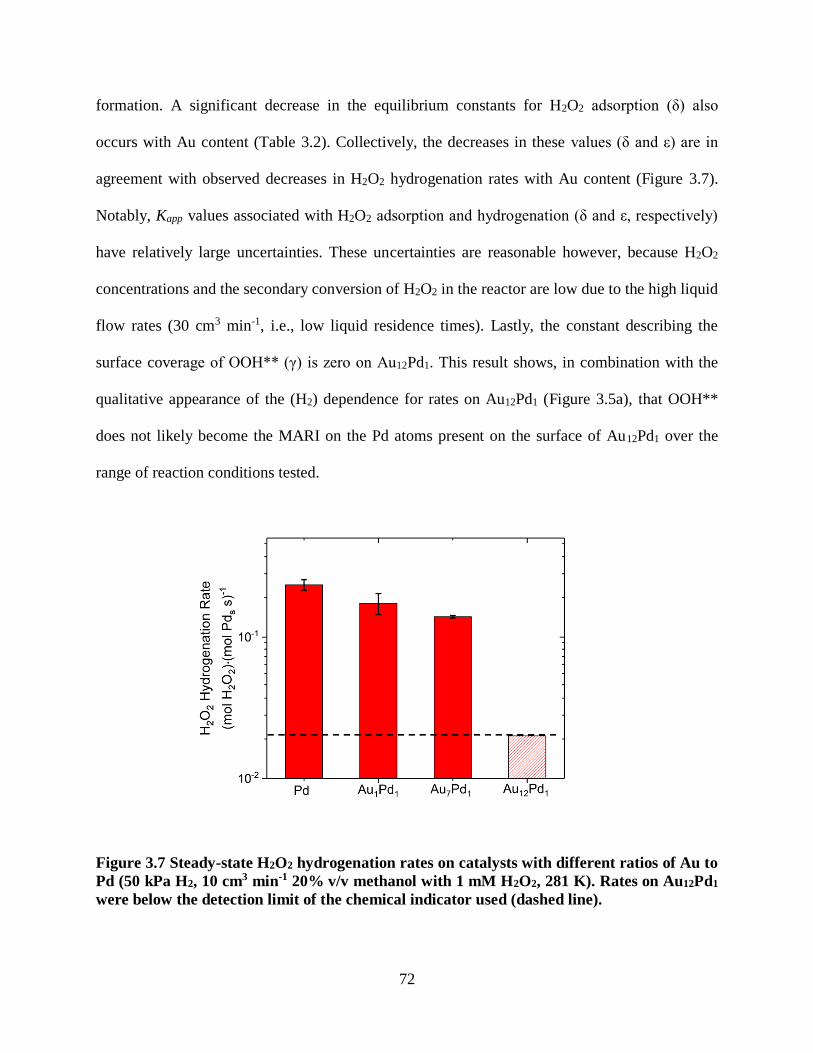
72
formation. A significant decrease in the equilibrium constants for H2O2 adsorption (δ) also
occurs with Au content (Table 3.2). Collectively, the decreases in these values (δ and ε) are in
agreement with observed decreases in H2O2 hydrogenation rates with Au content (Figure 3.7).
Notably, Kapp values associated with H2O2 adsorption and hydrogenation (δ and ε, respectively)
have relatively large uncertainties. These uncertainties are reasonable however, because H2O2
concentrations and the secondary conversion of H2O2 in the reactor are low due to the high liquid
flow rates (30 cm3 min-1, i.e., low liquid residence times). Lastly, the constant describing the
surface coverage of OOH** (γ) is zero on Au12Pd1. This result shows, in combination with the
qualitative appearance of the (H2) dependence for rates on Au12Pd1 (Figure 3.5a), that OOH**
does not likely become the MARI on the Pd atoms present on the surface of Au12Pd1 over the
range of reaction conditions tested.
Figure 3.7 Steady-state H2O2 hydrogenation rates on catalysts with different ratios of Au to
Pd (50 kPa H2, 10 cm3 min-1 20% v/v methanol with 1 mM H2O2, 281 K). Rates on Au12Pd1
were below the detection limit of the chemical indicator used (dashed line).
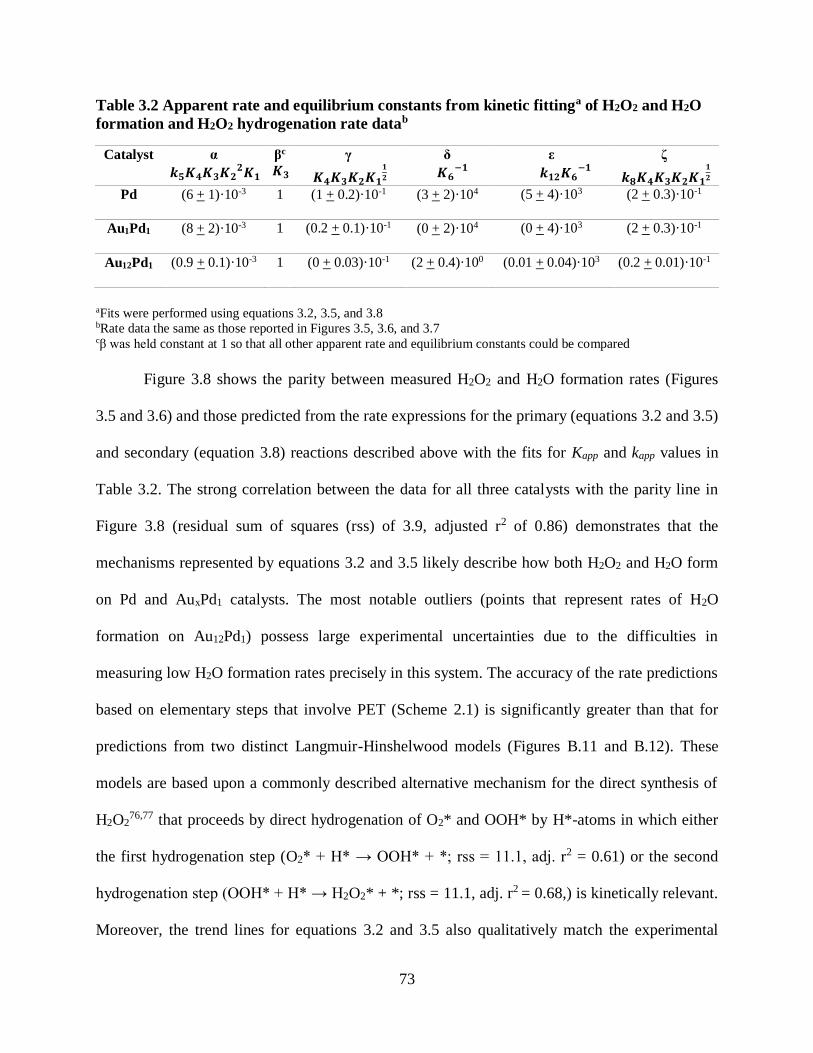
73
Table 3.2 Apparent rate and equilibrium constants from kinetic fittinga of H2O2 and H2O
formation and H2O2 hydrogenation rate datab
aFits were performed using equations 3.2, 3.5, and 3.8 bRate data the same as those reported in Figures 3.5, 3.6, and 3.7 cβ was held constant at 1 so that all other apparent rate and equilibrium constants could be compared
Figure 3.8 shows the parity between measured H2O2 and H2O formation rates (Figures
3.5 and 3.6) and those predicted from the rate expressions for the primary (equations 3.2 and 3.5)
and secondary (equation 3.8) reactions described above with the fits for Kapp and kapp values in
Table 3.2. The strong correlation between the data for all three catalysts with the parity line in
Figure 3.8 (residual sum of squares (rss) of 3.9, adjusted r2 of 0.86) demonstrates that the
mechanisms represented by equations 3.2 and 3.5 likely describe how both H2O2 and H2O form
on Pd and AuxPd1 catalysts. The most notable outliers (points that represent rates of H2O
formation on Au12Pd1) possess large experimental uncertainties due to the difficulties in
measuring low H2O formation rates precisely in this system. The accuracy of the rate predictions
based on elementary steps that involve PET (Scheme 2.1) is significantly greater than that for
predictions from two distinct Langmuir-Hinshelwood models (Figures B.11 and B.12). These
models are based upon a commonly described alternative mechanism for the direct synthesis of
H2O276,77 that proceeds by direct hydrogenation of O2* and OOH* by H*-atoms in which either
the first hydrogenation step (O2* + H* → OOH* + *; rss = 11.1, adj. r2 = 0.61) or the second
hydrogenation step (OOH* + H* → H2O2* + *; rss = 11.1, adj. r2 = 0.68,) is kinetically relevant.
Moreover, the trend lines for equations 3.2 and 3.5 also qualitatively match the experimental
Catalyst α
𝒌𝟓𝑲𝟒𝑲𝟑𝑲𝟐𝟐𝑲𝟏
βc
𝑲𝟑 γ
𝑲𝟒𝑲𝟑𝑲𝟐𝑲𝟏𝟏
𝟐
δ
𝑲𝟔−𝟏
ε
𝒌𝟏𝟐𝑲𝟔−𝟏
ζ
𝒌𝟖𝑲𝟒𝑲𝟑𝑲𝟐𝑲𝟏𝟏
𝟐
Pd (6 + 1)·10-3 1 (1 + 0.2)·10-1 (3 + 2)·104 (5 + 4)·103 (2 + 0.3)·10-1
Au1Pd1 (8 + 2)·10-3 1 (0.2 + 0.1)·10-1 (0 + 2)·104 (0 + 4)·103 (2 + 0.3)·10-1
Au12Pd1 (0.9 + 0.1)·10-3 1 (0 + 0.03)·10-1 (2 + 0.4)·100 (0.01 + 0.04)·103 (0.2 + 0.01)·10-1

74
measurements for all catalysts tested much better than those based on either Langmuirian model
(Figures B.8-B.10). Collectively, these comparisons strongly suggest the direct synthesis of H2O2
on both Pd and AuxPd1 catalysts proceeds by PET steps that reduce O2** and OOH** surface
species (Scheme 2.1) and not by a Langmuir-Hinshelwood type mechanism.
Figure 3.8 Parity plot of experimentally measured H2O2 (closed) and H2O (open) formation
rates Pd (■, □), Au1Pd1 (●, ○), and Au12Pd1 (blue ▲, ∆) compared with formation rates
predicted from simultaneously fitting measured formation rates to equations 3.2 and 3.5.
Formation rates measured as a dependence on (O2) were multiplied by a constant so that
they overlapped with the dependence on (H2) when at similar conditions. Dashed line
represents an ideal fit to the data. The data deviates from this line with a rss of 3.9 and an
adj. r2 of 0.86.
This conclusion was supported further by measuring H2O2 formation in both protic and
aprotic solvents on Pd and AuxPd1 catalysts. Figure 3.9 shows H2O2 formation rates measured on
Pd, Au1Pd1, and Au12Pd1 catalysts with 0.5 wt. % Pd loading within pure protic (methanol, 20%
methanol in water) and aprotic (acetonitrile) solvents to probe the need for protons in the
mechanism for H2O2 formation (Figure B.13 shows the concentration of H2O2 as a function of
time). Measured H2O2 formation rates are at least a factor of 230 times greater on Pd, 100 on
75
Au1Pd1, and 140 on Au12Pd1 in protic solvents (methanol and 20% methanol in water) than those
in the aprotic solvent (acetonitrile) based on the limit of detection for H2O2 (Figure 3.9). The true
difference in formation rates may be much greater, because H2O2 was not observed under any
conditions in acetonitrile. The trends in Figure 3.9 are a result of the protic/aprotic nature of the
solvents and do not reflect differences between the dielectric constants of the solvents because
the dielectric constant for acetonitrile (37.5) falls between those for methanol (32.6) and 20%
methanol in water (~78.5). These results agree with measurements showing that H2O2 formation
was undetectable in aprotic solvents (dimethyl sulfoxide, acetonitrile, propylene carbonate) on
Pd clusters (section 2.3.2). Water and methanol contain protonated species (e.g., H3O+ and
CH5O+) that shuttle H+, formed by heterolytic oxidation of H*, to O2** and OOH**.131 A protic
solvent is required for all Au to Pd ratios tested, which shows that the mechanism does not
change between the different AuxPd1 catalysts at these reaction conditions. The results of this
alloying Pd with Au does not change the mechanism by which H2O2 forms, which is most likely
a PET mechanism to adsorbed O2** and OOH** following the heterolytic dissociation of H2.
Therefore, the measured differences in selectivities and rates between the catalysts are not the
result of different reaction pathways. Next, formation and hydrogenation rates as well as
selectivities are examined in order to determine the effectiveness of different Au to Pd ratios for
the direct synthesis of H2O2.

76
Figure 3.9 H2O2 formation rates on Pd (black), Au1Pd1 (red), and Au12Pd1 (blue) in
different solvents in the semi-batch reactor (4.2 kPa H2, 4.2 kPa O2, 295 K, 60 cm3 solvent).
The dashed line represents the detection limit of the H2O2 indicator and the shaded bars
indicate that the H2O2 formation rate was below the detection limit.
3.3.2 Effects of Au to Pd ratio on Formation Rates of H2O2 and H2O, H2O2 Hydrogenation
Rates, and Selectivity
Figure 3.10 shows that H2O2 and H2O formation turnover rates as well as H2O2
selectivities depend strongly on the Au content of bimetallic AuxPd1 clusters of similar size (7-11
nm). Specifically, bimetallic Au12Pd1 catalysts give H2O2 and H2O formation rates (0.11 mol
H2O2 (mol Pds s)-1 and 0.08 mol H2O (mol Pds s)-1) that are lower than those on Pd catalysts
(0.40 mol H2O2 (mol Pds s)-1 and 1.4 mol H2O (mol Pds s)-1) by a factor of ~4 and ~18,
respectively. Pure Au clusters do not catalyze measurable H2O2 or H2O formation rates, which
indicates that Pd atoms are required for direct synthesis to occur at observable rates and are
likely the active sites for this reaction. H2O2 formation was undetectable by mass spectrometry
on Pd in the absence of a flowing solvent. Figure 3.10 shows that selectivities for H2O2 increase
from 23% on Pd to 60% on Au12Pd1 catalysts, because the decrease in H2O formation rates with
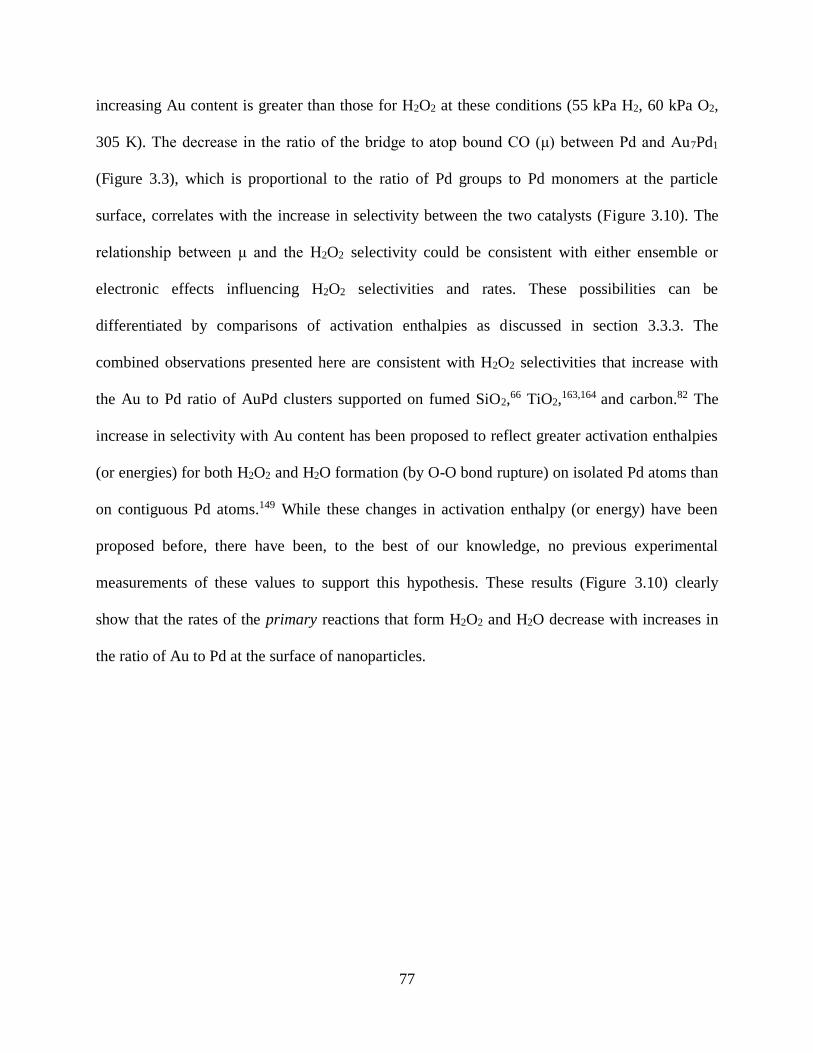
77
increasing Au content is greater than those for H2O2 at these conditions (55 kPa H2, 60 kPa O2,
305 K). The decrease in the ratio of the bridge to atop bound CO (μ) between Pd and Au7Pd1
(Figure 3.3), which is proportional to the ratio of Pd groups to Pd monomers at the particle
surface, correlates with the increase in selectivity between the two catalysts (Figure 3.10). The
relationship between μ and the H2O2 selectivity could be consistent with either ensemble or
electronic effects influencing H2O2 selectivities and rates. These possibilities can be
differentiated by comparisons of activation enthalpies as discussed in section 3.3.3. The
combined observations presented here are consistent with H2O2 selectivities that increase with
the Au to Pd ratio of AuPd clusters supported on fumed SiO2,66 TiO2,
163,164 and carbon.82 The
increase in selectivity with Au content has been proposed to reflect greater activation enthalpies
(or energies) for both H2O2 and H2O formation (by O-O bond rupture) on isolated Pd atoms than
on contiguous Pd atoms.149 While these changes in activation enthalpy (or energy) have been
proposed before, there have been, to the best of our knowledge, no previous experimental
measurements of these values to support this hypothesis. These results (Figure 3.10) clearly
show that the rates of the primary reactions that form H2O2 and H2O decrease with increases in
the ratio of Au to Pd at the surface of nanoparticles.
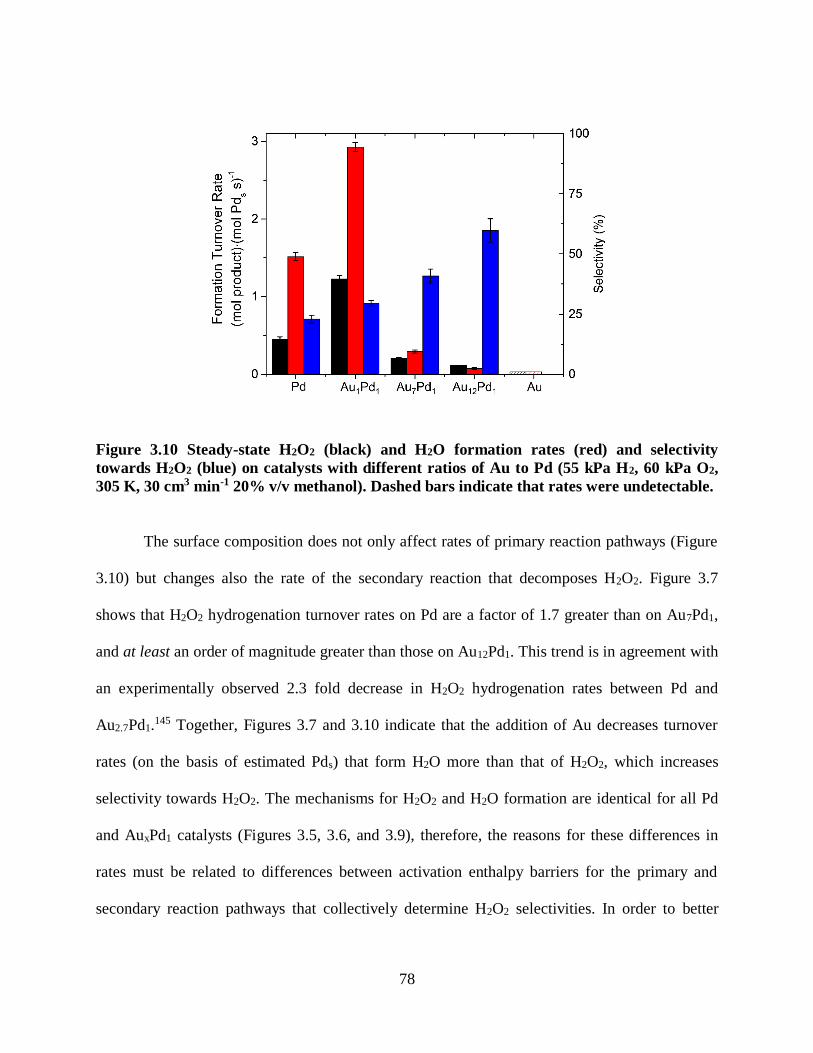
78
Figure 3.10 Steady-state H2O2 (black) and H2O formation rates (red) and selectivity
towards H2O2 (blue) on catalysts with different ratios of Au to Pd (55 kPa H2, 60 kPa O2,
305 K, 30 cm3 min-1 20% v/v methanol). Dashed bars indicate that rates were undetectable.
The surface composition does not only affect rates of primary reaction pathways (Figure
3.10) but changes also the rate of the secondary reaction that decomposes H2O2. Figure 3.7
shows that H2O2 hydrogenation turnover rates on Pd are a factor of 1.7 greater than on Au7Pd1,
and at least an order of magnitude greater than those on Au12Pd1. This trend is in agreement with
an experimentally observed 2.3 fold decrease in H2O2 hydrogenation rates between Pd and
Au2.7Pd1.145 Together, Figures 3.7 and 3.10 indicate that the addition of Au decreases turnover
rates (on the basis of estimated Pds) that form H2O more than that of H2O2, which increases
selectivity towards H2O2. The mechanisms for H2O2 and H2O formation are identical for all Pd
and AuxPd1 catalysts (Figures 3.5, 3.6, and 3.9), therefore, the reasons for these differences in
rates must be related to differences between activation enthalpy barriers for the primary and
secondary reaction pathways that collectively determine H2O2 selectivities. In order to better
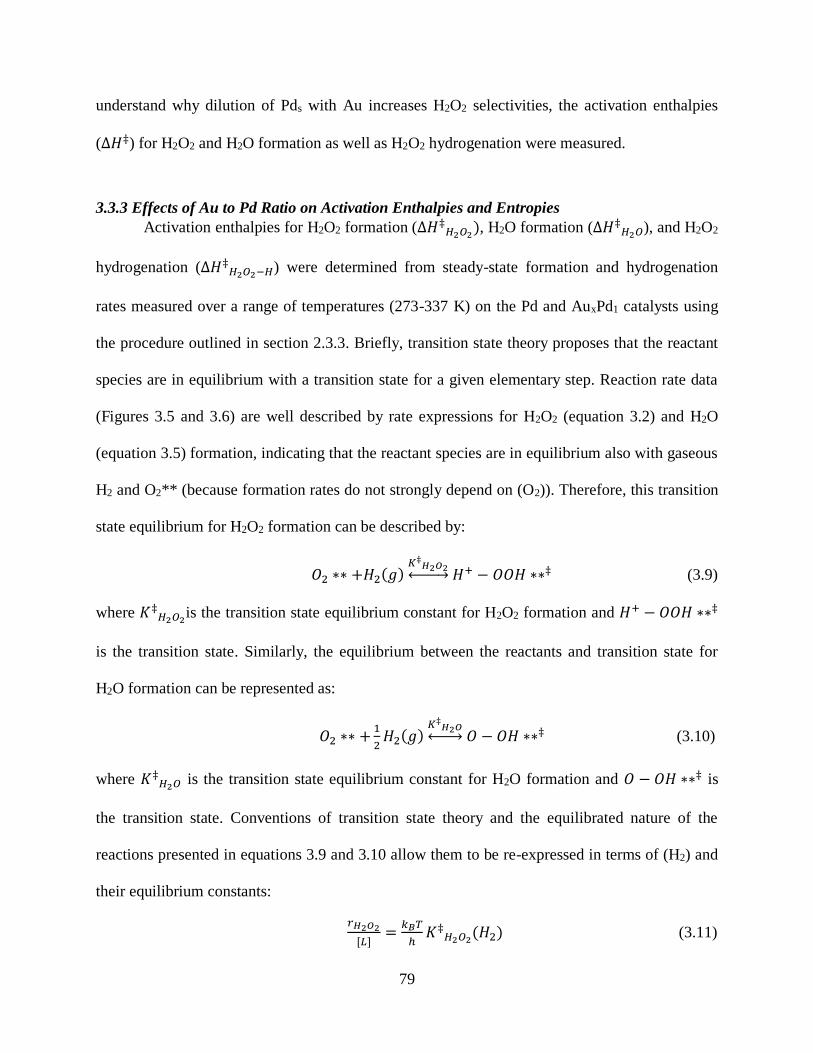
79
understand why dilution of Pds with Au increases H2O2 selectivities, the activation enthalpies
(∆𝐻‡) for H2O2 and H2O formation as well as H2O2 hydrogenation were measured.
3.3.3 Effects of Au to Pd Ratio on Activation Enthalpies and Entropies
Activation enthalpies for H2O2 formation (∆𝐻‡𝐻2𝑂2), H2O formation (∆𝐻‡𝐻2𝑂), and H2O2
hydrogenation (∆𝐻‡𝐻2𝑂2−𝐻) were determined from steady-state formation and hydrogenation
rates measured over a range of temperatures (273-337 K) on the Pd and AuxPd1 catalysts using
the procedure outlined in section 2.3.3. Briefly, transition state theory proposes that the reactant
species are in equilibrium with a transition state for a given elementary step. Reaction rate data
(Figures 3.5 and 3.6) are well described by rate expressions for H2O2 (equation 3.2) and H2O
(equation 3.5) formation, indicating that the reactant species are in equilibrium also with gaseous
H2 and O2** (because formation rates do not strongly depend on (O2)). Therefore, this transition
state equilibrium for H2O2 formation can be described by:
𝑂2 ∗∗ +𝐻2(𝑔)𝐾‡𝐻2𝑂2↔ 𝐻+ − 𝑂𝑂𝐻 ∗∗‡ (3.9)
where 𝐾‡𝐻2𝑂2is the transition state equilibrium constant for H2O2 formation and 𝐻+ − 𝑂𝑂𝐻 ∗∗‡
is the transition state. Similarly, the equilibrium between the reactants and transition state for
H2O formation can be represented as:
𝑂2 ∗∗ +1
2𝐻2(𝑔)
𝐾‡𝐻2𝑂↔ 𝑂 − 𝑂𝐻 ∗∗‡ (3.10)
where 𝐾‡𝐻2𝑂 is the transition state equilibrium constant for H2O formation and 𝑂 − 𝑂𝐻 ∗∗‡ is
the transition state. Conventions of transition state theory and the equilibrated nature of the
reactions presented in equations 3.9 and 3.10 allow them to be re-expressed in terms of (H2) and
their equilibrium constants:
𝑟𝐻2𝑂2
[𝐿]=𝑘𝐵𝑇
ℎ𝐾‡𝐻2𝑂2(𝐻2) (3.11)
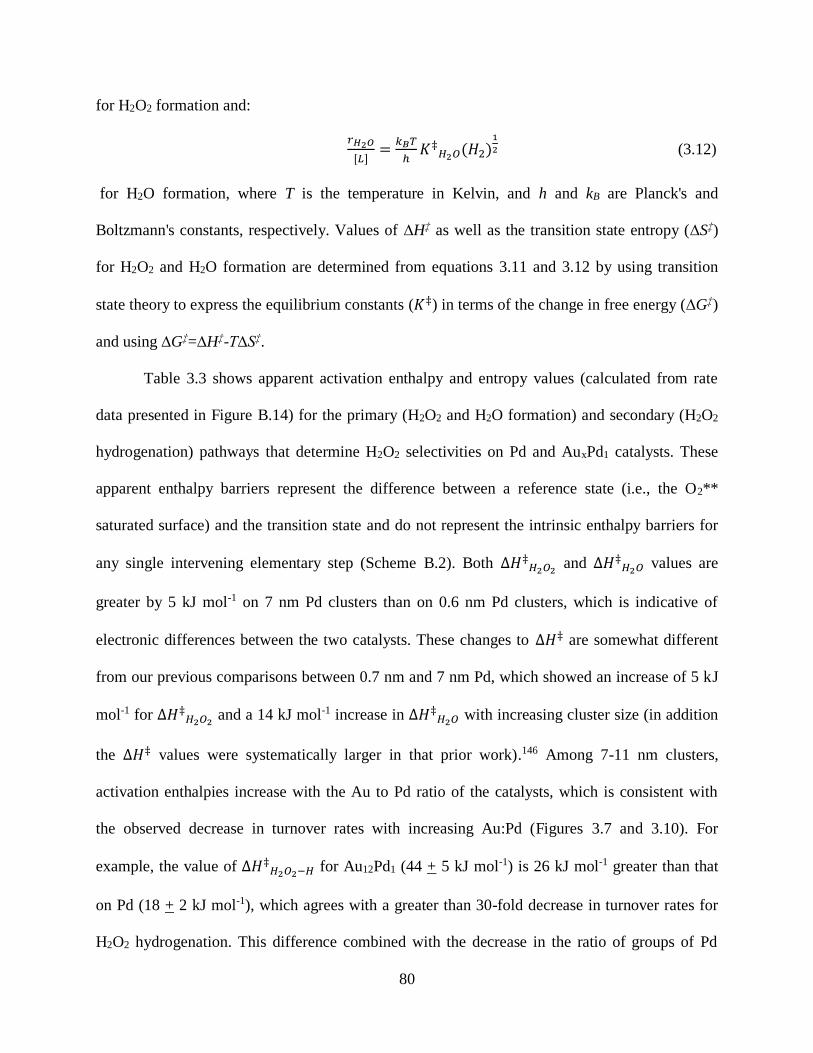
80
for H2O2 formation and:
𝑟𝐻2𝑂
[𝐿]=𝑘𝐵𝑇
ℎ𝐾‡𝐻2𝑂(𝐻2)
1
2 (3.12)
for H2O formation, where T is the temperature in Kelvin, and h and kB are Planck's and
Boltzmann's constants, respectively. Values of ∆H‡ as well as the transition state entropy (∆S‡)
for H2O2 and H2O formation are determined from equations 3.11 and 3.12 by using transition
state theory to express the equilibrium constants (𝐾‡) in terms of the change in free energy (∆G‡)
and using ∆G‡=∆H‡-T∆S‡.
Table 3.3 shows apparent activation enthalpy and entropy values (calculated from rate
data presented in Figure B.14) for the primary (H2O2 and H2O formation) and secondary (H2O2
hydrogenation) pathways that determine H2O2 selectivities on Pd and AuxPd1 catalysts. These
apparent enthalpy barriers represent the difference between a reference state (i.e., the O2**
saturated surface) and the transition state and do not represent the intrinsic enthalpy barriers for
any single intervening elementary step (Scheme B.2). Both ∆𝐻‡𝐻2𝑂2 and ∆𝐻‡𝐻2𝑂 values are
greater by 5 kJ mol-1 on 7 nm Pd clusters than on 0.6 nm Pd clusters, which is indicative of
electronic differences between the two catalysts. These changes to ∆𝐻‡ are somewhat different
from our previous comparisons between 0.7 nm and 7 nm Pd, which showed an increase of 5 kJ
mol-1 for ∆𝐻‡𝐻2𝑂2 and a 14 kJ mol-1 increase in ∆𝐻‡𝐻2𝑂 with increasing cluster size (in addition
the ∆𝐻‡ values were systematically larger in that prior work).146 Among 7-11 nm clusters,
activation enthalpies increase with the Au to Pd ratio of the catalysts, which is consistent with
the observed decrease in turnover rates with increasing Au:Pd (Figures 3.7 and 3.10). For
example, the value of ∆𝐻‡𝐻2𝑂2−𝐻 for Au12Pd1 (44 + 5 kJ mol-1) is 26 kJ mol-1 greater than that
on Pd (18 + 2 kJ mol-1), which agrees with a greater than 30-fold decrease in turnover rates for
H2O2 hydrogenation. This difference combined with the decrease in the ratio of groups of Pd
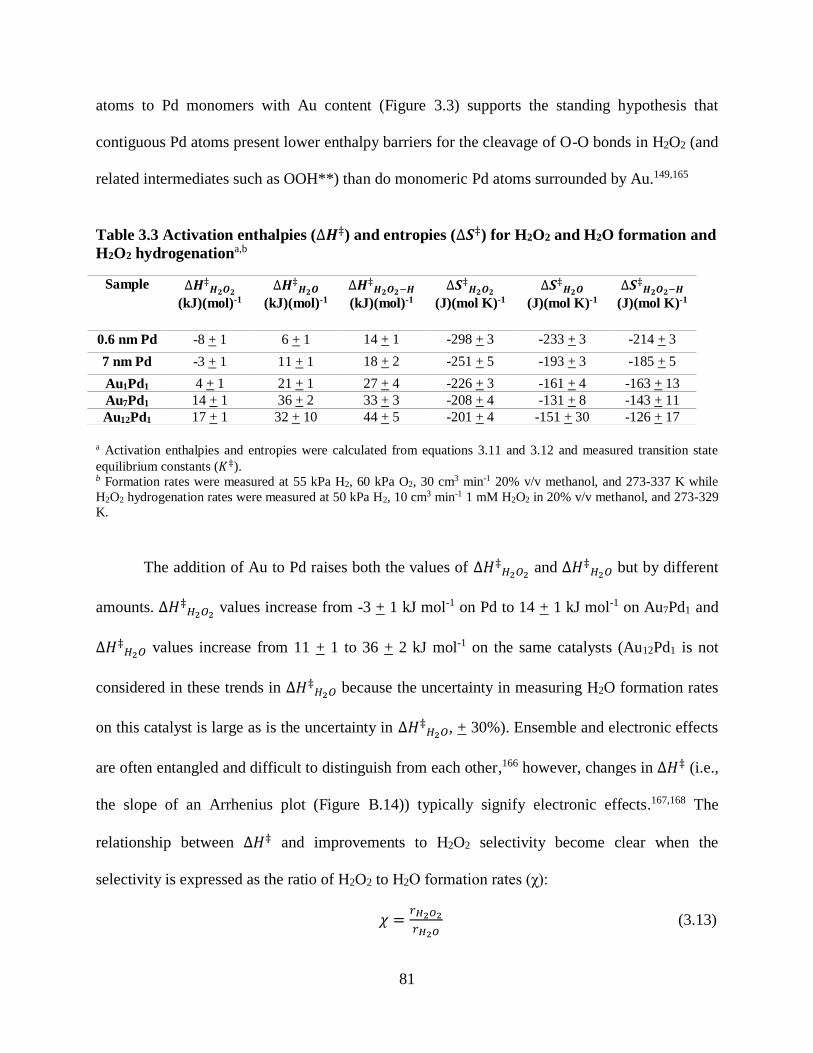
81
atoms to Pd monomers with Au content (Figure 3.3) supports the standing hypothesis that
contiguous Pd atoms present lower enthalpy barriers for the cleavage of O-O bonds in H2O2 (and
related intermediates such as OOH**) than do monomeric Pd atoms surrounded by Au.149,165
Table 3.3 Activation enthalpies (∆𝑯‡) and entropies (∆𝑺‡) for H2O2 and H2O formation and
H2O2 hydrogenationa,b
a Activation enthalpies and entropies were calculated from equations 3.11 and 3.12 and measured transition state
equilibrium constants (𝐾‡). b Formation rates were measured at 55 kPa H2, 60 kPa O2, 30 cm3 min-1 20% v/v methanol, and 273-337 K while
H2O2 hydrogenation rates were measured at 50 kPa H2, 10 cm3 min-1 1 mM H2O2 in 20% v/v methanol, and 273-329
K.
The addition of Au to Pd raises both the values of ∆𝐻‡𝐻2𝑂2 and ∆𝐻‡𝐻2𝑂 but by different
amounts. ∆𝐻‡𝐻2𝑂2 values increase from -3 + 1 kJ mol-1 on Pd to 14 + 1 kJ mol-1 on Au7Pd1 and
∆𝐻‡𝐻2𝑂 values increase from 11 + 1 to 36 + 2 kJ mol-1 on the same catalysts (Au12Pd1 is not
considered in these trends in ∆𝐻‡𝐻2𝑂 because the uncertainty in measuring H2O formation rates
on this catalyst is large as is the uncertainty in ∆𝐻‡𝐻2𝑂, + 30%). Ensemble and electronic effects
are often entangled and difficult to distinguish from each other,166 however, changes in ∆𝐻‡ (i.e.,
the slope of an Arrhenius plot (Figure B.14)) typically signify electronic effects.167,168 The
relationship between ∆𝐻‡ and improvements to H2O2 selectivity become clear when the
selectivity is expressed as the ratio of H2O2 to H2O formation rates (χ):
𝜒 =𝑟𝐻2𝑂2
𝑟𝐻2𝑂 (3.13)
Sample ∆𝑯‡𝑯𝟐𝑶𝟐
(kJ)(mol)-1
∆𝑯‡𝑯𝟐𝑶
(kJ)(mol)-1
∆𝑯‡𝑯𝟐𝑶𝟐−𝑯
(kJ)(mol)-1
∆𝑺‡𝑯𝟐𝑶𝟐
(J)(mol K)-1
∆𝑺‡𝑯𝟐𝑶
(J)(mol K)-1
∆𝑺‡𝑯𝟐𝑶𝟐−𝑯
(J)(mol K)-1
0.6 nm Pd -8 + 1 6 + 1 14 + 1 -298 + 3 -233 + 3 -214 + 3
7 nm Pd -3 + 1 11 + 1 18 + 2 -251 + 5 -193 + 3 -185 + 5
Au1Pd1 4 + 1 21 + 1 27 + 4 -226 + 3 -161 + 4 -163 + 13
Au7Pd1 14 + 1 36 + 2 33 + 3 -208 + 4 -131 + 8 -143 + 11
Au12Pd1 17 + 1 32 + 10 44 + 5 -201 + 4 -151 + 30 -126 + 17
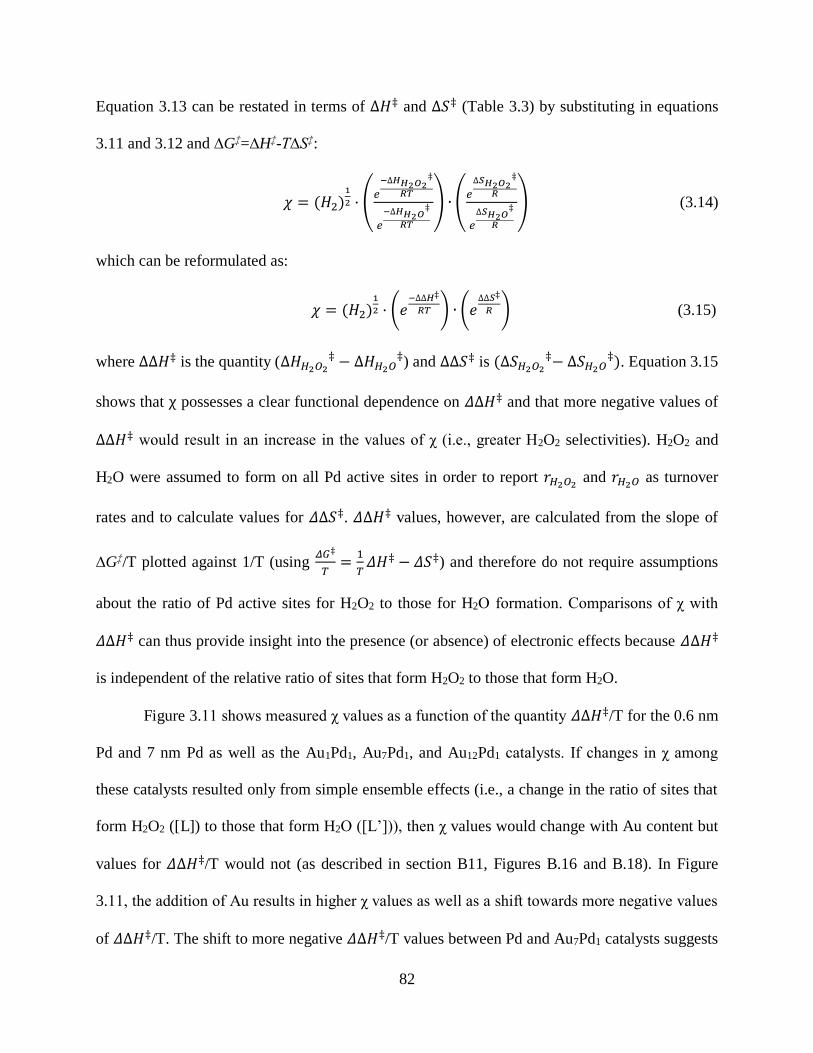
82
Equation 3.13 can be restated in terms of ∆𝐻‡ and ∆𝑆‡ (Table 3.3) by substituting in equations
3.11 and 3.12 and ∆G‡=∆H‡-T∆S‡:
𝜒 = (𝐻2)1
2 · (𝑒
−∆𝐻𝐻2𝑂2‡
𝑅𝑇
𝑒
−∆𝐻𝐻2𝑂‡
𝑅𝑇
) ∙ (𝑒
∆𝑆𝐻2𝑂2‡
𝑅
𝑒
∆𝑆𝐻2𝑂‡
𝑅
) (3.14)
which can be reformulated as:
𝜒 = (𝐻2)1
2 · (𝑒−∆∆𝐻‡
𝑅𝑇 ) ∙ (𝑒∆∆𝑆‡
𝑅 ) (3.15)
where ∆∆𝐻‡ is the quantity (∆𝐻𝐻2𝑂2‡ − ∆𝐻𝐻2𝑂
‡) and ∆∆𝑆‡ is (∆𝑆𝐻2𝑂2‡− ∆𝑆𝐻2𝑂
‡). Equation 3.15
shows that χ possesses a clear functional dependence on 𝛥∆𝐻‡ and that more negative values of
∆∆𝐻‡ would result in an increase in the values of χ (i.e., greater H2O2 selectivities). H2O2 and
H2O were assumed to form on all Pd active sites in order to report 𝑟𝐻2𝑂2 and 𝑟𝐻2𝑂 as turnover
rates and to calculate values for 𝛥∆𝑆‡. 𝛥∆𝐻‡ values, however, are calculated from the slope of
∆G‡/T plotted against 1/T (using 𝛥𝐺‡
𝑇=1
𝑇𝛥𝐻‡ − 𝛥𝑆‡) and therefore do not require assumptions
about the ratio of Pd active sites for H2O2 to those for H2O formation. Comparisons of χ with
𝛥∆𝐻‡ can thus provide insight into the presence (or absence) of electronic effects because 𝛥∆𝐻‡
is independent of the relative ratio of sites that form H2O2 to those that form H2O.
Figure 3.11 shows measured χ values as a function of the quantity 𝛥∆𝐻‡/T for the 0.6 nm
Pd and 7 nm Pd as well as the Au1Pd1, Au7Pd1, and Au12Pd1 catalysts. If changes in χ among
these catalysts resulted only from simple ensemble effects (i.e., a change in the ratio of sites that
form H2O2 ([L]) to those that form H2O ([L’])), then χ values would change with Au content but
values for 𝛥∆𝐻‡/T would not (as described in section B11, Figures B.16 and B.18). In Figure
3.11, the addition of Au results in higher χ values as well as a shift towards more negative values
of 𝛥∆𝐻‡/T. The shift to more negative 𝛥∆𝐻‡/T values between Pd and Au7Pd1 catalysts suggests
83
that there are changes to χ which do not reflect changes in the ratio of distinct types of sites
([L]/[L’]; i.e., electronic effects are the dominate cause for the increase in H2O2 selectivities).
Unfortunately, the large uncertainties in 𝛥∆𝐻‡/T values for Au12Pd1 prevent the use of this
approach to probe the relative contributions of electronic and ensemble effects to the increase in
χ values for this specific catalyst (Figure 3.11). Similarities between Figure 3.11 and Figures
B.15 and B.17 (i.e., sample calculations of the electronic only case) further implicate the
presence of electronic effects as Au is added to Pd. Therefore, the addition of Au to Pd clusters
leads to different groupings of surface Pd atoms that present more negative values of 𝛥∆𝐻‡ and
in turn increase H2O2 selectivity. This conclusion is consistent with DFT calculations which have
shown the dissociation energy of O-O bonds in O2** decrease with the size of Pd ensembles on
AuPd surfaces149,165 and with experiments using X-ray photoelectron spectroscopy (XPS) which
demonstrated shifts in the Pd binding energy upon alloying with Au.169-171 These findings
provide further evidence that Au can alter the electronic structure of Pd and that these differences
result in significant improvement in H2O2 selectivity between Pd and AuxPd1 catalysts.
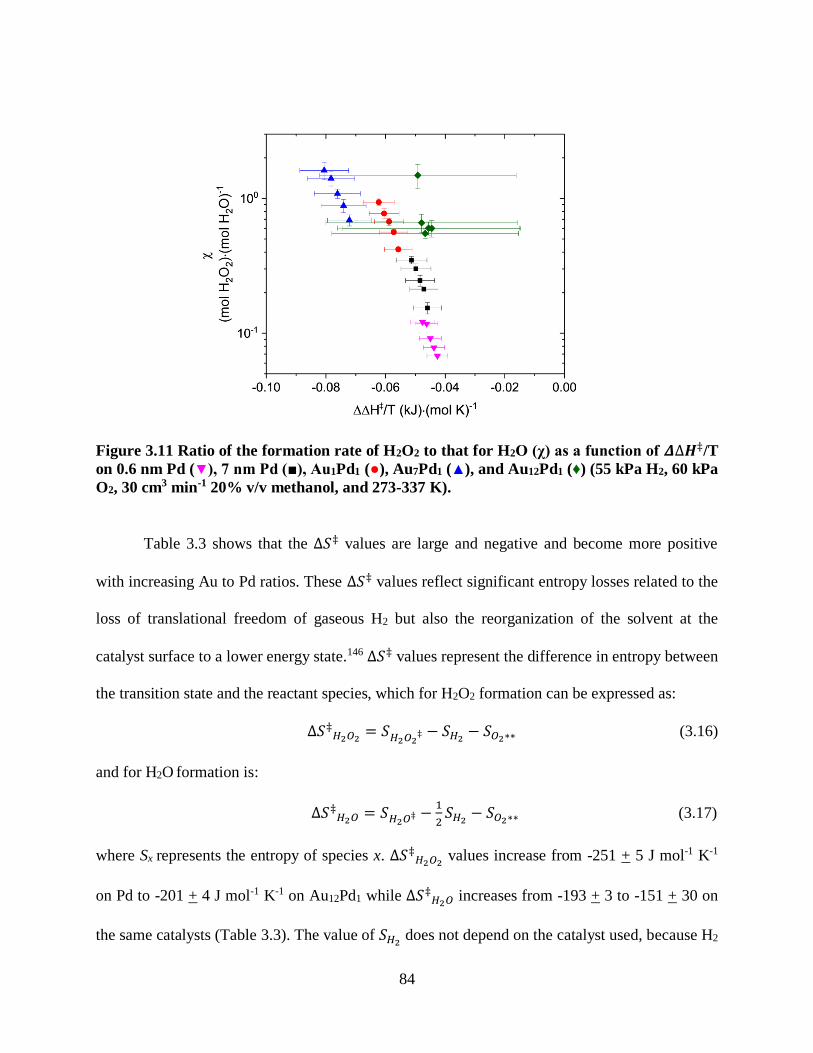
84
Figure 3.11 Ratio of the formation rate of H2O2 to that for H2O (χ) as a function of 𝜟∆𝑯‡/T
on 0.6 nm Pd (▼), 7 nm Pd (■), Au1Pd1 (●), Au7Pd1 (▲), and Au12Pd1 (♦) (55 kPa H2, 60 kPa
O2, 30 cm3 min-1 20% v/v methanol, and 273-337 K).
Table 3.3 shows that the ∆𝑆‡ values are large and negative and become more positive
with increasing Au to Pd ratios. These ∆𝑆‡ values reflect significant entropy losses related to the
loss of translational freedom of gaseous H2 but also the reorganization of the solvent at the
catalyst surface to a lower energy state.146 ∆𝑆‡ values represent the difference in entropy between
the transition state and the reactant species, which for H2O2 formation can be expressed as:
∆𝑆‡𝐻2𝑂2 = 𝑆𝐻2𝑂2‡ − 𝑆𝐻2 − 𝑆𝑂2∗∗ (3.16)
and for H2O formation is:
∆𝑆‡𝐻2𝑂 = 𝑆𝐻2𝑂‡ −1
2𝑆𝐻2 − 𝑆𝑂2∗∗ (3.17)
where Sx represents the entropy of species x. ∆𝑆‡𝐻2𝑂2 values increase from -251 + 5 J mol-1 K-1
on Pd to -201 + 4 J mol-1 K-1 on Au12Pd1 while ∆𝑆‡𝐻2𝑂 increases from -193 + 3 to -151 + 30 on
the same catalysts (Table 3.3). The value of 𝑆𝐻2 does not depend on the catalyst used, because H2
85
is a gas-phase species. Thus the increase in ∆𝑆‡𝐻2𝑂2 and ∆𝑆‡𝐻2𝑂 values must stem from both
𝑆𝐻2𝑂2‡ and 𝑆𝐻2𝑂‡ becoming larger relative to 𝑆𝑂2∗∗ as the Au to Pd ratio of the catalyst surface
increases. This would suggest a greater gain in translational mobility of the transition state over
that of O2** with increasing Au content due to a weakening of the Pd-adsorbate bond.
These combined data show that high H2O2 selectivities measured over AuxPd1 clusters
result predominantly from electronic changes to Pd active sites that are caused by interactions of
Pd atoms that form the active sites with Au (i.e., ∆∆𝐻‡ increases with Au content). Changes in
the grouping of Pd atoms at the surface of the AuxPd1 clusters (from the addition of Au) increase
∆𝐻‡ values for H2O2 and H2O formation (Table 3.3), which are strong indications of changes to
the electronic structure of the active sites. These electronic modifications appear to be mainly
responsible for the increase in selectivity as shown by greater similarities between trends in
Figure 3.11 and those in Figures B.15 and B.17 (differences between catalysts resulting only
from electronic changes) in comparison to Figures B.16 and B.18 (differences in catalysts
resulting only from changes in ratios of ensembles). Electronic effects dominate for these
materials (Pd to Au7Pd1) likely because they expose predominantly Pd covered surfaces, and
therefore, insignificant fractions of monomeric Pd species. However, other nanoparticle catalysts
such as those where surfaces possess significant fractions of monomeric Pd (e.g., higher Au:Pd
ratios or dispersions than those tested here) could result in a more significant contribution from
ensemble effects similar to those described for the electrocatalytic formation of H2O2 on ordered
Hg containing Pt, Pd, and Ag compounds.36,37
3.4 Conclusions
Rates of H2O2 and H2O formation, as well as H2O2 hydrogenation, were measured as a
function of H2 and O2 pressure and temperature on Pd and AuxPd1 clusters with comparable
86
diameters. H2O2 and H2O formation rates depend similarly on reactant pressures for all AuxPd1
and Pd clusters, and H2O2 forms only in the presence of protic solvents on all catalysts.
Analytical rate expressions for H2O2 and H2O formation derived from a series of elementary
steps that involve proton-electron transfer to O2** and OOH** intermediates more accurately
capture the dependence of product formation rates on H2 and O2 pressure than do rate
expressions that assume O2** and OOH** hydrogenate by homolytic surface reactions with H*
atoms. Together, these observations suggest that H2O2 forms by kinetically relevant proton-
electron transfer to a surface hydroperoxide intermediate on all Pd and AuxPd1 catalysts tested
(Au1Pd1, Au7Pd1, Au12Pd1). Although the mechanisms that form H2O2 or H2O remain identical
among this series of catalysts, the H2O2 selectivity increases with increases in the bulk Au to Pd
ratio of the catalysts. Activation enthalpies (∆𝐻‡) for the formation of H2O2 and H2O, and also
that for the hydrogenation of H2O2, increase significantly (> 19 kJ mol-1) with the Au content of
the bimetallic catalysts and show that electronic changes to the active sites are responsible for the
changes in turnover rates. However, the values of ∆𝐻‡ for H2O formation increase by a larger
amount than those for the other reaction pathways (e.g., ∆∆𝐻‡ between H2O2 and H2O formation
increased between Pd and Au7Pd1 by 8 kJ mol-1). Differences in ∆∆𝐻‡ values among Pd and
AuxPd1 catalysts suggest that electronic effects are primarily responsible for increased H2O2
selectivities on AuxPd1 catalysts, and comparisons of χ to ∆∆𝐻‡/T lack trends that clearly show
consequential contributions of ensemble effects to the selectivity. These combined results
implicate electronic modification of the Pd by the Au as the predominant cause of the greater
H2O2 selectivities on AuxPd1 clusters compared to Pd clusters.
87
CHAPTER 4
DIRECT SYNTHESIS OF H2O2 ON AgPt OCTAHEDRA: THE IMPORTANCE OF
Ag-Pt INTERACTIONS FOR HIGH H2O2 SELECTIVITY
4.1 Introduction
Hydrogen peroxide (H2O2) is an environmentally benign reactant with the potential to
replace common chlorinated industrial oxidants (e.g., Cl2, NaClO)11,12 in many processes,
however, such oxidizers typically cost less than H2O2 and are a fixture within the chemical
industry.4 The conventional method for producing H2O2 (i.e., the Riedl-Pfleiderer (RP) process)
utilizes the auto-oxidation of anthraquinones and requires multiple energy-intensive separation
and concentration steps, which are costly to build and operate.25,31 These steps may be avoided
by the direct synthesis of H2O2 (i.e., the immediate reaction of H2 and O2 on metal
nanoparticles), however, Pd nanoparticles46,57,87,172 obtain H2O2 selectivities competitive with the
RP process only in the presence of caustic acids and halides.63,84,86,173 Pd alloyed or promoted
with other metals such as Au82 or Sn (as well as Ni, Zn, Ga, In, or Co)72 are reported to give high
H2O2 selectivities (> 95%) following specific pretreatment procedures. The increase in the
selectivities of AuPd catalysts result primarily from changes in the electronic structure of the Pd
active sites by the addition of Au, consistent with differences in the apparent activation
enthalpies (∆𝐻‡) for both H2O2 and H2O formation between Pd and AuxPd1 clusters.174 These
differences may be induced by charge transfer between Pd and Au, or intra-atomic orbital
hybridization that influence the d-band structure of metallic Pd atoms.175 Alternatively, the
presence of Au may maintain Pd in a metallic state during the reaction, whereas monometallic Pd
nanoparticles potentially form palladium hydride (PdH) in the high H2 pressures used for direct
synthesis.70 Sn and other heteroatoms may also suppress the formation of PdH.176,177
Consequently, H2O2 selectivities that are greater on Pd-based bimetallics than on pure Pd
88
nanoparticles either reflect differences between the electronic structure of Pd active sites in the
metallic phase of the catalysts or simply differences in the chemical state of Pd during catalysis
(i.e., Pd vs. PdH). To determine the potential effects of these possibilities, rates and selectivities
for H2O2 formation must be measured on, and compared between, a complementary pair of
monometallic and bimetallic catalysts in which the monometallic components do not form
hydrides and in which the coordination of the active metal atoms can be manipulated by simple
and reversible procedures.
Here, we compare steady-state H2O2 formation rates and selectivities on Pt nanoparticles
and AgPt octahedra, neither of which form metal hydrides at the conditions for direct synthesis
(55 kPa H2, 60 kPa O2, 275-305 K)178,179 and which are one of few systems appropriate for
deconvoluting electronic effects from bulk-like phase transitions. The AgPt octahedra expose
surfaces where the coverage and location of Pt atoms can be controlled by gentle annealing in
CO or inert gases. Changes in vibrational frequency of chemisorbed CO and previously reported
high-resolution transmission electron microscopy180 show these AgPt octahedra form a uniform
distribution of Pt and Ag across the surface when exposed to CO at 373 K, but Pt atoms relocate
to the edges of the octahedra and move into the bulk when annealed in Ar or He at 373 K. Shifts
in the singleton frequency of adsorbed 13CO are compared to changes in the activation enthalpies
(∆𝐻‡) for the formation of H2O2 and H2O to probe the link between electronic properties of
exposed Pt atoms and catalytic reactivity for the reduction of O2.
4.2 Materials and Methods
4.2.1 Catalyst Synthesis
Silica supported AgPt octahedra (0.12 wt. % Ag, 0.2 wt. % Pt) were synthesized with a
1:1 molar ratio of Ag to Pt using a hydrothermal method181 and treated in flowing Ar (AgPtAr) or
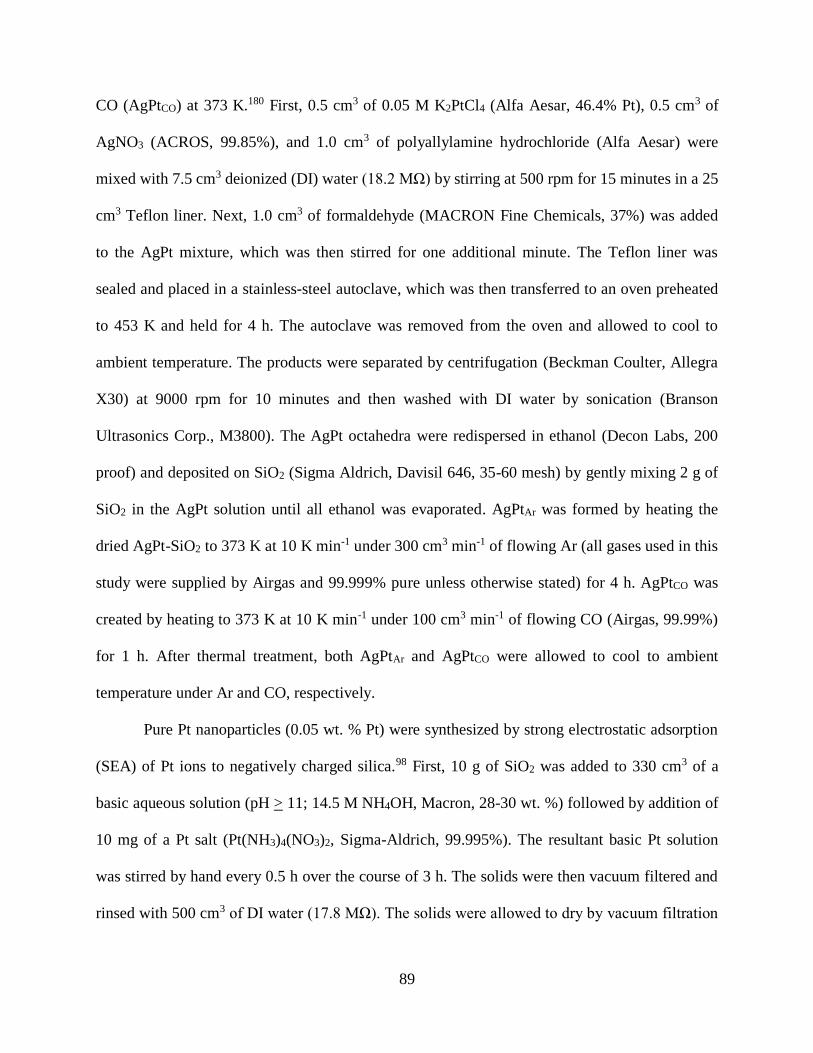
89
CO (AgPtCO) at 373 K.180 First, 0.5 cm3 of 0.05 M K2PtCl4 (Alfa Aesar, 46.4% Pt), 0.5 cm3 of
AgNO3 (ACROS, 99.85%), and 1.0 cm3 of polyallylamine hydrochloride (Alfa Aesar) were
mixed with 7.5 cm3 deionized (DI) water (18.2 MΩ) by stirring at 500 rpm for 15 minutes in a 25
cm3 Teflon liner. Next, 1.0 cm3 of formaldehyde (MACRON Fine Chemicals, 37%) was added
to the AgPt mixture, which was then stirred for one additional minute. The Teflon liner was
sealed and placed in a stainless-steel autoclave, which was then transferred to an oven preheated
to 453 K and held for 4 h. The autoclave was removed from the oven and allowed to cool to
ambient temperature. The products were separated by centrifugation (Beckman Coulter, Allegra
X30) at 9000 rpm for 10 minutes and then washed with DI water by sonication (Branson
Ultrasonics Corp., M3800). The AgPt octahedra were redispersed in ethanol (Decon Labs, 200
proof) and deposited on SiO2 (Sigma Aldrich, Davisil 646, 35-60 mesh) by gently mixing 2 g of
SiO2 in the AgPt solution until all ethanol was evaporated. AgPtAr was formed by heating the
dried AgPt-SiO2 to 373 K at 10 K min-1 under 300 cm3 min-1 of flowing Ar (all gases used in this
study were supplied by Airgas and 99.999% pure unless otherwise stated) for 4 h. AgPtCO was
created by heating to 373 K at 10 K min-1 under 100 cm3 min-1 of flowing CO (Airgas, 99.99%)
for 1 h. After thermal treatment, both AgPtAr and AgPtCO were allowed to cool to ambient
temperature under Ar and CO, respectively.
Pure Pt nanoparticles (0.05 wt. % Pt) were synthesized by strong electrostatic adsorption
(SEA) of Pt ions to negatively charged silica.98 First, 10 g of SiO2 was added to 330 cm3 of a
basic aqueous solution (pH > 11; 14.5 M NH4OH, Macron, 28-30 wt. %) followed by addition of
10 mg of a Pt salt (Pt(NH3)4(NO3)2, Sigma-Aldrich, 99.995%). The resultant basic Pt solution
was stirred by hand every 0.5 h over the course of 3 h. The solids were then vacuum filtered and
rinsed with 500 cm3 of DI water (17.8 MΩ). The solids were allowed to dry by vacuum filtration

90
then heated to 573 K at a ramp rate of 5 K min-1 and held at 573 K for 4 h in a flowing H2 and He
mixture (40 kPa H2, 61 kPa He, 100 cm3 min-1) with the intent to reduce the Pt ions into
nanoparticles. The reduced nanoparticles were then heated to 973 K at 5 K min-1 and held for 4 h
in flowing dry air (100 cm3 min-1) to increase the mean nanoparticle diameter to 26 + 8 nm. Last,
the catalyst was allowed to cool to 573 K, where a second reduction treatment (40 kPa H2, 61
kPa He, 100 cm3 min) was conducted for 4 h.
Fourier transform infrared spectroscopy experiments involving 13CO (section 4.2.2)
required the use of higher metal loading catalysts in order to improve the signal to noise ratio.
The high metal loading AgPt catalysts (0.63 wt. % Pt and 0.37 wt. % Ag) were synthesized by
the same procedure outlined above except a higher concentration of nanoparticles were deposited
on the support, which in this case was α-alumina. High metal loading Pt nanoparticles (5 wt. %)
were prepared by SEA as described above however a greater Pt/SiO2 ratio was used to achieve
the desired metal loading.
4.2.2 Catalyst Characterization
The approximate sizes of the AgPt and Pt nanoparticles were determined by bright-field
imaging with a transmission electron microscope (JEOL 2010 LaB6). Figures 4.1a-4.1d show
representative transmission electron microscopy (TEM) images of both the silica supported AgPt
octahedra and Pt nanoparticles and their corresponding size distributions. The surface area
normalized average diameter (<dTEM>) of the AgPt octahedrons and Pt nanoparticles was
determined using:
< dTEM > =∑ 𝑛𝑖𝑑𝑖
3𝑖
∑ 𝑛𝑖𝑑𝑖2
𝑖 (4.1)
where ni is the number of particles with diameter di. Values of di for AgPt octahedrons were
calculated from the average of the length and the width of each octahedron. Values of <dTEM> for

91
synthesized AgPt octahedra was 17 + 2 nm (Figure 4.1a), which remained constant following
treatments in either pure CO (17 + 3 nm) or Ar (16 + 2 nm) and after catalyzing the direct
synthesis of H2O2 for ~12 h (Figures 4.1b and 4.1c). These images demonstrate that the
geometric structure and dispersion of the octahedra are not affected by treatments in CO or Ar at
373 K or by exposure to the reaction conditions. The Pt nanoparticles (Figure 4.1d) have a
broader size distribution and a larger value of <dTEM> (26 + 8 nm) than the AgPt octahedra, but
the Pt nanoparticles also expose highly coordinated Pt surface atoms.
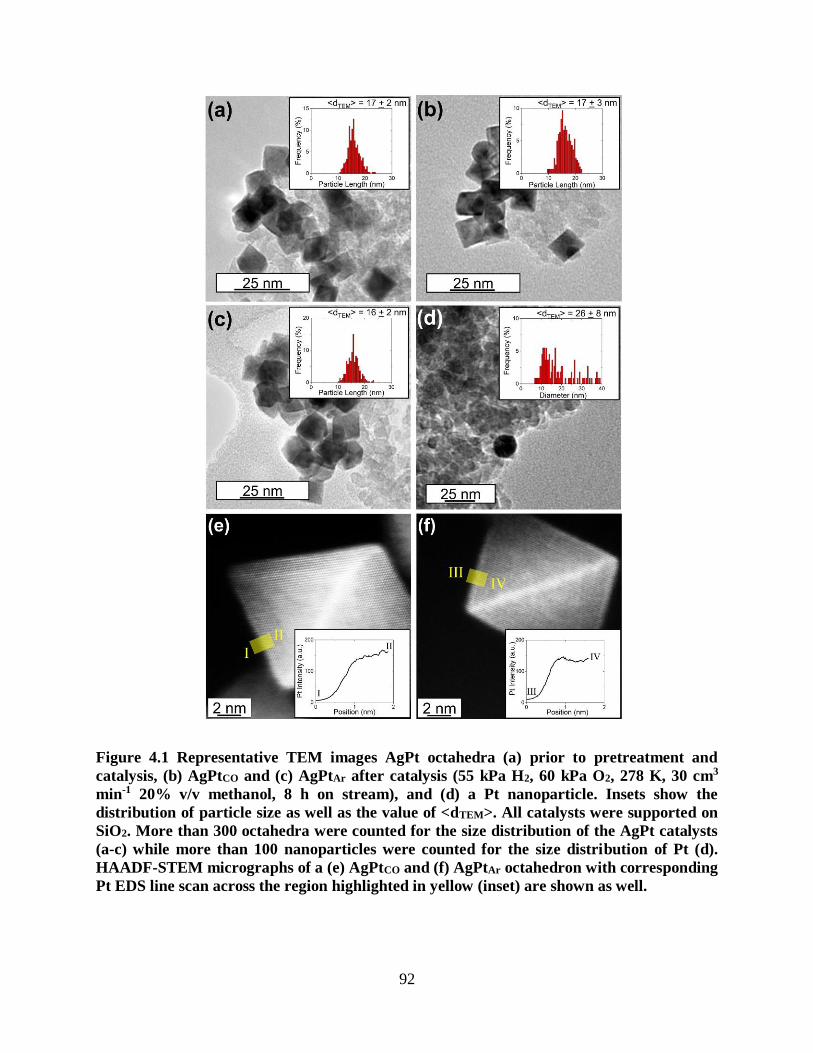
92
Figure 4.1 Representative TEM images AgPt octahedra (a) prior to pretreatment and
catalysis, (b) AgPtCO and (c) AgPtAr after catalysis (55 kPa H2, 60 kPa O2, 278 K, 30 cm3
min-1 20% v/v methanol, 8 h on stream), and (d) a Pt nanoparticle. Insets show the
distribution of particle size as well as the value of <dTEM>. All catalysts were supported on
SiO2. More than 300 octahedra were counted for the size distribution of the AgPt catalysts
(a-c) while more than 100 nanoparticles were counted for the size distribution of Pt (d).
HAADF-STEM micrographs of a (e) AgPtCO and (f) AgPtAr octahedron with corresponding
Pt EDS line scan across the region highlighted in yellow (inset) are shown as well.

93
High angular dark field scanning transmission electron microscopy (HAADF-STEM;
JEOL 2200 FS STEM with Schottky field emitter and Cs-corrector) was used in combination
with energy dispersive X-ray spectroscopy (EDS) line scans to observe where Pt was located
within individual AgPt octahedrons. Figures 4.1e and 4.1f show representative Z-contrast
micrographs and EDS scans of Pt, AgPtCO, (Fig. 4.1e) and AgPtAr (Fig. 4.1f). EDS line scans
across the edge of the AgPtCO particle (from position I to II in Figure 4.1e) show only small
perturbations of the Pt intensity as the overall intensity increases, suggesting Pt and Ag are
homogeneously mixed in the near-edge region of each octahedron. The Pt intensity remains
nearly constant as the scan passes through the edge and scans the terrace atoms, indicating no
significant difference in Pt content between the edge and the terrace. In contrast, EDS line scans
across the near-edge region of a AgPtAr particle (from position III to IV in Figure 4.1f) show a
maximum in the Pt intensity at the edge, followed by a decrease in Pt intensity within the terrace
(i.e., as the scan approaches IV), which suggests that surface Pt atoms exist in higher
concentrations at the edge of the AgPtAr octahedra while the terrace atoms consist primarily of
Ag atoms. The segregation of Pt atoms to the edges is shown qualitatively in the micrograph of
the AgPtAr octahedron (Figure 4.1f) and appears as bright edges of the octahedron (higher Z-
contrast) whereas there are no similar points of contrast in the micrograph of the AgPtCO
octahedron (Figure 4.1e). These micrographs and EDS line scans (Figures 4.1e and 4.1f) show
that the position of Pt on the surface of the AgPt octahedra can be manipulated by low
temperature treatments in CO or Ar. This phenomena and the resulting effects on the electronic
structure of Pt atoms were probed by interrogation of active sites by determining H2O2 formation
rates and barriers and by analysis of vibrational spectra obtained during 12CO-13CO exchange
(vide infra).
94
Migration of Pt atoms in AgPt octahedra following pretreatments in either CO or Ar was
observed using Fourier transform infrared (FTIR) spectroscopy. The details of the FTIR
procedure used have been described previously.146 Briefly, samples were ground to a fine
powder (< 200 mesh) and then pressed into a disc with a 20 mm diameter and roughly 1-2 mm
thick using a pellet press (Fred S. Carver Inc., Model C). The disc was supported between two
stainless-steel retaining rings inside a custom-made transmission cell containing CaF2 windows
and a K-type thermocouple in contact with the retaining rings. The cell was sealed by pressing
natural carbon ferrules (Chromalytic Technology Pty. Ltd.) against the CaF2 windows by
tightening stainless-steel discs on the outside of the cell. The cell was heated using aluminum
blocks containing electrical heating cartridges controlled by a PID temperature controller
(Watlow, EZ-ZONE PM). Gases (He, H2, 12CO, 13CO) were fed to the transmission cell through
a gas-handling manifold using digital mass flow controllers (MFC; Alicat, MC series).
The pure Pt catalysts were reduced in situ by heating to 573 K at 10 K min-1 under 50
cm3 min-1 of a He/H2 mixture (61 kPa He, 40 kPa H2). H2 was then removed from the stream and
He (101 kPa) was allowed to flow at 30 cm3 min-1 over the catalyst for 0.5 h. The cell was then
allowed to cool to ambient temperature (297 K) under flowing He. Next, a background scan was
taken with the FTIR (Bruker, Tensor 37, equipped with a liquid N2 cooled mercury-cadmium-
telluride detector). The catalyst was then exposed to a flowing mixture (31.6 cm3 min-1) of 5 kPa
12CO in He (96 kPa) while continuously measuring FTIR spectra. After saturation of the catalyst
surface with 12CO (i.e., spectra no longer changing with time, ~600 s), the 12CO stream was
stopped and He was allowed to purge residual gas-phase 12CO from the cell while scanning with
the FTIR. Spectra from these experiments were taken immediately after the complete removal of
gas-phase 12CO features.

95
A different procedure was used for the AgPt catalyst. First, the cell was purged of air by
flowing He at ambient temperature overnight (~ 12 h). Then, a background scan was taken with
the FTIR followed by the introduction of a 31.6 cm3 min-1 gas mixture containing 5 kPa 12CO in
He (96 kPa) at ambient temperature. The cell was then heated to 373 K at 10 K min-1 and held at
373 K for 1 h. Next, the cell was allowed to cool to ambient temperature and the 12CO stream
was shut off and He purged the gas-phase 12CO while continuously scanning with the FTIR.
Next, the cell was heated back up to 373 K at 10 K min-1 under flowing He (30 cm3 min-1) only
and held at 373 K for 4 h. After the cell was cooled to ambient temperature under flowing He,
another background scan was taken with the FTIR and 12CO was introduced to the stream (31.6
cm3 min-1, 5 kPa 12CO, 96 kPa He) while continuously scanning with the FTIR. Once the surface
was saturated with 12CO, the 12CO stream was stopped and the gas-phase 12CO was once again
purged with He as measurements were taken with the FTIR. The catalysts used for these
experiments were the same ones used for rate and selectivity measurements.
Rates of exchange between 13CO (Sigma-Aldrich, 99%) and 12CO were determined using
FTIR by performing the same treatments as above, followed by saturating the surface in 13CO.
After the signal for adsorbed 13CO was not no longer changing, a gas stream of 12CO (0.2 kPa)
was introduced while scanning. To determine the singleton frequency of 13CO, 13CO and 12CO
were introduced to the system at different molar ratios to vary the surface coverage of 13CO
relative to the total number of adsorbed CO molecules (θ):
θ =[ CO∗]13
([ CO∗]13 +[ CO∗])12 (4.2)
where [13CO*] and [12CO*] are the number of adsorbed 13CO and 12CO molecules, respectively.
Values of [13CO*] and [12CO*] and for ν(C=O) of 13CO* and 12CO* were determined from the
intensities and peak locations of deconvoluted bi-gaussian curves describing 13CO* and 12CO*
96
(section C1, Figures C.1 and C.2). The peak centers of these fits gave the vibrational frequency
of ν(C=O) for 12CO and 13CO while the peak heights gave the value of θ. The width of the
adsorbed 13CO feature at full 13CO coverage (θ=1) is within 10% of the feature at the lowest
measurable 13CO coverage (θ~0.2) on all three catalysts, allowing for peak heights to be used to
approximate surface coverage. Catalysts used for these experiments were a higher metal loading
in order to get a higher signal to noise ratio (section 4.2.1). The high metal loading AgPt
catalysts were supported on α-alumina and were 0.63 wt. % Pt and 0.37 wt. % Ag while the Pt
catalysts were 5 wt. % on silica. The methods by which these catalysts were prepared were the
same as those made for the rate and selectivity measurements.
4.2.3 Steady-state H2O2 and H2O Formation Rate Measurements
Formation rates were measured in a packed-bed, plugged flow reactor system described
previously.146 Briefly, 300-1000 mg of catalyst was loaded into the cooling-jacket equipped
stainless-steel reactor (15 cm long, 0.5 cm inner diameter) between glass wool and 4 mm
diameter glass rods. Certified reactant gas mixtures of 25% H2, balance N2, and 5% O2, balance
N2 (Airgas) were introduced to the system by digital MFCs (Porter, 601 series) and mixed with a
20% v/v aqueous methanol (Macron, > 99.8 %) solution, which was introduced using a high-
performance liquid chromatography (HPLC) pump (SSI, M1 class). The reactor temperature was
controlled by a refrigerated recirculating bath (Fisher Scientific, Isotemp) and monitored by a K-
type thermocouple. The reactor pressure (1.3 MPa) was maintained by a back-pressure regulator
(BPR; Equilibar, EB1LF1-SS316) controlled by an electronic pressure reducer (EPR; Proportion
Air, QB1S). The two phases of the gas-liquid stream leaving the BPR was separated using a
polyvinyl chloride gas-liquid separator (GLS). The gas stream was separated and analyzed using
a gas chromatograph (Agilent, 7890, thermal conductivity detector, Ar carrier and reference gas)
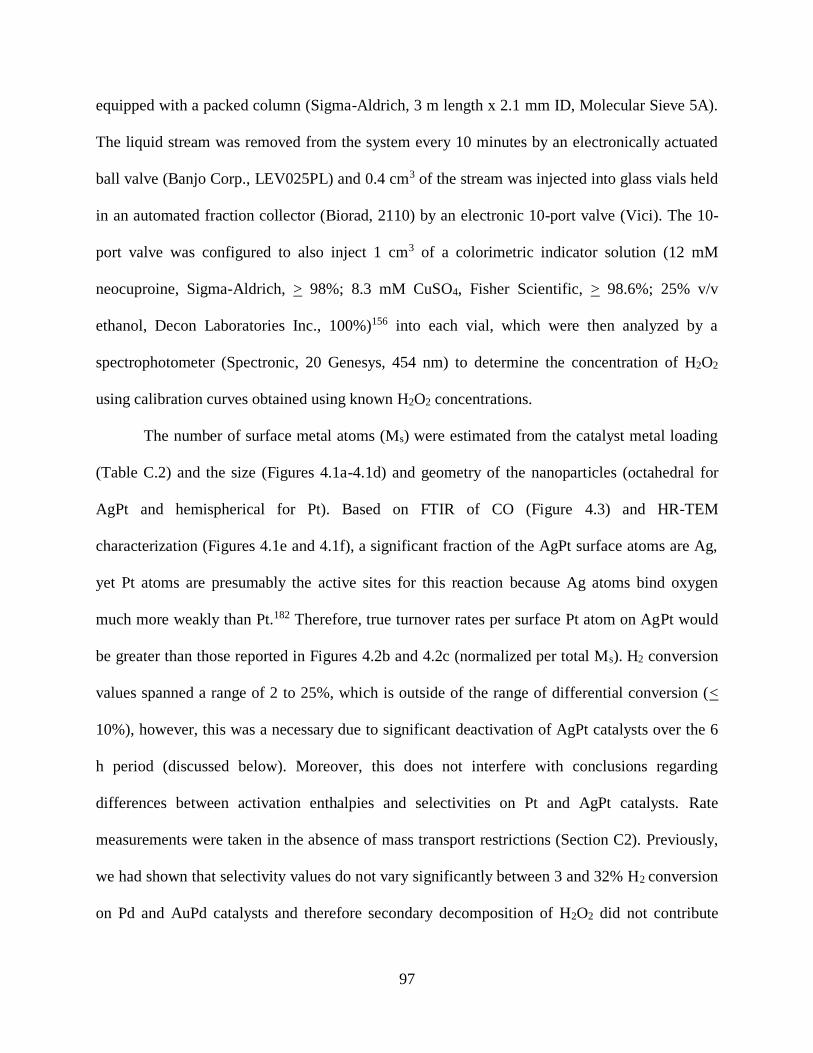
97
equipped with a packed column (Sigma-Aldrich, 3 m length x 2.1 mm ID, Molecular Sieve 5A).
The liquid stream was removed from the system every 10 minutes by an electronically actuated
ball valve (Banjo Corp., LEV025PL) and 0.4 cm3 of the stream was injected into glass vials held
in an automated fraction collector (Biorad, 2110) by an electronic 10-port valve (Vici). The 10-
port valve was configured to also inject 1 cm3 of a colorimetric indicator solution (12 mM
neocuproine, Sigma-Aldrich, > 98%; 8.3 mM CuSO4, Fisher Scientific, > 98.6%; 25% v/v
ethanol, Decon Laboratories Inc., 100%)156 into each vial, which were then analyzed by a
spectrophotometer (Spectronic, 20 Genesys, 454 nm) to determine the concentration of H2O2
using calibration curves obtained using known H2O2 concentrations.
The number of surface metal atoms (Ms) were estimated from the catalyst metal loading
(Table C.2) and the size (Figures 4.1a-4.1d) and geometry of the nanoparticles (octahedral for
AgPt and hemispherical for Pt). Based on FTIR of CO (Figure 4.3) and HR-TEM
characterization (Figures 4.1e and 4.1f), a significant fraction of the AgPt surface atoms are Ag,
yet Pt atoms are presumably the active sites for this reaction because Ag atoms bind oxygen
much more weakly than Pt.182 Therefore, true turnover rates per surface Pt atom on AgPt would
be greater than those reported in Figures 4.2b and 4.2c (normalized per total Ms). H2 conversion
values spanned a range of 2 to 25%, which is outside of the range of differential conversion (<
10%), however, this was a necessary due to significant deactivation of AgPt catalysts over the 6
h period (discussed below). Moreover, this does not interfere with conclusions regarding
differences between activation enthalpies and selectivities on Pt and AgPt catalysts. Rate
measurements were taken in the absence of mass transport restrictions (Section C2). Previously,
we had shown that selectivity values do not vary significantly between 3 and 32% H2 conversion
on Pd and AuPd catalysts and therefore secondary decomposition of H2O2 did not contribute
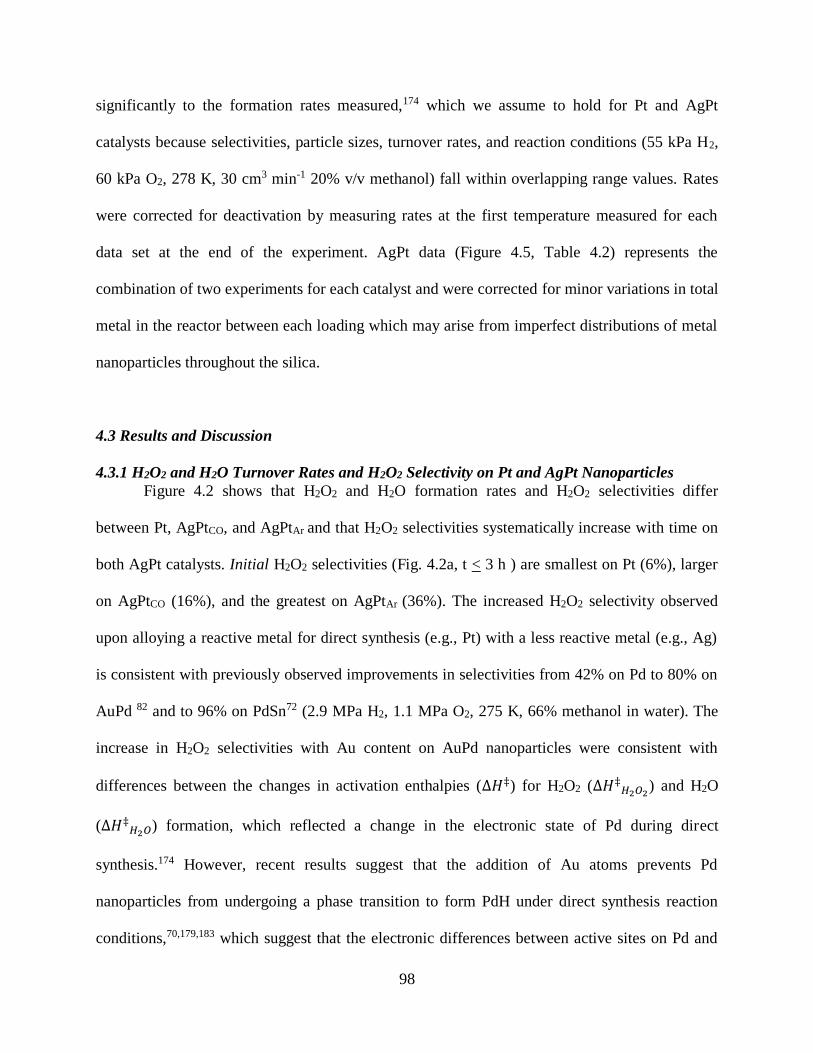
98
significantly to the formation rates measured,174 which we assume to hold for Pt and AgPt
catalysts because selectivities, particle sizes, turnover rates, and reaction conditions (55 kPa H2,
60 kPa O2, 278 K, 30 cm3 min-1 20% v/v methanol) fall within overlapping range values. Rates
were corrected for deactivation by measuring rates at the first temperature measured for each
data set at the end of the experiment. AgPt data (Figure 4.5, Table 4.2) represents the
combination of two experiments for each catalyst and were corrected for minor variations in total
metal in the reactor between each loading which may arise from imperfect distributions of metal
nanoparticles throughout the silica.
4.3 Results and Discussion
4.3.1 H2O2 and H2O Turnover Rates and H2O2 Selectivity on Pt and AgPt Nanoparticles
Figure 4.2 shows that H2O2 and H2O formation rates and H2O2 selectivities differ
between Pt, AgPtCO, and AgPtAr and that H2O2 selectivities systematically increase with time on
both AgPt catalysts. Initial H2O2 selectivities (Fig. 4.2a, t < 3 h ) are smallest on Pt (6%), larger
on AgPtCO (16%), and the greatest on AgPtAr (36%). The increased H2O2 selectivity observed
upon alloying a reactive metal for direct synthesis (e.g., Pt) with a less reactive metal (e.g., Ag)
is consistent with previously observed improvements in selectivities from 42% on Pd to 80% on
AuPd 82 and to 96% on PdSn72 (2.9 MPa H2, 1.1 MPa O2, 275 K, 66% methanol in water). The
increase in H2O2 selectivities with Au content on AuPd nanoparticles were consistent with
differences between the changes in activation enthalpies (∆𝐻‡) for H2O2 (∆𝐻‡𝐻2𝑂2) and H2O
(∆𝐻‡𝐻2𝑂) formation, which reflected a change in the electronic state of Pd during direct
synthesis.174 However, recent results suggest that the addition of Au atoms prevents Pd
nanoparticles from undergoing a phase transition to form PdH under direct synthesis reaction
conditions,70,179,183 which suggest that the electronic differences between active sites on Pd and

99
AuPd catalysts may reflect the differences between metallic and hydridic Pd atoms. Here, neither
Pt nor AgPt form hydrides at these conditions178,179 and therefore the differences in H2O2
selectivities among the Pt and differently treated AgPt nanoparticles (i.e., AgPtCO and AgPtAr)
arise only as a result of electronic changes induced within metallic Pt atoms by interactions with
Ag. The electronic modifications of Pt atoms by the addition of Ag may be caused by
rehybridization of d-orbitals of Pt due to tensile strain caused by the lattice mismatch (4.2%)
between Ag and Pt184 or perhaps by differences between the electronegativity of Ag (2.15) and Pt
(2.1).185 Tensile strain would likely shift the density of states to higher energies and strengthen
bonds between Pt and adsorbed O2, (or other molecules) whereas withdrawal of electrons from
the Pt would lead to decreased occupation of d-states and less electron exchange with adsorbates.
Greater selectivities to H2O2 and reduced rates for H2O formation (by O-O bond rupture) suggest
that Pt atoms become less reactive when intermingled with Ag, however, these electronic
changes can be probed directly with spectroscopic CO exchange experiments shown below
(section 4.2.2).
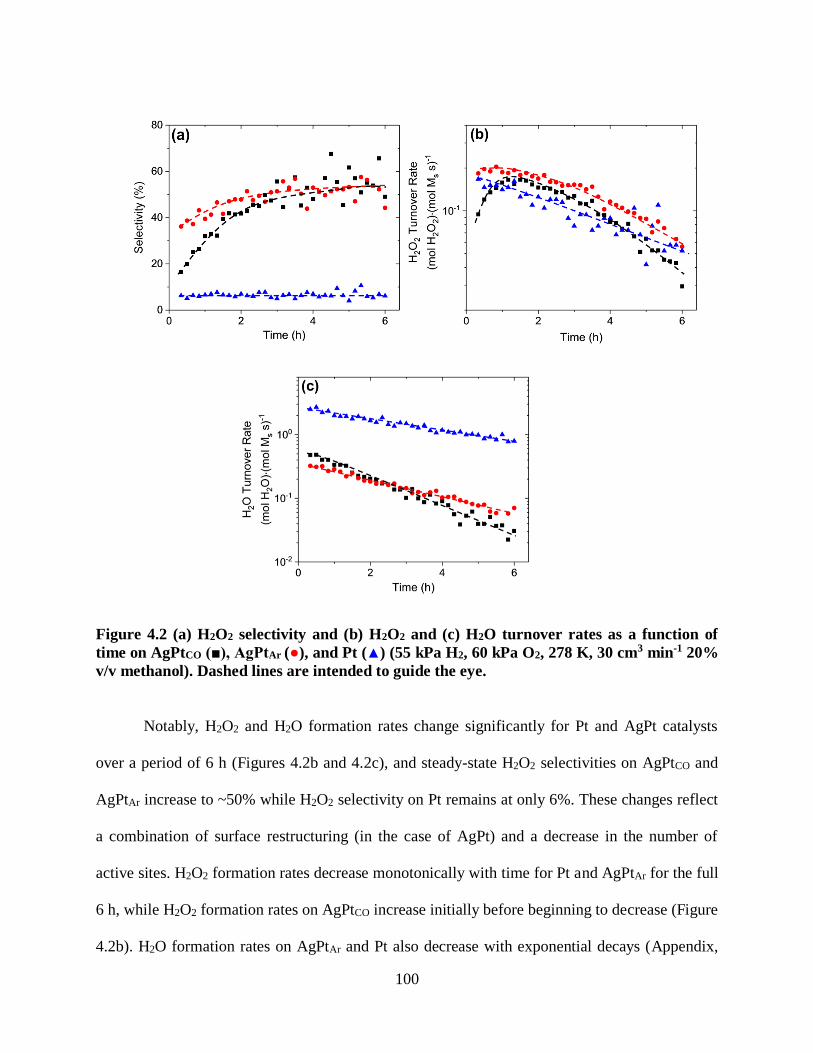
100
Figure 4.2 (a) H2O2 selectivity and (b) H2O2 and (c) H2O turnover rates as a function of
time on AgPtCO (■), AgPtAr (●), and Pt (▲) (55 kPa H2, 60 kPa O2, 278 K, 30 cm3 min-1 20%
v/v methanol). Dashed lines are intended to guide the eye.
Notably, H2O2 and H2O formation rates change significantly for Pt and AgPt catalysts
over a period of 6 h (Figures 4.2b and 4.2c), and steady-state H2O2 selectivities on AgPtCO and
AgPtAr increase to ~50% while H2O2 selectivity on Pt remains at only 6%. These changes reflect
a combination of surface restructuring (in the case of AgPt) and a decrease in the number of
active sites. H2O2 formation rates decrease monotonically with time for Pt and AgPtAr for the full
6 h, while H2O2 formation rates on AgPtCO increase initially before beginning to decrease (Figure
4.2b). H2O formation rates on AgPtAr and Pt also decrease with exponential decays (Appendix,
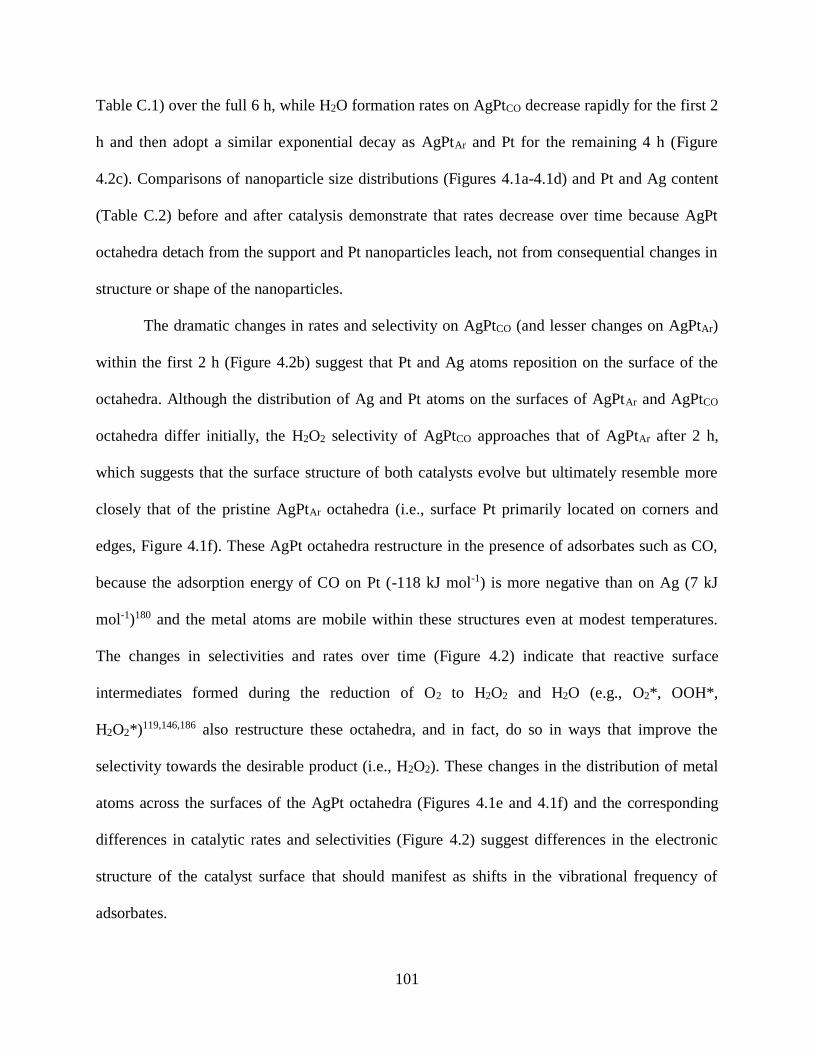
101
Table C.1) over the full 6 h, while H2O formation rates on AgPtCO decrease rapidly for the first 2
h and then adopt a similar exponential decay as AgPtAr and Pt for the remaining 4 h (Figure
4.2c). Comparisons of nanoparticle size distributions (Figures 4.1a-4.1d) and Pt and Ag content
(Table C.2) before and after catalysis demonstrate that rates decrease over time because AgPt
octahedra detach from the support and Pt nanoparticles leach, not from consequential changes in
structure or shape of the nanoparticles.
The dramatic changes in rates and selectivity on AgPtCO (and lesser changes on AgPtAr)
within the first 2 h (Figure 4.2b) suggest that Pt and Ag atoms reposition on the surface of the
octahedra. Although the distribution of Ag and Pt atoms on the surfaces of AgPtAr and AgPtCO
octahedra differ initially, the H2O2 selectivity of AgPtCO approaches that of AgPtAr after 2 h,
which suggests that the surface structure of both catalysts evolve but ultimately resemble more
closely that of the pristine AgPtAr octahedra (i.e., surface Pt primarily located on corners and
edges, Figure 4.1f). These AgPt octahedra restructure in the presence of adsorbates such as CO,
because the adsorption energy of CO on Pt (-118 kJ mol-1) is more negative than on Ag (7 kJ
mol-1)180 and the metal atoms are mobile within these structures even at modest temperatures.
The changes in selectivities and rates over time (Figure 4.2) indicate that reactive surface
intermediates formed during the reduction of O2 to H2O2 and H2O (e.g., O2*, OOH*,
H2O2*)119,146,186 also restructure these octahedra, and in fact, do so in ways that improve the
selectivity towards the desirable product (i.e., H2O2). These changes in the distribution of metal
atoms across the surfaces of the AgPt octahedra (Figures 4.1e and 4.1f) and the corresponding
differences in catalytic rates and selectivities (Figure 4.2) suggest differences in the electronic
structure of the catalyst surface that should manifest as shifts in the vibrational frequency of
adsorbates.
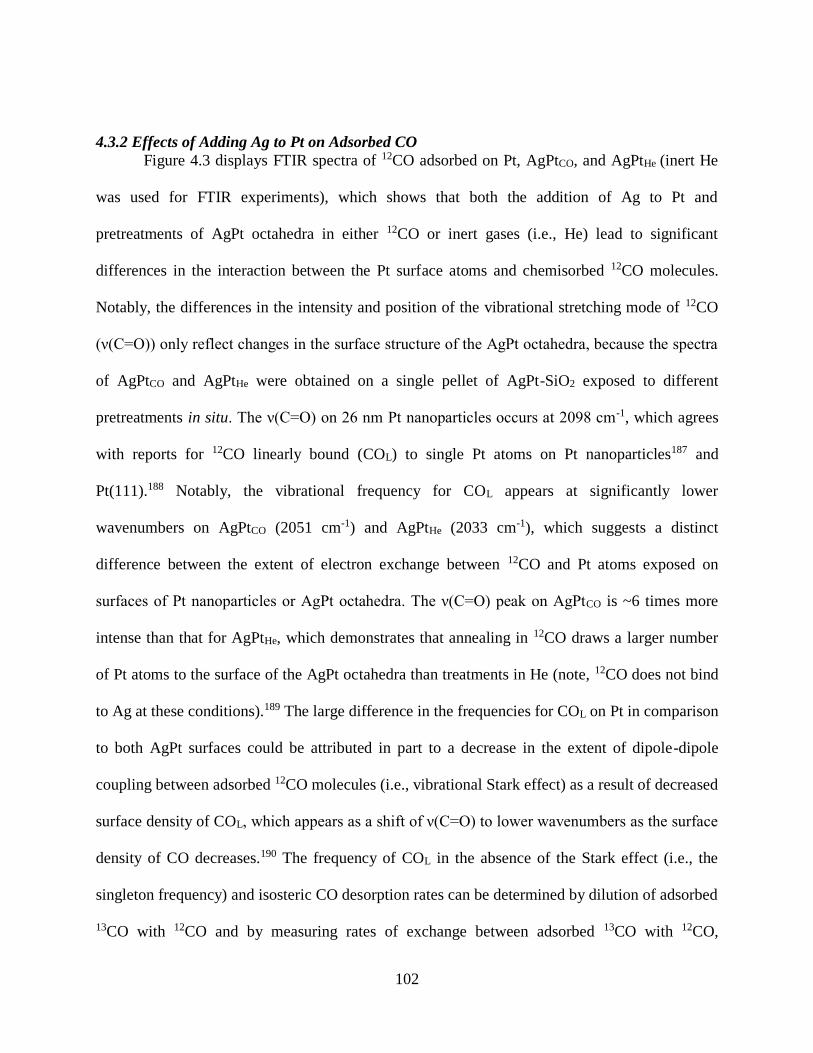
102
4.3.2 Effects of Adding Ag to Pt on Adsorbed CO
Figure 4.3 displays FTIR spectra of 12CO adsorbed on Pt, AgPtCO, and AgPtHe (inert He
was used for FTIR experiments), which shows that both the addition of Ag to Pt and
pretreatments of AgPt octahedra in either 12CO or inert gases (i.e., He) lead to significant
differences in the interaction between the Pt surface atoms and chemisorbed 12CO molecules.
Notably, the differences in the intensity and position of the vibrational stretching mode of 12CO
(ν(C=O)) only reflect changes in the surface structure of the AgPt octahedra, because the spectra
of AgPtCO and AgPtHe were obtained on a single pellet of AgPt-SiO2 exposed to different
pretreatments in situ. The ν(C=O) on 26 nm Pt nanoparticles occurs at 2098 cm-1, which agrees
with reports for 12CO linearly bound (COL) to single Pt atoms on Pt nanoparticles187 and
Pt(111).188 Notably, the vibrational frequency for COL appears at significantly lower
wavenumbers on AgPtCO (2051 cm-1) and AgPtHe (2033 cm-1), which suggests a distinct
difference between the extent of electron exchange between 12CO and Pt atoms exposed on
surfaces of Pt nanoparticles or AgPt octahedra. The ν(C=O) peak on AgPtCO is ~6 times more
intense than that for AgPtHe, which demonstrates that annealing in 12CO draws a larger number
of Pt atoms to the surface of the AgPt octahedra than treatments in He (note, 12CO does not bind
to Ag at these conditions).189 The large difference in the frequencies for COL on Pt in comparison
to both AgPt surfaces could be attributed in part to a decrease in the extent of dipole-dipole
coupling between adsorbed 12CO molecules (i.e., vibrational Stark effect) as a result of decreased
surface density of COL, which appears as a shift of ν(C=O) to lower wavenumbers as the surface
density of CO decreases.190 The frequency of COL in the absence of the Stark effect (i.e., the
singleton frequency) and isosteric CO desorption rates can be determined by dilution of adsorbed
13CO with 12CO and by measuring rates of exchange between adsorbed 13CO with 12CO,
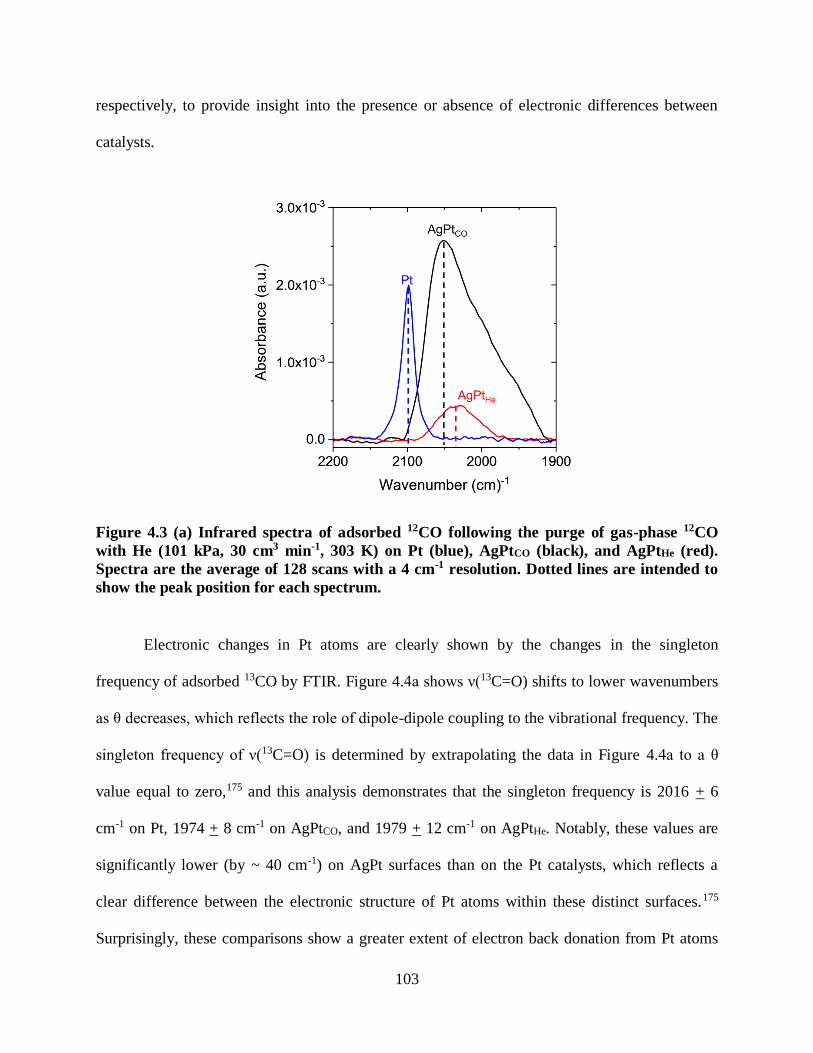
103
respectively, to provide insight into the presence or absence of electronic differences between
catalysts.
Figure 4.3 (a) Infrared spectra of adsorbed 12CO following the purge of gas-phase 12CO
with He (101 kPa, 30 cm3 min-1, 303 K) on Pt (blue), AgPtCO (black), and AgPtHe (red).
Spectra are the average of 128 scans with a 4 cm-1 resolution. Dotted lines are intended to
show the peak position for each spectrum.
Electronic changes in Pt atoms are clearly shown by the changes in the singleton
frequency of adsorbed 13CO by FTIR. Figure 4.4a shows ν(13C=O) shifts to lower wavenumbers
as θ decreases, which reflects the role of dipole-dipole coupling to the vibrational frequency. The
singleton frequency of ν(13C=O) is determined by extrapolating the data in Figure 4.4a to a θ
value equal to zero,175 and this analysis demonstrates that the singleton frequency is 2016 + 6
cm-1 on Pt, 1974 + 8 cm-1 on AgPtCO, and 1979 + 12 cm-1 on AgPtHe. Notably, these values are
significantly lower (by ~ 40 cm-1) on AgPt surfaces than on the Pt catalysts, which reflects a
clear difference between the electronic structure of Pt atoms within these distinct surfaces.175
Surprisingly, these comparisons show a greater extent of electron back donation from Pt atoms
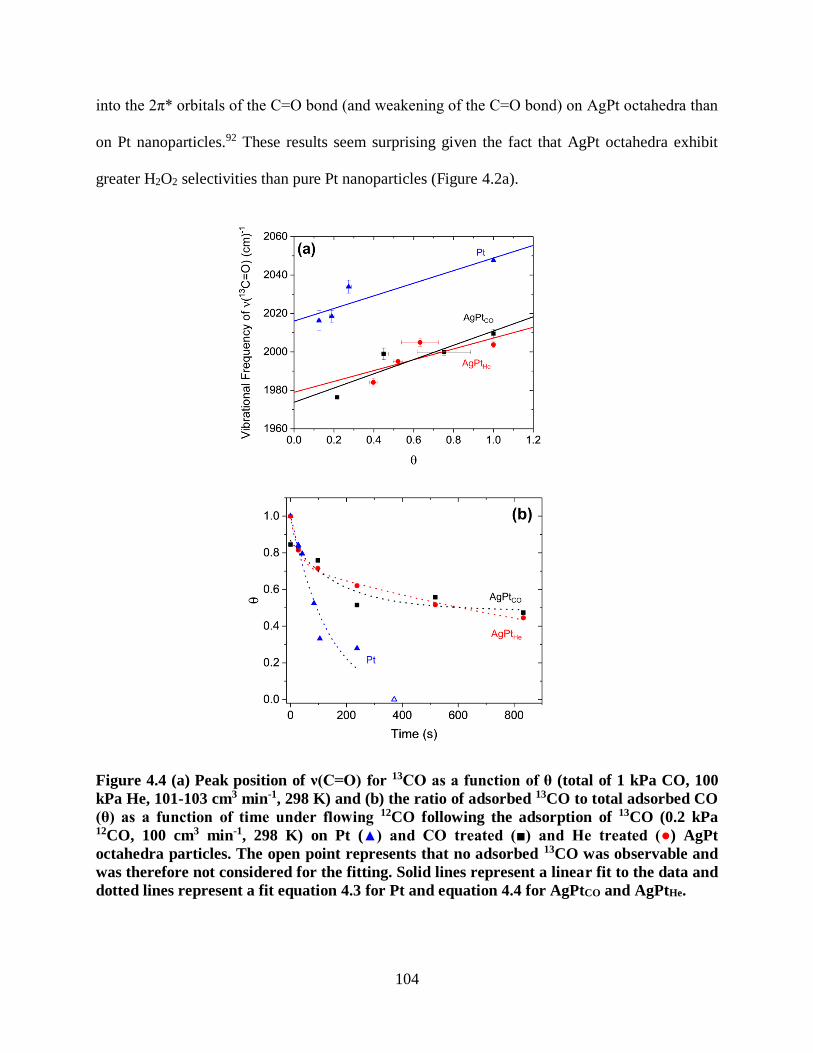
104
into the 2π* orbitals of the C=O bond (and weakening of the C=O bond) on AgPt octahedra than
on Pt nanoparticles.92 These results seem surprising given the fact that AgPt octahedra exhibit
greater H2O2 selectivities than pure Pt nanoparticles (Figure 4.2a).
Figure 4.4 (a) Peak position of ν(C=O) for 13CO as a function of θ (total of 1 kPa CO, 100
kPa He, 101-103 cm3 min-1, 298 K) and (b) the ratio of adsorbed 13CO to total adsorbed CO
(θ) as a function of time under flowing 12CO following the adsorption of 13CO (0.2 kPa 12CO, 100 cm3 min-1, 298 K) on Pt (▲) and CO treated (■) and He treated (●) AgPt
octahedra particles. The open point represents that no adsorbed 13CO was observable and
was therefore not considered for the fitting. Solid lines represent a linear fit to the data and
dotted lines represent a fit equation 4.3 for Pt and equation 4.4 for AgPtCO and AgPtHe.
105
Figure 4.4b shows that isosteric desorption rates of 13CO are much lower on both types of
AgPt octahedra than on Pt, which further confirms that CO binds more strongly to individual Pt
atoms when they are surrounded by Ag atoms. Complete 13CO* exchange with 12CO* occurs on
Pt in ~400 s while this process is less than 60% complete in more than 800 s on AgPtHe and
AgPtCO. Rates of 13CO* desorption are described well for Pt nanoparticles (Fig. 4.4b) using a
single exponential decay that models a first order desorption process of a uniform surface:
𝜃 = 𝐴 ∙ 𝑒−𝑘𝐴∙𝑡 (4.3)
where A is a pre-exponential constant, kA is a rate constant for CO desorption in s-1, and t is time
in s. The quality of the fit of equation (4.3) to the experimental data indicates that the vast
majority of 13CO* molecules desorb with similar rate constants from CO*-saturated surfaces of
Pt nanoparticles. This model for a uniform surface does not, however, describe 13CO* desorption
rates accurately for either form of AgPt octahedra (Figure C.3, Table C.4), which suggests that
these surfaces expose chemically distinct Pt atoms that bind CO* molecules. The diversity in
sites is captured reasonably well using a model for desorption that describes desorption from two
independent and distinct binding sites:
𝜃 = 𝐴 ∙ 𝑒−𝑘𝐴∙𝑡 + 𝐵 ∙ 𝑒−𝑘𝐵∙𝑡 (4.4)
where B and kB are the pre-exponential and rate constants for a second type of site that coexists
on AgPt. Table 4.1 demonstrates that kB values are at least an order of magnitude less than all kA
values, therefore CO* desorbs more slowly (i.e., binds more strongly) on this new type of site
that emerges after alloying Pt with Ag. Moreover, comparisons of the values of A and B (which
represent the fraction of sites which have time constants kA and kB, respectively) on AgPt
surfaces suggests that more than half of the exposed Pt atoms are chemically modified to bind
CO* more strongly (and allow CO* to desorb more slowly) than on Pt nanoparticle surfaces.

106
This analysis suggests the presence of both electronic and ensemble effects after the addition of
Ag to Pt.
Table 4.1 Time constants from fitting exponential decays to θ as a function of timea
Catalyst A B kA (s)-1 kB (s)-1
Pt 1 + 0.07 -b (7 + 0.1)·10-3 - b
AgPtCO 0.4 + 0.4 0.5 + 0.4 (6 + 9)·10-3 (0.05 + 1)·10-3
AgPtAr 0.3 + 0.03 0.7 + 0.02 (4 + 0.9)·10-2 (6 + 0.7)·10-4
aConstants are from fits of equations 4.3 (for Pt) and 4.4 (for AgPt) and were performed on the data in Figure 4.4b. bNot applicable
The decreased rates of CO* desorption on Pt atoms modified by interactions with Ag
agree with the observed red shift in the singleton frequency of ν(13C=O) after adding Ag to Pt
(Figure 4.4a) and are consistent with an expected change in the energy of the Pt d-band center
from -2.25 eV to -1.75 eV predicted to occur for a Pt overlayer on Ag(111).191 The narrowing of
the d-band and upward shift in energy for Pt results from decreased d-orbital overlap induced by
tensile surface Pt atom strain caused by differences between the atomic radii of Pt (135 pm) and
Ag (160 pm).191 Such changes in the d-band center as a result of alloying would be expected to
increase rates of O-O bond cleavage in adsorbed O2,192,193 and in the context of direct synthesis,
decrease H2O2 selectivities on uniform surfaces with complete Pt overlayers.46 Rather, the H2O2
selectivity increases with Ag content (Fig. 4.2a). These observations are reconciled by recalling
that transition states for O2 molecules bind in η2 configurations on ensembles of three or more Pt
atoms on Pt(111).194 The probability of finding these Pt ensembles decreases with increasing
surface densities of Ag atoms. H2O2 likely forms by reduction of O2* and OOH* intermediates
bound in η1 configurations195 that require fewer contiguous Pt atoms and perhaps only a single Pt
atom. These sites on AgPt give greater H2O2 turnover rates than those on Pt due to the upward
shift in the Pt d-band center (Figure 4.4). These combined results suggest that the greater
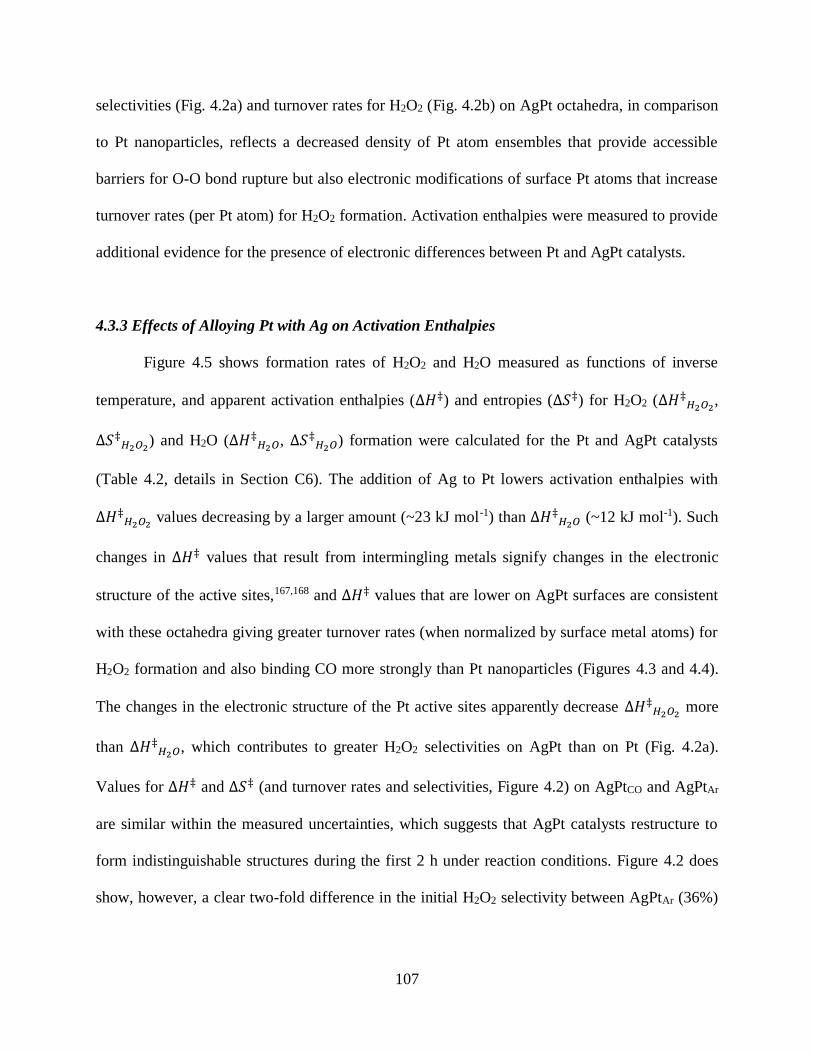
107
selectivities (Fig. 4.2a) and turnover rates for H2O2 (Fig. 4.2b) on AgPt octahedra, in comparison
to Pt nanoparticles, reflects a decreased density of Pt atom ensembles that provide accessible
barriers for O-O bond rupture but also electronic modifications of surface Pt atoms that increase
turnover rates (per Pt atom) for H2O2 formation. Activation enthalpies were measured to provide
additional evidence for the presence of electronic differences between Pt and AgPt catalysts.
4.3.3 Effects of Alloying Pt with Ag on Activation Enthalpies
Figure 4.5 shows formation rates of H2O2 and H2O measured as functions of inverse
temperature, and apparent activation enthalpies (∆𝐻‡) and entropies (∆𝑆‡) for H2O2 (∆𝐻‡𝐻2𝑂2,
∆𝑆‡𝐻2𝑂2) and H2O (∆𝐻‡𝐻2𝑂, ∆𝑆‡𝐻2𝑂) formation were calculated for the Pt and AgPt catalysts
(Table 4.2, details in Section C6). The addition of Ag to Pt lowers activation enthalpies with
∆𝐻‡𝐻2𝑂2 values decreasing by a larger amount (~23 kJ mol-1) than ∆𝐻‡𝐻2𝑂 (~12 kJ mol-1). Such
changes in ∆𝐻‡ values that result from intermingling metals signify changes in the electronic
structure of the active sites,167,168 and ∆𝐻‡ values that are lower on AgPt surfaces are consistent
with these octahedra giving greater turnover rates (when normalized by surface metal atoms) for
H2O2 formation and also binding CO more strongly than Pt nanoparticles (Figures 4.3 and 4.4).
The changes in the electronic structure of the Pt active sites apparently decrease ∆𝐻‡𝐻2𝑂2 more
than ∆𝐻‡𝐻2𝑂, which contributes to greater H2O2 selectivities on AgPt than on Pt (Fig. 4.2a).
Values for ∆𝐻‡ and ∆𝑆‡ (and turnover rates and selectivities, Figure 4.2) on AgPtCO and AgPtAr
are similar within the measured uncertainties, which suggests that AgPt catalysts restructure to
form indistinguishable structures during the first 2 h under reaction conditions. Figure 4.2 does
show, however, a clear two-fold difference in the initial H2O2 selectivity between AgPtAr (36%)
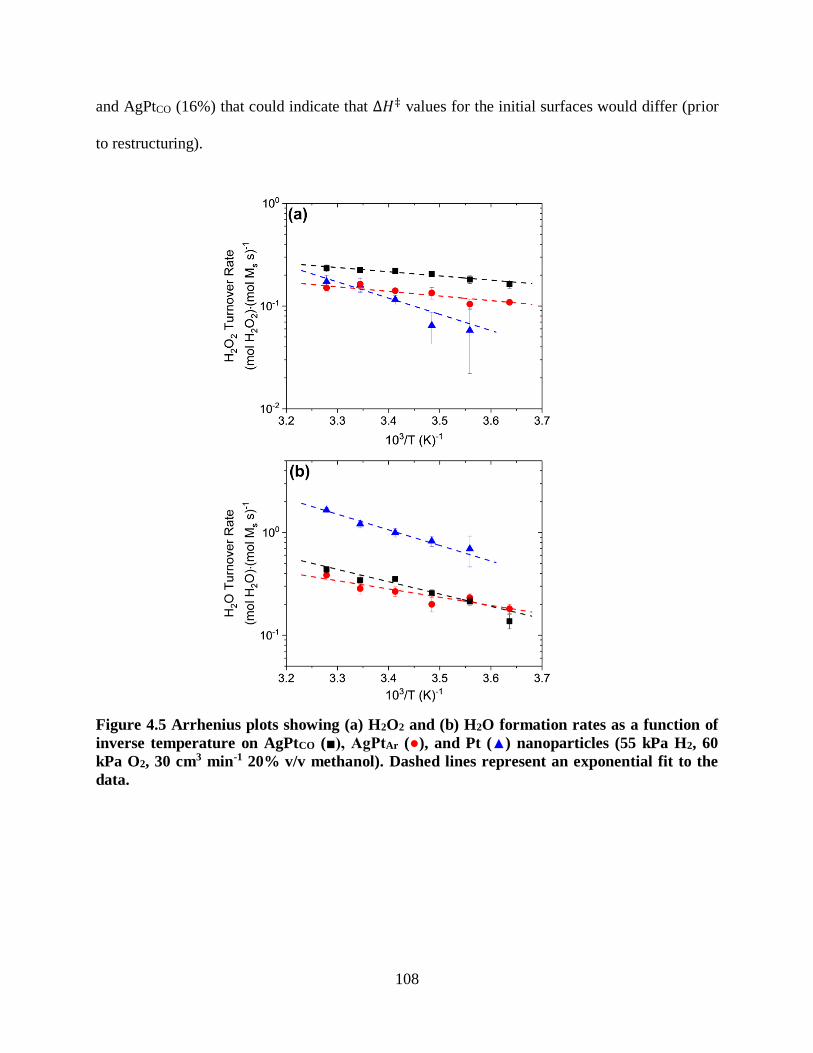
108
and AgPtCO (16%) that could indicate that ∆𝐻‡ values for the initial surfaces would differ (prior
to restructuring).
Figure 4.5 Arrhenius plots showing (a) H2O2 and (b) H2O formation rates as a function of
inverse temperature on AgPtCO (■), AgPtAr (●), and Pt (▲) nanoparticles (55 kPa H2, 60
kPa O2, 30 cm3 min-1 20% v/v methanol). Dashed lines represent an exponential fit to the
data.
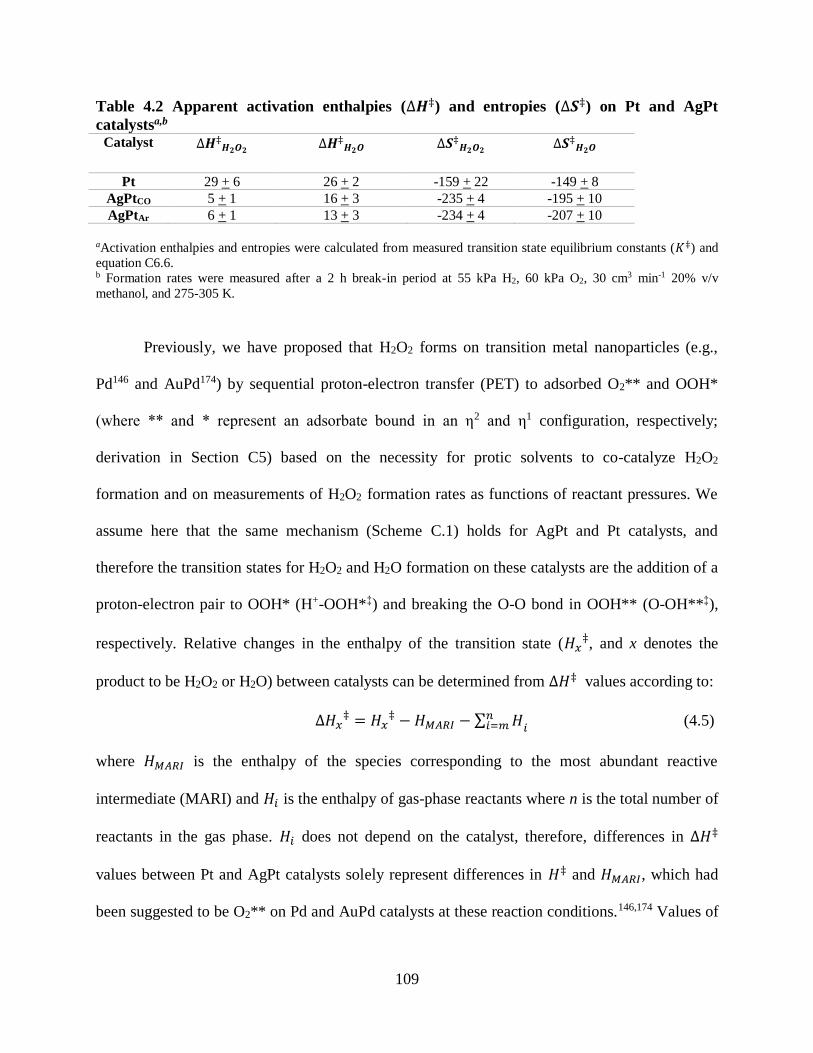
109
Table 4.2 Apparent activation enthalpies (∆𝑯‡) and entropies (∆𝑺‡) on Pt and AgPt
catalystsa,b
Catalyst ∆𝑯‡𝑯𝟐𝑶𝟐 ∆𝑯‡𝑯𝟐𝑶 ∆𝑺‡𝑯𝟐𝑶𝟐 ∆𝑺‡𝑯𝟐𝑶
Pt 29 + 6 26 + 2 -159 + 22 -149 + 8
AgPtCO 5 + 1 16 + 3 -235 + 4 -195 + 10
AgPtAr 6 + 1 13 + 3 -234 + 4 -207 + 10
aActivation enthalpies and entropies were calculated from measured transition state equilibrium constants (𝐾‡) and
equation C6.6. b Formation rates were measured after a 2 h break-in period at 55 kPa H2, 60 kPa O2, 30 cm3 min-1 20% v/v
methanol, and 275-305 K.
Previously, we have proposed that H2O2 forms on transition metal nanoparticles (e.g.,
Pd146 and AuPd174) by sequential proton-electron transfer (PET) to adsorbed O2** and OOH*
(where ** and * represent an adsorbate bound in an η2 and η1 configuration, respectively;
derivation in Section C5) based on the necessity for protic solvents to co-catalyze H2O2
formation and on measurements of H2O2 formation rates as functions of reactant pressures. We
assume here that the same mechanism (Scheme C.1) holds for AgPt and Pt catalysts, and
therefore the transition states for H2O2 and H2O formation on these catalysts are the addition of a
proton-electron pair to OOH* (H+-OOH*‡) and breaking the O-O bond in OOH** (O-OH**‡),
respectively. Relative changes in the enthalpy of the transition state (𝐻𝑥‡, and x denotes the
product to be H2O2 or H2O) between catalysts can be determined from ∆𝐻‡ values according to:
∆𝐻𝑥‡ = 𝐻𝑥
‡ −𝐻𝑀𝐴𝑅𝐼 − ∑ 𝐻𝑛𝑖=𝑚 𝑖
(4.5)
where 𝐻𝑀𝐴𝑅𝐼 is the enthalpy of the species corresponding to the most abundant reactive
intermediate (MARI) and 𝐻𝑖 is the enthalpy of gas-phase reactants where n is the total number of
reactants in the gas phase. 𝐻𝑖 does not depend on the catalyst, therefore, differences in ∆𝐻‡
values between Pt and AgPt catalysts solely represent differences in 𝐻‡ and 𝐻𝑀𝐴𝑅𝐼, which had
been suggested to be O2** on Pd and AuPd catalysts at these reaction conditions.146,174 Values of
110
∆𝐻‡𝐻2𝑂2 decrease (from 29 to ~6 kJ mol-1) more than ∆𝐻‡𝐻2𝑂 (from 26 to ~15 kJ mol-1) after
adding Ag to Pt which implies that 𝐻‡𝐻2𝑂2 decreases more than 𝐻‡𝐻2𝑂 relative to the 𝐻𝑀𝐴𝑅𝐼.
These differences appear to be inconsistent with chemically similar active sites catalyzing both
reaction pathways because principles of bond order conservation suggest that the η1 bound
OOH* intermediate that reduces to form H2O2 should be less sensitive to the chemical state of
the η2 bound transition states that cleave O-O bonds to form H2O. These comparisons reflect the
catalytic diversity of sites that exist on the surface of AgPt octahedra during direct synthesis,
which are also apparent in 13CO-12CO exchange experiments (Figure 4.4b). A subset of the
active site ensembles are catalytically modified by the presence of Ag to a greater degree than
those that form H2O. This reasoning suggest that H2O2 forms primarily on Pt monomers or
dimers surrounded by Ag atoms that significantly modify the electronic orbitals of these Pt atoms
by tensile strain, which leads to the decrease of 23 kJ mol-1 in 𝐻‡𝐻2𝑂2. In contrast, larger
oligomers of Pt atoms that are less affected by the presence of Ag (𝐻‡𝐻2𝑂 decreases by only 11
kJ mol-1) catalyze O-O bond rupture and give the observed rates for H2O formation.
4.4 Conclusions
H2O2 and H2O formation rates were measured on Pt nanoparticles and tunable AgPt
octahedra. AgPt cannot form a hydride at the reaction conditions implemented, yet dramatic
H2O2 selectivity differences between Pt (6%) and AgPt (50%) demonstrate that preventing
hydride formation is not a primary reason for the improved selectivities observed on bimetallic
catalysts. AgPt was found to be more selective than Pt and AgPtAr (surface Pt atoms localized at
the corners and edges) was more selective than AgPtCO (even distribution of Ag and Pt surface
atoms). These differences are partially from electronic modification of Pt by the Ag, as indicated
111
by changes in the relative values of ∆𝐻‡𝐻2𝑂2 and ∆𝐻‡𝐻2𝑂 and a red shift in the singleton
frequency of ν(C=O) of adsorbed 13CO. The addition of Ag also slows the rate of exchange
between 13CO and 12CO. The increase in H2O2 selectivities with the addition of Ag, combined
with the observed red shift of the singleton frequency and decreased rates of 13CO-12CO
exchange, strongly suggests that H2O2 and H2O form on distinct active site ensembles and that
the ratio of those that form H2O2 to those that form H2O increase with the addition of Ag. These
combined results show that both electronic modification and changes in the relative number of
sites which form H2O2 and H2O are significant factors for improving H2O2 selectivity in AgPt
catalysts, thereby providing guidance for the design of future direct synthesis catalysts.
112
CHAPTER 5
PdZn NANOPARTICLES AS A SELECTIVE CATALYST FOR THE DIRECT
SYNTHESIS OF H2O2
5.1 Introduction
The direct synthesis of H2O2 (H2 + O2 → H2O2) is a promising alternative to the
industrial standard for H2O2 production, the Riedl-Pfleiderer (RP) process (i.e., the auto-
oxidation of anthraquinones).25 The RP process requires significant infrastructure and energy for
separations and the final concentration of H2O2 to generate 30-70 wt. % solutions that are
transported to the point of use.24 Coupling RP with an oxidation process on site, such as
propylene oxidation (PO) via the HPPO process,196,197 results in a significant decrease in energy
usage (35%).54 Ultimately, this reduces the expense and environmental impact of H2O2 produced
by the RP process because H2O2 is produced on site, reducing concentration and transportation
costs. However RP is only operated at large scales (~2x10⁵ tons H2O2 year-1)20 because of the
need for significant quantities of organic solvent and anthraquinones. As such RP can only be
coupled with another process of a similar scale, such as PO (~3x10⁵ tons propylene oxide
year-1).198 Small scale processes like pulp and paper bleaching,3 wastewater treatment,5 and the
decontamination of chemical warfare agents6 are not operated at large enough scales to cost
effectively use H2O2 made by RP and therefore must rely on other less expensive, yet more
hazardous oxidants such as Cl2.3,4 The direct synthesis of H2O2 is an advantageous alternative to
RP. First, direct synthesis of H2O2 can be implemented at small scales because it can be
performed in water or aqueous alcohol mixtures, eliminating the energy usage associated with
concentration and distribution of H2O2. Second, inexpensive H2O2 will make its industrial use
more widespread, negating the need for hazardous oxidants (e.g., Cl2) which can escape into the
environment and affect environmental health.10,12 Unfortunately the thermodynamically
113
preferred product of direct synthesis on supported transition metal catalysts (e.g., Pd) is
H2O.82,86,145 There are clear benefits to using direct synthesis over RP, and as such significant
research has been conducted on developing catalysts which can achieve H2O2 selectivities
comparable to RP (> 95%).23
Alloying Pd with various transition metals (e.g., Au,65,145,199,200 Sn,72 Zn,72,201 Pt47,67)
increases H2O2 selectivity and has several advantages over the use of mineral acids (e.g.,
H2SO4,65 HCl,89,173 HBr,63,65,86,202 H3PO4
84,202) or halide-containing salts (e.g., KCl,86 NaBr69,84),
which also improve H2O2 selectivity but require downstream separations that increase process
cost. In addition, bimetallic catalysts can provide comparable H2O2 selectivities to those obtained
through the addition of modifiers (e.g., >95% H2O2 selectivity on AuPd82 and PdSn,72 ~95%
H2O2 selectivity on Pd in a solution containing 0.1 M HCl and 0.01 M NaBr63). As a result,
significant H2O2 direct synthesis research has been directed towards bimetallic catalysts. Since
the initial discovery that AuPd is a selective H2O2 direct synthesis catalyst in 2003,65 AuPd has
been shown many times to be the benchmark bimetallic direct synthesis catalyst, which can
obtain H2O2 selectivities and formation rates as high as 98% and 6.4·103 mol H2O2 kgPd-1 h-1,
respectively.82 In comparison, a Pd catalyst in the same system only achieves an H2O2 selectivity
of 42% and a H2O2 formation rate of 1.0·103 mol H2O2 kgPd-1 h-1.82 Recently, H2O2 selectivities
and formation rates as high as 96% and 6.1·103 mol H2O2 kgPd-1 h-1 have been obtained in a
semi-batch reactor using titania supported PdSn catalyst prepared by incipient wetness and
pretreated using alternating reduction and oxidation steps.72 Hutchings and coworkers
demonstrated also that when alloyed with Pd, metals other than Sn (e.g., Ni, Zn, Ga, In, Co) can
eliminate secondary reactions which decompose H2O2 and obtain H2O2 formation rates between
3.0·103 and 6.4·103 mol H2O2 kgPd-1 h-1.72 Work by Zhang et al. has shown PdZn to be a selective
114
direct synthesis catalyst as well (79% H2O2 in a semi-batch reactor and in the presence of 0.03 M
H2SO4).201 These collective findings are highly promising for direct synthesis research because
they show that alloying Pd with metals other than Au can result in high H2O2 selectivity. Yet the
reasons for these selectivity improvements have not been concretely established in these prior
works, thereby motivating the need for a better understanding of the mechanisms behind the
increased selectivities measured on these new bimetallic catalysts. We have recently provided
evidence that AuPd catalysts have higher H2O2 selectivities than Pd primarily because Au
electronically modifies the Pd active sites either by intra-atomic orbital hybridization that affects
the d-band structure of Pd or withdrawal of electron density away from the Pd.174 Similar
analyses must be conducted on these new Pd-M (where M is a common metal such as Sn, Zn, or
Cu) class of catalysts to fully understand the reasons for the high selectivities on these materials.
In this work, we measure steady-state H2O2 and H2O formation rates and H2O2
hydrogenation rates in a plugged-flow reactor on silica-supported Pd and PdxZny (where x and y
denote the bulk molar ratio of Pd to Zn) nanoparticles between 7 and 26 nm. These data,
combined with semi-batch measurements in protic (e.g., methanol) and aprotic (e.g., aprotic)
solvents, show that the likely mechanism for direct synthesis on PdZn nanoparticles is a proton-
electron transfer (PET) mechanism similar to what has been reported on Pd,146 AuPd,174 and
AgPt.203 Increasing the bulk ratio of Zn to Pd results in a concomitant increase in H2O2
selectivity from 26 to 69% between Pd and Pd1Zn30. Comparisons of H2O2 selectivities to X-ray
diffractograms of the Pd and PdxZny samples suggests that these selectivity differences result
primarily from a change in the ratio of nanoparticles with the β1-Pd1Zn1 phase to those with the
face-centered cubic (fcc) structure of Pd within the catalyst, rather than an increase in the ratio of
Zn to Pd within individual nanoparticles. Activation enthalpy (∆𝐻‡) values for H2O2 (∆𝐻‡𝐻2𝑂2)
115
and H2O (∆𝐻‡𝐻2𝑂) formation were calculated from formation rates measured as a function of
temperature and show that increasing the ratio of β1-Pd1Zn1 to fcc-Pd in the catalyst results in
dramatic increases in the values of ∆𝐻‡𝐻2𝑂2 and ∆𝐻‡𝐻2𝑂 (from -3 to 14 kJ mol1 and from 11 to
44 kJ mol-1, respectively) , which shows that the electronic structure of the active sites exposed
on β1-Pd1Zn1 nanoparticles differ significantly from those on Pd nanoparticle surfaces. The
combined results of this work show that PdxZny is more selective towards H2O2 than Pd
primarily from electronic differences and that the highest H2O2 selectivities are obtained by
adding enough Zn to suppress the formation of fcc-Pd nanoparticles. These findings provide
insight into why PdxZny is an effective direct synthesis catalyst, allowing for the rational design
of Pd-M or other selective bimetallic direct synthesis catalysts which use alternatives to Au and
other precious metals.
5.2 Methods and Materials Characterization
5.2.1 Synthesis of Supported Pd and PdxZny catalysts for Steady-State Rate Measurements
The procedure used here for synthesizing SiO2 supported PdxZny nanoparticles was
adapted from a procedure for making PdSn-SnO2 supported on carbon.204 The following
describes the synthesis procedure for the Pd1Zn30 catalyst. All other Pd:Zn metal ratios and metal
loadings were synthesized by adjusting the ratio of Pd and Zn metal precursors and the amount
of SiO2 added. First, 420 mg of ZnCl2 (Sigma-Aldrich, > 98%) was added to 75 cm3 of ethylene
glycol (EG; Fisher Scientific, > 99.8%) which was stirred at 600 rpm with a stir bar. Next, 68 mg
of PdCl2 (Sigma-Aldrich, > 99.9%) was dissolved in 1-2 cm3 of HCl (Macron, 36.5-38%), which
became orange in color once the PdCl2 had dissolved. The PdCl2-HCl solution was then added to
the stirring ZnCl2-EG mixture along with 10 g of SiO2 (Sigma-Aldrich, Davisil 646, 35-60
mesh). Then 25-60 cm3 of a 0.5 M NaOH (Sigma-Aldrich, > 97%) in EG was added in 5 cm3
116
intervals until pH paper measured a pH between 9 and 10. The metal-SiO2 slurry was then heated
to 433 K while stirring at 600 rpm (Thermo Scientific, Super-Nuova) at which point the solution
changed from orange to black, signifying the reduction of the metal cations to nanoclusters. The
solution was held at 433 K for 2 h to ensure complete reduction of the metal cations. The solvent
was separated from the solids by vacuum filtration, which were then rinsed with ~600 cm3 of DI
H2O (17.8 MΩ). The solids were dried for ~12 h at ambient temperature (295 K) before heating
to 673 K at 3 K min-1 under flowing H2 and He (40 kPa H2, 61 kPa He, 150 cm3 min-1). All gases
used were from Airgas and 99.999% pure unless otherwise stated. The catalyst was held at 673 K
for 4 h with intention of reducing any remaining oxidized metal and to remove excess H2O. The
catalyst was sieved to 35-60 mesh to prevent finely ground SiO2 particles from plugging the flow
reactor and causing large pressure drop across the catalyst bed.
Silica supported Pd catalysts were prepared using strong electrostatic adsorption (SEA)
as described previously.98,146 Briefly, 15 g of SiO2 was added to a basic (pH > 11) aqueous
solution containing NH4OH (Macron 28-30 wt. %). Next, 17.4 mg of Pd(NH3)4Cl2 (Sigma-
Aldrich, > 99.99%) was added to the basic solution, which was stirred by hand approximately
every 0.5 h for 3 h. The solids were recovered by vacuum filtration and rinsed with ~500 cm3 of
DI H2O before being allowed to dry at ambient temperature for ~12 h. The solid catalyst was
then heated to 573 K at 3 K min-1 and held at 573 K for 4 h in H2 and He (40 kPa H2, 61 kPa He,
100 cm3 min-1). In order to increase the average diameter of the Pd nanoparticles, the catalyst
was then heated to 973 K at 3 K min-1 and held at 973 K for 4 h in flowing dry (100 cm3 min-1).
A subsequent reduction procedure was conducted at 573 K for 4 h in 100 cm3 min-1 of a 40 kPa
H2 and 61 kPa He mixture.
117
The metal loading of the PdxZny catalysts synthesized for kinetic experiments were kept
low (0.04-0.05 wt. % Pd) in order to avoid mass transport limitations (section A2), however,
higher metal loadings (0.19-1.4 wt. % Pd) are necessary for detectable X-ray diffraction patterns
(section 5.2.2). Therefore, higher metal loading Pd and PdxZny catalysts were prepared using
SEA and EG reduction (respectively) according to the procedure outlined above but with an
increase in the ratio of metal salt to SiO2 in order to obtain the desired metal loading. These high
metal loading catalysts are labeled throughout with the symbol ω in front of the catalyst name
(e.g., ω-Pd1Zn20).
5.2.2 Catalyst Characterization
The metal content of each sample was determined using energy dispersive X-ray
fluorescence (EDXRF) spectroscopy. Briefly, ~30 mg of each catalyst was finely ground and
loaded into a polypropylene sample holder (1 cm diameter) that was sealed with ultralene film.
These were then loaded into a spectrometer (Shimadzu, EDX-7000), whose sample chamber
compartment was purged with He, and measurements were taken between 0-30 keV (100 scans,
co-average) where the relative intensities of the fluorescence features for each element was used
to calculate the percent, by mass, of each component. Results from these measurements can be
found in Table 5.1.
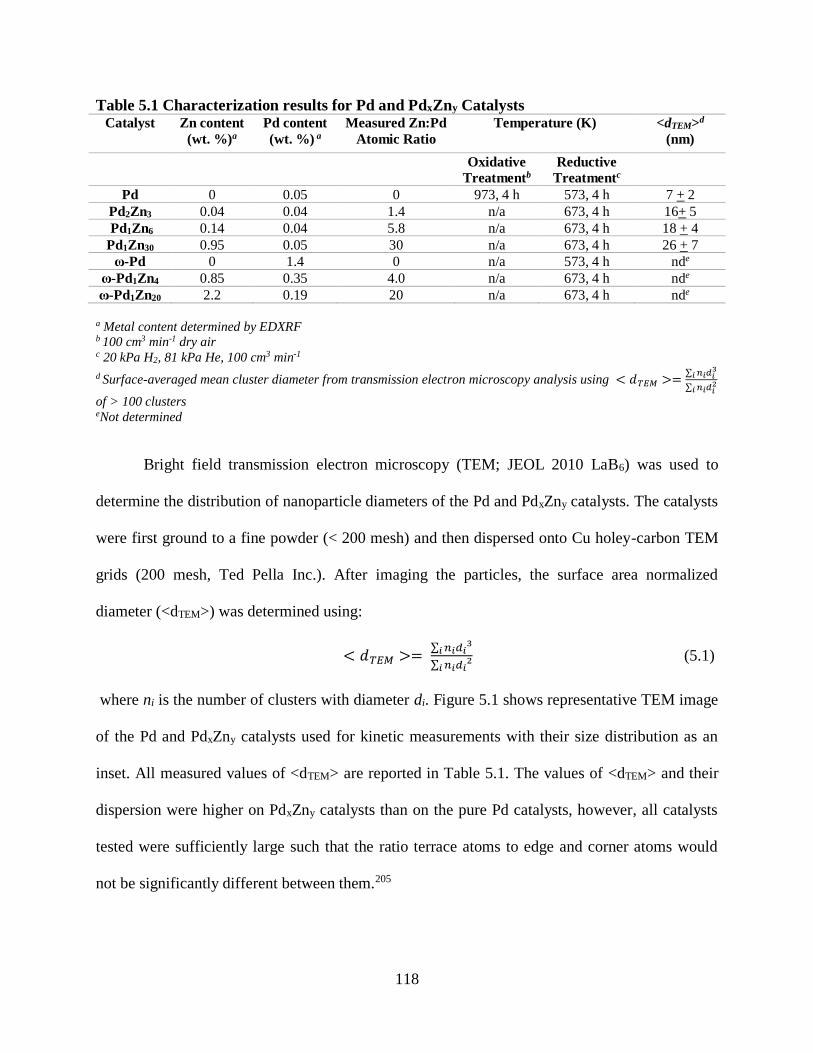
118
Table 5.1 Characterization results for Pd and PdxZny Catalysts Catalyst
Zn content
(wt. %)a
Pd content
(wt. %) a
Measured Zn:Pd
Atomic Ratio
Temperature (K) <dTEM>d
(nm)
Oxidative
Treatmentb
Reductive
Treatmentc
Pd 0 0.05 0 973, 4 h 573, 4 h 7 + 2
Pd2Zn3 0.04 0.04 1.4 n/a 673, 4 h 16+ 5
Pd1Zn6 0.14 0.04 5.8 n/a 673, 4 h 18 + 4
Pd1Zn30 0.95 0.05 30 n/a 673, 4 h 26 + 7
ω-Pd 0 1.4 0 n/a 573, 4 h nde
ω-Pd1Zn4 0.85 0.35 4.0 n/a 673, 4 h nde
ω-Pd1Zn20 2.2 0.19 20 n/a 673, 4 h nde
a Metal content determined by EDXRF b 100 cm3 min-1 dry air c 20 kPa H2, 81 kPa He, 100 cm3 min-1
d Surface-averaged mean cluster diameter from transmission electron microscopy analysis using < 𝑑𝑇𝐸𝑀 >=∑ 𝑛𝑖𝑑𝑖
3𝑖
∑ 𝑛𝑖𝑑𝑖2
𝑖
of > 100 clusters eNot determined
Bright field transmission electron microscopy (TEM; JEOL 2010 LaB6) was used to
determine the distribution of nanoparticle diameters of the Pd and PdxZny catalysts. The catalysts
were first ground to a fine powder (< 200 mesh) and then dispersed onto Cu holey-carbon TEM
grids (200 mesh, Ted Pella Inc.). After imaging the particles, the surface area normalized
diameter (<dTEM>) was determined using:
< 𝑑𝑇𝐸𝑀 >= ∑ 𝑛𝑖𝑑𝑖
3𝑖
∑ 𝑛𝑖𝑑𝑖2
𝑖 (5.1)
where ni is the number of clusters with diameter di. Figure 5.1 shows representative TEM image
of the Pd and PdxZny catalysts used for kinetic measurements with their size distribution as an
inset. All measured values of <dTEM> are reported in Table 5.1. The values of <dTEM> and their
dispersion were higher on PdxZny catalysts than on the pure Pd catalysts, however, all catalysts
tested were sufficiently large such that the ratio terrace atoms to edge and corner atoms would
not be significantly different between them.205

119
Figure 5.1 Representative TEM images of silica supported (a) Pd, (b) Pd2Zn3, (c) Pd1Zn6,
and (d) Pd1Zn30 catalysts with their corresponding size distribution and <dTEM> value as
inset. More than 100 nanoparticles were counted for each for each size distribution.
X-ray diffraction (XRD) was used to determine the bulk crystal structure of the
nanoparticles within each catalyst. X-ray diffractograms were obtained using a diffractometer
(Siemens/Bruker, D5000) with Cu Kα radiation (0.15418 nm) under ambient conditions. Both
the low metal loading and the high metal loading catalysts were measured using XRD, however,
the Pd, Pd2Zn3, and Pd1Zn6 catalysts did not have enough metal to yield measurable diffraction
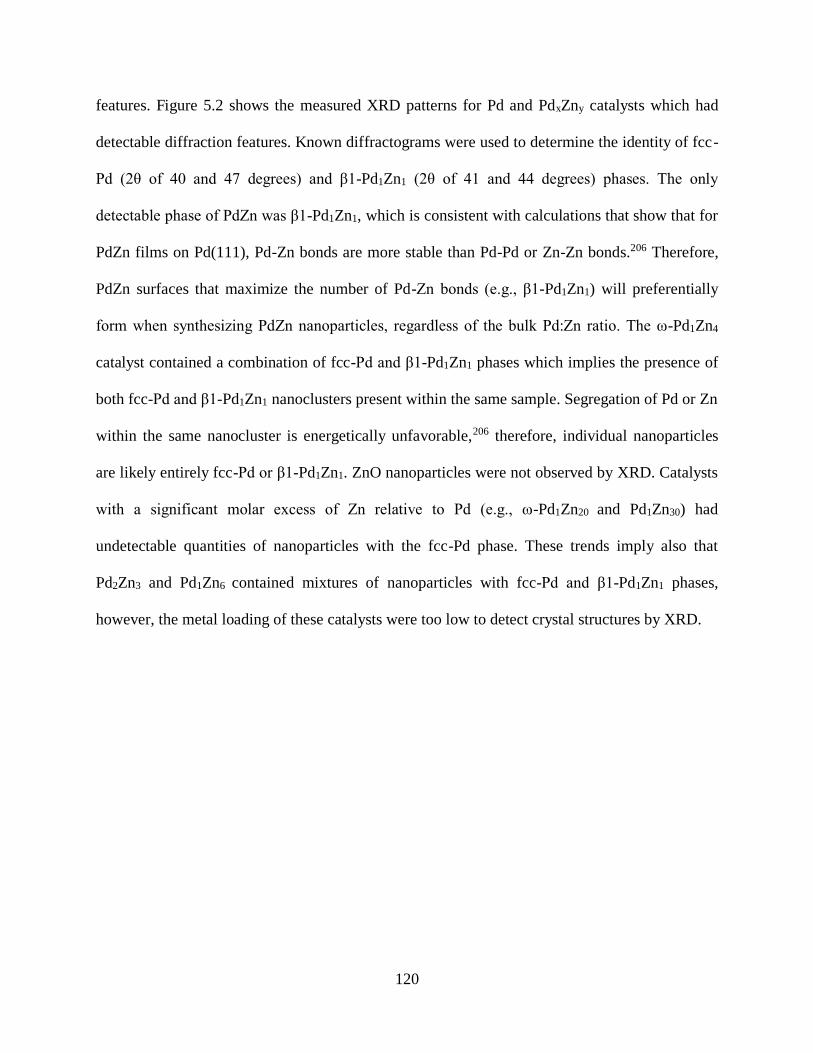
120
features. Figure 5.2 shows the measured XRD patterns for Pd and PdxZny catalysts which had
detectable diffraction features. Known diffractograms were used to determine the identity of fcc-
Pd (2θ of 40 and 47 degrees) and β1-Pd1Zn1 (2θ of 41 and 44 degrees) phases. The only
detectable phase of PdZn was β1-Pd1Zn1, which is consistent with calculations that show that for
PdZn films on Pd(111), Pd-Zn bonds are more stable than Pd-Pd or Zn-Zn bonds.206 Therefore,
PdZn surfaces that maximize the number of Pd-Zn bonds (e.g., β1-Pd1Zn1) will preferentially
form when synthesizing PdZn nanoparticles, regardless of the bulk Pd:Zn ratio. The ω-Pd1Zn4
catalyst contained a combination of fcc-Pd and β1-Pd1Zn1 phases which implies the presence of
both fcc-Pd and β1-Pd1Zn1 nanoclusters present within the same sample. Segregation of Pd or Zn
within the same nanocluster is energetically unfavorable,206 therefore, individual nanoparticles
are likely entirely fcc-Pd or β1-Pd1Zn1. ZnO nanoparticles were not observed by XRD. Catalysts
with a significant molar excess of Zn relative to Pd (e.g., ω-Pd1Zn20 and Pd1Zn30) had
undetectable quantities of nanoparticles with the fcc-Pd phase. These trends imply also that
Pd2Zn3 and Pd1Zn6 contained mixtures of nanoparticles with fcc-Pd and β1-Pd1Zn1 phases,
however, the metal loading of these catalysts were too low to detect crystal structures by XRD.
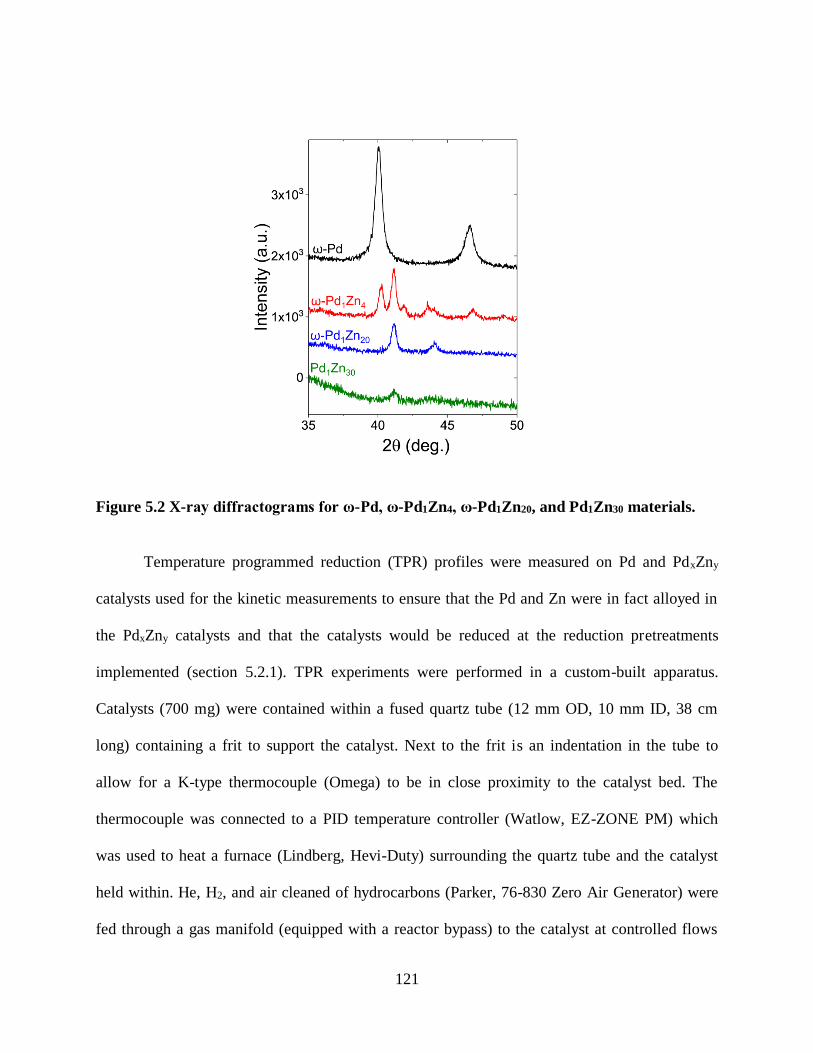
121
Figure 5.2 X-ray diffractograms for ω-Pd, ω-Pd1Zn4, ω-Pd1Zn20, and Pd1Zn30 materials.
Temperature programmed reduction (TPR) profiles were measured on Pd and PdxZny
catalysts used for the kinetic measurements to ensure that the Pd and Zn were in fact alloyed in
the PdxZny catalysts and that the catalysts would be reduced at the reduction pretreatments
implemented (section 5.2.1). TPR experiments were performed in a custom-built apparatus.
Catalysts (700 mg) were contained within a fused quartz tube (12 mm OD, 10 mm ID, 38 cm
long) containing a frit to support the catalyst. Next to the frit is an indentation in the tube to
allow for a K-type thermocouple (Omega) to be in close proximity to the catalyst bed. The
thermocouple was connected to a PID temperature controller (Watlow, EZ-ZONE PM) which
was used to heat a furnace (Lindberg, Hevi-Duty) surrounding the quartz tube and the catalyst
held within. He, H2, and air cleaned of hydrocarbons (Parker, 76-830 Zero Air Generator) were
fed through a gas manifold (equipped with a reactor bypass) to the catalyst at controlled flows
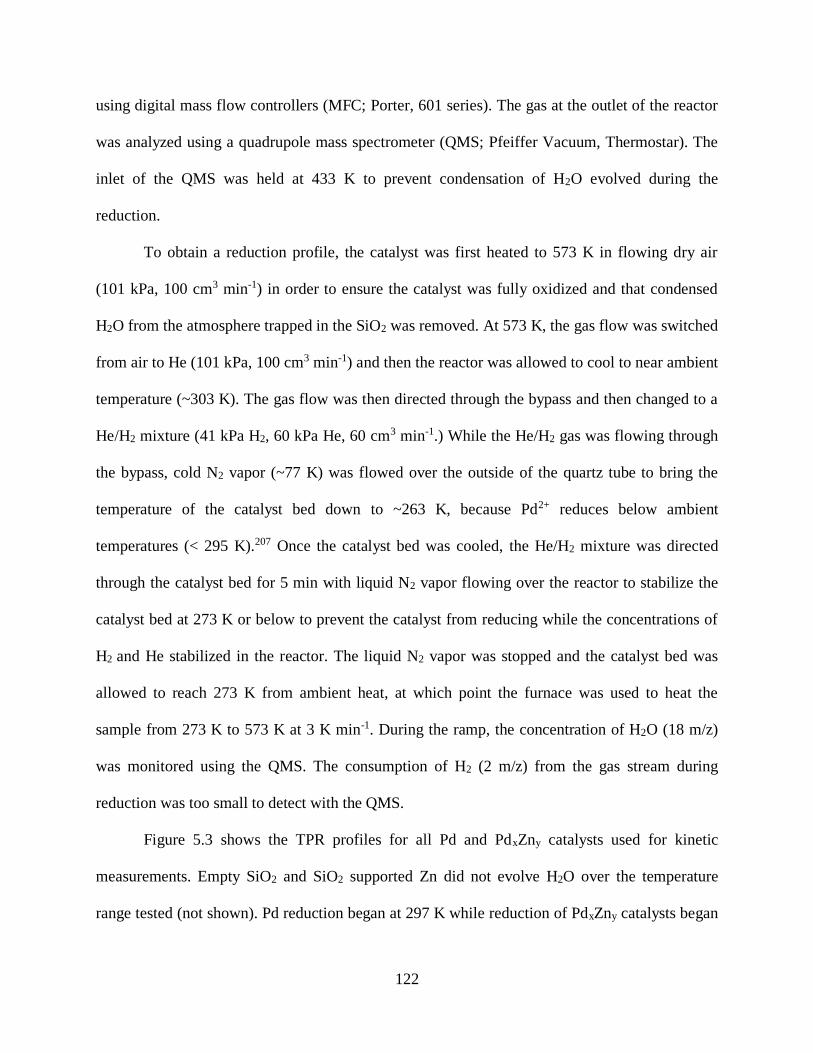
122
using digital mass flow controllers (MFC; Porter, 601 series). The gas at the outlet of the reactor
was analyzed using a quadrupole mass spectrometer (QMS; Pfeiffer Vacuum, Thermostar). The
inlet of the QMS was held at 433 K to prevent condensation of H2O evolved during the
reduction.
To obtain a reduction profile, the catalyst was first heated to 573 K in flowing dry air
(101 kPa, 100 cm3 min-1) in order to ensure the catalyst was fully oxidized and that condensed
H2O from the atmosphere trapped in the SiO2 was removed. At 573 K, the gas flow was switched
from air to He (101 kPa, 100 cm3 min-1) and then the reactor was allowed to cool to near ambient
temperature (~303 K). The gas flow was then directed through the bypass and then changed to a
He/H2 mixture (41 kPa H2, 60 kPa He, 60 cm3 min-1.) While the He/H2 gas was flowing through
the bypass, cold N2 vapor (~77 K) was flowed over the outside of the quartz tube to bring the
temperature of the catalyst bed down to ~263 K, because Pd2+ reduces below ambient
temperatures (< 295 K).207 Once the catalyst bed was cooled, the He/H2 mixture was directed
through the catalyst bed for 5 min with liquid N2 vapor flowing over the reactor to stabilize the
catalyst bed at 273 K or below to prevent the catalyst from reducing while the concentrations of
H2 and He stabilized in the reactor. The liquid N2 vapor was stopped and the catalyst bed was
allowed to reach 273 K from ambient heat, at which point the furnace was used to heat the
sample from 273 K to 573 K at 3 K min-1. During the ramp, the concentration of H2O (18 m/z)
was monitored using the QMS. The consumption of H2 (2 m/z) from the gas stream during
reduction was too small to detect with the QMS.
Figure 5.3 shows the TPR profiles for all Pd and PdxZny catalysts used for kinetic
measurements. Empty SiO2 and SiO2 supported Zn did not evolve H2O over the temperature
range tested (not shown). Pd reduction began at 297 K while reduction of PdxZny catalysts began
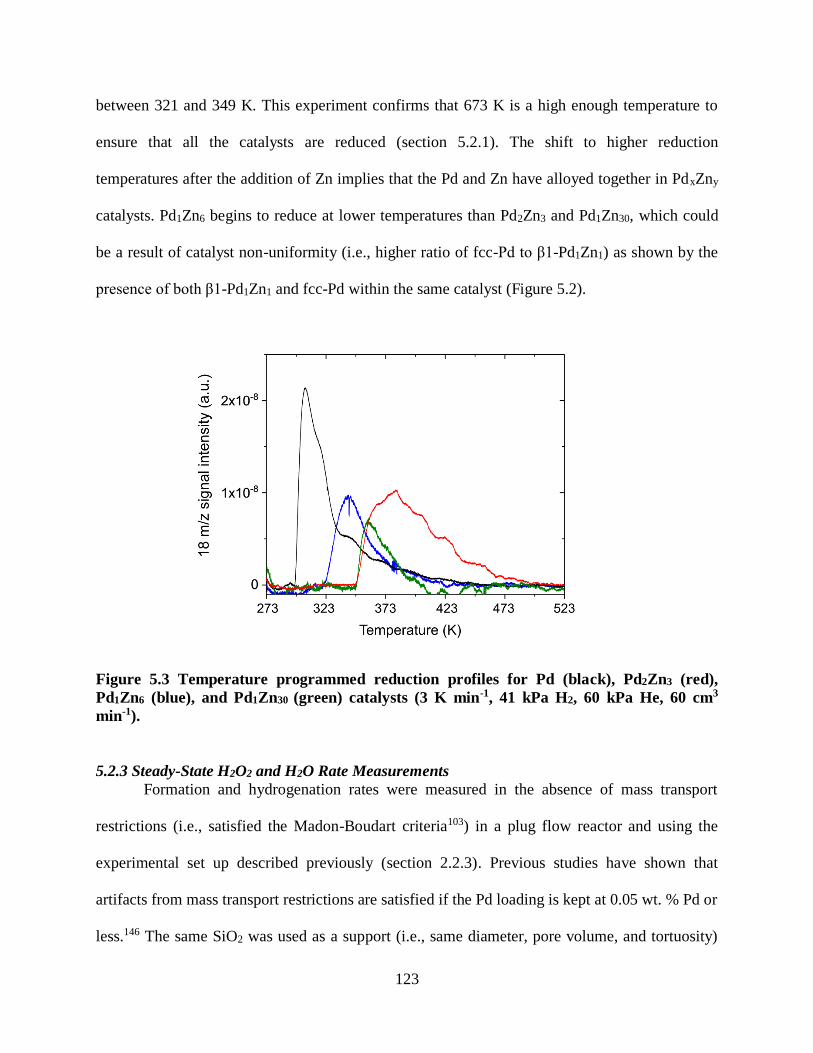
123
between 321 and 349 K. This experiment confirms that 673 K is a high enough temperature to
ensure that all the catalysts are reduced (section 5.2.1). The shift to higher reduction
temperatures after the addition of Zn implies that the Pd and Zn have alloyed together in PdxZny
catalysts. Pd1Zn6 begins to reduce at lower temperatures than Pd2Zn3 and Pd1Zn30, which could
be a result of catalyst non-uniformity (i.e., higher ratio of fcc-Pd to β1-Pd1Zn1) as shown by the
presence of both β1-Pd1Zn1 and fcc-Pd within the same catalyst (Figure 5.2).
Figure 5.3 Temperature programmed reduction profiles for Pd (black), Pd2Zn3 (red),
Pd1Zn6 (blue), and Pd1Zn30 (green) catalysts (3 K min-1, 41 kPa H2, 60 kPa He, 60 cm3
min-1).
5.2.3 Steady-State H2O2 and H2O Rate Measurements
Formation and hydrogenation rates were measured in the absence of mass transport
restrictions (i.e., satisfied the Madon-Boudart criteria103) in a plug flow reactor and using the
experimental set up described previously (section 2.2.3). Previous studies have shown that
artifacts from mass transport restrictions are satisfied if the Pd loading is kept at 0.05 wt. % Pd or
less.146 The same SiO2 was used as a support (i.e., same diameter, pore volume, and tortuosity)
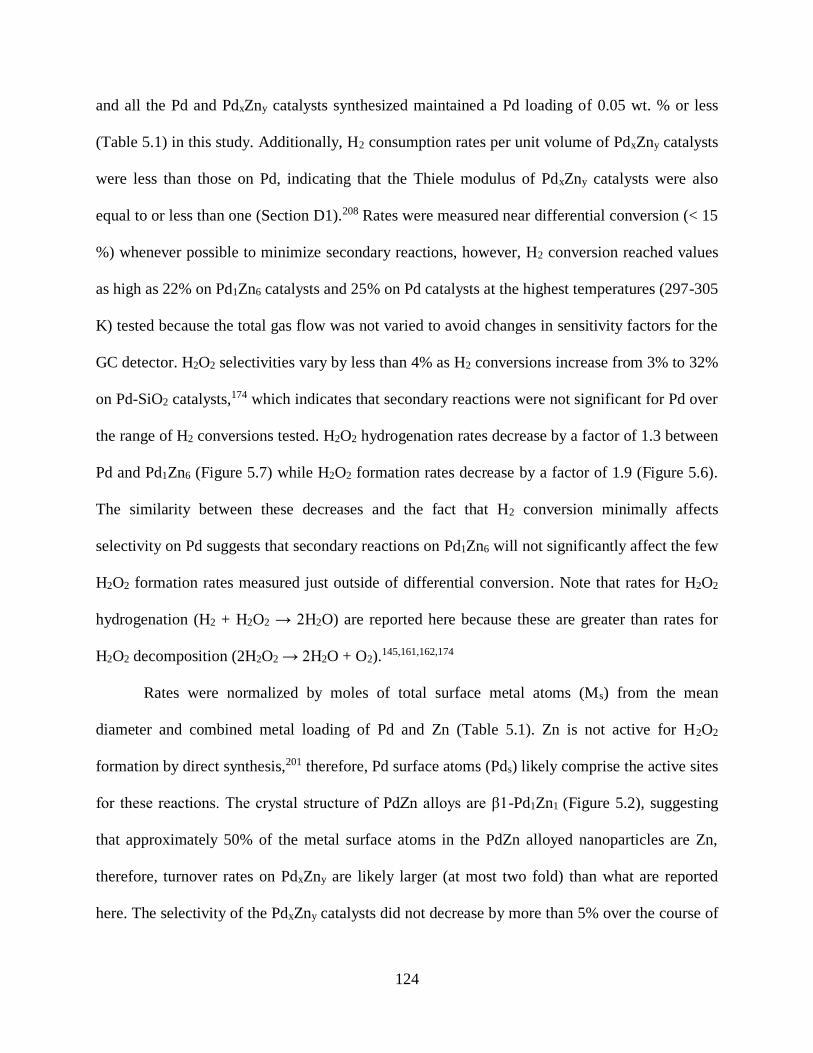
124
and all the Pd and PdxZny catalysts synthesized maintained a Pd loading of 0.05 wt. % or less
(Table 5.1) in this study. Additionally, H2 consumption rates per unit volume of PdxZny catalysts
were less than those on Pd, indicating that the Thiele modulus of PdxZny catalysts were also
equal to or less than one (Section D1).208 Rates were measured near differential conversion (< 15
%) whenever possible to minimize secondary reactions, however, H2 conversion reached values
as high as 22% on Pd1Zn6 catalysts and 25% on Pd catalysts at the highest temperatures (297-305
K) tested because the total gas flow was not varied to avoid changes in sensitivity factors for the
GC detector. H2O2 selectivities vary by less than 4% as H2 conversions increase from 3% to 32%
on Pd-SiO2 catalysts,174 which indicates that secondary reactions were not significant for Pd over
the range of H2 conversions tested. H2O2 hydrogenation rates decrease by a factor of 1.3 between
Pd and Pd1Zn6 (Figure 5.7) while H2O2 formation rates decrease by a factor of 1.9 (Figure 5.6).
The similarity between these decreases and the fact that H2 conversion minimally affects
selectivity on Pd suggests that secondary reactions on Pd1Zn6 will not significantly affect the few
H2O2 formation rates measured just outside of differential conversion. Note that rates for H2O2
hydrogenation (H2 + H2O2 → 2H2O) are reported here because these are greater than rates for
H2O2 decomposition (2H2O2 → 2H2O + O2).145,161,162,174
Rates were normalized by moles of total surface metal atoms (Ms) from the mean
diameter and combined metal loading of Pd and Zn (Table 5.1). Zn is not active for H2O2
formation by direct synthesis,201 therefore, Pd surface atoms (Pds) likely comprise the active sites
for these reactions. The crystal structure of PdZn alloys are β1-Pd1Zn1 (Figure 5.2), suggesting
that approximately 50% of the metal surface atoms in the PdZn alloyed nanoparticles are Zn,
therefore, turnover rates on PdxZny are likely larger (at most two fold) than what are reported
here. The selectivity of the PdxZny catalysts did not decrease by more than 5% over the course of

125
a 36 h period with the exception of Pd1Zn30 which increased by 30% in the first 12 h and Pd2Zn3
which decreased by 20% following the first 24 h (Figure D.1). Rates were measured at times
where the selectivities varied insignificantly. H2O2 formation and H2 consumption rates
decreased between 5 and 25% over (Figure D.1) the course of an experiment (~ 12h), and so
linear corrections for deactivation were performed to account for this.
5.2.4 Steady-State H2O2 Measurements Conducted in a Semi-Batch Reactor
H2O2 formation rates were measured in a protic (methanol) and aprotic (acetonitrile;
Avantor, 99.9%) solvent in a semi-batch reactor configuration described previously.174 Briefly,
80 cm3 of solvent was added to a 100 cm3 three-neck round bottom flask equipped with a
condenser column, followed by the introduction of a reactant gas stream (4.2 kPa H2, 4.2 kPa O2,
92.9 kPa N2) using a variable area rotameter (Omega, FL-1461-S). Reactant gases were
introduced to the solvent for 30 min prior to reaction to allow the solvent to reach steady state
concentrations of H2 and O2. Next 200-300 mg of catalyst, which had been ground to a fine
powder (> 200 mesh), was added to the flask to initiate the reaction. The reaction was allowed to
proceed under continuous stirring and at ambient temperature (~295 K) for 2 h. Liquid samples
(~0.5 cm3) were collected every 5-30 minutes with a filtered syringe to prevent contamination of
the sample by the catalyst. The H2O2 concentration of each liquid sample was determined using
the colorimetric titration procedure described previously (Section 2.2.3).
5.3 Results and Discussion
5.3.1. Steady-State Formation Rates and Determination of Reaction Mechanism
Figure 5.4 shows steady-state H2O2 (Fig. 5.4a) and H2O (Fig. 5.4b) formation turnover
rates as a function of H2 pressure ((H2)) on Pd, Pd1Zn6, and Pd1Zn30 catalysts (25-400 kPa H2, 60
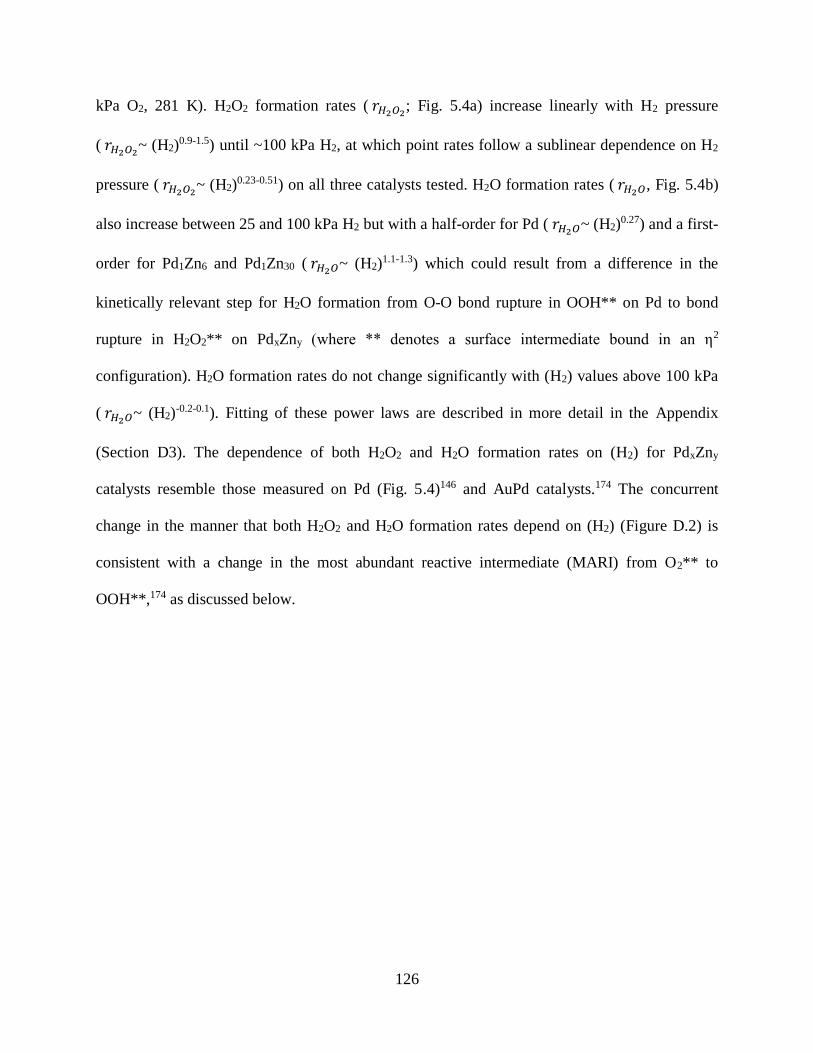
126
kPa O2, 281 K). H2O2 formation rates ( 𝑟𝐻2𝑂2; Fig. 5.4a) increase linearly with H2 pressure
( 𝑟𝐻2𝑂2~ (H2)0.9-1.5) until ~100 kPa H2, at which point rates follow a sublinear dependence on H2
pressure ( 𝑟𝐻2𝑂2~ (H2)0.23-0.51) on all three catalysts tested. H2O formation rates ( 𝑟𝐻2𝑂, Fig. 5.4b)
also increase between 25 and 100 kPa H2 but with a half-order for Pd ( 𝑟𝐻2𝑂~ (H2)0.27) and a first-
order for Pd1Zn6 and Pd1Zn30 ( 𝑟𝐻2𝑂~ (H2)1.1-1.3) which could result from a difference in the
kinetically relevant step for H2O formation from O-O bond rupture in OOH** on Pd to bond
rupture in H2O2** on PdxZny (where ** denotes a surface intermediate bound in an η2
configuration). H2O formation rates do not change significantly with (H2) values above 100 kPa
( 𝑟𝐻2𝑂~ (H2)-0.2-0.1). Fitting of these power laws are described in more detail in the Appendix
(Section D3). The dependence of both H2O2 and H2O formation rates on (H2) for PdxZny
catalysts resemble those measured on Pd (Fig. 5.4)146 and AuPd catalysts.174 The concurrent
change in the manner that both H2O2 and H2O formation rates depend on (H2) (Figure D.2) is
consistent with a change in the most abundant reactive intermediate (MARI) from O2** to
OOH**,174 as discussed below.
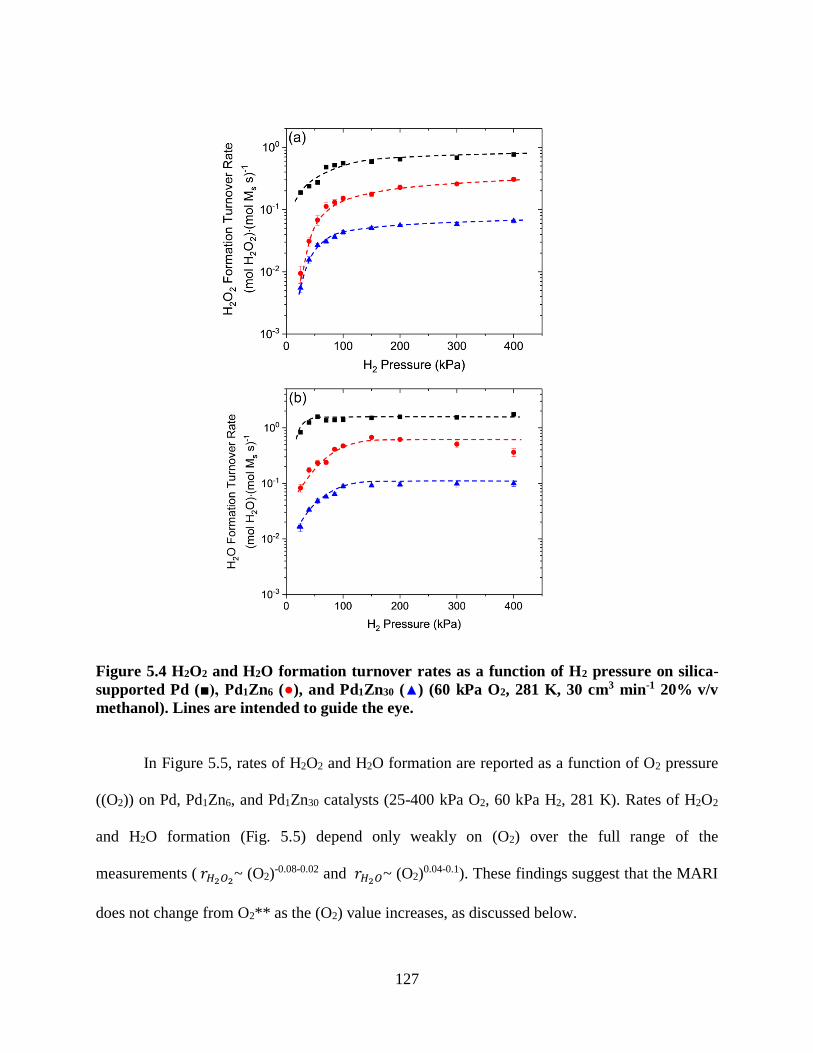
127
Figure 5.4 H2O2 and H2O formation turnover rates as a function of H2 pressure on silica-
supported Pd (■), Pd1Zn6 (●), and Pd1Zn30 (▲) (60 kPa O2, 281 K, 30 cm3 min-1 20% v/v
methanol). Lines are intended to guide the eye.
In Figure 5.5, rates of H2O2 and H2O formation are reported as a function of O2 pressure
((O2)) on Pd, Pd1Zn6, and Pd1Zn30 catalysts (25-400 kPa O2, 60 kPa H2, 281 K). Rates of H2O2
and H2O formation (Fig. 5.5) depend only weakly on (O2) over the full range of the
measurements ( 𝑟𝐻2𝑂2~ (O2)-0.08-0.02 and 𝑟𝐻2𝑂~ (O2)
0.04-0.1). These findings suggest that the MARI
does not change from O2** as the (O2) value increases, as discussed below.
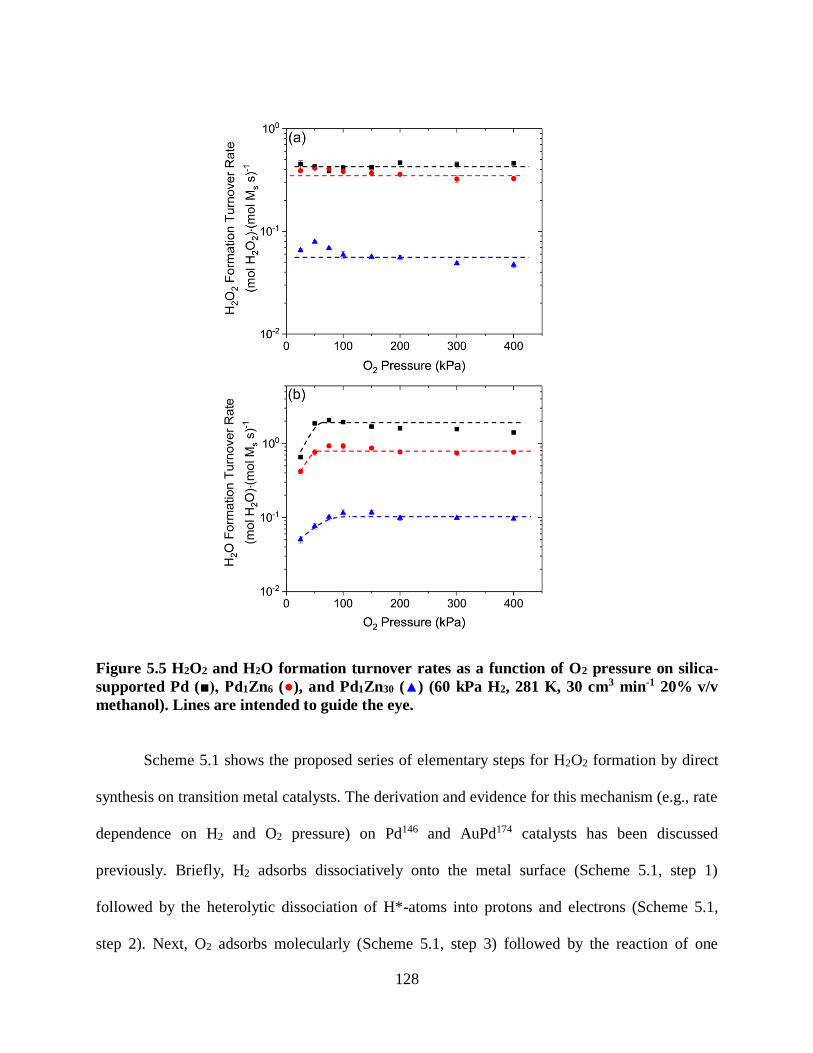
128
Figure 5.5 H2O2 and H2O formation turnover rates as a function of O2 pressure on silica-
supported Pd (■), Pd1Zn6 (●), and Pd1Zn30 (▲) (60 kPa H2, 281 K, 30 cm3 min-1 20% v/v
methanol). Lines are intended to guide the eye.
Scheme 5.1 shows the proposed series of elementary steps for H2O2 formation by direct
synthesis on transition metal catalysts. The derivation and evidence for this mechanism (e.g., rate
dependence on H2 and O2 pressure) on Pd146 and AuPd174 catalysts has been discussed
previously. Briefly, H2 adsorbs dissociatively onto the metal surface (Scheme 5.1, step 1)
followed by the heterolytic dissociation of H*-atoms into protons and electrons (Scheme 5.1,
step 2). Next, O2 adsorbs molecularly (Scheme 5.1, step 3) followed by the reaction of one

129
proton-electron pair with O2** to form OOH** (Scheme 5.1, step 4). Then, the kinetically
relevant addition of a proton-electron to OOH** occurs, resulting in the formation of H2O2**
(Scheme 5.1, step 5). Last H2O2** desorbs from the surface into the solution (Scheme 5.1, step
6). A rate expression for H2O2 formation was derived by applying the pseudo-steady state
hypothesis to the reactive intermediates of these elementary steps and performing several
substitutions following a total site balance146 (Section B5):
:
𝑟𝐻2𝑂2
[𝐿]=
𝑘5𝐾4𝐾3𝐾22𝐾1(𝐻2)(𝑂2)
1+𝐾3(𝑂2)+𝐾4𝐾3𝐾2𝐾112(𝐻2)
12(𝑂2)+
1
𝐾6(𝐻2𝑂2)
(5.2)
where [L] is the total number of sites, (H2O2) is the liquid-phase concentration of H2O2, and kx
and Kx are the rate and equilibrium constants for elementary step x. The weak dependence of
H2O2 formation turnover rates on (O2) (Fig. 5.5a) suggests the MARI contains molecular O2
(e.g., O2** or OOH**). If the MARI is O2**, equation 5.2 simplifies to:
𝑟𝐻2𝑂2
[𝐿]= 𝑘5𝐾4𝐾2
2𝐾1(𝐻2) (5.3)
Equation 5.3 is qualitatively consistent with measured trends in H2O2 over all (O2) values tested
(Figure 5.5a) and low (H2) values (Figure 5.4a, 25-80 kPa H2) for Pd and PdxZny catalysts. If the
MARI was instead OOH**, equation 5.2 becomes:
𝑟𝐻2𝑂2
[𝐿]= 𝑘5𝐾2𝐾1
1
2(𝐻2)1
2 (5.4)
The half-order dependence on (H2) in equation 5.4 is consistent with the sub-linear dependence
on (H2) above 80 kPa H2 in Figure 5.4a, implying that the MARI changes from O2** to OOH**
at sufficiently high (H2) values. These H2O2 dependencies on (H2) and (O2) for PdxZny catalysts
(Figures 5.4a and 5.5a) strongly resemble those for Pd146 and AuPd174 which likely form H2O2 by
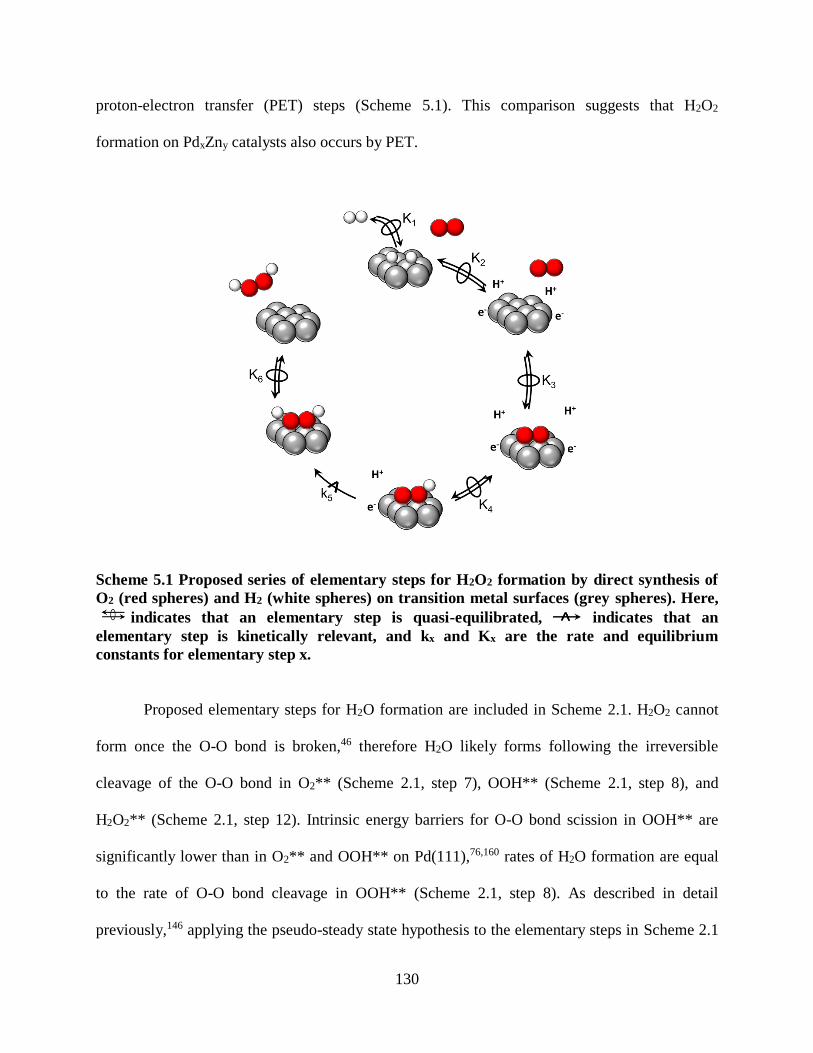
130
proton-electron transfer (PET) steps (Scheme 5.1). This comparison suggests that H2O2
formation on PdxZny catalysts also occurs by PET.
Scheme 5.1 Proposed series of elementary steps for H2O2 formation by direct synthesis of
O2 (red spheres) and H2 (white spheres) on transition metal surfaces (grey spheres). Here,
indicates that an elementary step is quasi-equilibrated, indicates that an
elementary step is kinetically relevant, and kx and Kx are the rate and equilibrium
constants for elementary step x.
Proposed elementary steps for H2O formation are included in Scheme 2.1. H2O2 cannot
form once the O-O bond is broken,46 therefore H2O likely forms following the irreversible
cleavage of the O-O bond in O2** (Scheme 2.1, step 7), OOH** (Scheme 2.1, step 8), and
H2O2** (Scheme 2.1, step 12). Intrinsic energy barriers for O-O bond scission in OOH** are
significantly lower than in O2** and OOH** on Pd(111),76,160 rates of H2O formation are equal
to the rate of O-O bond cleavage in OOH** (Scheme 2.1, step 8). As described in detail
previously,146 applying the pseudo-steady state hypothesis to the elementary steps in Scheme 2.1
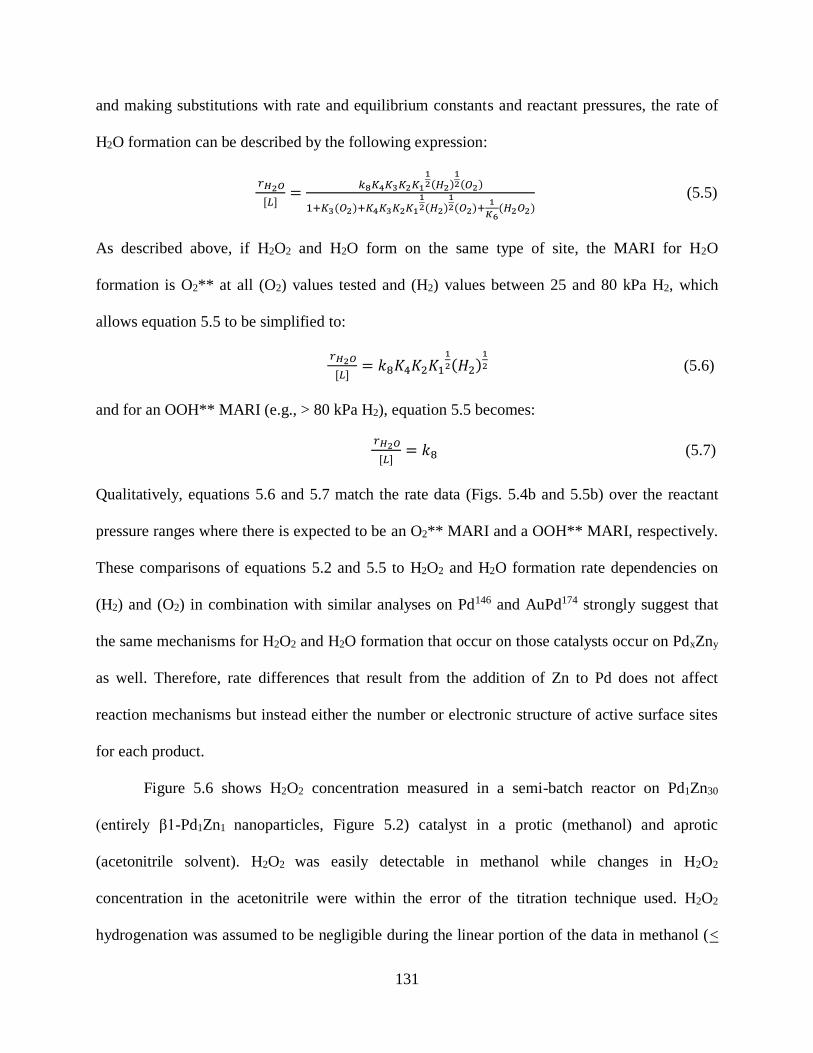
131
and making substitutions with rate and equilibrium constants and reactant pressures, the rate of
H2O formation can be described by the following expression:
𝑟𝐻2𝑂
[𝐿]=
𝑘8𝐾4𝐾3𝐾2𝐾112(𝐻2)
12(𝑂2)
1+𝐾3(𝑂2)+𝐾4𝐾3𝐾2𝐾112(𝐻2)
12(𝑂2)+
1
𝐾6(𝐻2𝑂2)
(5.5)
As described above, if H2O2 and H2O form on the same type of site, the MARI for H2O
formation is O2** at all (O2) values tested and (H2) values between 25 and 80 kPa H2, which
allows equation 5.5 to be simplified to:
𝑟𝐻2𝑂
[𝐿]= 𝑘8𝐾4𝐾2𝐾1
1
2(𝐻2)1
2 (5.6)
and for an OOH** MARI (e.g., > 80 kPa H2), equation 5.5 becomes:
𝑟𝐻2𝑂
[𝐿]= 𝑘8 (5.7)
Qualitatively, equations 5.6 and 5.7 match the rate data (Figs. 5.4b and 5.5b) over the reactant
pressure ranges where there is expected to be an O2** MARI and a OOH** MARI, respectively.
These comparisons of equations 5.2 and 5.5 to H2O2 and H2O formation rate dependencies on
(H2) and (O2) in combination with similar analyses on Pd146 and AuPd174 strongly suggest that
the same mechanisms for H2O2 and H2O formation that occur on those catalysts occur on PdxZny
as well. Therefore, rate differences that result from the addition of Zn to Pd does not affect
reaction mechanisms but instead either the number or electronic structure of active surface sites
for each product.
Figure 5.6 shows H2O2 concentration measured in a semi-batch reactor on Pd1Zn30
(entirely β1-Pd1Zn1 nanoparticles, Figure 5.2) catalyst in a protic (methanol) and aprotic
(acetonitrile solvent). H2O2 was easily detectable in methanol while changes in H2O2
concentration in the acetonitrile were within the error of the titration technique used. H2O2
hydrogenation was assumed to be negligible during the linear portion of the data in methanol (<
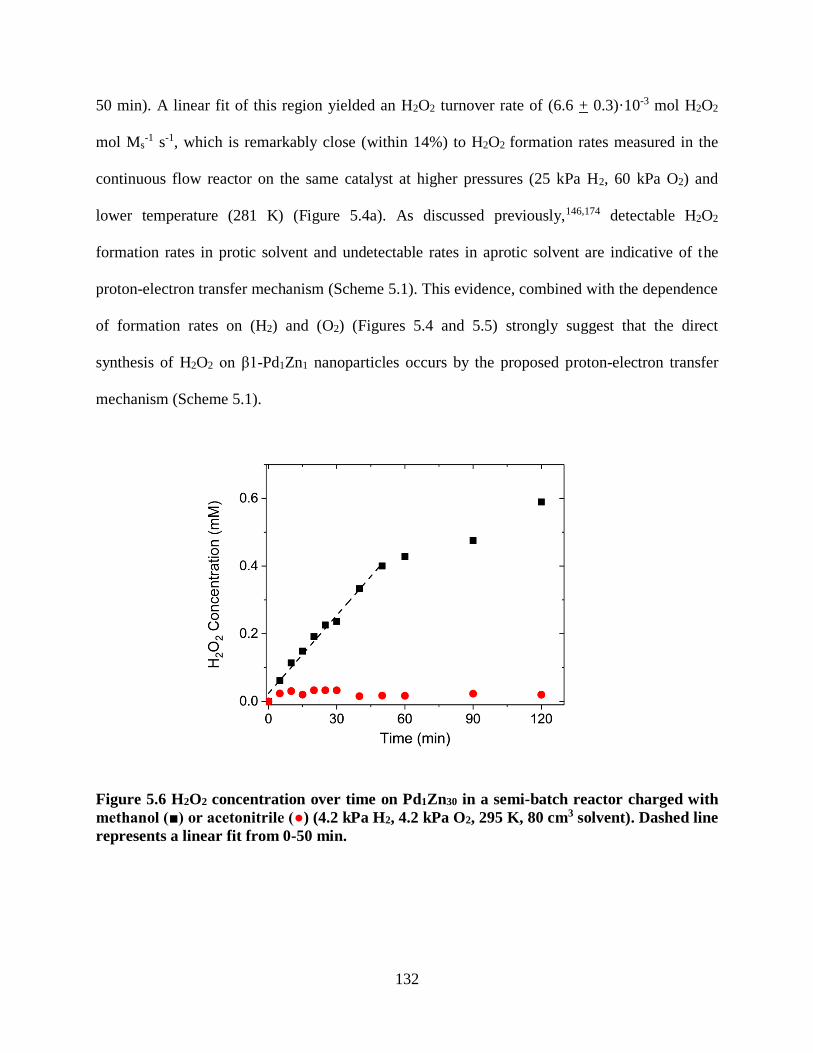
132
50 min). A linear fit of this region yielded an H2O2 turnover rate of (6.6 + 0.3)·10-3 mol H2O2
mol Ms-1 s-1, which is remarkably close (within 14%) to H2O2 formation rates measured in the
continuous flow reactor on the same catalyst at higher pressures (25 kPa H2, 60 kPa O2) and
lower temperature (281 K) (Figure 5.4a). As discussed previously,146,174 detectable H2O2
formation rates in protic solvent and undetectable rates in aprotic solvent are indicative of the
proton-electron transfer mechanism (Scheme 5.1). This evidence, combined with the dependence
of formation rates on (H2) and (O2) (Figures 5.4 and 5.5) strongly suggest that the direct
synthesis of H2O2 on β1-Pd1Zn1 nanoparticles occurs by the proposed proton-electron transfer
mechanism (Scheme 5.1).
Figure 5.6 H2O2 concentration over time on Pd1Zn30 in a semi-batch reactor charged with
methanol (■) or acetonitrile (●) (4.2 kPa H2, 4.2 kPa O2, 295 K, 80 cm3 solvent). Dashed line
represents a linear fit from 0-50 min.
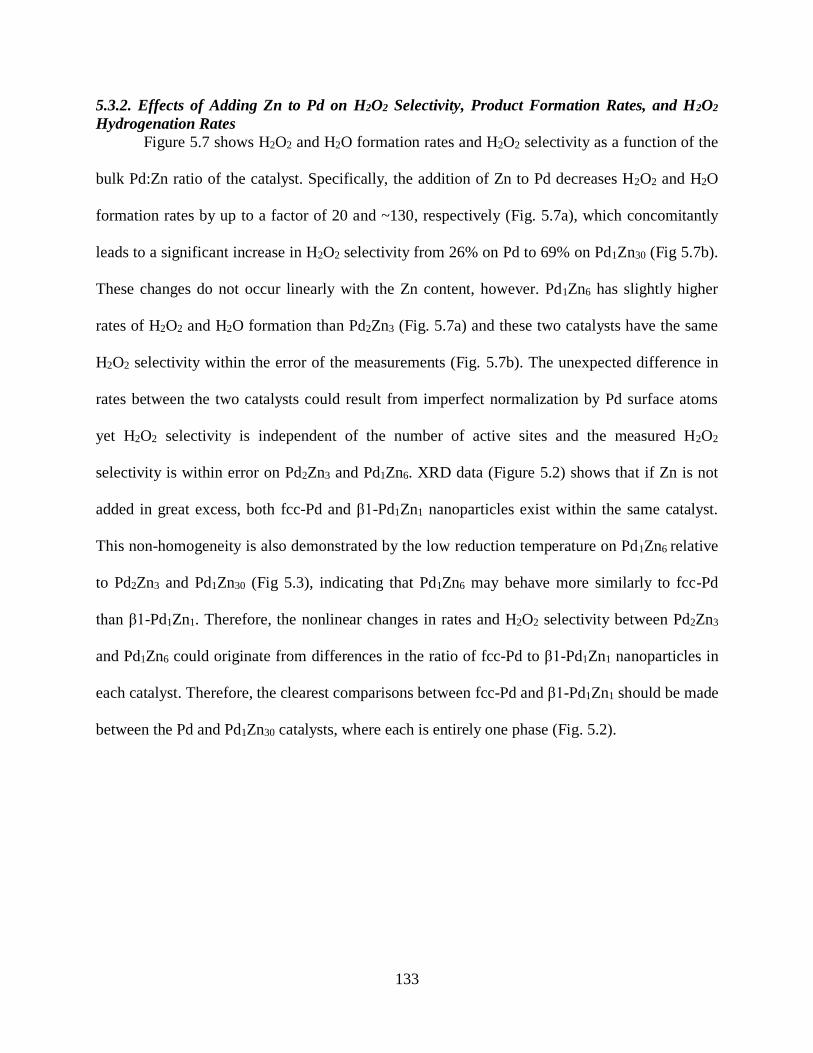
133
5.3.2. Effects of Adding Zn to Pd on H2O2 Selectivity, Product Formation Rates, and H2O2
Hydrogenation Rates
Figure 5.7 shows H2O2 and H2O formation rates and H2O2 selectivity as a function of the
bulk Pd:Zn ratio of the catalyst. Specifically, the addition of Zn to Pd decreases H2O2 and H2O
formation rates by up to a factor of 20 and ~130, respectively (Fig. 5.7a), which concomitantly
leads to a significant increase in H2O2 selectivity from 26% on Pd to 69% on Pd1Zn30 (Fig 5.7b).
These changes do not occur linearly with the Zn content, however. Pd1Zn6 has slightly higher
rates of H2O2 and H2O formation than Pd2Zn3 (Fig. 5.7a) and these two catalysts have the same
H2O2 selectivity within the error of the measurements (Fig. 5.7b). The unexpected difference in
rates between the two catalysts could result from imperfect normalization by Pd surface atoms
yet H2O2 selectivity is independent of the number of active sites and the measured H2O2
selectivity is within error on Pd2Zn3 and Pd1Zn6. XRD data (Figure 5.2) shows that if Zn is not
added in great excess, both fcc-Pd and β1-Pd1Zn1 nanoparticles exist within the same catalyst.
This non-homogeneity is also demonstrated by the low reduction temperature on Pd1Zn6 relative
to Pd2Zn3 and Pd1Zn30 (Fig 5.3), indicating that Pd1Zn6 may behave more similarly to fcc-Pd
than β1-Pd1Zn1. Therefore, the nonlinear changes in rates and H2O2 selectivity between Pd2Zn3
and Pd1Zn6 could originate from differences in the ratio of fcc-Pd to β1-Pd1Zn1 nanoparticles in
each catalyst. Therefore, the clearest comparisons between fcc-Pd and β1-Pd1Zn1 should be made
between the Pd and Pd1Zn30 catalysts, where each is entirely one phase (Fig. 5.2).

134
Figure 5.7 (a) H2O2 (black) and H2O (red) formation turnover rates and (b) H2O2
selectivity on different Pd and PdxZny catalysts (55 kPa H2, 60 kPa O2, 273 K, 30 cm3 min-1
20% v/v methanol).
H2O2 hydrogenation rates decreased by a factor of 8 between Pd and Pd1Zn30 catalysts
(Figure 5.8), demonstrating that adding Zn increases H2O2 selectivity by decreasing secondary
reactions. However, this decrease in H2O2 hydrogenation rates are much less significant than the
factor of 20 increase in H2O2 formation rates and the factor of 128 decrease in H2O formation
rates. Therefore, while the suppression of secondary reactions is a measurable benefit of adding
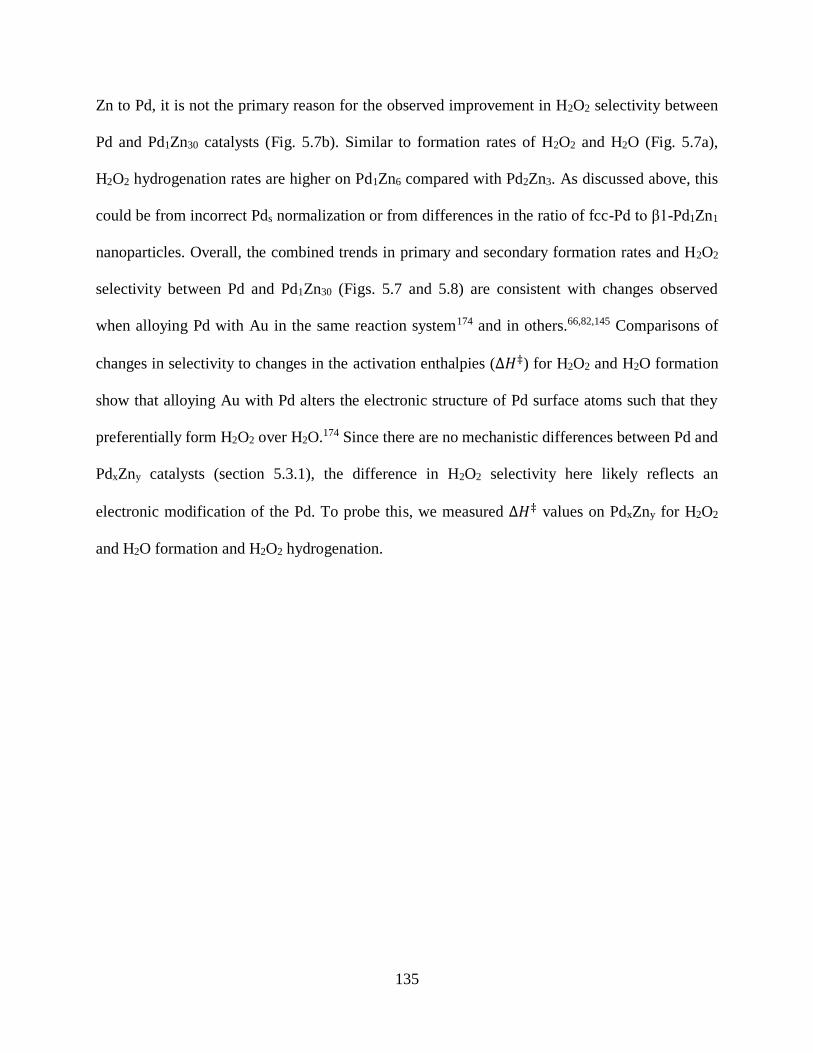
135
Zn to Pd, it is not the primary reason for the observed improvement in H2O2 selectivity between
Pd and Pd1Zn30 catalysts (Fig. 5.7b). Similar to formation rates of H2O2 and H2O (Fig. 5.7a),
H2O2 hydrogenation rates are higher on Pd1Zn6 compared with Pd2Zn3. As discussed above, this
could be from incorrect Pds normalization or from differences in the ratio of fcc-Pd to β1-Pd1Zn1
nanoparticles. Overall, the combined trends in primary and secondary formation rates and H2O2
selectivity between Pd and Pd1Zn30 (Figs. 5.7 and 5.8) are consistent with changes observed
when alloying Pd with Au in the same reaction system174 and in others.66,82,145 Comparisons of
changes in selectivity to changes in the activation enthalpies (∆𝐻‡) for H2O2 and H2O formation
show that alloying Au with Pd alters the electronic structure of Pd surface atoms such that they
preferentially form H2O2 over H2O.174 Since there are no mechanistic differences between Pd and
PdxZny catalysts (section 5.3.1), the difference in H2O2 selectivity here likely reflects an
electronic modification of the Pd. To probe this, we measured ∆𝐻‡ values on PdxZny for H2O2
and H2O formation and H2O2 hydrogenation.
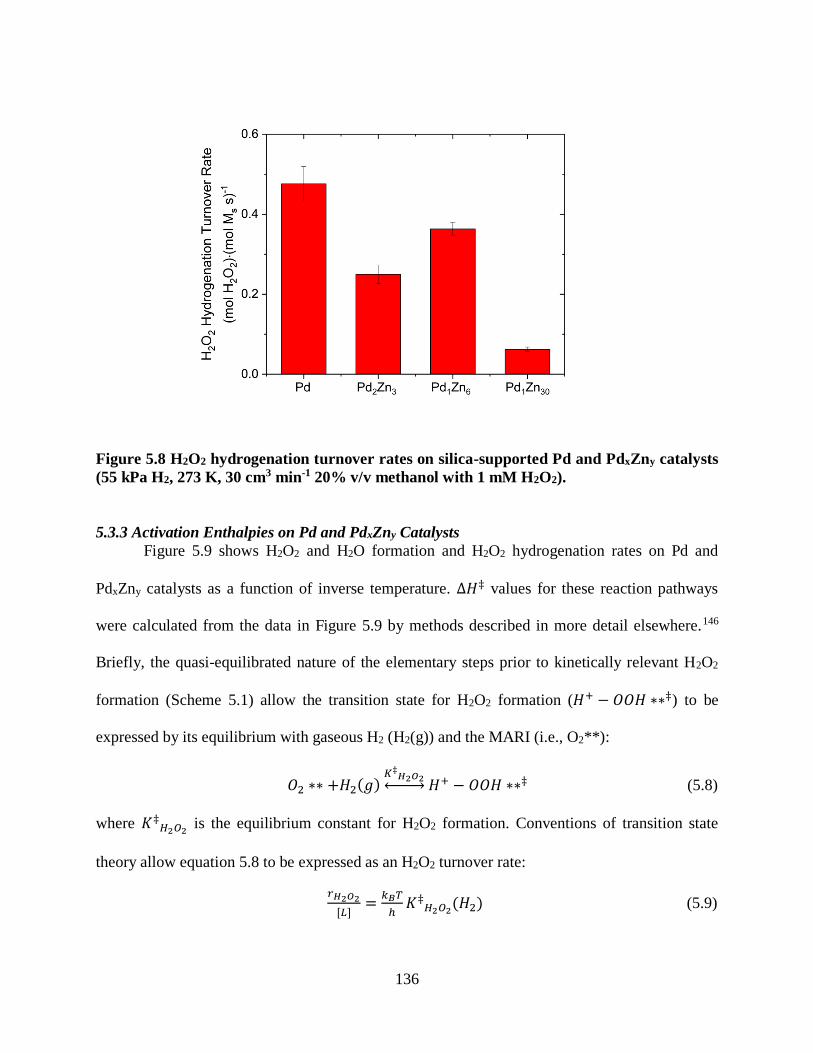
136
Figure 5.8 H2O2 hydrogenation turnover rates on silica-supported Pd and PdxZny catalysts
(55 kPa H2, 273 K, 30 cm3 min-1 20% v/v methanol with 1 mM H2O2).
5.3.3 Activation Enthalpies on Pd and PdxZny Catalysts
Figure 5.9 shows H2O2 and H2O formation and H2O2 hydrogenation rates on Pd and
PdxZny catalysts as a function of inverse temperature. ∆𝐻‡ values for these reaction pathways
were calculated from the data in Figure 5.9 by methods described in more detail elsewhere.146
Briefly, the quasi-equilibrated nature of the elementary steps prior to kinetically relevant H2O2
formation (Scheme 5.1) allow the transition state for H2O2 formation (𝐻+ − 𝑂𝑂𝐻 ∗∗‡) to be
expressed by its equilibrium with gaseous H2 (H2(g)) and the MARI (i.e., O2**):
𝑂2 ∗∗ +𝐻2(𝑔)𝐾‡𝐻2𝑂2↔ 𝐻+ − 𝑂𝑂𝐻 ∗∗‡ (5.8)
where 𝐾‡𝐻2𝑂2 is the equilibrium constant for H2O2 formation. Conventions of transition state
theory allow equation 5.8 to be expressed as an H2O2 turnover rate:
𝑟𝐻2𝑂2
[𝐿]=𝑘𝐵𝑇
ℎ𝐾‡𝐻2𝑂2(𝐻2) (5.9)

137
where T is the temperature in Kelvin, and kB and h are Boltzmann’s and Planck’s constants,
respectively. Similar arguments allow H2O formation turnover rates to be expressed in terms of
an equilibrium constant (section A10). Transition state theory is then used to express 𝐾‡𝐻2𝑂2 in
terms of the change in Gibb’s free energy (∆𝐺‡). Values of the ∆𝐻‡ and the activation entropy
(∆𝑆‡) were calculated from ∆𝐺‡ using the relationship between these properties (∆𝐺‡ = ∆𝐻‡ −
𝑇∆𝑆‡).
Figure 5.9 (a) H2O2 and (b) H2O formation and (c) H2O2 hydrogenation turnover rates as a
function of inverse temperature on Pd (■), Pd2Zn3 (●), Pd1Zn6 (▲), and Pd1Zn30 (♦) (55 kPa
H2, 60 kPa O2, 273-305 K, 30 cm3 min-1 20% v/v methanol for formation rates; 55 kPa H2,
273-305 K, 30 cm3 min-1 20% v/v methanol with 1 mM H2O2 for H2O2 hydrogenation
rates). Dashed lines represent an exponential fit to the data.
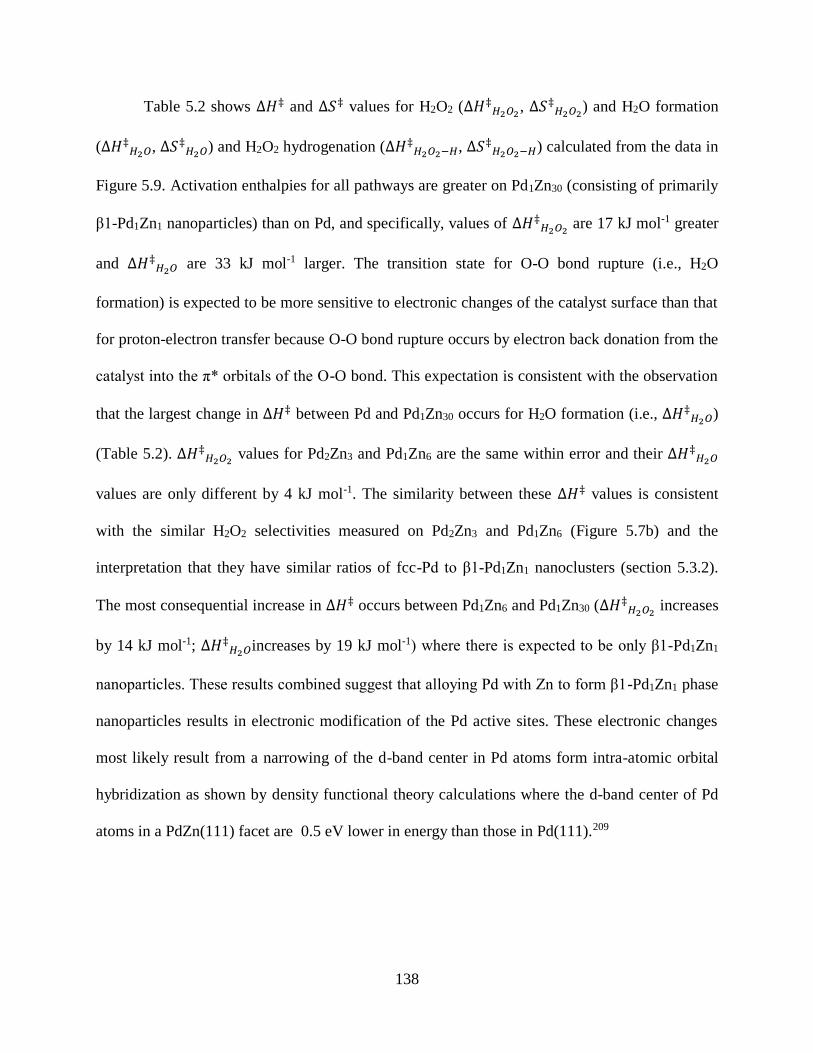
138
Table 5.2 shows ∆𝐻‡ and ∆𝑆‡ values for H2O2 (∆𝐻‡𝐻2𝑂2, ∆𝑆‡𝐻2𝑂2) and H2O formation
(∆𝐻‡𝐻2𝑂, ∆𝑆‡𝐻2𝑂) and H2O2 hydrogenation (∆𝐻‡𝐻2𝑂2−𝐻, ∆𝑆‡𝐻2𝑂2−𝐻) calculated from the data in
Figure 5.9. Activation enthalpies for all pathways are greater on Pd1Zn30 (consisting of primarily
β1-Pd1Zn1 nanoparticles) than on Pd, and specifically, values of ∆𝐻‡𝐻2𝑂2 are 17 kJ mol-1 greater
and ∆𝐻‡𝐻2𝑂 are 33 kJ mol-1 larger. The transition state for O-O bond rupture (i.e., H2O
formation) is expected to be more sensitive to electronic changes of the catalyst surface than that
for proton-electron transfer because O-O bond rupture occurs by electron back donation from the
catalyst into the π* orbitals of the O-O bond. This expectation is consistent with the observation
that the largest change in ∆𝐻‡ between Pd and Pd1Zn30 occurs for H2O formation (i.e., ∆𝐻‡𝐻2𝑂)
(Table 5.2). ∆𝐻‡𝐻2𝑂2 values for Pd2Zn3 and Pd1Zn6 are the same within error and their ∆𝐻‡𝐻2𝑂
values are only different by 4 kJ mol-1. The similarity between these ∆𝐻‡ values is consistent
with the similar H2O2 selectivities measured on Pd2Zn3 and Pd1Zn6 (Figure 5.7b) and the
interpretation that they have similar ratios of fcc-Pd to β1-Pd1Zn1 nanoclusters (section 5.3.2).
The most consequential increase in ∆𝐻‡ occurs between Pd1Zn6 and Pd1Zn30 (∆𝐻‡𝐻2𝑂2 increases
by 14 kJ mol-1; ∆𝐻‡𝐻2𝑂increases by 19 kJ mol-1) where there is expected to be only β1-Pd1Zn1
nanoparticles. These results combined suggest that alloying Pd with Zn to form β1-Pd1Zn1 phase
nanoparticles results in electronic modification of the Pd active sites. These electronic changes
most likely result from a narrowing of the d-band center in Pd atoms form intra-atomic orbital
hybridization as shown by density functional theory calculations where the d-band center of Pd
atoms in a PdZn(111) facet are 0.5 eV lower in energy than those in Pd(111).209
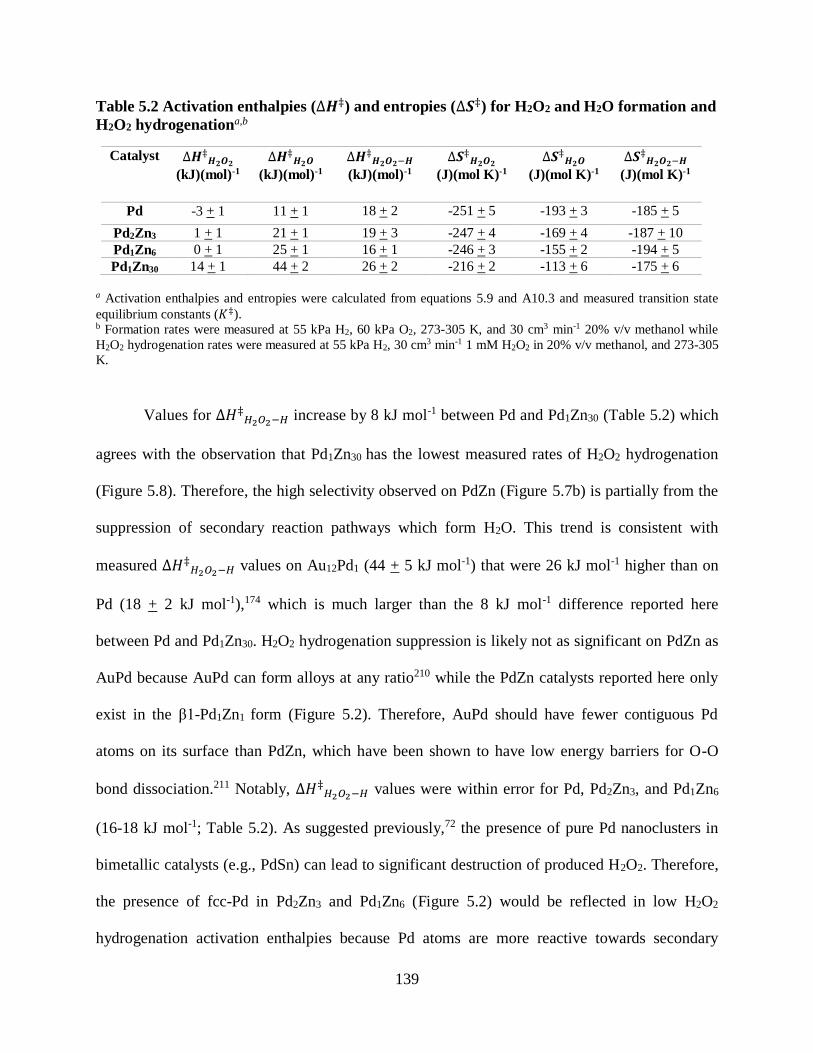
139
Table 5.2 Activation enthalpies (∆𝑯‡) and entropies (∆𝑺‡) for H2O2 and H2O formation and
H2O2 hydrogenationa,b
a Activation enthalpies and entropies were calculated from equations 5.9 and A10.3 and measured transition state
equilibrium constants (𝐾‡). b Formation rates were measured at 55 kPa H2, 60 kPa O2, 273-305 K, and 30 cm3 min-1 20% v/v methanol while
H2O2 hydrogenation rates were measured at 55 kPa H2, 30 cm3 min-1 1 mM H2O2 in 20% v/v methanol, and 273-305
K.
Values for ∆𝐻‡𝐻2𝑂2−𝐻 increase by 8 kJ mol-1 between Pd and Pd1Zn30 (Table 5.2) which
agrees with the observation that Pd1Zn30 has the lowest measured rates of H2O2 hydrogenation
(Figure 5.8). Therefore, the high selectivity observed on PdZn (Figure 5.7b) is partially from the
suppression of secondary reaction pathways which form H2O. This trend is consistent with
measured ∆𝐻‡𝐻2𝑂2−𝐻 values on Au12Pd1 (44 + 5 kJ mol-1) that were 26 kJ mol-1 higher than on
Pd (18 + 2 kJ mol-1),174 which is much larger than the 8 kJ mol-1 difference reported here
between Pd and Pd1Zn30. H2O2 hydrogenation suppression is likely not as significant on PdZn as
AuPd because AuPd can form alloys at any ratio210 while the PdZn catalysts reported here only
exist in the β1-Pd1Zn1 form (Figure 5.2). Therefore, AuPd should have fewer contiguous Pd
atoms on its surface than PdZn, which have been shown to have low energy barriers for O-O
bond dissociation.211 Notably, ∆𝐻‡𝐻2𝑂2−𝐻 values were within error for Pd, Pd2Zn3, and Pd1Zn6
(16-18 kJ mol-1; Table 5.2). As suggested previously,72 the presence of pure Pd nanoclusters in
bimetallic catalysts (e.g., PdSn) can lead to significant destruction of produced H2O2. Therefore,
the presence of fcc-Pd in Pd2Zn3 and Pd1Zn6 (Figure 5.2) would be reflected in low H2O2
hydrogenation activation enthalpies because Pd atoms are more reactive towards secondary
Catalyst ∆𝑯‡𝑯𝟐𝑶𝟐
(kJ)(mol)-1
∆𝑯‡𝑯𝟐𝑶
(kJ)(mol)-1
∆𝑯‡𝑯𝟐𝑶𝟐−𝑯
(kJ)(mol)-1
∆𝑺‡𝑯𝟐𝑶𝟐
(J)(mol K)-1
∆𝑺‡𝑯𝟐𝑶
(J)(mol K)-1
∆𝑺‡𝑯𝟐𝑶𝟐−𝑯
(J)(mol K)-1
Pd -3 + 1 11 + 1 18 + 2 -251 + 5 -193 + 3 -185 + 5
Pd2Zn3 1 + 1 21 + 1 19 + 3 -247 + 4 -169 + 4 -187 + 10
Pd1Zn6 0 + 1 25 + 1 16 + 1 -246 + 3 -155 + 2 -194 + 5
Pd1Zn30 14 + 1 44 + 2 26 + 2 -216 + 2 -113 + 6 -175 + 6
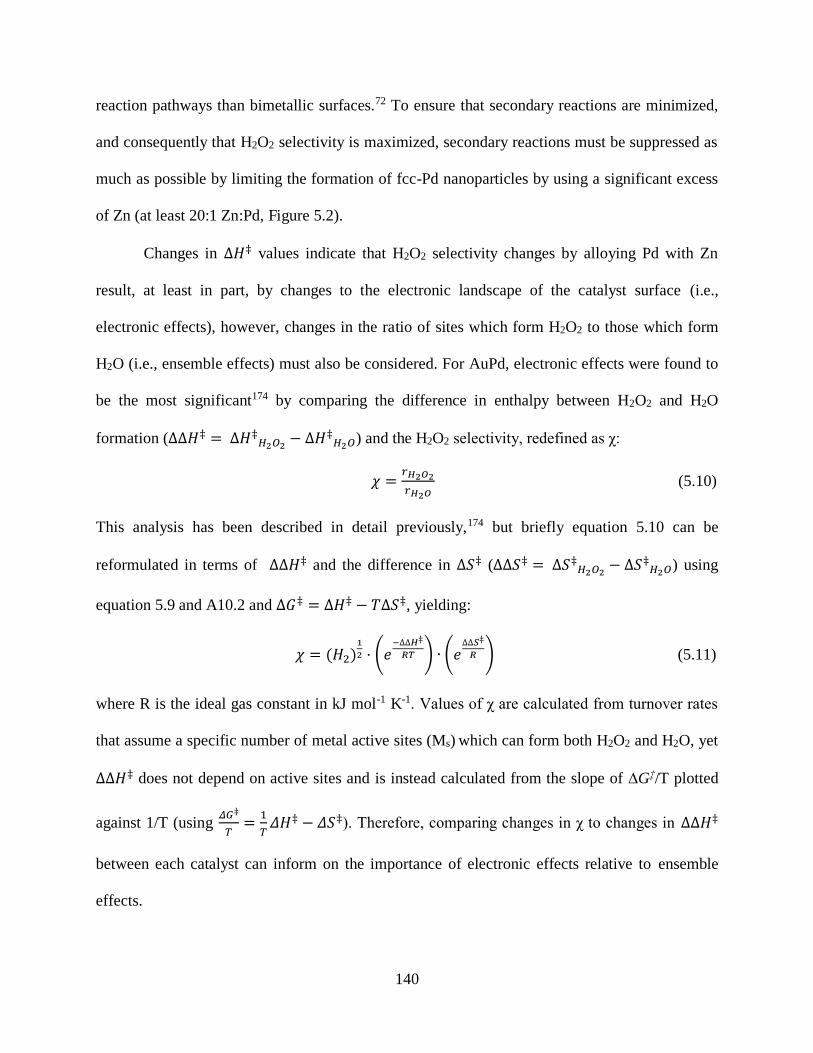
140
reaction pathways than bimetallic surfaces.72 To ensure that secondary reactions are minimized,
and consequently that H2O2 selectivity is maximized, secondary reactions must be suppressed as
much as possible by limiting the formation of fcc-Pd nanoparticles by using a significant excess
of Zn (at least 20:1 Zn:Pd, Figure 5.2).
Changes in ∆𝐻‡ values indicate that H2O2 selectivity changes by alloying Pd with Zn
result, at least in part, by changes to the electronic landscape of the catalyst surface (i.e.,
electronic effects), however, changes in the ratio of sites which form H2O2 to those which form
H2O (i.e., ensemble effects) must also be considered. For AuPd, electronic effects were found to
be the most significant174 by comparing the difference in enthalpy between H2O2 and H2O
formation (∆∆𝐻‡ = ∆𝐻‡𝐻2𝑂2 − ∆𝐻‡𝐻2𝑂) and the H2O2 selectivity, redefined as χ:
𝜒 =𝑟𝐻2𝑂2
𝑟𝐻2𝑂 (5.10)
This analysis has been described in detail previously,174 but briefly equation 5.10 can be
reformulated in terms of ∆∆𝐻‡ and the difference in ∆𝑆‡ (∆∆𝑆‡ = ∆𝑆‡𝐻2𝑂2 − ∆𝑆‡𝐻2𝑂) using
equation 5.9 and A10.2 and ∆𝐺‡ = ∆𝐻‡ − 𝑇∆𝑆‡, yielding:
𝜒 = (𝐻2)1
2 · (𝑒−∆∆𝐻‡
𝑅𝑇 ) ∙ (𝑒∆∆𝑆‡
𝑅 ) (5.11)
where R is the ideal gas constant in kJ mol-1 K-1. Values of χ are calculated from turnover rates
that assume a specific number of metal active sites (Ms) which can form both H2O2 and H2O, yet
∆∆𝐻‡ does not depend on active sites and is instead calculated from the slope of ∆G‡/T plotted
against 1/T (using 𝛥𝐺‡
𝑇=1
𝑇𝛥𝐻‡ − 𝛥𝑆‡). Therefore, comparing changes in χ to changes in ∆∆𝐻‡
between each catalyst can inform on the importance of electronic effects relative to ensemble
effects.
141
Figure 5.10 shows χ values as a function of ∆∆𝐻‡/T on Pd and PdxZny catalysts.
Catalysts with higher Zn content have greater χ values (i.e., H2O2 selectivities) and more
negative ∆∆𝐻‡ values. Figure 5.10 much more closely resembles the ideal case when only
electronic effects exist (Figures B.15 and B.17) than when changes result only from ensemble
effects (Figures B.16 and B.18). These similarities lead to the conclusion that electronic
modification of Pd by the addition of Zn are the predominant reason for the increase in H2O2
selectivity. Figure 5.10 does not however have the same trend shown in Figures B.16 and B.18,
therefore, contributions to selectivity beyond electronic effects must exist (likely ensemble
effects). The trends in Figure 5.10 and subsequent conclusions about the importance of electronic
modification for H2O2 selectivity are similar to those seen on AuPd.174 It is surprising that
selectivities on Pd1Zn30 (Figure 5.7b) are so similar to those obtained on Au12Pd1174 because it is
expected that the variable amount of Au relative to Pd in the nanoparticle crystal structure210
would lead to a higher ratio of Au to Pd surface atoms relative to the limited 1:1 ratio of Zn to Pd
in β1-Pd1Zn1 (Figure 5.2). It could be that in both cases there was not enough dilution of Pd
surface atoms by Au or Zn to for observable ensemble effects. This conclusion is consistent with
AgPt nanoparticles which achieved a 10-fold increase in selectivity over Pt (a less selective
catalyst than Pd for direct synthesis).203 Measurements of the rate of 13CO exchange with 12CO
by Fourier transform infrared spectroscopy provided direct evidence for ensemble effects in
AgPt octahedra catalysts.203 These catalysts likely had a low ratio of Pt to Ag surface atoms
because the Pt existed primarily at edge and corner sites, which ultimately led to a 10-fold
increase in H2O2 selectivity over pure Pt nanoclusters. These combined findings show Au does
not have an entirely unique interaction with Pd that leads to an increase in H2O2 selectivity,
which result primarily from electronic changes to the Pd active sites. Therefore, improvements to
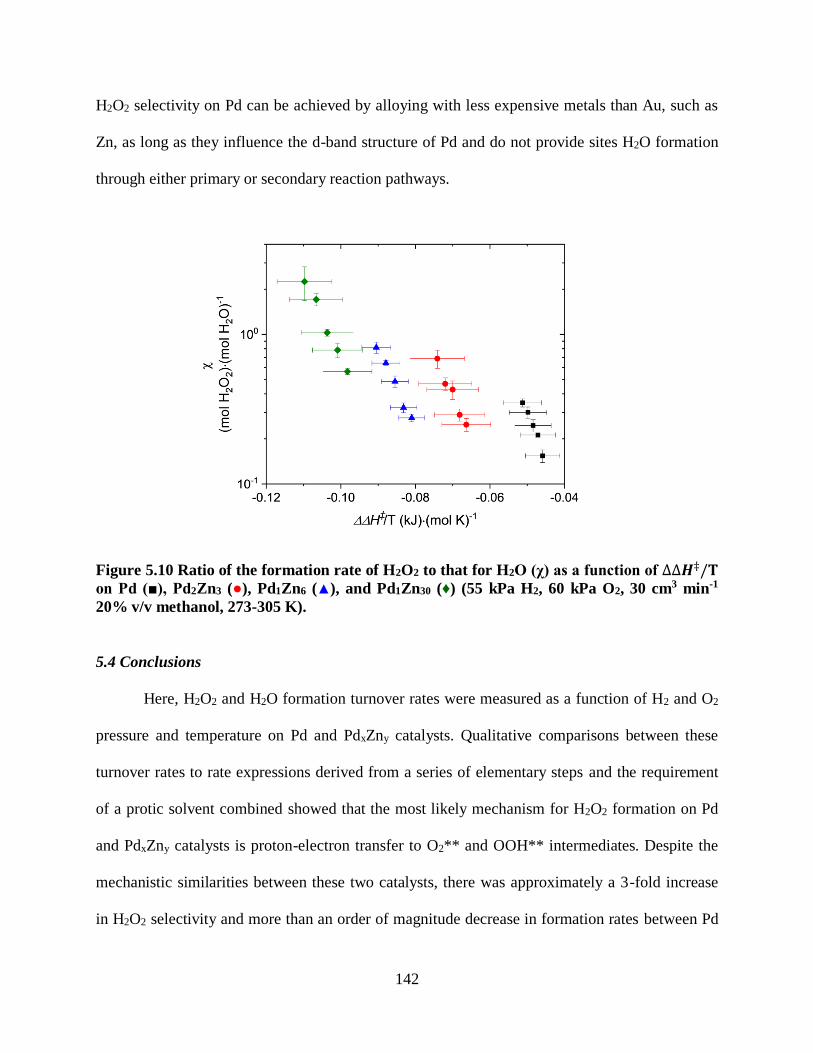
142
H2O2 selectivity on Pd can be achieved by alloying with less expensive metals than Au, such as
Zn, as long as they influence the d-band structure of Pd and do not provide sites H2O formation
through either primary or secondary reaction pathways.
Figure 5.10 Ratio of the formation rate of H2O2 to that for H2O (χ) as a function of ∆∆𝑯‡/𝐓
on Pd (■), Pd2Zn3 (●), Pd1Zn6 (▲), and Pd1Zn30 (♦) (55 kPa H2, 60 kPa O2, 30 cm3 min-1
20% v/v methanol, 273-305 K).
5.4 Conclusions
Here, H2O2 and H2O formation turnover rates were measured as a function of H2 and O2
pressure and temperature on Pd and PdxZny catalysts. Qualitative comparisons between these
turnover rates to rate expressions derived from a series of elementary steps and the requirement
of a protic solvent combined showed that the most likely mechanism for H2O2 formation on Pd
and PdxZny catalysts is proton-electron transfer to O2** and OOH** intermediates. Despite the
mechanistic similarities between these two catalysts, there was approximately a 3-fold increase
in H2O2 selectivity and more than an order of magnitude decrease in formation rates between Pd

143
and Pd1Zn30 catalysts. In addition, there was a 5-fold decrease in H2O2 hydrogenation rates
between Pd and Pd1Zn30 catalysts. These changes were not linear with Zn content, likely from a
non-homogenous composition of some PdxZny catalysts as shown by the presence of fcc-Pd and
β1-Pd1Zn1 reflections in the same catalyst (XRD) as well as lower than anticipated reduction
temperatures (TPR). Activation enthalpies (∆𝐻‡) for H2O2 and H2O formation and H2O2
hydrogenation were calculated from formation and hydrogenation turnover rates as a function of
temperature. Increasing the Zn content of the catalyst led to an increase in all ∆𝐻‡values, with
those on Pd1Zn30 (the only catalyst directly shown here to be phase-pure β1-Pd1Zn1) being the
highest. Comparisons of the difference in activation enthalpy (∆Δ𝐻‡) between the two formation
pathways (i.e., H2O2 and H2O) to H2O2 selectivity demonstrated trends which implicate
electronic modification of the Pd by the Zn as the primary method for selectivity improvement.
Yet, this analysis cannot completely rule out ensemble effects which would likely have a greater
effect on H2O2 selectivity if phases with lower Pd to Zn ratios were synthesized and tested. The
combined results of this work show that, like the addition of Au to Pd, adding Zn to Pd improves
H2O2 selectivity by electronic modification of the Pd by Zn. Therefore, electronic effects
between alloyed metals is an important design factor for improving H2O2 selectivity and should
be a significant consideration when developing H2O2 direct synthesis catalysts in future studies.
144
CHAPTER 6
CONCLUSIONS AND OUTLOOK
6.1 Conclusions
These collective studies have focused on improving the fundamental understanding of the
direct synthesis of H2O2 on supported transition metal catalysts, with the ultimate intention of
transitioning away from anthraquinone auto-oxidation to direct synthesis as the predominant
industrial process for H2O2 formation. This paradigm shift can begin once it has been
demonstrated that direct synthesis is economically viable with small scale oxidation processes
such as pulp and paper bleaching. Extensive research into the catalysts which form H2O2 by
direct synthesis is the first step towards less expensive H2O2, resulting in many studies
examining how to improve selectivity towards H2O2.49-52,57-69 However, despite these many
works, the mechanism by which direct synthesis of H2O2 occurs on Pd (a standard catalyst for
this field) had not been concretely established. Therefore, our first research goal was to perform
a detailed mechanistic study of the direct synthesis of H2O2 on benchmark SiO2 supported Pd
catalysts in order to inform future research directions for us and others.
In Chapter 2, we proposed a mechanism for the direct synthesis of H2O2 on SiO2
supported Pd clusters which involves proton-electron transfer elementary steps that bear
similarity to the oxygen reduction reaction rather than the commonly invoked Langmuir-
Hinshelwood type mechanism. Specifically, proton-electron pairs (which form from the
heterolytic dissociation of H* atoms) react with O2** and OOH** intermediates, while H2O
likely forms following the irreversible scission of the O-O bond in OOH**. Evidence for this
mechanism was supported by comparisons of turnover rates measured as a function of reactant
(e.g., H2, O2) pressures to rate expressions derived from a series of elementary steps. In addition,
145
a protic solvent is required to measure detectable quantities of H2O2, further suggesting that
protons are involved in the formation of H2O2. However, the addition of protons to solution did
not increase H2O2 turnover rates because of the equilibrated relationship between protons and
electrons in this system. The dependence of H2O2 and H2O turnover rates did not change
between 0.7 and 7 nm Pd clusters, indicating no mechanistic differences between them.
However, activation enthalpies (∆𝐻‡) for H2O formation increased by 14 kJ mol-1 between 0.7
and 7 nm Pd clusters while ∆𝐻‡ for H2O2 formation increased by only 5 kJ mol-1 between the
same two catalysts. Changes in the ratio of coordinated to undercoordinated surface atoms
weakly affects H2O2 formation because the corresponding transition state involves interactions
with species not adsorbed to, and therefore independent of the metal surface. Collectively, these
findings provided a mechanistic foundation for the direct synthesis of H2O2 which informed our
subsequent investigations.
In Chapter 3, we investigated the reasons why SiO2 supported AuPd catalysts are so
much more selective than Pd for the direct synthesis of H2O2. As in Chapter 2, turnover rates
were measured as a function of H2 and O2 pressure and compared to rate expressions which
involved proton-electron transfer steps. These findings demonstrated that the same direct
synthesis of H2O2 mechanism which occurs on Pd occurs also on AuPd clusters. Therefore, the
observed increase in H2O2 selectivity from 23% on Pd to 60% on Au12Pd1 did not result from a
change in the mechanism. Instead, unequal increases in H2O2 and H2O ∆𝐻‡ values between Pd
and AuPd catalysts provided initial evidence that electronic differences between the two catalysts
could be the primary reason for the measured difference in H2O2 selectivity. Comparisons of the
differences in ∆𝐻‡ between H2O2 and H2O formation (i.e., ∆∆𝐻‡) to H2O2 selectivity on each
146
catalyst provided a qualitative argument for electronic effects as the primary cause for the
selectivity differences over the Au:Pd ratios tested.
Chapter 4 reports on our investigation of AgPt octahedra and Pt nanoparticles for the
direct synthesis of H2O2. H2O2 selectivities on Pt (6 %) were increased by almost 10-fold by
alloying with Ag (50%). Poor catalyst stability prevented determination of the reaction
mechanism, yet measurements of CO as a probe molecule by FTIR provided insight into the
reasons for the difference in selectivity. A red shift of the ν(13C=O) feature by ~31 cm-1 between
Pt and AgPt catalysts suggest significant electronic modification of the Pt active sites. This
conclusion was supported also by decreases to H2O2 and H2O ∆𝐻‡ values between Pt and AgPt.
These results initially seem to contradict the observation that AgPt is more selective towards
H2O2 than Pt, however, measurements of the rate of 13CO desorption suggest that there are two
different types of active sites on AgPt (while Pt only has one) which likely result from the
presence of isolated Pt atoms. These isolated Pt sites on AgPt cannot bind O2 in an orientation
that favors O-O bond scission and have high rates of H2O2 formation from increased electron
density caused by interactions between the Ag and Pt. Therefore, AgPt has a higher selectivity
than Pt because of both electronic and ensemble effects. Significant ensemble effects were not
detected on the AuPd catalysts (Chapter 3) likely because sufficient surface dilution of the Pd by
the Au was not achieved. In contrast, AgPt catalysts appear to be the most stable under reaction
conditions with Pt atoms localized at corners and edge sites, which make up a small fraction of
the surface metal atoms for octahedra of this size (~17 nm). These findings indicate that both
electronic and ensemble effects are important, however, sufficient dilution of active sites with
another metal must be obtained before ensemble effects manifest themselves.
147
Lastly, Chapter 5 contains our findings on PdZn catalysts as a selective bimetallic
catalyst alternative to the extensively studied AuPd. Unlike AgPt (Chapter 4), PdZn catalysts
were stable and allowed us to measure turnover rates as a function of H2 and O2 pressure as well
as the protic and aprotic nature of the reaction solvent. These measurements were consistent with
those measured on Pd (Chapter 2) and AuPd (Chapter 3) catalysts, suggesting that the proposed
proton-electron transfer mechanism occurred also on PdZn catalysts. Similarly to alloying Pd
with Au, alloying Pd with Zn dramatically increased H2O2 selectivity (69%) over pure Pd (26%).
Measurements of the ∆𝐻‡ values between Pd and PdZn catalysts showed that ∆𝐻‡ values for
H2O2 and H2O formation increase unequally with Zn content. Comparisons of ∆∆𝐻‡ to H2O2
selectivity on all catalysts tested demonstrated that electronic effects are the most likely reason
for the difference in selectivity. The most significant differences in selectivity and ∆𝐻‡ occur on
PdZn catalysts which do not contain monometallic fcc-Pd nanoparticles. XRD measurements
show that the highest ratio of Pd to Zn obtained in each PdZn nanoparticle is 1:1 (as β1-Pd1Zn1).
Therefore, 1:1 Pd:Zn is not a low enough ratio (i.e., not enough Zn) to measure significant
ensemble effects like those measured on AgPt octahedra (Chapter 4).
6.2 Future Work: FTIR Studies on AuPd Catalysts with a High Au Content
Our previous work on AuPd (Chapter 3) has demonstrated that electronic modification of
Pd by the Au is a significant factor for improving H2O2 selectivity. Transient FTIR
measurements of the exchange between adsorbed 13CO* and 12CO* on AgPt (Chapter 4) have
however provided evidence that ensemble effects can be important contributors to high H2O2
selectivity. Calculated activation barriers for breaking the O-O bond in OOH** are higher on
monomers (78 kJ mol-1) than on dimers (52 kJ mol-1) of Pd surrounded by Au atoms,211
148
demonstrating further the potential significance of ensemble effects for the AuPd system. Our
analysis on AuPd (Chapter 3) has shown that the mechanism for direct synthesis is similar to the
oxygen reduction reaction (ORR), and previous ORR studies on AuPd at 0 V show that H2O2
selectivity is higher on Pd monomers than contiguous Pd sites.39 Therefore, it is likely that we
did not observe significant ensemble effects previously (Chapter 3) because we did not achieve a
sufficiently high ratio of Au:Pd such that the surface was dominated by Pd monomers. This
could be because bulk Pd atoms tend to migrate to the surface in the presence of strongly binding
adsorbates151 (e.g., O2) and so the ratio of bulk metal atoms may not necessarily reflect the ratio
of surface metal atoms in the presence of O2.
Future work on this project should focus on synthesizing and studying catalysts with
sufficiently high ratios of Au to Pd (e.g., 100:1 Au:Pd) yet contain enough Pd (e.g., 0.05 wt. %
Pd) to measure formation rates and characterize by FTIR with a high signal to noise ratio. The
volume of liquid needed for synthesizing very high Au:Pd ratios by the colloidal technique
described in Chapter 3 is prohibitive. Therefore, an alternative synthesis method should be used,
such as the simultaneous incipient wetness of SiO2 with Au and Pd salt precursors.199 Once the
catalysts are synthesized, the rate of exchange of 13CO* with 12CO* should be measured by FTIR
to probe for the presence of multiple types of active sites (as discussed in Chapter 4). If the
signal to noise ratio is not high enough, higher Pd metal loading catalysts can be used (> 0.05 wt.
% Pd), however, the absence of mass transport limitations must be determined on these materials
by measuring the H2 conversion as a function of total catalyst loaded in the reactor, as described
in the Appendix (section C2). Additionally, selectivity, rate, and ∆𝐻‡ measurements should be
conducted on these AuPd catalysts to relate ensemble and electronic effects to catalyst
performance.
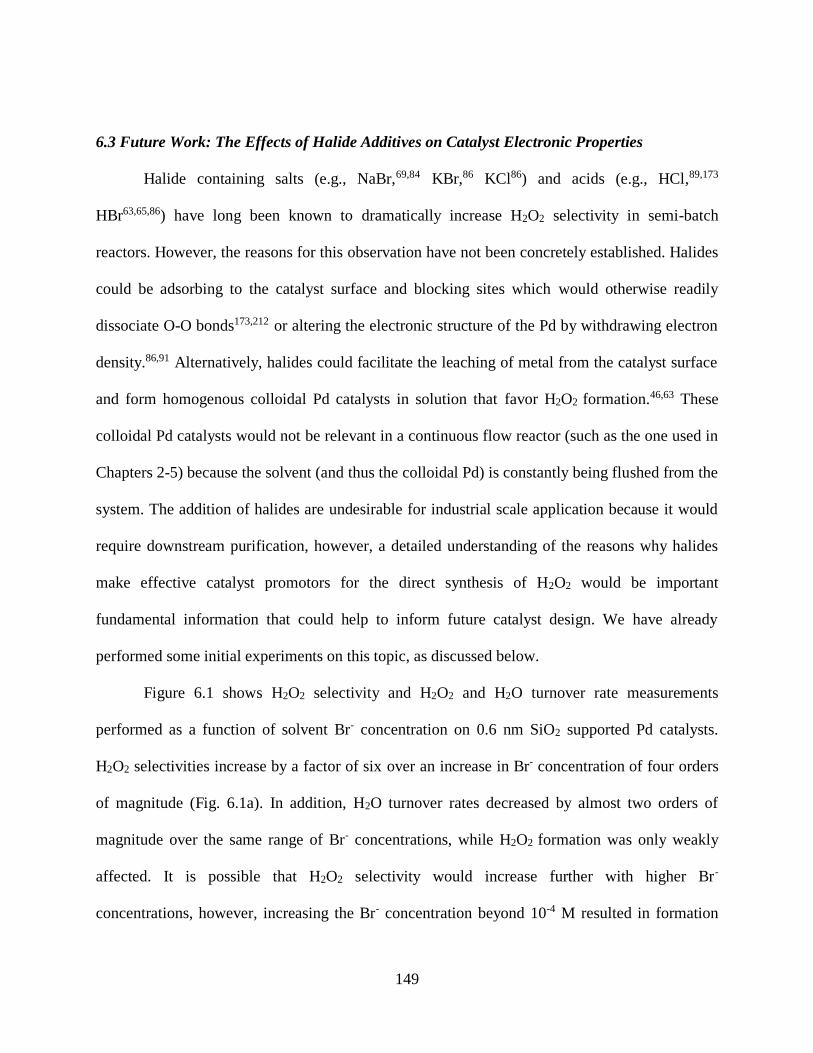
149
6.3 Future Work: The Effects of Halide Additives on Catalyst Electronic Properties
Halide containing salts (e.g., NaBr,69,84 KBr,86 KCl86) and acids (e.g., HCl,89,173
HBr63,65,86) have long been known to dramatically increase H2O2 selectivity in semi-batch
reactors. However, the reasons for this observation have not been concretely established. Halides
could be adsorbing to the catalyst surface and blocking sites which would otherwise readily
dissociate O-O bonds173,212 or altering the electronic structure of the Pd by withdrawing electron
density.86,91 Alternatively, halides could facilitate the leaching of metal from the catalyst surface
and form homogenous colloidal Pd catalysts in solution that favor H2O2 formation.46,63 These
colloidal Pd catalysts would not be relevant in a continuous flow reactor (such as the one used in
Chapters 2-5) because the solvent (and thus the colloidal Pd) is constantly being flushed from the
system. The addition of halides are undesirable for industrial scale application because it would
require downstream purification, however, a detailed understanding of the reasons why halides
make effective catalyst promotors for the direct synthesis of H2O2 would be important
fundamental information that could help to inform future catalyst design. We have already
performed some initial experiments on this topic, as discussed below.
Figure 6.1 shows H2O2 selectivity and H2O2 and H2O turnover rate measurements
performed as a function of solvent Br- concentration on 0.6 nm SiO2 supported Pd catalysts.
H2O2 selectivities increase by a factor of six over an increase in Br- concentration of four orders
of magnitude (Fig. 6.1a). In addition, H2O turnover rates decreased by almost two orders of
magnitude over the same range of Br- concentrations, while H2O2 formation was only weakly
affected. It is possible that H2O2 selectivity would increase further with higher Br-
concentrations, however, increasing the Br- concentration beyond 10-4 M resulted in formation
150
rates which were too low to accurately measure. This problem could be avoided in the future by
loading more catalyst in the reactor (> 300 mg). The strong effect that Br- has on H2O formation,
combined with the weak effect on H2O2 formation, suggests that Br- blocks sites which would
form H2O (e.g., ensembles of Pd atoms) while leaving sites that form H2O2 mostly unaffected.
Colloidal Pd cannot be a contributing factor to the increase in H2O2 selectivity with Br-
concentration because a flow reactor was used and any colloidal Pd that formed from leaching of
the metal by the halides would be washed away with the solvent. There is a notable decrease in
H2O and H2O2 formation rates in the absence of Br- after the experiment had been conducted
(~12 h), which could be a result of metal leaching facilitated by the presence of Br-. In the future,
this hypothesis could be tested by measurements of the metal content of the catalyst (using
EDXRF) following the experiment. This decrease in rates is likely not from strongly binding Br -
remaining on the catalyst because H2O2 selectivity drops dramatically after removal of Br- from
the solvent. These initial measurements (Fig. 6.1) do not provide evidence for the presence or
absence of electronic modification of the Pd.
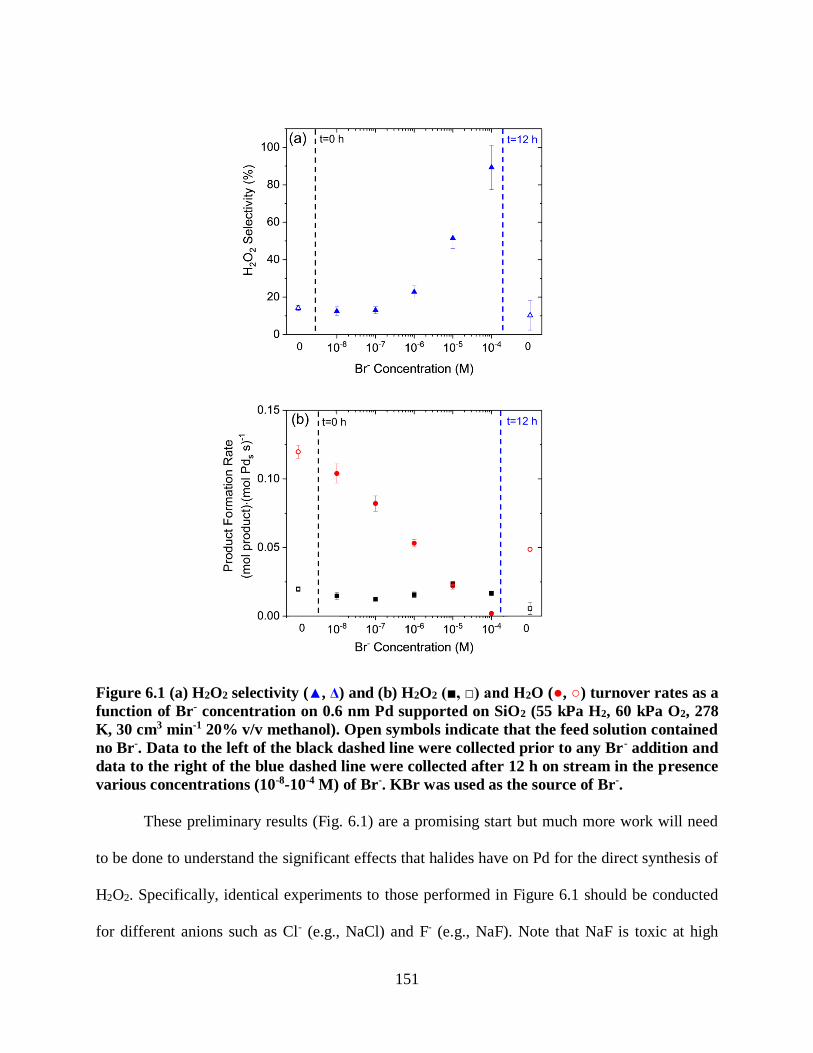
151
Figure 6.1 (a) H2O2 selectivity (▲, Δ) and (b) H2O2 (■, □) and H2O (●, ○) turnover rates as a
function of Br- concentration on 0.6 nm Pd supported on SiO2 (55 kPa H2, 60 kPa O2, 278
K, 30 cm3 min-1 20% v/v methanol). Open symbols indicate that the feed solution contained
no Br-. Data to the left of the black dashed line were collected prior to any Br- addition and
data to the right of the blue dashed line were collected after 12 h on stream in the presence
various concentrations (10-8-10-4 M) of Br-. KBr was used as the source of Br-.
These preliminary results (Fig. 6.1) are a promising start but much more work will need
to be done to understand the significant effects that halides have on Pd for the direct synthesis of
H2O2. Specifically, identical experiments to those performed in Figure 6.1 should be conducted
for different anions such as Cl- (e.g., NaCl) and F- (e.g., NaF). Note that NaF is toxic at high

152
concentrations and so care should be used when handling and low concentrations should be
maintained at all times. In addition to the anion, Br compounds with different cations should be
tested to ensure that they do not influence the reaction (e.g., NaBr, HBr). Previously it had been
shown that H2O2 formation rates can increase linearly with O2 pressure from 200 to 1000 kPa O2
in the presence of 10 ppm of Br- and 0.05 M H2SO4.213 Notably this finding is different from our
own H2O2 rate measurements as a function of O2 pressure (Chapters 2, 3, and 5) which range
from 25 to 400 kPa O2. It is possible that the adsorption of Br- affects the electronic landscape of
the Pd surface such that O2 adsorption becomes less favorable than in the absence of Br-. This
effect would manifest as a ** MARI at O2 pressures exceeding 25 kPa O2, which would be
consistent with our proposed mechanism. This should be investigated by performing an H2 and
O2 pressure dependence on Pd in the presence of Br- at a concentration similar to what had been
used in that previous study213 (e.g., ~10-5 M). Similarly, H2O2 formation rates measured in the
semi-batch reactor in protic and aprotic solvents containing Br- will provide evidence for the
proton-electron transfer reaction mechanism in the presence of Br-. NaBr or KBr should be used
in place of HBr so that there is no contamination of free protons in the aprotic solvent. Last, ∆𝐻‡
measurements in the presence of Br- will provide insight into the possible electronic effects that
halide adsorption has on the catalyst.
6.4 Future Work: Investigations of the Reaction Solvent on Direct Synthesis
Our work has shown that direct synthesis of H2O2 can only occur at detectable rates in
protic solvent (Chapters 2, 3, and 5), indicating that the solvent plays a critical role in the direct
synthesis of H2O2. Typically the reaction solvent for this reaction is some combination of
H2O,59,86,214 methanol,177,215-218 and ethano,l212,219,220 however, less common solvents such as
153
supercritical CO265,221 and aqueous mixtures of acetonitrile219 have been studied as well.
Typically, ethanol and methanol are implemented to overcome the limited solubility of H2 into
H2O.89,173,215,219 However, it is possible that the solvent could contribute to the reaction in ways
that are currently unknown. Computational work of ORR on Pt(111) has shown that hydrogen
bonding in liquid water stabilizes charge transfer from the Pt to the π* orbitals of O-O bonds,
facilitating H2O formation.105 Additionally, very recent kinetic isotope effect (KIE)
measurements by our group involving deuterated water and methanol have provided preliminary
evidence that methanol may act as a co-catalyst which increases rates of H2O2 formation.
We have used either pure methanol (Chapter 2) or 20% v/v methanol in H2O (Chapters 3-
5) as a solvent for our rate measurements, however, using different solvents in order to perform a
thorough investigation into solvent effects could provide insight into how the solvent participates
in the reaction. First, detailed rate and selectivity measurements should be conducted on 0.6 nm
Pd clusters using the continuous flow reactor and different pure solvents such as methanol,
ethanol, and H2O. These solvents were selected because they are commonly used for direct
synthesis and are relatively inexpensive. If these solvents only affect the reaction by improving
solubility, the results of these experiments can easily be correlated to the solubility factor of H2
in each solvent. The KIE for these different solvents can then be measured in the semi-batch
reactor to determine if the identity of the solvent affects the KIE. Next, selectivity and rates
should be measured as a function of methanol concentration, where the methanol concentration
is changed by the addition of H2O to the solvent feed while the reaction is proceeding. This
experiment can also be performed for ethanol. Based on the outcome of this experiment, a few
methanol concentrations which provide the biggest differences in rates and selectivity should be
studied further by measuring ∆𝐻‡ values using these different methanol concentrations. H2 and

154
O2 pressure dependencies have already been measured on Pd in methanol (Chapter 2) and 20%
v/v methanol (Chapter 3), but it would be worthwhile to perform these measurements in pure
ethanol or water.
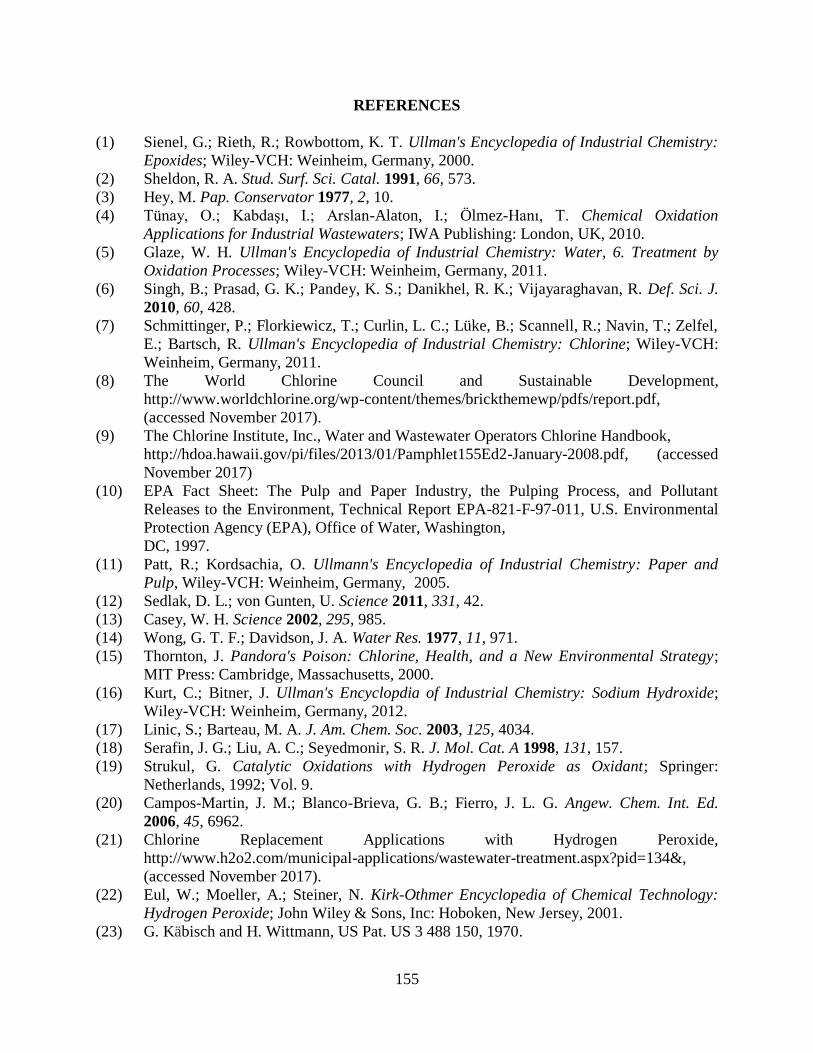
155
REFERENCES
(1) Sienel, G.; Rieth, R.; Rowbottom, K. T. Ullman's Encyclopedia of Industrial Chemistry:
Epoxides; Wiley-VCH: Weinheim, Germany, 2000.
(2) Sheldon, R. A. Stud. Surf. Sci. Catal. 1991, 66, 573.
(3) Hey, M. Pap. Conservator 1977, 2, 10.
(4) Tünay, O.; Kabdaşı, I.; Arslan-Alaton, I.; Ölmez-Hanı, T. Chemical Oxidation
Applications for Industrial Wastewaters; IWA Publishing: London, UK, 2010.
(5) Glaze, W. H. Ullman's Encyclopedia of Industrial Chemistry: Water, 6. Treatment by
Oxidation Processes; Wiley-VCH: Weinheim, Germany, 2011.
(6) Singh, B.; Prasad, G. K.; Pandey, K. S.; Danikhel, R. K.; Vijayaraghavan, R. Def. Sci. J.
2010, 60, 428.
(7) Schmittinger, P.; Florkiewicz, T.; Curlin, L. C.; Lüke, B.; Scannell, R.; Navin, T.; Zelfel,
E.; Bartsch, R. Ullman's Encyclopedia of Industrial Chemistry: Chlorine; Wiley-VCH:
Weinheim, Germany, 2011.
(8) The World Chlorine Council and Sustainable Development,
http://www.worldchlorine.org/wp-content/themes/brickthemewp/pdfs/report.pdf,
(accessed November 2017).
(9) The Chlorine Institute, Inc., Water and Wastewater Operators Chlorine Handbook,
http://hdoa.hawaii.gov/pi/files/2013/01/Pamphlet155Ed2-January-2008.pdf, (accessed
November 2017)
(10) EPA Fact Sheet: The Pulp and Paper Industry, the Pulping Process, and Pollutant
Releases to the Environment, Technical Report EPA-821-F-97-011, U.S. Environmental
Protection Agency (EPA), Office of Water, Washington,
DC, 1997.
(11) Patt, R.; Kordsachia, O. Ullmann's Encyclopedia of Industrial Chemistry: Paper and
Pulp, Wiley-VCH: Weinheim, Germany, 2005.
(12) Sedlak, D. L.; von Gunten, U. Science 2011, 331, 42.
(13) Casey, W. H. Science 2002, 295, 985.
(14) Wong, G. T. F.; Davidson, J. A. Water Res. 1977, 11, 971.
(15) Thornton, J. Pandora's Poison: Chlorine, Health, and a New Environmental Strategy;
MIT Press: Cambridge, Massachusetts, 2000.
(16) Kurt, C.; Bitner, J. Ullman's Encyclopdia of Industrial Chemistry: Sodium Hydroxide;
Wiley-VCH: Weinheim, Germany, 2012.
(17) Linic, S.; Barteau, M. A. J. Am. Chem. Soc. 2003, 125, 4034.
(18) Serafin, J. G.; Liu, A. C.; Seyedmonir, S. R. J. Mol. Cat. A 1998, 131, 157.
(19) Strukul, G. Catalytic Oxidations with Hydrogen Peroxide as Oxidant; Springer:
Netherlands, 1992; Vol. 9.
(20) Campos-Martin, J. M.; Blanco-Brieva, G. B.; Fierro, J. L. G. Angew. Chem. Int. Ed.
2006, 45, 6962.
(21) Chlorine Replacement Applications with Hydrogen Peroxide,
http://www.h2o2.com/municipal-applications/wastewater-treatment.aspx?pid=134&,
(accessed November 2017).
(22) Eul, W.; Moeller, A.; Steiner, N. Kirk-Othmer Encyclopedia of Chemical Technology:
Hydrogen Peroxide; John Wiley & Sons, Inc: Hoboken, New Jersey, 2001.
(23) G. Käbisch and H. Wittmann, US Pat. US 3 488 150, 1970.

156
(24) Goor, G.; Glennberg, J.; Jacobi, S. Ullmann's Encyclopedia of Industrial Chemistry:
Hydrogen Peroxide 2012, 18, 394.
(25) Samanta, C. Appl. Catal. A 2008, 350, 133.
(26) Russo, V.; Tesser, R.; Santacesaria, E.; Di Serio, M. Ind. Eng. Chem. Res. 2013, 52,
1168.
(27) Short, P. L. Chem. Eng. News 2009, 87, 21.
(28) Tullo, A. H.; Short, P. L. Chem. Eng. News 2006, 84, 22.
(29) Ritter, S. K. In C Chem. Eng. News 2010, 88, 19.
(30) Tullo, A. H. In Chem. Eng. News 2005, 83, 7.
(31) García-Serna, J.; Moreno, T.; Biasi, P.; Cocero, M. J.; Mikkola, J.-P.; Salmi, T. O. Green
Chem. 2014, 16, 2320.
(32) Kemsley, J. Chem. Eng. News 2008, 86, 9.
(33) Evonik,
http://corporate.evonik.com/en/media/search/pages/news-details.aspx?newsid=45021,
(accessed November 2017).
(34) Otsuka, K.; Yamanaka, I. Electrochim. Acta 1990, 35, 319.
(35) Qiang, Z.; Chang, J.-H.; Huang, C.-P. Water Res. 2002, 36, 85.
(36) Verdaguer-Casadevall, A.; Deiana, D.; Karamad, M.; Siahrostami, S.; Malacrida, P.;
Hansen, T. W.; Rossmeisl, J.; Chorkendorff, I.; Stephens, I. E. L. Nano Lett. 2014, 14,
1603.
(37) Siahrostami, S.; Verdaguer-Casadevall, A.; Karamad, M.; Deiana, D.; Malacrida, P.;
Wickman, B.; Escudero-Escribano, M.; Paoli, E. A.; Frydendal, R.; Hansen, T. W.;
Chorkendorff, I.; Stephens, I. E. L.; Rossmeisl, J. Nat. Mater. 2013, 12, 1137.
(38) Yamanaka, I.; Onisawa, T.; Hashimoto, T.; Murayama, T. ChemSusChem 2011, 4, 494.
(39) Jirkovský, J. S.; Panas, I.; Ahlberg, E.; Halasa, M.; Romani, S.; Schiffrin, D. J. J. Am.
Chem. Soc. 2011, 133, 19432.
(40) Goto, H.; Hanada, Y.; Ohno, T.; Matsumura, M. J. Catal. 2004, 225, 223.
(41) Korman, C.; Bahnemann, D. W.; Hoffmann, M. R. Environ. Sci. Technol. 1988, 22, 798.
(42) Morinaga, K. Bull. Chem. Soc. Jpn. 1962, 35, 345.
(43) Bianchi, D.; Bortolo, R.; D'Aloisio, R.; Ricci, M. Angew. Chem. Int. Ed. 1999, 38, 706.
(44) Henkel, H.; Weber, W. H. C. US Pat. 1 108 752, 1914.
(45) Riedl, H.-J.; Pfiederer, G. US Pat. 2 158 525, 1939.
(46) Dissanayake, D. P.; Lunsford, J. H. J. Catal. 2003, 214, 113.
(47) Liu, Q.; Bauer, J. C.; Schaak, R. E.; Lunsford, J. H. Appl. Catal., A 2008, 339, 130.
(48) Biasi, P.; Menegazzo, F.; Pinna, F.; Eranen, K.; Canu, P.; Salmi, T. O. Ind. Eng. Chem.
Res. 2010, 49, 10627.
(49) Izumi, Y.; Miyazaki, H.; Kawahara, S.-I. US Pat. 4 009 252, 1977.
(50) Sun, H.-N.; Leonard, J. J.; Shalit, H. US Pat. 4 393 038, 1983.
(51) Gosser, L. W.; Schwartz, J. T. US Pat. 4 772 458, 1988.
(52) Weynbergh, J. V.; Schoebrechts, J.-P.; Colery, J.-C. US Pat. 5 447 706, 1995.
(53) Business Roundup, Chem. Eng. News, 2015, 93, 28.
(54) Bassler, P.; -Göbbel, -. H.-G.; Weidenbach, M. Chem. Eng. Trans. 2010, 21, 571.
(55) U.S. Energy Information Adminitration Annual Energy Outlook 2016 Early Release:
Annotated Summary of Two Cases,
http://www.eia.gov/forecasts/aeo/er/pdf/0383er(2016).pdf, (accessed November 2017).
(56) Gerard, J. N. Chem. Eng. News, 2016, 94, 26.
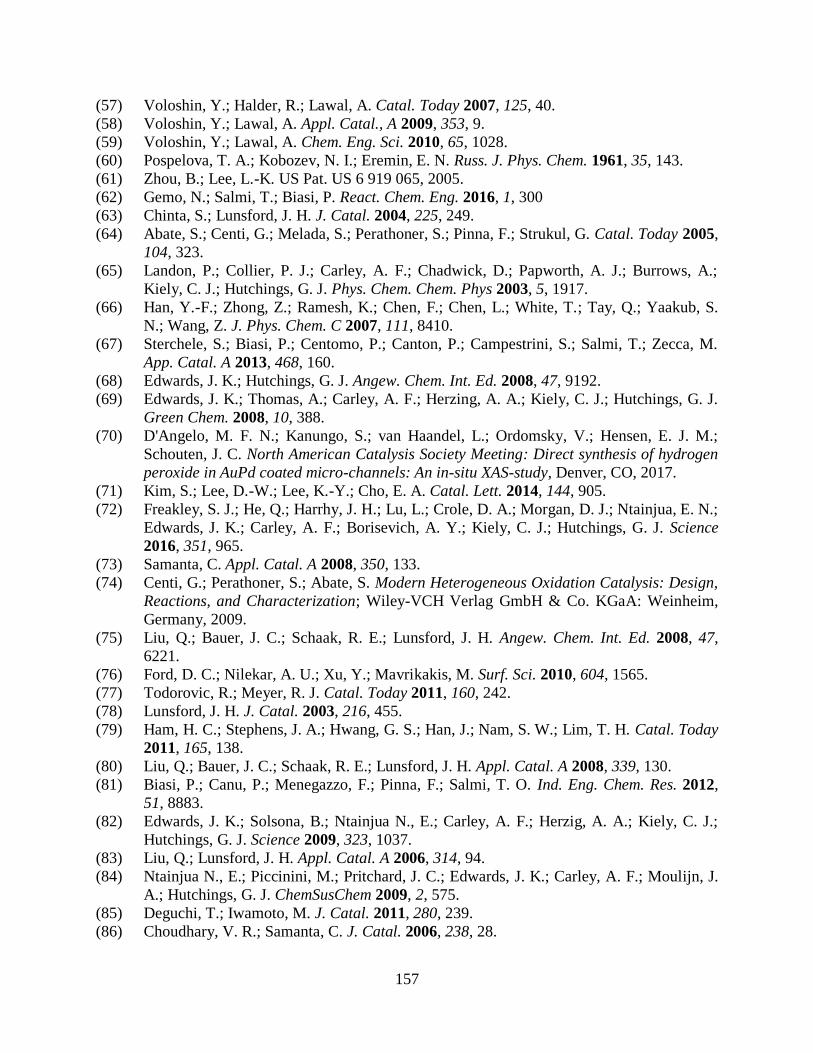
157
(57) Voloshin, Y.; Halder, R.; Lawal, A. Catal. Today 2007, 125, 40.
(58) Voloshin, Y.; Lawal, A. Appl. Catal., A 2009, 353, 9.
(59) Voloshin, Y.; Lawal, A. Chem. Eng. Sci. 2010, 65, 1028.
(60) Pospelova, T. A.; Kobozev, N. I.; Eremin, E. N. Russ. J. Phys. Chem. 1961, 35, 143.
(61) Zhou, B.; Lee, L.-K. US Pat. US 6 919 065, 2005.
(62) Gemo, N.; Salmi, T.; Biasi, P. React. Chem. Eng. 2016, 1, 300
(63) Chinta, S.; Lunsford, J. H. J. Catal. 2004, 225, 249.
(64) Abate, S.; Centi, G.; Melada, S.; Perathoner, S.; Pinna, F.; Strukul, G. Catal. Today 2005,
104, 323.
(65) Landon, P.; Collier, P. J.; Carley, A. F.; Chadwick, D.; Papworth, A. J.; Burrows, A.;
Kiely, C. J.; Hutchings, G. J. Phys. Chem. Chem. Phys 2003, 5, 1917.
(66) Han, Y.-F.; Zhong, Z.; Ramesh, K.; Chen, F.; Chen, L.; White, T.; Tay, Q.; Yaakub, S.
N.; Wang, Z. J. Phys. Chem. C 2007, 111, 8410.
(67) Sterchele, S.; Biasi, P.; Centomo, P.; Canton, P.; Campestrini, S.; Salmi, T.; Zecca, M.
App. Catal. A 2013, 468, 160.
(68) Edwards, J. K.; Hutchings, G. J. Angew. Chem. Int. Ed. 2008, 47, 9192.
(69) Edwards, J. K.; Thomas, A.; Carley, A. F.; Herzing, A. A.; Kiely, C. J.; Hutchings, G. J.
Green Chem. 2008, 10, 388.
(70) D'Angelo, M. F. N.; Kanungo, S.; van Haandel, L.; Ordomsky, V.; Hensen, E. J. M.;
Schouten, J. C. North American Catalysis Society Meeting: Direct synthesis of hydrogen
peroxide in AuPd coated micro-channels: An in-situ XAS-study, Denver, CO, 2017.
(71) Kim, S.; Lee, D.-W.; Lee, K.-Y.; Cho, E. A. Catal. Lett. 2014, 144, 905.
(72) Freakley, S. J.; He, Q.; Harrhy, J. H.; Lu, L.; Crole, D. A.; Morgan, D. J.; Ntainjua, E. N.;
Edwards, J. K.; Carley, A. F.; Borisevich, A. Y.; Kiely, C. J.; Hutchings, G. J. Science
2016, 351, 965.
(73) Samanta, C. Appl. Catal. A 2008, 350, 133.
(74) Centi, G.; Perathoner, S.; Abate, S. Modern Heterogeneous Oxidation Catalysis: Design,
Reactions, and Characterization; Wiley-VCH Verlag GmbH & Co. KGaA: Weinheim,
Germany, 2009.
(75) Liu, Q.; Bauer, J. C.; Schaak, R. E.; Lunsford, J. H. Angew. Chem. Int. Ed. 2008, 47,
6221.
(76) Ford, D. C.; Nilekar, A. U.; Xu, Y.; Mavrikakis, M. Surf. Sci. 2010, 604, 1565.
(77) Todorovic, R.; Meyer, R. J. Catal. Today 2011, 160, 242.
(78) Lunsford, J. H. J. Catal. 2003, 216, 455.
(79) Ham, H. C.; Stephens, J. A.; Hwang, G. S.; Han, J.; Nam, S. W.; Lim, T. H. Catal. Today
2011, 165, 138.
(80) Liu, Q.; Bauer, J. C.; Schaak, R. E.; Lunsford, J. H. Appl. Catal. A 2008, 339, 130.
(81) Biasi, P.; Canu, P.; Menegazzo, F.; Pinna, F.; Salmi, T. O. Ind. Eng. Chem. Res. 2012,
51, 8883.
(82) Edwards, J. K.; Solsona, B.; Ntainjua N., E.; Carley, A. F.; Herzig, A. A.; Kiely, C. J.;
Hutchings, G. J. Science 2009, 323, 1037.
(83) Liu, Q.; Lunsford, J. H. Appl. Catal. A 2006, 314, 94.
(84) Ntainjua N., E.; Piccinini, M.; Pritchard, J. C.; Edwards, J. K.; Carley, A. F.; Moulijn, J.
A.; Hutchings, G. J. ChemSusChem 2009, 2, 575.
(85) Deguchi, T.; Iwamoto, M. J. Catal. 2011, 280, 239.
(86) Choudhary, V. R.; Samanta, C. J. Catal. 2006, 238, 28.
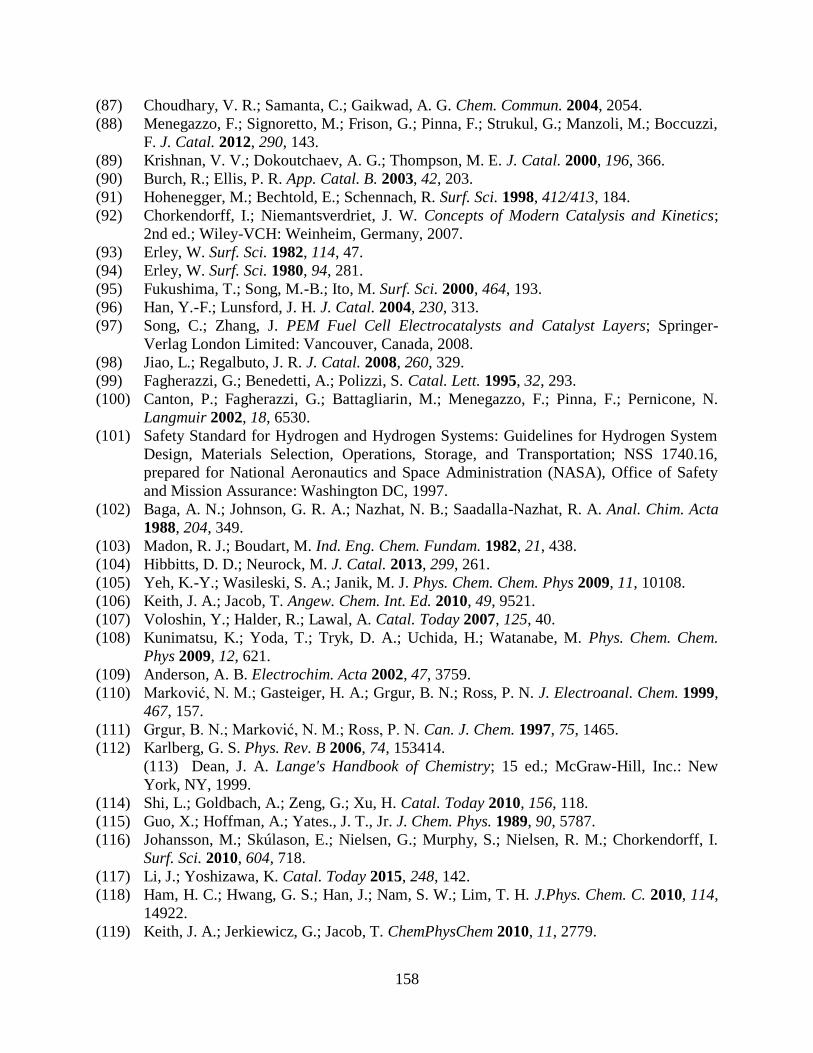
158
(87) Choudhary, V. R.; Samanta, C.; Gaikwad, A. G. Chem. Commun. 2004, 2054.
(88) Menegazzo, F.; Signoretto, M.; Frison, G.; Pinna, F.; Strukul, G.; Manzoli, M.; Boccuzzi,
F. J. Catal. 2012, 290, 143.
(89) Krishnan, V. V.; Dokoutchaev, A. G.; Thompson, M. E. J. Catal. 2000, 196, 366.
(90) Burch, R.; Ellis, P. R. App. Catal. B. 2003, 42, 203.
(91) Hohenegger, M.; Bechtold, E.; Schennach, R. Surf. Sci. 1998, 412/413, 184.
(92) Chorkendorff, I.; Niemantsverdriet, J. W. Concepts of Modern Catalysis and Kinetics;
2nd ed.; Wiley-VCH: Weinheim, Germany, 2007.
(93) Erley, W. Surf. Sci. 1982, 114, 47.
(94) Erley, W. Surf. Sci. 1980, 94, 281.
(95) Fukushima, T.; Song, M.-B.; Ito, M. Surf. Sci. 2000, 464, 193.
(96) Han, Y.-F.; Lunsford, J. H. J. Catal. 2004, 230, 313.
(97) Song, C.; Zhang, J. PEM Fuel Cell Electrocatalysts and Catalyst Layers; Springer-
Verlag London Limited: Vancouver, Canada, 2008.
(98) Jiao, L.; Regalbuto, J. R. J. Catal. 2008, 260, 329.
(99) Fagherazzi, G.; Benedetti, A.; Polizzi, S. Catal. Lett. 1995, 32, 293.
(100) Canton, P.; Fagherazzi, G.; Battagliarin, M.; Menegazzo, F.; Pinna, F.; Pernicone, N.
Langmuir 2002, 18, 6530.
(101) Safety Standard for Hydrogen and Hydrogen Systems: Guidelines for Hydrogen System
Design, Materials Selection, Operations, Storage, and Transportation; NSS 1740.16,
prepared for National Aeronautics and Space Administration (NASA), Office of Safety
and Mission Assurance: Washington DC, 1997.
(102) Baga, A. N.; Johnson, G. R. A.; Nazhat, N. B.; Saadalla-Nazhat, R. A. Anal. Chim. Acta
1988, 204, 349.
(103) Madon, R. J.; Boudart, M. Ind. Eng. Chem. Fundam. 1982, 21, 438.
(104) Hibbitts, D. D.; Neurock, M. J. Catal. 2013, 299, 261.
(105) Yeh, K.-Y.; Wasileski, S. A.; Janik, M. J. Phys. Chem. Chem. Phys 2009, 11, 10108.
(106) Keith, J. A.; Jacob, T. Angew. Chem. Int. Ed. 2010, 49, 9521.
(107) Voloshin, Y.; Halder, R.; Lawal, A. Catal. Today 2007, 125, 40.
(108) Kunimatsu, K.; Yoda, T.; Tryk, D. A.; Uchida, H.; Watanabe, M. Phys. Chem. Chem.
Phys 2009, 12, 621.
(109) Anderson, A. B. Electrochim. Acta 2002, 47, 3759.
(110) Marković, N. M.; Gasteiger, H. A.; Grgur, B. N.; Ross, P. N. J. Electroanal. Chem. 1999,
467, 157.
(111) Grgur, B. N.; Marković, N. M.; Ross, P. N. Can. J. Chem. 1997, 75, 1465.
(112) Karlberg, G. S. Phys. Rev. B 2006, 74, 153414.
(113) Dean, J. A. Lange's Handbook of Chemistry; 15 ed.; McGraw-Hill, Inc.: New
York, NY, 1999.
(114) Shi, L.; Goldbach, A.; Zeng, G.; Xu, H. Catal. Today 2010, 156, 118.
(115) Guo, X.; Hoffman, A.; Yates., J. T., Jr. J. Chem. Phys. 1989, 90, 5787.
(116) Johansson, M.; Skúlason, E.; Nielsen, G.; Murphy, S.; Nielsen, R. M.; Chorkendorff, I.
Surf. Sci. 2010, 604, 718.
(117) Li, J.; Yoshizawa, K. Catal. Today 2015, 248, 142.
(118) Ham, H. C.; Hwang, G. S.; Han, J.; Nam, S. W.; Lim, T. H. J.Phys. Chem. C. 2010, 114,
14922.
(119) Keith, J. A.; Jerkiewicz, G.; Jacob, T. ChemPhysChem 2010, 11, 2779.
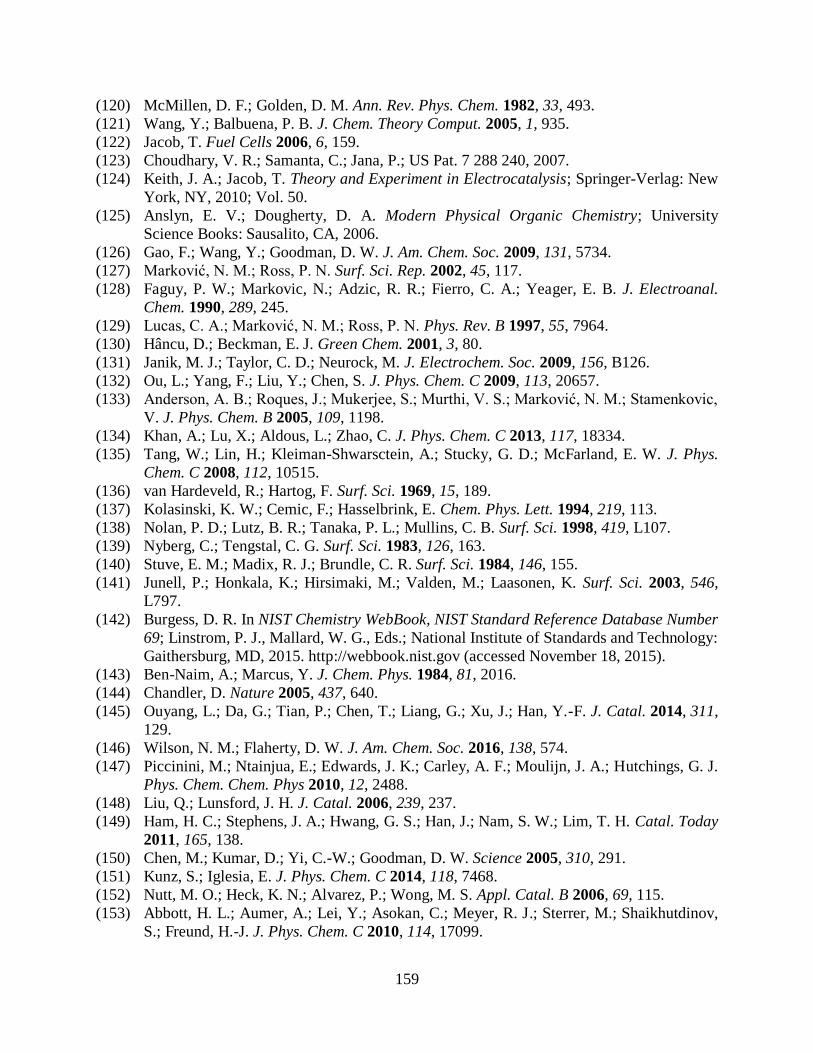
159
(120) McMillen, D. F.; Golden, D. M. Ann. Rev. Phys. Chem. 1982, 33, 493.
(121) Wang, Y.; Balbuena, P. B. J. Chem. Theory Comput. 2005, 1, 935.
(122) Jacob, T. Fuel Cells 2006, 6, 159.
(123) Choudhary, V. R.; Samanta, C.; Jana, P.; US Pat. 7 288 240, 2007.
(124) Keith, J. A.; Jacob, T. Theory and Experiment in Electrocatalysis; Springer-Verlag: New
York, NY, 2010; Vol. 50.
(125) Anslyn, E. V.; Dougherty, D. A. Modern Physical Organic Chemistry; University
Science Books: Sausalito, CA, 2006.
(126) Gao, F.; Wang, Y.; Goodman, D. W. J. Am. Chem. Soc. 2009, 131, 5734.
(127) Marković, N. M.; Ross, P. N. Surf. Sci. Rep. 2002, 45, 117.
(128) Faguy, P. W.; Markovic, N.; Adzic, R. R.; Fierro, C. A.; Yeager, E. B. J. Electroanal.
Chem. 1990, 289, 245.
(129) Lucas, C. A.; Marković, N. M.; Ross, P. N. Phys. Rev. B 1997, 55, 7964.
(130) Hâncu, D.; Beckman, E. J. Green Chem. 2001, 3, 80.
(131) Janik, M. J.; Taylor, C. D.; Neurock, M. J. Electrochem. Soc. 2009, 156, B126.
(132) Ou, L.; Yang, F.; Liu, Y.; Chen, S. J. Phys. Chem. C 2009, 113, 20657.
(133) Anderson, A. B.; Roques, J.; Mukerjee, S.; Murthi, V. S.; Marković, N. M.; Stamenkovic,
V. J. Phys. Chem. B 2005, 109, 1198.
(134) Khan, A.; Lu, X.; Aldous, L.; Zhao, C. J. Phys. Chem. C 2013, 117, 18334.
(135) Tang, W.; Lin, H.; Kleiman-Shwarsctein, A.; Stucky, G. D.; McFarland, E. W. J. Phys.
Chem. C 2008, 112, 10515.
(136) van Hardeveld, R.; Hartog, F. Surf. Sci. 1969, 15, 189.
(137) Kolasinski, K. W.; Cemic, F.; Hasselbrink, E. Chem. Phys. Lett. 1994, 219, 113.
(138) Nolan, P. D.; Lutz, B. R.; Tanaka, P. L.; Mullins, C. B. Surf. Sci. 1998, 419, L107.
(139) Nyberg, C.; Tengstal, C. G. Surf. Sci. 1983, 126, 163.
(140) Stuve, E. M.; Madix, R. J.; Brundle, C. R. Surf. Sci. 1984, 146, 155.
(141) Junell, P.; Honkala, K.; Hirsimaki, M.; Valden, M.; Laasonen, K. Surf. Sci. 2003, 546,
L797.
(142) Burgess, D. R. In NIST Chemistry WebBook, NIST Standard Reference Database Number
69; Linstrom, P. J., Mallard, W. G., Eds.; National Institute of Standards and Technology:
Gaithersburg, MD, 2015. http://webbook.nist.gov (accessed November 18, 2015).
(143) Ben-Naim, A.; Marcus, Y. J. Chem. Phys. 1984, 81, 2016.
(144) Chandler, D. Nature 2005, 437, 640.
(145) Ouyang, L.; Da, G.; Tian, P.; Chen, T.; Liang, G.; Xu, J.; Han, Y.-F. J. Catal. 2014, 311,
129.
(146) Wilson, N. M.; Flaherty, D. W. J. Am. Chem. Soc. 2016, 138, 574.
(147) Piccinini, M.; Ntainjua, E.; Edwards, J. K.; Carley, A. F.; Moulijn, J. A.; Hutchings, G. J.
Phys. Chem. Chem. Phys 2010, 12, 2488.
(148) Liu, Q.; Lunsford, J. H. J. Catal. 2006, 239, 237.
(149) Ham, H. C.; Stephens, J. A.; Hwang, G. S.; Han, J.; Nam, S. W.; Lim, T. H. Catal. Today
2011, 165, 138.
(150) Chen, M.; Kumar, D.; Yi, C.-W.; Goodman, D. W. Science 2005, 310, 291.
(151) Kunz, S.; Iglesia, E. J. Phys. Chem. C 2014, 118, 7468.
(152) Nutt, M. O.; Heck, K. N.; Alvarez, P.; Wong, M. S. Appl. Catal. B 2006, 69, 115.
(153) Abbott, H. L.; Aumer, A.; Lei, Y.; Asokan, C.; Meyer, R. J.; Sterrer, M.; Shaikhutdinov,
S.; Freund, H.-J. J. Phys. Chem. C 2010, 114, 17099.
160
(154) Wang, J.; Kispersky, V. F.; Delgass, W. N.; Ribeiro, F. H. J. Catal. 2012, 289, 171.
(155) Kugler, E. L.; Boudart, M. J. Catal. 1979, 59, 201.
(156) Baga, A. N.; Johnson, G. R. A.; Nazhat, N. B.; Saadalla-Nazhat, R. A. Anal. Chim. Acta
1988, 204, 349.
(157) Fogler, H. S.; Elements of Chemical Reacction Engineering 4th ed., Prentice Hall: Boston,
MA, 2006.
(158) Kunimatsu, K.; Yoda, T.; Tryk, D. A.; Uchida, H.; Watanabe, M. Phys. Chem. Chem.
Phys 2010, 12, 621.
(159) Yu, W.-Y.; Zhang, L.; Mullen, G. M.; Henkelman, G.; Mullins, C. B. J. Phys. Chem. C
2015, 119, 11754.
(160) Plauck, A.; Strangland, E. E.; Dumesic, J. A.; Mavrikakis, M. Proc. Natl. Acad. Sci.
2016, 113, E1973.
(161) Melada, S.; Rioda, R.; Menegazzo, F.; Pinna, F.; Strukul, G. J. Catal. 2006, 239, 422.
(162) Choudhary, V. R.; Samanta, C.; Jana, P. Appl. Catal. A 2007, 332, 70.
(163) Edwards, J. K.; Solsona, B. E.; Landon, P.; Carley, A. F.; Herzing, A.; Kiely, C. J.;
Hutchings, G. J. J. Catal. 2005, 236, 69.
(164) Edwards, J. K.; Ntainjua N., E.; Carley, A. F.; Herzing, A. A.; Kiely, C. J.; Hutchings, G.
J. Angew. Chem. Int. Ed. 2009, 48, 8512.
(165) Kim, H. Y.; Henkelman, G. ACS Catal. 2013, 3, 2541.
(166) Calaza, F.; Mahapatra, M.; Neurock, M.; Tysoe, W. T. J. Catal. 2014, 312, 37.
(167) Dahl, S.; Logadottir, A.; Jacobsen, C. J. H.; Nørskov, J. K. Appl. Catal. A 2001, 222, 19.
(168) Xu, Y.; Ruban, A. V.; Mavrikakis, M. J. Am. Chem. Soc. 2004, 126, 4717.
(169) Liu, F.; Wechsler, D.; Zhang, P. Chem. Phys. Lett. 2008, 461, 254.
(170) Marx, S.; Baiker, A. J. Phys. Chem. C 2009, 113, 6191.
(171) Xu, J.; White, T.; Li, P.; He, C.; Yu, J.; Yuan, W.; Han, Y.-F. J. Am. Chem. Soc. 2010,
132, 10398.
(172) Biasi, P.; Gemo, N.; Carucci, J. R. H.; Eränen, K.; Canu, P.; Salmi, T. O. Ind. Eng. Chem.
Res. 2012, 51, 8903.
(173) Liu, Q.; Lunsford, J. H. Appl. Catal., A 2006, 314, 94.
(174) Wilson, N. M.; Priyadarshini, P.; Kunz, S.; Flaherty, D. W. J. Catal. 2018, 357, 163.
(175) Toolenaar, F. J. C. M.; Stoop, F.; Ponec, V. J. Catal. 1983, 82, 1.
(176) Menegazzo, F.; Signoretto, M.; Manzoli, M.; Boccuzzi, F.; Cruciani, G.; Pinna, F.;
Strukul, G. J. Catal. 2009, 268, 122.
(177) Gu, J.; Wang, S.; He, Z.; Han, Y.; Zhang, J. Catal. Sci. Technol. 2016, 6, 809.
(178) Scheler, T.; Degtyareva, O.; Marqués, M.; Guillaume, C. L.; Proctor, J. E.; Evans, S.;
Gregoryanz, E. Phys. Rev. B 2011, 83, 214106.
(179) Fukai, Y. The Metal-Hydrogen System; Springer Berlin Heidelberg: Berlin, Germany,
1993; Vol. 21.
(180) Pan, Y.-T.; Yan, L.; Shao, Y.-T.; Zuo, J.-M.; Yang, H. Nano Lett. 2016, 16, 7988.
(181) Fu, G.-T.; Ma, R.-G.; Gao, X.-Q.; Chen, Y.; Tang, Y.-W.; Lu, T.-H.; Lee, J.-M.
Nanoscale 2014, 6, 12310.
(182) Miller, S. D.; İnoğlu, N.; Kitchin, J. R. J. Chem. Phys. 2011, 134, 104709.
(183) Lewis, F. A. Platin. Met. Rev. 1960, 4, 132.
(184) He, W.; Wu, X.; Liu, J.; Hu, X.; Zhang, K.; Hou, S.; Zhou, W.; Xie, S. Chem. Mater.
2010, 22, 2988.
(185) Clifford, A. F. J. Phys. Chem. 1959, 63, 1227.

161
(186) Farberow, C. A.; Godinez-Garcia, A.; Peng, G.; Perez-Robles, J. F.; Solorza-Feria, O.;
Mavrikakis, M. ACS Catal. 2013, 3, 1622.
(187) Kale, M. J.; Christopher, P. ACS Catal. 2016, 6, 5599.
(188) Hayden, B. E.; Bradshaw, A. M. Surf. Sci. 1983, 125, 787.
(189) McElhiney, G.; Papp, H.; Pritchard, J. Surf. Sci. 1976, 54, 617.
(190) Hadjiivanov, K. I.; Vayssilov, G. N. Adv. Catal. 2002, 47, 307.
(191) Ruban, A.; Hammer, B.; Stoltze, P.; Skriver, H. L.; Nørskov, J. K. J. Mol. Cat. A 1997,
115.
(192) Rankin, R. B.; Greeley, J. ACS Catal. 2012, 2, 2664.
(193) Grabow, L. C.; Hvolbaek, B.; Falsig, H.; Nørskov, J. K. Top. Catal. 2012, 55, 336.
(194) Li, R.; Li, H.; Liu, J. Int. J. Quantum Chem. 2016, 116, 908.
(195) Ham, H. C.; Hwang, G. S.; Han, J.; Nam, S. W.; Lim, T. H. J. Phys. Chem. C 2010, 114,
14922.
(196) Blanco-Brieva, G.; Capel-Sanchez, M. C.; de Frutos, M. P.; Padilla-Polo, A.; Campos-
Martin, J. M.; Fierro, J. L. G. Ind. Eng. Chem. Res. 2008, 47, 8011.
(197) Russo, V.; Tesser, R.; Santacesaria, E.; Di Serio, M. Ind. Eng. Chem. Res. 2013, 52,
1168.
(198) Tullo, A. H. In Chem. Eng. News 2005, 83, 7.
(199) Edwards, J. K.; Carley, A. F.; Herzig, A. A.; Kiely, C. J.; Hutchings, G. J. Faraday
Discuss. 2008, 138, 225.
(200) Biasi, P.; Menegazzo, F.; Pinna, F.; Eränen, K.; Salmi, T. O.; Canu, P. Chem. Eng. J.
2011, 176-177, 172.
(201) Wang, S.; Gao, K.; Li, W.; Zhang, J. Appl. Catal. A 2017, 531, 89.
(202) Choudhary, V. R.; Ingole, Y. V.; Samanta, C.; Jana, P. Ind. Eng. Chem. Res. 2007, 46,
8566.
(203) Wilson, N. M.; Pan, Y.-T.; Yang, H.; Flaherty, D. W. to be submitted, ACS Catal.
(204) Wang, H.; Liu, Z.; Ma, Y.; Julian, K.; Ji, S.; Linkov, V.; Wang, R. Phys. Chem. Chem.
Phys 2013, 15, 13999.
(205) van Hardeveld, R.; Hartog, F. Surf. Sci. 1969, 15, 189.
(206) Chen, Z.-X.; Neyman, K. M.; Rösch, N. Surf. Sci. 2004, 548, 291.
(207) Chou, C.-W.; Chu, S.-J.; Chiang, H.-J.; Huang, C.-Y.; Lee, C.-J.; Sheen, S.-R.; Perng, T.-
P.; Yeh, C.-T. J. Phys. Chem. B 2001, 105, 9113.
(208) Weisz, P. B.; Prater, C. D. Adv. Catal. 1954, 6, 143.
(209) Chen, Z.-X.; Neyman, K. M.; Gordienko, A. B.; Rösch, N. Phys. Rev. B 2003, 68,
075417.
(210) Okamoto, H.; Massalki, T. B. Bull. Alloy Phase Diagrams 1985, 6, 7.
(211) Ham, H. C.; Hwang, G. S.; Han, J.; Nam, S. W.; Lim, T. H. J. Phys. Chem. C 2009, 113,
12943.
(212) Han, Y.-F.; Lunsford, J. H. J. Catal. 2005, 230, 313.
(213) Paunovic, V.; Schouten, J. C.; Nijhuis, T. A. Appl. Catal. A 2015, 505, 249.
(214) Paunovic, V.; Ordomsky, V. V.; Sushkevich, V. L.; Schouten, J. C.; Nijhuis, T. A.
ChemCatChem 2015, 7, 1161.
(215) Freakley, S. J.; Piccinini, M.; Edwards, J. K.; Ntainjua, E. N.; Moulijin, J. A.; Hutchings,
G. J. ACS Catal. 2013, 3, 487.
(216) Blanco-Brieva, G.; Escrig, M. P. F.; Campos-Martin, J. M.; Fierro, J. L. G. Green Chem.
2010, 12, 1163.
162
(217) Gemo, N.; Sterchele, S.; Biasi, P.; Centomo, P.; Canu, P.; Zecca, M.; Shchukarev, A.;
Kordàs, K.; Salmi, T. O.; Mikkola, J.-P. Catal. Sci. Technol. 2015, 5, 3543.
(218) Melada, S.; Pinna, F.; Strukul, G.; Perathoner, S.; Centi, G. J. Catal. 2006, 237, 213.
(219) Burch, R.; Ellis, P. R. Appl. Catal., B 2003, 42, 203.
(220) Ouyang, L.; Tian, P.-F.; Da, G.-J.; Xu, H.-C.; Ao, C.; Chen, T.-Y.; Si, R.; Xu, J.; Han,
Y.-F. J. Catal. 2015, 321, 70.
(221) Landon, P.; Collier, P. J.; Papworth, A. J.; Kiely, C. J.; G.J., H. Chem. Commun. 2002,
2058.
163
APPENDIX A
SUPPLEMENTARY DATA AND ANALYSIS FOR CHAPTER 2
This Appendix includes supplementary information for understanding the direct synthesis
of H2O2 on Pd clusters such as additional TEM images, the approach to avoid mass transfer
limitations, derivations of rate expressions and equilibrium constants, and additional rate and
selectivity data.
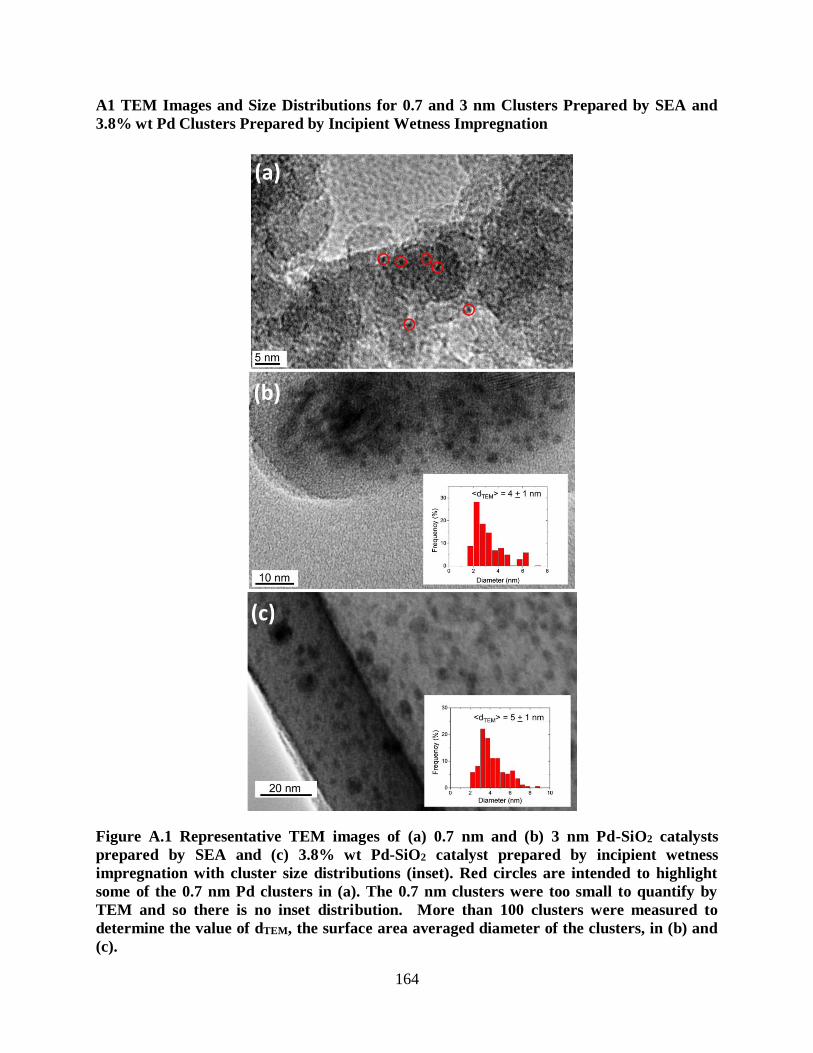
164
A1 TEM Images and Size Distributions for 0.7 and 3 nm Clusters Prepared by SEA and
3.8% wt Pd Clusters Prepared by Incipient Wetness Impregnation
Figure A.1 Representative TEM images of (a) 0.7 nm and (b) 3 nm Pd-SiO2 catalysts
prepared by SEA and (c) 3.8% wt Pd-SiO2 catalyst prepared by incipient wetness
impregnation with cluster size distributions (inset). Red circles are intended to highlight
some of the 0.7 nm Pd clusters in (a). The 0.7 nm clusters were too small to quantify by
TEM and so there is no inset distribution. More than 100 clusters were measured to
determine the value of dTEM, the surface area averaged diameter of the clusters, in (b) and
(c).
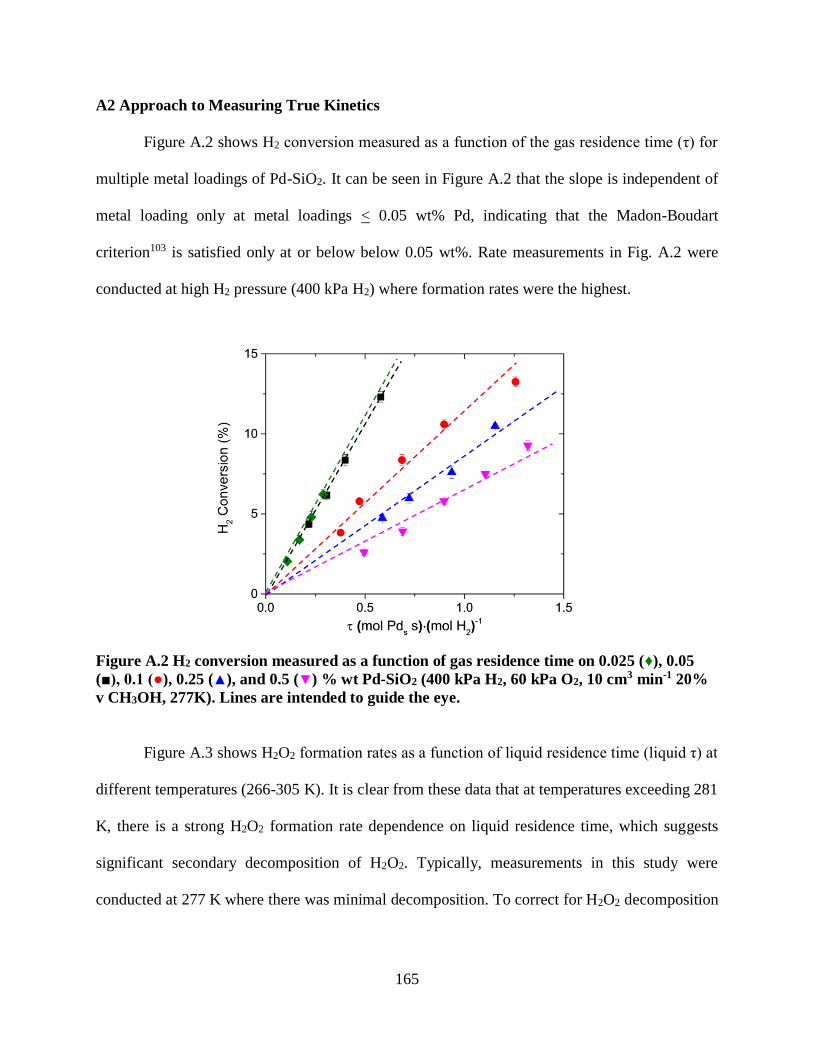
165
A2 Approach to Measuring True Kinetics
Figure A.2 shows H2 conversion measured as a function of the gas residence time (τ) for
multiple metal loadings of Pd-SiO2. It can be seen in Figure A.2 that the slope is independent of
metal loading only at metal loadings < 0.05 wt% Pd, indicating that the Madon-Boudart
criterion103 is satisfied only at or below below 0.05 wt%. Rate measurements in Fig. A.2 were
conducted at high H2 pressure (400 kPa H2) where formation rates were the highest.
Figure A.2 H2 conversion measured as a function of gas residence time on 0.025 (♦), 0.05
(■), 0.1 (●), 0.25 (▲), and 0.5 (▼) % wt Pd-SiO2 (400 kPa H2, 60 kPa O2, 10 cm3 min-1 20%
v CH3OH, 277K). Lines are intended to guide the eye.
Figure A.3 shows H2O2 formation rates as a function of liquid residence time (liquid τ) at
different temperatures (266-305 K). It is clear from these data that at temperatures exceeding 281
K, there is a strong H2O2 formation rate dependence on liquid residence time, which suggests
significant secondary decomposition of H2O2. Typically, measurements in this study were
conducted at 277 K where there was minimal decomposition. To correct for H2O2 decomposition
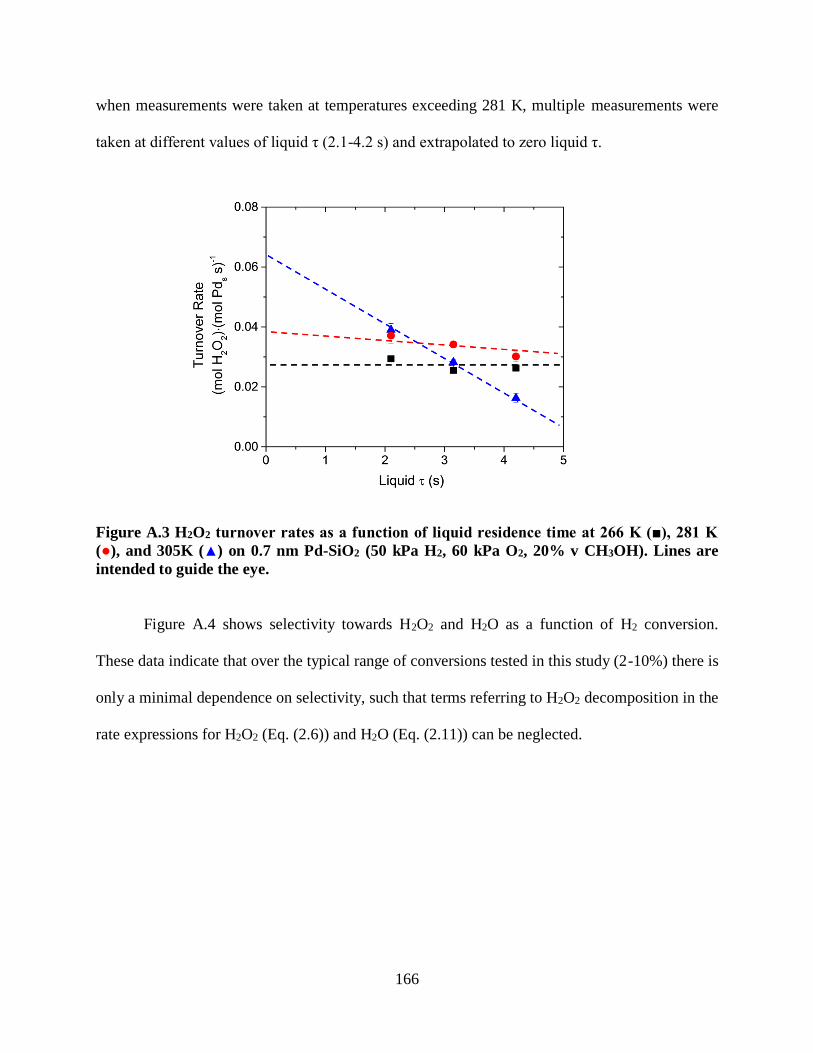
166
when measurements were taken at temperatures exceeding 281 K, multiple measurements were
taken at different values of liquid τ (2.1-4.2 s) and extrapolated to zero liquid τ.
Figure A.3 H2O2 turnover rates as a function of liquid residence time at 266 K (■), 281 K
(●), and 305K (▲) on 0.7 nm Pd-SiO2 (50 kPa H2, 60 kPa O2, 20% v CH3OH). Lines are
intended to guide the eye.
Figure A.4 shows selectivity towards H2O2 and H2O as a function of H2 conversion.
These data indicate that over the typical range of conversions tested in this study (2-10%) there is
only a minimal dependence on selectivity, such that terms referring to H2O2 decomposition in the
rate expressions for H2O2 (Eq. (2.6)) and H2O (Eq. (2.11)) can be neglected.
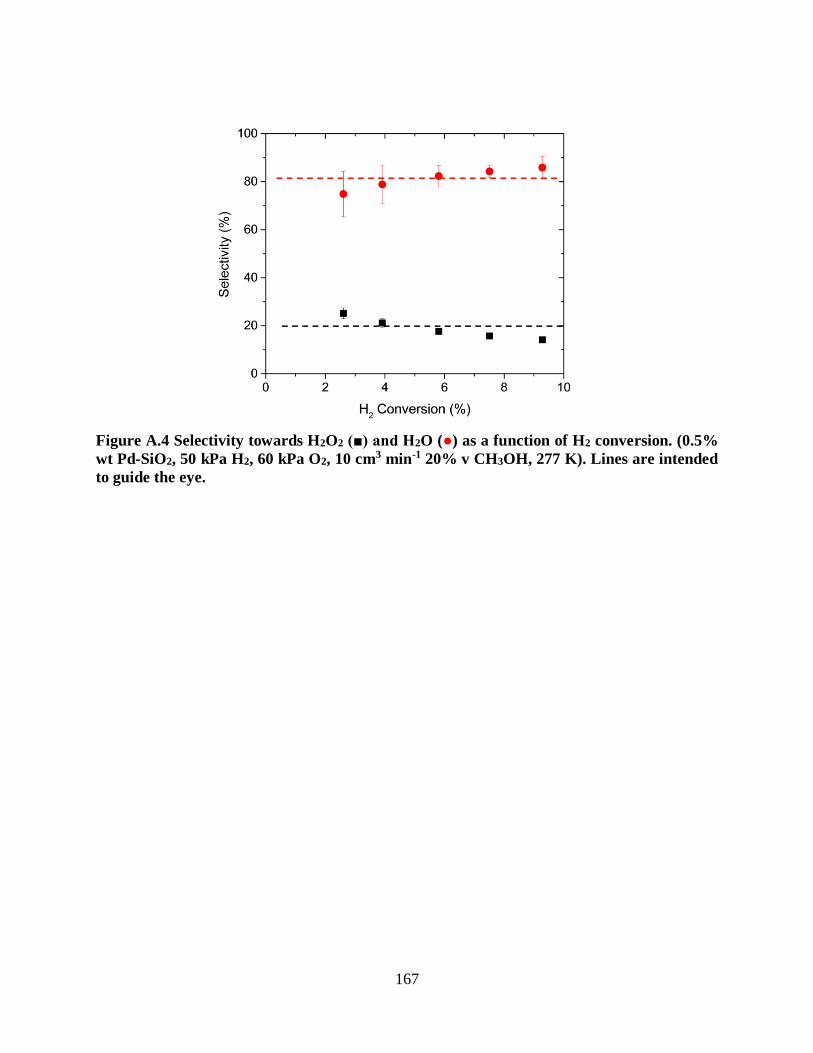
167
Figure A.4 Selectivity towards H2O2 (■) and H2O (●) as a function of H2 conversion. (0.5%
wt Pd-SiO2, 50 kPa H2, 60 kPa O2, 10 cm3 min-1 20% v CH3OH, 277 K). Lines are intended
to guide the eye.

168
A3 Calculations for the O2 Pressure Needed to Achieve a MARI of H2O*
Here, we present calculations to estimate the O2 pressure necessary to change the most
abundant reactive intermediate (MARI) from empty sites in solution (H2O*) to chemisorbed O2
(O2**), as shown by:
2𝐻2𝑂 ∗ +𝑂2(𝑔)𝐾𝜙↔ 2𝐻2𝑂(𝑙) + 𝑂2 ∗∗ (A3.1)
where 𝐾𝜙 is the equilibrium constant describing O2 adsorption on an H2O saturated Pd surface.
Here, 𝐾𝜙 represents the activities of all species in equation A3.1:
𝐾𝜙 =𝑎𝐻2𝑂
2
𝜇𝑎𝑂2 (A3.2)
where ax is the activity of species x and μ is the ratio of 𝑎𝐻2𝑂∗2 to 𝑎𝑂2∗∗. Here, H2O is in the
liquid phase and it is thus assumed that 𝑎𝐻2𝑂 is equal to unity. The value of 𝑎𝑂2 can be related to
O2 pressure by:
𝑎𝑂2 = 𝛾𝑃𝑂2
𝑃𝑂2,0 (A3.3)
where 𝑃𝑂2 is the partial pressure of O2, 𝑃𝑂2,0 is the standard pressure (1 bar), and 𝛾 is the activity
coefficient (estimated to be unity). The equilibrium constant 𝐾𝜙 can be estimated from the
calculated value for the change in free energy (ΔG) for displacing H2O on the surface with O2
(-39 kJ mol-1)105 by:
𝐾𝜙 = 𝑒−𝛥𝐺
𝑅𝑇 (A3.4)
where R is the ideal gas constant and T is the temperature in K. By assuming that a MARI of
H2O* would require a μ value greater than 100, and by combining equations A3.2, A3.3, and
A3.4, it was calculated that a minimum O2 pressure of 5.3·10-8 kPa is required to achieve an
H2O* MARI. It is notable that despite multiple assumptions made throughout the derivation, the

169
minimum O2 pressure is many orders of magnitude separated from the lowest O2 pressure tested
in this study (25 kPa).
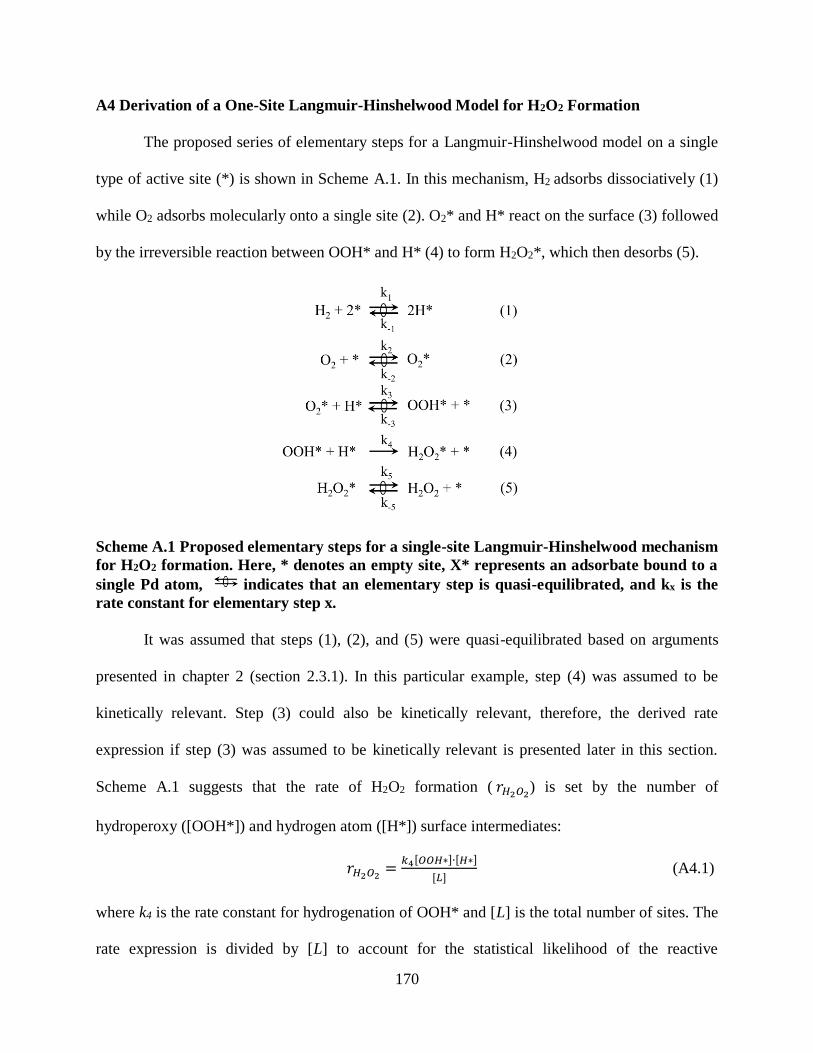
170
A4 Derivation of a One-Site Langmuir-Hinshelwood Model for H2O2 Formation
The proposed series of elementary steps for a Langmuir-Hinshelwood model on a single
type of active site (*) is shown in Scheme A.1. In this mechanism, H2 adsorbs dissociatively (1)
while O2 adsorbs molecularly onto a single site (2). O2* and H* react on the surface (3) followed
by the irreversible reaction between OOH* and H* (4) to form H2O2*, which then desorbs (5).
Scheme A.1 Proposed elementary steps for a single-site Langmuir-Hinshelwood mechanism
for H2O2 formation. Here, * denotes an empty site, X* represents an adsorbate bound to a
single Pd atom, indicates that an elementary step is quasi-equilibrated, and kx is the
rate constant for elementary step x.
It was assumed that steps (1), (2), and (5) were quasi-equilibrated based on arguments
presented in chapter 2 (section 2.3.1). In this particular example, step (4) was assumed to be
kinetically relevant. Step (3) could also be kinetically relevant, therefore, the derived rate
expression if step (3) was assumed to be kinetically relevant is presented later in this section.
Scheme A.1 suggests that the rate of H2O2 formation ( 𝑟𝐻2𝑂2) is set by the number of
hydroperoxy ([OOH*]) and hydrogen atom ([H*]) surface intermediates:
𝑟𝐻2𝑂2 =𝑘4[𝑂𝑂𝐻∗]∙[𝐻∗]
[𝐿] (A4.1)
where k4 is the rate constant for hydrogenation of OOH* and [L] is the total number of sites. The
rate expression is divided by [L] to account for the statistical likelihood of the reactive
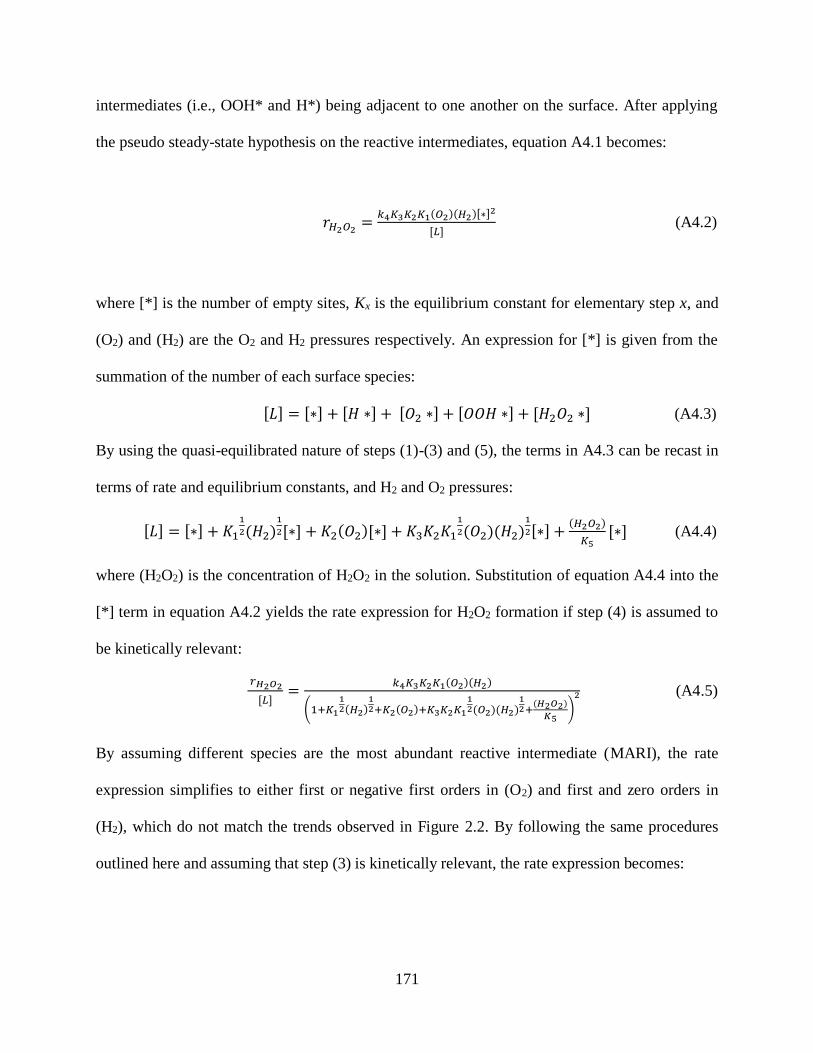
171
intermediates (i.e., OOH* and H*) being adjacent to one another on the surface. After applying
the pseudo steady-state hypothesis on the reactive intermediates, equation A4.1 becomes:
𝑟𝐻2𝑂2 =𝑘4𝐾3𝐾2𝐾1(𝑂2)(𝐻2)[∗]
2
[𝐿] (A4.2)
where [*] is the number of empty sites, Kx is the equilibrium constant for elementary step x, and
(O2) and (H2) are the O2 and H2 pressures respectively. An expression for [*] is given from the
summation of the number of each surface species:
[𝐿] = [∗] + [𝐻 ∗] + [𝑂2 ∗] + [𝑂𝑂𝐻 ∗] + [𝐻2𝑂2 ∗] (A4.3)
By using the quasi-equilibrated nature of steps (1)-(3) and (5), the terms in A4.3 can be recast in
terms of rate and equilibrium constants, and H2 and O2 pressures:
[𝐿] = [∗] + 𝐾11
2(𝐻2)1
2[∗] + 𝐾2(𝑂2)[∗] + 𝐾3𝐾2𝐾11
2(𝑂2)(𝐻2)1
2[∗] +(𝐻2𝑂2)
𝐾5[∗] (A4.4)
where (H2O2) is the concentration of H2O2 in the solution. Substitution of equation A4.4 into the
[*] term in equation A4.2 yields the rate expression for H2O2 formation if step (4) is assumed to
be kinetically relevant:
𝑟𝐻2𝑂2
[𝐿]=
𝑘4𝐾3𝐾2𝐾1(𝑂2)(𝐻2)
(1+𝐾112(𝐻2)
12+𝐾2(𝑂2)+𝐾3𝐾2𝐾1
12(𝑂2)(𝐻2)
12+(𝐻2𝑂2)
𝐾5)
2 (A4.5)
By assuming different species are the most abundant reactive intermediate (MARI), the rate
expression simplifies to either first or negative first orders in (O2) and first and zero orders in
(H2), which do not match the trends observed in Figure 2.2. By following the same procedures
outlined here and assuming that step (3) is kinetically relevant, the rate expression becomes:
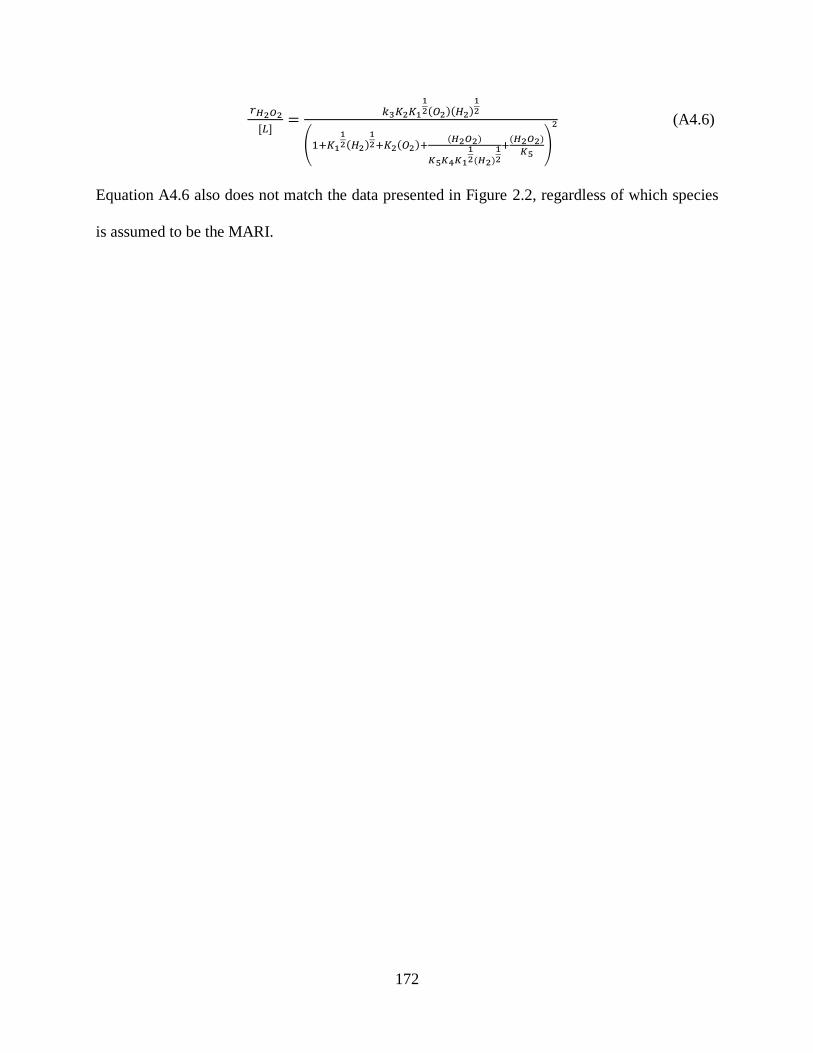
172
𝑟𝐻2𝑂2
[𝐿]=
𝑘3𝐾2𝐾112(𝑂2)(𝐻2)
12
(1+𝐾112(𝐻2)
12+𝐾2(𝑂2)+
(𝐻2𝑂2)
𝐾5𝐾4𝐾1
12(𝐻2)
12
+(𝐻2𝑂2)
𝐾5)
2 (A4.6)
Equation A4.6 also does not match the data presented in Figure 2.2, regardless of which species
is assumed to be the MARI.

173
A5 Derivation of a Two-Site Langmuir-Hinshelwood Model for H2O2 Formation
Scheme A.2 presents a proposed series of elementary steps for a Langmuir-Hinshelwood
mechanism that involves two types of sites, specifically, sites that will only form bonds with
hydrogen (*) and sites that will only form bonds with oxygen (□). H2 adsorbs onto the * sites
dissociatively (1), while O2 adsorbs onto □ sites molecularly (2). H* then reacts with O2□ to
form OOH□ (3), followed by hydrogenation of OOH□ by H* (4), yielding the final product
(H2O2□) which then desorbs from the □ site (5).
Scheme A.2 Proposed elementary steps for a two-site Langmuir-Hinshelwood mechanism
for H2O2 formation. Here, * denotes an empty site that can only bind H-atoms, H*
represents a H-atom bound to a * site, □ denotes a site that can only bind to oxygen, X□
corresponds to a species X bound to a □ site, indicates that an elementary step is quasi-
equilibrated, and kx is the rate constant for elementary step x.
Steps (1), (2), and (5) were assumed to be quasi-equilibrated based on arguments presented in the
main text (section 3.1). In this derivation, step (4) was assumed to be kinetically relevant.
However, it could be assumed that step (3) was kinetically relevant, therefore, the rate expression
derived by assuming that step (3) was kinetically relevant is presented later in this section.
Scheme A.2 indicates that the rate of H2O2 formation ( 𝑟𝐻2𝑂2) can be defined by the number of
hydroperoxy ([OOH□]) and hydrogen ([H*]) surface species:

174
𝑟𝐻2𝑂2 =𝑘4[𝑂𝑂𝐻□]∙[𝐻∗]
[𝐿∗] (A5.1)
where k4 is the rate constant for step (4) and [L*] is the total number of * sites. The rate equation
A5.1 is divided by [L*] to account for the statistical likelihood of OOH□ being adjacent to H*.
Note that there is no meaningful difference in the final rate expression if the reference species is
taken to be H* and the rate is divided by the total number of □ sites ([L□]). The pseudo steady-
state hypothesis is then applied to the reactive intermediates to re-express A5.1 in terms of the
partial pressures of H2 ((H2)) and O2 ((O2)):
𝑟𝐻2𝑂2 =𝑘4𝐾3𝐾2𝐾1(𝑂2)(𝐻2)[∗][□]
[𝐿∗] (A5.2)
where Kx is the equilibrium constant for elementary step x and [*] and [□] are the numbers of *
and □ sites respectively. Expressions for [*] and [□] are given by summing the total number of
species on * sites:
𝐿∗ = [∗] + [𝐻 ∗] (A5.3)
and by summing the total number of species on □ sites:
𝐿□ = [□] + [𝑂2□] + [𝑂𝑂𝐻□] + [𝐻2𝑂2□] (A5.4)
The quasi-equilibrated nature of steps (1)-(3) and (5) allow for equations A5.3 and A5.4 to be
recast in terms of (H2), (O2), and the rate and equilibrium constants, such that they take on the
forms:
𝐿∗ = [∗] + 𝐾11
2(𝐻2)1
2[∗] (A5.5)
and:
𝐿□ = [□] + 𝐾2(𝑂2)[□] + 𝐾3𝐾2𝐾11
2(𝑂2)(𝐻2)1
2[□] +(𝐻2𝑂2)
𝐾5[□] (A5.6)

175
where (H2O2) is the concentration of H2O2 in solution. Substitution of equations A5.5 and A5.6
into the terms for [*] and [□], respectively, in equation A5.2 yields the rate expression for H2O2
formation:
𝑟𝐻2𝑂2
𝐿□=
𝑘4𝐾3𝐾2𝐾1(𝑂2)(𝐻2)
(1+𝐾112(𝐻2)
12)(1+𝐾2(𝑂2)+𝐾3𝐾2𝐾1
12(𝑂2)(𝐻2)
12+(𝐻2𝑂2)
𝐾5) (A5.7)
This rate expression does fit the data in Figure 2.2 if it is assumed that the * sites remain empty
(i.e., H2O*) over the entire range of H2 pressures tested (5-400 kPa H2), which is unlikely
considering the heat of adsorption for H2O on Pd (39 kJ mol-1) is significantly lower than that for
a H-atom (72 kJ mol-1, from calculated H adsorption energies112 and H2 dissociation energy).113
Evidence is also provided (section 2.3.2) that implicates proton-electron transfer is the primary
mechanism by which H2O2 is formed, not a Langmuir-Hinshelwood model. A different rate
expression is derived by following the same steps presented here but assuming that step (3) is
kinetically relevant:
𝑟𝐻2𝑂2
[𝐿]=
𝑘3𝐾2𝐾112(𝑂2)(𝐻2)
12
(1+𝐾112(𝐻2)
12)(𝐾2(𝑂2)+
(𝐻2𝑂2)
𝐾5𝐾4𝐾1
12(𝐻2)
12
+(𝐻2𝑂2)
𝐾5)
(A5.8)
Unlike equation A5.7, this rate expression cannot describe the data in Fig. 2.2 regardless of any
assumptions about the identity of the most abundant reactive intermediate (MARI).

176
A6 Complete Derivation of the Eley-Rideal Mechanism for H2O2 and H2O Formation
Scheme 2.1 shows the proposed series of elementary steps for H2O2 formation by an
Eley-Rideal mechanism. The reasoning behind the different assumptions about the quasi-
equilibrated, kinetically relevant, and reversible nature of the different elementary steps is
presented in the main text (section 2.3.1). Scheme 2.1 suggests that the rate of H2O2 formation
( 𝑟𝐻2𝑂2) increases with the number of hydroperoxy surface intermediates ([OOH**]) and the
concentration of H+ in solution and decreases with the number of adsorbed H2O2 ([H2O2**]):
𝑟𝐻2𝑂2 = 𝑘5 ∙ [𝑂𝑂𝐻 ∗∗] ∙ [𝐻+] ∙ [𝑒−] − 𝑘12 ∙ [𝐻2𝑂2 ∗∗] (A6.1)
where kx is the rate constant for step x, [H+] is the concentration of H+, and [e-] is the number of
free e- on the cluster. The quasi-equilibrated nature of steps (1)-(4), and (6) allow for the number
of surface intermediates ([X] for surface intermediate X) to be expressed in terms of the
equilibrium constants Kx for each step x. For step (1) the equilibrium constant is defined as:
𝐾1 =[𝐻∗]2
(𝐻2)[∗]2 (A6.2)
for step (2):
𝐾2 =[𝐻+][𝑒−][∗]
[𝐻∗] (A6.3)
for step (3):
𝐾3 =[𝑂2∗∗]
(𝑂2)[∗∗] (A6.4)
for step (4):
𝐾4 =[𝑂𝑂𝐻∗∗]
[𝑂2∗∗][𝐻+][𝑒−]
(A6.5)
and for step (6):
𝐾6 =(𝐻2𝑂2)[∗∗]
[𝐻2𝑂2∗∗] (A6.6)
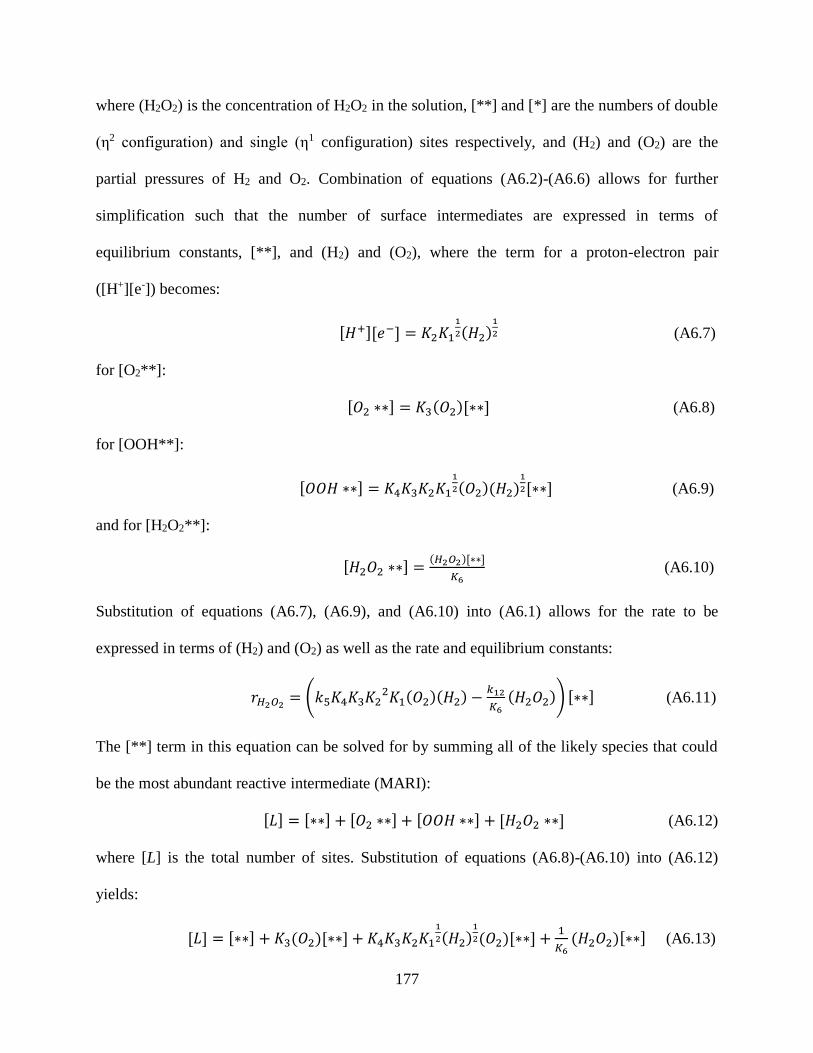
177
where (H2O2) is the concentration of H2O2 in the solution, [**] and [*] are the numbers of double
(η2 configuration) and single (η1 configuration) sites respectively, and (H2) and (O2) are the
partial pressures of H2 and O2. Combination of equations (A6.2)-(A6.6) allows for further
simplification such that the number of surface intermediates are expressed in terms of
equilibrium constants, [**], and (H2) and (O2), where the term for a proton-electron pair
([H+][e-]) becomes:
[𝐻+][𝑒−] = 𝐾2𝐾11
2(𝐻2)1
2 (A6.7)
for [O2**]:
[𝑂2 ∗∗] = 𝐾3(𝑂2)[∗∗] (A6.8)
for [OOH**]:
[𝑂𝑂𝐻 ∗∗] = 𝐾4𝐾3𝐾2𝐾11
2(𝑂2)(𝐻2)1
2[∗∗] (A6.9)
and for [H2O2**]:
[𝐻2𝑂2 ∗∗] =(𝐻2𝑂2)[∗∗]
𝐾6 (A6.10)
Substitution of equations (A6.7), (A6.9), and (A6.10) into (A6.1) allows for the rate to be
expressed in terms of (H2) and (O2) as well as the rate and equilibrium constants:
𝑟𝐻2𝑂2 = (𝑘5𝐾4𝐾3𝐾22𝐾1(𝑂2)(𝐻2) −
𝑘12
𝐾6(𝐻2𝑂2)) [∗∗] (A6.11)
The [**] term in this equation can be solved for by summing all of the likely species that could
be the most abundant reactive intermediate (MARI):
[𝐿] = [∗∗] + [𝑂2 ∗∗] + [𝑂𝑂𝐻 ∗∗] + [𝐻2𝑂2 ∗∗] (A6.12)
where [L] is the total number of sites. Substitution of equations (A6.8)-(A6.10) into (A6.12)
yields:
[𝐿] = [∗∗] + 𝐾3(𝑂2)[∗∗] + 𝐾4𝐾3𝐾2𝐾11
2(𝐻2)1
2(𝑂2)[∗∗] +1
𝐾6(𝐻2𝑂2)[∗∗] (A6.13)
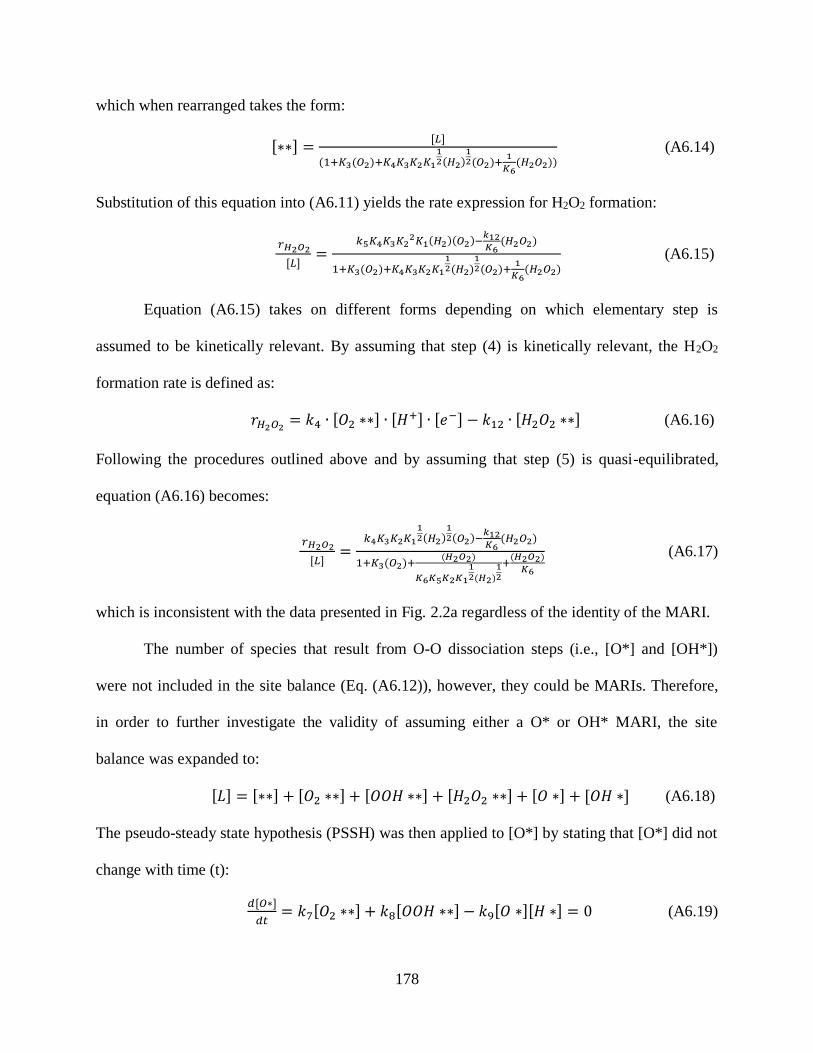
178
which when rearranged takes the form:
[∗∗] =[𝐿]
(1+𝐾3(𝑂2)+𝐾4𝐾3𝐾2𝐾112(𝐻2)
12(𝑂2)+
1
𝐾6(𝐻2𝑂2))
(A6.14)
Substitution of this equation into (A6.11) yields the rate expression for H2O2 formation:
𝑟𝐻2𝑂2
[𝐿]=
𝑘5𝐾4𝐾3𝐾22𝐾1(𝐻2)(𝑂2)−
𝑘12𝐾6(𝐻2𝑂2)
1+𝐾3(𝑂2)+𝐾4𝐾3𝐾2𝐾112(𝐻2)
12(𝑂2)+
1
𝐾6(𝐻2𝑂2)
(A6.15)
Equation (A6.15) takes on different forms depending on which elementary step is
assumed to be kinetically relevant. By assuming that step (4) is kinetically relevant, the H2O2
formation rate is defined as:
𝑟𝐻2𝑂2 = 𝑘4 ∙ [𝑂2 ∗∗] ∙ [𝐻+] ∙ [𝑒−] − 𝑘12 ∙ [𝐻2𝑂2 ∗∗] (A6.16)
Following the procedures outlined above and by assuming that step (5) is quasi-equilibrated,
equation (A6.16) becomes:
𝑟𝐻2𝑂2
[𝐿]=
𝑘4𝐾3𝐾2𝐾112(𝐻2)
12(𝑂2)−
𝑘12𝐾6(𝐻2𝑂2)
1+𝐾3(𝑂2)+(𝐻2𝑂2)
𝐾6𝐾5𝐾2𝐾1
12(𝐻2)
12
+(𝐻2𝑂2)
𝐾6
(A6.17)
which is inconsistent with the data presented in Fig. 2.2a regardless of the identity of the MARI.
The number of species that result from O-O dissociation steps (i.e., [O*] and [OH*])
were not included in the site balance (Eq. (A6.12)), however, they could be MARIs. Therefore,
in order to further investigate the validity of assuming either a O* or OH* MARI, the site
balance was expanded to:
[𝐿] = [∗∗] + [𝑂2 ∗∗] + [𝑂𝑂𝐻 ∗∗] + [𝐻2𝑂2 ∗∗] + [𝑂 ∗] + [𝑂𝐻 ∗] (A6.18)
The pseudo-steady state hypothesis (PSSH) was then applied to [O*] by stating that [O*] did not
change with time (t):
𝑑[𝑂∗]
𝑑𝑡= 𝑘7[𝑂2 ∗∗] + 𝑘8[𝑂𝑂𝐻 ∗∗] − 𝑘9[𝑂 ∗][𝐻 ∗] = 0 (A6.19)

179
Substitution of the terms derived earlier for the surface intermediates (Eqs. (A6.7)-(A6.10))
allow for [O*] to be expressed as:
[𝑂 ∗] =𝑘7𝐾3(𝑂2)[∗∗]+𝑘8𝐾4𝐾3𝐾2𝐾1
12(𝑂2)(𝐻2)
12[∗∗]
𝑘9𝐾2𝐾112(𝐻2)
12
(A6.20)
If O* was the MARI ([L]=[O*]), then the expression for H2O2 formation rate (equation (A6.15))
would simplify to:
𝑟𝐻2𝑂2
[𝐿]=
𝑘5𝐾4𝐾3𝐾22𝐾1(𝐻2)(𝑂2)−
𝑘12𝐾6(𝐻2𝑂2)
(𝑘7𝐾3(𝑂2)+𝑘8𝐾4𝐾3𝐾2𝐾1
12(𝑂2)(𝐻2)
12
𝑘9𝐾2𝐾1
12(𝐻2)
12
)
(A6.21)
If the 𝑘12
𝐾6(𝐻2𝑂2) term is neglected (see section 2.3.1), then it can be easily seen that there is no
dependence on (O2) which is consistent with Fig. 2.2a, however, there is no clear first- or half-
order dependence on (H2). Therefore, the dependence on (H2) is inconsistent with the data in Fig.
2.2a. Therefore O* cannot be the MARI.
In order to examine if a MARI of OH* could describe the data, the PSSH was applied to
[OH*]:
𝑑[𝑂𝐻∗]
𝑑𝑡= 𝑘8[𝑂𝑂𝐻 ∗∗]+𝑘9[𝑂 ∗][𝐻 ∗] − 𝑘10[𝑂𝐻 ∗∗][𝐻 ∗] + 2𝑘12[𝐻2𝑂2 ∗∗] = 0 (A6.22)
and the surface intermediate terms were evaluated using equations (A6.7)-(A6.10) and (A6.20)
in order to derive an expression for [OH*]:
[𝑂𝐻 ∗] =2𝑘8𝐾4𝐾3𝐾2𝐾1
12(𝑂2)(𝐻2)
12[∗∗]+𝑘7𝐾3(𝑂2)[∗∗]+
2𝑘12(𝐻2𝑂2)[∗∗]
𝐾6
𝑘10𝐾2𝐾112(𝐻2)
12
(A6.23)
By assuming that the MARI is OH*, equation (A6.15) simplifies to:
𝑟𝐻2𝑂2
[𝐿]=
𝑘5𝐾4𝐾3𝐾22𝐾1(𝐻2)(𝑂2)−
𝑘12𝐾6(𝐻2𝑂2)
(2𝑘8𝐾4𝐾3𝐾2𝐾1
12(𝑂2)(𝐻2)
12+𝑘7𝐾3(𝑂2)+
2𝑘12(𝐻2𝑂2)𝐾6
𝑘10𝐾2𝐾1
12(𝐻2)
12
)
(A6.24)
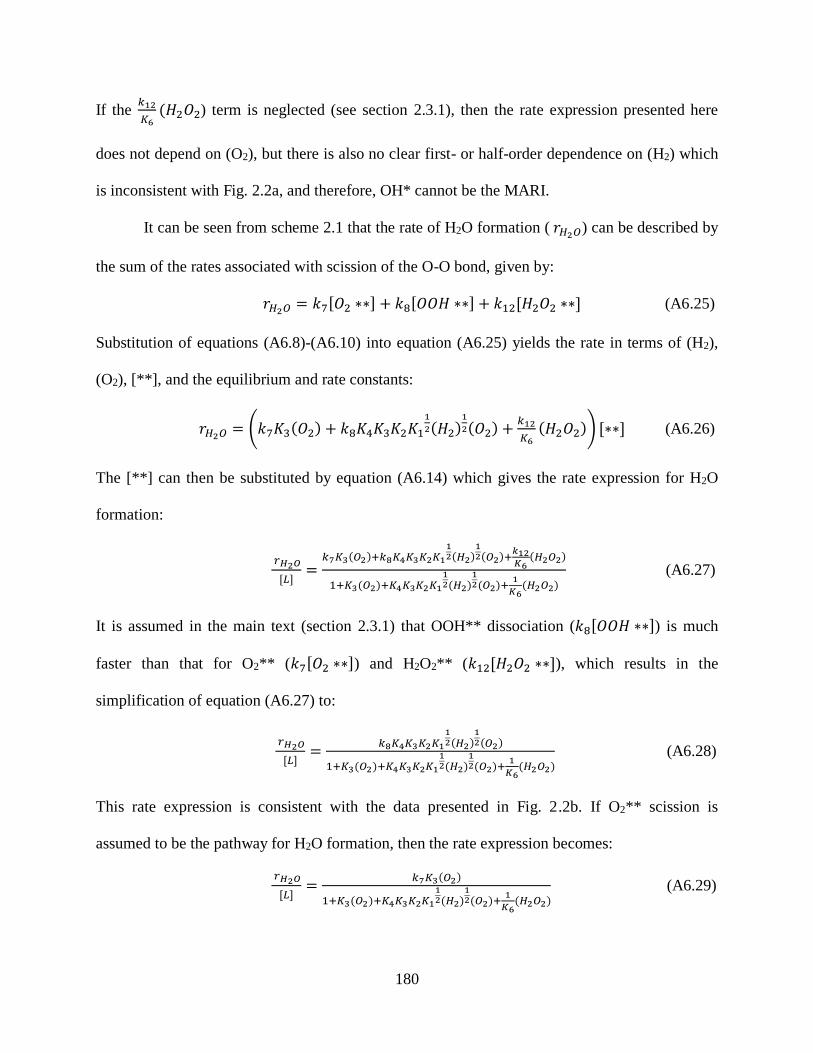
180
If the 𝑘12
𝐾6(𝐻2𝑂2) term is neglected (see section 2.3.1), then the rate expression presented here
does not depend on (O2), but there is also no clear first- or half-order dependence on (H2) which
is inconsistent with Fig. 2.2a, and therefore, OH* cannot be the MARI.
It can be seen from scheme 2.1 that the rate of H2O formation ( 𝑟𝐻2𝑂) can be described by
the sum of the rates associated with scission of the O-O bond, given by:
𝑟𝐻2𝑂 = 𝑘7[𝑂2 ∗∗] + 𝑘8[𝑂𝑂𝐻 ∗∗] + 𝑘12[𝐻2𝑂2 ∗∗] (A6.25)
Substitution of equations (A6.8)-(A6.10) into equation (A6.25) yields the rate in terms of (H2),
(O2), [**], and the equilibrium and rate constants:
𝑟𝐻2𝑂 = (𝑘7𝐾3(𝑂2) + 𝑘8𝐾4𝐾3𝐾2𝐾11
2(𝐻2)1
2(𝑂2) +𝑘12
𝐾6(𝐻2𝑂2)) [∗∗] (A6.26)
The [**] can then be substituted by equation (A6.14) which gives the rate expression for H2O
formation:
𝑟𝐻2𝑂
[𝐿]=𝑘7𝐾3(𝑂2)+𝑘8𝐾4𝐾3𝐾2𝐾1
12(𝐻2)
12(𝑂2)+
𝑘12𝐾6(𝐻2𝑂2)
1+𝐾3(𝑂2)+𝐾4𝐾3𝐾2𝐾112(𝐻2)
12(𝑂2)+
1
𝐾6(𝐻2𝑂2)
(A6.27)
It is assumed in the main text (section 2.3.1) that OOH** dissociation (𝑘8[𝑂𝑂𝐻 ∗∗]) is much
faster than that for O2** (𝑘7[𝑂2 ∗∗]) and H2O2** (𝑘12[𝐻2𝑂2 ∗∗]), which results in the
simplification of equation (A6.27) to:
𝑟𝐻2𝑂
[𝐿]=
𝑘8𝐾4𝐾3𝐾2𝐾112(𝐻2)
12(𝑂2)
1+𝐾3(𝑂2)+𝐾4𝐾3𝐾2𝐾112(𝐻2)
12(𝑂2)+
1
𝐾6(𝐻2𝑂2)
(A6.28)
This rate expression is consistent with the data presented in Fig. 2.2b. If O2** scission is
assumed to be the pathway for H2O formation, then the rate expression becomes:
𝑟𝐻2𝑂
[𝐿]=
𝑘7𝐾3(𝑂2)
1+𝐾3(𝑂2)+𝐾4𝐾3𝐾2𝐾112(𝐻2)
12(𝑂2)+
1
𝐾6(𝐻2𝑂2)
(A6.29)
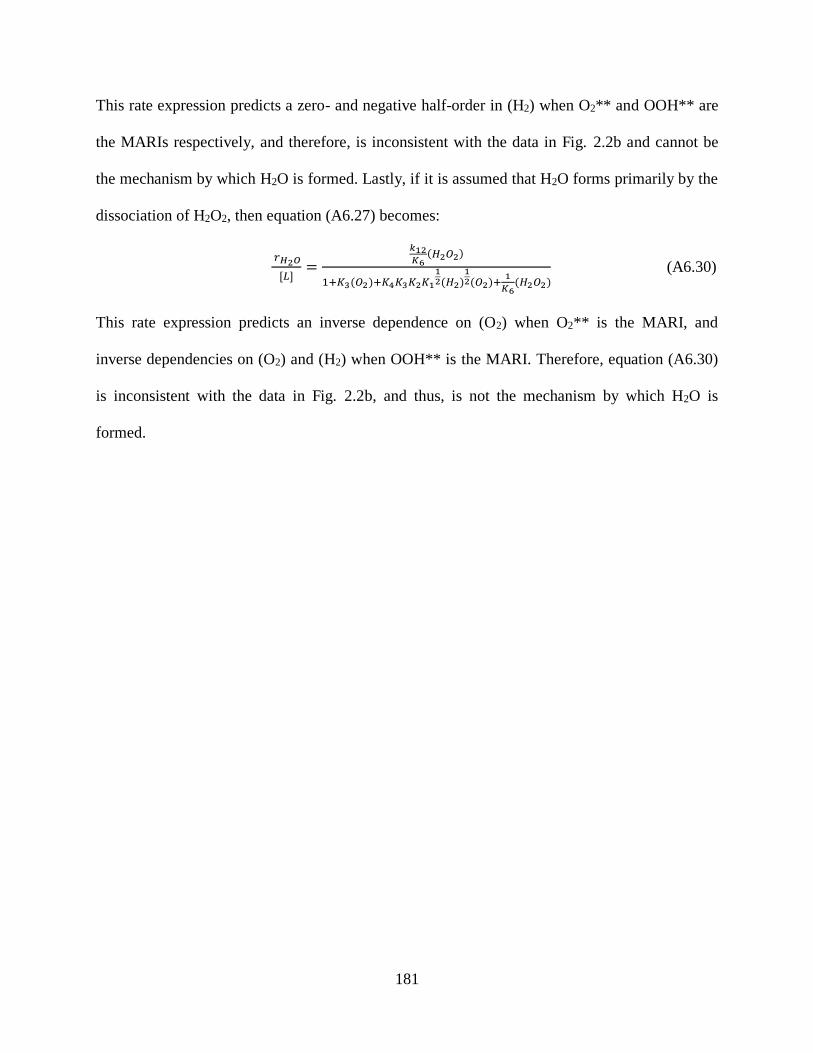
181
This rate expression predicts a zero- and negative half-order in (H2) when O2** and OOH** are
the MARIs respectively, and therefore, is inconsistent with the data in Fig. 2.2b and cannot be
the mechanism by which H2O is formed. Lastly, if it is assumed that H2O forms primarily by the
dissociation of H2O2, then equation (A6.27) becomes:
𝑟𝐻2𝑂
[𝐿]=
𝑘12𝐾6(𝐻2𝑂2)
1+𝐾3(𝑂2)+𝐾4𝐾3𝐾2𝐾112(𝐻2)
12(𝑂2)+
1
𝐾6(𝐻2𝑂2)
(A6.30)
This rate expression predicts an inverse dependence on (O2) when O2** is the MARI, and
inverse dependencies on (O2) and (H2) when OOH** is the MARI. Therefore, equation (A6.30)
is inconsistent with the data in Fig. 2.2b, and thus, is not the mechanism by which H2O is
formed.
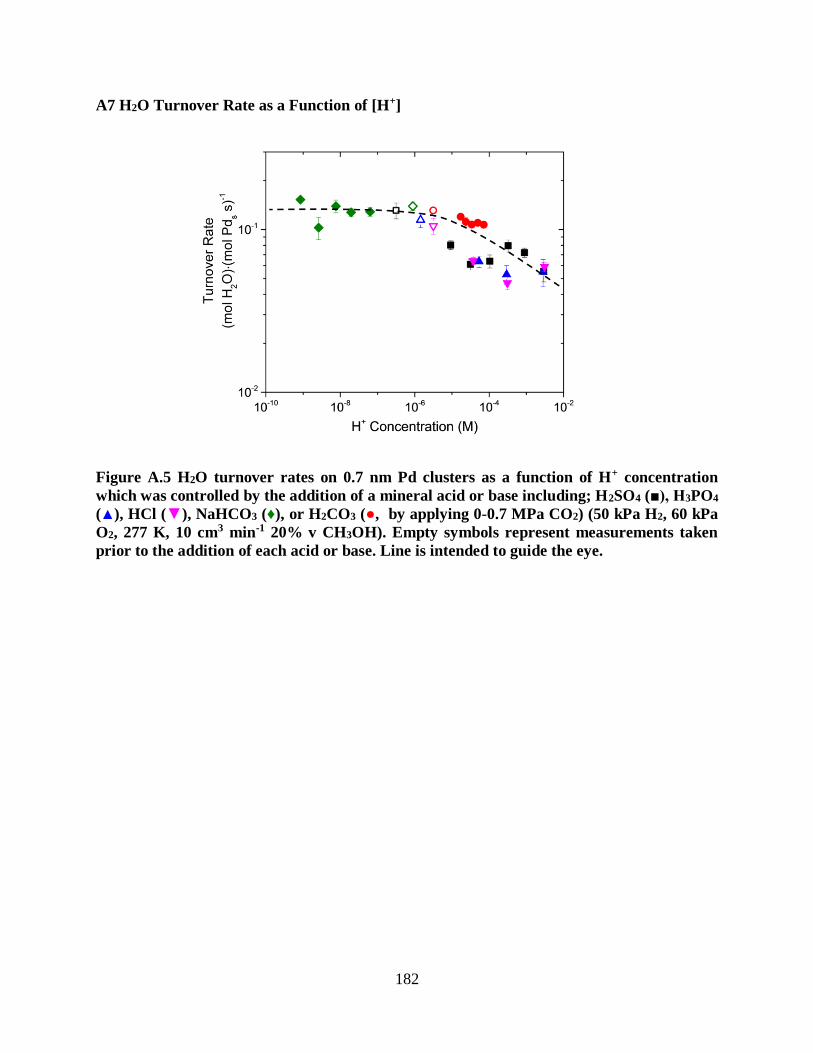
182
A7 H2O Turnover Rate as a Function of [H+]
Figure A.5 H2O turnover rates on 0.7 nm Pd clusters as a function of H+ concentration which was controlled by the addition of a mineral acid or base including; H2SO4 (■), H3PO4
(▲), HCl (▼), NaHCO3 (♦), or H2CO3 (●, by applying 0-0.7 MPa CO2) (50 kPa H2, 60 kPa
O2, 277 K, 10 cm3 min-1 20% v CH3OH). Empty symbols represent measurements taken
prior to the addition of each acid or base. Line is intended to guide the eye.
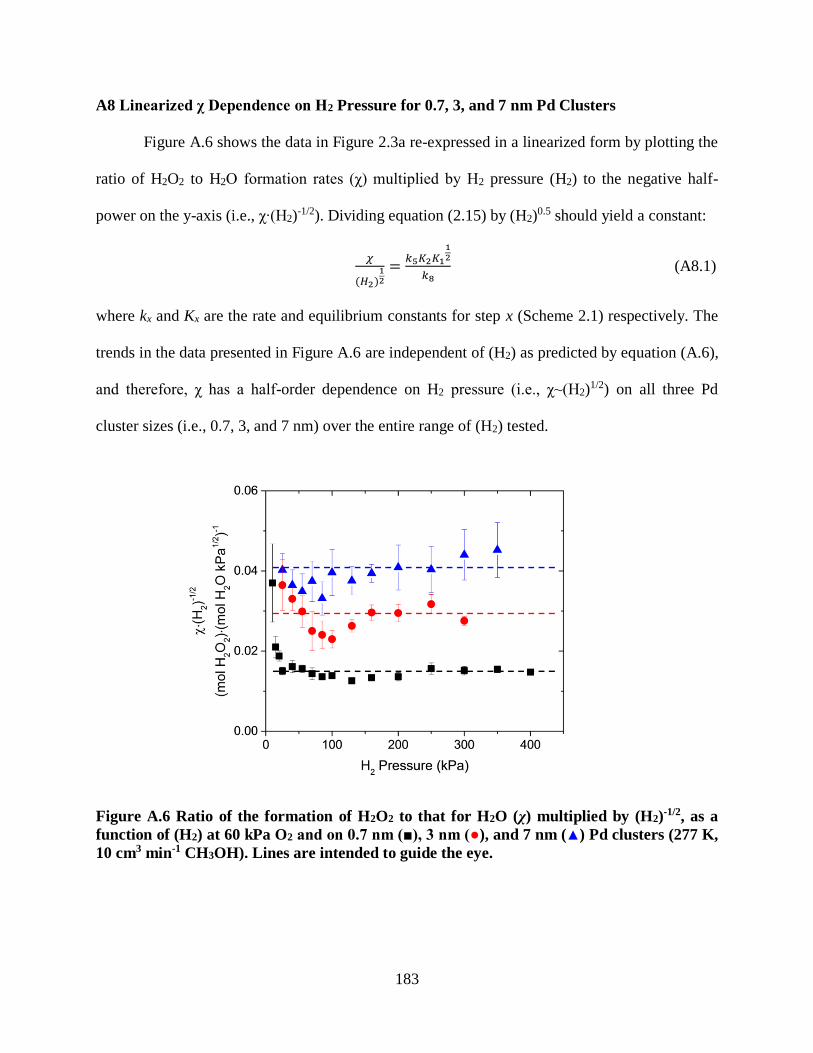
183
A8 Linearized χ Dependence on H2 Pressure for 0.7, 3, and 7 nm Pd Clusters
Figure A.6 shows the data in Figure 2.3a re-expressed in a linearized form by plotting the
ratio of H2O2 to H2O formation rates (χ) multiplied by H2 pressure (H2) to the negative half-
power on the y-axis (i.e., χ∙(H2)-1/2). Dividing equation (2.15) by (H2)
0.5 should yield a constant:
𝜒
(𝐻2)12
=𝑘5𝐾2𝐾1
12
𝑘8 (A8.1)
where kx and Kx are the rate and equilibrium constants for step x (Scheme 2.1) respectively. The
trends in the data presented in Figure A.6 are independent of (H2) as predicted by equation (A.6),
and therefore, χ has a half-order dependence on H2 pressure (i.e., χ~(H2)1/2) on all three Pd
cluster sizes (i.e., 0.7, 3, and 7 nm) over the entire range of (H2) tested.
Figure A.6 Ratio of the formation of H2O2 to that for H2O (χ) multiplied by (H2)-1/2, as a
function of (H2) at 60 kPa O2 and on 0.7 nm (■), 3 nm (●), and 7 nm (▲) Pd clusters (277 K,
10 cm3 min-1 CH3OH). Lines are intended to guide the eye.

184
A9 H2O2 and H2O Formation Rate Dependence on H2 and O2 Pressure for 3 and 7 nm Pd
Clusters
Figure A.7 shows H2O2 (Fig. A.7a) and H2O (Fig. A.7b) turnover rates as functions of H2
((H2)) and O2 ((O2)) pressure on 3nm Pd clusters. H2O2 and H2O formation rates do not depend
on (O2) at any conditions. H2O2 has an approximately first-order dependence on (H2) until
approximately 100 kPa H2, where the rate dependence changes to half-order in (H2). At this same
pressure (100 kPa H2), the H2O dependence on (H2) changes from half- to zero-order in (H2),
which suggests a change in the MARI (see section 2.3.1). These data are consistent with the
mechanism proposed in Scheme 2.1.
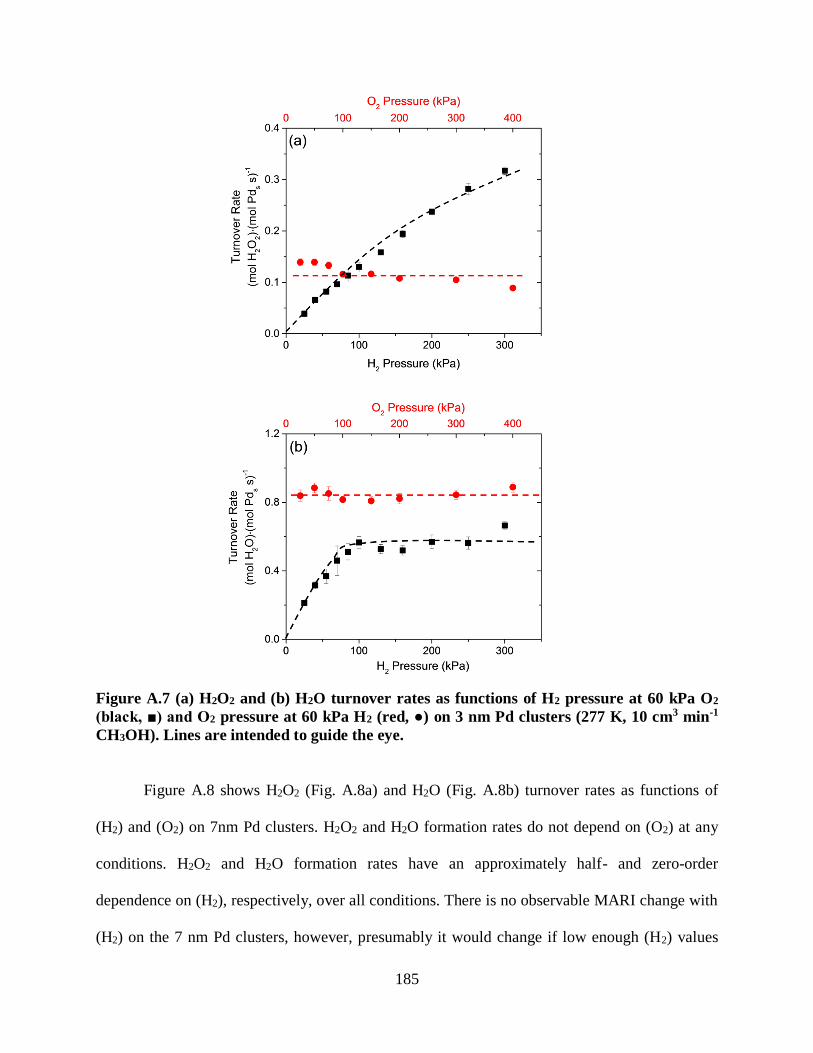
185
Figure A.7 (a) H2O2 and (b) H2O turnover rates as functions of H2 pressure at 60 kPa O2
(black, ■) and O2 pressure at 60 kPa H2 (red, ●) on 3 nm Pd clusters (277 K, 10 cm3 min-1
CH3OH). Lines are intended to guide the eye.
Figure A.8 shows H2O2 (Fig. A.8a) and H2O (Fig. A.8b) turnover rates as functions of
(H2) and (O2) on 7nm Pd clusters. H2O2 and H2O formation rates do not depend on (O2) at any
conditions. H2O2 and H2O formation rates have an approximately half- and zero-order
dependence on (H2), respectively, over all conditions. There is no observable MARI change with
(H2) on the 7 nm Pd clusters, however, presumably it would change if low enough (H2) values
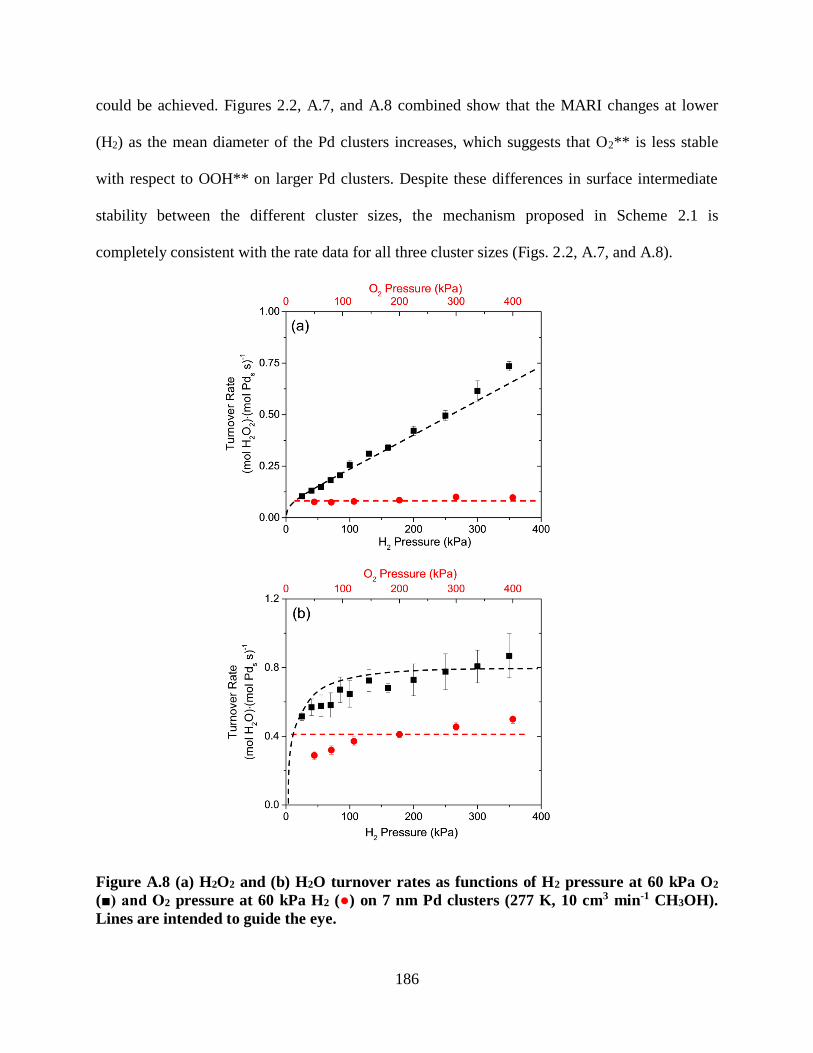
186
could be achieved. Figures 2.2, A.7, and A.8 combined show that the MARI changes at lower
(H2) as the mean diameter of the Pd clusters increases, which suggests that O2** is less stable
with respect to OOH** on larger Pd clusters. Despite these differences in surface intermediate
stability between the different cluster sizes, the mechanism proposed in Scheme 2.1 is
completely consistent with the rate data for all three cluster sizes (Figs. 2.2, A.7, and A.8).
Figure A.8 (a) H2O2 and (b) H2O turnover rates as functions of H2 pressure at 60 kPa O2
(■) and O2 pressure at 60 kPa H2 (●) on 7 nm Pd clusters (277 K, 10 cm3 min-1 CH3OH).
Lines are intended to guide the eye.

187
A10 Derivation of Equation Used to Relate 𝑲‡𝑯𝟐𝑶 to Measured H2O Turnover Rates
Transition state theory proposes that reactant species (i.e., OOH**) exist in equilibrium
with a transition state (i.e., 𝑂 − 𝑂𝐻 ∗∗‡) for a given elementary step.125 The agreement between
the rate data in Figures 2.2b, A.7b, and A.8b, and the rate expression for H2O formation (Eq.
(2.12)), indicate that the transition state is also in equilibrium with gaseous H2 and O2 reactants.
This equilibrium, as well as the form of equation (13), indicates that transition states for H2O are
in equilibrium with O2** and H2 gas, as shown in Scheme 2.3 and expressed as:
𝑂2 ∗∗ +𝐻2(𝑔)𝐾‡𝐻2𝑂↔ 𝑂 − 𝑂𝐻 ∗∗‡ (A10.1)
where 𝐾‡𝐻2𝑂 is the transition state equilibrium constant for H2O formation. Conventions of
transition state theory allow equation (A10.1) to be expressed in terms of the number of
transition state species ([𝑂 − 𝑂𝐻 ∗∗‡]) and the rate of H2O formation (𝑟𝐻2𝑂):
𝑟𝐻2𝑂
[𝐿]=𝑘𝐵𝑇
ℎ[𝑂 − 𝑂𝐻 ∗∗‡] (A10.2)
where [L] is the number of active sites, T is the temperature in K, and h and kB are Planck’s and
Boltzmann’s constants respectively. The equilibrated nature of equation (A10.1) and the
observation that H2O formation depends on H2 and O2 pressure with a half- and zero-order
dependence respectively (Fig. 2.2b), allow Eq. (A10.2) to be represented in terms of H2 pressure
((H2)) and 𝐾‡𝐻2𝑂:
𝑟𝐻2𝑂
[𝐿]=𝑘𝐵𝑇
ℎ𝐾‡𝐻2𝑂(𝐻2)
1
2 (A10.3)
Equation A10.3, in combination with equation (2.25), can be applied to calculate the overall
change in free energy (∆𝐺‡𝐻2𝑂), enthalpy (∆𝐻‡𝐻2𝑂), and entropy (∆𝑆‡𝐻2𝑂) for H2O formation.
188
APPENDIX B
SUPPLEMENTARY DATA AND ANALYSIS FOR CHAPTER 3
This Appendix includes supplementary information for understanding why AuPd clusters
are effective direct synthesis catalysts, such as additional TEM and STEM images, EDS scans,
H2O2 decomposition at various reaction conditions, detailed derivations, comparisons of the fits
of rate data to different mechanisms, H2O2 concentration as a function of time in various
solvents, Arrhenius plots, reaction coordinate diagrams, sample calculations of ΔΔH‡/T and χ,
and equations used to calculate rates and selectivities.

189
B1 TEM Images and Size Distributions of Additional Pd, Au, and AuxPd1 Clusters
Figure B.1 Representative TEM images of silica-supported (a) Pd, (b) Au7Pd1, (c) Au12Pd1,
and (d) Au catalysts with cluster size distributions (inset). More than 100 clusters were
measured to determine the value of <dTEM>, the surface area averaged diameter of the
clusters.
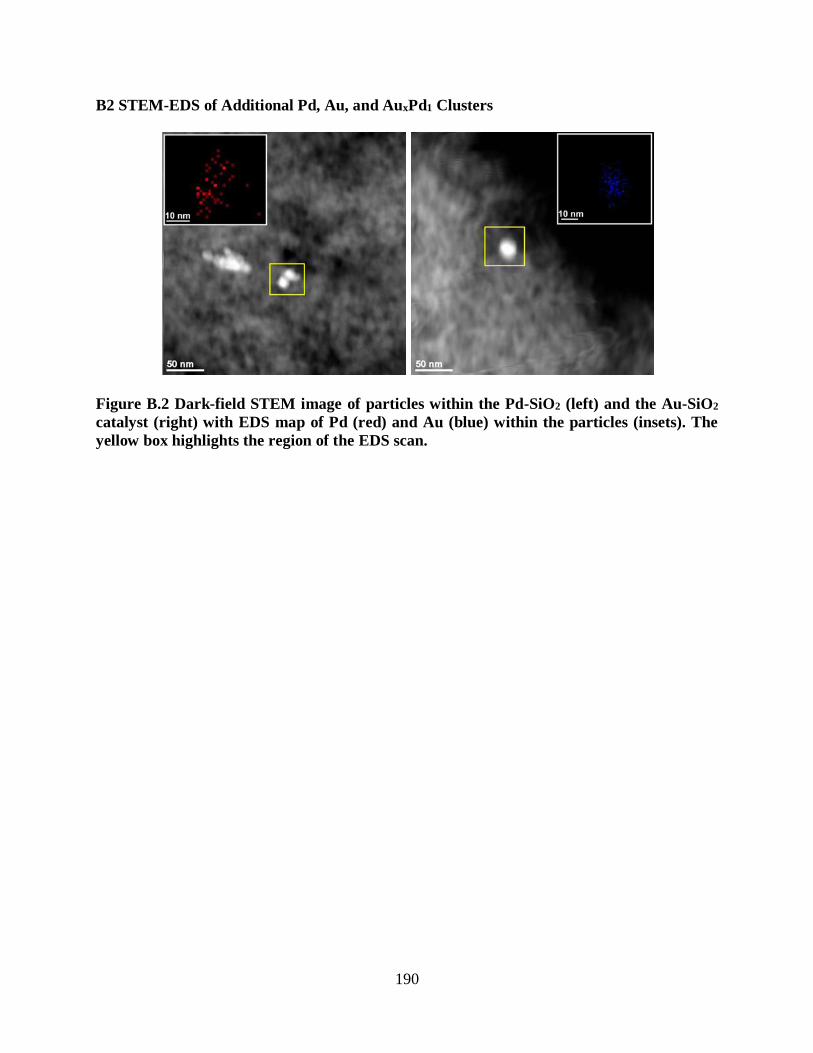
190
B2 STEM-EDS of Additional Pd, Au, and AuxPd1 Clusters
Figure B.2 Dark-field STEM image of particles within the Pd-SiO2 (left) and the Au-SiO2
catalyst (right) with EDS map of Pd (red) and Au (blue) within the particles (insets). The
yellow box highlights the region of the EDS scan.
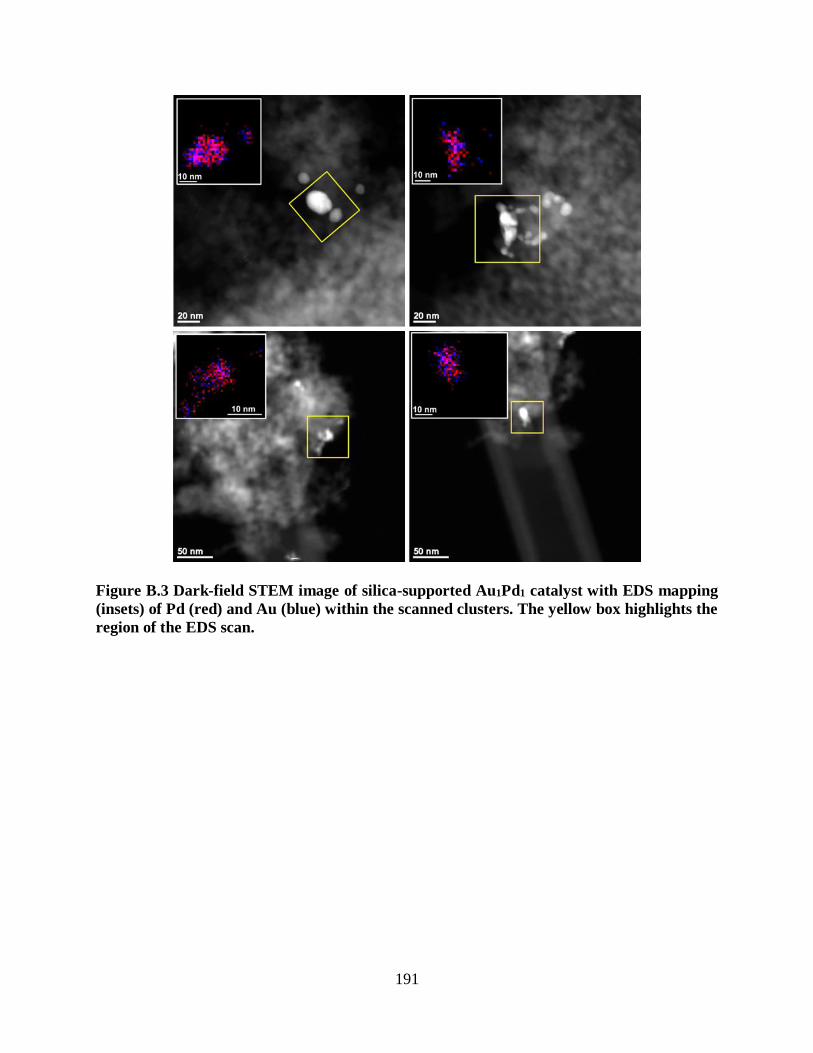
191
Figure B.3 Dark-field STEM image of silica-supported Au1Pd1 catalyst with EDS mapping
(insets) of Pd (red) and Au (blue) within the scanned clusters. The yellow box highlights the
region of the EDS scan.
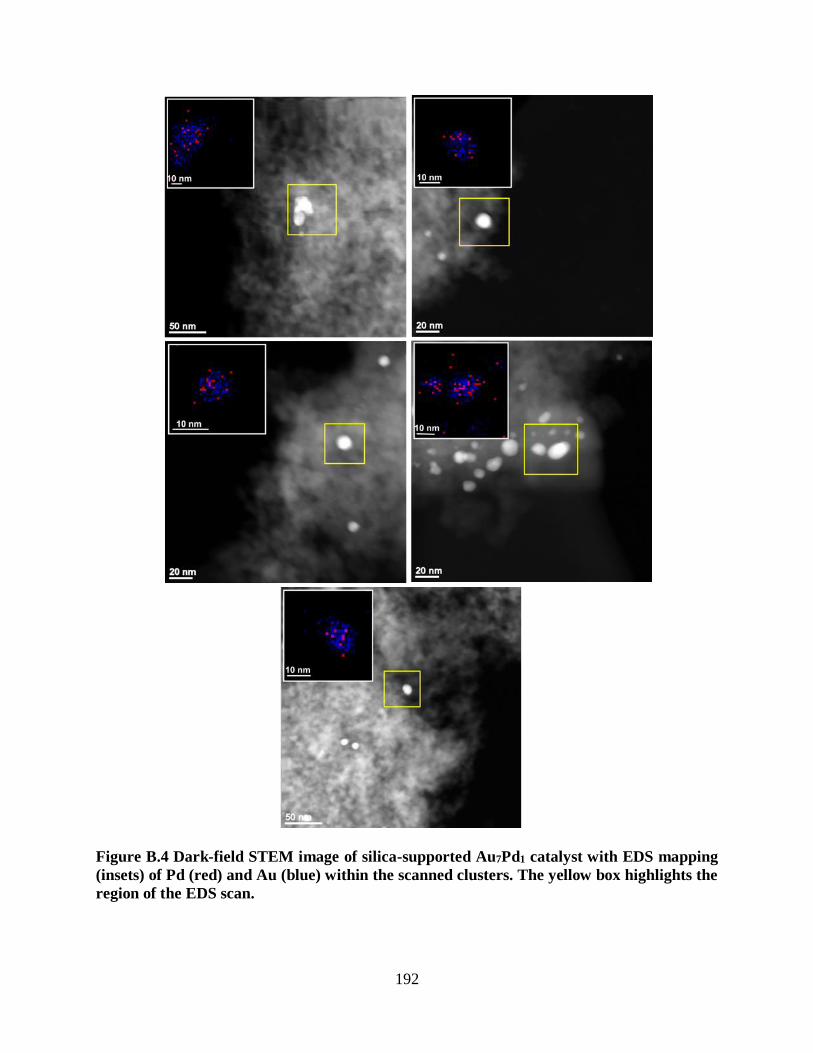
192
Figure B.4 Dark-field STEM image of silica-supported Au7Pd1 catalyst with EDS mapping
(insets) of Pd (red) and Au (blue) within the scanned clusters. The yellow box highlights the
region of the EDS scan.

193
Figure B.5 Dark-field STEM image of silica-supported Au12Pd1 catalyst with EDS mapping
(insets) of Pd (red) and Au (blue) within the scanned clusters. The yellow box highlights the
region of the EDS scan.
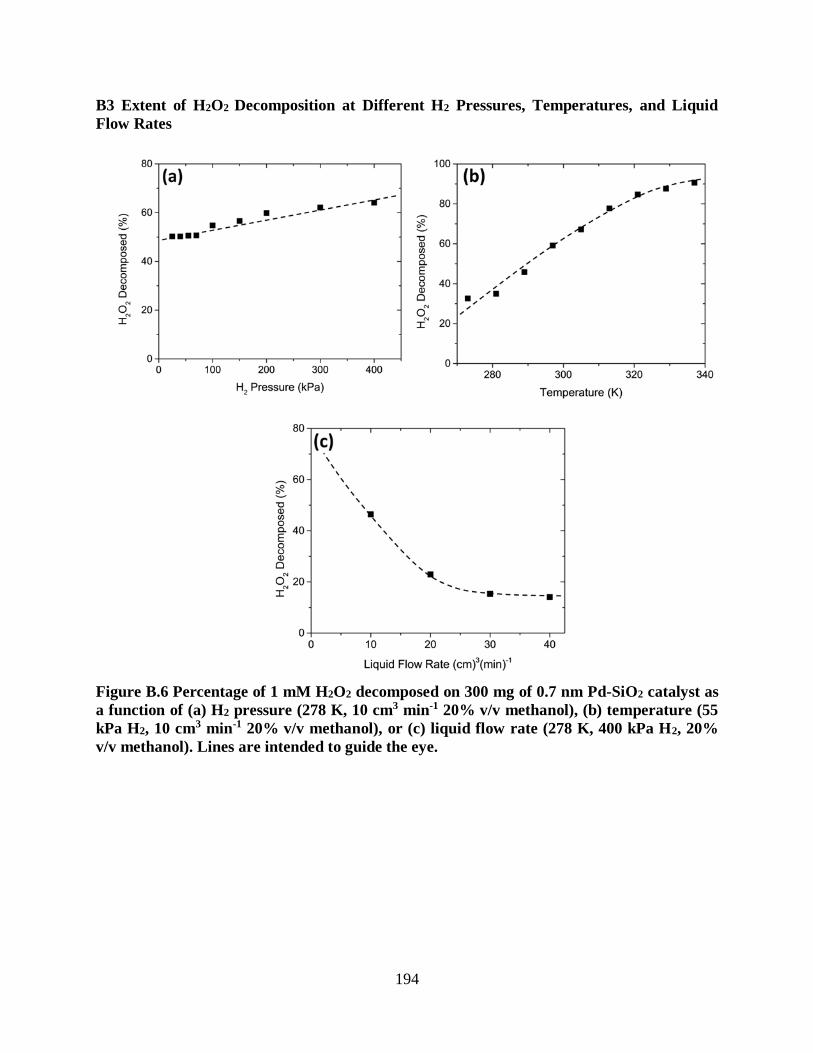
194
B3 Extent of H2O2 Decomposition at Different H2 Pressures, Temperatures, and Liquid
Flow Rates
Figure B.6 Percentage of 1 mM H2O2 decomposed on 300 mg of 0.7 nm Pd-SiO2 catalyst as
a function of (a) H2 pressure (278 K, 10 cm3 min-1 20% v/v methanol), (b) temperature (55
kPa H2, 10 cm3 min-1 20% v/v methanol), or (c) liquid flow rate (278 K, 400 kPa H2, 20%
v/v methanol). Lines are intended to guide the eye.
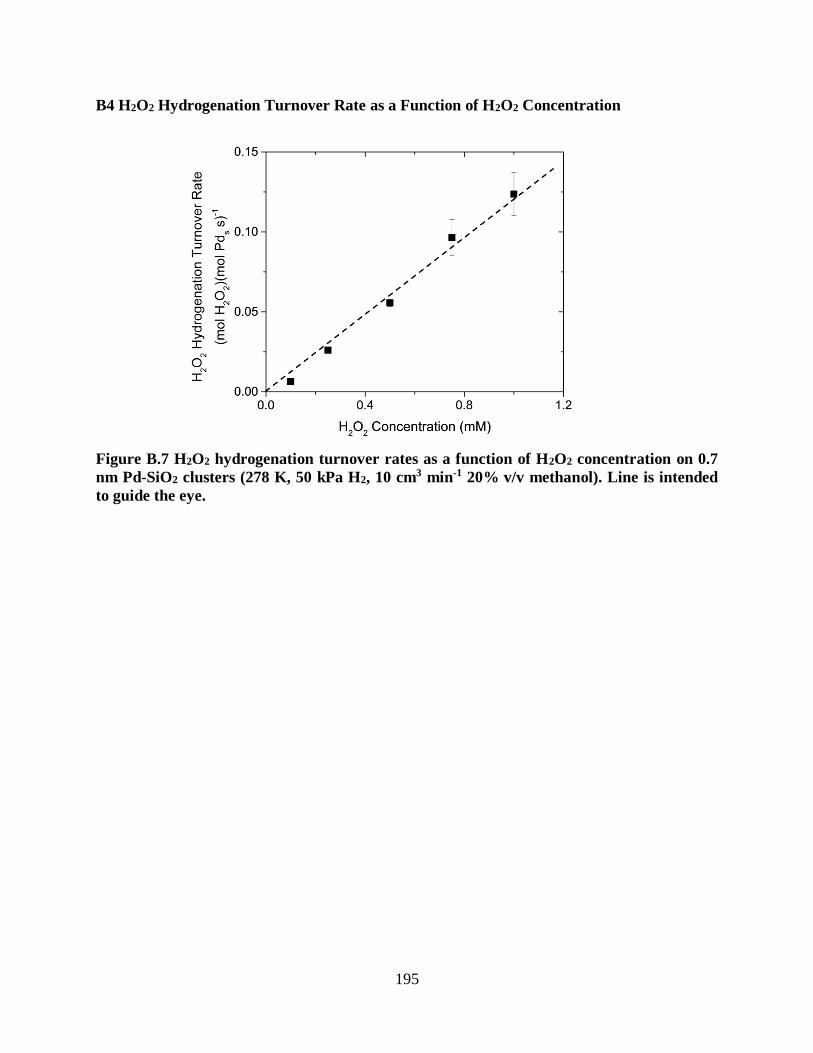
195
B4 H2O2 Hydrogenation Turnover Rate as a Function of H2O2 Concentration
Figure B.7 H2O2 hydrogenation turnover rates as a function of H2O2 concentration on 0.7
nm Pd-SiO2 clusters (278 K, 50 kPa H2, 10 cm3 min-1 20% v/v methanol). Line is intended
to guide the eye.

196
B5 Detailed Derivation of the Proposed Proton-Electron Transfer Mechanism
Scheme 2.1 shows the proposed series of elementary steps for the direct synthesis of
H2O2. The dissociative adsorption of H2 (Scheme 2.1, step 1) and the heterolytic dissociation of
H* (Scheme 2.1, step 2) were assumed to be quasi-equilibrated. To examine this assumption, we
have measured rates of HD formation following the introduction of H2 (10 kPa) and D2 (kPa)
with a quadrupole mass spectrometer (Pfeiffer, Thermostar) at 278 K on the 7 nm Pd clusters.
The rate of HD formation at these conditions (18.7 (mol HD)(mol Pds s)-1) is at least 47 fold
higher than H2O2 formation rates measured in this study on Pd and AuxPd1 catalysts at 305 K
(0.11-0.40 (mol H2O2)(mol Pds s)-1). The high rates of HD formation suggest that H2 dissociates
much faster than H2O2 forms, therefore, H2 dissociation can be assumed to be quasi-equilibrated.
Molecular adsorption of O2 (Scheme 2.1, step 3) was assumed to be quasi-equilibrated as well,
because the free energy of O2 adsorption on Pd(111) becomes negligible when O2 coverages
approach saturation (O2** together with OOH** species are assumed to be the MARI across all
conditions studied here).115 Finally, desorption of H2O2 (Scheme 2.1, step 6) and H2O (Scheme
2.1, step 11) were considered to be quasi-equilibrated, because the rate of secondary
decomposition of H2O2 was found to be first order with respect to H2O2 concentration (Figure
B.7), which suggests that these species rapidly adsorb and desorb. Steps involving O-O bond
dissociation products (i.e., O* and OH*; Scheme 2.1, steps 7-10 and 12) were considered
irreversible since the reformation of O-O bonds in this chemistry is energetically unfavorable.46
The assumption that proton-electron transfer to OOH** (Scheme 2.1, step 5) is kinetically
relevant for H2O2 formation is justified by good agreement between formation rate data and the
derived rate expression. This agreement is better than the rate expression derived when assuming
that proton-electron transfer to O2** (Scheme 2.1, steps 4) is kinetically relevant.146
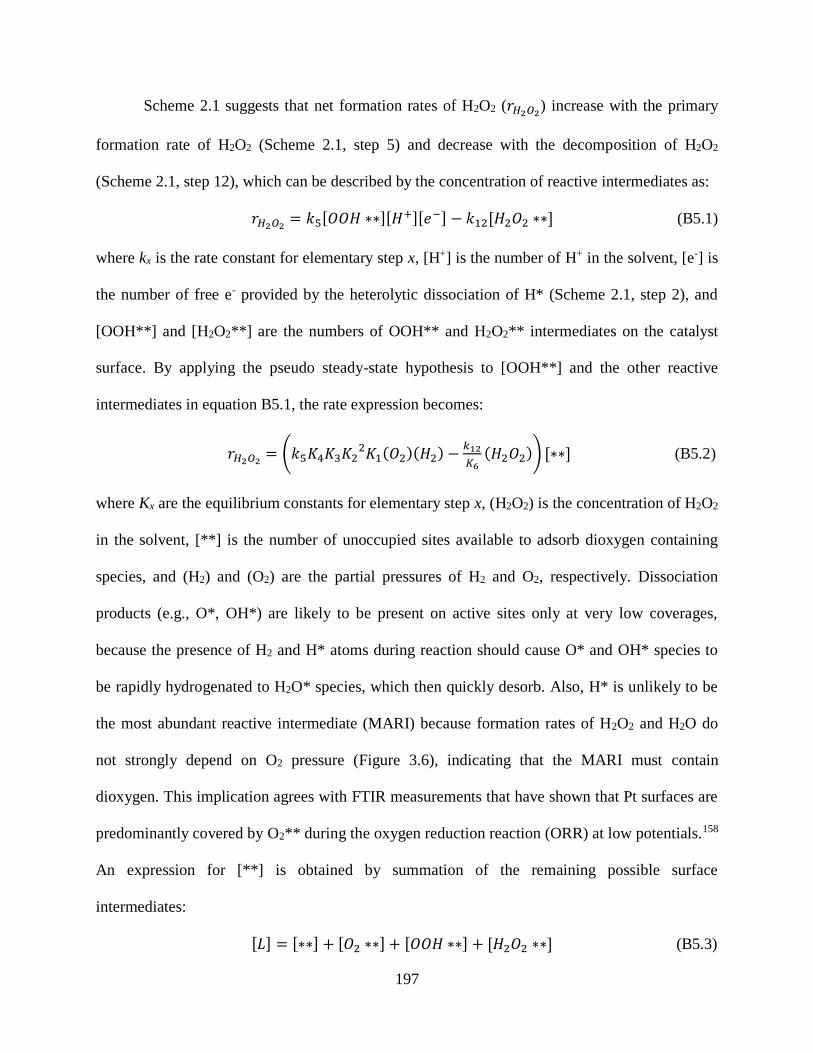
197
Scheme 2.1 suggests that net formation rates of H2O2 (𝑟𝐻2𝑂2) increase with the primary
formation rate of H2O2 (Scheme 2.1, step 5) and decrease with the decomposition of H2O2
(Scheme 2.1, step 12), which can be described by the concentration of reactive intermediates as:
𝑟𝐻2𝑂2 = 𝑘5[𝑂𝑂𝐻 ∗∗][𝐻+][𝑒−] − 𝑘12[𝐻2𝑂2 ∗∗] (B5.1)
where kx is the rate constant for elementary step x, [H+] is the number of H+ in the solvent, [e-] is
the number of free e- provided by the heterolytic dissociation of H* (Scheme 2.1, step 2), and
[OOH**] and [H2O2**] are the numbers of OOH** and H2O2** intermediates on the catalyst
surface. By applying the pseudo steady-state hypothesis to [OOH**] and the other reactive
intermediates in equation B5.1, the rate expression becomes:
𝑟𝐻2𝑂2 = (𝑘5𝐾4𝐾3𝐾22𝐾1(𝑂2)(𝐻2) −
𝑘12
𝐾6(𝐻2𝑂2)) [∗∗] (B5.2)
where Kx are the equilibrium constants for elementary step x, (H2O2) is the concentration of H2O2
in the solvent, [**] is the number of unoccupied sites available to adsorb dioxygen containing
species, and (H2) and (O2) are the partial pressures of H2 and O2, respectively. Dissociation
products (e.g., O*, OH*) are likely to be present on active sites only at very low coverages,
because the presence of H2 and H* atoms during reaction should cause O* and OH* species to
be rapidly hydrogenated to H2O* species, which then quickly desorb. Also, H* is unlikely to be
the most abundant reactive intermediate (MARI) because formation rates of H2O2 and H2O do
not strongly depend on O2 pressure (Figure 3.6), indicating that the MARI must contain
dioxygen. This implication agrees with FTIR measurements that have shown that Pt surfaces are
predominantly covered by O2** during the oxygen reduction reaction (ORR) at low potentials.158
An expression for [**] is obtained by summation of the remaining possible surface
intermediates:
[𝐿] = [∗∗] + [𝑂2 ∗∗] + [𝑂𝑂𝐻 ∗∗] + [𝐻2𝑂2 ∗∗] (B5.3)
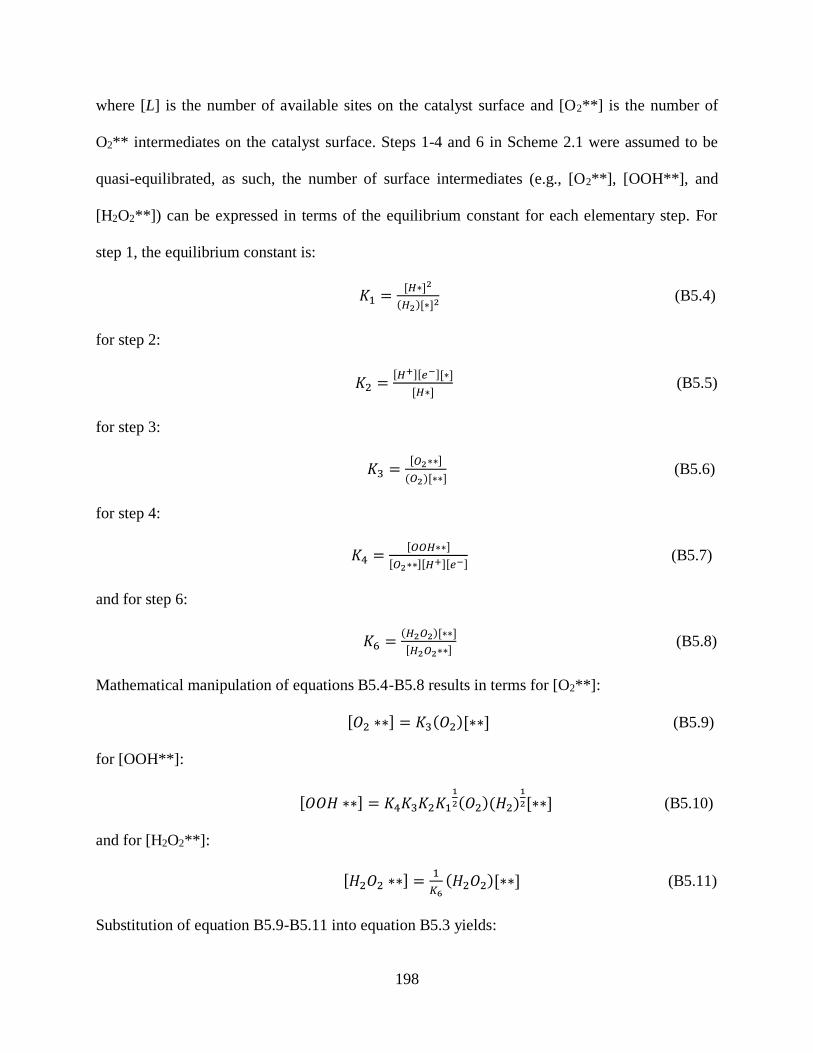
198
where [L] is the number of available sites on the catalyst surface and [O2**] is the number of
O2** intermediates on the catalyst surface. Steps 1-4 and 6 in Scheme 2.1 were assumed to be
quasi-equilibrated, as such, the number of surface intermediates (e.g., [O2**], [OOH**], and
[H2O2**]) can be expressed in terms of the equilibrium constant for each elementary step. For
step 1, the equilibrium constant is:
𝐾1 =[𝐻∗]2
(𝐻2)[∗]2 (B5.4)
for step 2:
𝐾2 =[𝐻+][𝑒−][∗]
[𝐻∗] (B5.5)
for step 3:
𝐾3 =[𝑂2∗∗]
(𝑂2)[∗∗] (B5.6)
for step 4:
𝐾4 =[𝑂𝑂𝐻∗∗]
[𝑂2∗∗][𝐻+][𝑒−]
(B5.7)
and for step 6:
𝐾6 =(𝐻2𝑂2)[∗∗]
[𝐻2𝑂2∗∗] (B5.8)
Mathematical manipulation of equations B5.4-B5.8 results in terms for [O2**]:
[𝑂2 ∗∗] = 𝐾3(𝑂2)[∗∗] (B5.9)
for [OOH**]:
[𝑂𝑂𝐻 ∗∗] = 𝐾4𝐾3𝐾2𝐾11
2(𝑂2)(𝐻2)1
2[∗∗] (B5.10)
and for [H2O2**]:
[𝐻2𝑂2 ∗∗] =1
𝐾6(𝐻2𝑂2)[∗∗] (B5.11)
Substitution of equation B5.9-B5.11 into equation B5.3 yields:
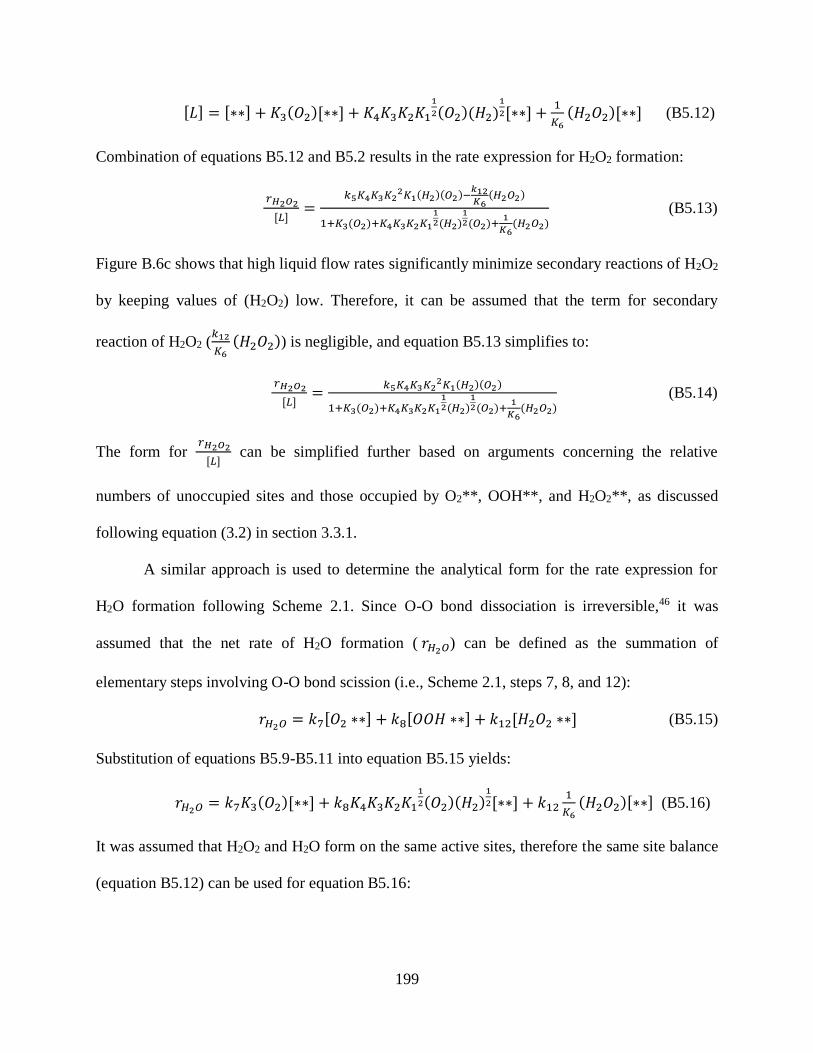
199
[𝐿] = [∗∗] + 𝐾3(𝑂2)[∗∗] + 𝐾4𝐾3𝐾2𝐾11
2(𝑂2)(𝐻2)1
2[∗∗] +1
𝐾6(𝐻2𝑂2)[∗∗] (B5.12)
Combination of equations B5.12 and B5.2 results in the rate expression for H2O2 formation:
𝑟𝐻2𝑂2
[𝐿]=
𝑘5𝐾4𝐾3𝐾22𝐾1(𝐻2)(𝑂2)−
𝑘12𝐾6(𝐻2𝑂2)
1+𝐾3(𝑂2)+𝐾4𝐾3𝐾2𝐾112(𝐻2)
12(𝑂2)+
1
𝐾6(𝐻2𝑂2)
(B5.13)
Figure B.6c shows that high liquid flow rates significantly minimize secondary reactions of H2O2
by keeping values of (H2O2) low. Therefore, it can be assumed that the term for secondary
reaction of H2O2 (𝑘12
𝐾6(𝐻2𝑂2)) is negligible, and equation B5.13 simplifies to:
𝑟𝐻2𝑂2
[𝐿]=
𝑘5𝐾4𝐾3𝐾22𝐾1(𝐻2)(𝑂2)
1+𝐾3(𝑂2)+𝐾4𝐾3𝐾2𝐾112(𝐻2)
12(𝑂2)+
1
𝐾6(𝐻2𝑂2)
(B5.14)
The form for 𝑟𝐻2𝑂2
[𝐿] can be simplified further based on arguments concerning the relative
numbers of unoccupied sites and those occupied by O2**, OOH**, and H2O2**, as discussed
following equation (3.2) in section 3.3.1.
A similar approach is used to determine the analytical form for the rate expression for
H2O formation following Scheme 2.1. Since O-O bond dissociation is irreversible,46 it was
assumed that the net rate of H2O formation ( 𝑟𝐻2𝑂) can be defined as the summation of
elementary steps involving O-O bond scission (i.e., Scheme 2.1, steps 7, 8, and 12):
𝑟𝐻2𝑂 = 𝑘7[𝑂2 ∗∗] + 𝑘8[𝑂𝑂𝐻 ∗∗] + 𝑘12[𝐻2𝑂2 ∗∗] (B5.15)
Substitution of equations B5.9-B5.11 into equation B5.15 yields:
𝑟𝐻2𝑂 = 𝑘7𝐾3(𝑂2)[∗∗] + 𝑘8𝐾4𝐾3𝐾2𝐾11
2(𝑂2)(𝐻2)1
2[∗∗] + 𝑘121
𝐾6(𝐻2𝑂2)[∗∗] (B5.16)
It was assumed that H2O2 and H2O form on the same active sites, therefore the same site balance
(equation B5.12) can be used for equation B5.16:
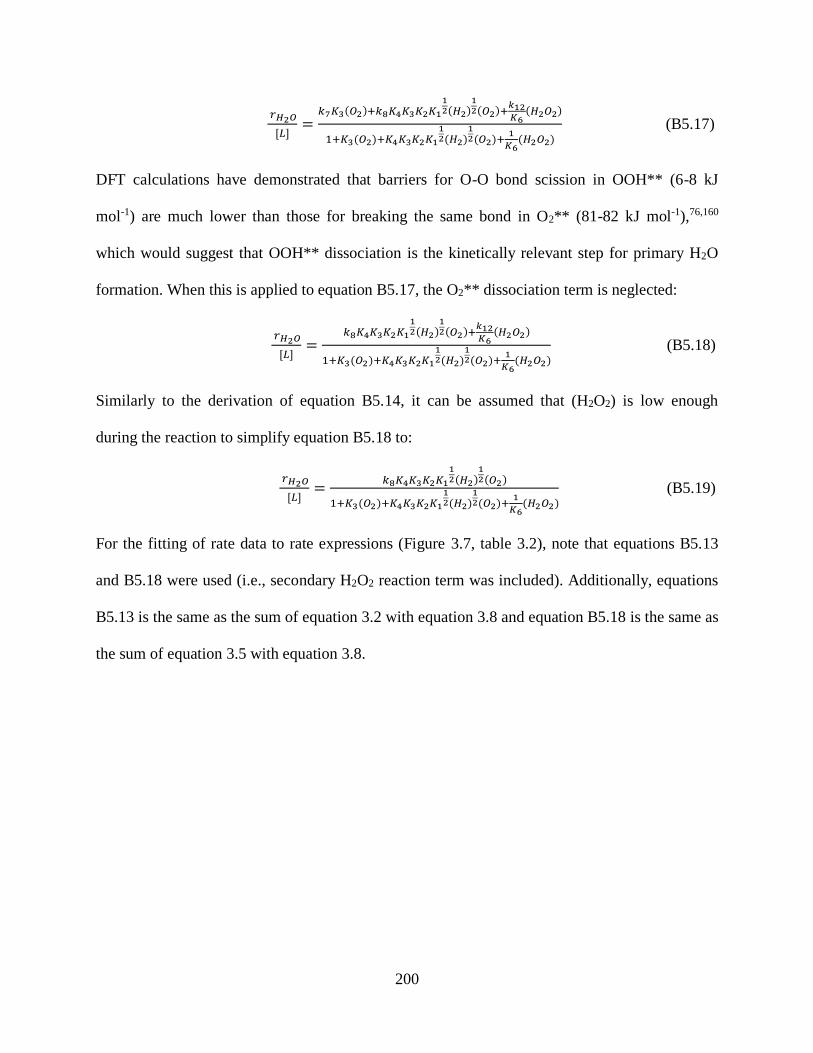
200
𝑟𝐻2𝑂
[𝐿]=𝑘7𝐾3(𝑂2)+𝑘8𝐾4𝐾3𝐾2𝐾1
12(𝐻2)
12(𝑂2)+
𝑘12𝐾6(𝐻2𝑂2)
1+𝐾3(𝑂2)+𝐾4𝐾3𝐾2𝐾112(𝐻2)
12(𝑂2)+
1
𝐾6(𝐻2𝑂2)
(B5.17)
DFT calculations have demonstrated that barriers for O-O bond scission in OOH** (6-8 kJ
mol-1) are much lower than those for breaking the same bond in O2** (81-82 kJ mol-1),76,160
which would suggest that OOH** dissociation is the kinetically relevant step for primary H2O
formation. When this is applied to equation B5.17, the O2** dissociation term is neglected:
𝑟𝐻2𝑂
[𝐿]=
𝑘8𝐾4𝐾3𝐾2𝐾112(𝐻2)
12(𝑂2)+
𝑘12𝐾6(𝐻2𝑂2)
1+𝐾3(𝑂2)+𝐾4𝐾3𝐾2𝐾112(𝐻2)
12(𝑂2)+
1
𝐾6(𝐻2𝑂2)
(B5.18)
Similarly to the derivation of equation B5.14, it can be assumed that (H2O2) is low enough
during the reaction to simplify equation B5.18 to:
𝑟𝐻2𝑂
[𝐿]=
𝑘8𝐾4𝐾3𝐾2𝐾112(𝐻2)
12(𝑂2)
1+𝐾3(𝑂2)+𝐾4𝐾3𝐾2𝐾112(𝐻2)
12(𝑂2)+
1
𝐾6(𝐻2𝑂2)
(B5.19)
For the fitting of rate data to rate expressions (Figure 3.7, table 3.2), note that equations B5.13
and B5.18 were used (i.e., secondary H2O2 reaction term was included). Additionally, equations
B5.13 is the same as the sum of equation 3.2 with equation 3.8 and equation B5.18 is the same as
the sum of equation 3.5 with equation 3.8.

201
B6 Detailed Derivation of the Proposed Langmuir-Hinshelwood Mechanism
The proposed elementary steps for direct synthesis by a Langmuir-Hinshelwood
mechanism are:
Scheme B.1 Series of elementary steps for H2O2 and H2O formation for direct synthesis
assuming a Langmuir-Hinshelwood model. Here, * denotes an empty site, X* represents an
adsorbate bound to a single Pd atom, indicates that an elementary step is quasi-
equilibrated, and kx is the rate constant for elementary step x.
Scheme B.1 suggests that net rates of H2O2 formation (𝑟𝐻2𝑂2) increase with rates of OOH*
hydrogenation (Scheme B.1, step 4) and decrease with the rates for the decomposition of H2O2
(Scheme B.1, step 11), which can be represented by the concentration of reactive intermediates
by:

202
𝑟𝐻2𝑂2 =𝑘4[𝑂𝑂𝐻∗][𝐻∗]−𝑘11[𝐻2𝑂2∗][∗]
[𝐿] (B6.1)
where kx is the rate constant for elementary step x, [L] is the total number of sites, and [H*],
[OOH*], and [H2O2*] are the numbers of H*, OOH*, and H2O2* intermediates on the catalyst
surface. Note that the rate expression is divided by [L] to account for the statistical likelihood of
the reactant surface species being adjacent to one another. Applying the pseudo steady-state
hypothesis to [OOH*] and the other reactive intermediates allows for equation B6.1 to be
represented by reaction pressures and concentrations by:
𝑟𝐻2𝑂2 =𝑘4𝐾3𝐾2𝐾1(𝑂2)(𝐻2)[∗]
2−𝑘11𝐾5(𝐻2𝑂2)[∗]
2
[𝐿] (B6.2)
where Kx are the equilibrium constants for elementary step x, (H2O2) is the concentration of H2O2
in the solvent, [*] is the number of unoccupied sites, and (H2) and (O2) are the partial pressures
of H2 and O2, respectively. Assumptions about which steps are quasi-equilibrated and kinetically
relevant as well as why H*, O*, and OH* exist in negligible numbers on the surface are
described in detail above in section B5. An expression for [*] can be described by summing the
number of likely surface intermediates:
[𝐿] = [∗] + [𝑂2 ∗] + [𝑂𝑂𝐻 ∗] + [𝐻2𝑂2 ∗] (B6.3)
where [O2*] is the number of O2* intermediates. As shown in Scheme B.1 and discussed in
section B5, steps 1-3 and 5 were assumed to be quasi-equilibrated. This allows for the number of
surface intermediates to be expressed in terms of reactant pressures and concentrations and
equilibrium constants. For step 1, the equilibrium constant is:
𝐾1 =[𝐻∗]2
(𝐻2)[∗]2 (B6.4)
for step 2:
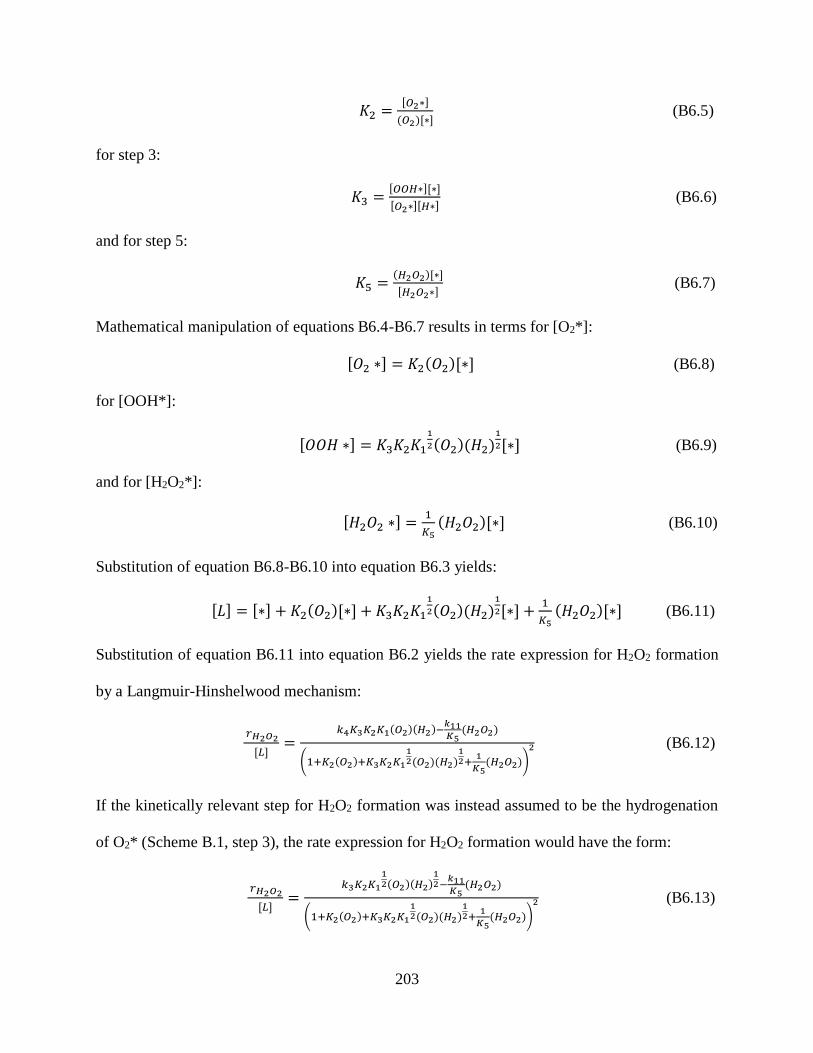
203
𝐾2 =[𝑂2∗]
(𝑂2)[∗] (B6.5)
for step 3:
𝐾3 =[𝑂𝑂𝐻∗][∗]
[𝑂2∗][𝐻∗] (B6.6)
and for step 5:
𝐾5 =(𝐻2𝑂2)[∗]
[𝐻2𝑂2∗] (B6.7)
Mathematical manipulation of equations B6.4-B6.7 results in terms for [O2*]:
[𝑂2 ∗] = 𝐾2(𝑂2)[∗] (B6.8)
for [OOH*]:
[𝑂𝑂𝐻 ∗] = 𝐾3𝐾2𝐾11
2(𝑂2)(𝐻2)1
2[∗] (B6.9)
and for [H2O2*]:
[𝐻2𝑂2 ∗] =1
𝐾5(𝐻2𝑂2)[∗] (B6.10)
Substitution of equation B6.8-B6.10 into equation B6.3 yields:
[𝐿] = [∗] + 𝐾2(𝑂2)[∗] + 𝐾3𝐾2𝐾11
2(𝑂2)(𝐻2)1
2[∗] +1
𝐾5(𝐻2𝑂2)[∗] (B6.11)
Substitution of equation B6.11 into equation B6.2 yields the rate expression for H2O2 formation
by a Langmuir-Hinshelwood mechanism:
𝑟𝐻2𝑂2
[𝐿]=
𝑘4𝐾3𝐾2𝐾1(𝑂2)(𝐻2)−𝑘11𝐾5(𝐻2𝑂2)
(1+𝐾2(𝑂2)+𝐾3𝐾2𝐾112(𝑂2)(𝐻2)
12+
1
𝐾5(𝐻2𝑂2))
2 (B6.12)
If the kinetically relevant step for H2O2 formation was instead assumed to be the hydrogenation
of O2* (Scheme B.1, step 3), the rate expression for H2O2 formation would have the form:
𝑟𝐻2𝑂2
[𝐿]=
𝑘3𝐾2𝐾112(𝑂2)(𝐻2)
12−𝑘11𝐾5(𝐻2𝑂2)
(1+𝐾2(𝑂2)+𝐾3𝐾2𝐾112(𝑂2)(𝐻2)
12+
1
𝐾5(𝐻2𝑂2))
2 (B6.13)
204
By the same arguments presented in section B5, the net rate of H2O formation ( 𝑟𝐻2𝑂) can be
described by the sum of the rate of O-O bond dissociation in OOH* (Scheme B.1, step 7) and
H2O2* (Scheme B.1, step 11):
𝑟𝐻2𝑂 =𝑘7[𝑂𝑂𝐻∗][∗]+𝑘11[𝐻2𝑂2∗][∗]
[𝐿]
(B6.14)
Substitution of equations B6.9 and B6.10 into equation B6.14 allow for equation B6.14 to be
expressed in terms of reactant pressures and concentrations:
𝑟𝐻2𝑂 =𝑘7𝐾3𝐾2𝐾1
12(𝑂2)(𝐻2)
12[∗]2+
𝑘11𝐾5(𝐻2𝑂2)[∗]
2
[𝐿] (B6.15)
It was assumed that H2O2 and H2O formation occur on the same sites, therefore, equation B6.11
can be substituted into equation B6.15 to yield the rate expression for H2O formation:
𝑟𝐻2𝑂
[𝐿]=
𝑘7𝐾3𝐾2𝐾112(𝑂2)(𝐻2)
12+𝑘11𝐾5(𝐻2𝑂2)
(1+𝐾2(𝑂2)+𝐾3𝐾2𝐾112(𝑂2)(𝐻2)
12+
1
𝐾5(𝐻2𝑂2))
2 (B6.16)
Note that equations B6.12, B6.13, and B6.16 were used for the fitting of rate data to rate
expressions (section B7).

205
B7 Comparison of Rate Data Fit to a Proton-Electron Transfer Mechanism and to a
Langmuir-Hinshelwood Mechanism
Figures B.8-B.10 show fits of equations B6.12, B6.13, and B6.16 compared to fits for a
proton-electron transfer mechanism (equations B5.13 and B5.18). Additionally, the apparent rate
constants from the fits when using equations B6.12 and B6.13 for H2O2 formation are shown in
Table 7.1 and Table 7.2, respectively. Parity plots demonstrating the quality of fit when
assuming the second hydrogenation step is kinetically relevant and when assuming the first
hydrogenation step is kinetically relevant are shown in Figures B.11 and B.12, respectively.
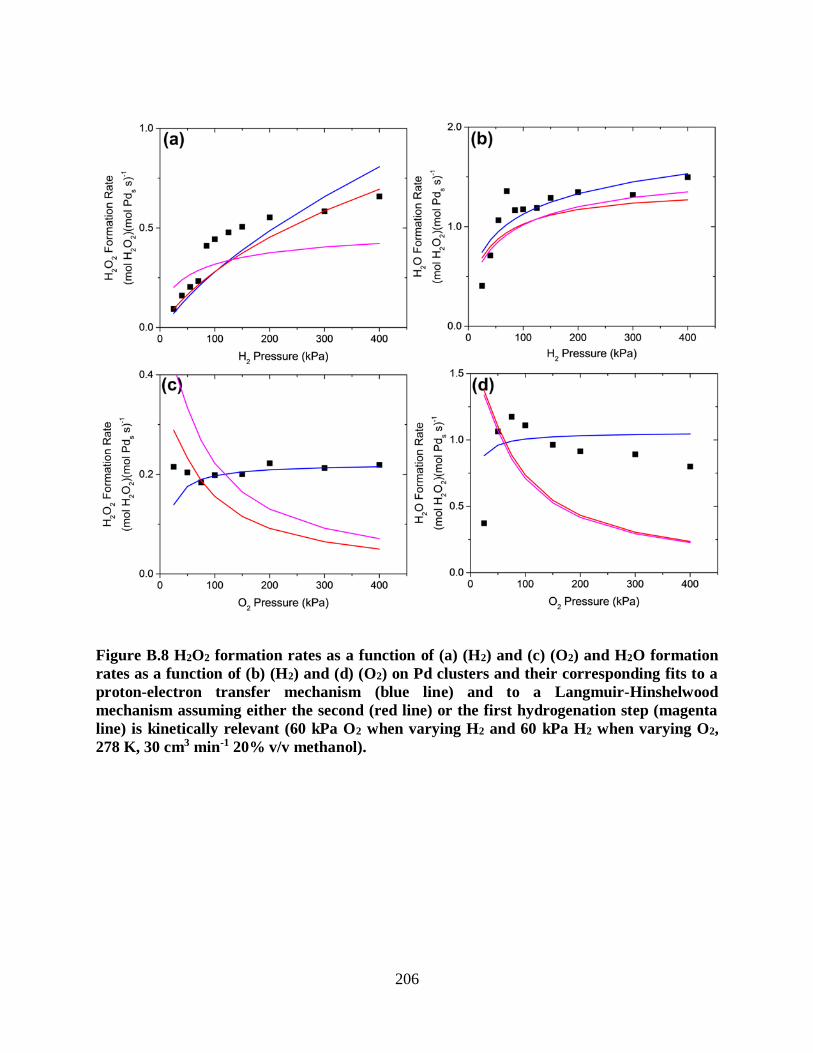
206
Figure B.8 H2O2 formation rates as a function of (a) (H2) and (c) (O2) and H2O formation
rates as a function of (b) (H2) and (d) (O2) on Pd clusters and their corresponding fits to a
proton-electron transfer mechanism (blue line) and to a Langmuir-Hinshelwood
mechanism assuming either the second (red line) or the first hydrogenation step (magenta
line) is kinetically relevant (60 kPa O2 when varying H2 and 60 kPa H2 when varying O2,
278 K, 30 cm3 min-1 20% v/v methanol).
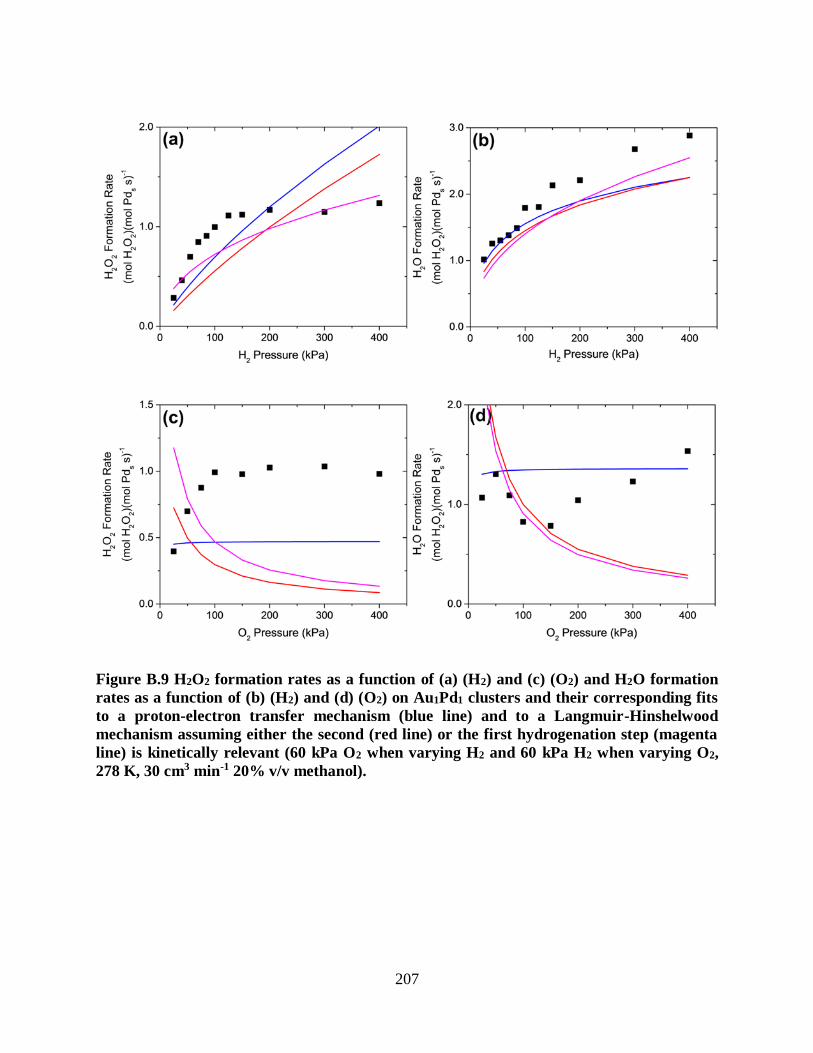
207
Figure B.9 H2O2 formation rates as a function of (a) (H2) and (c) (O2) and H2O formation
rates as a function of (b) (H2) and (d) (O2) on Au1Pd1 clusters and their corresponding fits
to a proton-electron transfer mechanism (blue line) and to a Langmuir-Hinshelwood
mechanism assuming either the second (red line) or the first hydrogenation step (magenta
line) is kinetically relevant (60 kPa O2 when varying H2 and 60 kPa H2 when varying O2,
278 K, 30 cm3 min-1 20% v/v methanol).
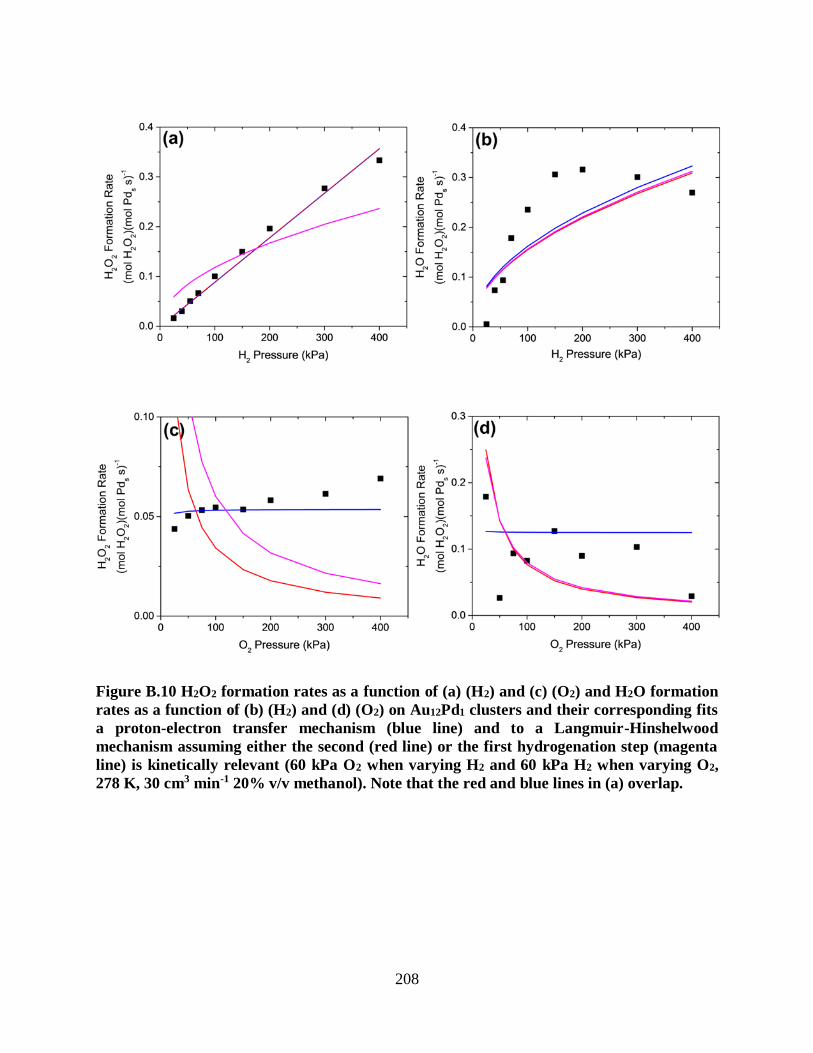
208
Figure B.10 H2O2 formation rates as a function of (a) (H2) and (c) (O2) and H2O formation
rates as a function of (b) (H2) and (d) (O2) on Au12Pd1 clusters and their corresponding fits
a proton-electron transfer mechanism (blue line) and to a Langmuir-Hinshelwood
mechanism assuming either the second (red line) or the first hydrogenation step (magenta
line) is kinetically relevant (60 kPa O2 when varying H2 and 60 kPa H2 when varying O2,
278 K, 30 cm3 min-1 20% v/v methanol). Note that the red and blue lines in (a) overlap.
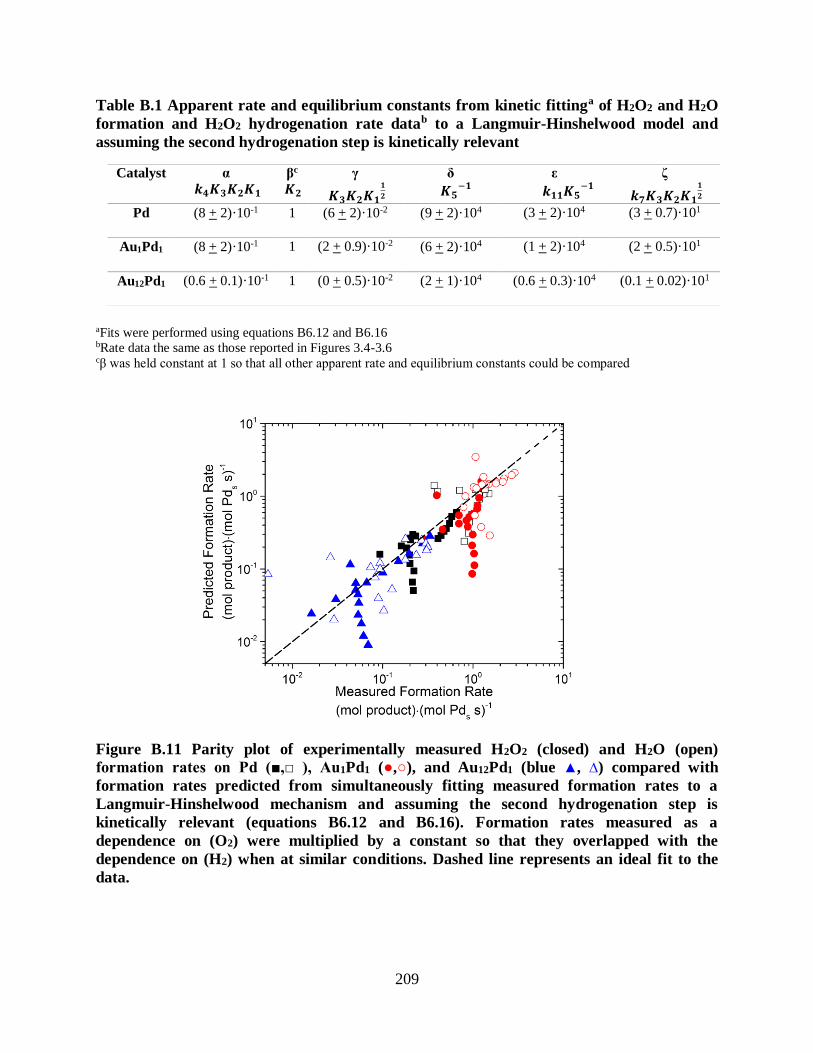
209
Table B.1 Apparent rate and equilibrium constants from kinetic fittinga of H2O2 and H2O
formation and H2O2 hydrogenation rate datab to a Langmuir-Hinshelwood model and
assuming the second hydrogenation step is kinetically relevant
aFits were performed using equations B6.12 and B6.16 bRate data the same as those reported in Figures 3.4-3.6 cβ was held constant at 1 so that all other apparent rate and equilibrium constants could be compared
Figure B.11 Parity plot of experimentally measured H2O2 (closed) and H2O (open)
formation rates on Pd (■,□ ), Au1Pd1 (●,○), and Au12Pd1 (blue ▲, ∆) compared with
formation rates predicted from simultaneously fitting measured formation rates to a
Langmuir-Hinshelwood mechanism and assuming the second hydrogenation step is
kinetically relevant (equations B6.12 and B6.16). Formation rates measured as a
dependence on (O2) were multiplied by a constant so that they overlapped with the
dependence on (H2) when at similar conditions. Dashed line represents an ideal fit to the
data.
Catalyst α
𝒌𝟒𝑲𝟑𝑲𝟐𝑲𝟏 βc
𝑲𝟐 γ
𝑲𝟑𝑲𝟐𝑲𝟏𝟏
𝟐
δ
𝑲𝟓−𝟏
ε
𝒌𝟏𝟏𝑲𝟓−𝟏
ζ
𝒌𝟕𝑲𝟑𝑲𝟐𝑲𝟏𝟏
𝟐
Pd (8 + 2)·10-1 1 (6 + 2)·10-2 (9 + 2)·104 (3 + 2)·104 (3 + 0.7)·101
Au1Pd1 (8 + 2)·10-1 1 (2 + 0.9)·10-2 (6 + 2)·104 (1 + 2)·104 (2 + 0.5)·101
Au12Pd1 (0.6 + 0.1)·10-1 1 (0 + 0.5)·10-2 (2 + 1)·104 (0.6 + 0.3)·104 (0.1 + 0.02)·101
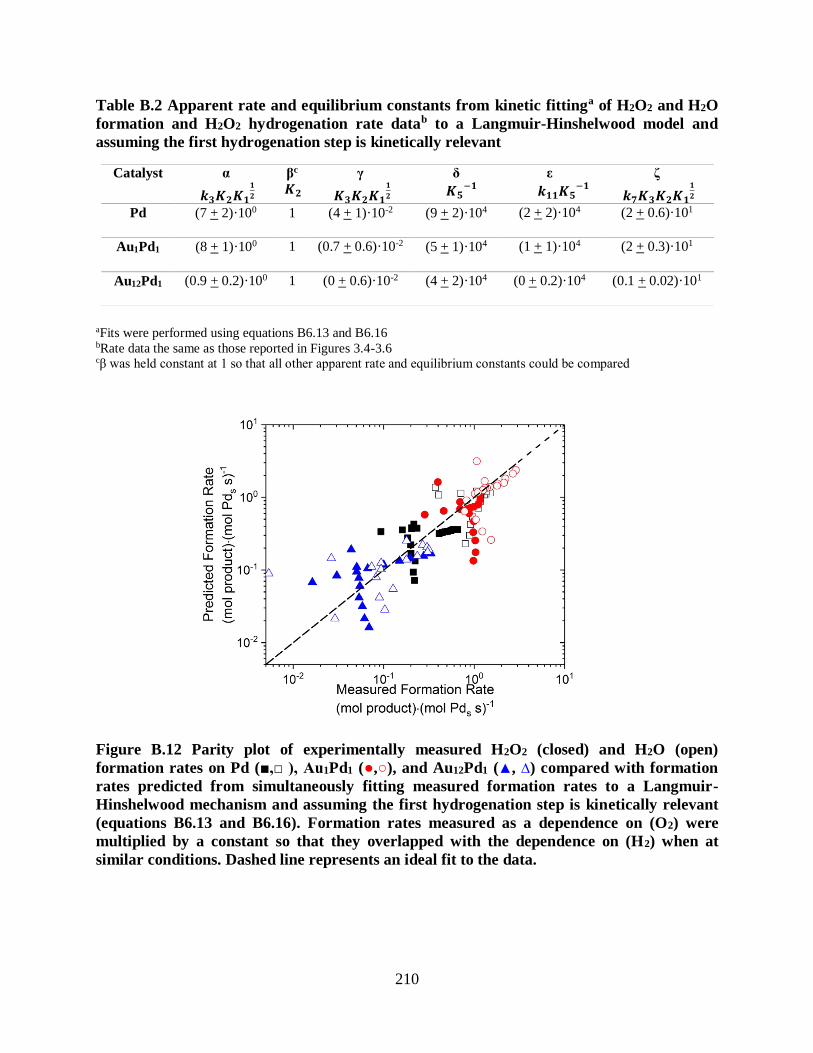
210
Table B.2 Apparent rate and equilibrium constants from kinetic fittinga of H2O2 and H2O
formation and H2O2 hydrogenation rate datab to a Langmuir-Hinshelwood model and
assuming the first hydrogenation step is kinetically relevant
aFits were performed using equations B6.13 and B6.16 bRate data the same as those reported in Figures 3.4-3.6 cβ was held constant at 1 so that all other apparent rate and equilibrium constants could be compared
Figure B.12 Parity plot of experimentally measured H2O2 (closed) and H2O (open)
formation rates on Pd (■,□ ), Au1Pd1 (●,○), and Au12Pd1 (▲, ∆) compared with formation
rates predicted from simultaneously fitting measured formation rates to a Langmuir-
Hinshelwood mechanism and assuming the first hydrogenation step is kinetically relevant
(equations B6.13 and B6.16). Formation rates measured as a dependence on (O2) were
multiplied by a constant so that they overlapped with the dependence on (H2) when at
similar conditions. Dashed line represents an ideal fit to the data.
Catalyst α
𝒌𝟑𝑲𝟐𝑲𝟏𝟏
𝟐
βc
𝑲𝟐 γ
𝑲𝟑𝑲𝟐𝑲𝟏𝟏
𝟐
δ
𝑲𝟓−𝟏
ε
𝒌𝟏𝟏𝑲𝟓−𝟏
ζ
𝒌𝟕𝑲𝟑𝑲𝟐𝑲𝟏𝟏
𝟐
Pd (7 + 2)·100 1 (4 + 1)·10-2 (9 + 2)·104 (2 + 2)·104 (2 + 0.6)·101
Au1Pd1 (8 + 1)·100 1 (0.7 + 0.6)·10-2 (5 + 1)·104 (1 + 1)·104 (2 + 0.3)·101
Au12Pd1 (0.9 + 0.2)·100 1 (0 + 0.6)·10-2 (4 + 2)·104 (0 + 0.2)·104 (0.1 + 0.02)·101
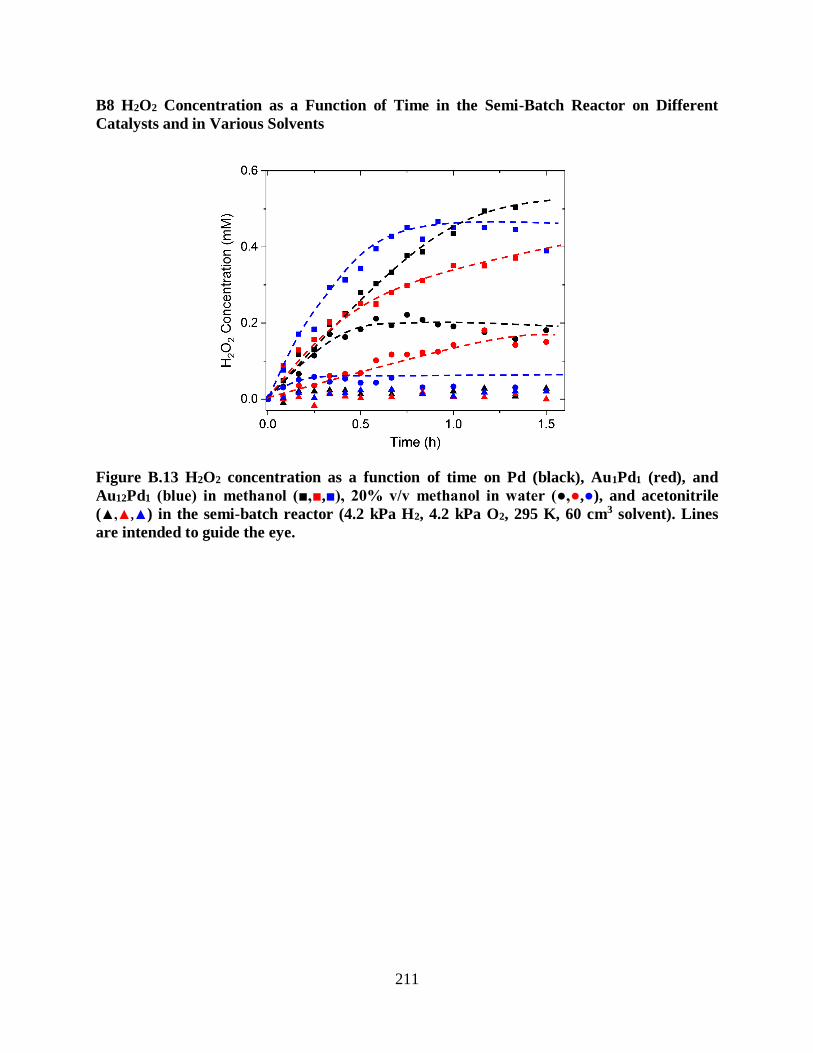
211
B8 H2O2 Concentration as a Function of Time in the Semi-Batch Reactor on Different
Catalysts and in Various Solvents
Figure B.13 H2O2 concentration as a function of time on Pd (black), Au1Pd1 (red), and
Au12Pd1 (blue) in methanol (■,■,■), 20% v/v methanol in water (●,●,●), and acetonitrile
(▲,▲,▲) in the semi-batch reactor (4.2 kPa H2, 4.2 kPa O2, 295 K, 60 cm3 solvent). Lines
are intended to guide the eye.
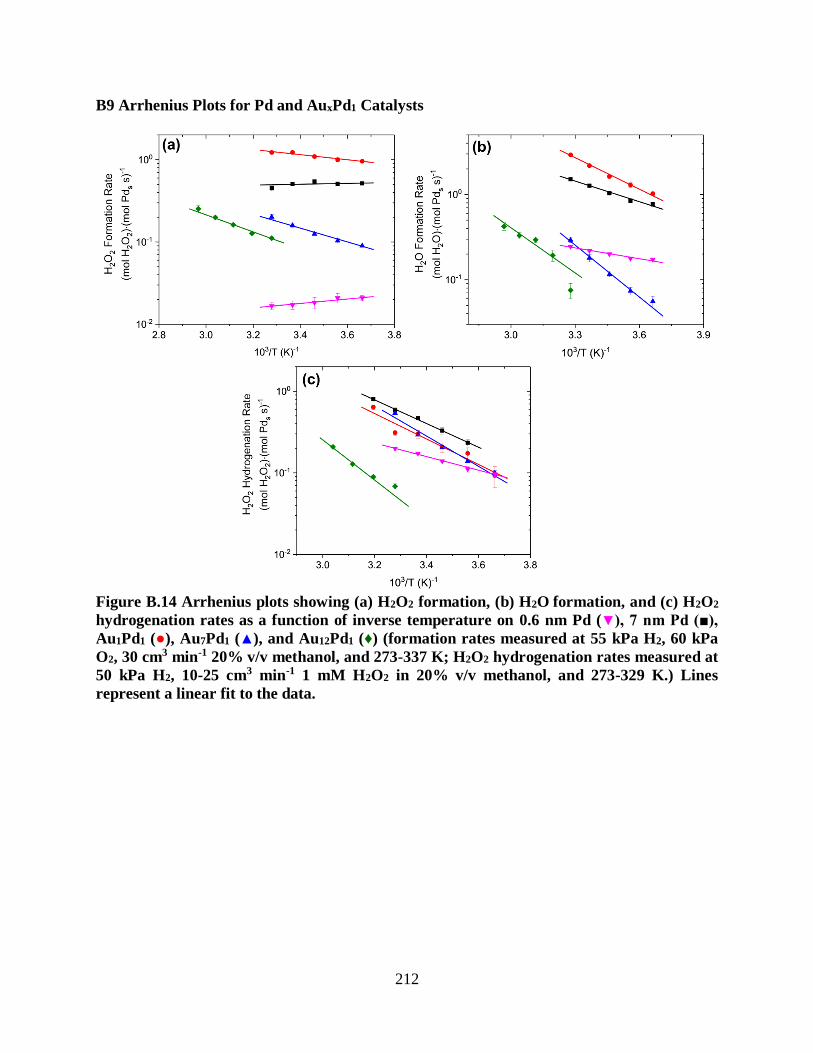
212
B9 Arrhenius Plots for Pd and AuxPd1 Catalysts
Figure B.14 Arrhenius plots showing (a) H2O2 formation, (b) H2O formation, and (c) H2O2
hydrogenation rates as a function of inverse temperature on 0.6 nm Pd (▼), 7 nm Pd (■),
Au1Pd1 (●), Au7Pd1 (▲), and Au12Pd1 (♦) (formation rates measured at 55 kPa H2, 60 kPa
O2, 30 cm3 min-1 20% v/v methanol, and 273-337 K; H2O2 hydrogenation rates measured at
50 kPa H2, 10-25 cm3 min-1 1 mM H2O2 in 20% v/v methanol, and 273-329 K.) Lines
represent a linear fit to the data.
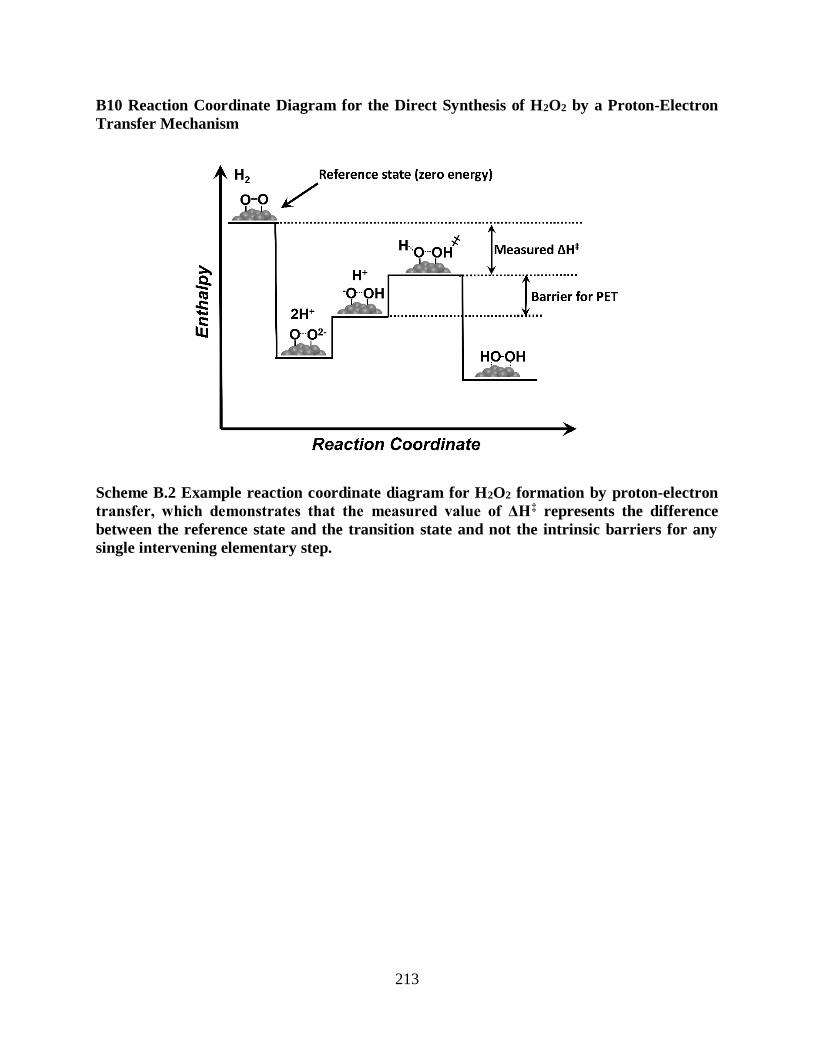
213
B10 Reaction Coordinate Diagram for the Direct Synthesis of H2O2 by a Proton-Electron
Transfer Mechanism
Scheme B.2 Example reaction coordinate diagram for H2O2 formation by proton-electron
transfer, which demonstrates that the measured value of ΔH‡ represents the difference
between the reference state and the transition state and not the intrinsic barriers for any
single intervening elementary step.
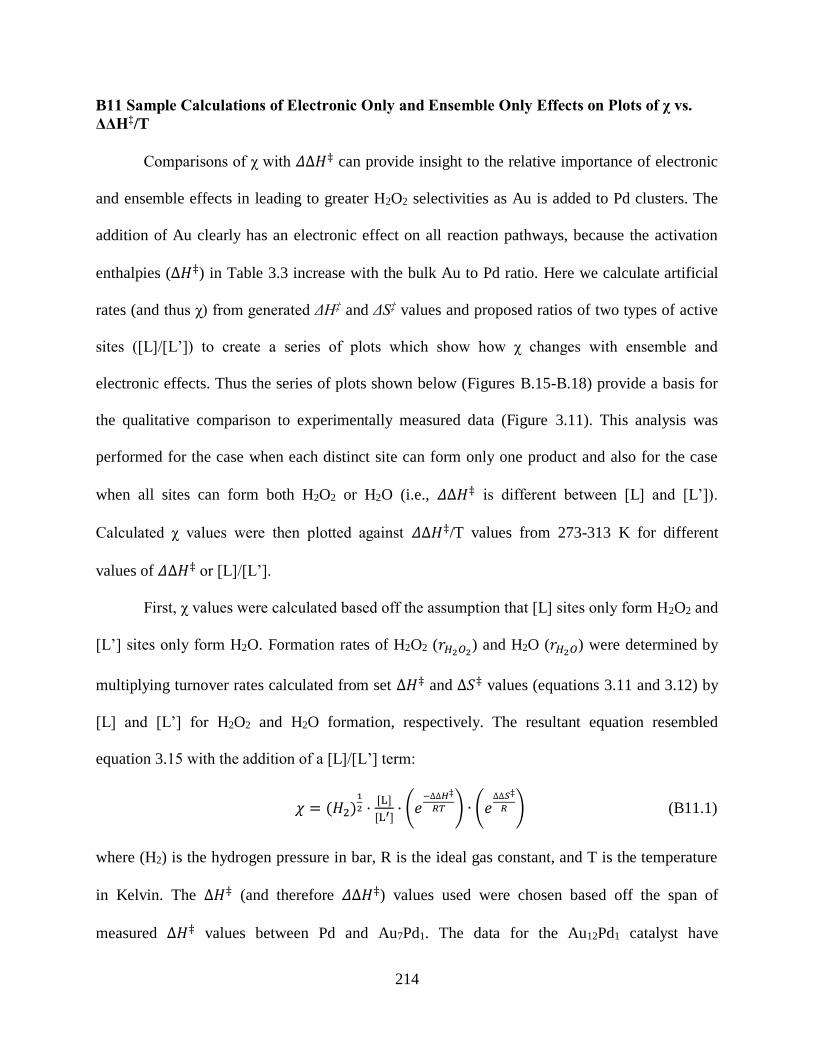
214
B11 Sample Calculations of Electronic Only and Ensemble Only Effects on Plots of χ vs.
ΔΔH‡/T
Comparisons of χ with 𝛥∆𝐻‡ can provide insight to the relative importance of electronic
and ensemble effects in leading to greater H2O2 selectivities as Au is added to Pd clusters. The
addition of Au clearly has an electronic effect on all reaction pathways, because the activation
enthalpies (∆𝐻‡) in Table 3.3 increase with the bulk Au to Pd ratio. Here we calculate artificial
rates (and thus χ) from generated ΔH‡ and ΔS‡ values and proposed ratios of two types of active
sites ([L]/[L’]) to create a series of plots which show how χ changes with ensemble and
electronic effects. Thus the series of plots shown below (Figures B.15-B.18) provide a basis for
the qualitative comparison to experimentally measured data (Figure 3.11). This analysis was
performed for the case when each distinct site can form only one product and also for the case
when all sites can form both H2O2 or H2O (i.e., 𝛥∆𝐻‡ is different between [L] and [L’]).
Calculated χ values were then plotted against 𝛥∆𝐻‡/T values from 273-313 K for different
values of 𝛥∆𝐻‡ or [L]/[L’].
First, χ values were calculated based off the assumption that [L] sites only form H2O2 and
[L’] sites only form H2O. Formation rates of H2O2 (𝑟𝐻2𝑂2) and H2O (𝑟𝐻2𝑂) were determined by
multiplying turnover rates calculated from set ∆𝐻‡ and ∆𝑆‡ values (equations 3.11 and 3.12) by
[L] and [L’] for H2O2 and H2O formation, respectively. The resultant equation resembled
equation 3.15 with the addition of a [L]/[L’] term:
𝜒 = (𝐻2)1
2 ·[L]
[L′]· (𝑒
−∆∆𝐻‡
𝑅𝑇 ) ∙ (𝑒∆∆𝑆‡
𝑅 ) (B11.1)
where (H2) is the hydrogen pressure in bar, R is the ideal gas constant, and T is the temperature
in Kelvin. The ∆𝐻‡ (and therefore 𝛥∆𝐻‡) values used were chosen based off the span of
measured ∆𝐻‡ values between Pd and Au7Pd1. The data for the Au12Pd1 catalyst have
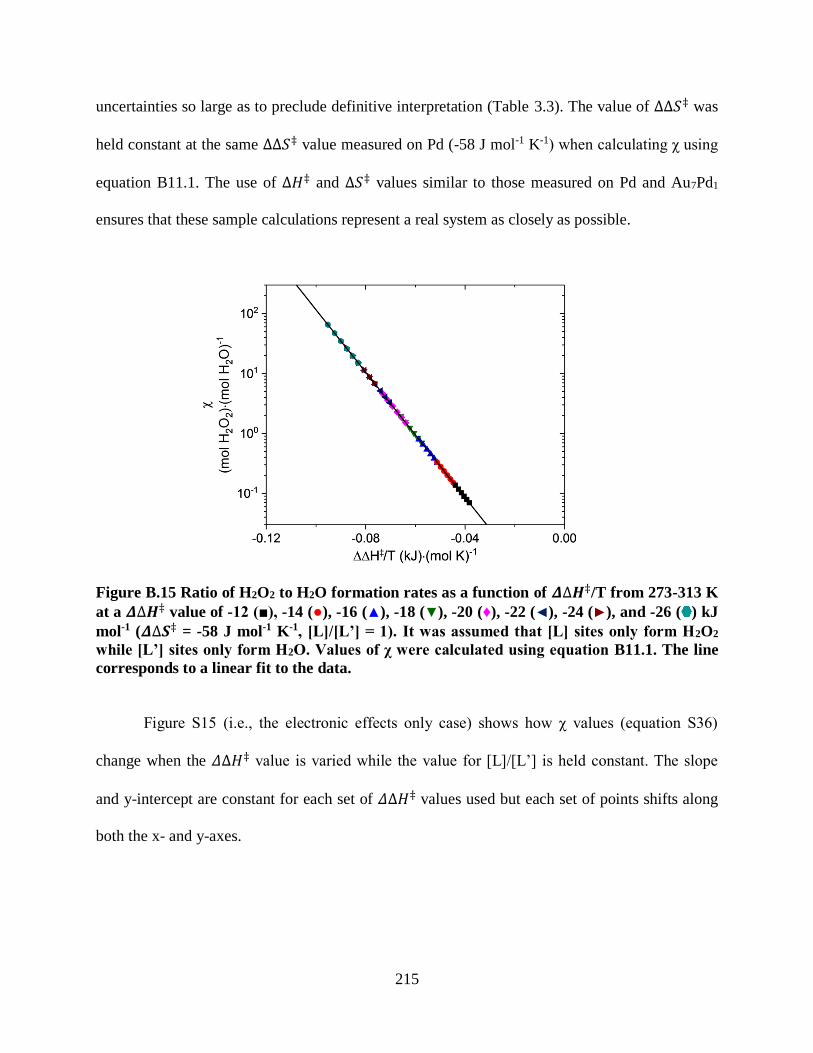
215
uncertainties so large as to preclude definitive interpretation (Table 3.3). The value of Δ∆𝑆‡ was
held constant at the same Δ∆𝑆‡ value measured on Pd (-58 J mol-1 K-1) when calculating χ using
equation B11.1. The use of ∆𝐻‡ and ∆𝑆‡ values similar to those measured on Pd and Au7Pd1
ensures that these sample calculations represent a real system as closely as possible.
Figure B.15 Ratio of H2O2 to H2O formation rates as a function of 𝜟∆𝑯‡/T from 273-313 K
at a 𝜟∆𝑯‡ value of -12 (■), -14 (●), -16 (▲), -18 (▼), -20 (♦), -22 (◄), -24 (►), and -26 ( ) kJ
mol-1 (𝜟∆𝑺‡ = -58 J mol-1 K-1, [L]/[L’] = 1). It was assumed that [L] sites only form H2O2
while [L’] sites only form H2O. Values of χ were calculated using equation B11.1. The line
corresponds to a linear fit to the data.
Figure S15 (i.e., the electronic effects only case) shows how χ values (equation S36)
change when the 𝛥∆𝐻‡ value is varied while the value for [L]/[L’] is held constant. The slope
and y-intercept are constant for each set of 𝛥∆𝐻‡ values used but each set of points shifts along
both the x- and y-axes.
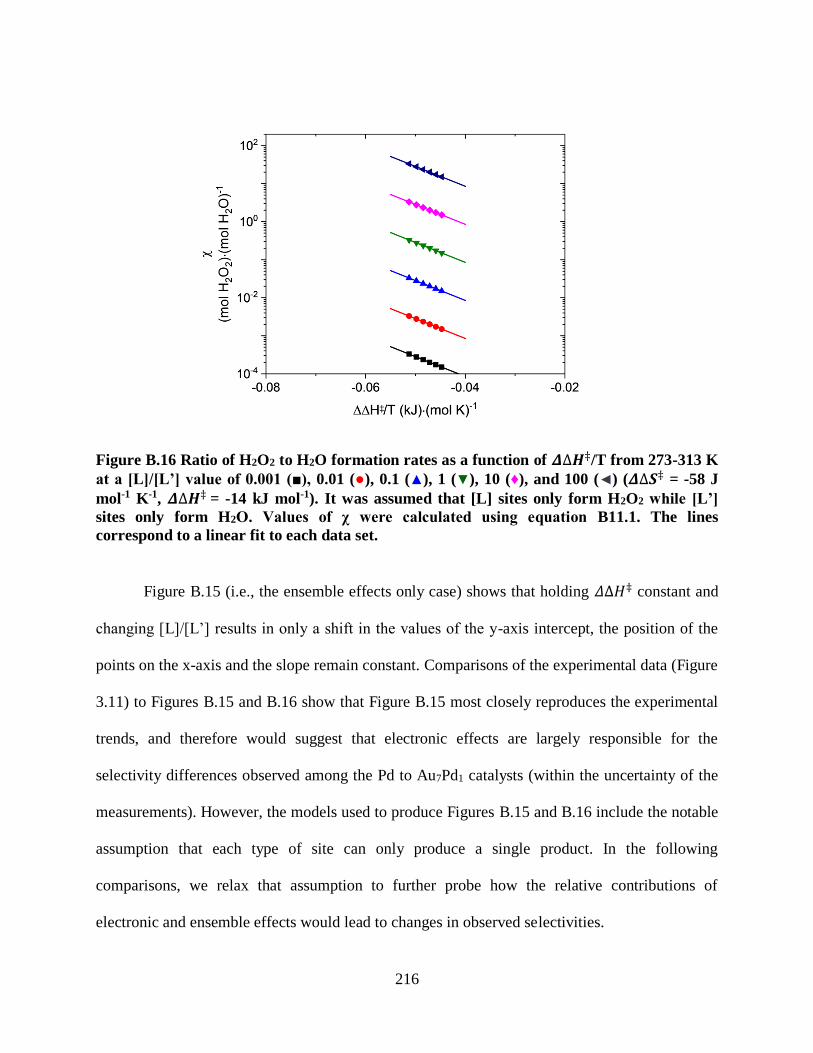
216
Figure B.16 Ratio of H2O2 to H2O formation rates as a function of 𝜟∆𝑯‡/T from 273-313 K
at a [L]/[L’] value of 0.001 (■), 0.01 (●), 0.1 (▲), 1 (▼), 10 (♦), and 100 (◄) (𝜟∆𝑺‡ = -58 J
mol-1 K-1, 𝜟∆𝑯‡ = -14 kJ mol-1). It was assumed that [L] sites only form H2O2 while [L’]
sites only form H2O. Values of χ were calculated using equation B11.1. The lines
correspond to a linear fit to each data set.
Figure B.15 (i.e., the ensemble effects only case) shows that holding 𝛥∆𝐻‡ constant and
changing [L]/[L’] results in only a shift in the values of the y-axis intercept, the position of the
points on the x-axis and the slope remain constant. Comparisons of the experimental data (Figure
3.11) to Figures B.15 and B.16 show that Figure B.15 most closely reproduces the experimental
trends, and therefore would suggest that electronic effects are largely responsible for the
selectivity differences observed among the Pd to Au7Pd1 catalysts (within the uncertainty of the
measurements). However, the models used to produce Figures B.15 and B.16 include the notable
assumption that each type of site can only produce a single product. In the following
comparisons, we relax that assumption to further probe how the relative contributions of
electronic and ensemble effects would lead to changes in observed selectivities.

217
A complementary set of sample calculations were made assuming that [L] and [L’] sites
could make both H2O2 and H2O. In this case, there were different ∆𝐻‡ and 𝛥∆𝐻‡ values for each
type of site (∆𝐻‡𝐻2𝑂2 and ∆𝐻‡𝐻2𝑂 for [L] and ∆𝐻‡′𝐻2𝑂2 and ∆𝐻‡′𝐻2𝑂 for [L’]). In this case,
formation rates are calculated as the sum of the rates on each type of site. Dividing the sum of
H2O2 formation rates by the sum of H2O formation rates yields χ:
𝜒 = (𝐻2)1
2 ·[L]𝑒
−𝛥𝐻‡𝐻2𝑂2𝑅𝑇 𝑒
𝛥𝑆‡𝐻2𝑂2𝑅 +[L′]𝑒
−𝛥𝐻‡′𝐻2𝑂2𝑅𝑇 𝑒
𝛥𝑆‡′𝐻2𝑂2𝑅
[L]𝑒
−𝛥𝐻‡𝐻2𝑂𝑅𝑇 𝑒
𝛥𝑆‡𝐻2𝑂𝑅 +[L′]𝑒
−𝛥𝐻‡′𝐻2𝑂𝑅𝑇 𝑒
𝛥𝑆‡′𝐻2𝑂𝑅
(B11.2)
where 𝛥𝐻‡𝑥 and 𝛥𝑆‡𝑥 are the enthalpy and entropy for product x on [L] sites and 𝛥𝐻‡′𝑥 and
𝛥𝑆‡′𝑥 are the enthalpy and entropy for product x on [L’] sites. Within these calculations, values
of 𝛥𝐻‡′𝑥 and 𝛥𝑆‡′𝑥 were held constant at the same values measured on Au7Pd1 to simulate a
different type of site that might form upon alloying Pd with Au. Values of 𝛥𝑆‡𝑥 and
𝛥𝐻‡𝐻2𝑂2were the same as those measured on Pd and 𝛥𝐻‡𝐻2𝑂 was varied from the measured
value on Pd to simulate a change in the electronic structure of the [L] sites. Otherwise, 𝛥𝐻‡𝐻2𝑂
was held constant at the value measured on Pd for the ensemble only case (i.e., [L]/[L’] is
varied).
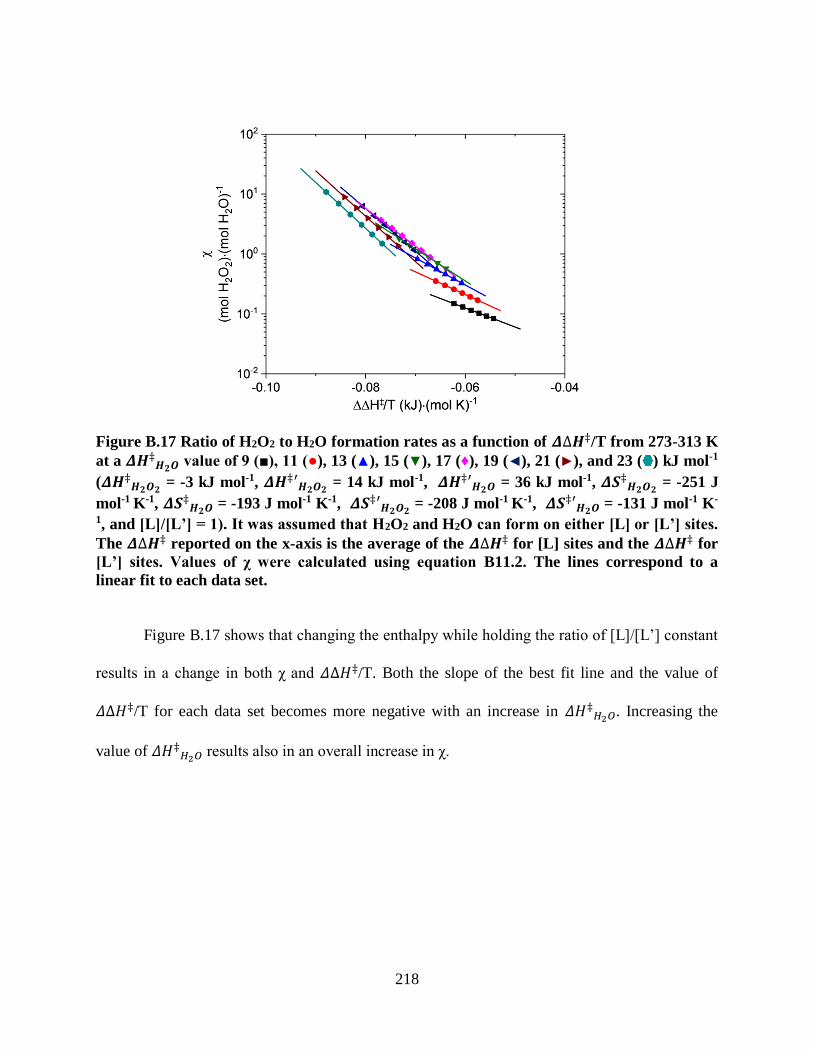
218
Figure B.17 Ratio of H2O2 to H2O formation rates as a function of 𝜟∆𝑯‡/T from 273-313 K
at a 𝜟𝑯‡𝑯𝟐𝑶 value of 9 (■), 11 (●), 13 (▲), 15 (▼), 17 (♦), 19 (◄), 21 (►), and 23 ( ) kJ mol-1
(𝜟𝑯‡𝑯𝟐𝑶𝟐 = -3 kJ mol-1, 𝜟𝑯‡′𝑯𝟐𝑶𝟐 = 14 kJ mol-1, 𝜟𝑯‡′𝑯𝟐𝑶 = 36 kJ mol-1, 𝜟𝑺‡𝑯𝟐𝑶𝟐 = -251 J
mol-1 K-1, 𝜟𝑺‡𝑯𝟐𝑶 = -193 J mol-1 K-1, 𝜟𝑺‡′𝑯𝟐𝑶𝟐 = -208 J mol-1 K-1, 𝜟𝑺‡′𝑯𝟐𝑶 = -131 J mol-1 K-
1, and [L]/[L’] = 1). It was assumed that H2O2 and H2O can form on either [L] or [L’] sites.
The 𝜟∆𝑯‡ reported on the x-axis is the average of the 𝜟∆𝑯‡ for [L] sites and the 𝜟∆𝑯‡ for
[L’] sites. Values of χ were calculated using equation B11.2. The lines correspond to a
linear fit to each data set.
Figure B.17 shows that changing the enthalpy while holding the ratio of [L]/[L’] constant
results in a change in both χ and 𝛥∆𝐻‡/T. Both the slope of the best fit line and the value of
𝛥∆𝐻‡/T for each data set becomes more negative with an increase in 𝛥𝐻‡𝐻2𝑂. Increasing the
value of 𝛥𝐻‡𝐻2𝑂 results also in an overall increase in χ.
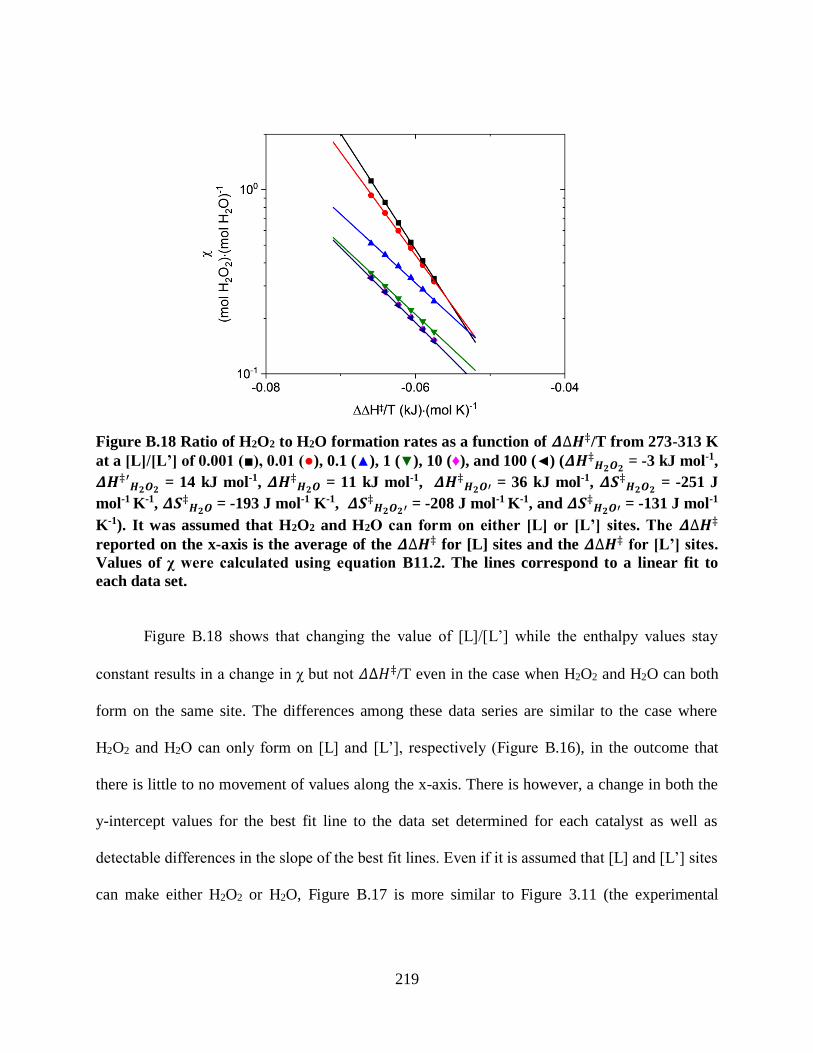
219
Figure B.18 Ratio of H2O2 to H2O formation rates as a function of 𝜟∆𝑯‡/T from 273-313 K
at a [L]/[L’] of 0.001 (■), 0.01 (●), 0.1 (▲), 1 (▼), 10 (♦), and 100 (◄) (𝜟𝑯‡𝑯𝟐𝑶𝟐 = -3 kJ mol-1,
𝜟𝑯‡′𝑯𝟐𝑶𝟐 = 14 kJ mol-1, 𝜟𝑯‡𝑯𝟐𝑶 = 11 kJ mol-1, 𝜟𝑯‡𝑯𝟐𝑶′ = 36 kJ mol-1, 𝜟𝑺‡𝑯𝟐𝑶𝟐 = -251 J
mol-1 K-1, 𝜟𝑺‡𝑯𝟐𝑶 = -193 J mol-1 K-1, 𝜟𝑺‡𝑯𝟐𝑶𝟐′ = -208 J mol-1 K-1, and 𝜟𝑺‡𝑯𝟐𝑶′ = -131 J mol-1
K-1). It was assumed that H2O2 and H2O can form on either [L] or [L’] sites. The 𝜟∆𝑯‡ reported on the x-axis is the average of the 𝜟∆𝑯‡ for [L] sites and the 𝜟∆𝑯‡ for [L’] sites.
Values of χ were calculated using equation B11.2. The lines correspond to a linear fit to
each data set.
Figure B.18 shows that changing the value of [L]/[L’] while the enthalpy values stay
constant results in a change in χ but not 𝛥∆𝐻‡/T even in the case when H2O2 and H2O can both
form on the same site. The differences among these data series are similar to the case where
H2O2 and H2O can only form on [L] and [L’], respectively (Figure B.16), in the outcome that
there is little to no movement of values along the x-axis. There is however, a change in both the
y-intercept values for the best fit line to the data set determined for each catalyst as well as
detectable differences in the slope of the best fit lines. Even if it is assumed that [L] and [L’] sites
can make either H2O2 or H2O, Figure B.17 is more similar to Figure 3.11 (the experimental
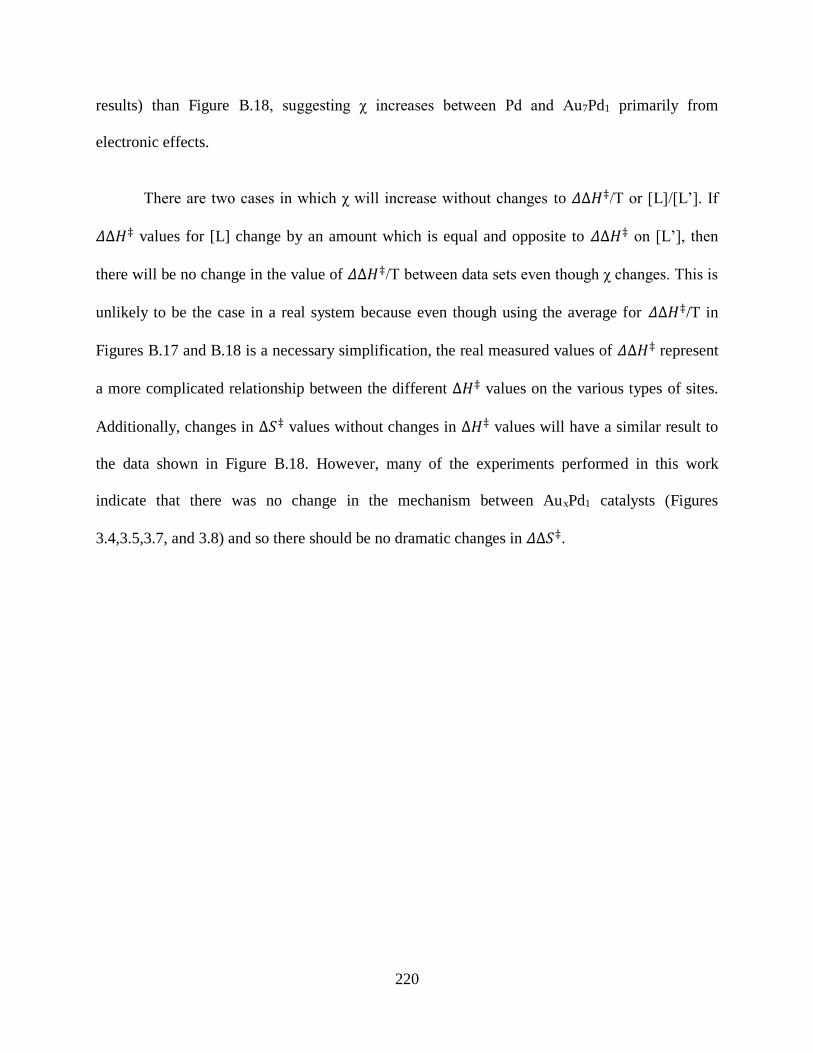
220
results) than Figure B.18, suggesting χ increases between Pd and Au7Pd1 primarily from
electronic effects.
There are two cases in which χ will increase without changes to 𝛥∆𝐻‡/T or [L]/[L’]. If
𝛥∆𝐻‡ values for [L] change by an amount which is equal and opposite to 𝛥∆𝐻‡ on [L’], then
there will be no change in the value of 𝛥∆𝐻‡/T between data sets even though χ changes. This is
unlikely to be the case in a real system because even though using the average for 𝛥∆𝐻‡/T in
Figures B.17 and B.18 is a necessary simplification, the real measured values of 𝛥∆𝐻‡ represent
a more complicated relationship between the different ∆𝐻‡ values on the various types of sites.
Additionally, changes in ∆𝑆‡ values without changes in ∆𝐻‡ values will have a similar result to
the data shown in Figure B.18. However, many of the experiments performed in this work
indicate that there was no change in the mechanism between AuxPd1 catalysts (Figures
3.4,3.5,3.7, and 3.8) and so there should be no dramatic changes in 𝛥∆𝑆‡.
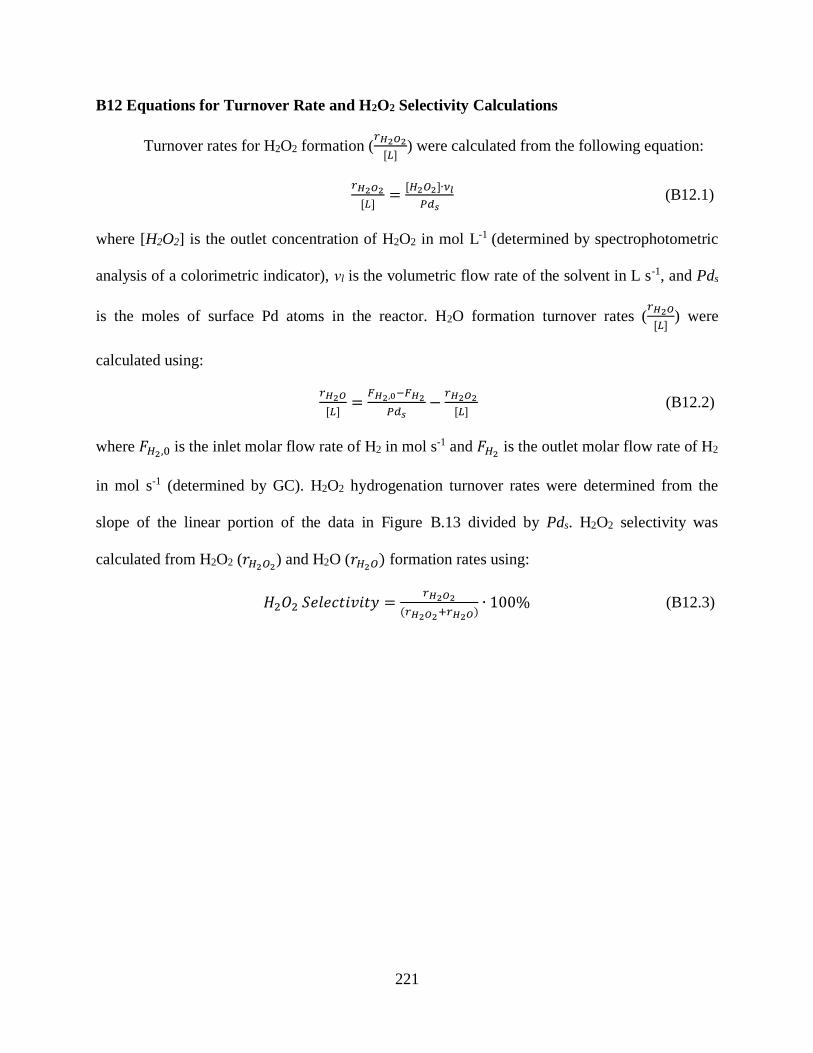
221
B12 Equations for Turnover Rate and H2O2 Selectivity Calculations
Turnover rates for H2O2 formation (𝑟𝐻2𝑂2
[𝐿]) were calculated from the following equation:
𝑟𝐻2𝑂2
[𝐿]=[𝐻2𝑂2]∙𝜈𝑙
𝑃𝑑𝑠 (B12.1)
where [H2O2] is the outlet concentration of H2O2 in mol L-1 (determined by spectrophotometric
analysis of a colorimetric indicator), νl is the volumetric flow rate of the solvent in L s-1, and Pds
is the moles of surface Pd atoms in the reactor. H2O formation turnover rates (𝑟𝐻2𝑂
[𝐿]) were
calculated using:
𝑟𝐻2𝑂
[𝐿]=𝐹𝐻2,0−𝐹𝐻2
𝑃𝑑𝑠−𝑟𝐻2𝑂2
[𝐿] (B12.2)
where 𝐹𝐻2,0 is the inlet molar flow rate of H2 in mol s-1 and 𝐹𝐻2 is the outlet molar flow rate of H2
in mol s-1 (determined by GC). H2O2 hydrogenation turnover rates were determined from the
slope of the linear portion of the data in Figure B.13 divided by Pds. H2O2 selectivity was
calculated from H2O2 (𝑟𝐻2𝑂2) and H2O (𝑟𝐻2𝑂) formation rates using:
𝐻2𝑂2 𝑆𝑒𝑙𝑒𝑐𝑡𝑖𝑣𝑖𝑡𝑦 =𝑟𝐻2𝑂2
(𝑟𝐻2𝑂2+𝑟𝐻2𝑂)∙ 100% (B12.3)
222
APPENDIX C
SUPPLEMENTARY DATA AND ANALYSIS FOR CHAPTER 4
This Appendix includes supplementary information for relating Pt nanoparticles and
AgPt octahedra as catalysts for the direct synthesis of H2O2 such as FTIR spectra used to
calculate 13CO coverage and peak position, evidence for the absence of mass transport
restrictions, evidence that the reduction in rates with time is from leaching effects, details on fits
of exponential decays to transient 13CO-12CO exchange data, details on the assumed mechanism
and associated elementary steps, and details for calculations of activation enthalpies and
entropies.

223
C1 FTIR Spectra of 13CO and 12CO on Pt and AgPt Catalysts
Values of the singleton frequency for 13CO were from the spectra reported below in
Figure C.1. The 13CO peak positions and the error associated were determined by fitting two bi-
gaussians (one for 12CO and one for 13CO) to the data.
Figure C.1 FTIR spectra of adsorbed 13CO and 12CO on (a) Pt, (b) AgPtCO, and (c) AgPtHe
spectra at different θ values (inset) (298 K, 101-103 cm3 min-1, 100 kPa He, 1 kPa CO). The
pretreatment for AgPtCO used 13CO and 12CO instead of just 12CO. Spectra represent the
average of 128 scans with 4 cm-1 resolution.

224
The FTIR spectra of the exchange between adsorbed 13CO and 12CO at various times on Pt and
AgPt catalysts are shown below in Figure C.2.
Figure C.2 FTIR spectra of 13CO at various times between 0 and 833 s after a stream of 12CO in He (0.2 kPa 12CO, 100 cm3 min-1, 298 K) is introduced on (a) Pt, (b) AgPtCO, and (c)
AgPtHe. The catalysts were saturated with adsorbed 13CO before the experiment using
pulses of 13CO in flowing He until the signal for adsorbed 13CO did not change. 12CO was
used for the pretreatment on AgPtCO and so there is some residual adsorbed 12CO on that
catalyst which could not be easily removed with the 13CO pulses. Spectra represent the
average of 8 scans at 4 cm-1 resolution. Each spectra took 7 s to acquire.
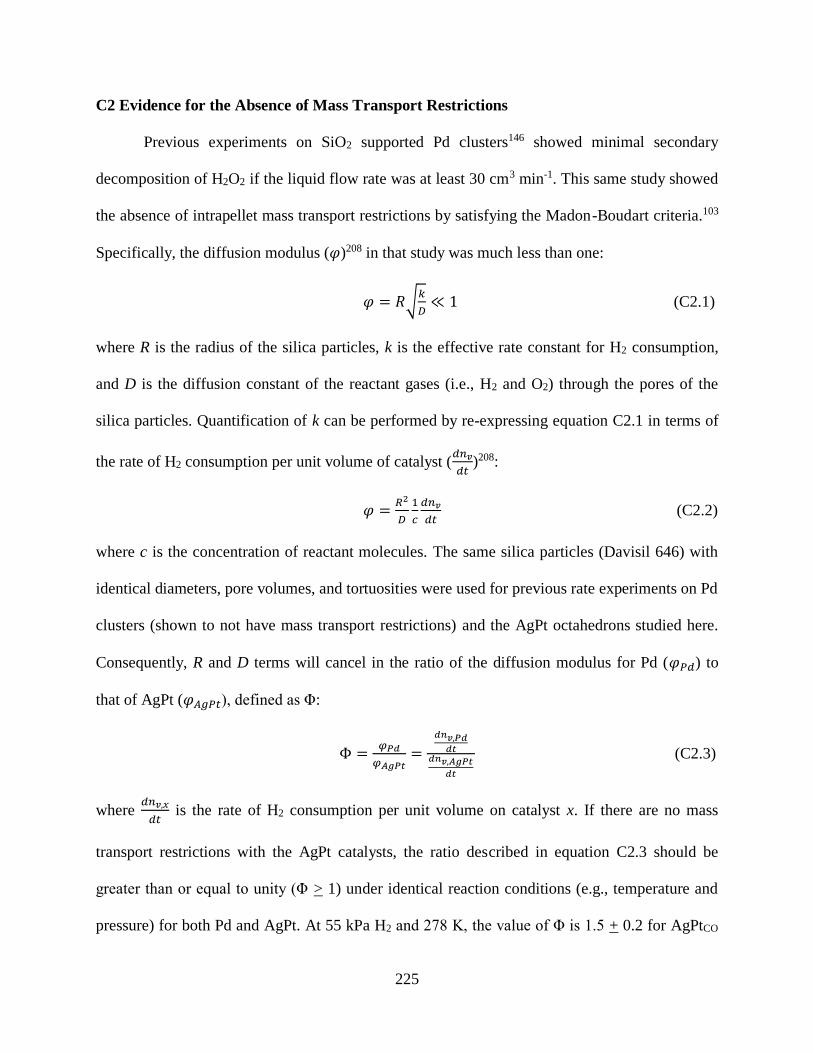
225
C2 Evidence for the Absence of Mass Transport Restrictions
Previous experiments on SiO2 supported Pd clusters146 showed minimal secondary
decomposition of H2O2 if the liquid flow rate was at least 30 cm3 min-1. This same study showed
the absence of intrapellet mass transport restrictions by satisfying the Madon-Boudart criteria.103
Specifically, the diffusion modulus (𝜑)208 in that study was much less than one:
𝜑 = 𝑅√𝑘
𝐷≪ 1 (C2.1)
where R is the radius of the silica particles, k is the effective rate constant for H2 consumption,
and D is the diffusion constant of the reactant gases (i.e., H2 and O2) through the pores of the
silica particles. Quantification of k can be performed by re-expressing equation C2.1 in terms of
the rate of H2 consumption per unit volume of catalyst (𝑑𝑛𝑣
𝑑𝑡)208:
𝜑 =𝑅2
𝐷
1
𝑐
𝑑𝑛𝑣
𝑑𝑡 (C2.2)
where c is the concentration of reactant molecules. The same silica particles (Davisil 646) with
identical diameters, pore volumes, and tortuosities were used for previous rate experiments on Pd
clusters (shown to not have mass transport restrictions) and the AgPt octahedrons studied here.
Consequently, R and D terms will cancel in the ratio of the diffusion modulus for Pd (𝜑𝑃𝑑) to
that of AgPt (𝜑𝐴𝑔𝑃𝑡), defined as Φ:
Φ =𝜑𝑃𝑑
𝜑𝐴𝑔𝑃𝑡=
𝑑𝑛𝑣,𝑃𝑑𝑑𝑡
𝑑𝑛𝑣,𝐴𝑔𝑃𝑡
𝑑𝑡
(C2.3)
where 𝑑𝑛𝑣,𝑥
𝑑𝑡 is the rate of H2 consumption per unit volume on catalyst x. If there are no mass
transport restrictions with the AgPt catalysts, the ratio described in equation C2.3 should be
greater than or equal to unity (Φ > 1) under identical reaction conditions (e.g., temperature and
pressure) for both Pd and AgPt. At 55 kPa H2 and 278 K, the value of Φ is 1.5 + 0.2 for AgPtCO
226
and 1.6 + 0.2 for AgPtAr after 2 h under reaction conditions (i.e., after the catalyst is allowed to
break-in). Likewise, the same approach can be performed for the pure Pt nanoparticles (𝜑𝑃𝑡),
which yields a Φ value of 4.8 + 0.6. Values of Φ were found to be greater than one for both the
AgPt and Pt catalysts, which demonstrates that H2O2 and H2O formation rates were measured in
the absence of mass transport restrictions in this study.

227
C3 Evidence that Reaction Rates Rapidly Decrease from Leaching Effects
Exponential decays (equation 4.3) were fit to H2O2 and H2O formation rate data (Figs.
4.2b and 4.2c) for Pt and AgPtAr for the full time on stream and to AgPtCO from 2 to 6 h. The
time constants (k1) for these fits are shown in Table C.1.
Table C.1 Time constants from fitting an exponential decay to formation rate data Catalyst H2O2 Formation k1
(h-1)
H2O Formation k1 (h-1)
Pt 0.19 + 0.02 0.21 + 0.01
AgPtCOa 0.34 + 0.02 0.49 + 0.03
AgPtAr 0.21 + 0.01 0.32 + 0.01
aFits to an exponential decay for AgPtCO were performed from 2 to 6 h to avoid the initial induction period within
the first 2 h (Figures 4.2b and 4.2c).
These time constants are similar between the three catalysts tested (Table C.1). TEM
images and nanoparticle size distributions taken before (Fig. 4.1a) and after 8 h of direct
synthesis (Figs. 4.1b and 4.1c) show that the mean sizes of the AgPt octahedra do not change,
which in combination with the similar rate of decay between catalysts (Table C.1), suggests that
the decrease in rates over long reaction times reflects the loss of metal from the washing of intact
octahedra off of the support. This conclusion is supported also by the nearly uniform decrease in
both Ag (50%) and Pt (40-55%) content of the AgPt catalysts (Table C.2). Pt deactivates as well
(likely from leaching), however, the amount of metal leached over the reaction period (20%) is
less than metal removed from the support for AgPt catalysts (40-55%).
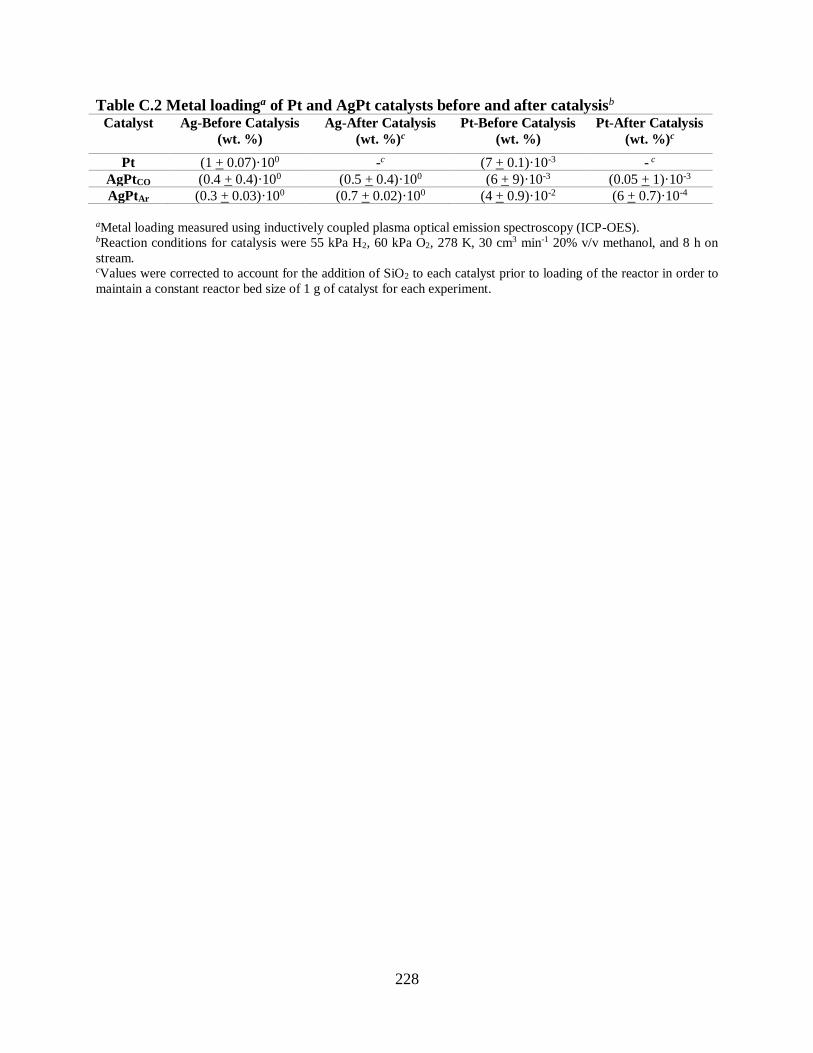
228
Table C.2 Metal loadinga of Pt and AgPt catalysts before and after catalysisb
Catalyst Ag-Before Catalysis
(wt. %)
Ag-After Catalysis
(wt. %)c
Pt-Before Catalysis
(wt. %)
Pt-After Catalysis
(wt. %)c
Pt (1 + 0.07)·100 -c (7 + 0.1)·10-3 - c
AgPtCO (0.4 + 0.4)·100 (0.5 + 0.4)·100 (6 + 9)·10-3 (0.05 + 1)·10-3
AgPtAr (0.3 + 0.03)·100 (0.7 + 0.02)·100 (4 + 0.9)·10-2 (6 + 0.7)·10-4
aMetal loading measured using inductively coupled plasma optical emission spectroscopy (ICP-OES). bReaction conditions for catalysis were 55 kPa H2, 60 kPa O2, 278 K, 30 cm3 min-1 20% v/v methanol, and 8 h on
stream. cValues were corrected to account for the addition of SiO2 to each catalyst prior to loading of the reactor in order to
maintain a constant reactor bed size of 1 g of catalyst for each experiment.

229
C4 Additional Exponential Decay Fits to 13CO Surface Coverage as a Function of Time
Here, equation 2 and 3 were fit to AgPt and Pt (Figure 4.4b), respectively. These fits are
the opposite equations to what are reported in Figure 4.4b and Table 4.1 and are intended to
demonstrate that they are weaker fits. Table C.3 contains the constants from these fits and Table
C.4 shows the residuals from fits reported in Tables 4.1 and C.3.
Figure C.3 (a) Peak position of ν(C=O) for 13CO as a function of θ (total of 1 kPa CO, 100
kPa He, 101-103 cm3 min-1, 298 K) and (b) the ratio of adsorbed 13CO to total adsorbed CO
(θ) as a function of time under flowing 12CO following the adsorption of 13CO (0.2 kPa 12CO, 100 cm3 min-1, 298 K) on Pt (blue ▲) and CO treated (black ■) and He treated (red
●) AgPt octahedra particles. The open point represents that no 13CO was observable and
was not considered in the fits. Solid lines represent a linear fit to the data and dotted lines
represent a fit equation 4.4 for Pt and equation 4.3 for AgPtCO and AgPtHe.
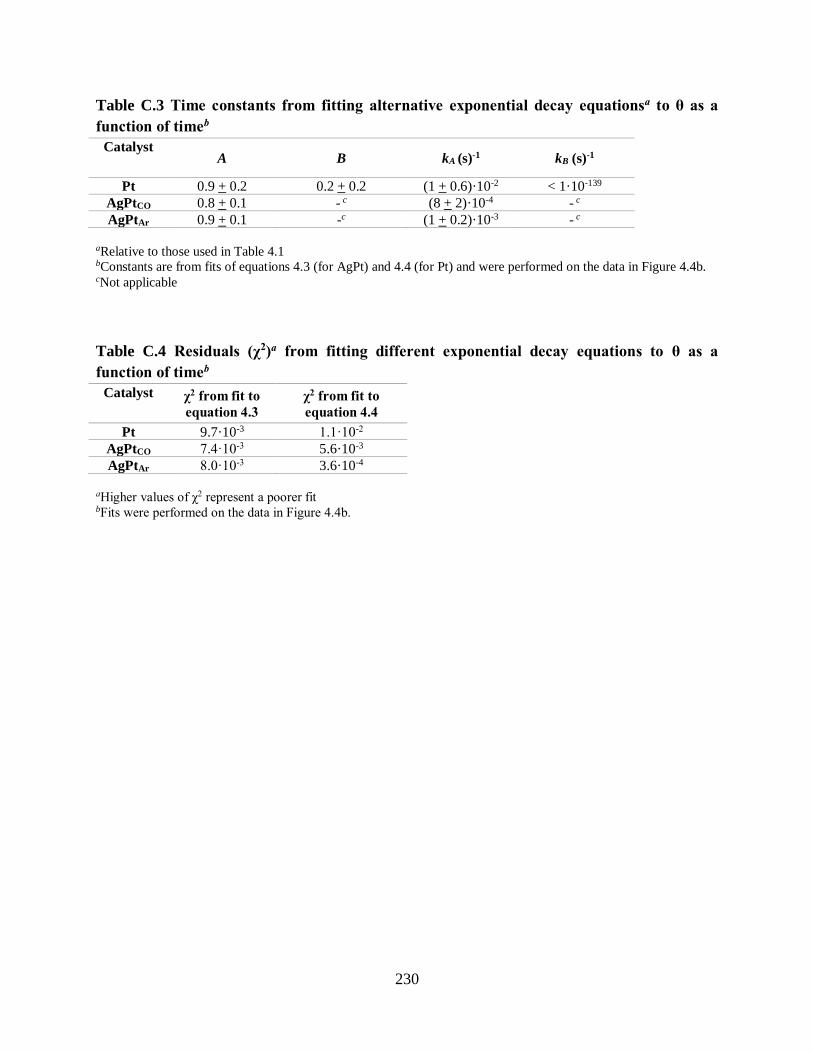
230
Table C.3 Time constants from fitting alternative exponential decay equationsa to θ as a
function of timeb
Catalyst A B kA (s)-1 kB (s)-1
Pt 0.9 + 0.2 0.2 + 0.2 (1 + 0.6)·10-2 < 1·10-139
AgPtCO 0.8 + 0.1 - c (8 + 2)·10-4 - c
AgPtAr 0.9 + 0.1 -c (1 + 0.2)·10-3 - c
aRelative to those used in Table 4.1
bConstants are from fits of equations 4.3 (for AgPt) and 4.4 (for Pt) and were performed on the data in Figure 4.4b. cNot applicable
Table C.4 Residuals (χ2)a from fitting different exponential decay equations to θ as a
function of timeb
Catalyst χ2 from fit to
equation 4.3
χ2 from fit to
equation 4.4
Pt 9.7·10-3 1.1·10-2
AgPtCO 7.4·10-3 5.6·10-3
AgPtAr 8.0·10-3 3.6·10-4
aHigher values of χ2 represent a poorer fit bFits were performed on the data in Figure 4.4b.
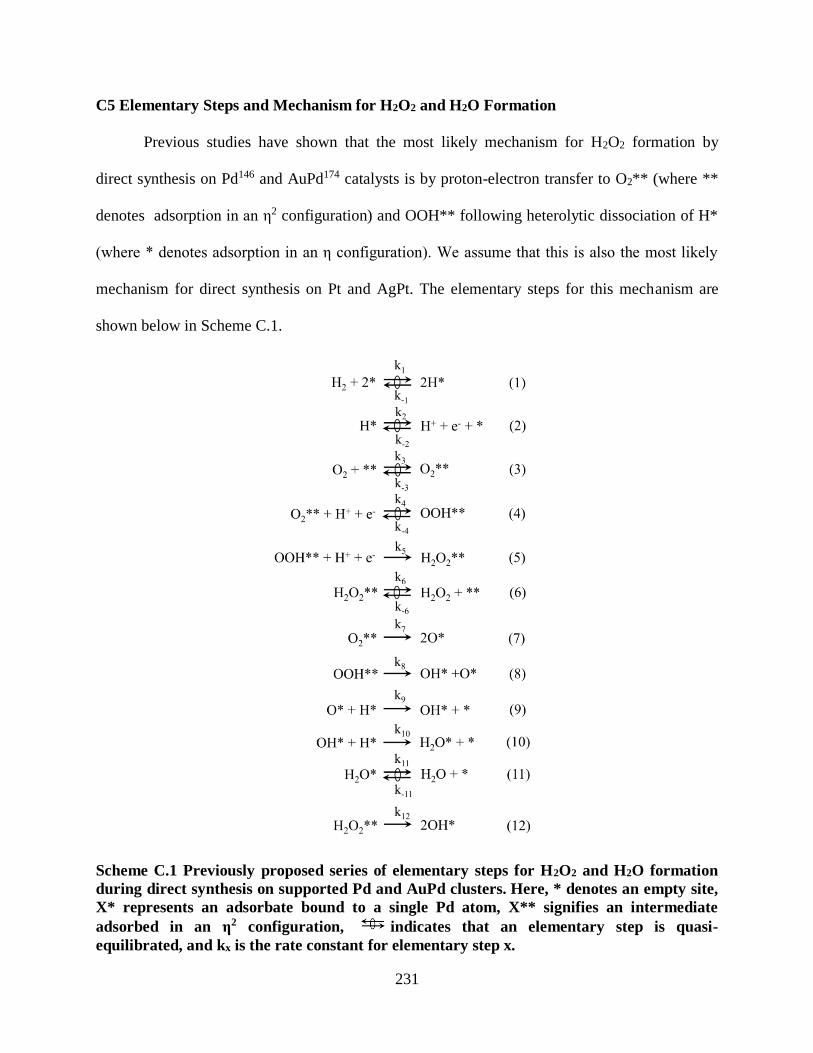
231
C5 Elementary Steps and Mechanism for H2O2 and H2O Formation
Previous studies have shown that the most likely mechanism for H2O2 formation by
direct synthesis on Pd146 and AuPd174 catalysts is by proton-electron transfer to O2** (where **
denotes adsorption in an η2 configuration) and OOH** following heterolytic dissociation of H*
(where * denotes adsorption in an η configuration). We assume that this is also the most likely
mechanism for direct synthesis on Pt and AgPt. The elementary steps for this mechanism are
shown below in Scheme C.1.
Scheme C.1 Previously proposed series of elementary steps for H2O2 and H2O formation
during direct synthesis on supported Pd and AuPd clusters. Here, * denotes an empty site,
X* represents an adsorbate bound to a single Pd atom, X** signifies an intermediate
adsorbed in an η2 configuration, indicates that an elementary step is quasi-
equilibrated, and kx is the rate constant for elementary step x.
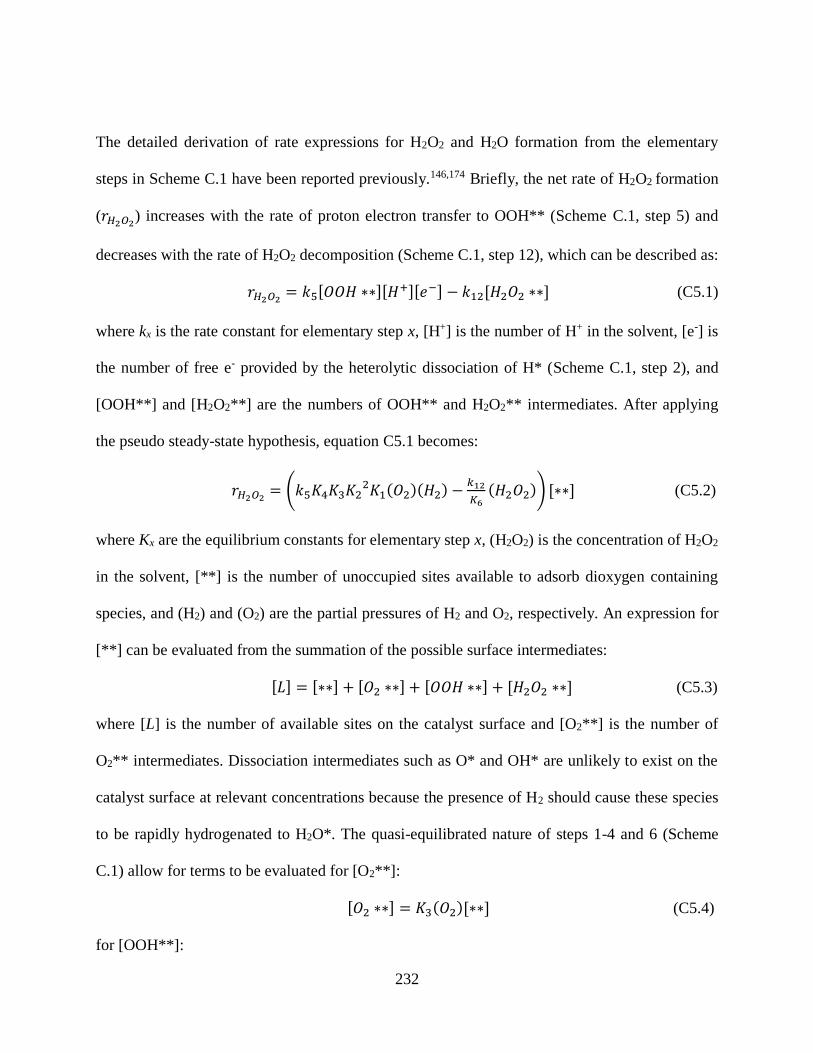
232
The detailed derivation of rate expressions for H2O2 and H2O formation from the elementary
steps in Scheme C.1 have been reported previously.146,174 Briefly, the net rate of H2O2 formation
(𝑟𝐻2𝑂2) increases with the rate of proton electron transfer to OOH** (Scheme C.1, step 5) and
decreases with the rate of H2O2 decomposition (Scheme C.1, step 12), which can be described as:
𝑟𝐻2𝑂2 = 𝑘5[𝑂𝑂𝐻 ∗∗][𝐻+][𝑒−] − 𝑘12[𝐻2𝑂2 ∗∗] (C5.1)
where kx is the rate constant for elementary step x, [H+] is the number of H+ in the solvent, [e-] is
the number of free e- provided by the heterolytic dissociation of H* (Scheme C.1, step 2), and
[OOH**] and [H2O2**] are the numbers of OOH** and H2O2** intermediates. After applying
the pseudo steady-state hypothesis, equation C5.1 becomes:
𝑟𝐻2𝑂2 = (𝑘5𝐾4𝐾3𝐾22𝐾1(𝑂2)(𝐻2) −
𝑘12
𝐾6(𝐻2𝑂2)) [∗∗] (C5.2)
where Kx are the equilibrium constants for elementary step x, (H2O2) is the concentration of H2O2
in the solvent, [**] is the number of unoccupied sites available to adsorb dioxygen containing
species, and (H2) and (O2) are the partial pressures of H2 and O2, respectively. An expression for
[**] can be evaluated from the summation of the possible surface intermediates:
[𝐿] = [∗∗] + [𝑂2 ∗∗] + [𝑂𝑂𝐻 ∗∗] + [𝐻2𝑂2 ∗∗] (C5.3)
where [L] is the number of available sites on the catalyst surface and [O2**] is the number of
O2** intermediates. Dissociation intermediates such as O* and OH* are unlikely to exist on the
catalyst surface at relevant concentrations because the presence of H2 should cause these species
to be rapidly hydrogenated to H2O*. The quasi-equilibrated nature of steps 1-4 and 6 (Scheme
C.1) allow for terms to be evaluated for [O2**]:
[𝑂2 ∗∗] = 𝐾3(𝑂2)[∗∗] (C5.4)
for [OOH**]:

233
[𝑂𝑂𝐻 ∗∗] = 𝐾4𝐾3𝐾2𝐾11
2(𝑂2)(𝐻2)1
2[∗∗] (C5.5)
and for [H2O2**]:
[𝐻2𝑂2 ∗∗] =1
𝐾6(𝐻2𝑂2)[∗∗] (C5.6)
Substitution of equations C5.47-C5.6 into equation C5.3 yields:
[𝐿] = [∗∗] + 𝐾3(𝑂2)[∗∗] + 𝐾4𝐾3𝐾2𝐾11
2(𝑂2)(𝐻2)1
2[∗∗] +1
𝐾6(𝐻2𝑂2)[∗∗] (C5.7)
Substitution of equation C5.7 into equation C5.2 results in the rate expression for H2O2
formation:
𝑟𝐻2𝑂2
[𝐿]=
𝑘5𝐾4𝐾3𝐾22𝐾1(𝐻2)(𝑂2)−
𝑘12𝐾6(𝐻2𝑂2)
1+𝐾3(𝑂2)+𝐾4𝐾3𝐾2𝐾112(𝐻2)
12(𝑂2)+
1
𝐾6(𝐻2𝑂2)
(C5.8)
Equation C5.8 can be simplified further by assuming that the concentration of H2O2 is low,
which results from the high liquid flow rates implemented in this study (30 cm3 min-1):
𝑟𝐻2𝑂2
[𝐿]=
𝑘5𝐾4𝐾3𝐾22𝐾1(𝐻2)(𝑂2)
1+𝐾3(𝑂2)+𝐾4𝐾3𝐾2𝐾112(𝐻2)
12(𝑂2)
(C5.9)
The rate expression for H2O formation can be derived using a similar approach. First, the
rate of H2O formation ( 𝑟𝐻2𝑂) is defined by summing the rates for the elementary steps which
involve the dissociation of the O-O bond (Scheme C.1, steps 7,8, and 12):
𝑟𝐻2𝑂 = 𝑘7[𝑂2 ∗∗] + 𝑘8[𝑂𝑂𝐻 ∗∗] + 𝑘12[𝐻2𝑂2 ∗∗] (C5.10)
Substitution of equations C5.4-C5.6 into equation C5.10 results in the following equation:
𝑟𝐻2𝑂 = 𝑘7𝐾3(𝑂2)[∗∗] + 𝑘8𝐾4𝐾3𝐾2𝐾11
2(𝑂2)(𝐻2)1
2[∗∗] + 𝑘121
𝐾6(𝐻2𝑂2)[∗∗] (C5.11)
If it is assumed that the same active sites that form H2O2 also form H2O, equation C5.7 can be
substituted into equation C5.11, yielding the rate expression for H2O formation:
𝑟𝐻2𝑂
[𝐿]=𝑘7𝐾3(𝑂2)+𝑘8𝐾4𝐾3𝐾2𝐾1
12(𝐻2)
12(𝑂2)+
𝑘12𝐾6(𝐻2𝑂2)
1+𝐾3(𝑂2)+𝐾4𝐾3𝐾2𝐾112(𝐻2)
12(𝑂2)+
1
𝐾6(𝐻2𝑂2)
(C5.12)
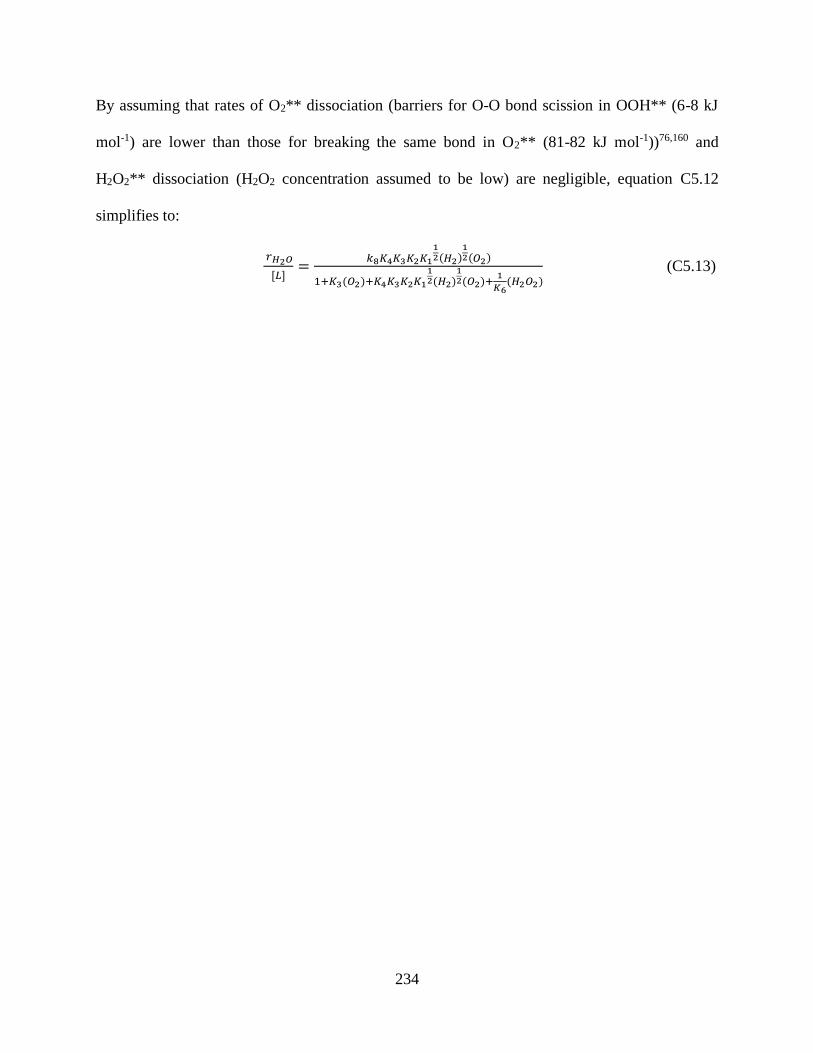
234
By assuming that rates of O2** dissociation (barriers for O-O bond scission in OOH** (6-8 kJ
mol-1) are lower than those for breaking the same bond in O2** (81-82 kJ mol-1))76,160 and
H2O2** dissociation (H2O2 concentration assumed to be low) are negligible, equation C5.12
simplifies to:
𝑟𝐻2𝑂
[𝐿]=
𝑘8𝐾4𝐾3𝐾2𝐾112(𝐻2)
12(𝑂2)
1+𝐾3(𝑂2)+𝐾4𝐾3𝐾2𝐾112(𝐻2)
12(𝑂2)+
1
𝐾6(𝐻2𝑂2)
(C5.13)
235
C6 Calculation of Activation Enthalpies and Entropies
Transition state theory proposes that the reactant species are in equilibrium with a
transition state for a given elementary step. Previously, it has been shown that reaction rate data
are well described by derived rate expressions for H2O2 (equation C5.9) and H2O (equation
C5.13) formation, therefore the reactant species are in equilibrium also with gaseous H2 and
O2** (O2** was shown previously to be the most abundant surface intermediate).146 Therefore,
the transition state equilibrium for H2O2 formation can be described by:
𝑂2 ∗∗ +𝐻2(𝑔)𝐾‡𝐻2𝑂2↔ 𝐻+ − 𝑂𝑂𝐻 ∗∗‡ (C6.1)
where 𝐾‡𝐻2𝑂2is the transition state equilibrium constant for H2O2 formation and 𝐻+ − 𝑂𝑂𝐻 ∗∗‡
is the transition-state. The same arguments can be made for H2O formation, where the
equilibrium between the reactants and transition state can be described by:
𝑂2 ∗∗ +1
2𝐻2(𝑔)
𝐾‡𝐻2𝑂↔ 𝑂 − 𝑂𝐻 ∗∗‡ (C6.2)
where 𝐾‡𝐻2𝑂 is the transition state equilibrium constant for H2O formation and 𝑂 − 𝑂𝐻 ∗∗‡ is
the transition-state. Conventions of transition state theory and the equilibrated nature of the
reactions in equations C6.1 and C6.2 allow them to be redefined using (H2) and their 𝐾‡ values:
𝑟𝐻2𝑂2
[𝐿]=𝑘𝐵𝑇
ℎ𝐾‡𝐻2𝑂2(𝐻2) (C6.3)
for H2O2 formation and:
𝑟𝐻2𝑂
[𝐿]=𝑘𝐵𝑇
ℎ𝐾‡𝐻2𝑂(𝐻2)
1
2 (C6.4)
for H2O formation, where T is the temperature in kelvin, and h and kB are Planck's and
Boltzmann's constants, respectively. Activation enthalpies (∆H‡) and entropies (∆S‡) for H2O2
and H2O formation on Pt and AgPt were calculated from measured 𝐾‡ values (determined by
substituting the data from Figure 4.5 into equations C6.3 and C6.4, respectively) by first using

236
transition state theory to express the 𝐾‡ values in terms of the change in free energy (∆G‡) and
the ideal gas constant (R):
𝐾‡ = 𝑒−∆𝐺‡
𝑅𝑇⁄ (C6.5)
then using ∆G‡=∆H‡-T∆S‡:
𝐾‡ = 𝑒−∆𝐻‡
𝑅𝑇⁄ ∙ 𝑒∆𝑆‡
𝑅⁄ (C6.6)

237
APPENDIX D
SUPPLEMENTARY DATA AND ANALYSIS FOR CHAPTER 5
This Appendix provides supplementary data that shows that PdxZny catalysts are not mass
transport limited, the stability of PdxZny catalysts for extended times on stream (> 32 h), and fits
of rate data as a function of reactant pressure on Pd and PdxZny to a power law equation.
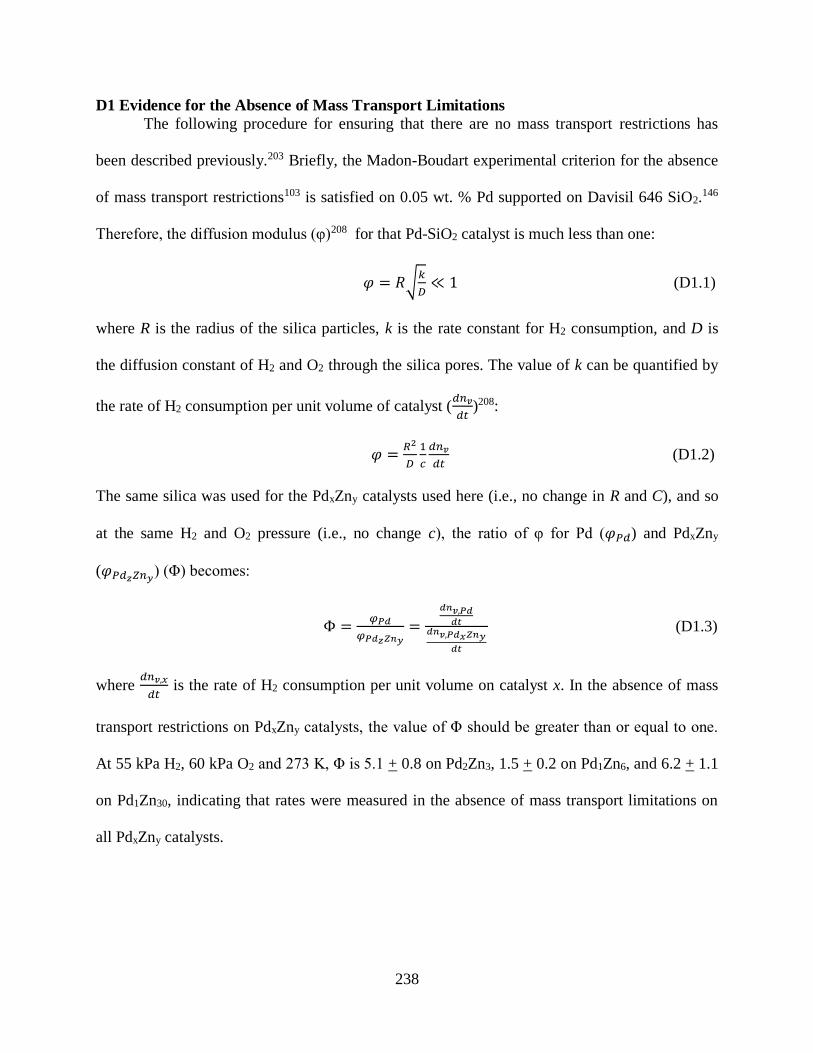
238
D1 Evidence for the Absence of Mass Transport Limitations
The following procedure for ensuring that there are no mass transport restrictions has
been described previously.203 Briefly, the Madon-Boudart experimental criterion for the absence
of mass transport restrictions103 is satisfied on 0.05 wt. % Pd supported on Davisil 646 SiO2.146
Therefore, the diffusion modulus (φ)208 for that Pd-SiO2 catalyst is much less than one:
𝜑 = 𝑅√𝑘
𝐷≪ 1 (D1.1)
where R is the radius of the silica particles, k is the rate constant for H2 consumption, and D is
the diffusion constant of H2 and O2 through the silica pores. The value of k can be quantified by
the rate of H2 consumption per unit volume of catalyst (𝑑𝑛𝑣
𝑑𝑡)208:
𝜑 =𝑅2
𝐷
1
𝑐
𝑑𝑛𝑣
𝑑𝑡 (D1.2)
The same silica was used for the PdxZny catalysts used here (i.e., no change in R and C), and so
at the same H2 and O2 pressure (i.e., no change c), the ratio of φ for Pd (𝜑𝑃𝑑) and PdxZny
(𝜑𝑃𝑑𝑧𝑍𝑛𝑦) (Φ) becomes:
Φ =𝜑𝑃𝑑
𝜑𝑃𝑑𝑧𝑍𝑛𝑦=
𝑑𝑛𝑣,𝑃𝑑𝑑𝑡
𝑑𝑛𝑣,𝑃𝑑𝑥𝑍𝑛𝑦
𝑑𝑡
(D1.3)
where 𝑑𝑛𝑣,𝑥
𝑑𝑡 is the rate of H2 consumption per unit volume on catalyst x. In the absence of mass
transport restrictions on PdxZny catalysts, the value of Φ should be greater than or equal to one.
At 55 kPa H2, 60 kPa O2 and 273 K, Φ is 5.1 + 0.8 on Pd2Zn3, 1.5 + 0.2 on Pd1Zn6, and 6.2 + 1.1
on Pd1Zn30, indicating that rates were measured in the absence of mass transport limitations on
all PdxZny catalysts.
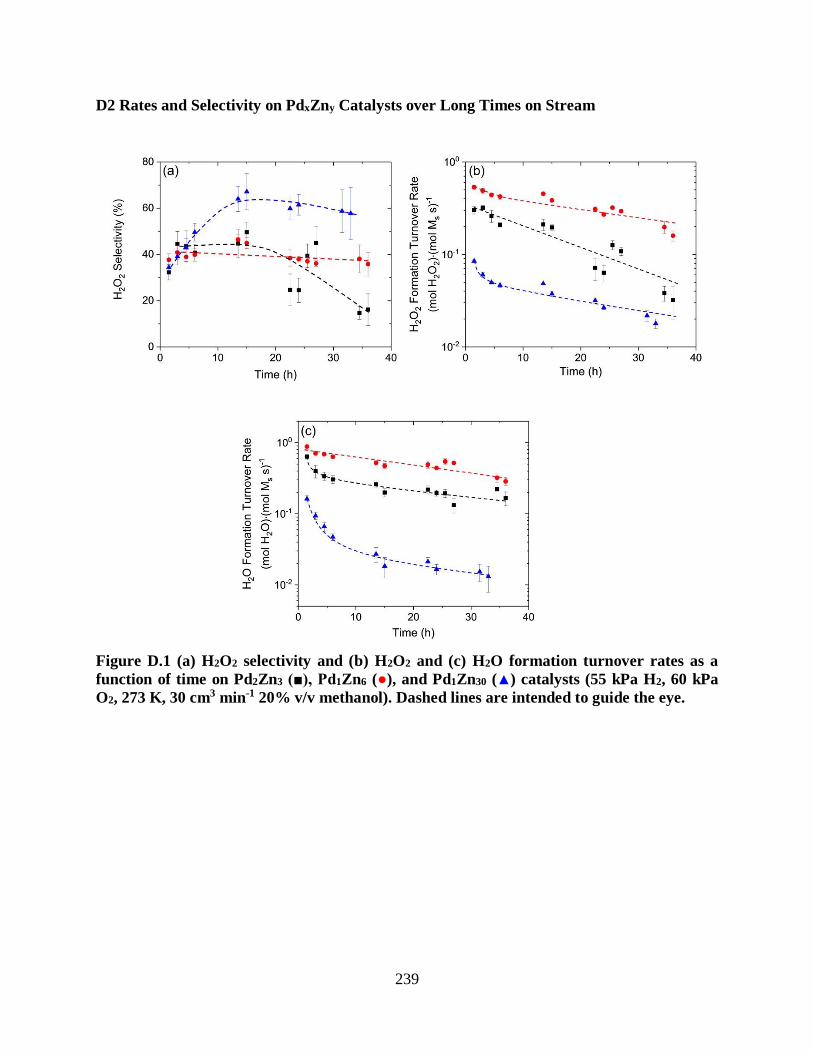
239
D2 Rates and Selectivity on PdxZny Catalysts over Long Times on Stream
Figure D.1 (a) H2O2 selectivity and (b) H2O2 and (c) H2O formation turnover rates as a
function of time on Pd2Zn3 (■), Pd1Zn6 (●), and Pd1Zn30 (▲) catalysts (55 kPa H2, 60 kPa
O2, 273 K, 30 cm3 min-1 20% v/v methanol). Dashed lines are intended to guide the eye.

240
D3 Power Law Fits to H2O2 and H2O Formation Rates and χ as a Function of Reactant
Pressure
The following power law was used to describe H2O2 and H2O formation as a function of
reactant pressure:
𝑟𝑥 = 𝑎 ∙ 𝑃𝑏 (D3.1)
where r is the turnover rate for product x, P is the varied reactant pressure, a is a pre-exponential
constant, and b is the constant which describes the reaction order. Equation D3.1 was fit over the
range of data where there was expected to be no change in the MARI, therefore, data in Figure
5.4 was fit from 25-100 kPa H2 and then a separate fit was performed from 100-400 kPa H2
while data in Figure 5.5 was fit over the entire range of O2 pressures. Table D.1 summarizes the
power law results of these fittings. Figure D.2 shows the same data in Figures 5.4 and 5.5 plotted
in terms of χ (equation 5.10). Fits of these data to equation D3.1 show power law dependencies
on H2 and O2 pressure for H2O2 and H2O formation (shown as inset) between all three catalysts.
This indicates that the MARI is the same for both H2O2 and H2O formation and that changes in
the MARI occur for both formation pathways simultaneously.
Table D.1 Power law constants (b) from fitsa to formation rates as a function of (H2) and
(O2)
a Fits were performed on the data in Figures 5.4 and 5.5 using equation D3.1 b (H2) > 100 kPa c (H2) < 100 kPa
Catalyst H2O2 power
dependence
on (H2)
H2O power
dependence
on (H2)
H2O2 power
dependence on
(H2)
H2O power
dependence
on (H2)
H2O2 power
dependence
on (O2)
H2O power
dependence
on (O2)
OOH** MARIb O2** MARIc
Pd 0.23 + 0.03 0.14 + 0.04 0.91 + 0.15 0.27 + 0.14 0.02 + 0.03 0.04 + 0.1
Pd1Zn6 0.51 + 0.04 -0.17 + 0.22 1.5 + 0.22 1.3 + 0.19 -0.08 + 0.02 0.08 + 0.09
Pd1Zn30 0.28 + 0.03 0.09 + 0.01 1.1 + 0.14 1.1 + 0.12 -0.15 + 0.04 0.14 + 0.08
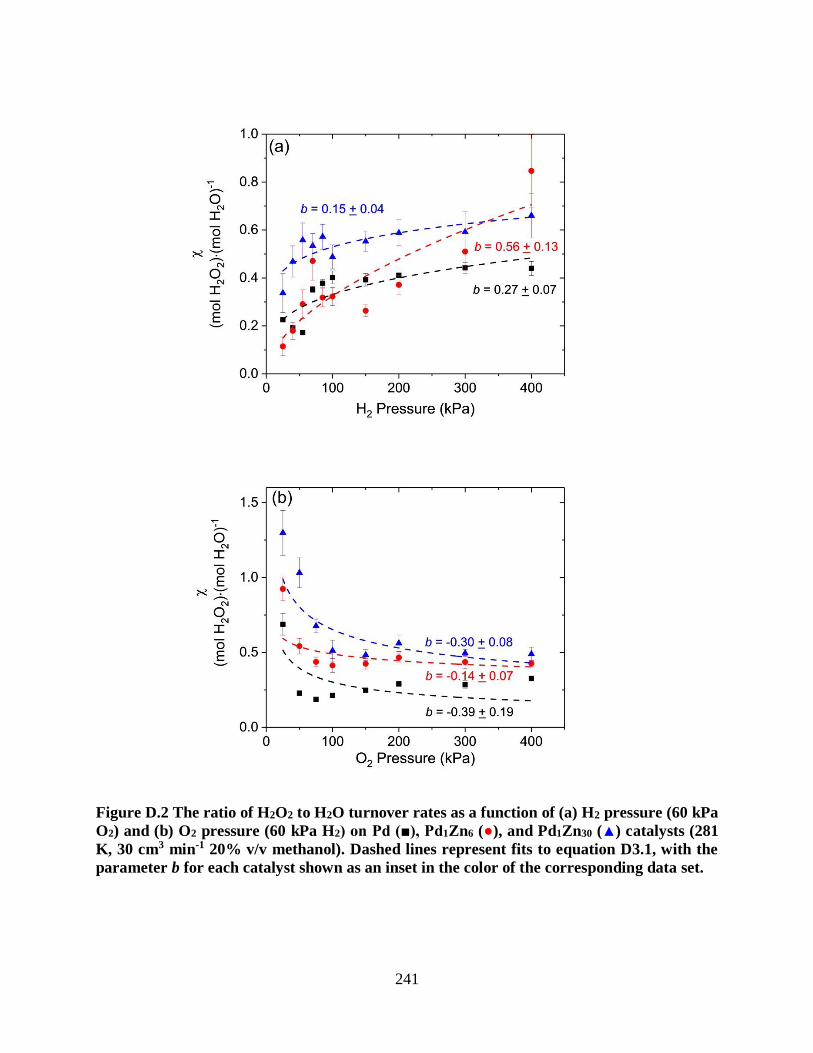
241
Figure D.2 The ratio of H2O2 to H2O turnover rates as a function of (a) H2 pressure (60 kPa
O2) and (b) O2 pressure (60 kPa H2) on Pd (■), Pd1Zn6 (●), and Pd1Zn30 (▲) catalysts (281
K, 30 cm3 min-1 20% v/v methanol). Dashed lines represent fits to equation D3.1, with the
parameter b for each catalyst shown as an inset in the color of the corresponding data set.