Embed Size (px)
Citation preview

ENHANCED FINITE ELEMENT ANALYSIS TOOLS AND INSTRUMENTATION METHOD TO EVALUATE THE STRUCTURAL BEHAVIOR OF NON-CONVENTIONAL
CONCRETE PAVEMENTS
By
KUKJOO KIM
A DISSERTATION PRESENTED TO THE GRADUATE SCHOOL OF THE UNIVERSITY OF FLORIDA IN PARTIAL FULFILLMENT
OF THE REQUIREMENTS FOR THE DEGREE OF DOCTOR OF PHILOSOPHY
UNIVERSITY OF FLORIDA
2017

© 2017 Kukjoo Kim

To my beloved family

4
ACKNOWLEDGMENTS
First of all, I sincerely appreciate my advisor Dr. Tia for his invaluable guidance
and support throughout my studies at the University of Florida. He has always inspired
and believed in me, and he has given specific guidance to complete my dissertation. I
also would like to extend my gratitude to other committee members, Dr. Reynaldo
Roque, Dr. Fazil Najafi, and Dr. Larry C. Muszynski, for their support to accomplish my
doctoral study.
Secondly, I appreciate my country, the Republic of Korea, and the Korea Army
Engineers. My country and the Army gave me the chance to study civil engineering and
also have supported me in many ways.
Finally, I sincerely appreciate my family, my wife, Soonjung Woo, my son,
Seonghoon Kim, and my daughter, Jane (Kaylee) Kim for their enduring love,
encouragement and support. Especially, my wife has always been my most important
mentors and advisors in my life. It is a great pleasure for me to thank and acknowledge
the individuals who advised and supported during the course of my doctoral program.
5
TABLE OF CONTENTS page
ACKNOWLEDGMENTS .................................................................................................. 4
LIST OF TABLES ............................................................................................................ 8
LIST OF FIGURES ........................................................................................................ 10
LIST OF ABBREVIATIONS ........................................................................................... 13
ABSTRACT ................................................................................................................... 14
CHAPTER
1 INTRODUCTION .................................................................................................... 16
Background ............................................................................................................. 16
Objectives and Scope ............................................................................................. 18 Research Hypothesis .............................................................................................. 19 Research Approach ................................................................................................ 19
2 LITERATURE REVIEW .......................................................................................... 23
Analytical Response Model ..................................................................................... 23
Two-Dimensional Finite Element Models ................................................................ 26 Three-Dimensional Finite Element Models ............................................................. 28
Summary ................................................................................................................ 32
3 DEVELOPMENT OF A FINITE ELEMENT MODEL FOR JPCP USING CONCRETE CONTAINING RAP ............................................................................ 34
Overview ................................................................................................................. 34 Literature Review on FE modeling of JPCP ............................................................ 35
Concrete Slab ................................................................................................... 35 Subgrade Layer ................................................................................................ 36 Transverse and Longitudinal Joints .................................................................. 37
Interface Between Concrete Slab and Base ..................................................... 37
Applied Loads ................................................................................................... 38 Temperature and Moisture Effects ................................................................... 39
Finite Element Modeling ......................................................................................... 40
Mechanical Properties of Concrete Containing RAP ........................................ 40 Compressive, flexural, and splitting tensile strength .................................. 40 Modulus of elasticity ................................................................................... 40 Coefficient of thermal expansion ................................................................ 41 Toughness ................................................................................................. 41
Characterization of the RAP Concrete ............................................................. 42

6
FE Modeling of Concrete Pavement Containing RAP ...................................... 42
Modeling of RAP concrete material ............................................................ 42 Modeling of pavement structure ................................................................. 43
Loading configuration and temperature effects .......................................... 44 FE Results Considering Actual Stress-Strain Characteristics ................................. 44 Summary of Findings .............................................................................................. 45
4 DEVELOPMENT OF A FINITE ELEMENT MODEL FOR PPCP ............................ 59
Overview ................................................................................................................. 59
Background ...................................................................................................... 59 Objectives ......................................................................................................... 60 Scope ............................................................................................................... 61
Experience of the PPCP in Florida ......................................................................... 61 Finite Element Modeling ......................................................................................... 63
FE Modeling of PPCP ...................................................................................... 63
Modeling of Prestress ....................................................................................... 64 Modeling of Concrete-AC Interface .................................................................. 65
Calibration of FE Model and Determination of Model Parameters .................... 65 Results of Parametric Analysis ............................................................................... 67
Effects of Loading Location on Critical Stresses .............................................. 67
Effects of Concrete Modulus ............................................................................ 68 Effects of Coefficient of Thermal Expansion ..................................................... 69
Effects of Prestress Force on Critical Stresses ................................................ 69 Effects of Subgrade Stiffness ........................................................................... 70
Summary of Findings .............................................................................................. 71
5 DEVELOPMENT OF A FINITE ELEMENT MODEL FOR ANALYSIS OF CRCP ... 80
Overview ................................................................................................................. 80
Background ...................................................................................................... 80 Objectives ......................................................................................................... 82
Scope ............................................................................................................... 82 Mechanism of Horizontal Cracking in CRCP .......................................................... 82 Finite Element Modeling of CRCP .......................................................................... 83
Effect of Critical Loading Condition on Horizontal Cracking .................................... 84 Effects of Concrete Properties ................................................................................ 85
Effects of Coefficient of Thermal Expansion ..................................................... 85
Effects of Concrete Modulus ............................................................................ 86
Effects of Structural Design Parameters ................................................................. 87 Effects of Base Layer Modulus ......................................................................... 87 Effects of Base Friction .................................................................................... 88 Effects of Concrete Slab Thickness .................................................................. 89 Effects of Transverse Crack Spacing ............................................................... 89
Effects of Longitudinal Steel Design ....................................................................... 90 Summary of Findings .............................................................................................. 90

7
6 LABORATORY TESTING TO EVALUATE THE PERFORMANCE AND SUITABILITY OF SENSORS ................................................................................ 102
Background ........................................................................................................... 102
Overview of Instrumentation ................................................................................. 103 Vibrating Wire Strain Gauge ........................................................................... 104 Electrical Resistance Strain Gauges .............................................................. 104 Fiber-optic Sensor .......................................................................................... 105
Laboratory Testing Program ................................................................................. 106
Concrete Specimens ...................................................................................... 107 Concrete Mixtures .......................................................................................... 107 Compression Test .......................................................................................... 108 Shrinkage Test ............................................................................................... 109
Results of Sensor Evaluation ................................................................................ 110 Evaluation of Gauge Accuracy ....................................................................... 110
Evaluation of Gauge Repeatability and Reproducibility .................................. 110 Results of Concrete Shrinkage Measurements .............................................. 112
Summary of Findings ............................................................................................ 112
7 EFFECTIVE INSTRUMENTATION PLAN AND ANALYSIS METHODOLOGY .... 124
Overview ............................................................................................................... 124
Background .................................................................................................... 124 Objectives and Scope .................................................................................... 125
Test Facility and Instrumentation .......................................................................... 125
Instrumentation Layout and Installation .......................................................... 125
FE Modeling of Test Slab Section .................................................................. 126 Calibration and Validation of the FE Model .................................................... 127
Configurations of Strain Gauges for Test Slabs .................................................... 129
Summary of Findings ............................................................................................ 130
8 CONCLUSIONS ................................................................................................... 139
Summary and Findings ......................................................................................... 139 Recommendations ................................................................................................ 141
LIST OF REFERENCES ............................................................................................. 142
BIOGRAPHICAL SKETCH .......................................................................................... 148

8
LIST OF TABLES
Table page 2-1 Summary of finite element models for rigid pavement analysis .......................... 33
3-1 Mix designs of the RAP concrete in the study by Tia et al. (2009)...................... 47
3-2 The RAP concrete material properties from the study by Tia et al. (2009) ......... 47
3-3 Stress-strain values used in the non-linear models ............................................ 48
3-4 Elastic modulus values used in the linear models .............................................. 48
3-5 Comparison of maximum stresses computed by the linear elastic and actual stress-strain models for the concrete mix with 0% RAP ..................................... 49
3-6 Comparison of maximum stresses computed by the linear elastic and actual stress-strain models for the concrete mix with 10% RAP ................................... 50
3-7 Comparison of maximum stresses computed by the linear elastic and actual stress-strain models for the concrete mix with 20% RAP ................................... 51
3-8 Comparison of maximum stresses computed by the linear elastic and actual stress-strain models for the concrete mix with 40% RAP ................................... 52
4-1 Prestress force and applied initial strain in each tendon ..................................... 73
4-2 Material properties used in the FE model ........................................................... 73
4-3 Computed maximum stresses in the PPCP system caused by a 22-kip axle load ..................................................................................................................... 73
4-4 Effects of prestress on maximum stresses at +20 °F temperature gradient ....... 74
4-5 Effects of prestress on maximum stresses at -20 °F temperature gradient ........ 75
5-1 Geometry and material properties used in the CRCP model .............................. 92
6-1 Mix proportions for concrete mixture used. ....................................................... 114
6-2 Compression loading cases used. .................................................................... 114
6-3 Summary of sensor accuracy test results. ........................................................ 115
6-4 Results of Student’s t-tests on the accuracy test at 95% confidence level. ...... 115
6-5 Measured dynamic strains from two Kyowa gauges and calculated statistics. . 116

9
6-6 Summary of statistical analysis results. ............................................................ 117
6-7 Summary of shrinkage test and t-test results at 95% confidence level ............. 117
7-1 Summary of model parameters calibrated for the test slabs. ............................ 131
7-2 Calculated strain responses of concrete slab at various wheel wander positions. .......................................................................................................... 131
7-3 Calculated strain responses of concrete slab for various wheel widths. ........... 132

10
LIST OF FIGURES
Figure page 1-1 Research approach diagram .............................................................................. 22
3-1 8-, 20-, 21- & 27-nodes elements ....................................................................... 53
3-2 Foundation displacement under an applied load ................................................ 53
3-3 Modeling of joint by linear springs ...................................................................... 53
3-4 Modeling of dowel bar with actual dimension and steel properties ..................... 54
3-5 Interface model used in this study ...................................................................... 54
3-6 Reduction in compressive, flexural and splitting tensile strength ........................ 54
3-7 Example of stress-strain behavior of RAP concrete ........................................... 55
3-8 Stress-Strain Curve for Concrete Containing RAP.. ........................................... 56
3-9 3-D finite element model developed for analysis of a RAP concrete slab ........... 57
3-10 Critical loading conditions ................................................................................... 57
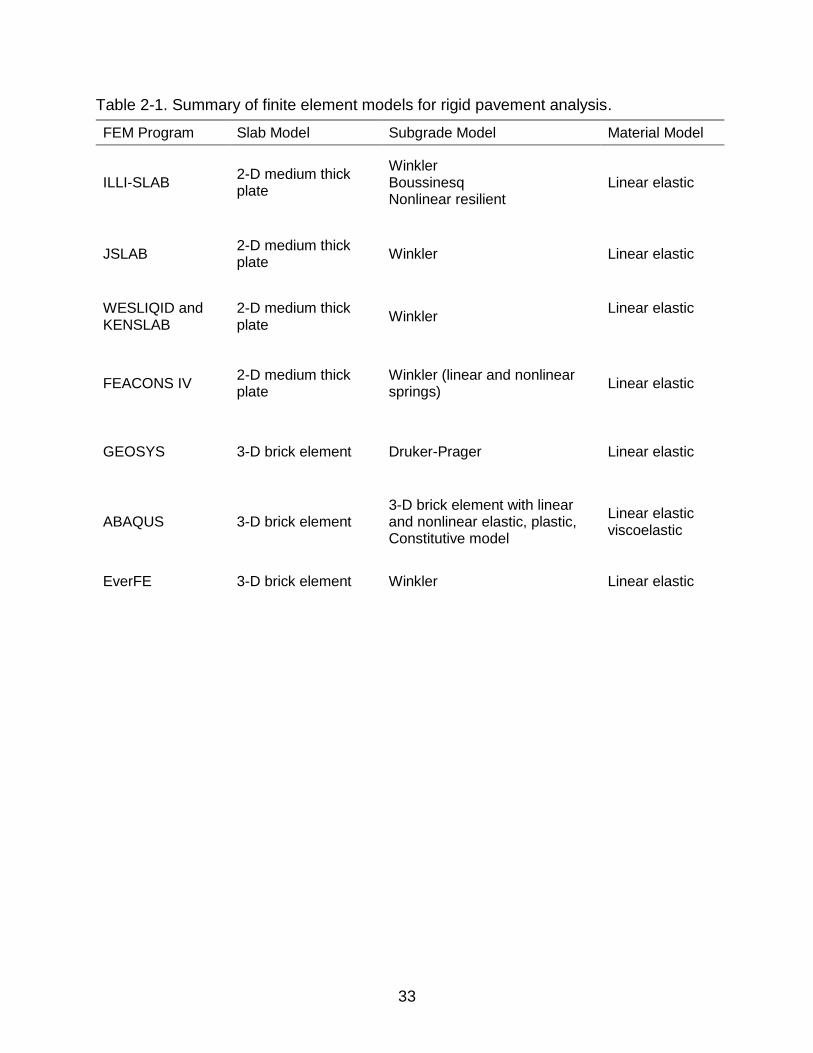
3-11 Computed stress-strength ratios for concrete slabs containing RAP .................. 58
4-1 Pavement structure modeled .............................................................................. 76
4-2 Finite element model developed ......................................................................... 76
4-3 Matching of deflection basins in the longitudinal direction caused by a 19-kip (85 kN) FWD load applied to the center of a PPCP lane .................................... 77
4-4 Illustration of critical loading conditions at slab corner and middle edge ............ 77
4-5 Effects of concrete modulus on maximum stress and stress ratio in PPCP ....... 78
4-6 Effects of coefficient of thermal expansion on maximum stresses in PPCP ....... 78
4-7 Effect of subgrade stiffness on critical stresses at +20 °F temperature gradient .............................................................................................................. 79
4-8 Effect of subgrade stiffness on critical stresses at -20 °F temperature gradient .............................................................................................................. 79
5-1 Horizontal cracking in CRCP .............................................................................. 93

11
5-2 Vertical stress of concrete in CRCP ................................................................... 94
5-3 Finite element model of CRCP ........................................................................... 95
5-4 Finite element model for concrete-steel interface ............................................... 96
5-5 Computed vertical tensile stresses at the depth of steels ................................... 97
5-6 Effects of coefficient of thermal expansion on maximum vertical stresses at the depth of steel ................................................................................................ 98
5-7 Effects of concrete modulus on maximum vertical tensile stresses in CRCP under critical temperature-load condition ............................................................ 98
5-8 Effects of subgrade stiffness on maximum vertical stresses in CRCP under critical temperature-load condition ...................................................................... 99
5-9 Effects of base friction on maximum vertical stresses in CRCP under critical temperature-load condition ................................................................................. 99
5-10 Effects of concrete slab thickness on maximum vertical stresses in CRCP under critical temperature-load condition .......................................................... 100
5-11 Effects of transverse crack spacing on maximum vertical stresses in CRCP under critical temperature-load condition .......................................................... 100
5-12 Effects of longitudinal steel spacing on maximum vertical stresses in CRCP under critical temperature-load condition .......................................................... 101
6-1 Model 4200 Vibrating Wire Strain Gauge. ........................................................ 118
6-2 Comparison of 2-wire and 3-wire connections for electrical resistance strain gauge. .............................................................................................................. 118
6-3 Fiber-optic sensor system ................................................................................ 119
6-4 Principle of operation of a FBG sensor. ............................................................ 119
6-5 Locations of sensors in concrete specimens. ................................................... 120
6-6 Concrete specimen tested in compression ....................................................... 121
6-7 Set-up for free shrinkage measurement using a LVDT ..................................... 121
6-8 Accuracy test results ........................................................................................ 122
6-9 Comparison of free shrinkage strain measurements ........................................ 123
7-1 Instrumentation layout. ..................................................................................... 133

12
7-2 3-D finite element model for test slabs. ............................................................ 133
7-3 Example of determination of elastic modulus using FWD deflection basin caused by a 9-kip FWD load at slab center for test-1 slab. .............................. 134
7-4 Example of determination of spring stiffness across the joint using FWD basin caused by a 9-kip FWD load across the joint for standard mix slab. ....... 134
7-5 Measured and computed strains at selected gauge locations .......................... 135
7-6 Recommended layout of the sensor locations. ................................................. 136
7-7 Relationship between strain profile and tire wandering position. ...................... 137
7-8 Relationship between strain profile and tire width. ............................................ 138

13
LIST OF ABBREVIATIONS
AASHTO American Association of State Highway and Transportation Officials
AC Asphalt Concrete
APT Accelerated Pavement Testing
ASTM American Society for Testing and Materials
CRCP Continuously Reinforced Concrete Pavement
CTE Coefficient of Thermal Expansion
DAQ Data Acquisition System
FBG Fiber Bragg Grating
FDOT Florida Department of Transportation
FEM Finite Element Model
FOS Fiber-Optic Sensor
FWD Falling Weight Deflectometer
HVS Heavy Vehicle Simulator
JPCP Jointed Plain Concrete Pavement
LTE Load Transfer Efficiency
LVDT Linear Variable Differential Transformer
MEPDG Mechanistic-Empirical Pavement Design
PCC Portland Cement Concrete
PPCP Precast Prestressed Concrete Pavement
RAP Reclaimed or Recycled Asphalt Pavement
VWSG Vibrating Wire Strain Gauge

14
Abstract of Dissertation Presented to the Graduate School of the University of Florida in Partial Fulfillment of the Requirements for the Degree of Doctor of Philosophy
ENHANCED FINITE ELEMENT ANALYSIS TOOLS AND INSTRUMENTATION
METHOD TO EVALUATE THE STRUCTURAL BEHAVIOR OF NON-CONVENTIONAL CONCRETE PAVEMENTS
By
Kukjoo Kim
May 2017
Chair: Mang Tia Major: Civil Engineering
This study was conducted to address the need to develop improved finite
element (FE) models of concrete pavements, especially for concrete pavement
containing RAP, Precast Prestressed Concrete Pavement (PPCP), and Continuously
Reinforced Concrete Pavement (CRCP) with capability of analyzing the horizontal
cracking potential under environmental and traffic loading conditions. The developed
models permit the analysis of complicated stress states in concrete pavement using
RAP concrete which has a non-linear stress-strain behavior, prestress forces in PPCP,
and effects of reinforcement on horizontal cracking. Verification of the FE models is
accomplished through comparison with measured FWD deflection basins and strain
data in test slabs. Parametric studies on the effects of various design parameters on the
potential performance were conducted. From the parametric study results, it was found
that the FE model incorporating the actual stress-strain behavior of the RAP concrete,
instead of assumption of the concrete as linear elastic material, tends to give lower
computed stresses in the slab under critical temperature-load condition. It was also
found that the induced maximum stresses in PPCP were significantly affected by the

15
prestress forces while variations in the base and subbase properties were found to have
minimal effect on the maximum stresses in concrete, which indicate that the PPCP
system is appropriate for a wide variety of subbase and subgrade conditions. The use of
varying longitudinal steel spacing (i.e., small steel spacing under wheel path and wide
steel spacing for other region) may be one of the effective ways to reduce the horizontal
cracking potential without changing the steel ratio of the slab.
New instrumentation and strain data analysis methodology were also
investigated for evaluation of the behavior and performance of concrete pavement slab
using embedded strain gauges. The laboratory test results indicate that fiber-optic
sensors selected have similar accuracy, repeatability, and reproducibility in measuring
load-induced strains as compared with measurements of conventional electrical and
vibrating wire strain gauges. Furthermore, for health monitoring system in concrete
pavement, a series of six strain sensors are recommended for use to capture the
complete strain profile in transvers direction caused by a wandering wheel load. This
strain profile can be used to infer about the wandering positon and the width of the
wheel load. It can also be used for back-calculation of pavement parameters in a
similar fashion as FWD deflection basins are used for estimation of pavement
parameters.

16
CHAPTER 1 INTRODUCTION
Background
In recent years, there has been a movement toward mechanistic-empirical
pavement design (MEPDG) procedures for concrete pavements which require accurate
prediction of the structural responses of the pavement system to more accurately
predict pavement performance. In the past, many finite-element-based programs have
been developed specifically for analysis of concrete pavement including FEACONS,
KENSLABS, WESLIQID, J-SLAB, and ISLAB2000. These FE programs typically model
the concrete pavement using two-dimensional (2-D) elements. The concrete slabs are
modeled by plate elements and dowel bars are modeled as either bar elements or
spring elements. Due to the limitations of 2-D analysis (as compared with 3-D analysis)
and the simplified elements used, the behavior of the concrete pavement cannot be
accurately modeled. Difficulties in matching analytical Falling Weight Deflectometer
(FWD) deflection basins with the measured FWD deflection basins were often
encountered especially for composite pavements, and at locations near doweled joints
and edges of slabs. To overcome the aforementioned shortcomings, 3-D finite element
models, such as EverFE, were developed in the past. However, most of FE programs
developed consider concrete as a linear elastic material, and focus on behavior of
conventional Jointed Plain Concrete Pavement (JPCP) under vehicle and environmental
loads. Therefore, there are great need for improved analysis tools in the following areas:
1. Concrete pavement using ductile concrete such as concrete containing Reclaimed Asphalt Pavement (RAP). The actual stress-strain characteristics of the concrete needs to be incorporated in the model instead of assuming a linear elastic behavior. Since RAP in the concrete mix generates greatly improved toughness and energy absorbing capacity (Huang et al. 2005; Tia et al. 2012; Tia et al. 2009), the RAP concrete can take substantially more strain beyond its

17
elastic limit, which may benefit the performance of the concrete pavements. Thereby, it is necessary to develop the FE model to evaluate the behavior of the concrete beyond its elastic limit and how the increased failure strain of these ductile concrete affect the pavement’s potential performance.
2. Precast Prestressed Concrete Pavement (PPCP). There is a lack of analytical model for PPCP due to the complicated stress states caused by the prestressing forces and traffic loads. To estimate the design PPCP panel thickness, the stress equivalency concept (also referred to the thickness equivalency concept) and the strength equivalency concept have been used. Both approaches determine an equivalent thickness of PPCP panel that will provide performance equal to or better than a conventional JPCP under the same condition. However, the structural behaviors between PPCP and JPCP are different under environmental and traffic loading conditions due to induced prestress and tendon restraints. Therefore, there is need to develop the FE model which is properly considering the effects of longitudinal and transverse prestress forces.
3. Continuously Reinforced Concrete Pavement (CRCP). Recently, the new type of distress, called a horizontal cracking, has been reported in CRCP. This type of distress has not been well recognized until recently due to the difficulty of detection before full-depth rehabilitation. When the horizontal cracking occurs at approximately mid-depth of the slab along the plane of the slab, the concrete slab acts like two thin layers. The upper thin slab would easily crack under temperature and load effects. In the previous studies (only three research papers were identified) which have addressed the horizontal cracking in CRCP (Choi et al. 2011; Kim and Won 2004; Won et al. 2002), the concrete slab and longitudinal steel were modeled using 2-D plane strain and frame elements, respectively, in order to identify the horizontal cracking mechanism under environmental conditions. However, the effect of traffic loading could be greater than that of environmental loading on the development of horizontal cracking in CRCP. Therefore, it is necessary to develop an improved CRCP model to analyze the behavior of CRCP under environmental and wheel loading conditions.
Meanwhile, there is a need to develop instrumentation and physical evaluation
methodologies which can be used in conjunction with the analysis tools (a) to verify the
analytical results, (b) to make the needed adjustments to the models, and (c) to monitor
the behavior and performance of these pavements. Many field instrumentation studies
have been conducted to measure the in-situ responses of concrete pavement system
under various environmental and traffic loading conditions. However, interpreting
thousands of strain measurements at certain locations is questionable without

18
knowledge of the corresponding traffic loading information. Since the concrete
pavement responses can vary with the offset distance of wheel load, weight of vehicle
(axle load), and environmental condition (e.g. temperature differential, moisture
condition etc.), the instrumentation plan should consider the possible effects of (a)
temperature variation in the concrete, (b) moisture variation in the concrete, (c) variation
of applied load, and (d) variation of location of applied load. Thereby, effective
instrumentation should be allowed to determine the values of these four factors.
Objectives and Scope
The primary objective of this study is to develop improved finite element analysis
tools and instrumentation and monitoring methods for the three non-conventional types
of pavements. Specific objectives are as follows:
1. To develop a 3-D finite element model for analysis of JPCP which can analyze the effect of temperature differential, joint, edge, and load.
2. To verify the reasonableness of the 3-D model for JPCP through Falling Weight Deflectometer (FWD) test, and dynamic strain measurement from loading of concrete slabs by a heavy vehicle simulator (HVS).
3. To extend the 3-D JPCP model to pavements using ductile concrete by incorporating actual stress-strain behavior of the concrete. This model can analyze the behavior of the concrete slab beyond its elastic limit and can better predict failure for this type of pavement.
4. To develop a 3-D FE model for PPCP, with the consideration of the prestress forces in longitudinal and transverse directions. The developed 3-D model is to be calibrated with measured deflection basins from FWD tests and then used to perform a parametric analysis to determine the effects of critical loading location, concrete material properties, and loss of prestress force on the behavior of PPCP.
5. To develop a 3-D FE model for CRCP, which can accurately calculate the stresses in concrete at the depth of the reinforcing steel due to environmental and load effects. CRCP with transverse cracks of specified spacing will be modeled and analyzed under critical temperature and load conditions to determine the maximum stresses in the concrete at the depth of the steel, which can cause horizontal cracking (predominant distress mode in CRCP).

19
6. To evaluate sensors for strain measurements (both static and dynamic) in concrete, including evaluation of accuracy, repeatability, and reproducibility under actual concrete slab conditions.
7. To develop instrumentation and analysis methodology for evaluation of concrete test slabs.
Research Hypothesis
In view of the inadequacies of the existing analytical models for analysis of
concrete pavements using ductile concrete, PPCP, and CRCP, the incorporation of the
following features in finite element models will improve their prediction of structural
behavior and failure of these pavements.
1. The incorporation of the actual stress-strain characteristics of the ductile concrete instead of the assumption of linear elastic behavior until fracture.
2. The incorporation of the prestressing forces in both the longitudinal and transverse direction in the model for PPCP.
3. The modeling of CRCP as slabs which are formed as a result of transverse shrinkage cracks and which are held together by longitudinal reinforcing steel. The use of this model enables the prediction of tensile stresses which can cause horizontal cracking, which is the predominant mode of failure in CRCP.
Research Approach
This research mainly focuses on the development of improved analysis tools
using finite element models for non-conventional concrete pavements including ductile
concrete slabs made with RAP, PPCP, and CRCP. The developed 3-D FE models are
to be calibrated using FWD deflection data and dynamic strains induced by HVS loads
and measured by embedded gauges. The developed models will also be used to
perform parametric analyses to evaluate the effects of concrete properties, slab
thickness, modulus of subgrade reaction, and other pavement design parameters on
pavement structural behavior.

20
In addition, in order to develop an effective instrumentation plan, various selected
strain sensors are to be evaluated to assess their performance in concrete cylinders
under known static and dynamic strain conditions. Various selected strain sensors are
also to be evaluated in full size concrete test slabs subjected to HVS loading. The
responses of the strain sensors in the concrete test slabs under different loading
configuration will be studied in order to develop an effective instrumentation and
analysis methodology for evaluation of concrete test pavements. The overall research
approach is presented in a flow chart in Figure 1 and details for each phase of this
research are described in the following sections.
The research work includes the following tasks:
Literature Review on the Finite Element Method
- Overview the current state-of-the-art models of concrete pavement systems.
- Identify what specific modeling strategies are needed.
- Identify the factors influencing performance of the specific concrete pavements.
Development of a finite element model for JPCP
- Develop a 3-D FE model for JPCP and evaluate its applicability using full-scale test slabs loaded by HVS and subjected to different temperature conditions.
- Calibrate the FE model by matching the measured FWD deflection basins with analytically computed deflection.
- Verify the FE model by comparing the measured strain from sensors embedded in the test slabs with the computed strains.
Extension of the 3-D model for JPCP to pavement using ductile concrete made with RAP
- Identify the typical stress-strain behavior of RAP concrete from previous study.

21
- Develop a finite element model using stress-strain behavior of ductile concrete.
- Evaluate the performance of a hypothetical concrete pavement using a ductile concrete with the specified stress-strain characteristics.
Development of a finite element model for PPCP
- Incorporate prestressing forces in the longitudinal and transverse direction in the FE model.
- Calibrate the model using FWD data from test road implemented on SR-600, FL.
- Evaluate the effects of loading location on the critical stresses.
- Evaluate the effects of concrete properties on response of PPCP under combined environmental and traffic loading.
- Quantify the effects of transverse prestressing and longitudinal post-tensioning forces on performance in terms of stress-to-strength ratio.
- Evaluate the effect of the stiffness of the base material to the performance of the PPCP.
Development of a finite element model for analysis of CRCP
- Identify the major distress mode and mechanism (horizontal cracking) in CRCP
- Develop the finite element model to evaluate the horizontal cracking mechanism.
- Evaluate the design parameters influencing horizontal cracking potential in CRCP under combined environmental and traffic loads.
Determination of an effective instrumentation plan and analysis methodology for evaluation of concrete test pavements.
- Assess the performance of the embedded strain sensors in concrete cylinder under known strain condition in terms of accuracy, repeatability, and reproducibility.
- Develop an effective instrumentation plan using strain sensors and data analysis methodology for evaluation of concrete test pavements.

22
Figure 1-1. Research approach diagram.

23
CHAPTER 2 LITERATURE REVIEW
A concrete pavement system consists of thin concrete slabs over one or more
base layers. The response of a concrete slab under traffic loads is affected by slab size,
the presence of different types of discontinuities (e.g., joints, cracks), load transfer
mechanisms (e.g., dowel bar, aggregate interlocks), and the possible factors on
environment (e.g., temperature curling, moisture warping). These concrete pavement
behaviors make the analysis more complicated and challenging. Thus, appropriate
levels of simplifications and recognizing the important factors are imperative during
analysis of pavements.
Numerous mechanistic response models have been developed with different
levels of sophistication over the decades, ranging from Westergaard’s analytical
solution, to multi-layer elastic theory, to finite element models. This chapter presents a
literature review of the current concrete pavement response models and related
research regarding concrete pavement performance analysis.
Analytical Response Model
Closed-form analytical solutions for calculating stresses and deflections due to
thermal curling and traffic loading in rigid pavement had been developed by
Westergaard based upon the theory of elasticity (Westergaard 1927). He assumed that
the slab acts as a homogeneous, isotropic, elastic solid in equilibrium, and the reaction
of the subgrade is only vertical and proportional to the deflection of the slab. The
subgrade layer is characterized by the modulus of subgrade reaction or the k value,
which is a measure of the stiffness of the subgrade in units of force per area per unit
deflection or force/length3. One of the important expression in Westergaard closed-form

24
solution is the radius of relative stiffness, which quantifies the stiffness of the slab
relative to that of the subgrade in the following equation:
3
24
12(1 )
h
K
(2-1)
where, E= modulus of elasticity of concrete
h= thickness of slab
ν= Poisson’s ratio of concrete
Westergaard solved the response of the slab by assuming that of a plate on a
bed of springs (Winkler foundation) for the following three cases:
1. Wheel load close to the corner of a semi-infinite slab.
0.6
2
3 21
P
h
(2-2)
2
21.1 0.88
P
k
(2-3)
where, = radius of relative stiffness (m)
α = contact radius (m)
p = concentrated loading (N)
h = thickness of the slab (m)
k = reaction modulus of the foundation (MPa/m)
2. Wheel load at the interior of an infinite slab.
2
3(1 )ln 0.6159
2
P
h b
(2-4)

25
2
2
11 ln 0.673
8 2 2
P a
k
(2-5)
where, b a , when 1.724a h
2 21.6 0.675b a h h , when 1.724a h
3. Wheel load at the edge of a semi-infinite slab.
3
2 4
3(1 ) 4 1 1.18(1 2 )ln 1.84
(3 ) 100 3 2
P Eh a
h ka
(2-6)
3
2 1.2 (0.76 0.4 )1
P a
Eh k
(2-7)
Graphical influence charts that greatly simplified the determination of theoretical
deflections and moments caused by multiple wheel loadings had been developed
(Pickett and Ray 1951), and then extended to sixteen additional influence charts for
deflection, moment, and reactive pressure under interior, edge, and center loadings on
slab over liquid, elastic solid, and elastic layer subgrades. As a result of influence
chart’s simplicity, the FAA, U.S. Army, and U.S. Air Force adopted these charts to
calculate the maximum tensile stress in pavement system. In addition, a few
computerized versions of the influence chart had been also developed, including the
program H-51, H51-ES and PDILB (commonly referred to as the PCA AIRPORT
program). These programs are based upon Westergaard’s theory and subjected to the
limitation of its assumptions as follows:
All pavement layers below the concrete slab must be represented by the modulus of subgrade reaction to give an equivalent response of several layers.

26
However, multi-layer systems cannot be represented by a single parameter due to their complexity, including different quality, stiffness, and bonding or unbonding condition.
The foundation is linear elastic but most are nonlinear, stress dependent, and change with time and environment.
The concrete slabs are always in full contact with the subgrade at all points. This assumption is limited to analysis system when subgrade separation occur due to curling and warping.
The concrete slabs are considered as infinite (for the interior load case) or semi-infinite (for the edge and corner load case). In actual case, rigid pavements tend to be relatively narrow and have joints.
Load transfer cannot be considered. Edge stresses are reduced by load transfer achieved by aggregate interlock, mechanical load transfer device such as dowel bars, or a combination of these.
Two-Dimensional Finite Element Models
Although closed-form analytical solutions are desirable to get some idea in
routine pavement analysis and design, the assumptions of this model have resulted in
many limitations. To overcome the limitations of analytical solutions, the finite element
method has become a powerful numerical analysis technique since the early 1970s. A
number of finite element models have been developed for concrete slab analysis, such
as ILLI-SLAB, JSLAB, KENSLABS, WESLIQID, FEACONS IV, KENLAYER,
WESLAYER, and RIGMUL. All of the 2-D models used a 2-D medium-thick plate
element, and contain features, such as mechanics of joint and interface condition
between slab and base layer. Each node has three degree of freedom with translation in
the z-direction, and rotations of the nodal x- and y- axis with following assumptions:
The plate element is assumed to be elastic, homogeneous, and isotropic material.
Transverse loads are carried by flexural force.

27
Lines normal to middle surface in the undeformed plate remain straight, unstretched, and always normal to the middle surface.
Each lamina parallel to the middle surface is in a state of plane stress, and no axial or in plane shear stress occur during loading.
The subgrade model used by 2-D model was the dense liquid or Winkler
foundation characterized by the modulus of subgrade reaction (k). This model
represents the soil as a series of linear vertical springs with no shear interaction. Since
the deflection in any nodal point depends not only on the force in this node but also on
the deflection of the neighboring nodes, Winkler foundation has limitation due to its
simplicity.
FEACONS (Finite Element Analysis of CONcrete Slab) (Tia et al. 1987) program
was developed by the University of Florida to analyze concrete pavements for Florida
Department of Transportation (FDOT). This program was modified several times to
upgrade its capabilities. The latest version, FEACONS IV program can be used for
analysis of jointed plane concrete pavement with the following capabilities: (1) modeling
of interface condition between the concrete slab and base layer (bonding or un-
bonding), (2) modeling of effects of temperature differential between the top and bottom
of the slab, (3) modeling of load transfer mechanism at joins using torsional and
translational spring elements, (4) modeling of either a single or two layer concrete slab
(slab and base or slab and overlay), and (5) modeling of effects of the weight of the slab
in the analysis.
ILLI-SLAB programs was developed for the structural analysis of jointed concrete
slabs consisting of one or two layers (Tabatabaie and Barenberg 1978). The concrete
slab was modeled using a medium-thick elastic element over a Winkler foundation and
dowel bars at joints were modeled as discrete bar elements. This program was

28
extended to analyze jointed concrete pavements subjected to moving transient loads
which is called DYNA-SLAB (Chatti et al. 1994).
WESLIQID program was developed by the U.S. Army Engineer Waterways
Experimental Station to calculate stresses and deflections in jointed rigid pavements
(Chou 1981). The WESLIQID was later extended to the KENSLABS computer program
with the capability of modeling multiple slabs and various load transfer mechanisms.
The subgrade was idealized as liquid, solid, or layer foundation (Huang 1974; Huang
and Deng 1983).
A 2-D finite element program, called JSLAB, was developed. This program is
essentially the same as ILLI-SLAB (e.g., medium-thick plate element and Winkler
foundation) with a unique capability unlike ILLI-SLAB to consider noncircular load
transfer devices (Tayabji and Colley 1986). To specify the noncircular dowels, the
cross-section area and moment of inertia of the dowel must be considered as an input
parameter.
Three-Dimensional Finite Element Models
There are two types of 3-D finite element programs available: general-purpose
finite element program and finite element codes developed specifically for analysis of
pavement systems. These 3-D finite element models can describe more realistic
pavement behaviors, such as a non-uniform load distribution, multi-wheel loads,
pavement cracks, and nonlinear dynamic analysis etc. These finite element models are
based on displacement formulations to capture the stresses and strains behaviors. In
the displacement based finite elements model, the displacements at the nodes of the
elements are calculated first as the primary variable and then the stresses and strains
are calculated by numerical differential approximate solutions. However, the application

29
of commercial finite element programs requires expertise in engineering mechanics,
and demands a large amount of computation time.
Ioannides and Donnelly (1988) developed a 3-D finite element pavement model
using an existing 3-D finite element program called GEOSYS. This study was
conducted to provide an essential guide of the effective utilization of the 3-D finite
element approach and to eliminate the need for conducting such preliminary and time
consuming studies (Ioannides and Donnelly, 1988). The main findings in this study are
summarized as following:
The subgrade should extend to a depth of about 10 𝑙𝑒 (or about 40 ft) to insure
convergence of subgrade defections and strains. Where, 𝑙𝑒 is radius of relative
stiffness for elastic solid foundation (𝑙𝑒 = √{(1 − 𝜇𝑠)𝐷/𝐺𝑠}3), D is slab flexural
stiffness (𝐷 = 𝐸ℎ3/12(1 − 𝜇2)), and Gs is shear modulus of elastic solid foundation (𝐺𝑠 = 𝐸𝑠/2(1 + 𝜇𝑠)).
The lateral subgrade extension beyond the slab edge should be about 7 𝑙𝑒 to 10 𝑙𝑒 (the range of 25 ~ 35 ft) to insure convergence of subgrade deflection.
Both the horizontal and vertical subgrade boundaries should be on rollers to allow the subgrade elements to distribute loads by deforming.
The slab should be modeled by two layers of 3-D brick elements. Very little increase in accuracy can be gained by increasing the number of layers in the slab, and linear bending stress distribution within its depth may be assumed.
For the purpose of subdividing the subgrade into vertical direction, the subgrade may be divided into three regions: an upper, a middle, and a lower portion. The
upper portion should be extended to about 1.0 𝑙𝑒 (or 4 ft) and should consist of layers no greater than 0.25 𝑙𝑒 to 0.5 𝑙𝑒 (or 1 to 2 ft). The middle portion, which is typically about 1.0 𝑙𝑒 to 4.0 𝑙𝑒 (4 ~ 15 ft), should be divided into at least two layers of elements. Finally, the lower portion may be divided into one or more layers of elements.
The lateral extension of the subgrade beyond the slab edge should be divided into two or more elements.
Zaghloul et al. (1994) conducted a nonlinear and dynamic study of rigid
pavements using ABAQUS, which is a general purpose, nonlinear, and dynamic finite

30
element software. The subgrade and granular subgrade were modeled by 3-D eight-
node brick elements with an elastic-plastic Druker-Prager constitutive model, while the
clay subgrade was modeled with a modified Cam-Clay constitutive model. Mohr-
Coulomb friction was imposed between the slab and the subbase as an interface
condition. Joints were modeled with gap elements which have an initial opening in the
range of 0.9 to 1.9 cm, and dowel bars were modeled by bar elements at the mid-depth
of the slab with zero bond stress on one side to allow horizontal movements. A 80-kN
single axle load was applied with moving speed at 2.8 km/h. From this parametric study,
it was found that the dowel bars increase the joint efficiency and decrease the maximum
vertical deflections. It also found that joint efficiency can be increased with closer dowel
bar spacing.
Uddin et al. (1995) studied the effects of pavement discontinuities on surface
deflections in a jointed plain concrete pavement using the general purpose finite
element program ABAQUS, when subjected to a standard falling weight deflectometer
(FWD) load. The concrete slab, base, and subgrade layer were modeled by 3-D elastic
brick elements. Cracks and transverse joints were modeled by gap elements, and dowel
bars were modeled with beam elements. Back-calculation of the pavement layer moduli
was carried out for an uncracked section, a section with cracked concrete slab, and a
section with cracked concrete and cracked cement-treated base layer.
Kuo et al. (1995) developed a three-dimensional finite element model using
ABAQUS to overcome many of the inherent limitation of two-dimensional finite element
models. They investigated the various factors affecting rigid pavement support including
base thickness and stiffness, interface bonding, slab curling and warping, and load

31
transfer at the joints. The effect of loading conditions was also investigated such as
interior loading and edge loading cases. The subgrade was modeled using ABAQUS
“FOUNDATION” model, equivalent to the dense liquid or Winkler foundation, in which
the user simply applies a spring coefficient to the face of an element. The aggregate
interlocking was simply modeled by translational and rotational spring elements, while
doweled joint was modeled by beam elements. The predicted pavement responses from
the model had shown reasonable agreement with ILLI-SLAB results and full-scale field
test data from the AASHO Road Tests, PCA tests on cement-treated base, and the
Arlington Road Tests.
Masad et al. (1996) also developed a three-dimensional finite element model
using ABAQUS to examine the effects of temperature variation on plain concrete
pavements. The slab and subgrade were modeled using eight-noded brick elements
assumed to be linear elastic materials. The model has the capability to solve the loss of
contact between the slab and foundation due to linear and nonlinear temperature
differentials. The results from the model were compared with those from existing 2-D
finite element models KENSLABS, ILLI-SLAB, and JSLAB. The results of the parametric
studies have shown reasonable agreement with other solutions.
EverFE program was developed by Davids et al. (1998) for simulating the
response of jointed plain concrete pavement systems under axle loads and
environmental effects. The slab and base layer were modeled using 20-noded quadratic
brick elements, and the sub-base layer was modeled with 8-noded planar quadratic
elements incorporated with dense liquid foundation below the bottom-most elastic
layers. Interface condition between the slab and base was treated as either perfect

32
bond or separation under tension. The modeling of temperature gradients through the
depth of slab can be specified as linear, bi-linear, or tri-linear temperature changes with
user specified coefficient of thermal expansion. The results from EverFE were
compared with the measured values from scaled model tests of doweled rigid pavement
in laboratory.
Summary
Several pavement response models have been developed since the early 1920s.
These models can be characterized in two general categories: closed-from analytical
solution and finite element models. The analytical solution based on the work of
Westergaad are still used widely by field engineers to get insight of structural response
under limited loading condition. The finite element models have ability to model more
realistic pavement behaviors. These finite element programs are also classified into two
types of model: (a) finite element code developed specifically for analysis of pavement
systems, and (b) general-purpose finite elements programs.
With the development of the high-speed and large amount of memory computer,
it is no longer a big issue applying a variety of problems in pavement analysis and
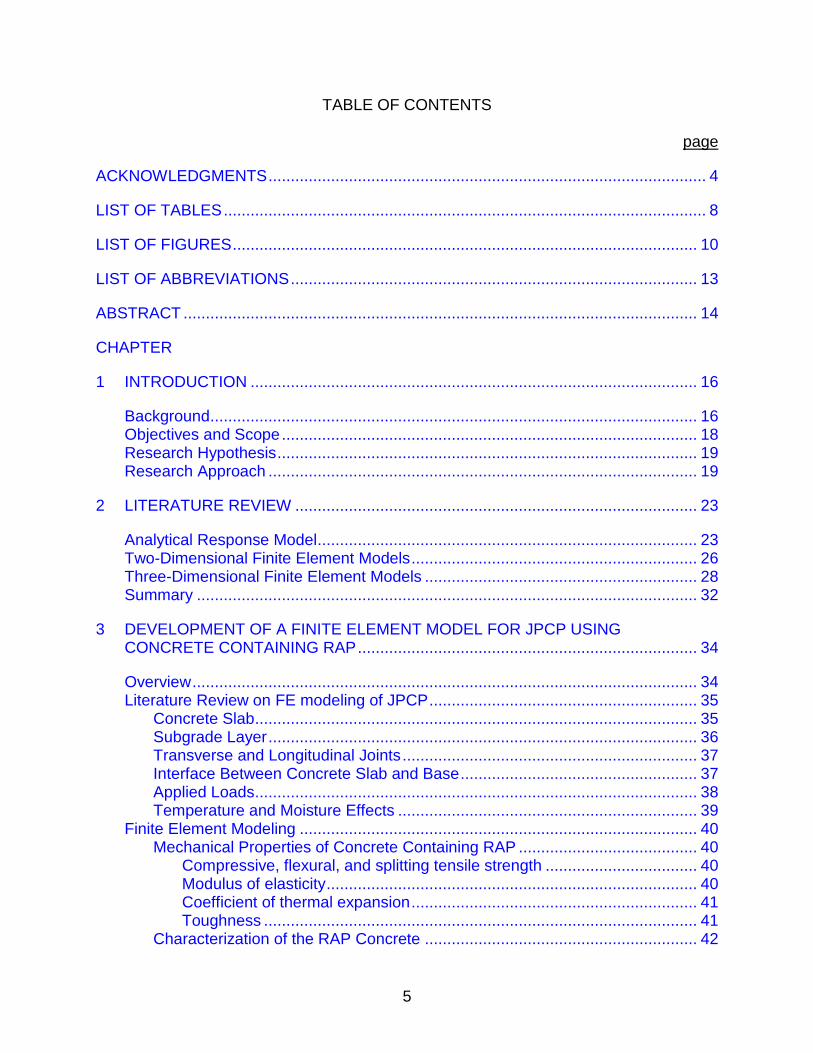
running 3-D finite element programs. Table 2-1 presents an overview of the available
finite element programs for analysis of rigid pavements as selected in the literature.
33
Table 2-1. Summary of finite element models for rigid pavement analysis.
FEM Program Slab Model Subgrade Model Material Model
ILLI-SLAB 2-D medium thick plate
Winkler Boussinesq Nonlinear resilient
Linear elastic
JSLAB 2-D medium thick plate
Winkler Linear elastic
WESLIQID and KENSLAB
2-D medium thick plate
Winkler Linear elastic
FEACONS IV 2-D medium thick plate
Winkler (linear and nonlinear springs)
Linear elastic
GEOSYS 3-D brick element Druker-Prager Linear elastic
ABAQUS 3-D brick element 3-D brick element with linear and nonlinear elastic, plastic, Constitutive model
Linear elastic viscoelastic
EverFE 3-D brick element Winkler Linear elastic

34
CHAPTER 3 DEVELOPMENT OF A FINITE ELEMENT MODEL FOR JPCP USING CONCRETE
CONTAINING RAP
Overview
The use of reclaimed or recycled asphalt pavement (RAP) materials in Portland
cement concrete (PCC) pavement has become more and more popular in recent years.
RAP materials have been used to replace coarse, and fine aggregates in PCC
pavement. Previous studies on concrete containing RAP shows that the compressive
strength, modulus of elasticity, splitting tensile strength and flexural strength decrease
as the percentage of RAP increases in the concrete mix (Berry et al. 2013; Delwar et al.
1997; Hossiney et al. 2010; Hossiney et al. 2008; Huang et al. 2005; Tia et al. 2012; Tia
et al. 2009). Also, RAP in concrete mix gives greatly improved toughness and energy
absorbing capacity of PCC, since the asphalt film in RAP at the interface of cement
mortar and aggregate can dissipate more energy when cracks propagate (Huang et al.
2005).
More recently, concrete pavements containing RAP have been evaluated
through a field demonstration project near Lewistown, Montana. The RAP concretes in
these slabs were batched, placed, and finished using conventional equipment, and
contractors were satisfied with its constructability. The performance of these slabs was
monitored via site visual observation and internal vibrating wire gauges over a two-year
period. The test slabs containing RAP did not experience visual damage (cracking and
spalling) and excessive shrinkage or curling (Berry et al. 2015). In another study, the
structural behavior of RAP concrete was evaluated using a Finite Element (FE) model
(Hossiney et al. 2010). The FE analysis results indicated that the stress-to-strength ratio
under critical temperature-load conditions decreases as the RAP content of the mix

35
increases. For pavement applications, a lower stress-to-strength ratio is desirable, since
a lower stress-to-strength ratio indicates that the material can withstand more stress
cycles before failure and can perform better.
Although the previous research studies show the benefits of RAP in concrete mix
through laboratory study, field demonstration, and FE analysis, it is still needed to study
how the non-linear stress-strain characteristics of these ductile concrete may affect the
structural behavior and performance characteristic of the RAP concrete pavements.
Since, most of the currently used finite element programs, such as WESLIQID,
FEACONS, and EverFE, consider the concrete slabs as a linear elastic material, there
is a need to develop an appropriate FE model by incorporating actual stress-strain
behavior of the RAP concrete to analyze the behavior of the concrete slab to better
predict the behavior and performance of this type of pavement.
This chapter presents the results of an analytical study to evaluate the effects of
the non-linear stress-strain behavior of the RAP concrete on the response of the
concrete pavement under critical temperature-load conditions.
Literature Review on FE modeling of JPCP
Concrete Slab
Most of the existing FE model for analysis of concrete pavement consider the
concrete slab as a linear elastic material. This elastic analysis requires the inputs of
concrete properties including (1) modulus of elasticity, (2) Poisson’s ratio, (3) density,
and (4) coefficient of thermal expansion. However, more recently, the use of Reclaimed
Asphalt Pavement (RAP) materials in Portland cement concrete (PCC) pavement has
been shown to be feasible. This RAP concrete has a more non-linear stress-strain
behavior and fails at a higher strain level (Al-Oraimi et al. 2009; Hassan et al. 2000;

36
Huang et al. 2006; Huang et al. 2005; Tia et al. 2012; Tia et al. 2009). For more realistic
and effective modeling of the RAP concrete behavior, the actual stress-strain
characteristics of the concrete needs to be incorporated in the FE model.
The concrete slab was modeled by an assemblage of hexahedron elements
defined by 8, 20, 21, or 27 nodes to capture the full three-dimensional stress, strain, and
displacement of the concrete under combined load-temperature effects. Figure 3-1
shows the available element types which can be used. These elements have different
integration points and number of nodes. In this study, the eight-node brick element was
used. To choose the adequate mesh size and element types, convergence studies
were done, and it was found that using an element size of less than 3 inches was
needed in order to capture the concrete responses accurately.
Subgrade Layer
Subgrade layer is the foundation which provides the support under the concrete
slab. In FE modeling using ADINA software, various subgrade model including Winkler,
dense liquid, elastic solid, and Drucker-Prager model are available in its material library.
The Winkler and dense liquid foundation is the simplest model for an idealized soil
behavior using a series of independent vertical springs characterized by the modulus of
subgrade reaction (k). This model has no shear interaction as shown in Figure 3-2.
Since the deflection in any nodal point depends not only on the force in this node but
also on the deflection of the neighboring nodes, the Winkler foundation has limitation
due to its simplicity.
The elastic solid foundation (base, subbase and subgrade) can be modeled as
isotropic and linearly elastic, and is characterized by their elastic modulus, and

37
Poisson’s ratio. The elastic solid foundation can capture the more realistic response
under applied loads.
Transverse and Longitudinal Joints
Many studies have been conducted to model the load transfer mechanism of
dowel bars at the joints. In previous models, dowel bars were modeled by linear elastic
spring elements, torsional spring elements, or a combination of these (Huang and Wang
1973; Tia et al. 1987). This is illustrated in Figure 3-3.
In a study conducted by Channakeshava et al. (1993), dowel bars were modeled
as beam elements and connected to the concrete elements with springs to represent
the interaction between the concrete and the dowel bars. In a similar approach (Dere et
al. 2006), the dowel bars were modeled as beam elements and connected to the
concrete elements nodes by two linear spring elements in horizontal and vertical
directions. A new approach was presented by William and Shoukry (2001) by modeling
dowel bars as eight-node solid brick elements with frictional surface between the dowel
bar and the surrounding concrete. However, this model requires very fine mesh for the
dowel bar and the surrounding concrete in order to properly simulate the mechanism of
interaction between the dowel bars and the concrete as shown in Figure 3-4.
Interface Between Concrete Slab and Base
The slab-base layer interface can have three different conditions, namely fully
bonded, partially bonded, and un-bonded. In the case of fully bonded condition, the
concrete slab and base layer are fully bonded and have the same deflection profiles
under temperature-load effects. To model this condition, there is no special treatment
required. The adjacent nodes between the concrete and base layer are rigidly
connected to each other.

38
In the case of un-bonded interface condition, the concrete slab may be separated
from base layer due to curling movement of the concrete slab and acts like a separated
layer under the combined effects of load and temperature. Therefore, there cannot be
any tensile load transfer across the interface, but there can still be transfer of
compressive load across the interface. This un-bonded interface is modeled by a
special spring which has an infinite stiffness value when the spring is in compression;
however, when the spring is in tension, the stiffness value is zero (Tia et al. 1987).
Another method for simulation of un-bond layer is the use of contact and target
elements (William and Shoukry 2001).
For the partially bonded interface condition, translational spring elements are
used to connect the bottom of the concrete layer with the top of the base layer at the
nodes with zero distance between the two layers. Three spring constants which
represent stiffness along the three different directions are used to model the partially
bonded condition. Kx and Ky represent the stiffness in the interface plane (x- and y-
directions), while Kz represents stiffness perpendicular to that plane (z-direction).
In this study, a combined approach using the contact surface element and spring
element method is used and is shown in Figure 3-5. Three different interface conditions
can be simulated by adjusting the magnitude of coefficient of friction and spring stiffness
in the same model. For instance, the un-bond interface condition can be simulated by
using a zero spring stiffness in the z-direction.
Applied Loads
The actual applied traffic loads to pavements are dynamic. Also, the magnitude
of the tire contact pressures and contact area are affected by roughness of the
pavement surface and vehicle suspension system. However, result of dynamic

39
analyses, conducted in the past, indicate that dynamic responses of the concrete
pavements are equal or lower than those of static analysis, and concluded that dynamic
analysis is not necessary for design of rigid pavement(Chatti et al. 1994). In addition,
the effect of vehicle velocity on maximum tensile stress has no significant effects in
JPCP (Kim et al. 2002; Kim et al. 2001). Thus, in this study, applied traffic loads were
modeled as static loads. The required inputs to specify the applied loads include (1) the
magnitude of each load, (2) the contact pressure, and (3) the location of each load.
Temperature and Moisture Effects
Environmental effects considered in concrete pavement analysis are those
caused by changes in temperature and changes in moisture content both of which can
cause expansion or contraction of the concrete. However, the effect of moisture
gradient in concrete slab is similar to that of temperature gradient. A positive moisture
differential has the same effect as that of a positive temperature differential on curling of
a concrete slab. The effect of a moisture differential in a concrete slab can be modeled
as an equivalent temperature differential in the slab. Also, the moisture differential
usually works in the opposite direction to the temperature differential. For instance, in
the daytime, when the temperature differential is usually positive (hotter at the top of the
slab), the moisture differential is usually negative (drier at the top). The effect of
moisture differential usually tends to mitigate the effect of temperature differential.
Therefore, when the effect of moisture differential is not considered and only the effect
of temperature differential is considered, a more conservative (or higher) estimate of the
maximum stresses induced would be obtained.

40
Finite Element Modeling
Mechanical Properties of Concrete Containing RAP
RAP is an asphalt concrete material removed and reprocessed from pavements.
The RAP material is a combination of both aged asphalt and aggregate. The properties
of RAP dominantly depend on the condition of reclaimed pavement, and can have
significant variation due to difference of the type of mix, aggregate quality and size,
asphalt mix consistency, and asphalt content. Typically, the fine RAP is much coarser
than the virgin fine aggregate, and the coarse RAP is much finer than the virgin coarse
aggregate (Huang et al. 2006). Toughness of the concrete could be improved by the
addition of RAP due to the asphalt thin film in RAP.
Compressive, flexural, and splitting tensile strength
In concrete incorporating RAP, the compressive strength, flexural strength, and
splitting tensile strength of concrete decrease as the percent of RAP increases (Hassan
et al. 2000; Hossiney et al. 2010; Huang et al. 2006; Tia et al. 2012; Tia et al. 2009).
Also, it was found that the use of fine RAP and coarse RAP cause more reduction in
strength than the use of coarse RAP and sand (Hassan et al. 2000). According to a
previous study (Al-Oraimi et al. 2009), RAP can be used as aggregate in non-structural
application but the percentage of RAP should be limited to achieve the required
performance for the desired application. Figure 3-6 shows the reduction of strength with
increase in percentage of RAP from a previous study (Hossiney et al. 2010).
Modulus of elasticity
The elastic modulus of concrete containing RAP decreases with increasing
percentage of RAP (Delwar et al. 1997; Hossiney et al. 2010; Tia et al. 2012; Tia et al.
2009). It can be explained by the well-known fact that the elastic modulus of concrete is

41
highly affected by the modulus of elasticity of the aggregate and the content of
aggregate in the mix. RAP is softer than the natural aggregate, and has lower elasticity,
which results in decrease of the elastic modulus of concrete. Thus, an increase in the
percentage of RAP in the mix would further reduce the modulus of elasticity of the
concrete.
Coefficient of thermal expansion
The coefficient of thermal expansion increases slightly with increasing
percentage of RAP in the concrete mixture (Tia et al. 2012). However, there is no clear
trend observed in the difference between the RAP mix and the conventional concrete
mix. This could be due to the variation in the RAP properties, since coefficient of
thermal expansion of a concrete mix depends on the properties of the aggregate. Based
on the fact that RAP contains asphalt, it can be expected that concrete containing RAP
should have a higher coefficient of thermal expansion as compared with the concrete
made with the virgin aggregate.
Toughness
The modulus of toughness generally increases with increasing percentage of
RAP in concrete mixture as shown in Figure 3-7 (Tia et al. 2012). These stress-strain
plots were obtained from beam tests, and the toughness was defined as the area under
the stress-strain curve. From these results, it can be observed that the failure stress
decreases with increasing percentage of RAP, but the strain at failure increases as the
percentage of RAP increases due to increased ductile behavior of the material. In the
case of concrete without RAP, the failure stress is much higher, but the strain at failure
is much lower due to the more brittle behavior of the concrete material.

42
Characterization of the RAP Concrete
The details of the RAP concrete testing results which are presented in this
section were presented in a 2012 report by Tia et al. (Tia et al. 2009). The RAP
concrete mixtures were produced by replacing a part of both coarse and fine aggregate
with a pre-wetted RAP and were mixed in the laboratory using a drum mixer. The mix
designs of the concrete are presented in Table 3-1. For the hardened concrete samples
at 28 days, compressive strength, flexural strength, splitting tensile, Poisson’s ratio, and
coefficient of thermal expansion (ASTM C39, C78, C496, C469 and AASHTO TP60)
data are presented in Table 3-2.
FE Modeling of Concrete Pavement Containing RAP
Most of the existing FE models for analysis of concrete pavements considered
the concrete slab as a linear elastic material. According to the previous studies, the
RAP concrete had a more non-linear stress-strain behavior and failed at a higher strain
level. For more realistic and effective modeling of the RAP concrete behavior, the actual
stress-strain characteristics of the concrete was incorporated in the model. The three
dimensional finite element model using the ADINA software for analysis of concrete
pavement slabs, which was developed in this study, was used to analyze the structural
behavior of these RAP concrete pavements under critical temperature-load conditions in
Florida
Modeling of RAP concrete material
Figure 3-8 shows the difference between an assumed linear elastic behavior and
an actual stress-strain behavior of the concrete. The elastic modulus is obtained by the
standard method (slope of stress versus strain at stress range from 0 to 40% of ultimate
concrete strength). As shown in Figure 3-8, the concrete exhibits almost linear behavior

43
up to the proportional limit at point σy and the actual stress-strain values start to deviate
from the assumed linear elastic behavior. Therefore, it is expected that the actual
behavior of concrete pavement containing RAP will exhibit some difference as
compared with the assumed linear elastic behavior at a higher stress level.
There are several material options to be considered for modeling of the RAP
concrete in ADINA software. These material options for concrete range from simple
elastic material to a nonlinear-plastic material. In this study, the actual stress-strain
characteristics of the RAP concretes, which were determined in a previous research
(Tia et al. 2009), were used to model the behavior of the RAP concrete. These stress-
strain characteristics were determined from the Flexural Strength Test (ASTM C78) on
the RAP concretes. For comparison purpose, a linear elastic model was also used in
the analysis.
Table 3-3 presents the actual stress-stain values obtained from the flexural
strength test on the concrete specimens containing different levels of RAP, and Table 3-
4 shows the elastic material properties obtained by the standard method and used in
the linear elastic FE model.
Modeling of pavement structure
The FE model consisted of two layers; which include (1) 144 in (3.65 m) wide, 9
in. (22.86 cm) thick concrete slab, and (2) 144 in (3.65 m) wide and 100 in. (254 cm)
thick subgrade layer. They were modeled by an assemblage of hexahedrons elements
defined by eight nodes with three degrees of freedom (i.e. translations in the x-, y-, and
z-directions). Mechanical and thermal parameters defined for the concrete slab were (1)
modulus of elasticity (E), (2) Poisson’s ratio, (3) coefficient of thermal expansion (CTE),
and (4) mass density, which were obtained from a previous study (Tia et al. 2009). For

44
the subgrade layer to simulate the real boundary condition with sufficient accuracy but
without excessive processing time, the subgrade was modeled as having a thickness of
100 in. (254 cm) and fixed in the z-direction. To reduce computer processing time, the
double symmetry about x and y axes was used. Figure 3-9 shows the 3-D FE model
developed for the analysis of the RAP concrete pavements.
Loading configuration and temperature effects
Stress analysis was performed to determine the maximum stresses in the
concrete slabs under a critical combined load-temperature conditions. According to a
previous study on concrete pavements in Florida (Wu et al. 1993), the maximum tensile
stresses in the concrete slab were induced if it were loaded by a 22-kip (98 kN) axle
load which is the maximum legal single axle load in Florida at the middle edge with no
load transfer across the joints as shown in Figure 3-10. Various temperature differential
in the concrete slab were also considered. The possible temperature differential in the
concrete slab was varied from 0 °F to 30 °F (0 °C to 16.7 °C).
FE Results Considering Actual Stress-Strain Characteristics
Using the developed 3-D FE models (i.e., linear elastic and stress-strain model),
stress analysis was performed to determine the maximum tensile stresses in the
concrete under the combined effect of a critical 22-kp axial load at mid-edge and
various temperature differentials in the slab. The stress-to-strength ratio for each
condition was calculated using the flexural strength of the concrete determined from
laboratory test.
Figure 3-11 shows the plot of calculated stress-to-strength ratio as a function of
temperature differential in the concrete slab using the two different FE model. From
these analyses results, the difference between the linear elastic and actual stress-strain

45
model increases as the temperature differential increases. It can also be observed that
both models are able to predict similar behavior up to stress-to-strength ratio of
approximately 0.6, and thereafter the actual stress-strain model predicts consistently
lower stresses in the concrete under the same temperature-load conditions. Since the
maximum tensile stresses in the concrete are an important factor influencing the
prediction of potential pavement performance, the effect of non-linear behavior of the
RAP concrete must be considered when calculating the critical stresses in the concrete
pavement. Therefore, it can be concluded that the modeling using actual stress-strain
behavior of the RAP concrete, instead of assumption of linear elastic material, can be
used to analyze the concrete pavement containing the RAP under critical temperature-
load condition. Tables 3-5 through 3-8 present the maximum stresses and stress-to-
strength ratios predicted by the two different FE models.
Summary of Findings
In this chapter, a non-linear FE model by incorporating the actual stress-strain
behavior of the RAP concrete obtained from the flexural strength test was developed to
evaluate the effects of the non-linear stress-strain behavior of the RAP concrete in a
critical stress analysis. The analytical results from the FE model incorporating the actual
stress-strain behavior of the RAP concrete were compared with the corresponding
results from the linear elastic FE model.
From the analysis results, it was observed that the FE model using actual stress-
strain behavior of the RAP concrete tends to give lower predicted stresses at high
stress level. Therefore, it can be concluded that in the analysis of the concrete
pavement containing the RAP, an analytical model using the actual stress-strain

46
characteristics, instead of the assumption of the concrete as linear elastic material,
should be employed to predict the maximum stresses in the concrete.

47
Table 3-1. Mix designs of the RAP concrete in the study by Tia et al. (2009).
Material
Mixture Design
RAP-0% RAP-10% RAP-20% RAP-40%
Cement (lbs/yd3) 508 508 508 508
Water (lbs/yd3) 270 270 270 270
Virgin Coarse Aggregate (lbs/yd3) 1,782 1,604 1,426 1,069
RAP Coarse Aggregate (lbs/yd3) 0 167 335 670
Virgin Fine Aggregate (lbs/yd3) 1,239 1,115 991 743
RAP Fine Aggregate (lbs/yd3) 0 103 205 410
w/c 0.53 0.53 0.53 0.53
Table 3-2. The RAP concrete material properties from the study by Tia et al. (2009).
Property Mixture Type
RAP-0% RAP-10% RAP-20% RAP-40%
Compressive Strength (psi) 5,596 4,936 3,778 2,521
Flexural Strength (psi) 699 566 596 531
Splitting Tensile Strength (psi) 470 488 374 351
Coefficient of Thermal Expansion (×10-6/°F) 6.05 6.07 6.43 6.20
Poisson's ratio 0.24 0.24 0.25 0.25

48
Table 3-3. Stress-strain values used in the non-linear models.
RAP-0% RAP-10% RAP-20% RAP-40%
Strain (ε)
Stress (psi)
Strain (ε)
Stress (psi)
Strain (ε)
Stress (psi)
Strain (ε)
Stress (psi)
0.00E+00 0 0.00E+00 0 0.00E+00 0 0.00E+00 0
3.99E-05 198 4.57E-05 218 3.37E-05 120 4.65E-05 122
6.31E-05 301 6.59E-05 310 8.80E-05 307 7.97E-05 206
8.47E-05 394 7.93E-05 366 1.30E-04 413 1.20E-04 286
1.06E-04 474 1.03E-04 441 1.89E-04 501 1.50E-04 349
1.20E-04 518 1.26E-04 499 2.24E-04 539 1.81E-04 379
1.40E-04 562 1.43E-04 523 2.71E-04 566 2.28E-04 421
1.59E-04 606 1.67E-04 547 3.37E-04 585 2.97E-04 459
1.83E-04 653 1.95E-04 558 4.57E-04 591 4.22E-04 509
1.98E-04 699 2.28E-04 566 4.98E-04 596 7.03E-04 531
Table 3-4. Elastic modulus values used in the linear models.
Layer Modulus (ksi) Poisson’s ratio
RAP-0% 4,964 0.24
RAP-10% 4,778 0.24
RAP-20% 3,560 0.25
RAP-40% 2,625 0.25
Subgrade 115 0.40

49
Table 3-5. Comparison of maximum stresses computed by the linear elastic and actual stress-strain models for the concrete mix with 0% RAP.
Temperature Differential (°F)
Linear Elastic Model Stress-Strain Model Difference (%)
Stress (psi) Stress Ratio Stress (psi) Stress Ratio
0 180.7 0.26 180.7 0.26 0.00
2 224.7 0.32 225.2 0.32 -0.20
4 268.7 0.38 267.5 0.38 0.43
6 312.7 0.45 308.9 0.44 1.19
8 356.6 0.51 350.4 0.50 1.76
10 400.6 0.57 391.2 0.56 2.34
12 444.6 0.64 431.1 0.62 3.03
14 488.6 0.70 471.5 0.67 3.49
16 532.5 0.76 510.2 0.73 4.19
18 576.5 0.82 547.6 0.78 5.02
20 620.5 0.89 585.4 0.84 5.66
22 664.5 0.95 620.8 0.89 6.57
24 708.4 1.01 652.6 0.93 7.89

50
Table 3-6. Comparison of maximum stresses computed by the linear elastic and actual stress-strain models for the concrete mix with 10% RAP.
Temperature Differential (°F)
Linear Elastic Model Stress-Strain Model Difference (%)
Stress (psi) Stress Ratio Stress (psi) Stress Ratio
0 178.2 0.31 178.2 0.31 0.00
2 220.6 0.39 220.6 0.39 0.00
4 262.9 0.46 263.4 0.47 -0.16
6 305.3 0.54 304.4 0.54 0.30
8 347.7 0.61 345.4 0.61 0.66
10 390.0 0.69 386.6 0.68 0.87
12 432.4 0.76 427.7 0.76 1.10
14 474.8 0.84 467.2 0.83 1.59
16 517.1 0.91 499.6 0.88 3.38
18 559.5 0.99 532.9 0.94 4.74
20 601.8 1.06 563.4 1.00 6.38

51
Table 3-7. Comparison of maximum stresses computed by the linear elastic and actual stress-strain models for the concrete mix with 20% RAP.
Temperature Differential (°F)
Linear Elastic Model Stress-Strain Model Difference (%)
Stress (psi) Stress Ratio Stress (psi) Stress Ratio
0 159.9 0.27 159.5 0.27 0.26
2 193.2 0.32 192.2 0.32 0.51
4 226.4 0.38 224.8 0.38 0.71
6 259.7 0.44 257.5 0.43 0.84
8 292.9 0.49 290.2 0.49 0.95
10 326.2 0.55 322.9 0.54 1.00
12 359.4 0.60 356.9 0.60 0.70
14 392.7 0.66 389.0 0.65 0.95
16 426.0 0.71 415.7 0.70 2.42
18 459.2 0.77 442.3 0.74 3.68
20 492.5 0.83 468.9 0.79 4.79
22 525.7 0.88 497.4 0.83 5.40
24 559.0 0.94 520.4 0.87 6.90
26 592.2 0.99 538.0 0.90 9.15
28 625.5 1.05 554.7 0.93 11.32

52
Table 3-8. Comparison of maximum stresses computed by the linear elastic and actual stress-strain models for the concrete mix with 40% RAP.
Temperature Differential (°F)
Linear Elastic Model Stress-Strain Model Difference (%)
Stress (psi) Stress Ratio Stress (psi) Stress Ratio
0 139.9 0.26 139.8 0.26 0.08
2 163.1 0.31 162.5 0.31 0.40
4 186.3 0.35 185.1 0.35 0.65
6 209.5 0.39 207.6 0.39 0.88
8 232.6 0.44 231.0 0.44 0.68
10 255.8 0.48 252.7 0.48 1.21
12 279.0 0.53 272.3 0.51 2.41
14 302.2 0.57 291.9 0.55 3.39
16 325.4 0.61 311.4 0.59 4.30
18 348.5 0.66 330.5 0.62 5.17
20 371.7 0.70 349.7 0.66 5.92
22 394.9 0.74 369.6 0.70 6.40
24 418.1 0.79 390.7 0.74 6.54
26 441.2 0.83 412.6 0.78 6.49
28 464.4 0.87 429.8 0.81 7.45
30 487.6 0.92 440.8 0.83 9.60

53
Figure 3-1. 8-, 20-, 21- & 27-nodes elements.
Figure 3-2. Foundation displacement under an applied load.
Figure 3-3. Modeling of joint by linear springs.

54
Figure 3-4. Modeling of dowel bar with actual dimension and steel properties.
Figure 3-5. Interface model used in this study.
Figure 3-6. Reduction in compressive, flexural and splitting tensile strength (Hossiney et al. 2010).

55
Figure 3-7. Example of stress-strain behavior of RAP concrete.

56
A B
C D
Figure 3-8. Stress-Strain Curve for Concrete Containing RAP. A) Concrete containing RAP-0%, B) Concrete containing RAP-10%, C) Concrete containing RAP-20%, D) Concrete containing RAP-40.

57
Figure 3-9. 3-D finite element model developed for analysis of a RAP concrete slab.
Figure 3-10. Critical loading conditions.
58
A B
C D
Figure 3-11. Computed stress-strength ratios for concrete slabs containing RAP. A) Concrete containing RAP-0%, B) Concrete containing RAP-10%, C) Concrete containing RAP-20%, D) Concrete containing RAP-40%.

59
CHAPTER 4 DEVELOPMENT OF A FINITE ELEMENT MODEL FOR PPCP
Overview
Background
The Florida Department of Transportation has implemented an initiative to
evaluate Precast Prestressed Concrete Pavement (PPCP) as an effort toward
minimizing disruption to the traveling public during pavement construction and
rehabilitation. The use of PPCP for the replacement of deteriorated highways can give
transportation agencies significant advantages in improving pavement performance,
decreasing the time before opening to traffic, and minimizing user costs (Merritt et al.
2008; Merritt et al. 2002; Merritt and Tayabji 2009; Ye and Tayabji 2012). The unique
feature of the PPCP is in the use of posttensioned precast concrete slabs, which are
compressed together with longitudinal and transverse posttensioning of steel strands.
Increasing the prestressing force helps the concrete panel to have an increased load
carrying capacity like a thicker pavement due to induced compressive stresses in the
slab. In addition, there will be voids under precast pavement, and the prestressing
forces will provide extra capacity to the panel to withstand these inconsistencies in the
subgrade and to control crack width by providing confinement. Panels can be cast and
cured under more ideal condition in which high quality concrete slabs can be
manufactured.
Previous research has indicated that the PPCP system provides both improved
durability and minimal traffic disruption, and the contractor was satisfied with its
constructability (Merritt et al. 2001). Also, well-documented design and construction
guidelines have been developed (Tayabji et al. 2013). However, the current lack of

60
understanding of the response of the PPCP under environmental and critical loading
conditions is probably the great deficiency in the evaluation of the PPCP system. The
response of PPCP under critical loading conditions has not been well studied due to the
complicated stress states caused by prestressing forces and loads. In addition, the main
issues associated with the design and construction of this type of pavement system
include (1) the effects of concrete properties including elastic modulus and coefficient of
thermal expansion which are the most significant factors affecting the maximum
stresses (Mallela et al. 2005; Tia et al. 1991), (2) the loss of prestressing due to
concrete creep, strand relaxation, and/or strand cutting, and (3) the effect of pre-existing
pavement as a base layer for the new PPCP pavement system. A better understanding
about how the PPCP system behaves under combined action of loads and prestress
forces may help in the understanding of some of the existing problems and provide
better guidelines for the design and construction of the PPCP system. Therefore, there
is a need to develop improved PPCP model to accurately predict the behavior and
performance of the PPCP system.
In this study, a three-dimensional (3-D) finite-element (FE) model was developed
for analyzing a PPCP system. The 3-D model was used to calculate the response of
PPCP under FWD loads and the analytical FWD deflections were compared with the
actual measured FWD data. The validated 3-D model was then used to evaluate the
effects of various design parameters on the performance of the PPCP.
Objectives
The analysis conducted herein was focused on the structural response of PPCP
system under critical loading condition associated with FDOT’s PPCP demonstration
project. The primary objectives of this task are as follows:

61
Evaluate the effects of loading location on the critical stresses in PPCP.
Evaluate the effects of concrete properties on response of PPCP under combined environmental and traffic loading.
Quantify the effects of transverse prestressing and longitudinal post-tensioning forces on performance in terms of stress-to-strength ratio.
Evaluate the effect of the stiffness of the base material to the performance of the PPCP.
Scope
In this task, a 3-D finite element model was developed for stress analysis of
PPCP under critical temperature-load conditions. The developed 3-D model was
calibrated with measured deflection basins from FWD tests and then used to perform a
parametric analysis to determine the effects of loading location, concrete material
properties, loss of prestress force, and subgrade stiffness on the response of PPCP
under critical temperature-load conditions.
Experience of the PPCP in Florida
The Florida PPCP pilot project was implemented on SR-600 in Volusia County.
The project consisted of 792 ft (241 m) of PPCP designed for 30 years life. The test
sections were part of a 6.5 mile (10 km) rehabilitation project completed in June of
2012. Each of the precast units was 24 ft × 12 ft and 9 in. thick (7.3 m × 3.7 m × 23 cm)
and a total of 66 (60 interior and 6 end panels) panels were used. The panels were
placed atop a 2 to 12 in. (5 to 30 cm) asphalt leveling course and a single layer
polyethylene sheet to reduce friction. Each panel was pre-tensioned in the transverse
direction and post-tensioned in the longitudinal direction.
The Volusia PPCP test section was constructed over an existing concrete
pavement (20-ft (6 m) slabs and untied) originally constructed in the 1940’s. The

62
westbound lanes were constructed in the 1940’s and the eastbound lanes were added
in the 1970’s. The paved travel shoulders were constructed in 1997. The existing
pavement showed significant distress and received no major rehabilitation except for
localized slab replacement. The westbound lanes (MP 9.0 to MP 10.5) were flooded
during a significant storm event in 2004 ~ 2005. The test section was located at MP
9.24.
The concrete mix for the slab was designed for a minimum 28-day compressive
strength of 5,500 psi (38 MPa) and achieved an average 28-day strength of 10,602 psi
(73 MPa). The pretensioning tendons (in the transverse direction) were designed to be
0.5 in. (1.3 cm) diameter, grade 270 low-relaxation strands conforming to AASHTO 203.
Theoretical values for area and modulus of elasticity are 0.153 in2 (1 cm2) and 28,500
ksi (197 GPa), respectively. The prestressing strands were assumed to be tensioned to
75% of the ultimate strength of the strand (270 ksi (1.9 GPa)) and a maximum jacking
force of 31.0 kips (138 kN) per strand. The posttensioning tendons are only different in
that the diameter is 0.6 in. (1.5 cm) and the area is 0.217 in2 (1.4 cm2).
The posttensioning strands (in the longitudinal direction) were designed to be
tensioned to 74% of the ultimate strength and a maximum jacking force of 43.4 kips
(193 kN) per strand. In this project, the precast panels were pretensioned during
fabrication using eight pretension strands which were spaced evenly above and below
the post-tensioning ducts to minimize any prestress eccentricity, and twelve posttension
strands were used to provide permanent prestress and load transfer between the
panels. It must be noted that two tendons were installed in one sheath tube, and so in

63
order to simplify the analysis, the two tendons were treated as one equivalent tendon
which were modeled by an assemblage of 3-in. beam elements.
As part of an evaluation of the FDOT PPCP demonstration project, performance
monitoring was conducted after it was open to traffic. For this condition survey, a
distress map was developed and approximately 3% of panels (2 panels over total 66
panels) had transverse cracks at 3 years after construction. One panel had a 1 in. (2.54
cm) transverse crack and another had a 9 in. (22.86 cm) transverse crack. FDOT also
conducted FWD deflection tests every year. Deflections were measured on both the
“approach” and “leave” sides of each transverse joint. All of the Load Transfer
Efficiency (LTE) testing, as analyzed and provided by FDOT, show very good load
transfer with most measuring greater than 90 percent (Long-Term Pavement
Performance Program recommends 60 % as the threshold for load transfer restoration).
From the FDOT initial survey, it can be concluded that PPCP system shows good initial
performance and anticipates better long-term performance.
Finite Element Modeling
FE Modeling of PPCP
The ADINA (version 9.0) finite element program was used to model the PPCP
system. The eight-node isoparametric solid brick element was chosen for modeling the
concrete slabs. The prestressing tendons were modeled as embedded beam elements
specialized by ADINA. Perfect bond between concrete and tendons was assumed. The
PPCP implemented on the test section consisted of sixty-six individual panels.
However, only twenty-two panels were modeled in this task. Each panel had a
dimension of 12 ft (3.7 m) in the longitudinal direction and 24 ft (7.3 m) in the transverse

64
direction with 9 in. (23 cm) thickness. The thickness of the leveling asphalt layer was 2
in. (5 cm). The leveling course was placed over a 9-in (23 cm) existing concrete
pavement. The subgrade was modeled as a layer with a thickness of 100 in. (254 cm). It
was found that increasing the thickness of the subgrade layer to more than 100 in. (254
cm) had no significant effects on the computed stresses in the concrete slabs. The
existing concrete, AC, and subgrade materials were modeled as isotropic and linearly
elastic and characterized by their modulus of elasticity and Poisson’s ratio. The
contraction and expansion of the concrete panel due to temperature effects is also
considered, and characterized by its coefficient of thermal expansion.
Modeling of Prestress
The prestress tendons were modeled as beam elements which were 3-in. (7.6
cm) long elements so the length of the elements in the tendon would be consistent with
the position of the nodes in the concrete slabs elements. The posttension and
pretension forces in the concrete in the longitudinal and transverse directions were
modeled by the initial strains in the tendons which were induced by these forces. The
contact interface between the tendons and the concrete is assumed to be full bonding
and there is no relative bond-slip. When the initial strain is applied to the tendon
elements, the tension stresses in the tendons were transferred as compression stresses
in the concrete elements. The initial strain (ε) in the tendon was calculated by using the
following equation.
E
(4-1)
Where, σ = prestress in the tendon
E = elastic modulus of the tendon

65
The modulus of elasticity of the tendons is 28,500 ksi (197 GPa). Therefore, the
theoretical strain can be obtained if the applied stress is known. The applied stress in
the tendon decided by the designer was 70% to 80% of the ultimate strength, fpu of the
steel. Table 4-1 presents the prestress force in each tendon and the applied initial strain
used in the FE model.
Modeling of Concrete-AC Interface
The PPCP slab contact with the AC leveling layer was maintained by applying
the concrete self-weight and there was no external constraints. In addition, a
polyethylene membrane was used to minimize prestress loss at the concrete panel-AC
layer interface, which results in less interface friction. The PPCP panel-AC layer
interface friction factor may range from 0.5 to 1.5 (Tayabji et al. 2013), while the
AASHTO 93 Guide recommends a range of concrete-base friction of 0.9 to 2.2. In this
modeling work, the sliding interface with frictional contact between the concrete panel
and the AC layer was assumed (μ = 0.68).
The double symmetry of the geometry about x- and y- axes was selected in order
to reduce computation time. The subgrade layer was fixed in the z-direction. Figure 4-1
shows the pavement structure modeled. Figure 4-2 shows the 3-D finite element model
developed for the analysis of the PPCP system.
Calibration of FE Model and Determination of Model Parameters
In order for the 3-D finite element model to accurately analyze the behavior of
PPCP system, it is necessary to have the correct properties of the pavement materials.
The elastic moduli of the concrete were initially estimated from the results of laboratory
tests in the design phase. The other material properties were adjusted by back-

66
calculation method where analytical deflections were matched to the measured FWD
deflections.
FWD tests were performed on the PPCP test section to estimate the elastic
moduli of the other pavement materials. Pavement surface deflection basins caused by
a 11-kip (49 kN) and 19-kip (85 kN) FWD load were used to estimate the elastic moduli
of the pavement layers. FEM predicted deflection basin on the surface of the PPCP slab
was compared with the FWD test results. A twelve inch by twelve inch square loading
area was used to model the loading area of the FWD which is a 12-inch (30.5 cm)
diameter circular plate.
Figure 4-3 shows an example of matched deflection basin from the back-
calculation process for estimating elastic moduli of the asphalt, existing pavement, and
subgrade materials. Using the estimated parameters, an appropriate match between the
measured and the calculated deflection basin was achieved with the right properties of
pavement system. Table 4-2 presents material properties used in the FE model.
In order to evaluate the possibility for the concrete to crack at the various
conditions, the maximum computed tensile stresses were divided by the flexural
strength of concrete to obtain the stress-to-strength ratio. In this study, the flexural
strength of concrete was not available, and it was first estimated from the compressive
strength of the concrete by following equation (ACI 2002):
0.57.5 cMR f (4-2)
Where, MR = flexural strength, in psi
fc = compressive strength, in psi

67
Results of Parametric Analysis
Effects of Loading Location on Critical Stresses
The critical loading condition had not been studied for PPCP system previously.
Critical stress analysis was performed to determine the maximum tensile stresses in the
slabs if they were subject to some critical load and temperature conditions. A 22-kip (98
kN) axle load, which represents the maximum legal load limit for single axle loads in
Florida, was used as the applied load in the analysis. Analysis for the following two
critical load-temperature conditions was performed: (1) A 22-kip (98 kN) axle load was
applied to the mid-edge of the pavement slab with a temperature differential of ±20 °F
(±11.1 °C), (2) A 22-kip (98 kN) axle load was applied to the corner of the pavement
slab with a temperature differential of ±20 °F (±11.1 °C).
To find other possible critical loading conditions, analysis was also performed for
the following load-temperature conditions: (1) A 22-kip (98 kN) axle load was applied to
the inner middle of the slab with a temperature differential of ±20 °F (±11.1 °C), (2) A
22-kip (98 kN) axle load was applied to the inner corner of the lane with a temperature
differential of ±20 °F (±11.1 °C), (3) Two 22-kip (98 kN) axle loads were applied to the
center of the slab with a temperature differential of ±20 °F (±11.1 °C), and (4) Two 22-
kip (98 kN) axle loads were applied to the joint of center slab with a temperature
differential of ±20 °F (±11.1 °C), as shown in Figure 4-4.
Table 4-3 shows the maximum computed tensile stresses in the longitudinal and
transverse directions. It can be seen that the most critical loading condition was at mid-
edge of the slab with +20 °F (+11.1 °C) temperature differential, which is the same as
the critical loading condition for conventional concrete pavements. However, the
transverse tensile stress was highest when the axial load was applied at the inner

68
corner of the lane with a temperature differential of +20 °F (+11.1 °C). It also can be
noted that the maximum tensile stresses when two single axles were placed
simultaneously at the center of slab or at the joint of center slab were lower than the
maximum stresses when one single axle load was placed at mid-edge.
Effects of Concrete Modulus
The effects of elastic modulus of concrete on the maximum induced stresses
were analyzed. The maximum longitudinal stresses in the slab caused by a 22-kip (98
kN) single axle load at the mid-edge with temperature differential of +20 °F (+11.1 °C)
were computed. Figure 4-5 shows the maximum tensile stresses as a function of elastic
modulus of concrete. It can be seen that the calculated maximum stress increases by
around 40% when the elastic modulus increased from 3,800 to 6,000 ksi (26 to 41
GPa). However, an increase in elastic modulus of the concrete is usually related to an
increase in its flexural strength when the same aggregate is used. The flexural strength
of the concrete can be related to its elastic modulus and unit weight by the following
equation (ACI 2002):
1.5
0.227EMR
w (4-3)
Where, E = elastic modulus, in psi
MR = flexural strength, in psi
w = unit weight, in pcf
Using this equation and a unit weight of 140 pcf (2,243 kg/m3), the concrete
flexural strengths at various values of elastic modulus were calculated, and the stress-
to-strength ratios were also plotted against the concrete elastic modulus in Figure 4-5. It

69
can be noted that the maximum stress-to-strength ratio decreases as the concrete
modulus increases.
Effects of Coefficient of Thermal Expansion
The effect of the coefficient of thermal expansion of the pavement concrete
ranging from 4.0×10⁻⁶ to 6.5×10⁻⁶ /°F (7.2×10⁻⁶ to 11.7×10⁻⁶ /°C) on the maximum
induced stresses were analyzed. Using the different values of the coefficient of thermal
expansion, the maximum stresses in PPCP under the critical loading conditions were
calculated and presented in Figure 4-6. The calculated maximum tensile stresses
increase by approximately 40% when the coefficient of thermal expansion increased
from 4.0×10⁻⁶ to 6.5×10⁻⁶ /°F (7.2×10⁻⁶ to 11.7×10⁻⁶ /°C).
Effects of Prestress Force on Critical Stresses
The 3-D finite element model was also used to evaluate the effects of loss of
transverse and longitudinal prestress force in terms of stress-to-strength ratio under
critical loading conditions. In doing these computations, the flexural strength was
calculated by equation (2), as presented earlier and was equal to 772 psi (5.3 MPa) for
this analysis. For long-term service life, approximately 40 % to 50 % losses of the
applied prestress force were expected for a well-constructed PPCP (Tayabji et al.
2013). The maximum computed stresses in the concrete slabs were computed using
the following two critical loading conditions, namely (1) a 22-kip (98 kN) axle load
applied to the mid-edge of the slab with a temperature differential of +20 °F (+11.1 °C),
which represents a typical severe condition in the daytime, and (2) a 22-kip (98 kN) axle
load applied to the corner of the slab with a temperature differential of -20 °F (-11.1 °C),
which represents a typical severe condition at night. Tables 4-4 and 5 present the
maximum stresses and stress-strength ratio as a function of prestress force level. The

70
maximum computed stresses were divided by the flexural strength of the concrete panel
to obtain the stress-to-strength ratios. According to fatigue theory (PCA 1984), the
number of load repetitions to failure of concrete increases as the stress-to-strength ratio
decreases. Thus, a lower computed stress-to-strength ratio would indicate a higher
allowable number of load repetitions to failure and a better expected performance in
service. When the stress-to-strength ratio is less than 0.5, the concrete is expected to
be able to withstand an infinite number of stress cycles without fatigue failure. The
analysis results indicate that the maximum stresses increase as prestress force
decrease. It shows the benefits of prestress force in PPCP. It can also be seen that the
PPCP system evaluated appeared to have a good predicted pavement performance up
to a loss of 20 % of prestress force in the longitudinal and transverse directions with
stress-strength ratio of less than 0.5.
Effects of Subgrade Stiffness
The effects of subgrade stiffness on maximum tensile stresses in PPCP were
analyzed. The maximum computed stresses in the PPCP slabs were computed using
the following two critical loading conditions, namely (1) a 22-kip (98 kN) axle load
applied to the mid-edge of the slab with a temperature differential of +20 °F (+11.1 °C),
and (2) a 22-kip (98 kN) axle load applied to the corner of the slab with a temperature
differential of -20 °F (-11.1 °C). Also, the Winkler foundation was used in the FE model
to study the effects of subgrade stiffness on maximum induced stresses. The subgrade
stiffness was varied from 0.3 kci to 1.1 kci (81 MPa/m to 299 MPa/m).
Figures 4-7 and 4-8 show the plots of maximum tensile stresses in concrete as a
function of subgrade stiffness. It is to be pointed out that the maximum stress decreases
as the subgrade stiffness increases. It can be explained by the fact that the PPCP

71
system used in FE analysis has longer transverse dimension which may cause the
settlement of mid-portion of slab and provide more uniform support. This agrees with
previous findings that maximum stress decreases as subgrade modulus increases for a
larger-dimension slab (Wu et al. 1993). Conversely, for concrete pavements of
conventional size (12 ft × 15 ft (3.7 m × 4.6 m)) in Florida, the maximum tensile stress
increases as the subgrade stiffness increases because the supporting area of the slab
with the temperature differential varies depending on the stiffness of base layer. A
higher subgrade stiffness may result in smaller supporting area and higher tensile
stress, while a softer base may offer more uniform slab support than a rigid base
resulting in lower tensile stress in the concrete slab.
Summary of Findings
A 3-D finite elements model was developed to study the structural response of
PPCP under typical Florida conditions. The model was calibrated using the measured
FWD deflection data from a PPCP test section in Florida. The model was then used to
perform a parametric analysis to determine the effects of a few important pavement
parameters on the maximum induced stresses in PPCP. The main findings are
summarized as follows:
The critical loading condition was at the mid-edge of the slab with +20 °F (+11.1 °C) temperature differential for the longitudinal tensile stress. However, for the transverse tensile stress, the maximum tensile stress was highest when the load was applied at the inner corner of the lane with a temperature differential of +20 °F (+11.1 °C).
Results from the parametric analysis indicated that the maximum stress in the concrete slab increases significantly as the concrete modulus increases. However, the stress-to-strength ratio decreases due to increase of flexural strength as the concrete modulus increases.
The maximum stress in the concrete slab increases as the coefficient thermal expansion increases.
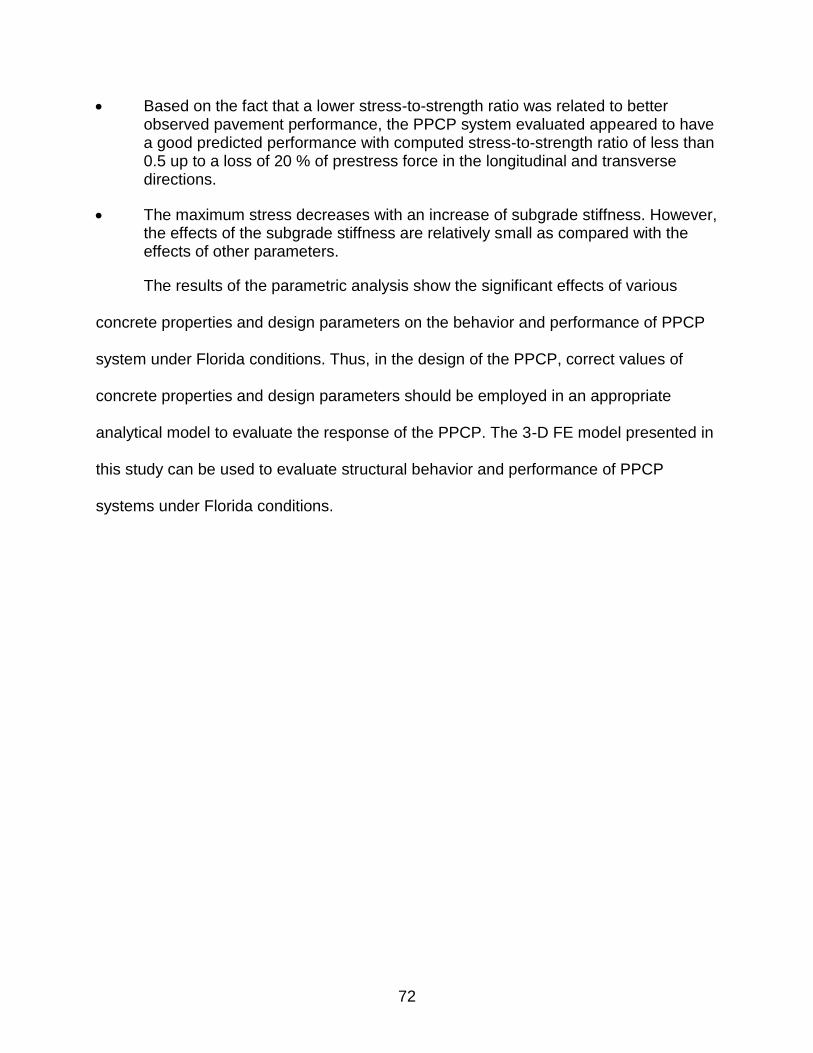
72
Based on the fact that a lower stress-to-strength ratio was related to better observed pavement performance, the PPCP system evaluated appeared to have a good predicted performance with computed stress-to-strength ratio of less than 0.5 up to a loss of 20 % of prestress force in the longitudinal and transverse directions.
The maximum stress decreases with an increase of subgrade stiffness. However, the effects of the subgrade stiffness are relatively small as compared with the effects of other parameters.
The results of the parametric analysis show the significant effects of various
concrete properties and design parameters on the behavior and performance of PPCP
system under Florida conditions. Thus, in the design of the PPCP, correct values of
concrete properties and design parameters should be employed in an appropriate
analytical model to evaluate the response of the PPCP. The 3-D FE model presented in
this study can be used to evaluate structural behavior and performance of PPCP
systems under Florida conditions.

73
Table 4-1. Prestress force and applied initial strain in each tendon.
Strand Pretension Posttension
Diameter (in) 0.5 0.6
Nominal Area (in2) 0.153 0.217
Ultimate load (lbf) 41,300 58,600
75% of ultimate load (lbf) 30,950 43,950
Fjacking (kip) 31.0 43.4
σ jacking (ksi) 202.5 200.0
εcalculated 0.00710 0.00702
Table 4-2. Material properties used in the FE model.
Material Modulus of Elasticity (psi) Poisson’s Ratio CTE
PPCP 4,300,000 0.20 5.5 × 10⁻⁶ /°F
AC layer 630,000 0.35
Existing concrete 4,800,000 0.20 6.0 × 10⁻⁶ /°F
Subgrade 30,000 0.40
Table 4-3. Computed maximum stresses in the PPCP system caused by a 22-kip axle load.
Possible Critical Loading Conditions
Computed Maximum Tensile Stress (psi)
Corner Middle Edge
Inner Corner
Inner Middle Edge
Inner Corner (2-axle)
Inner M-E (2-axle)
Temperature Differential of +20 °F (+11.1 °C) Between Top and Bottom
Max. longitudinal Stress (σxx) 94.42 340.44 86.30 275.03 47.88 290.26
Max. transverse Stress (σyy) 132.34 130.76 314.79 154.44 274.40 134.67
Temperature Differential of -20 °F (-11.1 °C) Between Top and Bottom
Max. longitudinal Stress (σxx) 264.95 90.13 168.21 80.45 203.32 49.34
Max. transverse Stress (σyy) 187.61 34.41 146.41 29.97 149.21 32.90

74
Table 4-4. Effects of prestress on maximum stresses at +20 °F temperature gradient.
Parameters
Prestress Force (kip) Computed Stress (psi) Stress Ratio
Flongitudinal Ftransverse σxx σyy σxx/MR σyy/MR
Transverse Pretension + Longitudinal Posttension
43.4 31.0 340.44 314.79 0.44 0.41
34.7 24.8 372.29 349.97 0.48 0.45
26.0 18.6 404.15 385.16 0.52 0.50
17.4 12.4 436.01 420.35 0.56 0.54
8.7 6.2 467.86 455.54 0.61 0.59
0 0 499.72 490.73 0.65 0.64
Transverse Pretension
43.4 24.8 347.67 363.40 0.45 0.47
43.4 18.6 354.91 412.01 0.46 0.53
43.4 12.4 362.14 460.62 0.47 0.60
43.4 6.2 368.05 509.23 0.48 0.66
43.4 0 376.61 557.83 0.49 0.72
Longitudinal Posttension
34.7 31.0 365.06 301.36 0.47 0.39
26.0 31.0 389.68 287.94 0.50 0.37
17.4 31.0 414.30 274.52 0.54 0.36
8.7 31.0 438.92 261.10 0.57 0.34
0 31.0 463.54 247.68 0.60 0.32

75
Table 4-5. Effects of prestress on maximum stresses at -20 °F temperature gradient.
Parameters Prestress Force (kip)
Computed Stress (psi)
Stress Ratio
Flongitudinal Ftransverse σxx σyy σxx/MR σyy/MR
Transverse Pretension + Longitudinal Posttension
43.4 31.0 264.95 187.61 0.34 0.24
34.7 24.8 280.69 221.42 0.36 0.29
26.0 18.6 301.04 256.01 0.39 0.33
17.4 12.4 321.36 290.60 0.42 0.38
8.7 6.2 341.71 325.19 0.44 0.42
0 0 362.06 359.78 0.47 0.47
Transverse Pretension
43.4 24.8 260.14 231.78 0.34 0.30
43.4 18.6 259.93 276.73 0.34 0.36
43.4 12.4 259.72 321.68 0.34 0.42
43.4 6.2 259.51 366.63 0.34 0.47
43.4 0 259.30 411.59 0.34 0.53
Longitudinal Posttension
34.7 31.0 280.90 176.47 0.36 0.23
26.0 31.0 301.46 166.11 0.39 0.22
17.4 31.0 322.00 155.75 0.42 0.20
8.7 31.0 342.56 145.39 0.44 0.19
0 31.0 363.12 135.03 0.47 0.17

76
Figure 4-1. Pavement structure modeled.
Figure 4-2. Finite element model developed.

77
Figure 4-3. Matching of deflection basins in the longitudinal direction caused by a 19-kip (85 kN) FWD load applied to the center of a PPCP lane.
Figure 4-4. Illustration of critical loading conditions at slab corner and middle edge.
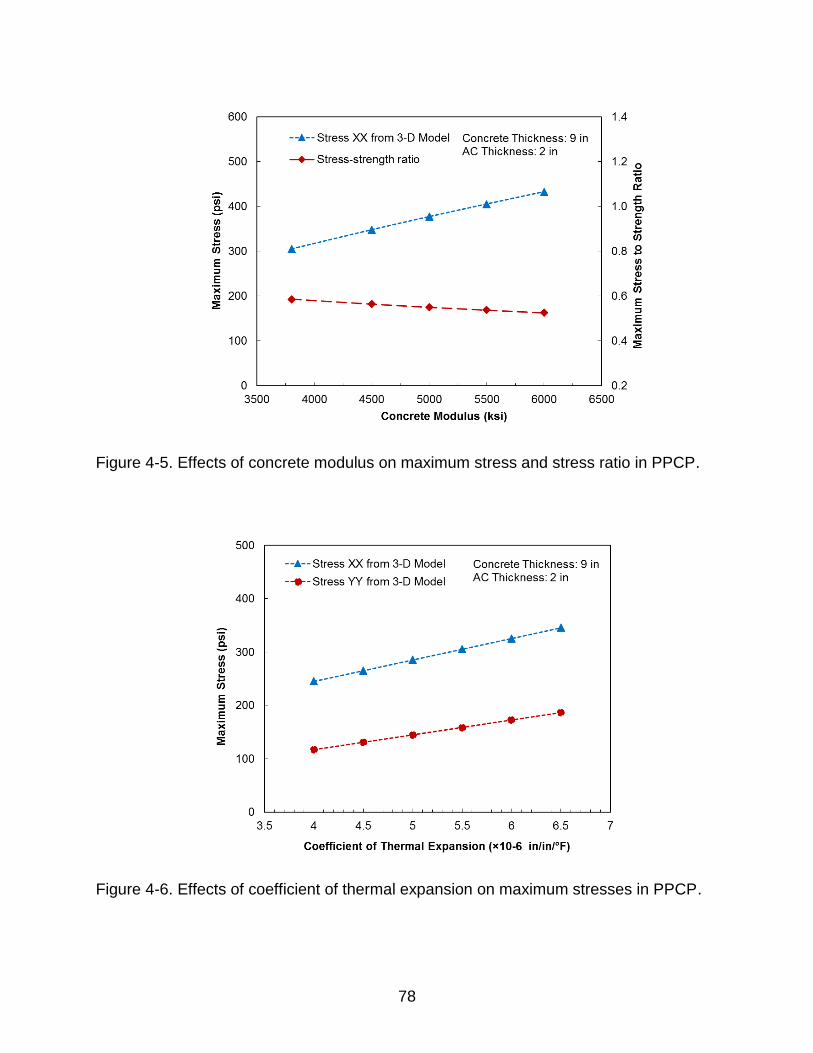
78
Figure 4-5. Effects of concrete modulus on maximum stress and stress ratio in PPCP.
Figure 4-6. Effects of coefficient of thermal expansion on maximum stresses in PPCP.

79
Figure 4-7. Effect of subgrade stiffness on critical stresses at +20 °F temperature gradient.
Figure 4-8. Effect of subgrade stiffness on critical stresses at -20 °F temperature gradient .

80
CHAPTER 5 DEVELOPMENT OF A FINITE ELEMENT MODEL FOR ANALYSIS OF CRCP
Overview
Background
A continuously reinforced concrete pavement (CRCP) is constructed without
transverse joints except for construction joints. CRCP has embedded steel
reinforcement in the transverse and longitudinal direction. CRCP allows the concrete to
crack as a result of drying shrinkage. The subsequent transverse cracks are held tightly
together by the longitudinal steel and thus provides good serviceability or ride quality.
Previous research has indicated that CRCP outperforms other types of concrete
pavement due to its durable nature (Smith et al. 1998). CRCP has been used primarily
in urban areas where delay associated with repairs and rehabilitation can cause higher
user cost. Because of its durable character, the Florida Department of Transportation
has movement to consider CRCP for heavy-load and heavy-traffic facilities (FDOT
2011).
Field evaluation of distresses indicated that punch-out distress is the most severe
performance problem in CRCP (Darter et al. 1979; McCullough et al. 1980; Zollinger
1989). However, in-depth evaluations of punch-outs during their repair revealed that this
type of distress was associated with horizontal cracking at the depth of the longitudinal
steel. Furthermore, full-depth punch-outs are quite rare in Texas (Won 2011). The
horizontal cracking has not been well recognized until recently due to the difficulty of
detection before full-depth rehabilitation. The horizontal crack prevents the transverse
crack propagation into the full-depth of concrete slab. These transverse and horizontal
cracks may ultimately cause a half-depth punch-out as shown in Figure 5-1(Choi et al.

81
2011). In addition, even though the top half of the concrete had deteriorated, the
bottom of half of the concrete was still healthy (Won 2011).
Previous research has been conducted to identify the mechanism of horizontal
cracking in CRCP due to environmental effects and found that the longitudinal steel
plays a significant role in the development of horizontal cracking. Significant tensile
stress occurred in concrete near the longitudinal steel due to environmental effects and
steel restraint (Choi et al. 2011; Kim and Won 2004). In addition, horizontal cracking
could be affected by concrete material properties, environmental conditions, and
longitudinal steel layout (Choi et al. 2011; Won et al. 2002). However, only three
research papers have been identified to address horizontal cracking and they focused
on effects of environmental loading only, due to the limitation of two-dimensional (2-D)
finite-element (FE) model. Even though axle loading may also affect the development of
horizontal cracking of CRCP, it has not been well considered in previous studies.
Therefore, the current lack of understanding of the horizontal cracking compared to
other distress type under environmental and critical loading conditions is probably the
great deficiency in the evaluation of the CRCP system. The effects of combination of
environmental and wheel loading need to be evaluated and understood in order to
mitigate this type of cracking. A better understanding about the mechanism of horizontal
cracking under combined action of wheel loads and environmental loads may help in
the understanding of some of the existing problems and provide better guidelines for the
design and construction of the CRCP system.
In this study, a three-dimensional (3-D) FE model was developed for analyzing a
CRCP system. The 3-D model was used to evaluate the effects of various design
82
parameters on the vertical tensile stress in concrete near the longitudinal steel, where
the horizontal crack generally occurs.
Objectives
The analysis conducted herein was focused on the evaluation of factors
influencing horizontal cracking in CRCP under combined environmental and traffic
loads. The design parameters evaluated include:
Location of combined environmental and traffic loads
Concrete properties (coefficient of thermal expansion, and modulus of elasticity).
Structural design parameters (base modulus, base friction coefficient, slab thickness, and crack spacing).
Longitudinal steel design (layout).
Scope
In this study, a 3-D finite element model was developed for computing the vertical
tensile stresses in the concrete in CRCP under critical temperature-load conditions. The
developed 3-D model was used to perform a parametric analysis to determine the
effects of loading location, concrete material properties, pavement design parameters,
and longitudinal steel design on the vertical tensile stress near the longitudinal steel
causing horizontal cracking.
Mechanism of Horizontal Cracking in CRCP
Temperature and moisture gradients in a concrete pavement slab can cause the
slab to curl. However, this distortion can be restrained by the longitudinal steel across
the transverse crack, resulting in a significant vertical tensile stress at the depth of the
longitudinal steel. Because the longitudinal steel resists curling, this force is applied to
the upper and lower halves of the slab. As a result, a substantial stress in the vertical

83
direction occurs at the depth of the longitudinal steel, which may result in horizontal
cracking in CRCP (Choi et al. 2011). It is expected that greater tensile stress zone
would be developed under an extreme temperature or moisture condition, especially
when wheel loads are applied. Figure 5-2 illustrates how vertical tensile stresses are
developed at the depth of steel when the concrete slab is subject to environmental
loadings of a temperature differential of ±20 °F (±11.1 °C) in the concrete slab. When
the vertical tensile stress near the steel is excessive, the concrete would crack
horizontally along the plane of the slab, splitting the slab into two separate slabs of
much lower thickness. The upper thin slab would easily crack under combined
temperature and load effects. Therefore, it is important to evaluate this vertical tensile
stress in order to prevent this type of cracking which will eventually lead to punch-out
failure in CRCP.
Finite Element Modeling of CRCP
The 3-D finite element model developed in this study consists of two concrete
slabs with one transverse crack supported by base and subgrade as shown in Figure 5-
3. The spacing of the transvers crack was initially assumed to be 10 ft (3 m). To
eliminate the boundary condition effects, the concrete slabs were modeled at their full
width and the base and subgrade layers were extended 24 inch (61 cm) on each side.
The concrete slabs’ contact with the base layer was maintained by applying the
concrete self-weight and there was no external constraint. The concrete slab-base layer
interface friction factor (μ) was assumed to be 1.5, since the AASHTO 93 Guide
recommends a range of concrete-base friction of 0.9 to 2.2. The concrete slab was
modeled by an assemblage of eight-node isoparametric solid brick elements and the
reinforce steels were modeled by beam elements. The bond-slip between the concrete

84
and the steel bars was modeled using spring elements. Figure 5-4 shows the frictional
bond-slip relation between the concrete and the steel bars which has been used by
other researchers and which was used in this study (Kim et al. 1998; Kim et al. 2000).
The thickness of the base layer was 6 in. (15 cm) over a 100-in (254 cm) subgrade. It
was found that increasing the thickness of the subgrade layer to more than 100 in. (254
cm) had no significant effect on the computed stresses in the concrete slabs. The base
and subgrade materials were modeled as isotropic and linearly elastic characterized by
their modulus of elasticity and Poisson’s ratio. The contraction and expansion of the
concrete due to temperature effects are also considered, and characterized by its
coefficient of thermal expansion. The double symmetry of the geometry about x- and y-
axes was selected in order to reduce computation time. The subgrade layer was fixed in
the z-direction. The geometry and material properties used in this study are presented
in Table 5-1.
Effect of Critical Loading Condition on Horizontal Cracking
The effects of combined temperature and load on the vertical tensile stress near
the longitudinal steels in CRCP has not been studied previously. Critical vertical stress
analysis at the depth of steel was performed to determine the maximum tensile stresses
in the concrete slabs if they were subject to some critical load and temperature
conditions which would produce the highest thermal-load-induced stresses in the
concrete. The two temperature differentials considered in the analysis were +20 °F
(+11.1 °C) and -20 °F (-11.1 °C), which represent typical severe temperature differential
in concrete pavement slabs in Florida. A 22-kip (98 kN) axle load, which represents the
maximum legal load limit for single axle loads in Florida, was used as the applied load in
the analysis. The four load positions were (1) slab corner at transverse crack, (2) slab

85
center at transverse crack, (3) slab edge between transverse cracks, and (4) slab center
between transverse cracks. Vertical tensile stresses at the depth of steel in concrete
caused by the axle load for the various combination of temperature differentials and
load positions were computed using the 3-D FE model developed.
Figure 5-5 shows the computed vertical tensile stress in concrete at the depth of
steel caused by the different combinations of temperature differential and axle load. The
results of the analysis indicate that when the temperature differential in the slab is
positive, the critical load position is at the slab corner. Therefore, the corner load positon
at transverse crack was used in the computation of the maximum thermal-load-induced
vertical tensile stresses for most of the cases in this study.
Effects of Concrete Properties
Effects of Coefficient of Thermal Expansion
The 3-D finite element model was also used to evaluate the effects of coefficient
of thermal expansion on the maximum tensile stresses in CRCP under the critical
loading condition, when the load is applied to the corner of the slab as formed by the
transverse cracks with a temperature differential of +20 °F (+11.1 °C). The effects of the
coefficient of thermal expansion of the pavement concrete ranging from 5.0×10⁻⁶ to
7.0×10⁻⁶ in/in/°F (9×10⁻⁶ to 12.6×10⁻⁶ m/m/°C) on the maximum induced vertical
stresses were analyzed.
For comparison purpose, the vertical tensile stresses due to environment loading
only were also calculated. Using the different values of the coefficient of thermal
expansion, the maximum vertical stresses at the depth of steel were calculated and
presented in Figure 5-6.

86
As expected, the maximum vertical tensile stresses increase as the coefficient of
thermal expansion increases. However, the effects of coefficient of thermal expansion
on the environmental tensile stresses are much higher than those on the tensile stress
caused by the critical combined temperature-load effects, even though the magnitude of
environmental stress is much lower than that caused by the combined temperature-load
effects.
Effects of Concrete Modulus
The effects of elastic modulus of concrete on the maximum vertical stresses
were analyzed. The maximum vertical tensile stress in the slab caused by a 22-kip (98
kN) single axle load at the edge of the transverse crack at a temperature differential of
+20 °F (+11.1 °C) were computed. Figure 5-7 shows the maximum vertical tensile
stresses as a function of elastic modulus of concrete. It can be seen that the calculated
maximum stress increases by around 4.7% when the elastic modulus increases from
4,000 to 6,000 ksi (27.6 to 41.4 GPa).
However, an increase in elastic modulus of the concrete is usually accompanied
by an increase in its flexural strength when the same aggregate is used. In order to
evaluate the possibility for the concrete to crack at the various conditions, the maximum
computed tensile stresses were divided by the flexural strength of concrete to obtain the
stress-to-strength ratio. In this study, the flexural strength of the concrete was related to
its elastic modulus and unit weight by the following equation for a Florida concrete made
with a Florida limestone (Tia et al. 1990):
1.54.2
EMR
w
(5-1)
Where, E = elastic modulus, in psi
87
MR = flexural strength, in psi
w = unit weight, in pcf
Using this equation and a unit weight of 145 pcf (2,323 kg/m3), the concrete
flexural strengths at various values of elastic modulus were calculated, and the stress-
to-strength ratios were also plotted against the concrete elastic modulus in Figure 5-7. It
can be noted that the maximum stress-to-strength ratio decreases as the concrete
modulus increases. Decrease in stress-to-strength ratio with increase in modulus can
be explained by the increase in flexural strength which can be obtained by using a lower
water-cement ratio in concrete mixture. However, it must also be noted that if a different
type of aggregate is used to produce a concrete of lower elastic modulus without a
decrease in strength, the use of a low- modulus concrete can give a lower stress-
strength ratio and a lower horizontal cracking potential.
Effects of Structural Design Parameters
Effects of Base Layer Modulus
The effects of base layer modulus on maximum vertical tensile stresses in CRCP
were analyzed. The maximum vertical tensile stresses in the concrete slabs were
computed using the same critical loading condition and environmental condition. The
base modulus was varied from 50 ksi to 400 ksi (0.35 GPa to 2.76 GPa). Figure 5-8
shows the plots of vertical tensile stresses in concrete as a function of base modulus. It
can be noted that the maximum vertical tensile stress decreases as the base modulus
increases under critical loading condition. Conversely, the environmental stresses
increase slightly as the base modulus increases.
In the case of critical temperature-load condition, the slab edge deflects down
into the base layer due to traffic load and curling movement, which causes the base

88
reaction near the transverse crack. The magnitude of base reaction at the transverse
crack varies depending on the stiffness of the base layer. The higher reaction force near
the transverse crack causes less bending deflection which results in less vertical tensile
stresses in concrete near the longitudinal steel.
In case of the environmental loading condition, the maximum tensile stress
increases slightly as the base layer stiffness increases. Since a higher stiffness of base
layer may result in smaller supporting area and higher force exerted by the weight of
unsupported slab region, which causes the higher vertical tensile stress near the steel.
Thus, a softer base may offer more uniform slab support resulting in lower tensile
stresses in the concrete slab due to self-weight force.
Effects of Base Friction
The frictional force between the concrete slabs and the base layer is an
important factor in the early development of CRCP cracks. In the case of transverse
cracks, numerous investigations have looked into the effects of slab-base friction on
CRCP, but little research has been found regarding base friction on horizontal cracking
in CRCP. The base friction coefficient was varied from 0.9 to 2.2.
Figure 5-9 shows the plots of maximum vertical tensile stresses in concrete slab
at the depth of steel as a function of coefficient of slab-base friction. The sensitivity
study indicated that changes in base friction had very little effect on the environmental
tensile stresses, while the maximum tensile stresses caused by critical temperature-
load effects decrease as the base friction increases. It can be explained by the fact that
the frictional force increases as coefficient of base friction increases which results in
decrease of slab movements near the transverse crack under the critical temperature-
load condition. As a result, the vertical tensile stresses also decrease.

89
Based on the above observation, it appears that the horizontal cracking potential
deceases with increase in base friction.
Effects of Concrete Slab Thickness
The effects of slab thickness on maximum vertical stress in CRCP were analyzed
and presented in Figure 5-10. Obviously, increasing thickness reduces the vertical
tensile stress at the depth of steel. The calculated vertical tensile stresses decrease by
approximately 23% when the concrete slab thickness increases from 10 in. to 13 in.
(254 mm to 330 mm).
In addition to the vertical tensile stress, the principal tensile stress was also
evaluated since the cracks occur in perpendicular direction to the principal stress
vectors. The maximum principal stress vectors were perpendicular to the direction of
longitudinal steel, which indicates that horizontal cracking was likely to occur at the half
depth of slab in the longitudinal direction. As expected, the maximum principal stress
also decreases as the thickness of concrete slab increases.
Effects of Transverse Crack Spacing
As shown in the previous results, the maximum vertical stresses develop at the
location of transverse cracks. The LTPP data for CRCP sections show a spectrum of
transverse cracking varying from 0.25 ft to 10 ft (0.08 m to 3 m) and mean crack
spacing values vary between 1 ft and 7.5 ft (0.3 m and 2.3 m) (Selezneva et al. 2003).
The effects of the transverse crack spacing ranging from 3 ft to 10 ft (0.9 m to 3 m) on
horizontal cracking were analyzed. Using the different values of crack spacing, the
maximum vertical tensile stress and principal stress were calculated and presented in
Figure 5-11. The critical stresses were reduced slightly when the transverse crack

90
spacing increased. Variations in the transverse crack spacing can be noted to have
relatively minimal effect on the horizontal cracking.
Effects of Longitudinal Steel Design
The effects of longitudinal steel design on the horizontal cracking potential were
analyzed. Previous study (Choi et al. 2011; Won et al. 2002) found that a two-mat steel
bar has the advantages in preventing horizontal cracking. However, the two-mat
placement requires more materials or labor in implementation. In this study, the effects
of the longitudinal steel spacing ranging from 3 in. to 12 in. (7.62 cm to 30.48 cm) on
horizontal cracking potential were analyzed. Using the different longitudinal steel
spacing, the maximum vertical tensile stresses were calculated and presented in Figure
5-12. The vertical tensile stresses were significantly reduced when the steel spacing
was reduced. In addition, the analysis results indicated that the vertical tensile stress in
the region far away from the tire load was affected little by longitudinal steel spacing.
From this result, it can be concluded that the use of varying longitudinal steel spacing
can be one of the effective ways to reduce the horizontal cracking potential. For
instance, the use of narrow steel spacing under wheel path and wide steel spacing for
other region could be a possible solution without changing the steel ratio of the slab.
Summary of Findings
A 3-D finite elements model was developed to study the structural response of
CRCP under typical Florida conditions. The model developed was used to perform a
parametric analysis to determine the effects of important pavement parameters on the
maximum induced vertical tensile stresses for estimating the horizontal cracking
potential. The main findings are summarized as follows:

91
The results of the analysis indicate that the critical load position is at the corner of slab formed by transverse cracks when the concrete slab has a positive temperature differential.
The maximum vertical tensile stresses under the critical temperature-load condition is affected little by the coefficient of thermal expansion of the concrete.
The maximum stress-to-strength ratio decreases as the concrete’s flexural strength increases.
The maximum vertical tensile stresses decrease as the base modulus increases under the critical temperature-load condition.
The maximum tensile stresses decrease as the base friction increases under the critical temperature-load condition.
Increasing slab thickness reduces the vertical tensile stress at the depth of steel.
The critical vertical stresses decrease slightly when the transverse crack spacing increases.
The vertical tensile stresses are significantly reduced when the steel spacing is reduced. In addition, the vertical tensile stress in the region far away from the tire load is affected little by the longitudinal steel spacing. From this result, the use of varying longitudinal steel spacing (i.e., small steel spacing under wheel path and wide steel spacing for other region) may be one of the ways to reduce the horizontal cracking potential in CRCP.
The following procedures are recommended for analysis of CRCP to minimize
horizontal cracking:
1. Analyze the maximum vertical tensile stress at the depth of the longitudinal steel under critical temperature-load condition.
2. Compare the maximum vertical tensile stress to flexural strength of the concrete used.
3. If maximum tensile stress is greater than 50% of the flexural strength of the concrete, try to reduce it to 50% or less by the following options:
(1) Reduce longitudinal steel spacing
(2) Increase flexural strength of concrete
(3) Increase base modulus
(4) Increase slab thickness

92
Table 5-1. Geometry and material properties used in the CRCP model.
Transverse crack spacing 10 ft (3 m)
Pavement width 12 ft (3.6 m)
Pavement thickness 10 in. (25.4 cm)
Coefficient of thermal expansion of concrete 5.8 × 10⁻⁶ /°F (10.4 × 10⁻⁶ /°C)
Coefficient of thermal expansion of steel 5.0 × 10⁻⁶ /°F (9.0 × 10⁻⁶ /°C)
Elastic modulus of concrete 4,800,000 psi (33.1 GPa)
Elastic modulus of steel 29,000,000 psi (200 GPa)
Depth of steel 5 in. (12.7 cm)
Diameter of longitudinal steel 0.75 in. (19 mm)
Diameter of transverse steel 0.625 in. (16 mm)
Longitudinal steel spacing 6 in. (15.2 cm)
Transverse steel spacing 18 in. (45.7 cm)

93
Figure 5-1. Horizontal cracking in CRCP (Choi et al. 2011).

94
A
B C
Figure 5-2. Vertical stress of concrete in CRCP. A) area of compressive and tensile stress zones at a transverse crack in CRCP due to a positive temperature differential in the slab, B) vertical stress in concrete near steel due to temperature differential of +20 °F, C) Vertical stress in concrete near steel due to temperature differential of -20 °F.
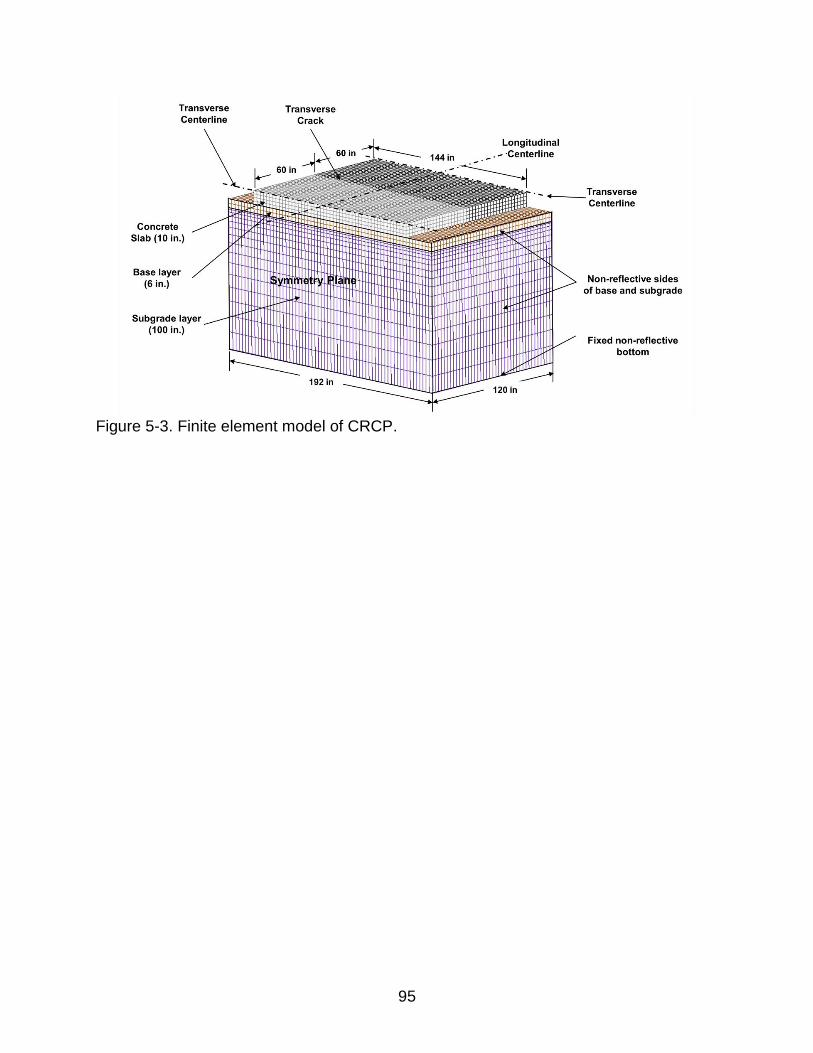
95
Figure 5-3. Finite element model of CRCP.

96
A
B
Figure 5-4. Finite element model for concrete-steel interface. A) spring for bond-slip between concrete and reinforce bar, B) bond stress-slip relationship used.

97
A B
C D
Figure 5-5. Computed vertical tensile stresses at the depth of steels. A) slab corner loading at transverse crack, B) slab center loading at transverse crack, C) slab edge loading between transverse cracks, D) slab center loading between transverse cracks.

98
Figure 5-6. Effects of coefficient of thermal expansion on maximum vertical stresses at the depth of steel.
Figure 5-7. Effects of concrete modulus on maximum vertical tensile stresses in CRCP under critical temperature-load condition.

99
Figure 5-8. Effects of subgrade stiffness on maximum vertical stresses in CRCP under critical temperature-load condition.
Figure 5-9. Effects of base friction on maximum vertical stresses in CRCP under critical temperature-load condition.

100
Figure 5-10. Effects of concrete slab thickness on maximum vertical stresses in CRCP under critical temperature-load condition.
Figure 5-11. Effects of transverse crack spacing on maximum vertical stresses in CRCP under critical temperature-load condition.

101
Figure 5-12. Effects of longitudinal steel spacing on maximum vertical stresses in CRCP under critical temperature-load condition.

102
CHAPTER 6 LABORATORY TESTING TO EVALUATE THE PERFORMANCE AND SUITABILITY
OF SENSORS
Background
Monitoring of strains at critical locations in concrete pavements can provide
useful information regarding structural behavior and performance. These strains can be
caused by temperature variation, shrinkage, creep, and traffic loads. Data collected
from the sensors installed in test road can be used to develop new pavement designs,
rehabilitation methods, and to validate and verify analytical models by comparing the
measured and calculated responses in terms of strain, stress, and deflections.
The most common type of sensor used in pavement instrumentation is the
electrical resistance strain gauge, which has been successfully used for strain
measurement due to their simplicity, low cost, and ease of installation. However, when
this type of sensor is installed in field, the long lead-wires are usually required due to
geographical location and configuration of road which results in high signal-to-noise
ratio, an increase in the susceptibility of electrical noise, and the high chance of the
damage from the lightning strike. In recent years, the technology of fiber-optic sensor
has been developed as an alternative to resistance strain gauges and possess
advantages including immunity to electromagnetic interference, environmental
durability, and high sensitivity. (Casas and Cruz 2003; Grattan and Sun 2000; Yehia et
al. 2008).
Many studies were conducted to characterize the mechanical behavior of fiber-
optic sensors in several applications on steel, concrete, and FRP and found that this
type of sensor achieved reliable measurements (Ansari and Chen 1991; Bonfiglioli et al.
1998; Bonfiglioli and Pascale 2003). In addition, Wang and Tang (2005) conducted the

103
experimental test for the application of the pavement structures to evaluate the stability
performance of fiber-optic sensors inside or bonded to the surface of asphalt and
concrete specimens under various loading and environmental conditions. This test
results indicated that fiber-optic sensors have excellent long-term stability and high
resolution.
Although several researchers have used and documented the response from
fiber-optic sensors, literature on the precision of these sensors in concrete pavement
application is very limited (Rice and Lloyd 2014; Wang and Tang 2005). Though the
fiber-optic technology is advanced for accurately measuring an object’s strain, the
assessment of fiber-optic sensor for use in concrete has not been thoroughly done in
comparison with electrical resistance sensors. Therefore, a laboratory study was
conducted to evaluate and compare fiber-optic and traditional resistance strain gauge
performance in terms of its accuracy, repeatability, and reproducibility. The different
strain sensors were embedded in concrete specimens which were then subjected to
known static and dynamic loads. In addition to evaluating the response due to load,
measurements due to concrete drying shrinkage were also evaluated.
Overview of Instrumentation
At present, the most commonly used sensors for measuring strains in concrete
pavements are vibrating wire strain gauges (VWSG) for long-term static strains, and
electrical resistance gauges for dynamic strains. Fiber-optic strain gauges have also
been used to monitor infrastructure performance, but concrete pavement use has been
limited. Each one of these types of strain gauges are discussed in this section.

104
Vibrating Wire Strain Gauge
The vibrating wire strain gauges used for this study were purchased from
Geokon Inc. The Geokon Model 4200 as shown in Figure 6-1 is primarily designed for
long-term strain measurements as embedment type. The vibrating wire strain gauge
consists of the tensioning cables, two end blocks, and an encasing tube. Deformation in
the concrete will cause an altering of the tension in the steel wire. Electromagnetic coils
excite and read of the resonance frequency of the wire within the gauge, which is
related to the strain experienced by the concrete. Each vibrating wire strain gauge is
also equipped with a thermistor, which is used to correct for changes in the length of
wire due to temperature change.
The main advantage of the vibrating wire strain gauge is that it can be used to
measure long-term strain events, since it is based on the natural frequency of the wire
which will not change with time. If the vibrating wire strain gauge output is properly
corrected, the reference reading can be used to correct the long-term strain variations.
On the other hand, the resistance base gauges (conventional strain gauges) require an
excitation voltage which may change over time. The output from an electrical
resistance-based strain gauge system may contain an offset relative to the change in
excitation voltage.
Electrical Resistance Strain Gauges
The principle of electrical strain gauges is based on the fact that the change in
resistance of a strain gauge corresponds to the change in length of the strain gauge.
These tiny changes of resistance are measured by means of a Wheatstone bridge
connection and in terms of an output voltage. In this study, three types of electric strain
gauges were evaluated, namely Vishay-120Ω, the Vishay-350Ω, and Kyowa-120Ω. The

105
Vishay strain gauges are manufactured by Miro-Measurement and specially designed
for measuring strains inside concrete. The Kyowa gauge is designed for measuring
interior strain in concrete or mortar. The body of the all gauges are sealed and specially
treated to ensure adequate bonding between the gauge and the concrete.
One of the problems of the electrical resistance strain gauge is lead-wire thermal
effect because the lead-wires between the gauge and the strain-gauge bridge also
change their electrical resistance with changes in temperature. Three wire systems
were developed to minimize the thermal effect from the gauge output. As shown in
Figure 6-2, the 3-wire system has lead-wires connecting to the gauge side of the bridge
and also to the adjacent side of the bridge. These lead-wires have the same change in
electrical resistance due to temperature change, and thus would balance each other out
in the Wheatstone bridge circuit. Three lead-wire connections were used in this study.
Fiber-optic Sensor
In this study, the OS-3600 FBG fiber-optic sensor manufactured by Micron Optics
was evaluated. The OS-3600 is designed to be embedded in concrete and adhere to
the concrete during curing process. This sensor is made of stainless steel and a Teflon
encasing with strain sensitivity of 1.2 pm/µε and temperature sensitivity of 23.8 pm/°C.
According to the OS-3600 specification, the fatigue life is 100 million cycles at 2,000 µε
and operating temperature range is -40°C to +80°C with strain limit of 2,500 µε. For data
acquisition, the Micro Optics sm130 interrogator was used. It has four optical channels
with wavelength range of 1510-1590 nm and a typical FBG sensor capacity of 40. It is
also designed for harsh environments with operating temperature of 0°C to 50°C, and
the operating humidity of 0 to 80%. Figure 6-3 shows the OS-3600 FBG fiber-optic
sensor and sm130 interrogator used.

106
A FBG sensor has Bragg gratings that reflect particular wavelengths of light
called the Bragg wavelength. The basic principle of operation of an FBG sensor is
based on detecting the shift of wavelength of the reflected “Bragg” signals as the
reflected Bragg wavelength is a function of the spacing between the gratings as shown
in Figure 6-4. A change in the peak Bragg wavelength is related to a change in
mechanical properties including strain, temperature, and displacements (Grattan and
Sun 2000).
To measure the reflection spectrum, the fiber-optic sensor requires a light
source with a particular wavelength range and detector of reflected signal which is
called an interrogator. This interrogator is needed due to the inherent characteristics of
fiber-optic sensor including the use of light instead of electricity and glass fiber instead
of copper wire. The interrogator measures the full optical spectrum and the peak
wavelength of the optical sensor signals which is related to a change in physical length
of the sensor. The sm130 dynamic optical sensing interrogator used in this study
served this purpose.
Laboratory Testing Program
A laboratory study was conducted to evaluate the performance of different
concrete embedment strain sensors. The different strain sensors were embedded in
concrete cylinders, and the concrete cylinders were subjected to various known static
and dynamic strains. The measured strains obtained from the various strain sensors
were then compared with the known strains to evaluate their performance with regards
to accuracy, repeatability, and reproducibility. In addition to the evaluation of the
performance of strain sensors in measuring load-induced strains, the vibrating wire
strain gauges and fiber-optic gauges were also tested to evaluate their performance in

107
measuring concrete shrinkage strains. Early age (up to 14 days) strain reading were
compared with the strain reading as measured by the calibrated LVDTs in the standard
drying shrinkage test. In this study, a total of five different strain gauge types were used,
namely three types of electronical resistance strain gauges, a vibrating wire strain
gauge, and a fiber-optic gauge.
Concrete Specimens
Two different sizes of concrete specimens were used to evaluate sensor
performance under different loading conditions. The concrete cylinders were 6 inches
(152.4 mm) in diameter and 16 inches (406.4 mm) in height for the fiber-optic sensors.
This longer cylinder size was needed in order to allow for the OS-3600 fiber optic
sensor to be fully embedded in it. The other sensors were embedded in 6 by 12 inches
(152.4mm by 304.8mm) cylinders. The sensors to be evaluated were placed in the
center of the cylinder and in the vertical direction to minimize the effects of eccentricity
and offset errors in sensor location that could cause variation in the measurements. All
sensors were placed along the same axis, equidistance from the edge of the cylinder.
The sensors were suspended by steel wires, and the concrete was placed in three
layers to ensure that the gauges were vertically in line with cylinder axis. Four vibrating
wire strain gauges, six electrical resistance strain gauges, and four fiber-optic sensors
were used for this evaluation.
Concrete Mixtures
A concrete mixture with high workability and small nominal maximum aggregate
size (#89 stone with a nominal maximum size of 3/8 inches) was used for testing. Table
6-1 shows the mix proportions for the concrete mix. It can be seen that the slump of the
concrete mix was high to allow the mixture flow into the space between the mold and

108
the sensor easily. For the hardened concrete samples at 28 days, the compressive
strength, elastic modulus and Poisson’s ratio (ASTM C39, ASTM C469) are 26.06 MPa,
28,406 MPa, and 0.24, respectively. Figure 6-5 shows how the sensors were placed in
the concrete test specimens.
Compression Test
To evaluate the performance of the different embeddable sensors, a concrete
cylinder was instrumented and tested under various known strains. The cylindrical
specimens were ground at the two ends to ensure that they were smooth and
perpendicular with respect to the vertical side of the cylinder. Since the characteristics
of the sensors are the same in either tension or compression, it is sufficient to evaluate
them in compression alone. Therefore, the cylinders were loaded in compression in the
vertical direction after curing for 36 days since it was much easier to put the concrete
specimens in compression than in tension. An extensometer, manufactured by Epsilon,
was attached on the outside of the concrete cylinder and used to measure the vertical
deformation and strain of the test cylinder. This extensometer was calibrated to meet
existing ASTM E 83 class B-1 accuracy requirements of ± 10-5 inch.
Measured compressive strains from the embedded sensors were compared with
strains from the extensometer mounted on the concrete cylinder. A universal testing
machine (UTM), manufactured by Instron, was used for the compression test and seven
different loading cases (as presented in Table 6-2) were used on the concrete
specimens. The first six loading cases are static loads from 5 to 50 kips, which were
applied and held for 30 seconds each. The seventh loading case is a dynamic load
cycling between 20 kips and 25 kips in compression as presented in Table 2. For
dynamic loading case, each load cycle took 12 seconds, and so the frequency of the

109
cyclic loading was 0.083 Hz. For all of the loading cases, the strain gauges were zeroed
at the beginning of each test.
A sampling rate of 100 Hz was used for electrical resistance gauges and fiber-
optic gauges. For the VWSG, a sampling rate of 1 Hz was chosen because the pluck-
read operation on a VWSG required the read time to be not less than 1 sec. Figure 6-6
shows the specimen and extensometer in the UTM before testing.
Shrinkage Test
Shrinkage strain measurements were performed on concrete specimens with
embedded VWSGs and FOSs. Displacement measurements were also taken by an
LVDT, which was calibrated to meet ASTM E2309 class A accuracy requirements of ±
10-4 inch, and then attached to surface of concrete cylinder. The setup for free
shrinkage test consisted of a DC-powered LVDT connected to a shrinkage test frame.
The outputs from the LVDTs and strain gauges were connected to a Data Acquisition
System (DAQ). The LVDTs have a sleeve bearing structure on one end that supports a
spring-loaded shaft attached to the core to facilitate mounting. All LVDTs are
hermetically sealed to operate in harsh environments such as a moist room, and have
an operating temperature range of 0 °F to 160 °F (-17.8 °C to 71.1 °C). The test setup
for measuring the free shrinkage using a LVDT is shown in Figure 6-7.
The following steps were used in conducting the free shrinkage test:
1. After concrete casting is done, cover the concrete samples with plastic sheets for one day.
2. After one day, remove the concrete samples from the molds and place them into the shrinkage test frames as shown in Figure 6-7.
3. Adjust the LVDT readings to zero. It is somewhat difficult to set the LVDT reading to zero due to its high sensitivity. Thus, just adjust it to as close to zero as possible.

110
4. After the LVDT readings are set to zero, set the DAQ to record readings every 15 minutes continuously.
Results of Sensor Evaluation
The objective of this analysis was to assess the performance in terms of
accuracy, repeatability, and reproducibility for load-induced and shrinkage strain
measurements.
Evaluation of Gauge Accuracy
Sensor accuracy can be defined as the degree of agreement of the measured
quantity to its true value. To evaluate the accuracy of sensors, ten cylinders were tested
and summarized in Table 6-3. The measured strains were compared with the strains as
measured by the calibrated extensometer. Figure 6-8 presents the results of the
accuracy test. The results show that the strains measured by the Kyowa, FOS, and
VWSG gauges matched well with the strains as measured by the extensometer.
However, the strains measured by the Vishay strain gauges show larger deviations from
those by the extensometer. It can be seen that the FOS had the lowest average
difference among all the gauges evaluated. A t-Test was run to determine if the
difference in accuracy for the other four types of sensors were statistically different from
that for the FOS. It can be seen that the differences in accuracy of the Kyowa and
VWSG gauges with the accuracy of the FOS are statistically insignificant with a
confidence level of 95%. However, the two Vishay gauges were significantly different as
compared with the FOS in accuracy as presented in Table 6-4.
Evaluation of Gauge Repeatability and Reproducibility
Sensor repeatability can be defined as the measure of agreement between the
results of successive measurements of the same sensor under the same condition.

111
Sensor reproducibility can be defined as the closeness of the agreement between the
results of measurements of the two or more sensors under similar condition.
To evaluate the repeatability and reproducibility of strain sensors, the magnitude
of strain, defined as the absolute difference between the minimum and maximum strain
value of the strain cycle, was calculated as the response variable. A statistical analysis
as described in ASTM C802, Standard Principles for Conducting an Inter-laboratory
Test Program to Determine the Precision of Test Methods for Construction Material
(ASTM(C802-09a) 2010), was applied to process the data. The pooled standard
deviation and coefficient of variations were calculated, including variance within and
between similar sensors measured under the same loading conditions. The results of
the analysis include within and between coefficient of variations (COV) which indicate
the degree of variability in measured strains with the same gauge (within) and the
variability in measured strains with similar gauges (between). Table 6-5 presents the
measured strains from the two Kyowa gauges in ten repeated load tests and the
calculated statistics from these data.
Table 6-6 presents the results of statistical analysis summary of the measured
strains from the four different gauges in the repeated load tests.
Repeatability
It can be seen that the Kyowa gauges show the best repeatability (with the
lowest within gauge coefficient of variation), to be followed by Vishay-350Ω, FOS, and
Vishay-120Ω gauges. The previous study conducted by FDOT (FDOT 2008) stated that
a strain gauge repeatability with COV of ≤ 10 percent was deemed acceptable and a

112
COV between 10 percent and 20 percent was considered as marginal. The overall COV
was found to be less than 10 percent (within gauge) for all sensors.
Reproducibility
It can be seen that the Kyowa gauges show the best reproducibility (with the
lowest COV between gauges) to be followed by Vishay-350Ω, FOS, and Vishay-120Ω
gauges.
Results of Concrete Shrinkage Measurements
The measured shrinkage strains from the sensors were compared with the
strains calculated from the LVDTs readings as shown in Figure 6-9. It can be noted that
there were two data gaps from 27 hours to 50 hours and from 268 hours to 288 hours
due to power failure. During the monitoring period, the average difference in strain
output between the fiber-optic sensor and LVDT was 14.28 µε with a standard deviation
of 8.07 µε, while the average difference between vibrating wire strain gauge and LVDT
was 12.84 µε with a standard deviation of 7.78 µε. In this experiment, the
measurements obtained through both embedded sensors show good agreement with
the LVDTs readings. The overall strain during the 14 days of monitoring period due to
shrinkage and the statistical analysis results are summarized in Table 6-7. It can be
seen that the difference in accuracy of the FOS and the VWSG were statistically
insignificant at 95% confidence level.
Summary of Findings
An experimental study was conducted to evaluate the performance
characteristics of fiber-optic, vibrating wire strain gauge (VWSG), and electrical
resistance sensors in measuring strains in concrete due to load and shrinkage. The

113
different sensors were evaluated in terms of accuracy, repeatability, and reproducibility.
The main findings are summarized as follows:
When compared with the strains measured by a calibrated extensometer in a compression test where the strains varied from 0 to around 450 µε, the fiber-optic strain sensor (FOS) showed an average error of 2.7 µε, as compared with average errors of 5.7 µε and 5.6 µε for an electrical resistance strain gauge and a vibrating wire strain gauge (VWSG), respectively. However, their differences in error were found to be statistically insignificant at 95% confidence level.
The repeatability of the strain measurements by the FOS in terms of coefficient of variation (COV) was 7.5% as compared with COVs of 4.4, 5.6, and 9.6% for the three different electrical resistance strain gauges.
The reproducibility of the strain measurements by the FOS in terms of COV was 9.8% as compared with COVs of 5.4, 5.7, and 10.1% for the three different electrical resistance gauges.
When compared with the strains measured by a calibrated LVDT in a concrete drying shrinkage test where the strains varied from 0 to around 250 µε, the FOS showed an average difference of 30.37 µε, while the VWSG showed an average difference of 34.04 µε. The difference in strain measurements by the different gauges was statistically insignificant at 95% confidence level.
Based on the results of this laboratory evaluation, the FOS is found to have
similar accuracy, repeatability, and reproducibility as compared to electrical resistance
and VWSG, and can be used for measuring dynamic and long-term strains in concrete
pavement.
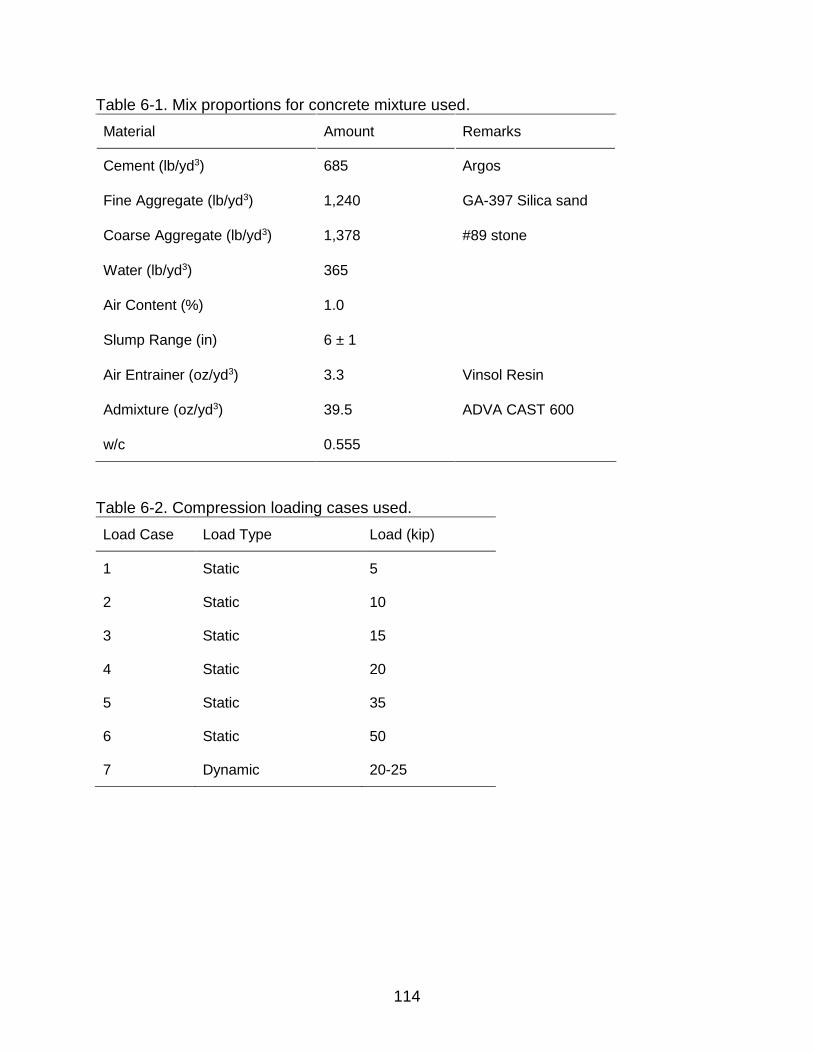
114
Table 6-1. Mix proportions for concrete mixture used.
Material Amount Remarks
Cement (lb/yd3) 685 Argos
Fine Aggregate (lb/yd3) 1,240 GA-397 Silica sand
Coarse Aggregate (lb/yd3) 1,378 #89 stone
Water (lb/yd3) 365
Air Content (%) 1.0
Slump Range (in) 6 ± 1
Air Entrainer (oz/yd3) 3.3 Vinsol Resin
Admixture (oz/yd3) 39.5 ADVA CAST 600
w/c 0.555
Table 6-2. Compression loading cases used.
Load Case Load Type Load (kip)
1 Static 5
2 Static 10
3 Static 15
4 Static 20
5 Static 35
6 Static 50
7 Dynamic 20-25

115
Table 6-3. Summary of sensor accuracy test results.
Sensor types Average difference as compared to the extensometer readings (µε)
Average difference for the same sensor type (µε)
FOS-1 1.025 2.697
FOS-2 4.370
Kyowa-1 3.758 5.698
Kyowa-2 7.637
Vishay-120Ω-1 28.819 31.828
Vishay-120Ω-2 34.838
Vishay-350Ω-1 15.521 17.729
Vishay-350Ω-2 19.938
VWSG-1 4.218 5.625
VWSG-2 7.032
Table 6-4. Results of Student’s t-tests on the accuracy test at 95% confidence level.
Test set Sensor type t-Test (P-value) Significantly different
1 FOS
0.362 No Kyowa
2 FOS
0.014 Yes Vishay-120Ω
3 FOS
0.032 Yes Vishay-350Ω
4 FOS
0.312 No VWSG

116
Table 6-5. Measured dynamic strains from two Kyowa gauges and calculated statistics.
Gauge 1 2 3 4 5 6 7 8 9 10 Average Variance
Kyowa-1 42.63 40.00 44.11 44.38 44.27 44.03 43.68 43.96 43.82 44.82 43.57 1.90
Kyowa-2 46.72 47.70 43.78 41.71 47.56 47.03 46.74 46.73 47.30 41.41 45.67 5.88
Average 44.62 3.89
𝑝 = 𝑁𝑢𝑚𝑏𝑒𝑟 𝑜𝑓 𝑔𝑎𝑢𝑔𝑒𝑠 = 2
𝑛 = 𝑁𝑢𝑚𝑏𝑒𝑟 𝑜𝑓 𝑡𝑟𝑖𝑎𝑙𝑠 = 10
𝑥 = 𝑆𝑢𝑚 𝑜𝑓 𝑛 𝑡𝑟𝑖𝑎𝑙𝑠 𝑓𝑜𝑟 𝑜𝑛𝑒 𝑔𝑎𝑢𝑔𝑒 𝑑𝑖𝑣𝑖𝑑𝑒𝑑 𝑏𝑦 𝑛 = ∑𝑥𝑖
𝑛= 43.57
𝑥𝐴 = 𝐴𝑣𝑒𝑟𝑎𝑔𝑒 𝑜𝑓 𝑔𝑎𝑢𝑔𝑒 𝑎𝑣𝑒𝑟𝑎𝑔𝑒𝑠 = 44.62
𝑆𝐴2(𝑝𝑜𝑜𝑙𝑒𝑑) = 𝐴𝑣𝑒𝑟𝑎𝑔𝑒 𝑜𝑓 𝑔𝑎𝑢𝑔𝑒 𝑣𝑎𝑟𝑖𝑎𝑛𝑐𝑒𝑠 = 3.89
S𝑥𝐴2
(𝐶𝑜𝑚𝑝𝑜𝑛𝑒𝑛𝑡 𝑜𝑓 𝑣𝑎𝑟𝑖𝑎𝑛𝑐𝑒 − 𝑤𝑖𝑡ℎ𝑖𝑛 𝑔𝑎𝑢𝑔𝑒) =∑ 𝑥𝑖
2− 𝑝(𝑥𝐴)2
𝑝 − 1= 2.198
SL𝐴2 (𝐶𝑜𝑚𝑝𝑜𝑛𝑒𝑛𝑡 𝑜𝑓 𝑣𝑎𝑟𝑖𝑎𝑛𝑐𝑒 − 𝑏𝑒𝑡𝑤𝑒𝑒𝑛 𝑔𝑎𝑢𝑔𝑒) = (S𝑥𝐴
2) −
𝑆𝐴2(𝑝𝑜𝑜𝑙𝑒𝑑)
𝑛= 1.81
Variance within gauges = 3.89
Varinace between gauges = 5.70
Coefficinet of variation (COV) 𝑤𝑖𝑡ℎ𝑖𝑛 𝑔𝑎𝑢𝑔𝑒𝑠 = 4.42
Coefficient of variation (COV) 𝑏𝑒𝑡𝑤𝑒𝑒𝑛 𝑔𝑎𝑢𝑔𝑒𝑠 = 5.35

117
Table 6-6. Summary of statistical analysis results.
Sensor Average (µε)
Variance Standard Deviation (µε)
Coefficient of variation (%)
within gauge
between gauge
within gauge
between gauge
within gauge
between gauge
Kyowa 44.62 3.89 5.70 1.97 2.39 4.42 5.35
Vishay-120Ω 35.79 11.74 12.93 3.43 3.60 9.58 10.05
Vishay-350Ω 39.36 4.84 5.05 2.20 2.25 5.59 5.71
FOS 48.14 12.96 22.23 3.60 4.72 7.48 9.79
Table 6-7. Summary of shrinkage test and t-test results at 95% confidence level.
Test set
Sensor type
Maximum measured shrinkage strain (µε)
Average difference between sensor and LVDT
Average difference for same sensor type (µε)
t-Test (P-value)
Significantly different
1 FOS-1 -267.45
14.28
30.37
0.903 No
LVDT -256.27
2 FOS-2 -246.43
46.45 LVDT -209.09
3 VWSG-1 -209.49
12.84
34.04 LVDT -191.07
4 VWSG-2 -232.81
55.24 LVDT -182.76

118
Figure 6-1. Model 4200 Vibrating Wire Strain Gauge (Geokon 2016).
Figure 6-2. Comparison of 2-wire and 3-wire connections for electrical resistance strain gauge.

119
A
B
Figure 6-3. Fiber-optic sensor system. A) OS-3600 FBG fiber-optic embeddable strain sensor (MicronOptics 2012), B) sm130 dynamic optical sensing interrogator (MicronOptics 2009).
Figure 6-4. Principle of operation of a FBG sensor.

120
A B
C D
Figure 6-5. Locations of sensors in concrete specimens (photo courtesy of Kukjoo Kim). A)strain gauge inside 6 "× 12" cylinder, B) FOS sensor embedded in 6" × 16" cylinder, C) 6" × 12" cylinders made of PVC pipe, D) cylinders during casting.

121
Figure 6-6. Concrete specimen tested in compression (photo courtesy of Kukjoo Kim).
Figure 6-7. Set-up for free shrinkage measurement using a LVDT (photo courtesy of Kukjoo Kim).

122
A B
C D
E
Figure 6-8. Accuracy test results. A) Fiber-optic sensor, B) Kyowa sensor, C) Vishay-120Ω sensor, D) Vishay-350Ω sensor, E) VWSG sensor.

123
A B
Figure 6-9. Comparison of free shrinkage strain measurements. A) Free shrinkage strain from FOS, B) Free shrinkage strain from VWSG.

124
CHAPTER 7 EFFECTIVE INSTRUMENTATION PLAN AND ANALYSIS METHODOLOGY
Overview
Background
In chapter 6, various embeddable strain gauges were tested to evaluate their
performance characteristics, and the results indicated all sensors evaluated have similar
accuracy, repeatability, and reproducibility in measuring load-induced strains (i.e., static
and dynamic load) and concrete shrinkage strains. However, there are factors that can
influence the measured strains in the field. These factors include the offset distance of
wheel load, weight of vehicle (axle load), and environmental conditions (e.g.,
temperature differentials and moisture condition through the depth of slab).
Since the concrete pavement responses can vary with aforementioned factors,
interpreting strain measurements at certain points in the concrete slab is questionable
without knowledge of the corresponding traffic load information. Thereby, the
instrumentation plan must take into account the uncontrollable variables such as the
wandering positions of the vehicle loads, temperature differentials in the concrete slabs,
the weight of loads, etc.
In this chapter, a full-scale test was conducted to evaluate various pavement
response obtained from different locations of the test slab by comparing the responses
magnitude and trend. Also, the instrumented test slabs were modeled numerically using
Finite Element Method (FEM) to determine the distribution of strain responses. The
measured and calculated responses were used to derive the relationship between the
strain distribution and the corresponding traffic load location.

125
Objectives and Scope
In this chapter, the primary objective is to develop an instrumentation
methodology which can be used in conjunction with the analysis tools (1) to verify the
analytical results, (2) to make the needed adjustments to the models, and (3) to monitor
the behavior and performance of these pavements. To do this, three full-scale test slabs
were constructed and subjected to HVS loading to evaluate the pavement responses
under combined temperature-load conditions. These measurements were used to
validate a 3-D finite element model developed using the test slab configuration. The
calculated and measured strain responses were then used to develop an
instrumentation plan and methodology for evaluation of concrete test pavements.
Test Facility and Instrumentation
Instrumentation Layout and Installation
Three test slabs were constructed at the Accelerated Pavement Testing (APT)
facility in the FDOT Materials Research Park in Gainesville, Florida. To construct the
three test slabs, three mix designs were selected for use, and were referred to as (1)
Test-1, (2) Test-2, and (3) Test-3, respectively. Each of the three concrete test slabs
was 12 ft by 16 ft in size and 9 in. in thickness, and was constructed over an existing
two-inch thick asphalt layer, which was placed over a 10.5 in. limerock base. There was
no dowel bar used at the slab joints. Figure 7-1 shows the instrumentation layout for the
test slabs. The locations for the dynamic strain gauges were selected based on the
anticipated maximum strain responses in the test slabs from the anticipated HVS
loading. At each indicated gauge location, two embedded strain gauges were placed at
a depth of 1 in. from the concrete surface, and 1 in. from the bottom of the concrete
layer. This was achieved by securing the strain gauges between two nylon rods which

126
were securely driven into the asphalt layer before the pouring of the concrete to form
the test slab.
Each test slab was loaded by a Heavy Vehicle Simulator (HVS). During the HVS
testing, dynamic strain data from the tested slab were recorded at every 15-minute
interval, for 30 seconds each time, at a rate of 100 values per second for each strain
gauge. Temperature data were recorded at five-minute intervals.
FE Modeling of Test Slab Section
A 3-D finite element model for concrete slabs was developed using the ADINA
(version 9) finite element software. Figure 7-2 shows the 3-D finite element model
which was developed for the analysis of the three test slabs. A concrete slab is
modeled by an assemblage of elastic hexahedron elements. A hexahedron element is
defined by eight nodes with each node having three degrees of freedom, i.e.,
translations in the x-, y-, and z-directions. The effects of temperature changes in the
concrete slab can also be considered in the analysis. The concrete is characterized by
its elastic modulus, Poisson’s ratio, and coefficient of thermal expansion (CTE).
The test slabs are modeled as not bonded to the underlying foundation. The
pavement foundation is modeled as an isotropic and linearly elastic subgrade material
characterized by its elastic modulus and Poisson’s ratio. A depth of 100 inches was
used to model the subgrade material. The bottom of subgrade layer was modeled as
fixed in z- direction.
The properties of the three concretes used in the model were initially obtained
from the measured properties of the sampled concrete. The elastic modulus of the
subgrade was obtained through back-calculation method by matching the analytical to
the measured FWD deflections of the test slabs, as presented in the next section. Load

127
transfer across the joint between two adjacent slabs is modeled by translational springs
connecting the nodes of the finite elements along the joint. Spring elements also have
three degrees of freedom. Three values of spring constants are used to represent the
stiffnesses along x-, y-, and z-directions.
Calibration and Validation of the FE Model
In order for the 3-D analytical model to accurately analyze the performance of the
test slabs under the HVS loading and critical loading conditions, it needs to have
accurate properties of the test slab materials and the correct values of spring stiffness
for modeling the behavior of joints and edges. The elastic modulus of the concrete
material was initially estimated from the results of laboratory tests on the sampled
concrete. The elastic modulus of subgrade and the spring stiffnesses of joint and edges
were estimated by back-calculation of the FWD deflection data using the FE model. The
elastic moduli of the concrete were also adjusted by back-calculation method. The
results of the FWD tests at the slab center were used to estimate the elastic modulus of
the subgrade. The results of the FWD test at the joints and edges were used to calibrate
values of spring stiffness at the joints and edges by matching the analytically computed
deflections with the measured FWD deflections. This process is referred to as
“calibration of model parameters” of the model in this study. The estimation of the test
slab materials properties and parameters was further verified by matching the
analytically computed strains with the measured strains in the test slabs caused by HVS
wheel loads. This process is referred to as “verification of model parameters” in this
study.
Pavement surface deflection basins caused by a 9-kip FWD applied load were
used to estimate the values of the elastic modulus of the subgrade and the stiffness of

128
the springs used to model the load transfer at the joints. Figure 7-3 shows an example
of measured and computed deflection basin caused by a 9-kip FWD load at the center
of slab. This set of FWD tests was done in the early morning when the slab would tend
to have a negative temperature differential and to have full contact with the subgrade at
the slab center. The measured deflection basins in the transverse direction were very
similar to those in the longitudinal direction. The analytical deflection basin was
calculated by using an elastic modulus of the subgrade of 115 ksi.
Deflection basins caused by FWD load applied at the joint were used to estimate
the joint spring stiffnesses, which were used to model the load transfer at the joints. This
set of FWD tests was performed at midday when the slab would tend to have a positive
temperature differential and to have full contact with the subgrade at the joints. The
estimated elastic moduli of the slab and subgrade were used in the FE model to
compute the deflection basin across the joint. Figure 7-4 shows the matched deflection
basins from the back-calculation process for estimating the joint spring stiffnesses.
Using the previous estimated parameters and material properties, a fairly good match
between the measured and the calculated deflection basins was achieved with a vertical
stiffness of 100,000 lb/in. and with stiffness of 10,000 lb/in. in the x and y directions.
In order to verify the parameters for the FE models for the test slabs, the
measured strains from strain gauges embedded in the test slab were compared with the
computed strains. The strain at each gauge location was computed by using the FE
model for the case of static load shifted according to the locations of the HVS wheel at
different times. A total of 64 shifts of the applied wheel load were used to simulate one
pass of the HVS loading with a speed of 7.5 mile per hour. Figure 7-5 shows the

129
comparison between the analytical strains predicted using the FE model and the
measured strains from the full-scale test slabs.
Table 7-1 presents a summary of model parameters calibrated for the test slabs
in this study. The 3-D FE models with the calibrated parameters were used to perform
the analysis of stresses under critical loading condition in Florida. As shown in Figure 7-
3 through 7-5, the analytical responses matched well with measured responses.
Thereby, the FE model developed will be used in the following analysis to develop an
effective instrumentation methodology.
Configurations of Strain Gauges for Test Slabs
Since the measured strains from embedded strain gauges due to applied wheel
loads are affected by the wheel wander locations, it is recommended that a series of six
strain gauges, so that the maximum strain as well as the strain profile caused by the
applied wheel load can be adequately captured. Figure 7-6 shows the recommended
locations of the six sensors relative to the expected wheel path. The six strain gauges
would be spaced 6 inches apart. The expected wheel path without wander would be at
the center of these six gauges, and between gauges 3 and 4.
Table 7-2 presents the calculated strains at the six strain gauge locations caused
by a 9-kip wheel load at various wander positions for a typical 9-inch thick concrete
pavement slab with no temperature differential. The load-induced strains at the six
sensor positions are plotted for the various wheel wander locations in Figure 7-7. As
shown in Figure 7-7, the peak location of the strain profile in transverse direction is
highly related with traffic wandering position. For instance, in the case of 7-7(a), the
wheel load passes between sensors 3 and 4, and the highest strains would be recorded

130
by sensors 3 and 4. In the case of 7-7(c), the wheel load is at sensor location 5, and
sensor location 5 would be able to capture the maximum strain.
Table 7-3 presents the calculated strains at the six strain gauge locations caused
by the same 9-kip wheel load placed at the center location for various wheel widths. The
calculated strain profiles caused by the 9-kip wheel load of various widths are shown in
Figure 7-8. It can be seen that the strain profile spreads out more as the wheel width
increases.
When a series of strain sensors are used, the captured strain profiles caused by
an applied load can also be used for back-calculation of pavement parameters in a
similar fashion as FWD deflection basins are used for estimation of pavement
parameters.
Summary of Findings
In this chapter, a data analysis methodology was developed for evaluation of the
behavior and performance of concrete pavement slab using embedded strain gauges.
The measured strains caused by applied loads can be used to evaluate the accuracy of
an analytical model to predict the responses of the pavement slab. In order to capture
the maximum strain caused by the applied load whose location changes with the
wandering positon of the wheel, a series of six strain sensors are recommended for use.
The use of this strain sensor configuration will enable the capture of the complete
strain profile caused by a wandering wheel load. The complete strain profile can also be
used to infer about the width of the wheel load. It can also be used for back-calculation
of pavement parameters.

131
Table 7-1. Summary of model parameters calibrated for the test slabs.
Parameters used in FE model Test-1 slab Test-2 slab Test-3 slab
Elastic Modulus of Concrete (ksi) 4,550 3,950 3,800
Density of Concrete (pcf) 138.3 129.9 130.4
Coefficient of Thermal Expansion (in/in/°F) 4.425E-6 4.239E-6 4.239E-6
Poisson’s ratio 0.2 0.2 0.2
Elastic Modulus of Subgrade (ksi) 115 115 115
Spring Constant for Load Transfer (lb/in)
Transverse Joint X 10,000 10,000 -
Transverse Joint Y 10,000 10,000 -
Transverse Joint Z 100,000 1,000,000 -
Longitudinal Joint X 10,000 - 10,000
Longitudinal Joint Y 10,000 - 10,000
Longitudinal Joint Z 1,000,000 - 100,000
Table 7-2. Calculated strain responses of concrete slab at various wheel wander positions.
Case Wander Position (in.)
Axle load (kip)
Tire width (in)
Gauge Number
1 2 3 4 5 6
1 0 9 9 4.71 6.93 9.28 9.28 6.93 4.71
2 3 9 9 3.89 5.72 8.23 9.70 8.23 5.72
3 6 9 9 2.67 3.89 5.72 8.23 9.70 8.23
4 9 9 9 2.23 3.22 4.71 6.93 9.28 9.28
5 12 9 9 1.87 2.67 3.89 5.72 8.23 9.70
6 -3 9 9 5.72 8.23 9.70 8.23 5.72 3.89
7 -6 9 9 8.23 9.70 8.23 5.72 3.89 2.67
8 -9 9 9 9.28 9.28 6.93 4.71 3.22 2.23
9 -12 9 9 9.70 8.23 5.72 3.89 2.67 1.87
Note: values are in units of µε.

132
Table 7-3. Calculated strain responses of concrete slab for various wheel widths.
Case Wander Position (in.)
Axle load (kip)
Tire width (in)
Gauge Number
1 2 3 4 5 6
1 0 10 6 4.78 7.05 10.50 10.50 7.05 4.78
2 0 10 9 5.31 7.82 10.47 10.47 7.82 5.31
3 0 10 12 5.85 8.45 10.42 10.42 8.45 5.85
Note: values are in units of µε.

133
Figure 7-1. Instrumentation layout.
Figure 7-2. 3-D finite element model for test slabs.

134
Figure 7-3. Example of determination of elastic modulus using FWD deflection basin caused by a 9-kip FWD load at slab center for test-1 slab.
Figure 7-4. Example of determination of spring stiffness across the joint using FWD basin caused by a 9-kip FWD load across the joint for standard mix slab.

135
A
B
C
Figure 7-5. Measured and computed strains at selected gauge locations. A) Test-1 slab from sensor D1-Bottom, B) Test-2 slab from sensor DA1-Top, C) Test-3 slab from sensor D1-Top.

136
Figure 7-6. Recommended layout of the sensor locations.

137
Figure 7-7. Relationship between strain profile and tire wandering position.

138
.
Figure 7-8. Relationship between strain profile and tire width.

139
CHAPTER 8 CONCLUSIONS
Summary and Findings
This study was undertaken with the objectives of (1) developing a FE model for
analysis of concrete pavement containing RAP by incorporating the actual stress-strain
characteristics of the concrete instead of assuming a linear elastic behavior; (2)
developing a FE model to properly consider the effects of longitudinal and transverse
prestress forces in PPCP; (3) developing an improved CRCP model to analyze the
horizontal cracking potential under environmental and traffic loading conditions; (4)
investigating new instrumentation methodology for interpreting strain measurements
from concrete slabs.
To test the accuracy and applicability of the proposed finite element models in
this study, analytical FWD deflection basins and strain data were compared with
measured values from test roads constructed in Florida and then a parametric study on
the effects of various design parameters on the potential performance was conducted.
The results from this study provide a better understanding of the behavior of non-
conventional concrete pavements. The main findings are as follows:
1. Concrete pavement containing RAP. The FE model incorporating the actual stress-strain behavior of the RAP concrete tends to give lower computed stresses in the slab as compared with the corresponding results from the linear elastic model. This error may cause the difference in the predicted potential performance of the concrete pavement containing RAP.
2. Precast Prestressed Concrete Pavement. The maximum stresses in the concrete were observed to increase significantly as the concrete modulus and coefficient thermal expansion increase. Due to the increase in flexural strength associated with the increase in elastic modulus of the concrete, an increase in elastic modulus of the concrete results in a decrease in the computed stress-to-strength ratio under critical temperature-load conditions. The PPCP system evaluated appears to have a good predicted pavement performance with computed stress-to-strength ratio of less than 0.5 with up to additional loss of 20 % of prestress

140
force in the longitudinal and transverse directions. Variations in the base and subbase properties were found to have minimal effect on the maximum induced stresses in concrete, which indicate that the PPCP system is appropriate for a wide variety of subbase and subgrade conditions.
3. Horizontal cracking potential in CRCP. The critical load position for horizontal cracking is at the corner of slab formed by transverse cracks when the concrete slab has a positive temperature differential. The maximum vertical tensile stresses in the concrete are slightly affected by the coefficient of thermal expansion of the concrete. In addition, the critical tensile stresses in the concrete were observed to decrease as the base modulus, slab-base friction, slab thickness, and transverse crack spacing increase. Also, the vertical tensile stresses are significantly reduced when the longitudinal steel spacing is reduced, while the maximum vertical tensile stresses in the region far away from the tire load are little affected by longitudinal steel spacing. The use of varying longitudinal steel spacing (i.e., small steel spacing under wheel path and wide steel spacing for other region) may be one of the ways to reduce the horizontal cracking potential without changing the steel ratio of the slab.
In addition to develop the improved FE models, new instrumentation and
evaluation methodologies were investigated to be used in conjunction with the analytical
models for verifying the analytical results and monitoring the behavior and performance
of these pavements. To do this, various strain sensors were embedded in concrete
specimens and then tested under the same known static and dynamic loads. The
results indicated that all sensors selected (including electric resistance, vibrating wire,
and fiber-optic sensor) have similar accuracy, repeatability, and reproducibility in
measuring load-induced strains (i.e., static and dynamic load) and concrete shrinkage
strains. However, since the wandering location of the wheel load can affect the locations
of maximum strains and strain distribution, a series of six strain sensors spaced at 6
inches apart are recommended. The use of this strain sensor configuration will enable
the capture of the complete strain profile regardless of the wandering position of the
wheel load.

141
Recommendations
Based on the findings from this study, the following recommendation are made:
1. In the analysis of the concrete pavement containing the RAP, an analytical model using the actual stress-strain characteristics, instead of the assumption of the concrete as linear elastic material, should be employed to calculate the maximum stresses in the concrete. The model incorporating the actual stress-strain behavior of the RAP concrete can simulate the structural responses to predict the potential performance of the pavement.
2. The results of the parametric analysis indicate that the significant effects of various concrete properties and design parameters on the behavior and performance of PPCP system under Florida conditions. Thus, in the design of the PPCP, correct values of concrete properties and design parameters should be employed in an appropriate analytical model rather than the use of the stress equivalency concept or the strength equivalency concept to evaluate the response of the PPCP.
3. When the horizontal cracking occurs at approximately mid-depth of the slab along the plane of the slab, the upper thin slab would easily crack under combined temperature and load effects. In order to prevent this type of cracking in CRCP, the following procedures are recommended for analysis of CRCP to minimize horizontal cracking:
a) Analyze the maximum vertical tensile stress at the depth of the longitudinal steel under critical temperature-load condition.
b) Compare the maximum vertical tensile stress to flexural strength of the concrete used.
c) If maximum tensile stress is greater than 50% of the flexural strength of the concrete, try to reduce it to 50% or less by the following options:
i) Reduce longitudinal steel spacing
ii) Increase flexural strength of concrete
iii) Increase base modulus
iv) Increase slab thickness
4. A series of six strain sensors spaced at 6 inches apart are recommended for use in order to capture the complete strain profile caused by a wandering wheel load.

142
LIST OF REFERENCES
ACI (2002). "Building code requirements for structural concrete and commentary ",
American Concrete Institute. Al-Oraimi, S., Hassan, H. F., and Hago, A. (2009). "Recycling of Reclaimed Asphalt
Pavement in Portland Cement Concrete." The Journal of Engineering Research, 6(1), 37-45.
Ansari, F., and Chen, Q.-Y. (1991). "Fiber-optic refractive-index sensor for use in fresh
concrete." Applied optics, 30(28), 4056-4059. ASTM(C802-09a) (2010). "Standard Practice for Conducting an Interlaboratory Test
Program to Determine the Precision of Test Methods for Construction Materials." Annual Book of ASTM StandardsWest Conshohocken, PA, 408-425.
Berry, M., Dalton, K., and Murray, F. (2015). "Feasibility of Reclaimed Asphalt
Pavement as Aggregate in Portland Cement Concrete Pavements Phase II: Field Demonstration." Montana Department of Transportation.
Berry, M., Stephens, J., Bermel, B., Hagel, A., and Schroeder, D. (2013). "Feasibility of
Reclaimed Asphalt Pavement as Aggregate in Portland Cement Concrete." Montana Department of Transportation.
Bonfiglioli, B., Arduini, M., Pascale, G., and Manfroni, O. (1998). "Monitoring of FRP
reinforcements in structural elements by means of fiber optic sensors." L'edilizia, 5, 40-45.
Bonfiglioli, B., and Pascale, G. (2003). "Internal strain measurements in concrete
elements by fiber optic sensors." Journal of Materials in Civil Engineering, 15(2), 125-133.
Casas, J. R., and Cruz, P. J. (2003). "Fiber optic sensors for bridge monitoring." Journal
of Bridge Engineering, 8(6), 362-373. Channakeshava, C., Barzegar, F., and Voyiadjis, G. Z. (1993). "Nonlinear FE analysis
of plain concrete pavements with doweled joints." Journal of Transportation Engineering, 119(5), 763-781.
Chatti, K., Lysmer, J., and Monismith, C. L. (1994). "Dynamic finite-element analysis of
jointed concrete pavements." University of California Transportation Center. Choi, S., Ha, S., and Won, M. C. (2011). "Horizontal cracking of continuously reinforced
concrete pavement under environmental loadings." Construction and Building Materials, 25(11), 4250-4262.
143
Chou, Y. T. (1981). "Structural Analysis Computer Programs for Rigid Multicomponent Pavement Structures with Discontinuities--WESLIQID and WESLAYER. Report 1. Program Development and Numerical Presentations." DTIC Document.
Darter, M. I., LaCoursiere, S. A., and Smiley, S. A. (1979). "Structural Distress
Mechanisms in Continuously Reinforced Concrete Pavement." Transportation Research Record(715).
Davids, W. G., Turkiyyah, G. M., and Mahoney, J. P. (1998). Modeling of rigid
pavements: joint shear transfer mechanisms and finite element solution strategies, Washington State Department of Transportation.
Delwar, M., Fahmy, M., and Taha, R. (1997). "Use of reclaimed asphalt pavement as an
aggregate in Portland cement concrete." ACI Materials Journal, 94(3). Dere, Y., Asgari, A., Sotelino, E. D., and Archer, G. C. (2006). "Failure prediction of
skewed jointed plain concrete pavements using 3D FE analysis." Engineering Failure Analysis, 13(6), 898-913.
FDOT (2008). "Evaluation of Pavement Strain Gauge Repeatability Under Accelerated
Pavement Testing." State of Florida Department of Transportation. FDOT (2011). "Portland Cement Concrete Pavement Specifications: State of the
Practice." State of Florida Department of Transportation. Geokon (2016). "Instruction Manual Model 4200 Series Vibrating Wire Strain Gauges."
Geokon, Lebanon, NH. Grattan, K., and Sun, T. (2000). "Fiber optic sensor technology: an overview." Sensors
and Actuators A: Physical, 82(1), 40-61. Hassan, K., Brooks, J., and Erdman, M. (2000). "The use of reclaimed asphalt
pavement (RAP) aggregates in concrete." Waste Management Series, 1, 121-128.
Hossiney, N., Tia, M., and Bergin, M. J. (2010). "Concrete containing RAP for use in
concrete pavement." International Journal of Pavement Research and Technology, 3(5), 251-258.
Hossiney, N., Wang, G., Tia, M., and Bergin, M. "Evaluation of Concrete Containing
Recycled Asphalt Pavement for Use in Concrete Pavement." Proc., Transportation Research Board 87th Annual Meeting.
Huang, B., Shu, X., and Burdette, E. (2006). "Mechanical properties of concrete
containing recycled asphalt pavements." Magazine of Concrete Research, 58(5), 313-320.

144
Huang, B., Shu, X., and Li, G. (2005). "Laboratory investigation of portland cement
concrete containing recycled asphalt pavements." Cement and Concrete Research, 35(10), 2008-2013.
Huang, Y., and Wang, S. (1973). "Finite-element analysis of concrete slabs and its
implications for rigid pavement design." Highway Research Record(466). Huang, Y. H. (1974). "Finite element analysis of slabs on elastic solids." Journal of the
Transportation Engineering Division, 100(2), 403-416. Huang, Y. H., and Deng, X.-J. (1983). "Finite element analysis of jointed concrete
pavements." Journal of Transportation Engineering, 109(5), 689-705. Ioannides, A., and Donnelly, J. (1988). Three-dimensional analysis of slab on stress-
dependent foundation. Kim, S.-M., Won, M., and Frank McCullough, B. (2002). "Dynamic stress response of
concrete pavements to moving tandem-axle loads." Transportation research record: journal of the transportation research board(1809), 32-41.
Kim, S.-M., Won, M., and McCullough, B. (1998). "Numerical modeling of continuously
reinforced concrete pavement subjected to environmental loads." Transportation research record: journal of the transportation research board(1629), 76-89.
Kim, S.-M., Won, M., and McCullough, B. (2000). "Three-dimensional analysis of
continuously reinforced concrete pavements." Transportation research record: journal of the transportation research board(1730), 43-52.
Kim, S.-M., Won, M., and McCullough, B. F. (2001). "Transformed field domain analysis
of pavements subjected to moving dynamic tandem-axle loads and integrating their effects into the CRCP-10 program." Center for Transportation Research, Bureau of Engineering Research, University of Texas at Austin.
Kim, S.-M., and Won, M. C. (2004). "Horizontal cracking in continuously reinforced
concrete pavements." ACI Structural Journal, 101(6). Kuo, C.-M., Hall, K. T., and Darter, M. I. (1995). "Three-dimensional finite element
model for analysis of concrete pavement support." Transportation Research Record(1505), 119-127.
Mallela, J., Abbas, A., Harman, T., Rao, C., Liu, R., and Darter, M. (2005).
"Measurement and significance of the coefficient of thermal expansion of concrete in rigid pavement design." Transportation research record: Journal of the transportation research board(1919), 38-46.
145
Masad, E., Taha, R., and Muhunthan, B. (1996). "Finite-element analysis of temperature effects on plain-jointed concrete pavements." Journal of Transportation Engineering, 122(5), 388-398.
McCullough, B. F., Ma, J., and Noble, C. (1980). "Limiting Criteria for the Design Of
Continuously Reinforced Concrete Pavements." Transportation Research Record(756).
Merritt, D., McCullough, B., and Burns, N. (2001). "Feasibility of using precast concrete
panels to expedite construction of portland cement concrete pavements." Transportation research record: journal of the transportation research board(1761), 3-9.
Merritt, D., Rogers, R., and Rasmussen, R. (2008). "Construction of a Precast
Prestressed Concrete Pavement Demonstration Project on Interstate 57 near Sikeston, Missouri." FHWA-HIF-08-009. Washington, DC: Federal Highway Administration.
Merritt, D. K., McCullough, B. F., and Burns, N. H. (2002). "Construction and Preliminary
Monitoring of the Georgetown, Texas Precast Prestressed Concrete Pavement." Citeseer.
Merritt, D. K., and Tayabji, S. (2009). "Precast Prestressed Concrete Pavement for
Reconstruction and Rehabilitation of Existing Pavements." MicronOptics (2009). "Optical sensing Interrogator (sm130)." MironOptics, Atlanta, GA. MicronOptics (2012). "Embeddable Strain Sensor (os3600)." MironOptics, Atlanta, GA. PCA (1984). Thickness design for concrete highway and street pavements, Portland
Cement Association, Skokie, IL. Pickett, G., and Ray, G. K. (1951). "Influence charts for rigid pavements." American
Society of Civil Engineers Transactions. Rice, J. A., and Lloyd, J. (2014). "Optimization of a Pavement Instrumentation Plan for a
Full-Scale Test Road: Evaluation." Selezneva, O., Darter, M., Zollinger, D., and Shoukry, S. (2003). "Characterization of
transverse cracking spatial variability: Use of long-term pavement performance data for continuously reinforced concrete pavement design." Transportation research record: journal of the transportation research board(1849), 147-155.
Smith, K., Wade, M., Peshkin, D., Khazanovich, L., Yu, H., and Darter, M. (1998).
"Performance of Concrete Pavements. Volume II: Evaluation of Inservice Concrete Pavements."

146
Tabatabaie, A. M., and Barenberg, E. J. (1978). "Finite-element analysis of jointed or
cracked concrete pavements." Transportation Research Record(671). Tayabji, S., Ye, D., and Buch, N. (2013). Precast concrete pavement technology,
Transportation Research Board. Tayabji, S. D., and Colley, B. E. (1986). "Analysis of jointed concrete pavements." Tia, M., Armaghani, J. M., Wu, C.-L., Lei, S., and Toye, K. L. (1987). FEACONS III
computer program for analysis of jointed concrete pavements. Tia, M., Bloomquist, D., Alungbe, G., and Richardson, D. (1991). "Coefficient of Thermal
Expansion of Concrete Used in Florida " Research Report, University of Florida, Gainesville, FL.
Tia, M., Bloomquist, D., Yang, M., Soongswang, P., Meletiou, C., Amornsrivilai, P.,
Dobson, E., and Rrichardson, D. (1990). "Field and Laboratory Study of Modulus of Rupture and Permeability of Structural Concrete in Florida." Research Report, University of Florida, Gainesville, FL.
Tia, M., Hossiney, N., Su, Y.-M., Chen, Y., and Do, T. A. (2012). "Use of Reclaimed
Asphalt Pavement in Concrete Pavement Slabs." Research Report, University of Florida, Gainesville, FL.
Tia, M., Liu, Y., Haranki, B., and Su, Y.-M. (2009). "Modulus of Elasticity, Creep and
Shrinkage of Concrete–PHASE II: Part 1–Creep Study." Research Report, University of Florida, Gainesville, FL.
Uddin, W., Hackett, R. M., Joseph, A., Pan, Z., and Crawley, A. B. (1995). "Three-
dimensional finite-element analysis of jointed concrete pavement with discontinuities." Transportation Research Record, 1482, 26-32.
Wang, J.-N., and Tang, J.-L. (2005). "Using Fiber Bragg Grating Sensors to Monitor
Pavement Structures." Transportation research record: journal of the transportation research board, 165-176.
Westergaard, H. "Analysis of stresses in concrete pavements due to variations of
temperature." Proc., Highway Research Board Proceedings. William, G. W., and Shoukry, S. N. (2001). "3D finite element analysis of temperature-
induced stresses in dowel jointed concrete pavements." International Journal of Geomechanics, 1(3), 291-307.
Won, M. (2011). "Continuously reinforced concrete pavement: identification of distress
mechanisms and improvement of mechanistic-empirical design procedures."

147
Transportation research record: journal of the transportation research board(2226), 51-59.
Won, M. C., Kim, S.-M., Merritt, D., and McCullough, B. F. "Horizontal cracking and
pavement distress in Portland cement concrete pavement." Proc., Designing, constructing, maintaining and financing today’s airport projects, 27th international air transport conference, Orlando, Florida, USA.
Wu, C., Tia, M., and Larsen, T. "Analysis of structural response of concrete pavements
under critical thermal-loading conditions." Proc., Fifth International Conference on Concrete Pavement Design and Rehabilitation.
Ye, D., and Tayabji, S. "Evaluation of Behavior and Performance of Precast Concrete
Pavements." Proc., Transportation Research Board 91st Annual Meeting. Yehia, S., Abudayyeh, O., Abdel-Qader, I., Zalt, A., and Meganathan, V. (2008).
"Evaluation of sensor performance for concrete applications." Transportation research record: journal of the transportation research board(2050), 101-110.
Zaghloul, S. M., White, T. D., and Kuczek, T. (1994). "Evaluation of heavy load damage
effect on concrete pavements using three-dimensional, nonlinear dynamic analysis." Transportation Research Record(1449).
Zollinger, D. G. (1989). "Investigation of punchout distress of continuously reinforced
concrete pavement." University of Illinois at Urbana-Champaign.

148
BIOGRAPHICAL SKETCH
Kukjoo Kim received a Bachelor of Engineering degree in the Department of Civil
Engineering from the Korea Military Academy, Korea, in March 2001. He was then
commissioned as an Army Engineer Officer in 2001. He further served as a Platoon
Leader as well as a Construction Officer in the 51st Division Engineer Combat Battalion.
After training for the O.A.C. (the Officer Advanced Course), while in service as a logistic
officer in the Engineer Combat Battalion, Division 1, he volunteered to be dispatched in
Iraq and served as a project manager in a Civil - Military Cooperation (CIMIC), set up to
rebuild the area in Erbil. After completing his overseas duty, he entered the Civil
Engineering Department of Texas A&M University in 2008. He got his master’s degree
in August 2010. After finishing his master’s degree, he came back to Korea and was
signed as an instructor of survivability at the Department of General Engineering,
R.O.K. Army Engineer School. He taught junior officer ‘Civil Engineering’ and
‘Fundamental of Protective Design’ that are compulsory coursed of OAC officers.
His academic pursuit led him to attend the Ph.D. program of materials group at
the University of Florida in 2012 and worked as a graduate research assistant with
doctoral advisor, Dr. Tia. After completing his Ph.D., he came back to Korea and will
continue his military career.