Embed Size (px)
Citation preview

VALIDATING THE HIERARCHY OF SOCIAL EMOTIONAL ABILITY DEVELOPMENT
By
JONATHAN WILLIAM ANDERSON
A THESIS PRESENTED TO THE GRADUATE SCHOOL
OF THE UNIVERSITY OF FLORIDA IN PARTIAL FULFILLMENT
OF THE REQUIREMENTS FOR THE DEGREE OF
MASTER OF SCIENCE
UNIVERSITY OF FLORIDA
2016

© 2016 Jonathan Anderson

There is no other relationship on Earth quite like one that passes between a father and son.
Nor are two father / son relationships alike. I dedicate this thesis to my son, Robert,
from whom I have learned more about love and life than I will ever be able to repay.
5
ACKNOWLEDGMENTS
As a non-traditional student, to be able to present this thesis to the Graduate School of the
University of Florida seems nothing less than a miracle. So many have been involved in
providing encouragement, emotional support, love, advice, and direction. I would like to
acknowledge and thank my family and close friends, and especially the people that are part of
the institution that is the University of Florida. In particular, I thank my son Robert for his
encouragement and support. And I thank UF for providing our family with a “reverse tradition.”
My son attended UF twenty-nine years before his Dad began his college career.
The University of Florida is the organizing focus for so many people, and attracts a
profoundly dedicated and caring faculty, staff, and student body. I am especially grateful for the
guidance of my thesis committee. I thank my committee chair, Dr. Victor Harris, without whom
I likely would not have attended graduate school, for his patient direction, guidance, and
encouragement. I thank my internal committee member, Dr. Larry Forthun for the many, many
hours spent helping me improve my critical thinking and writing skills. And I thank my external
committee member, Dr. Taylor Stein for his unwavering positive attitude, encouragement,
feedback, and direction.
I thank Dr. Tracy Johns for all the time she devoted to helping me develop a clearer
understanding of statistics and research; I thank Dr. Marilyn “Mickie” Swisher for her
completely spot-on advice regarding my approach to research. I thank Dr. Martie Gillen for
kindling my interest in research. I thank Dr. Heidi Radunovich for helping me deal with the
stress of my first semester of graduate school. And I thank Dr. Muthusami Kumaran for
encouraging me to attend graduate school in the first place. I thank Dr. Suzanna Smith for her
patient, calm, loving support. I thank Dr. David Diehl and Dr. Kevin Lancer for their help in the
development of the measurement instrument that was so critical to the success of this thesis.

6
And surprisingly, I thank Kate Fletcher for what, at the time, I considered to be her extreme
pickiness when it came to grading my APA citing attempts.
I would be remiss not to acknowledge the wonderful support staff that has helped me at
every turn. Thank You Greg Henderschiedt! Thank You Kathryn Ivey! Thank you to all of the
faculty, staff and students that make the Department of Family, Youth and Community Science
such a special collection of people. Thank you Dr. Tracy Irani for your efforts to demystify the
graduate school process, and for your efforts to reduce the stressors graduate students endure.
And thank you to all of my close friends who have lent so much love and support. It truly does
take a village… and not only for children!
7
TABLE OF CONTENTS
page
ACKNOWLEDGMENTS ...............................................................................................................5
LIST OF TABLES .........................................................................................................................10
LIST OF FIGURES .......................................................................................................................12
ABSTRACT ...................................................................................................................................13
CHAPTER
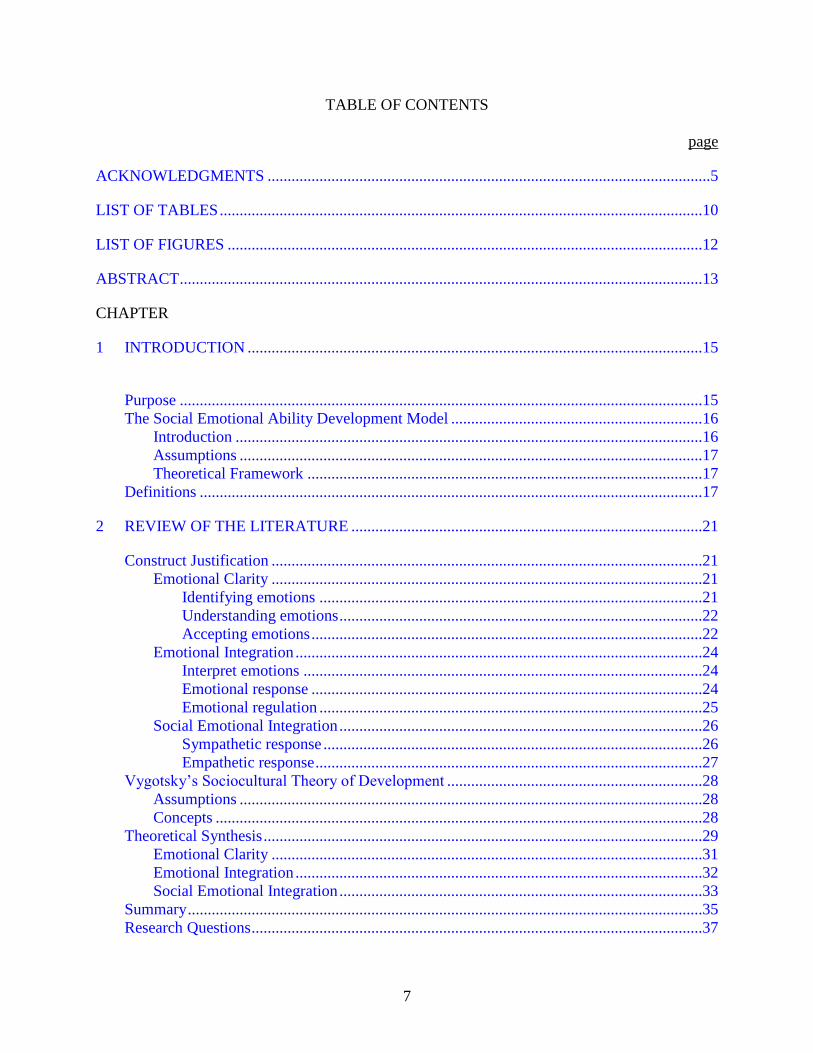
1 INTRODUCTION ..................................................................................................................15
Purpose ...................................................................................................................................15 The Social Emotional Ability Development Model ...............................................................16
Introduction .....................................................................................................................16 Assumptions ....................................................................................................................17 Theoretical Framework ...................................................................................................17
Definitions ..............................................................................................................................17
2 REVIEW OF THE LITERATURE ........................................................................................21
Construct Justification ............................................................................................................21 Emotional Clarity ............................................................................................................21
Identifying emotions ................................................................................................21 Understanding emotions ...........................................................................................22
Accepting emotions ..................................................................................................22 Emotional Integration ......................................................................................................24
Interpret emotions ....................................................................................................24
Emotional response ..................................................................................................24 Emotional regulation ................................................................................................25
Social Emotional Integration ...........................................................................................26 Sympathetic response ...............................................................................................26
Empathetic response .................................................................................................27
Vygotsky’s Sociocultural Theory of Development ................................................................28
Assumptions ....................................................................................................................28 Concepts ..........................................................................................................................28
Theoretical Synthesis ..............................................................................................................29 Emotional Clarity ............................................................................................................31 Emotional Integration ......................................................................................................32
Social Emotional Integration ...........................................................................................33 Summary .................................................................................................................................35 Research Questions .................................................................................................................37
8
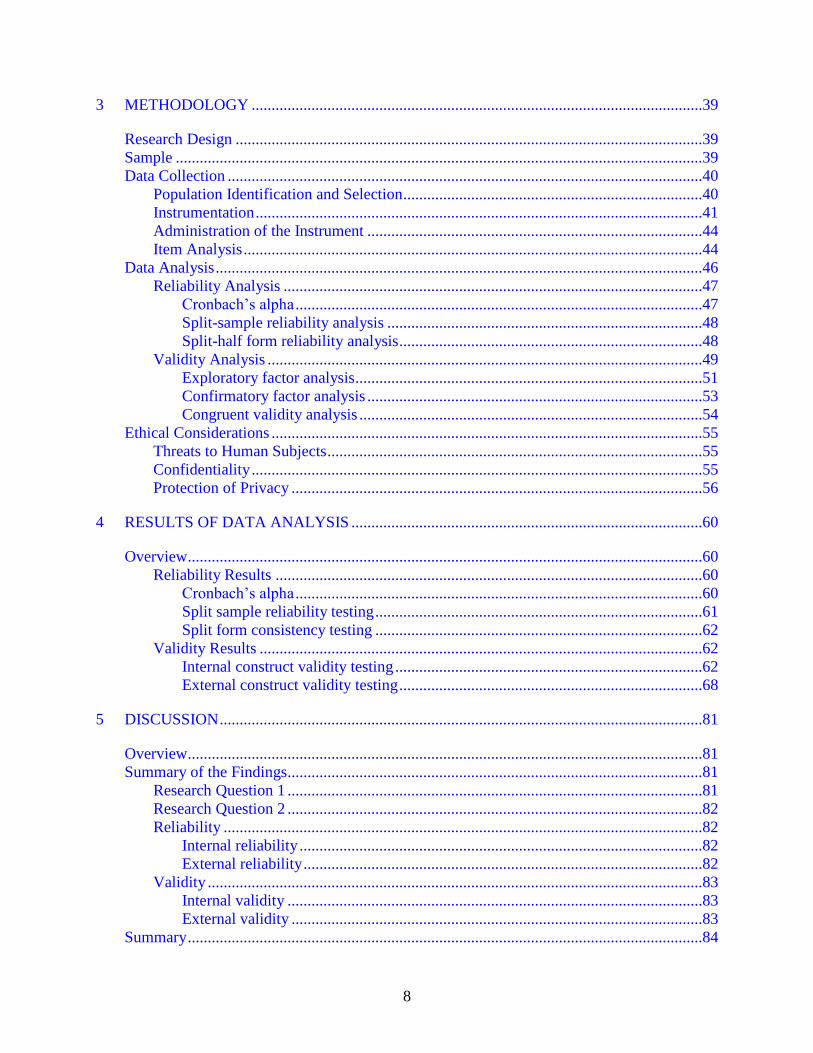
3 METHODOLOGY .................................................................................................................39
Research Design .....................................................................................................................39 Sample ....................................................................................................................................39 Data Collection .......................................................................................................................40
Population Identification and Selection ...........................................................................40 Instrumentation ................................................................................................................41 Administration of the Instrument ....................................................................................44 Item Analysis ...................................................................................................................44
Data Analysis ..........................................................................................................................46
Reliability Analysis .........................................................................................................47 Cronbach’s alpha ......................................................................................................47 Split-sample reliability analysis ...............................................................................48
Split-half form reliability analysis ............................................................................48 Validity Analysis .............................................................................................................49
Exploratory factor analysis .......................................................................................51
Confirmatory factor analysis ....................................................................................53 Congruent validity analysis ......................................................................................54
Ethical Considerations ............................................................................................................55 Threats to Human Subjects ..............................................................................................55 Confidentiality .................................................................................................................55
Protection of Privacy .......................................................................................................56
4 RESULTS OF DATA ANALYSIS ........................................................................................60
Overview .................................................................................................................................60 Reliability Results ...........................................................................................................60
Cronbach’s alpha ......................................................................................................60 Split sample reliability testing ..................................................................................61
Split form consistency testing ..................................................................................62 Validity Results ...............................................................................................................62
Internal construct validity testing .............................................................................62
External construct validity testing ............................................................................68
5 DISCUSSION .........................................................................................................................81
Overview .................................................................................................................................81 Summary of the Findings........................................................................................................81
Research Question 1 ........................................................................................................81 Research Question 2 ........................................................................................................82
Reliability ........................................................................................................................82 Internal reliability .....................................................................................................82 External reliability ....................................................................................................82
Validity ............................................................................................................................83 Internal validity ........................................................................................................83 External validity .......................................................................................................83
Summary .................................................................................................................................84

9
Important Implications ............................................................................................................85
For Individuals .................................................................................................................85 For Educators ...................................................................................................................86 For Practitioners ..............................................................................................................86
For Researchers ...............................................................................................................86 Cautions and Limitations ........................................................................................................87
APPENDIX: INSTRUMENT ITEMS ...........................................................................................88
REFERENCES ..............................................................................................................................89
BIOGRAPHICAL SKETCH .........................................................................................................96

10
LIST OF TABLES
Table page
3-1 Descriptive statistics of the sample: Gender ......................................................................57
3-2 Descriptive statistics of the sample: Age ...........................................................................57
3-3 Descriptive statistics of the sample: Race ..........................................................................57
3-4 Descriptive statistics of the sample: Ethnicity ...................................................................57
3-5 Descriptive statistics of the sample: College year .............................................................58
3-6 Descriptive statistics of the sample: Total family income .................................................58
4-1 Cronbach’s alpha reliability statistics: Emotional clarity ..................................................71
4-2 Cronbach’s alpha summary item statistics: Emotional clarity ...........................................71
4-3 Cronbach’s alpha item-total statistics: Emotional clarity ..................................................71
4-4 Cronbach’s alpha reliability statistics: Emotional integration ...........................................71
4-5 Cronbach’s alpha summary item statistics: Emotional integration ....................................71
4-6 Cronbach’s alpha item-total statistics: Emotional integration ...........................................72
4-7 Cronbach’s alpha reliability statistics: Social emotional integration .................................72
4-8 Cronbach’s alpha summary item statistics: Social emotional integration .........................72
4-9 Cronbach’s alpha item-total statistics: Social emotional integration .................................72
4-10 Split sample correlations: Emotional clarity ......................................................................73
4-11 Split sample correlations: Emotional integration ...............................................................73
4-12 Split sample correlations: Social emotional integration ....................................................73
4-13 Split sample correlations: Social emotional ability score ..................................................73
4-14 Split form internal consistency: Social emotional ability inventory ..................................74
4-15 Exploratory factor analysis: KMO and Bartlett's Test .......................................................74
4-16 Exploratory factor analysis: Total variance explained .......................................................74
4-17 Exploratory factor analysis: Component correlations ........................................................74

11
4-18 Exploratory factor analysis: Pattern matrix .......................................................................75
4-19 Confirmatory factor analysis: Total variance explained ....................................................76
4-20 Confirmatory factor analysis: Factor correlations .............................................................76
4-21 Confirmatory factor analysis: Pattern matrix .....................................................................77
4-22 Pearson’s correlations, external construct validity testing: Emotional clarity ...................78
4-23 Pearson’s correlations, external construct validity testing: Emotional regulation .............78
4-24 Pearson’s correlations, external construct validity testing: Social emotional ability
level ....................................................................................................................................78
A-1 Social emotional ability inventory (Harris & Anderson, 2015) .........................................88
A-2 Emotional clarity: Difficulties in emotional regulation scale (Gratz & Roemer, 2004) ....88
A-3 Emotional regulation: Difficulties in emotional regulation scale (Gratz & Roemer,
2004) ..................................................................................................................................88
A-4 Satisfaction with life scale (Diener, Emmons, Larsen, & Griffin, 1985) ..........................88
12
LIST OF FIGURES
Figure page
1-1 Hierarchy of Social Emotional Ability Development ........................................................20
2-1 Synthesis of the Social Emotional Ability Model and the Sociocultural Theory of
Development ......................................................................................................................38
4-1 Scree Plot of factor analyses component eigenvalues .......................................................79
4-2 Comparison of the factor structure of the SEAD, the principal components extracted
in the EFA, and the factor structure retained by the CFA .................................................80

13
Abstract of Thesis Presented to the
University of Florida Graduate School
in Partial Fulfillment of the
Requirements for the Degree of Master of Science
VALIDATING THE HIERARCHY OF SOCIAL EMOTIONAL ABILITY DEVELOPMENT
By
Jonathan Anderson
December 2016
Chair: Victor Harris
Major: Family, Youth and Community Sciences
This study introduced and validated a new theoretical model that explains processes
inherent to the development of the ability to interact with others, the Hierarchy of Social
Emotional Ability Development (SEAD). This study provided justification from the literature
for the structure and constructs of the SEAD and a synthesis between the dimensions and
constructs of the SEAD and the constructs of Vygotsky’s Sociocultural Theory of Development.
The study also provided justification for the structure and constructs of the SEAD by
quantification of Social Emotional Ability through the Social Emotional Ability Inventory
(SEAI) instrument, which was developed as a part of this study. The SEAI furnished reliable
and valid incremental measurement of social emotional ability for individuals, and differentiated
the theoretical constructs proposed by the SEAD. Following future development and refinement,
this study holds important implications for future development for individuals, practitioners,
educators and researchers. Individuals might use results from the SEAI for improving their
social interactions and life satisfaction. Practitioners might use a more fully developed SEAI
instrument as a diagnostic tool, and might use the SEAD model as a guide for helping clients
improve social interactions and life satisfaction. Educators might use the model to develop
curricula to improve student development, and for parental education so that parents might better

14
prepare their children to become more productive members of society. Researchers might use
the model and the instrument to more completely investigate and explain the relationship
between social interaction and life satisfaction.
Keywords: Emotional ability, life satisfaction, social ability, social ability development, social
emotional ability development, social engagement, social interaction
15
CHAPTER 1
INTRODUCTION
Social emotional ability is defined as a unique skillset of emotional, cognitive, and
behavioral ability that enables individuals to intentionally and consciously modulate their
emotional experiences and adaptively choose appropriate behaviors for the purpose of
facilitating social engagement (Broderick & Jennings, 2012). Social engagement has been a
subject of interest since 1920, when E. L. Thorndike introduced the concepts of social
intelligence and emotional intelligence (Cherniss, Extein, Goleman, & Weissberg, 2006).
Maslow’s seminal work, Hierarchy of Needs (1954), asserts that social engagement—
connectedness—is a basic human need (Huitt, 2007). Research suggests that social engagement
is an important predictor of well-being, life satisfaction, and happiness (Baumeister, Vohs,
Aaker, & Garbinsky 2013; Cialdini & Patrick, 2009; Lambert et al., 2010). Notably, both social
intelligence and emotional intelligence are defined as abilities that impact the quality of social
engagement. Thorndike (1920) defines social intelligence as the ability to understand others and
adaptively manage social engagement (Kihlstrom & Cantor, 2011). Wang, et al. (2012) defines
emotional intelligence as the ability to use emotions to improve social engagement.
Purpose
Social emotional ability is important because of the impact that quality of social
engagement exerts on individuals as well as people those individuals interact with. While social
and emotional intelligence are well represented in the body of knowledge, there is a paucity of
research concerning individual processes inherent to the development of social emotional ability.
The purpose of this study was to introduce and validate a new theoretical model that addresses
these processes, the Hierarchy of Social Emotional Ability Development (Harris & Anderson,
2015). This study expands the body of knowledge regarding the developmental processes of

16
social emotional ability by validating the constructs of the SEAD through linkages with existing
literature, and by the development of a valid, reliable instrument—the Social Emotional Ability
Inventory (SEAI)—capable of measuring levels of social emotional ability, validating the
constructs of the model, and providing incremental measurements that discriminate the
constructs of the SEAD.
The Social Emotional Ability Development Model
Introduction
The Social Emotional Ability Development (SEAD) model (Harris & Anderson, 2015)
presented a hierarchal progression of eight discrete social-emotional abilities defined within
three theoretical summative constructs (Figure 1-1). The first and foundational summary
construct is emotional clarity, which includes the following social emotional abilities: the ability
to identify; the ability to understand; and the ability to accept emotions. The second and central
summary construct, emotional integration, also includes three social emotional abilities: the
ability to interpret emotional messages; the ability to respond to one’s emotions; and the ability
to regulate emotions. The third and highest ordered summary construct, social emotional
integration, includes two social emotional abilities: the ability to respond sympathetically to
others and the ability to respond empathetically to others. The model articulates that higher
levels of social emotional ability and higher levels of empathetic response in particular, result in
more positive social engagement experiences (Allemand, Steiger, & Fend 2015; Lopes et al.,
2004). This articulation is vital to understanding social emotional ability because social
engagement is a predictor of well-being, life satisfaction, and happiness (Baumeister, Vohs,
Aaker, & Garbinsky 2013; Cialdini & Patrick, 2009; Lambert et al., 2010).
It is important to note that the SEAD is concerned with the development of higher-level
emotion-supported skills, and does not address human development processes. Moreover, the

17
SEAD model presupposes varying levels of emotional development, and does not suggest that
development of social emotional ability coincides with, or is sequentially related to, human
emotional development. For example, trait sympathy begins forming in infancy (Kienbaum,
2014), but higher levels of sympathetic abilities develop much later (Eisenberg, Cumberland,
Guthrie, Murphy, & Shepard, 2005).
Assumptions
Assumptions of the SEAD include the following: a) Development of social emotional
ability occurs in a linear progression facilitated by interactions between cognitive capacity and
environmental circumstances; b) In a manner similar to Maslow’s Hierarchy of Needs (Huitt,
2007), components of the SEAD model are hierarchal and independent in that changes in
abilities in any component can occur independently of other components; c) Changes in any
ability may also influence abilities of all other components, which could impact overall levels of
social emotional ability.
Theoretical Framework
Vygotsky’s Sociocultural Theory of Development (SCTD) (1978) informs this study.
The author asserts that the SCTD provides parsimonious, logical, clear constructs that encompass
pertinent aspects of cognitive, emotional, and social development without interjecting
unnecessary complexity.
Definitions
Researchers define important concepts and constructs differently, and the terms found in
the literature are often used to define more than one subject. Therefore, constructs and concepts
in this study are defined as follows:
Accept emotions: The cognitive ability to accept and embrace emotions.
18
Content validity: Assurance that items in a measurement instrument measure what they
are intended to measure.
Discriminatory power: The capacity of an item in an instrument to differentiate among
groups of respondents.
Dimension: Definitions found in the literature for this term lack consistency. For
example, some researchers use the word dimension to define a theoretical construct. For
the purposes of this study, a dimension is a characteristic of a theoretical construct that
lends depth to the theoretical definition and measurement of the construct. A construct
may consist of one or more dimensions, and multiple items from multiple dimensions
may be used within one scale in order to better capture the full range and meaning of the
construct.
Discriminant validity: The strength with which a posited relationship among concepts
actually exists.
Emotional clarity: The latent concept that represents the ability to identify, understand,
and accept one’s emotional experiences.
Emotional integration: The use of cognition and emotion to develop various modes of
motivation, inspiration and creativity as tools in decision-making and behavioral action.
Emotional management: The ability to intentionally and consciously modulate emotional
experiences.
Emotional reactivity: An individual’s in-the-moment reaction to emotional stimuli; a
phenomenon that can be extremely difficult to attenuate in the moment. For example, the
initial reaction to emotional pain is usually reactive in nature.
Emotional response: The ability to cognitively integrate emotional meaning into the
decision-making process to help choose contextually appropriate behaviors.
Empathy: The ability to participate in what others are feeling, including the
comprehension, participation in, and vicarious experience of the emotional states of
others
Empathetic response: The ability to participate in what others are feeling, including the
comprehension, participation in, and vicarious experience of the emotional states of
others, accompanied by the ability to participate empathetically with others in social
interaction.
Identify emotions: The latent concept representing the ability to recognize, name and
label emotions, and differentiate emotional states.
Internalize: The process of incorporating attitudes or behavior into one’s nature through
learning or assimilation.

19
Interpret emotions: The ability to determine the meaning of emotional messages.
Level of current ability: The level of an individual’s cognitive, social, and emotional
ability achieved at a given point in time across the lifespan.
Reliability: The level of consistency and stability demonstrated by a measurement
instrument.
Scaffolding: A progressive process whereby lessons are provided through a sequence of
thoughtful, incremental steps of guidance or instruction from more knowledgeable others.
Scaffolding supports the learning of increasingly more complex tasks.
Social emotional ability: A unique skillset of emotional, cognitive, and behavioral ability
that enables individuals to intentionally and consciously modulate their emotional
experiences and adaptively choose appropriate behaviors for the purpose of facilitating
social engagement.
Social emotional integration: The integration of cognition, emotion, and adaptive social
interaction behaviors with others through sympathetic and empathetic responses.
Sociocultural Theory of Development: A theoretical framework proposed by Vygotsky
(1978) that describes learning as a social process and posits that social and cultural
interaction plays a fundamental role in the development of cognition.
Sympathy: Concern resulting from the emotional distress of others, accompanied by the
desire to alleviate negative feelings caused by other’s distress.
Sympathetic response: The ability to interact with others in response to the emotion,
sympathy.
Understand emotions: The ability to comprehend the meaning of emotions and to know
their nature and intensity.
Variable: For the purposes of this study, a variable is defined as a multiple-item scale
used to measure either a theoretical construct, or dimensions of a theoretical construct.
Zone of proximal development: A collection of tasks dependent upon an individual’s
inability to complete certain tasks, conceptualized as an area. Tasks that are just outside
the grasp of one’s level of current abilities which can be accomplished with the support,
instruction, guidance, and imitative modeling of more knowledgeable others are said to
be in one’s zone of proximal development.

20
Figure 1-1. Hierarchy of Social Emotional Ability Development

21
CHAPTER 2
REVIEW OF THE LITERATURE
Construct Justification
Emotional Clarity
Emotional clarity is the foundational construct of the SEAD. Emotional clarity is defined
as the ability to identify, understand, and accept one’s emotional experiences (Boden, Thompson,
Dizen, Berenbaum, & Baker, 2013; Flynn & Rudolph, 2010). Emotional clarity supports
development of more sophisticated social emotional abilities. According to Nolen-Hoeksema
(2012), people with higher scores on measures of emotional clarity also developed higher levels
of emotional ability to adaptively modulate emotions. Flynn and Rudolph (2010) posited that
emotional clarity supports later development of important emotional skills such as the ability to
understand emotional displays in others and emotional regulation capabilities in oneself. High
levels of emotional clarity are positively related to subjective well-being and adaptive
explanatory styles (Flynn & Rudolph, 2010). Conversely, people with lower levels of the ability
to understand their emotions are believed to expend greater effort managing emotions and have
more difficulty with goal-oriented behaviors (Flynn & Rudolph, 2010). Furthermore, lower
levels of emotional clarity are associated with contextually inappropriate stress responses and
reduced adaptive stress responses (Gohm, Corser, & Dalsky, 2005).
Identifying emotions
The social emotional ability to identify emotions is the first of three dimensions within
the summary construct, emotional clarity. The ability to identify emotions underpins
development of all social emotional ability, and is defined as the ability to recognize, name and
label emotions, and differentiate emotional states (Boden, Thompson, Dizen, Berenbaum, &
Baker, 2013). According to Bar-On and Parker (2000), identifying emotions is a learning

22
process begun in infancy, when perceptions of emotional signals are undifferentiated. The
ability to differentiate emotional signals and identify emotions normatively increases with
developmentally appropriate experiences. However, differentiated emotional expressions can be
quite subtle (Ekman, 2003). In addition, lower ability levels in the area of emotional processing
can have adverse consequences on social decision-making (Bar-On & Parker, 2000).
Understanding emotions
The social emotional ability to understand emotions is the second dimension of the
summary construct, emotional clarity. Understanding emotions is the ability to comprehend the
meaning of emotions and to know their nature and intensity (Helm, 2009). The ability to identify
emotions is integral to the ability to understand emotions. According to Bar-On and Parker
(2000), the ability to understand emotions begins to develop in childhood. Children who are
given clear, non-ambiguous emotional messages generally develop a greater understanding of the
nature of emotional expressions than children who do not. Bar-On and Parker (2000) posited
that infants react to changes in their mothers’ emotional expressions according to its intensity
and their own understanding of the intended emotion. This ability has important implications for
children as they grow and mature into adulthood, as the ability to understand emotions is
essential for emotional health (Bar-On & Parker, 2000). Children who have difficulty
understanding emotions are at risk for developing poor social interactions and impeded
friendship formation (Spackman, Fujiki, & Brinton, 2006). Brackett and Salovey (2006)
proposed that understanding emotions requires cognitive appraisal of emotions—an ability that
supports development of the ability to interpret emotions.
Accepting emotions
The social emotional ability to accept emotions is the third dimension of the summary
construct, emotional clarity. Emotional acceptance is the cognitive ability to accept and embrace
23
emotions, as opposed to the denial or avoidance of emotional experiences (Greenberg, 2004).
Gratz, Bornovalova, Delany-Brumsey, Nick, and Lejuez, (2007) posited that the acceptance or
avoidance of one’s emotions is rooted in experiences encountered in childhood. Greenberg
(2004) suggests that the ability to accept emotions is fundamental to the development of
emotional clarity. Acceptance of all emotions—particularly the acceptance of negative
emotions—is healthy, useful, and adaptive (Shallcross, Troy, Boland, & Mauss, 2010).
Development of the ability to accept emotions is greatly influenced by social experience, and is
dependent upon abilities to identify and understand emotional expressions (Ekman, 2003).
Correspondingly, the ability to accept one’s emotions assumes that emotions are neither good nor
bad. The ability to understand emotions facilitates development of the ability to accept
emotions. Shallcross, Troy, Boland, and Mauss (2010) suggested that some individuals have not
fully developed the ability to accept emotions, which often results in unhealthy emotional
processes. For instance, secondary emotions may be substituted for primary emotions in an
attempt to avoid experiencing emotions perceived as uncomfortable (Ekman, 2003). Both anger
and lust are often termed “secondary emotions” because they are preceded by primary emotions
such as fear, pain, jealousy, frustration, and perceptions of blocked goals (Friel & Friel, 1995).
Anger can quickly appear in some individuals as a substitute for fear, pain, or agony. Similarly,
lust may be substituted for feelings such as tenderness, safety, closeness, and sensuality (Friel &
Friel, 1995). Often, individuals will experience emotional stimuli such as hurt, anger, jealousy,
or desire, and deny these feelings and instead respond reflexively in counterproductive ways
(Ekman, 2003). The ability to recognize the range of perceived “negative or uncomfortable
emotions” as being healthy and socially useful is an important indicator of social emotional
ability development (Harris & Anderson, 2015).

24
Emotional Integration
Emotional integration is the second of three summary constructs of the SEAD.
Emotional integration is defined as the use of cognition and emotion to develop various modes of
motivation, inspiration and creativity as tools in decision-making and behavioral action. The
cognitive processes of emotional clarity support development of emotional integration.
According to Gu, Liu, Van Dam, Hof, and Fan (2013), all complex human behaviors are
determined by the integration of emotional and cognitive processes.
Interpret emotions
The ability to interpret emotions is the first of three dimensions within the summary
construct, emotional integration. The ability to cognitively interpret emotional messages (listen
to emotions) enables individuals to accurately determine what their emotions are communicating
(Matsumoto, 2009). The ability to understand and accept emotions facilitates development of
the ability to interpret the meaning of emotional messages. It is possible to have a basic
understanding of emotions and not to accept certain emotions, thereby limiting development of
the ability to determine emotional meaning (Ekman, 2003).
Emotional response
The social emotional ability to respond to emotions is the second dimension of the
summary construct, emotional integration. Emotional response is defined as the ability to
cognitively integrate emotional meaning into the decision-making process to help choose
contextually appropriate behaviors (Gottman, Katz, & Hooven, 1997). It is important to not
confuse the concept of emotional response with emotional reactivity, which is a phenomenon
that can be extremely difficult to attenuate in the moment (Williams, Bargh, Nocera, & Gray,
2009). Emotional response is concerned with behavioral decisions made over time. Decision-
making is a cognitive process that depends on emotional signals (Matsumoto, 2009), therefore,

25
the ability to accurately interpret emotional meaning supports development of the ability to
appropriately respond to emotions. Individuals with greater levels of social emotional abilities
tend to “listen” to their emotions and are, therefore, more likely to trust what their emotions
indicate. As a result, they are more able to use emotions to facilitate thought and implement
context-driven behavioral responses (Ekman, 2003). Accurate emotional interpretation supports
healthy decision-making and contextually appropriate behavioral response. However, it is
possible to identify emotions but not to accept them, thereby limiting the ability to appropriately
interpret and respond; and, decision-making without an accurate interpretation of what emotions
indicate can lead to profoundly negative social outcomes (Bar-On & Parker, 2000).
Emotional regulation
The social emotional ability to regulate emotions is the third dimension of the summary
construct, emotional integration. Emotional regulation is defined as the ability to intentionally
and consciously modulate emotional experiences (Chapman, Dixon-Gordon, & Walters, 2011).
Emotional regulation begins in childhood (Denham, Zinsser, & Brown, 2012), and the ability to
manage emotions develops across the lifespan. Effective emotional regulation is an important
predictor of successful social interaction (Ivcevic & Brackett, 2014). Development of the ability
to manage emotions is primarily facilitated through the ability to appropriately respond to
emotions. Components of emotional regulation include managing distress, controlling emotional
expression, setting appropriate priorities, and sustaining motivation (Broderick & Jennings,
2012). There is an abundance of evidence in the literature regarding the importance of emotional
regulation (Cohen, 2012; Ivcevic & Brackett, 2014; Lopes, Salovey, Côté, & Beers, 2005; Silk et
al., 2003). According to Silk et al. (2003), emotional regulation can improve mental health,
improve personal relationships, and reduce the risk for psychopathology. Individuals who score
high on emotional regulation skills tend to view themselves as more interpersonally sensitive and

26
pro-social (Lopes, Salovey, Côté, & Beers, 2005). Additionally, Denham, Bassett, and Wyatt
(2010) asserted that understanding emotions is positively associated with the management of
negative emotions. Broderick and Jennings (2012) posited that emotional dysregulation is
responsible for a wide range of social, emotional, and behavioral problems. Emotional
dysregulation has been shown to reduce social interactions and promote aggressive coping styles.
Aggressive coping styles are highly correlated with deficits in emotional regulation and have
been shown to prolong and heighten conflict (Wilton, Craig, & Pepler, 2000).
Social Emotional Integration
Social emotional integration is the SEAD’s third and highest ordered summary construct.
Social emotional integration is defined as the integration of cognition, emotion, and adaptive
social interaction behaviors with others through sympathetic and empathetic responses (Singer &
Lamm, 2009). These interactions facilitate improved social engagement (Domitrovich, Cortes,
& Greenberg, 2007). Improved social engagement is an important predictor of well-being, life
satisfaction, and happiness (Baumeister, Vohs, Aaker, & Garbinsky 2013; Cialdini & Patrick,
2009; Lambert et al., 2010). Development of social emotional integration is supported by
emotional clarity and emotional integration.
Sympathetic response
The social emotional ability to respond to sympathetic emotion is the first of two
dimensions within the summary construct, social emotional integration. Sympathetic response is
the ability to interact with others through thoughtful behavioral reaction to the emotion,
sympathy. Sympathy is defined as a concern brought forth as a result of the comprehension of
the emotional distress of others, accompanied by a desire to alleviate the other’s distress
(Eisenberg, 2000). The definition of sympathy also includes the concern or apprehension that
may be felt by a sympathizer as a consequence of the sympathizer’s boundaries being violated by
27
others who may be emotionally distressed or disturbed (Eisenberg, 2000). Extreme neediness,
lying, manipulation, inappropriate touching and expressions, stalking, etc. may all prompt
apprehension on the part of the sympathizer and the resultant need to set, establish, and maintain
clear and healthy social and emotional boundaries. When experiencing the concern of
apprehensive sympathy, the sympathetic desire to help reduce the other’s distress is still evident,
but may be reduced in accordance with the level of the boundary violation. Both the concerns of
comprehension and apprehension are integral to understanding sympathetic response.
Sympathy begins in early childhood. For example, a mother’s support can serve as a
protective factor in the development of sympathy by buffering children against unsupportive
relationships (Laible & Carlo, 2004). Children normatively begin to develop sympathetic
responses through imitative learning from their primary caretakers’ ability to sympathize.
Research indicates that adolescents who score high in trait sympathy also score high in moral
judgment, which is known to motivate pro-social behavior (Eisenberg, Zhou, & Koller, 2001).
The ability to sympathetically respond to others is fundamental to the development of higher
levels of social emotional ability, as it represents the initial integration of social and emotional
abilities as one responds to sympathetic emotions and strives to help lessen effects of distressing
emotional states in others. The development of sympathetic response ability is supported by the
preceding constructs of the SEAD, with the primary construct emotional regulation being
particularly relevant. Sympathetic response represents the initial social emotional ability that
integrates cognition, emotion, and social behavior.
Empathetic response
The social emotional ability to respond empathetically to others is the second dimension
of the construct, social emotional integration. Empathy is defined as the ability to participate in
what others are feeling and includes the comprehension, participation in, and vicarious

28
experience of the emotional states of others (Eisenberg, 2000; Prinz, 2011). Empathetic response
is defined as the ability to participate empathetically with others in social interaction. Decety
and Lamm (2006) suggested that empathy can be conceptualized as social interaction wherein
one person shares the feelings of an other; empathetic interaction with other individuals plays a
central role in social interaction. Higher levels of empathy are related to less conflict
engagement and more positive problem solving skills, which suggests that people who are more
emotionally responsive to others when faced with conflict may inhibit antisocial responses
(Wied, Branje, & Meeus, 2007). The abilities associated with emotional clarity and emotional
integration, and particularly the social emotional ability to respond sympathetically to others,
support development of the ability to respond to others empathetically. Empathetic response is
the highest order of social emotional ability, and unifies each of the other components of the
SEAD into a holistic and comprehensive ability to negotiate social-emotional states and contexts
effectively, and can be thought of as the capstone of social emotional ability development (Harris
& Anderson, 2015).
Vygotsky’s Sociocultural Theory of Development
Assumptions
The major assumptions of sociocultural theory of development are: a) learning precedes
development and results from interactions between cultural and social environments; b) learning
within these environments is dependent upon the presence of specific cognitive abilities, and is
guided through instruction from a more knowledgeable other; and, c) language constructs and
transforms development through interactive guided participation (Kraker, 2000; Waters, 2013).
Concepts
The major concepts of the sociocultural theory of development are: a) level of current
ability; b) zone of proximal development; and, c) scaffolding (Berger & Thompson, 1991; Fine
29
& Fincham, 2013; Waters, 2013). Level of current ability is defined as the level of an
individual’s cognitive, social, and emotional ability achieved at a given point in time across the
lifespan. This is the dynamic area of knowledge and ability that expands as individuals learn and
grow (Waters, 2013). Zone of proximal development is defined as a collection of tasks
dependent upon an individual’s inability to complete the tasks, conceptualized as an area. Tasks
that are just outside the grasp of one’s level of current abilities which can be accomplished with
the support, instruction, guidance, and imitative modeling of more knowledgeable others are said
to be in one’s Zone of Proximal Development (Waters, 2013). Scaffolding is defined as the
process whereby lessons are provided through a sequence of thoughtful, incremental steps of
guidance, instruction or imitative modeling from more knowledgeable others. Scaffolding
supports the learning of more complex tasks in one’s zone of proximal development (Fine &
Fincham, 2013). Examples of scaffolding include learning to ride a bicycle, and language
acquisition through various interactions such as storytelling. Scaffolding, or laddering, is
important because it explains pathways for the inclusion of complex and abstract abilities into an
individual’s level of current ability (Berger & Thompson, 1991; Pentimonti & Justice, 2010). A
good illustration of the scaffolding process is when an individual learns through instruction the
lower math skill, counting (Waters, 2013). The skill to count is thereby assimilated from one’s
zone of proximal development into one’s level of current abilities. Assimilation of this
knowledge results in the inclusion of slightly more complex lower math skills such as adding and
subtracting into one’s zone of proximal development. The assimilation of ability to add and
subtract—which would not be possible without the ability to count—further expands the
individual’s level of current abilities, and so forth (Waters, 2013).
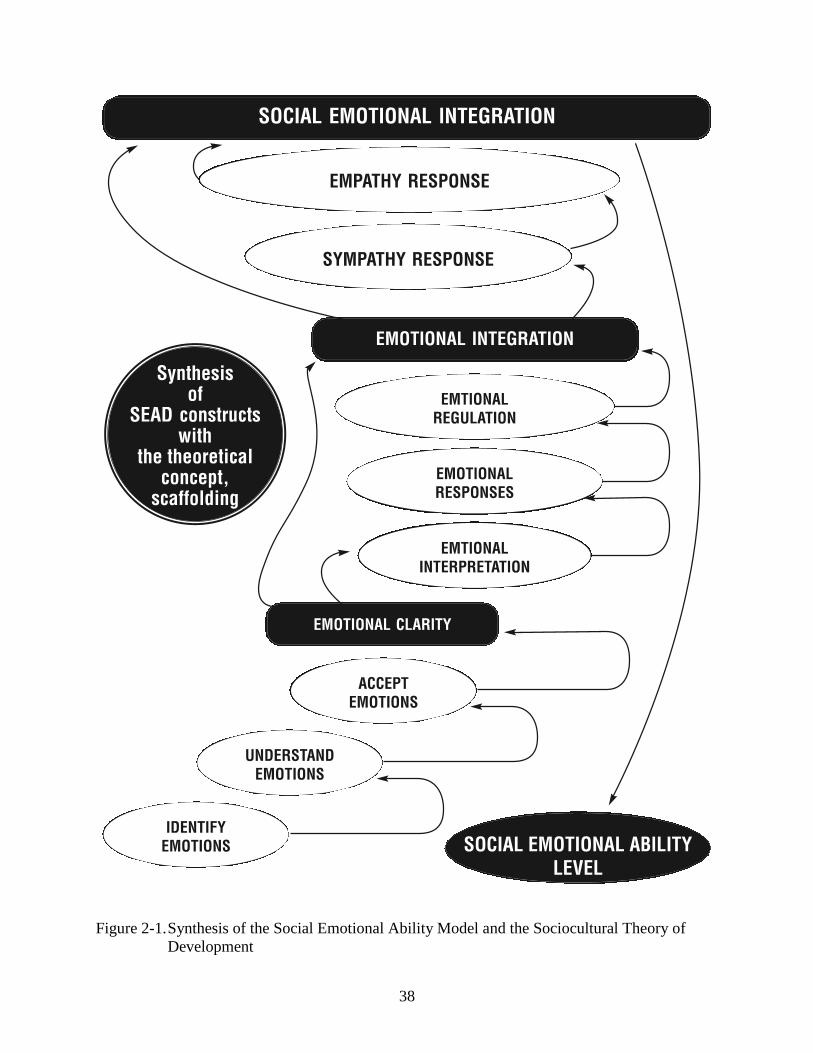
Theoretical Synthesis
This exploratory study investigates theoretical and developmental processes of

30
emotionally supported abilities critical to effective social interaction, as differentiated by the
Hierarchy of Social Emotional Ability Development model. This new theoretical model presents
a progression of eight discrete social-emotional abilities. These abilities improve as levels of
emotional and cognitive capacity interact with environmental factors (Harris & Anderson, 2015).
As a theory concerned with learning and development across the lifespan, Sociocultural Theory
of Development (SCDT) provides justification for constructs of the SEAD (Figure 2-1).
A review of the literature supports the SCDT as guidance for this study, particularly in
light of constructs of SEAD being dependent upon interactions between higher levels of
emotional and cognitive ability, and the integration of emotional messages, cognition and
behavior. John-Steiner and Mahn (1996) posited that the sociocultural perspective provides
appropriate explanation for processes of learning and development of social emotional skills.
This perspective views learning as a progression from elementary mental functioning to higher,
more complex abstract mental functioning provided through interactions between emotional and
cognitive capacity, and thousands of social experiences (John-Steiner & Mahn, 1996).
Furthermore, Berger and Thompson (1991) posited that the SCTD can be used to explain social,
emotional, and cognitive skills development. As individuals expand their social and emotional
skills beyond existing levels of competence through supportive and imitative instruction, they
complete tasks within their “zone of proximal development,” which is the area of ability just
beyond the reach of one’s existing means and strategies. As tasks are completed, learning occurs
and is internalized, providing cognitive social and emotional skills development. Internalization
is defined as the process of incorporating attitudes or behavior into one's nature through learning
or assimilation. Berger and Thompson (1991) suggested that a series of progressively complex
tasks completed in this manner, referred to as scaffolding, facilitates the ability to learn and

31
internalize progressively more complex cognitive, social, and emotional skills (Pentimonti &
Justice, 2010). French (2007) and John-Steiner and Mahn (1996) suggested that development of
supportive social interaction holds important implications for social and emotional ability
development, as new knowledge is created when individuals internalize learning that is
appropriated through social participation. Social-emotional abilities are rooted in this process of
emotional and social development, and subsequent interactions between cognitive capacity and
environmental factors.
Emotional Clarity
Emotional clarity, the foundational summary construct of the SEAD, can best be
explained through this scaffolding process of Sociocultural Theory of Development. The
concept, emotional clarity, is defined in the literature and represented in the SEAD as the ability
to identify, understand, and accept one’s emotional experiences (Boden et al., 2013; Flynn &
Rudolph, 2010). John-Steiner and Mahn (1996) suggested that building knowledge is a process
that begins with elementary mental functioning, which facilitates increasingly complex mental
functioning through the scaffolding process of SCTD (Pentimonti & Justice, 2010). The
summary construct of the SEAD, emotional clarity, represents the progression from the less
complex social emotional ability to identify, to the more complex social emotional ability to
understand, to the complex social emotional ability to accept one’s emotions. Waters (2013)
suggested that the nature of this progression exactly parallels concepts of the Sociocultural
Theory of Development. This makes sense, as the ability to recognize, name, and label one’s
emotions is a comparatively elementary cognitive function necessary to the ability to understand
one’s emotions. Clearly, understanding one’s emotions is a slightly more complex function than
the ability to identify emotions, and development of the ability to understand emotions without
first having the ability to identify emotions is not possible, much like learning to solve math

32
problems is not possible without first learning to count. Therefore, the level of development of
one’s ability to understand emotions would be partially dependent upon the level of one’s ability
to identify emotions. It also makes sense that the cognitive ability to accept and embrace
emotions is comparatively more abstract and slightly more complex than the abilities to identify
and understand emotions. Thus, this study posits that the summary construct, emotional clarity,
can best be explained by the scaffolding effects asserted by the SCTD and how individual levels
of cognitive social emotional skills inherent in emotional clarity are dependent upon the levels of
development of progressively more complex abilities to identify, understand, and accept one’s
emotions.
Emotional Integration
Emotional integration, the second summary construct of the SEAD, is also best explained
through the scaffolding process of Sociocultural Theory of Development (Pentimonti & Justice,
2010). The concept, emotional integration, is defined in the literature and the SEAD as the
ability to integrate emotion with cognition and behavior through emotional interpretation,
emotional response, and emotional management (Ochsner, Silvers, & Buhle, 2012). This
sequencing of the abilities to cognitively interpret and incorporate emotional meaning into the
decision-making and behavioral selection process represents progressively more complex
scaffolding that integrates emotion in support of thought, and results in development of the
highly complex and abstract social ability to manage emotions through the integration of
emotion, thought and behavioral processes (Pentimonti & Justice, 2010). According to Gu, Liu,
Van Dam, Hof, and Fan (2013), all complex human behaviors are determined by the integration
of emotional and cognitive processes. Ochsner, Silvers, and Buhle (2012) suggested the
integration of emotion, thought and behavior is deployed in explicit strategies to regulate one’s
emotions through cognitive selection from an array of behavioral choices. There is an

33
abundance of evidence in the literature regarding the importance of emotional management and
its impact on social engagement (Cohen, 2012; Ivcevic & Brackett, 2014; Lopes, Salovey, Côté,
& Beers, 2005; Silk et al., 2003).
Ochsner, Silvers, and Buhle (2012) suggests a progressive integration of emotion,
thought and behavior that parallels the development of higher mental processes described by
concepts of the Sociocultural Theory of Development. This is a logical progression. The ability
to cognitively interpret emotional meaning is a comparatively complex high mental function
necessary to development of the ability to integrate emotion with thought in support of the highly
complex and abstract decision-making processes. And it is clear that integrating emotion and
thought into the decision-making process to assist in the choice of contextually appropriate
behaviors is a more complex and abstract function than the ability to integrate emotion with
thought to assist in emotional interpretation. Similarly, the development of the ability to respond
to emotions without first having the ability to interpret emotions also does not make sense.
Therefore, the level of development of one’s ability to respond to emotions would be partially
dependent upon the level of one’s ability to interpret emotions. Logically, the highly complex
ability to respond to and manage emotions is comparatively more complex and abstract than the
abilities to interpret and respond to emotional messages. Thus, this study posited that the
summary construct, emotional integration, can best be explained by the scaffolding effects
asserted by the SCTD, and that individual levels of development of emotional integration
abilities are dependent upon the levels of development of progressively more complex abilities to
interpret, respond to emotions, and regulate emotions.
Social Emotional Integration
Social emotional integration, the highest ordered of the three summary constructs of the
Social Emotional Ability Development model, can also be explained through the scaffolding

34
process of the Sociocultural Theory of Development. The concept, social emotional integration,
is defined in the literature and the SEAD as the integration of cognition, emotion, and adaptive
social interaction behavior with others through sympathetic and empathetic responses (Singer &
Lamm, 2009). The sequencing of the ability to incorporate emotional integration with social
interactions with others through sympathetic response represents progressively more complex
scaffolding that results in development of the very complex and abstract social emotional ability
to interact with others through empathetic responses. According to Decety and Michalska,
(2010), sympathetic and empathetic responses are the basis for most social interaction, and
empathy is among the highest ordered emotions. Decety and Lamm (2006) suggested that
empathy could be conceptualized as social interaction wherein one person shares the feelings of
another person, with empathetic interaction playing a central role in social interaction.
Moreover, levels of empathic response are positively related to purposeful emotional regulation
(Decety & Michalska, 2010). There is an abundance of evidence in the literature regarding the
importance of empathetic ability and its impact on social engagement (Decety and Lamm, 2006;
Singer & Lamm, 2009; Wied, Branje, & Meeus, 2007).
Decety and Lamm (2006) showed a progressive relationship between sympathetic
response and empathetic response that parallels the development of higher mental processes
described by concepts of the Sociocultural Theory of Development. This progression makes
sense, as sympathetic response occurs as a result of experiencing the emotion, sympathy; and the
resulting social interaction is limited to attempts to make the person in distress feel better
(Eisenberg, 2000). Empathetic response, on the other hand, is far more complex, as it involves
complex interactions and behaviors that address many emotions in others (Decety & Lamm,
2006). The ability to respond sympathetically is a complex, highly abstract mental function

35
necessary to development of the ability to respond empathetically. It makes sense that the
logical integration of emotion, thought, and external behavior into the ability to respond
empathetically to the emotions of others is a far more complex and higher abstract function than
the ability to integrate emotion, thought, and external behavior into the ability to respond
sympathetically to the emotions of others. Development of the ability to respond empathetically
to others without first having the ability to respond sympathetically to others would not be
possible. Therefore, the level of development of one’s ability to respond to others empathetically
would be partially dependent upon one’s ability to respond sympathetically. It is apparent that
the highly complex ability to respond empathetically to the emotions of others is far more
complex and abstract than the abilities to respond to others on the basis of one’s own
sympathetic feelings. Thus, this study posited that the summary construct, social emotional
integration, can best be explained by the scaffolding effects asserted by the SCTD, and that
individual levels of social emotional integration abilities are dependent upon the levels of
development of progressively more complex abilities to respond to the emotions of others
sympathetically and the ability to respond to the emotions of others empathetically.
Summary
Even though social interaction is a critical building block of civilization itself, little exists
in the body of knowledge that explains the processes at play regarding how individuals develop
the social emotional ability necessary to interact effectively with others. The purpose of the
present study was to expand the body of knowledge regarding developmental processes of social
emotional ability among individuals by providing justification from the body of knowledge for
constructs of the new theoretical model, the Hierarchy of Social Emotional Ability Development.
This current study was guided by the theoretical framework of Vygotsky’s Sociocultural
Theory of Development, and included a review of the literature that justifies the validity of the

36
SEAD constructs. It also included a synthesis between constructs of the Sociocultural Theory of
Development and constructs of the SEAD theoretical model.
The summary constructs of the SEAD have been shown to be justifiable in both the body
of knowledge and through theoretical linkages; and the hierarchal progression of the SEAD is
logical. The first summary construct, emotional clarity, is comprised of the lower-level cognitive
abilities to identify, understand and accept emotions. It makes sense that these three constructs
would be defined within the summary construct, emotional clarity. It is also logical that these
abilities are progressive in that it would not be possible that the ability to accept emotions could
be fully developed without first having the ability to understand emotions; and it is apparent that
the ability to understand emotions is dependent upon first attaining the ability to identify
emotions.
The next summary construct, emotional integration, is comprised of the more complex
abilities to interpret, respond to, and regulate emotions. These abilities are more complex in that
they progressively integrate cognition, emotion and behavior. It stands to reason that these three
abilities are defined within the summary construct, emotional integration. It also makes sense
that these abilities are progressive in that it is not possible that the ability to regulate emotions
could be fully developed without first having the ability to respond to emotions; and logically,
the ability to respond to emotions is dependent upon the ability to interpret emotional meaning.
The third and highest ordered summary construct, social emotional integration, is
comprised of the progressively more complex and abstract ability to respond sympathetically to
others with the goal of validation and making that person feel better, and the even more complex
and abstract ability to respond empathetically with others with a wide variety of complex and
abstract emotionally based behaviors. Social emotional integration is the highest ordered

37
summary construct because it has been shown that empathy and sympathy are responsible for
much of healthy human social interaction (Singer & Lamm, 2009). This makes sense, as
sympathy and empathy are ways of connecting with others through caring concern. And it
stands to reason that individuals are attracted to those that express genuine concern for them.
Research Questions
This exploratory study was driven by the following research questions: 1). What are the
justifiable constructs of social emotional ability? 2). How can the constructs of the SEAD be
quantified in a valid and reliable survey instrument? To explore potential answers to the first
research question, the researcher justified the eight dimensions of the SEAD by exploring
supportive research from the literature, and provided linkages between existing theoretical
frameworks and the SEAD constructs. To explore potential answers to the second research
questions, the researcher developed the Social Emotional Ability Inventory instrument to provide
reliable and valid incremental measurement of social emotional ability for individuals, and
differentiate the theoretical constructs proposed by the SEAD model.
38
Figure 2-1. Synthesis of the Social Emotional Ability Model and the Sociocultural Theory of
Development

39
CHAPTER 3
METHODOLOGY
Research Design
The present quantitative research was an exploratory, non-random sample study designed
to answer two research questions: 1). What are the justifiable constructs of social emotional
ability? 2). How can the constructs of the SEAD be qualified in a valid and reliable survey
instrument? The study design was cross-sectional, which is appropriate for this study; data were
collected from each participant at one point in time in order to collect quantitative data for two or
more variables that were analyzed to detect patterns of association (Bryman, 2012). In order to
answer the research questions, the body of knowledge was reviewed and examined to provide
construct and structure justification for the theoretical Hierarchy of Social Emotional Ability
Development Model; and the SEAI instrument was constructed to provide reliable and valid
incremental measurement of social emotional ability for individuals, and to differentiate the
theoretical constructs of the SEAD.
Sample
The theoretical population was typical college students. The accessible population was
college students attending the University of Florida. The sampling method was non-random
volunteer. Random sampling was not employed as there were budget and time constraints, and
random sampling is not necessary for exploratory studies where the goal is not generalization
(Baker et el., 2013).
Two hundred thirty-six respondents were recruited from classes at the University of
Florida. Cleaning of the data begun with an inspection for completeness of each case; four
respondents failed to answer multiple items sequentially, and these cases were dropped. The
data were then inspected for missing data and outliers with IBM’s Statistical Package for the

40
Social Sciences (SPSS). Five cases were found that contained between one and four data points
with missing data, and four cases were found that contained univariate outliers. These cases
were deleted listwise. As there were relatively few cases with missing data or outliers, imputing
data replacement techniques were not employed and an inspection for the randomness of missing
data was not necessary (Williams, 2015).
After cleaning, the full sample size was 223 (N = 223). The sample was composed of
191 females and 32 males ranging from 19 to 32 years of age, with a mean age of 21 (SD =
1.23). Sixty-two percent of the sample was White (n = 138); 24% were Black or African
American (n = 54); 6% were Asian (n = 13), American Indian or Alaskan Native (n = 1), or
Pacific Islander (n = 1). Seven percent identified as “Other” (n = 15). One respondent chose to
not identify. Twenty-one percent (n = 46) of the participants described their ethnicity as
Hispanic, Latino, or of Spanish origin. More than half the participants (51%) were college
seniors (n = 114), more than one third (36%) were juniors (n = 81), and 12% were sophomores
(n = 27). One participant was a freshman. More than one-third (35%) reported a total family
income of less than $50,000 per year (n = 78). For a complete description of the sample, see
Tables 3-1 through Table 3-6.
Data Collection
Population Identification and Selection
Participants were students recruited from the University of Florida College of Agriculture
and Life Sciences, Department of Family, Youth and Community Sciences. All participants took
part in this study as volunteers, and were compensated for their time with extra credit classroom
points. Students attending the same classes who did not participate in the study were awarded
extra classroom points as well. Prior to recruiting, approval from UF’s IRB-02 was obtained.
Students who participated were directed to read the “Letter of Information” which identified the
41
nature of he study and the kinds of questions presented. Included in the Letter of Information
was an assessment of possible risks and rewards for taking part in this study. Participants were
advised that their survey responses would be completely anonymous, and no personally
identifiable information was collected or stored.
Instrumentation
Reliability and validity go hand-in-hand; therefore, the methodology employed for the
development of the SEAI instrument was informed by the theoretical definition of each
dimension of constructs of the SEAD, and the framework provided by the theoretical synthesis.
Fifty-six items were proposed as appropriate to the measurement of the constructs of the SEAD.
Items were based on the theoretically defined dimensions of each construct. In order to ensure
reliability and validity, the author recruited a consensus panel to assist with the development of
the SEAI. The panel consisted of six highly qualified experts who provided editorial suggestions
regarding validity of instrument content in relation to the theoretical constructs, the validity of
the items as measurements of the constructs, and the appropriateness of the instrument structure
from the perspective of context of the study population.
Recruitment of members for the consensus panel was based upon their expertise in areas
related to social and emotional developmental processes, such as inter- and intra-familial
relationships; human emotional development; family programming and evaluation; clinical
psychological counseling, and other fields related to topics important to this study. One panel
member had extensive knowledge and experience in the field of familial emotional relationships.
One panel member had extensive knowledge and experience in statistical analysis, and two panel
members had extensive knowledge and experience in the field of survey instrument construction
and data collection. All panel members held Ph.D. degrees. Two prospective panel members
declined to participate; one because she did not feel her expertise fit the subject matter closely

42
enough, and one because she would not have been able to dedicate the time necessary to help
produce a quality instrument. The panel of experts provided face validity and content validity
for the instrument through consensus of expert opinion, and validated both the form and structure
of the instrument.
Construction of individual items focused on methodology providing reliable and valid
results. Items were constructed in such a manner as to measure indicators and contra-indicators
of the same topics. This method of measuring the same topic from different perspectives
provides support for triangulation, which helps ensure reliability and facilitates construct validity
by providing convergent and discriminatory validity (Bryman, 2012; Morse, 2015). To further
support validity, items within each of the variables were based upon dimensions that define each
respective construct. For example, the item “I often cannot tell what emotion I am feeling,” is an
item subsumed within the variable that measures the overall construct of emotional clarity. The
indicator for this item, ability to identify emotions, is one of three dimensions of the construct,
emotional clarity. The other two dimensions, accepting emotions and understanding emotions,
are also indicators of items within the variable that measures the construct, emotional clarity.
Examples of the nature of items in the SEAI are: “Please read each of the following
statements carefully, and estimate the strength with which each statement applies to you; 1)
“Understanding my emotions helps me improve my relationships;” 2) “I frequently use what I
think my emotions mean to help me take better care of myself.” Each item provided seven data
collection points ranging from zero to six points.
Following five iterations of editing and revision by the consensus panel, the SEAI
instrument was reduced from fifty-six items to forty items. The construct, emotional clarity, was
defined by three dimensions and measured by one variable comprised of fifteen items. The

43
construct, emotional integration, was also defined by three dimensions and measured by one
variable comprised of fifteen items. The construct, social-emotional integration, was defined by
two dimensions, and measured by one variable comprised of ten items.
Subsequent to the panel of experts reaching consensus regarding the ability of the
instrument to measure the theoretical constructs and provide reliable, valid incremental
measurement of social emotional ability, cognitive testing of the instrument was conducted
among seven individuals recruited from the accessible population. The purpose of this testing
was to identify covert issues such as appropriateness of item interpretation in the context of the
study population, clarity of instructions, and logical flow of item order. On the basis of this
qualitative analysis, four items were reworded. Data were then collected for a pilot study. The
purpose of the pilot study was to identify overt issues such as non-random missing data,
miscoded items, and issues of a similar nature. Data from the pilot study (N = 27) were
examined, and three miscoding errors were uncovered and corrected.
Following pilot and cognitive testing, items where added for collection of demographic
information such as age, gender, race, ethnicity, education, and total monthly family income.
Items were also added to provide for assessment of external convergent validity. Two sub
indices were adopted from the Difficulties in Emotion Regulation Scale (DERS) (Gratz &
Roemer, 2004). The DERS is a well-documented, established valid and reliable instrument.
These sub-indices were appropriate for assessing convergent validity because they measured the
same or very similar concepts as those found in the instrument, they were adopted in their
entirety, and employed identical metrics (Agarwal, 2011).
The Satisfaction with Life Scale (SWLS) was also adopted and inserted into the
instrument in its entirety (Diener, Emmons, Larsen, & Griffin, 1985). The SWLS was a well-
44
documented, valid and reliable instrument designed to measure life satisfaction. It also
employed identical metrics as those found in the SEAD instrument. The Social Emotional
Ability Development model posits that higher levels of social emotional ability will generally
result in more positive social engagement experiences; and, social engagement is a predictor of
well-being, life satisfaction, and happiness (Harris & Anderson, 2015). This concept is also
reflected in the literature (Baumeister, Vohs, Aaker, & Garbinsky 2013; Cialdini & Patrick,
2009; Lambert et al., 2010). It stands to reason that if the SEAD instrument provided reliable,
valid measurement of social emotional ability, then a positive convergent relationship would
exist between the SEAD Score and the SWLS Score.
Administration of the Instrument
Data were collected through online, anonymous self-assessment techniques using the
Qualtrics assessment tool. Participants were provided access to the survey for one week and
were allowed to navigate forward and backward throughout the survey. Participants were able to
save their progress toward completion of the survey instrument and to complete it at a later time
within the designated time frame, if needed.
Item Analysis
Following data collection, preliminary cognitive and statistical analyses were conducted
to identify items likely to impact negatively on the reliability and validity of the instrument. To
guide cognitive assessment of the suitability of individual items, Cronbach’s alpha testing was
performed to provide alpha correlation coefficients, inter-item correlation summaries, and item
total correlations (Clark & Watson, 1995; UCLA, 2016). Three items were determined to be
unsuitable for their intended measurement and were removed, and two items that returned
negative item-total correlations were removed. Following Cronbach’s alpha testing,
discriminatory power testing was performed using Mann-Whitney U-Testing (Corder &

45
Foreman, 2014). Clark and Watson (1995), suggested that items returning greater than U = .5
for either the upper and lower rankings provide inadequate discriminatory power, and should be
considered for removal. Consequently, two additional items were removed. As a result of the
preliminary item analysis, seven items were removed from the instrument.
To finalize the item analysis process and identify items that might detract from the ability
of the instrument to measure their intended constructs as differentiated by the SEAD, the revised
inventory was subjected to a principal component analysis (PCA). Williams, Brown, and
Onsman (2012) suggested that principal components analysis was useful as a methodology for
reducing multiple items into common factors and identifying items that measured latent
concepts, and those that did not. To be significant, Beavers et al. (2013) asserted that
correlations should be at least .4, and avoid cross loading onto other components by being at
least .2 greater than any other correlation loadings for the same variable. Commensurate with
these guidelines, five items were identified that loaded onto components they had not been
intended to measure, or cross loaded onto components that measured more than one latent
concept as differentiated by the SEAD. Correspondingly, these five items were removed from
the inventory (Table 3-7).
In sum, item analysis identified a total of twelve items that were determined to have a
negative influence on reliability and validity of the instrument, and were consequently removed
from the instrument. This revised instrument that was subjected to data analysis consisted of
three sub scales that measured respective constructs of the SEAD. The first construct, emotional
clarity, was defined by three dimensions and measured by one variable comprised of eleven
items. The second construct, emotional integration, was also defined by three dimensions and
measured by one variable comprised of eleven items. The third construct, social-emotional

46
integration, was defined by two dimensions, and measured by one variable comprised of six
items. According to Hinkin, Tracey, and Enz (1997), there are no standard rules that dictate how
many items are necessary to measure a construct. However, these authors suggest that an
instrument must provide evidence of internal reliability and validity, and all constructs should be
measured by at least five items.
Data Analysis
IBM’s Statistical Package for the Social Sciences Version 23 was utilized to properly
explore the ability of the SEAD instrument to provide reliable, valid, incremental measurement
of social emotional ability. To summarize, twelve items had been removed from the SEAI
during the item analysis process. Accordingly, the dataset was revised to contain only data
collected by the remaining twenty-eight items, plus data collected by three sub scales that had
been inserted into the instrument to provide evidence of external validity, as previously
discussed. In keeping with the study objectives, statistical analysis for this study focused upon
assessing reliability and validity. The sequencing of data analysis was internal reliability tests
that included Cronbach’s alpha testing, split-sample reliability testing, and split form consistency
testing. Data were then analyzed for validity, which consisted of internal validity testing
utilizing factor analyses (including exploratory and confirmatory factor analysis). Results of the
factor analyses were inspected for characteristics of convergent and discriminant validity, and
principal components and principal factors were compared to the expected structure and factors
as differentiated by the SEAD model. Finally, data were analyzed for external construct validity,
which consisted of comparing correlations between scores provided by the instrument and scores
provided by external scales measuring the same or very similar concepts.

47
Reliability Analysis
Cronbach’s alpha
According to Gliem and Gliem (2003), Cronbach’s alpha coefficient, when examined in
conjunction with accompanying correlation summaries of inter-item and item-total correlations,
is one of the most widely used indicators of the internal reliability of quantitative survey
instruments. Cronbach’s Alpha testing was employed in this study to assess internal reliability.
The SEAD instrument satisfied the necessary assumptions for Cronbach’s alpha testing, which
are: The instrument is composed of multiple items that provide a composite score; each item
measures a property that varies quantitatively; there are no “right” or “wrong” responses to the
items; and responses to items provide ratings for each item (Gliem & Gliem, 2003).
Neuendorf (2016) asserted that Cronbach’s alpha can be sensitive to the number of items
measuring a construct and articulated that the mean inter-item correlation is a more consistent
indicator of internal reliability. Neuendorf (2016) suggested that a mean inter-item correlation
between .2 and .4 provides the optimum level of homogeneity. Clark and Watson (1995) posited
that the optimal mean inter-item correlation varies according to the complexity of the construct
being measured and suggested that, when measuring a more complex construct, a range of .15 to
.20 would be more appropriate. Similarly, they posited that when measuring less complex
constructs, a mean inter-item correlation between .40 and .50 would be appropriate.
Furthermore, Clark and Watson (1995), proposed that Cronbach’s alpha for exploratory
social science studies should generally be greater than .6, inter-item total correlation coefficient
means should be greater than .2, item-total coefficients should be greater than .3, and items that
return negative item-total coefficients should be considered for removal. Acceptable thresholds
applied to results for the current study were more conservative. Alpha coefficients greater than

48
.7; inter-item correlation averages generally greater than .2; and item total correlations greater
than .3 were deemed acceptable. Hof (2012) suggested that these thresholds are well within
acceptable ranges for this type of investigation.
Split-sample reliability analysis
According to Swisher (2016), an effective methodology for assessing internal reliability
would be provided by using Cronbach’s alpha testing in combination with split-sample
correlation. In addition to Cronbach’s alpha testing, internal reliability was assessed by
randomly splitting the sample in half and calculating correlations between composite SEAD
score and construct scores for each half. Data met assumptions necessary for calculating
correlations using Pearson’s correlations, as data compared two continuous variables that
represented two paired observations. Examination of scatterplots revealed elliptically shaped
patterns, which indicated that a linear relationship existed between the variables. No outliers
were identified in the data and normality testing ensured normal distribution (Kang, & Harring,
2012). According to Wuensch (2012), a correlation of greater than .2 (p = <.05) is evidence of a
statistically significant relationship, and was therefore used to determine significance of Person’s
correlations.
Split-half form reliability analysis
Consistency is integral to internal reliability. According to Bhattacherjee (2012), split-
half form testing is a measure of consistency between two halves of an instrument. The
instrument was split in half by alternate items (Bhattacherjee, 2012). Split form internal
consistency reliability assessment was provided by calculating Cronbach’s alpha, the Pearson
correlation between the two forms, and the Spearman-Brown split-half reliability coefficient
between scores for each half (Garson, 2009).
49
Validity Analysis
According to Agarwal (2011), providing evidence of construct validity for newly
developed instruments such as the Social Emotional Ability Inventory is critical. Construct
validity is defined as the degree to which inferences can be made from theoretical constructs on
which a study is based (Agarwal, 2011). Clark and Watson (1995) proposed that construct
validity has three components: first, a construct must be framed within a sound theoretical
framework; second, there must be internal statistical evidence of convergent and discriminate
validity; and third, evidence must be provided supporting external convergent and discriminant
validity. Correspondingly, evidence was provided to demonstrate that the constructs of the
SEAD were soundly based in theory; internal construct validity was assessed by providing
statistical evidence of the internal convergent and discriminant validity of the data; and external
construct validity was assessed by providing statistical evidence of external convergent validity
developed through the comparison of statistical relationships between measurements of the
constructs of SEAD and the same or very similar concepts found in the literature. External
discriminant validity testing was not performed.
Internal construct validity: Clark and Watson (1995) proposed that internal construct
validity cannot be tested directly, but evidence of internal construct validity must be verified
through convergent and discriminant characteristics of the items measuring theoretical
constructs. Williams et al. (2012) suggested that factor analysis was an effective methodology
for identifying and confirming latent constructs. Factor analysis is a methodology often
employed when validating a new instrument by providing evidence of internal construct validity
and confirming that an instrument reflects the measurement of intended constructs (Byrne, 2001;
William et al., 2012). Beavers et al. (2013) asserted that principal component analysis and
principal axis factoring (PAF) are the most common methodologies employed in factor analysis,
50
and the results from both methods are quite similar. These authors suggested performing
reliability testing prior to factor analysis to improve accuracy of the results, as this facilitates
interpretation of communality correlation matrices. Correspondingly, reliability testing was
performed prior to factor analysis.
Even though PCA and PAF yield similar results, it was important to understand that there
are substantial differences between the two methodologies. For example, PCA identifies
components of the structure of the instrument caused by item scores, while PAF identifies the
actual factors of an instrument and allows for the identification of the structure of factors thought
to be reflective of the items that measure a construct (Byrne, 2001). In other words, PCA reveals
components caused by resulting scores, and PAF identifies the structure of factors caused by
individual items. There are also important differences in the ways in which the methods measure
variance. Principal component analysis takes into account all variance, including common
variance, specific variance, and measurement error, and therefore produces greater reported
values (Beavers et al., 2013), which results in greater opportunity for cross loading. Principal
axis factoring reports only variance in common, which removes variance error and specific
variance, and provides more accurate but lower correlations (Beavers et al., 2013).
Taking these differences into consideration, this study employed an exploratory factor
analysis using PCA to assess relationships between items and groups of items, and to provide
evidence of internal construct validity. A confirmatory factor analysis was also performed
utilizing PAF as a form of structural equation modeling to define and confirm the underlying
structure of the theoretical constructs of the SEAD as measured by the Social Emotional Ability
Inventory (Pett, Lackey, & Sullivan, 2003; Williams et al., 2012).

51
The factor analyses were appropriate to their intended purposes. According to Pett et al.
(2003), a principal component analysis should be used to establish preliminary solutions when
performing an exploratory factor analysis, and Garson (2007) asserted that the traditional
methodology employed for structural equation modeling was a confirmatory factor analysis
employing principal axis factoring, as researchers could examine factor loadings to determine if
the intended items indeed loaded on latent factors as predicted by the theoretical model.
Exploratory factor analysis
Barry, Chaney, Stellefson, and Chaney (2011) recommended principal component
analysis as the most appropriate methodology for exploratory factor analyses intended for the
assessment of convergent and discriminant validity. Correspondingly, an exploratory factor
analysis was performed to determine if items that converged onto principal components also
failed to load out of construct, as differentiated by the SEAD (Williams et al., 2012). Because
the SEAD instrument was constructed to provide reliable, valid measurement of social emotional
ability as differentiated by constructs of the SEAD model, it was expected that the components
of the instrument would reflect the theoretical constructs of the SEAD model. Consequently, the
primary objective of the exploratory factor analysis was to explore the component structure of
the instrument and also provide evidence of internal construct validity for the instrument, and
evidence of the validity of the SEAD model. Barry, Chaney, Stellefson, and Chaney (2011)
recommended PCA as the most appropriate methodology for an exploratory factor analysis.
Correspondingly, an EFA was conducted employing PCA to assess internal convergent validity,
discriminant validity, and underlying component structure. Prior to the exploratory factor
analysis, data were tested to determine suitability. The value of the Kaiser-Meyer-Olkin (KMO)
measure of sampling adequacy was inspected to ensure linear relationships greater than .6
(Kaiser, 1970, 1974). Bartlett’s Test of Sphericity was inspected for significance (Bartlett,

52
1954), and the total item correlation matrix was inspected for items having a substantial number
of correlations greater than .3. It should be noted that one of the assumptions of factor analysis
was violated, as data were not collected through random sampling. However, Clark and Watson
(1995) asserted that in real-world analysis, factor analysis assumptions were routinely not met,
and depending on the type of investigation, this rarely affected study outcome. As this was an
exploratory study, it was not expected that non-random sampling significantly affected the study
outcome.
Williams et al. (2012) articulated that factor matrices are complex and often rotated to
facilitate interpretation. Osborne and Costello (2005) suggested that when extracted components
were expected to be related — as was the case with this data — results might best be interpreted
if the communalities correlation matrix was subjected to a Promax rotation. Consequently, this
analysis was conducted using a Promax (k=6) rotation. As suggested by Agarwal (2011), only
principal components that appeared above the “bend” of the scree plot with an eigenvalue greater
than 1 were considered for retention. Williams et al. (2012) asserted that there was a wide
latitude regarding what constituted an acceptable level of accumulated percentage of variance
explained by extracted components, but in the social science studies it was commonly between
50% and 60%, and often as low as 40%. The acceptable level of accumulated percentage of
variance explained for this study was set at 50%.
Beavers et al. (2013) proposed that a “simple factor structure” was the most desirable and
interpretable factor matrix. A simple structure was defined as one composed of at least three
items per component having strong loadings that did not exhibit significant secondary cross
loadings. As is the case with many such thresholds, guidelines for determining specifically what
might constitute a significant secondary or cross loading varied widely in the literature. Beavers
53
et al. (2013) suggested that to be considered significant, correlations should generally be at least
.4, and avoid secondary or cross loading onto other components by being at least .2 greater than
any other correlation loadings for the same variable. Therefore, for this present study, significant
communality correlations were those that generally loaded on components with r values of .4 or
greater, and were at least .2 greater than any other loadings for the same variable.
Correspondingly, items that loaded at less than .4 were suppressed in the communality
correlation matrix output.
Confirmatory factor analysis
Byrne (2001) recommended principal axis factoring as the most appropriate methodology
for a confirmatory factor analyses intended to identify the structure of an instrument and confirm
that the underlying proposed factors were reflective of the items used to measure the theoretical
latent constructs. Therefore, a confirmatory factor analysis was conducted to assess and confirm
the definition and structure of the factors that underlie the latent theoretical constructs of the
SEAD by performing principal axis factoring. Suitability of the data for factor analysis was
previously reported, as was justification for rotation for the communalities correlation matrix.
The communalities correlation matrix was subjected to a Promax (k = 6) rotation, and output for
items that loaded with r values less than .4 were suppressed. Thresholds for significance of
factors loadings were identical to those justified for principal component loadings.
In keeping with best practices for confirmatory factor analysis, factor structure was then
assessed by comparing theoretical intent to inductively identify, interpret, name, and group
identified factors according to construct (Williams et al., 2012). As Williams et al. (2012)
pointed out, the reason for factor analysis in the first place is to identify items with high in-factor
loading matrices that, when taken as a whole, explain the majority of item responses.

54
Congruent validity analysis
The study provided evidence of external construct validity by examining the strength of
correlation between measurements of three specific components of social emotional ability as
differentiated and provided by the SEAI instrument, and measurements provided by three
reliable and valid external scales that measured the same or similar concepts (Barry, Chaney,
Stellefson, & Chaney 2011). Data for correlation testing was collected at the same time, from
the same sample, employing the same metrics; as previously discussed in the methodology
chapter these external scales had been inserted at the end of the SEAI.
The difficulties in emotion regulation scale (DERS) (Gratz & Roemer, 2004) was a
widely used, reliable and valid instrument that contained two sub-scales that employed identical
metrics to the SEAI, and measured the same or very similar latent concepts that are also
measured by the SEAI instrument, emotional clarity and emotional regulation.
The third external scale was the satisfaction with life scale (SWLS) (Diener, et al., 1985).
The SWLS was a widely used, reliable and valid instrument that measured life satisfaction, and
employed metrics identical to those found in the SEAD instrument. As previously discussed in
the methodology chapter, the SWLS was also inserted at the end of the SEAI.
While the SWLS scale was not directly related to social emotional ability, it provided
measurement of life satisfaction (Diener, et al., 1985). The Social Emotional Ability
Development model articulated that higher levels of social emotional ability resulted in more
positive social engagement experiences, and social engagement was a predictor of well-being,
life satisfaction, and happiness (Harris & Anderson, 2015). It would stand to reason that if the
SEAD instrument provided reliable, valid measurement of social emotional ability, then a
positive relationship must have existed between the SEAD Score and the SWLS Score.
55
In order to assess external construct validity, relationships between composite scores for
social emotional ability, emotional clarity, and emotional regulation, and scores for the
respective external scales were examined using Pearson’s Product Moment correlation testing.
Data met assumptions for Pearson’s correlation testing. The procedure compared two
continuous variables that represented two paired observations. Examination of scatterplots
revealed elliptically shaped patterns, which indicated that a linear relationship existed between
the variables. No outliers were identified in the data and normality testing ensured normal
distribution (Kang & Harring, 2012). According to Wuensch (2012), a correlation of greater
than .2 (p = <.05) was evidence of a statistically significant relationship, and this correlation was
therefore used to determine significance of Pearson’s correlations.
Ethical Considerations
Threats to Human Subjects
All participants were provided access to a letter of information providing a brief
explanation of the purpose of the study. There were few, if any, possible perceived threats to the
human subjects involved in this study. Participants were advised that there were few anticipated
risks involved in this study, and researchers intended to keep all names and research locations
confidential. Participants were further informed that it was the intention of the researcher to share
study findings at professional education conferences and in research articles and literature, but
participant responses were not identifiable.
Confidentiality
The researcher was bound by the confidentiality of the University of Florida and all other
local, state and federal laws applicable to this study. No personally subject-identifiable data was
collected.

56
Protection of Privacy
Clearance for this study was obtained from the UF Institutional Review Board 02.
Participants were primarily recruited by oral request in a classroom setting. Some snowballing
and convenience sampling may have occurred.

57
Table 3-1. Descriptive statistics of the sample: Gender
Frequency Percent Valid
Percent
Cumulative
Percent
Valid
Female 191 85.7 85.7 85.7
Male 32 14.3 14.3 100.0
Total 223 100.0 100.0
Table 3-2. Descriptive statistics of the sample: Age
Frequency Percent Valid
Percent
Cumulative
Percent
Valid
19 22 9.9 9.9 9.9
20 52 23.3 23.3 33.2
21 81 36.3 36.3 69.5
22 45 20.2 20.2 89.7
23 11 4.9 4.9 94.6
24 - 32 12 5.4 5.4 100.0
Total 223 100.0 100.0
Table 3-3. Descriptive statistics of the sample: Race
Frequency Percent Valid
Percent
Cumulative
Percent
Valid
White 138 61.9 62.2 62.2
Black or African American 54 24.2 24.3 86.5
Asian 13 5.8 5.9 92.3
American Indian or Alaskan
Native 1 .4 .5 92.8
Pacific Islander 1 .4 .5 93.2
Other: 15 6.7 6.8 100.0
Total 222 99.6 100.0
Declined to answer 1 .4
Total 223 100.0
Table 3-4. Descriptive statistics of the sample: Ethnicity
Would you describe your ethnicity as Hispanic,
Latino, or of Spanish origin? Frequency Percent
Valid
Percent
Cumulative
Percent
Valid
Yes 46 20.6 20.6 20.6
No 177 79.4 79.4 100.0
Total 223 100.0 100.0

58
Table 3-5. Descriptive statistics of the sample: College year
Frequency Percent Valid
Percent
Cumulative
Percent
Valid
Freshman 1 .4 .4 .4
Sophomore 27 12.1 12.1 12.6
Junior 81 36.3 36.3 48.9
Senior 114 51.1 51.1 100.0
Total 223 100.0 100.0
Table 3-6. Descriptive statistics of the sample: Total family income
Frequency Percent Valid
Percent
Cumulative
Percent
Valid
Less than $50,000 78 35.0 35.3 35.3
$50,000 - $69,999 26 11.7 11.8 47.1
$70,000 - $79,999 24 10.8 10.9 57.9
$80,000 - $99.999 23 10.3 10.4 68.3
$100,000 - $149,999 39 17.5 17.6 86.0
$150,000 and above 31 13.9 14.0 100.0
Total 221 99.1 100.0
Missing (Declined to answer) 2 .9
Total 223 100.0
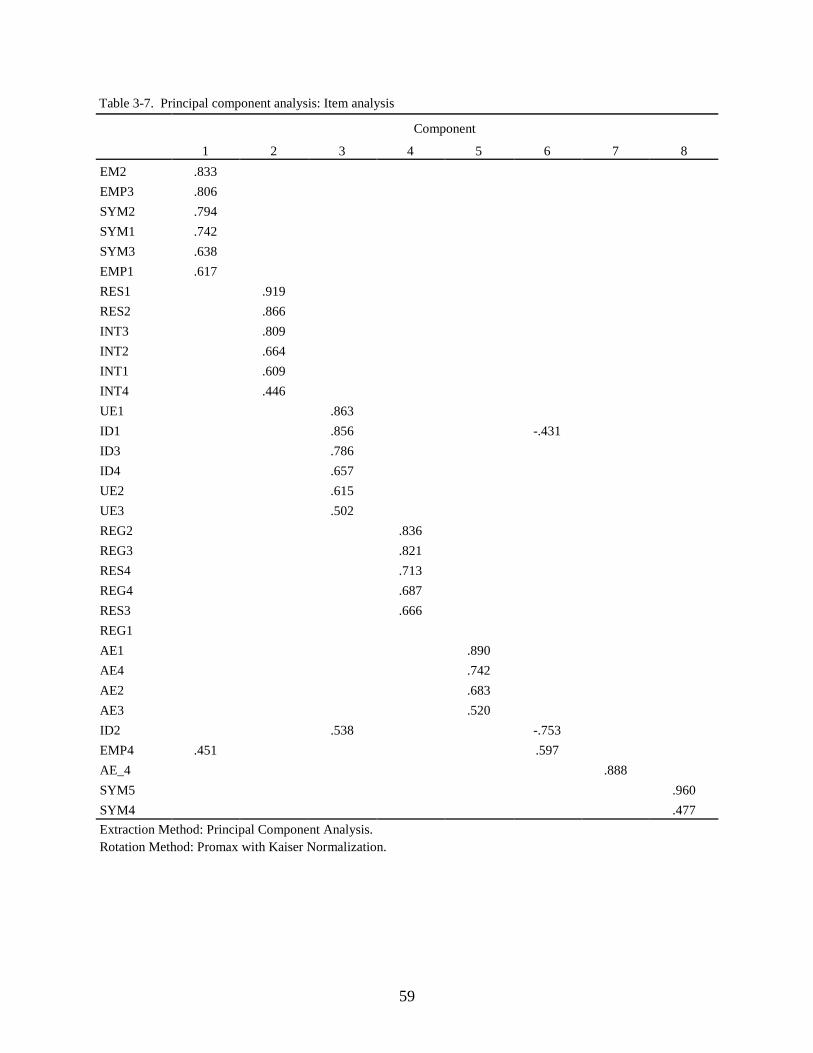
59
Table 3-7. Principal component analysis: Item analysis
Component
1 2 3 4 5 6 7 8
EM2 .833
EMP3 .806
SYM2 .794
SYM1 .742
SYM3 .638
EMP1 .617
RES1 .919
RES2 .866
INT3 .809
INT2 .664
INT1 .609
INT4 .446
UE1 .863
ID1 .856 -.431
ID3 .786
ID4 .657
UE2 .615
UE3 .502
REG2 .836
REG3 .821
RES4 .713
REG4 .687
RES3 .666
REG1
AE1 .890
AE4 .742
AE2 .683
AE3 .520
ID2 .538 -.753
EMP4 .451 .597
AE_4 .888
SYM5 .960
SYM4 .477
Extraction Method: Principal Component Analysis.
Rotation Method: Promax with Kaiser Normalization.
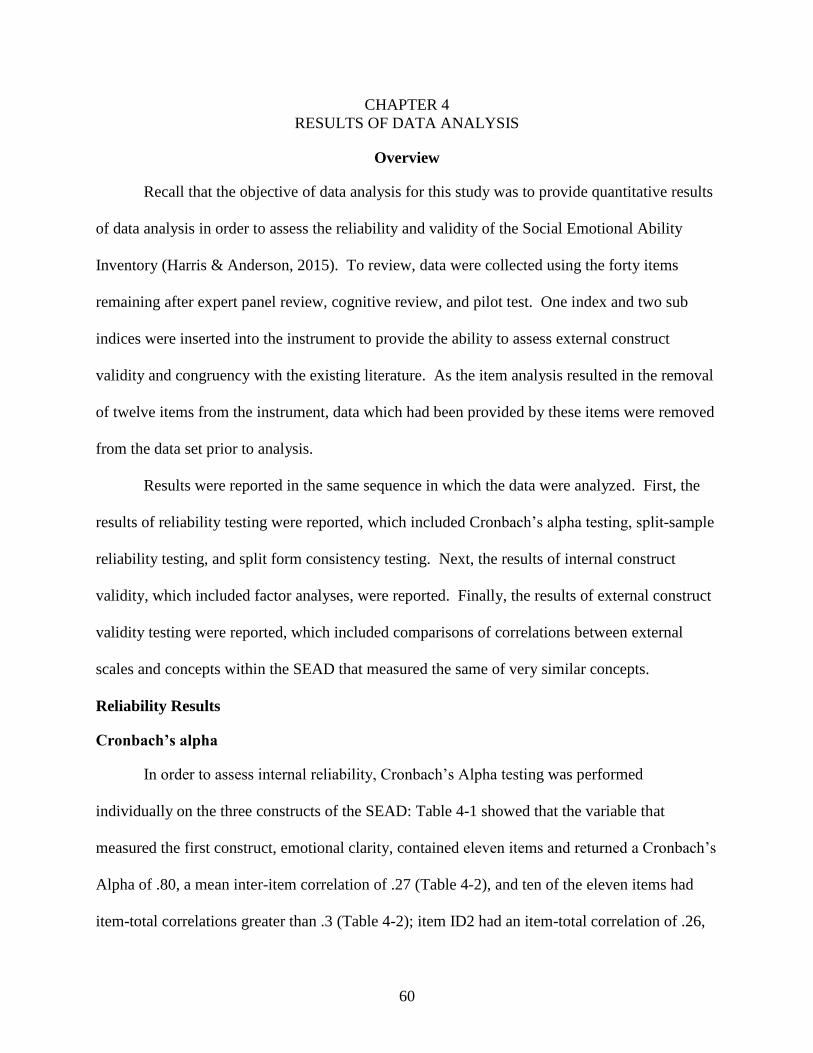
60
CHAPTER 4
RESULTS OF DATA ANALYSIS
Overview
Recall that the objective of data analysis for this study was to provide quantitative results
of data analysis in order to assess the reliability and validity of the Social Emotional Ability
Inventory (Harris & Anderson, 2015). To review, data were collected using the forty items
remaining after expert panel review, cognitive review, and pilot test. One index and two sub
indices were inserted into the instrument to provide the ability to assess external construct
validity and congruency with the existing literature. As the item analysis resulted in the removal
of twelve items from the instrument, data which had been provided by these items were removed
from the data set prior to analysis.
Results were reported in the same sequence in which the data were analyzed. First, the
results of reliability testing were reported, which included Cronbach’s alpha testing, split-sample
reliability testing, and split form consistency testing. Next, the results of internal construct
validity, which included factor analyses, were reported. Finally, the results of external construct
validity testing were reported, which included comparisons of correlations between external
scales and concepts within the SEAD that measured the same of very similar concepts.
Reliability Results
Cronbach’s alpha
In order to assess internal reliability, Cronbach’s Alpha testing was performed
individually on the three constructs of the SEAD: Table 4-1 showed that the variable that
measured the first construct, emotional clarity, contained eleven items and returned a Cronbach’s
Alpha of .80, a mean inter-item correlation of .27 (Table 4-2), and ten of the eleven items had
item-total correlations greater than .3 (Table 4-2); item ID2 had an item-total correlation of .26,

61
but was not removed because it was cognitively determined to have a theoretically sound basis
for inclusion. According to the thresholds referenced above and suggested by Barry, Chaney,
Stellefson, and Chaney (2011), the construct, emotional clarity, displayed the statistical
characteristics of “very good” internal reliability.
Table 4-4 showed that the variable that measured the second construct, emotional
integration, contained eleven items and returned a Cronbach’s Alpha of .78, a mean inter-item
correlation of .25 (Table 4-5), and all eleven items returned item total correlations greater than .3
(Table 4-5). According to the thresholds referenced above and suggested by Barry, Chaney,
Stellefson, and Chaney (2011), the construct, emotional integration, displayed the statistical
characteristics of “respectable” internal reliability.
Table 4-7 showed that the variable that measured the third construct, social emotional
integration, contained six items and returned a Cronbach’s Alpha of .88, a mean inter-item
correlation of .54 (Table 4-8), and all six items had item total correlations greater than .3 (Table
4-9). According to the thresholds referenced above and suggested by Barry, Chaney, Stellefson,
and Chaney (2011), the construct, social emotional integration, displayed the statistical
characteristics of “very good” internal reliability.
Split sample reliability testing
In order to assess internal reliability, the sample was split in half by odd-even case, and
Pearson’s product-moment correlations were run on Social Emotional Ability Scores and also on
composite scores for all three constructs for both halves. Preliminary analyses showed that
necessary assumptions had been met: tested relationships proved linear and normally distributed,
as assessed by Shapiro-Wilk's test (p > .05). Outliers had been previously removed. Table 4-10
showed a statistically significant, very strong positive correlation between the split sample
groups for the Social Emotional Ability Score, r(109) = 1.00, p < .001. Table 4-11 showed a

62
statistically significant, very strong positive correlation between the split sample groups for the
construct, emotional clarity, r(109) = .65, p < .001. Table 4-12 showed a statistically
significant, very strong positive correlation between the split sample groups for the construct,
emotional integration, r(109) = .70, p < .001. Table 4-13 showed a statistically significant,
moderately strong positive correlation between the split sample groups for the construct,
emotional clarity, r(109) = .33, p < .001.
According to the thresholds suggested by Kang and Harring (2012) for Pearson’s
correlations, and guidance provided by Swisher (2016) as referenced above, the Social
Emotional Ability Inventory displayed the statistical characteristics of “very good” internal
reliability.
Split form consistency testing
In order to assess internal consistency reliability, the Social Emotional Ability Inventory
instrument was split along odd-even items, by construct. Table 4-14 showed that Cronbach’s
alpha for the two form halves was .77 and .70, respectively. According to the thresholds
referenced above and suggested by Barry, Chaney, Stellefson, and Chaney (2011), these alphas
indicated good internal consistency reliability. Table 14-4 also showed a very strong positive
Pearson’s correlation between the two form halves, r = .85, and the Spearman-Brown split-half
reliability coefficient was .92. According to Garson (2009), these results indicated very good
internal consistency reliability.
Validity Results
Internal construct validity testing
Internal construct validity was tested using EFA with PCA methodology and CFA with
PAF methodology, which was discussed in detail in the methodology chapter.
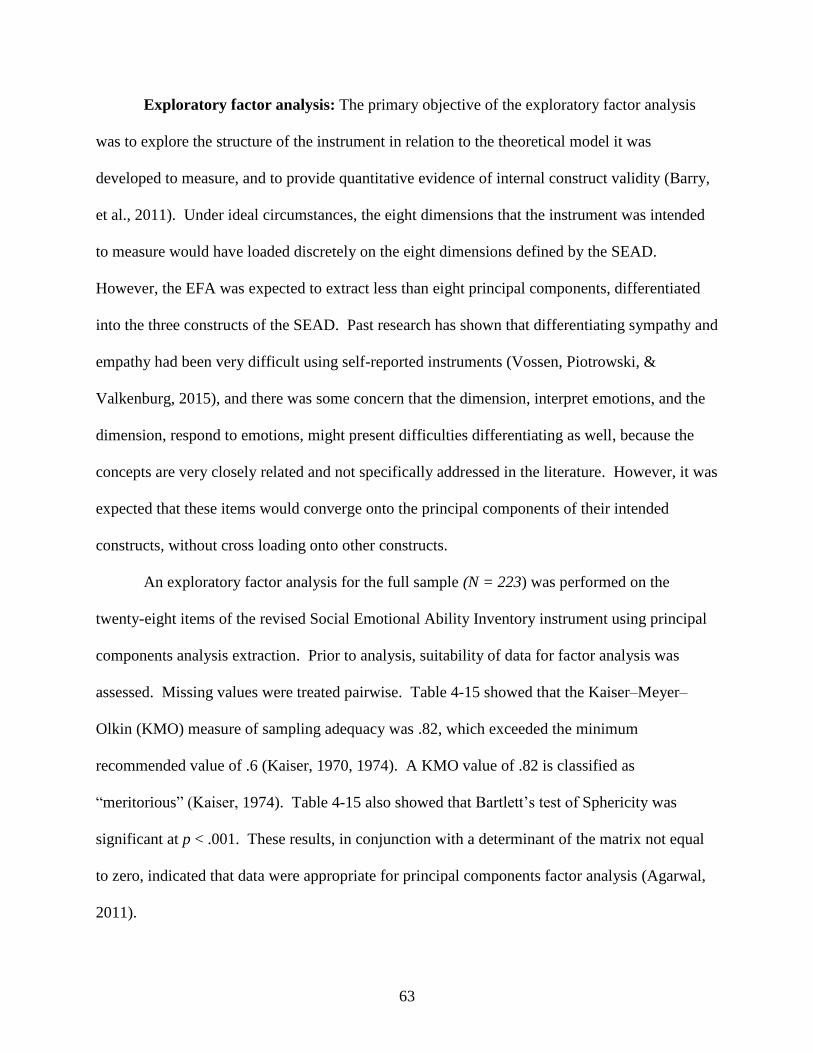
63
Exploratory factor analysis: The primary objective of the exploratory factor analysis
was to explore the structure of the instrument in relation to the theoretical model it was
developed to measure, and to provide quantitative evidence of internal construct validity (Barry,
et al., 2011). Under ideal circumstances, the eight dimensions that the instrument was intended
to measure would have loaded discretely on the eight dimensions defined by the SEAD.
However, the EFA was expected to extract less than eight principal components, differentiated
into the three constructs of the SEAD. Past research has shown that differentiating sympathy and
empathy had been very difficult using self-reported instruments (Vossen, Piotrowski, &
Valkenburg, 2015), and there was some concern that the dimension, interpret emotions, and the
dimension, respond to emotions, might present difficulties differentiating as well, because the
concepts are very closely related and not specifically addressed in the literature. However, it was
expected that these items would converge onto the principal components of their intended
constructs, without cross loading onto other constructs.
An exploratory factor analysis for the full sample (N = 223) was performed on the
twenty-eight items of the revised Social Emotional Ability Inventory instrument using principal
components analysis extraction. Prior to analysis, suitability of data for factor analysis was
assessed. Missing values were treated pairwise. Table 4-15 showed that the Kaiser–Meyer–
Olkin (KMO) measure of sampling adequacy was .82, which exceeded the minimum
recommended value of .6 (Kaiser, 1970, 1974). A KMO value of .82 is classified as
“meritorious” (Kaiser, 1974). Table 4-15 also showed that Bartlett’s test of Sphericity was
significant at p < .001. These results, in conjunction with a determinant of the matrix not equal
to zero, indicated that data were appropriate for principal components factor analysis (Agarwal,
2011).
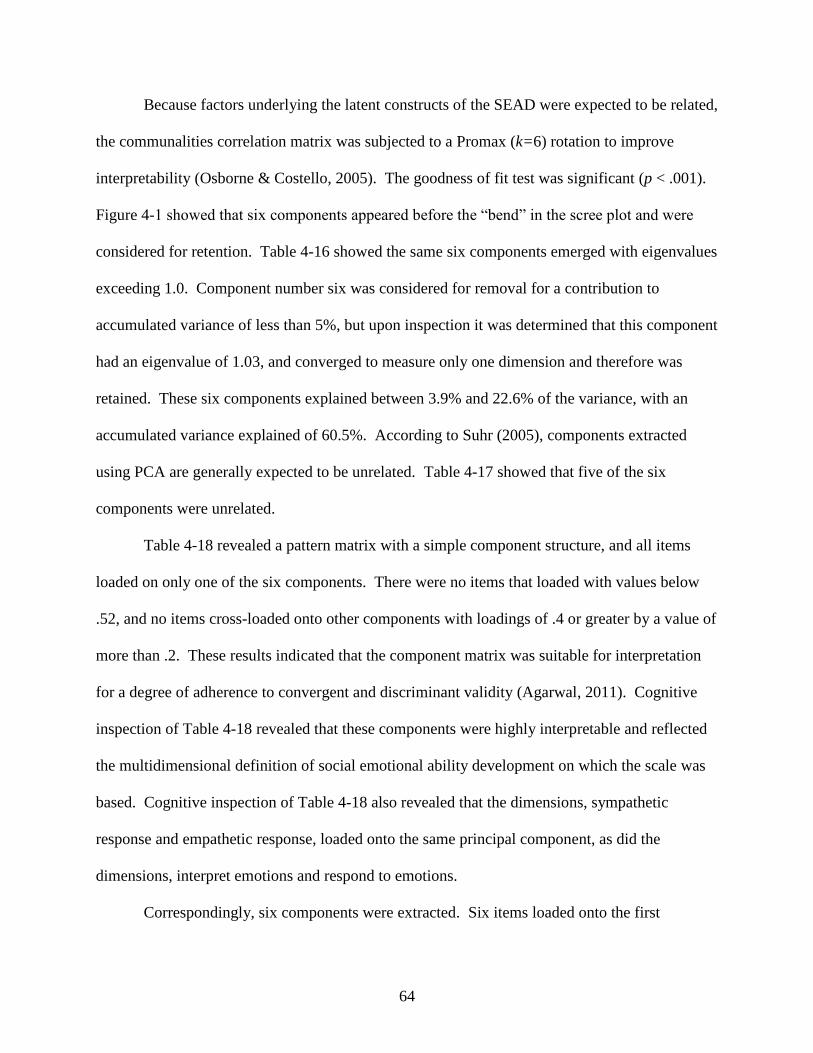
64
Because factors underlying the latent constructs of the SEAD were expected to be related,
the communalities correlation matrix was subjected to a Promax (k=6) rotation to improve
interpretability (Osborne & Costello, 2005). The goodness of fit test was significant (p < .001).
Figure 4-1 showed that six components appeared before the “bend” in the scree plot and were
considered for retention. Table 4-16 showed the same six components emerged with eigenvalues
exceeding 1.0. Component number six was considered for removal for a contribution to
accumulated variance of less than 5%, but upon inspection it was determined that this component
had an eigenvalue of 1.03, and converged to measure only one dimension and therefore was
retained. These six components explained between 3.9% and 22.6% of the variance, with an
accumulated variance explained of 60.5%. According to Suhr (2005), components extracted
using PCA are generally expected to be unrelated. Table 4-17 showed that five of the six
components were unrelated.
Table 4-18 revealed a pattern matrix with a simple component structure, and all items
loaded on only one of the six components. There were no items that loaded with values below
.52, and no items cross-loaded onto other components with loadings of .4 or greater by a value of
more than .2. These results indicated that the component matrix was suitable for interpretation
for a degree of adherence to convergent and discriminant validity (Agarwal, 2011). Cognitive
inspection of Table 4-18 revealed that these components were highly interpretable and reflected
the multidimensional definition of social emotional ability development on which the scale was
based. Cognitive inspection of Table 4-18 also revealed that the dimensions, sympathetic
response and empathetic response, loaded onto the same principal component, as did the
dimensions, interpret emotions and respond to emotions.
Correspondingly, six components were extracted. Six items loaded onto the first

65
component, and addressed sympathetic response and empathetic response, which are dimensions
of the construct, social emotional integration, as defined in the theoretically framed model. The
six items that loaded onto the second component addressed emotional regulation, a dimension of
the construct, emotional integration. The five items that loaded onto the third component
addressed the ability to interpret and respond to emotions, which are also dimensions of the
construct, emotional integration. The four items that loaded onto the fourth component
addressed the ability to accept emotions, which is a dimension of emotional clarity. The four
items that loaded onto the fifth component addressed the ability to identify and understand
emotions, which are dimensions of emotional clarity. And the three items that loaded onto the
sixth component addressed the ability to identify emotions, which is a dimension of the
construct, emotional clarity.
In summary, six components were extracted, and discretely represented the three latent
constructs proposed by the SEAD. Six items in component one measured the two dimensions of
the theoretical construct social emotional integration. Eleven items in components two and three
measured the three dimensions of the theoretical construct emotional integration. And the eleven
items in components four, five, and six measured the three dimensions of emotional clarity.
These loadings indicate high levels of in-construct convergent validity, and between-construct
discriminant validity for all items (Barry, Chaney, Stellefson, & Chaney, 2011). See Figure 4-2
for a comparison of the theoretical factor structure proposed by the SEAD and the principal
components that extracted as a result of the EFA.
Confirmatory factor analysis: It was expected that the six components of the SEAI
extracted in the EFA would correspond with the factor structure of the theoretical constructs as
measured by the SEAI, and as proposed by the SEAD model. Because of the inherent
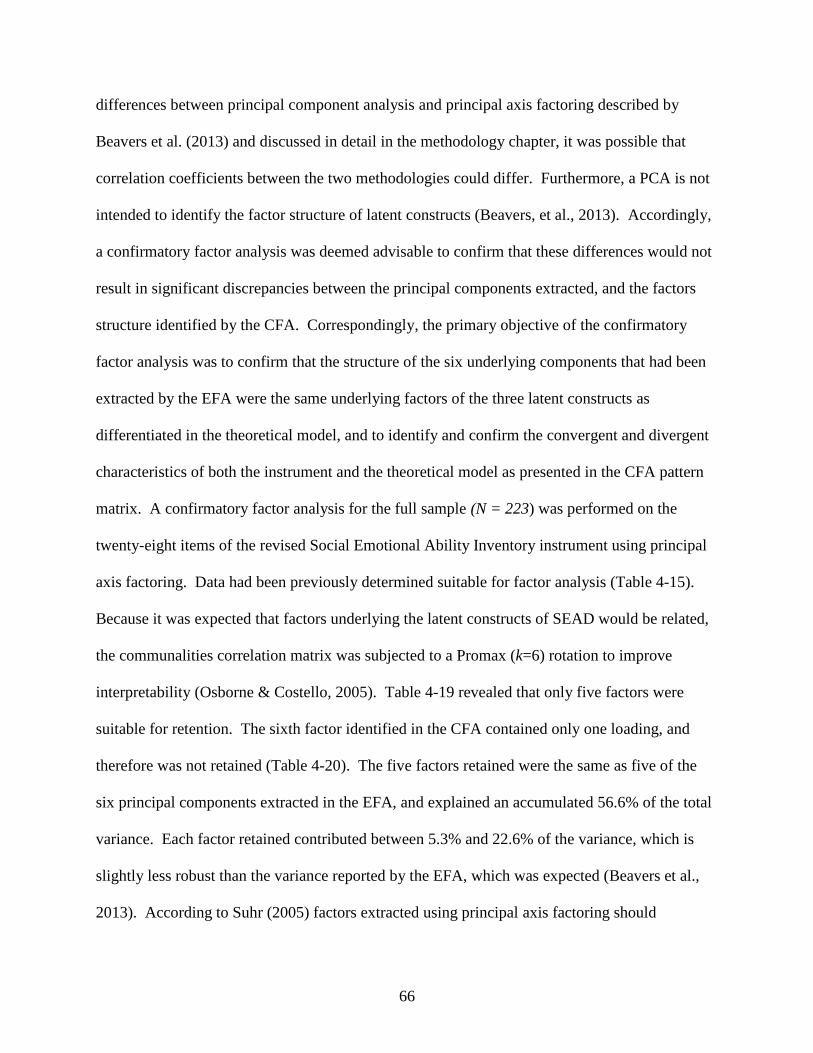
66
differences between principal component analysis and principal axis factoring described by
Beavers et al. (2013) and discussed in detail in the methodology chapter, it was possible that
correlation coefficients between the two methodologies could differ. Furthermore, a PCA is not
intended to identify the factor structure of latent constructs (Beavers, et al., 2013). Accordingly,
a confirmatory factor analysis was deemed advisable to confirm that these differences would not
result in significant discrepancies between the principal components extracted, and the factors
structure identified by the CFA. Correspondingly, the primary objective of the confirmatory
factor analysis was to confirm that the structure of the six underlying components that had been
extracted by the EFA were the same underlying factors of the three latent constructs as
differentiated in the theoretical model, and to identify and confirm the convergent and divergent
characteristics of both the instrument and the theoretical model as presented in the CFA pattern
matrix. A confirmatory factor analysis for the full sample (N = 223) was performed on the
twenty-eight items of the revised Social Emotional Ability Inventory instrument using principal
axis factoring. Data had been previously determined suitable for factor analysis (Table 4-15).
Because it was expected that factors underlying the latent constructs of SEAD would be related,
the communalities correlation matrix was subjected to a Promax (k=6) rotation to improve
interpretability (Osborne & Costello, 2005). Table 4-19 revealed that only five factors were
suitable for retention. The sixth factor identified in the CFA contained only one loading, and
therefore was not retained (Table 4-20). The five factors retained were the same as five of the
six principal components extracted in the EFA, and explained an accumulated 56.6% of the total
variance. Each factor retained contributed between 5.3% and 22.6% of the variance, which is
slightly less robust than the variance reported by the EFA, which was expected (Beavers et al.,
2013). According to Suhr (2005) factors extracted using principal axis factoring should

67
generally be related. Table 4-20 showed that the five components were related.
Table 4-21 revealed a pattern matrix with a relatively simple factor structure, with all
items loading on only one of the five retained factors. There were no items that loaded with
values below .42, and no items cross-loaded onto other factors with loadings of .4 or greater by a
value of less than .2. Cognitive inspection of the pattern matrix revealed that all five factors
were identified as being appropriate to the structural model. These results indicated that the
factor matrix was suitable for assessment for factor structure (Agarwal, 2011).
All five factors were highly interpretable and identified and confirmed both the
theoretically defined Social Emotional Ability Development model (Harris & Anderson, 2015),
the three latent constructs the SEAI intended to measure, and five of the six components
extracted by the EFA. The first factor addressed empathy and sympathy, which are dimensions
of the construct, social emotional integration. The second and third factors addressed emotional
regulation, emotional response, and emotional interpretation, which are dimensions of the SEAD
construct, emotional integration. The fourth and fifth factors addressed emotional acceptance,
emotional understanding, and emotional identification, which are dimensions of the SEAD
construct, emotional clarity.
As expected, the factor loadings identified in the confirmatory factor analysis were
somewhat lower than those reported by PCA for the exploratory factor analysis (Beavers et al.,
2013). Consequently, the pattern matrix in the confirmatory factor analysis differed somewhat
from the pattern matrix in the exploratory factor analysis as far as differentiating the dimensions
and the respective loadings on those dimensions were concerned. However, no items loaded out
of construct, and the confirmatory factor analysis confirmed that the dimensions measuring
constructs represented by items within the principal components analysis and the dimensions

68
measuring the underlying factors of the latent constructs of the SEAD were exactly aligned.
Furthermore, the high in-factor loading matrices provided by these analyses, when taken
as a whole, explained the majority of item responses (Williams et al., 2012). The structure of
principal components extracted by the exploratory factor analysis, and the structure of the factors
identified in the confirmatory factor analyses, even though slightly different, directly reflected
the theoretically defined dimension and construct structure of the Social Emotional Ability
Inventory instrument, as well as the theoretical Social Emotional Ability Development model.
See Figure 4-2 for a comparison of the theoretical factor structure proposed by the SEAD, the
principal components extracted by the the EFA, and the factor structure confirmed by the CFA.
External construct validity testing
Pearson’s product-moment correlation testing was employed to compare relationships
between measurement of dimensions of social emotional ability as differentiated by the SEAD
and external scales inserted at the end of the instrument, for the purpose of providing evidence of
external validity. Correlation effect size were interpreted in the manner suggested in Cohen
(1992), to wit: Results > .10 represent small correlations; results > .30 represent medium
correlations; results > .50 represent large correlations.
Emotional clarity correlation: Emotional clarity was a theoretical construct of the
SEAD, as measured by the Social Emotional Ability Inventory. Emotional clarity was also a
concept that had been measured by other valid and reliable instruments. The Difficulty in
Emotional Regulation Scale (DERS), was a well-known, valid and reliable instrument (Gratz &
Roemer, 2004). The DERS contained a sub-scale that measured emotional clarity, and was
inserted at the end of the SEAI for the purpose of providing evidence of external validity.
Pearson correlations were tested between emotional clarity scores provided by SEAI for
the SEAD construct, and scores provided for emotional clarity from the DERS (Gratz & Roemer,

69
2004). Preliminary analyses showed that necessary assumptions had been met; all the
relationships proved to be linear and normally distributed, as assessed by Shapiro-Wilk's test (p >
.05). Outliers had been previously removed. Table 4-22 revealed that there was a statistically
significant, strong positive correlation (r = .73, p < .001) between the theoretical construct,
emotional clarity, and the external concept, emotional clarity.
Emotional regulation correlation: Emotional regulation was one of the dimensions of
the SEAD measured by the SEAI. Emotional regulation was also a concept that had been
measured by other valid and reliable instruments. The Difficulty in Emotional Regulation Scale
(DERS), was a well-known, valid and reliable instrument (Gratz & Roemer, 2004). The DERS
contained a sub-scale that measured emotional regulation, and was inserted at the end of the
SEAI for the purpose of providing evidence of external validity (Gratz & Roemer, 2004).
Pearson correlations were tested between emotional regulation scores provided by the
SEAI to measure the SEAD dimension, emotional regulation, and scores measuring emotional
regulation from the DERS (Gratz & Roemer, 2004). Preliminary analyses showed that necessary
assumptions had been met; all the relationships proved to be linear and normally distributed, as
assessed by Shapiro-Wilk's test (p > .05). Outliers had been previously removed. Table 4-23
revealed a statistically significant, strong positive correlation (r = .70, p < .001) between the
dimension emotional regulation and the external concept, emotional regulation.
Social emotional ability correlation: Social emotional ability was a latent concept that
represented social emotional ability through an aggregated score of all of the dimensions of the
SEAD model, as measured by the SEAI (Harris & Anderson, 2015). The Social Emotional
Ability Development model articulated that higher levels of social emotional ability resulted in
more positive social engagement experiences, and social engagement, among other things, was a

70
predictor of life satisfaction (Harris & Anderson, 2015). For purposes of providing evidence of
external validity, the Satisfaction With Life Scale, a widely known, valid and reliable instrument
(SWLS) for measuring life satisfaction, was inserted into the SEAD (Diener, et al., 1985).
Pearson correlations were tested between SEAD scores and SWLS scores (Diener, et al.,
1985)). Preliminary analyses showed that necessary assumptions had been met: all the
relationships proved to be linear and normally distributed, as assessed by Shapiro-Wilk's test (p >
.05). Outliers had been previously removed. Table 4-24 showed a statistically significant,
moderate positive correlation (r = .33, p < .001) between Social Emotional Ability Scores and
satisfaction with life scores.

71
Table 4-1. Cronbach’s alpha reliability statistics: Emotional clarity
Cronbach's Alpha Cronbach's Alpha Based
on Standardized Items N of Items
.795 .802 11
Table 4-2. Cronbach’s alpha summary item statistics: Emotional clarity
Mean Minimum Maximum Range Maximum /
Minimum Variance
N of
Items
Item Means 3.836 3.188 4.511 1.323 1.415 .186 11
Inter-Item
Correlations .270 .000 .581 .580 12995.842 .019 11
Table 4-3. Cronbach’s alpha item-total statistics: Emotional clarity
Scale Mean if Item
Deleted
Scale Variance if
Item Deleted
Corrected Item-
Total Correlation
Squared Multiple
Correlation
Cronbach's Alpha if
Item Deleted
ID1 38.07 96.950 .503 .381 .774
ID2 38.29 100.343 .260 .231 .803
ID3 37.68 97.209 .535 .358 .772
ID4 38.13 98.685 .478 .412 .777
UE1 37.95 93.700 .589 .418 .765
UE2 39.00 97.536 .474 .284 .777
UE3 38.67 102.727 .334 .295 .790
AE1 38.83 97.869 .373 .386 .788
AE2 38.50 92.882 .547 .412 .768
AE3 38.81 91.994 .467 .395 .778
AE4 37.99 95.775 .491 .456 .775
Table 4-4. Cronbach’s alpha reliability statistics: Emotional integration
Cronbach's Alpha Cronbach's Alpha Based
on Standardized Items N of Items
.778 .783 11
Table 4-5. Cronbach’s alpha summary item statistics: Emotional integration
Mean Minimum Maximum Range Maximum / Minimum Variance N of Items
Item Means 4.234 3.659 4.924 1.265 1.346 .159 11
Inter-Item Correlations .247 .000 .656 .655 2624.076 .032 11

72
Table 4-6. Cronbach’s alpha item-total statistics: Emotional integration
Scale Mean if Item
Deleted
Scale Variance if
Item Deleted
Corrected Item-
Total Correlation
Squared Multiple
Correlation
Cronbach's Alpha if
Item Deleted
INT1 41.65 85.488 .392 .281 .766
INT2 42.44 84.500 .324 .334 .773
INT3 42.49 82.440 .437 .457 .761
RES1 42.61 81.130 .485 .581 .756
RES2 42.45 83.546 .421 .555 .763
RES3 42.04 77.944 .529 .436 .750
RES4 42.92 76.741 .446 .297 .760
REG1 41.69 82.928 .332 .188 .773
REG2 42.26 77.745 .480 .419 .755
REG3 42.58 75.650 .525 .459 .749
REG4 42.64 79.790 .392 .329 .767
Table 4-7. Cronbach’s alpha reliability statistics: Social emotional integration
Cronbach's Alpha Cronbach's Alpha Based
on Standardized Items N of Items
.875 .876 6
Table 4-8. Cronbach’s alpha summary item statistics: Social emotional integration
Mean Minimum Maximum Range Maximum / Minimum Variance N of Items
Item Means 4.760 4.251 5.184 .933 1.219 .109 6
Inter-Item Correlations .540 .437 .761 .324 1.742 .006 6
Table 4-9. Cronbach’s alpha item-total statistics: Social emotional integration
Scale Mean if Item
Deleted
Scale Variance if
Item Deleted
Corrected Item-
Total Correlation
Squared Multiple
Correlation
Cronbach's Alpha
if Item Deleted
SYM1 23.70 27.119 .629 .432 .861
SYM2 23.38 27.164 .703 .526 .851
SYM3 24.01 24.230 .756 .651 .839
EMP1 24.31 24.431 .707 .608 .849
EM2 23.82 26.427 .684 .497 .852
EMP3 23.58 27.443 .605 .402 .865
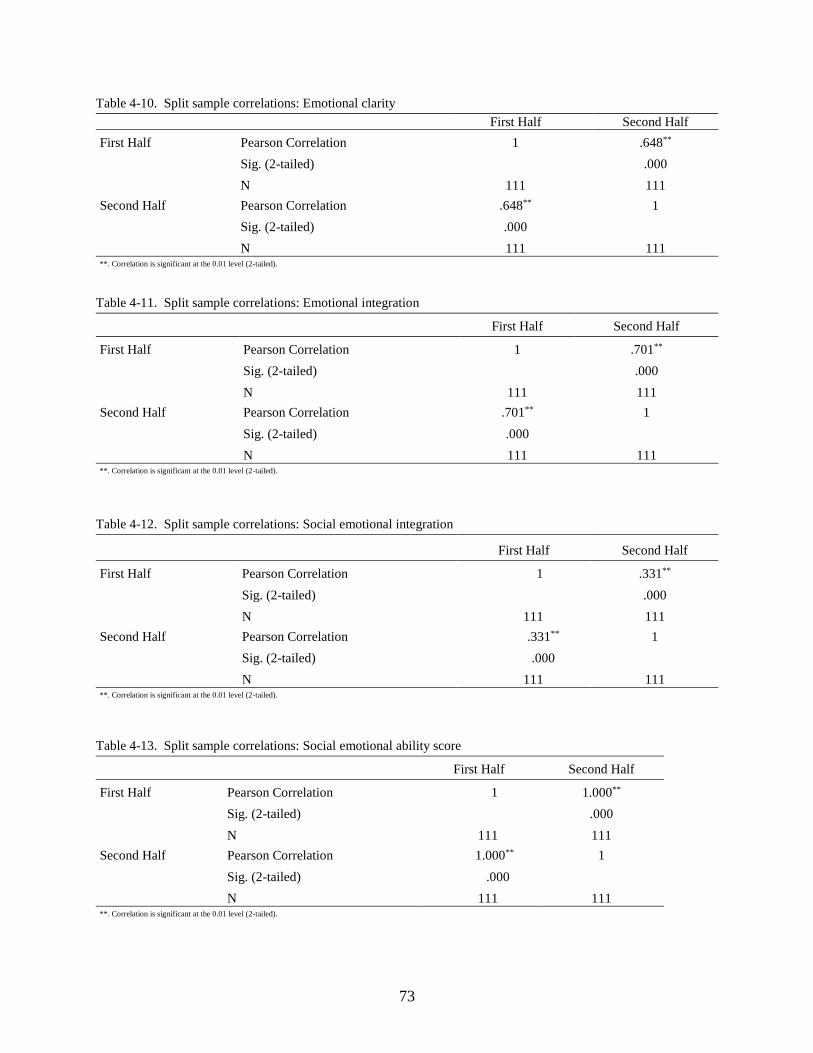
73
Table 4-10. Split sample correlations: Emotional clarity
First Half Second Half
First Half Pearson Correlation 1 .648**
Sig. (2-tailed) .000
N 111 111
Second Half Pearson Correlation .648** 1
Sig. (2-tailed) .000
N 111 111 **. Correlation is significant at the 0.01 level (2-tailed).
Table 4-11. Split sample correlations: Emotional integration
First Half Second Half
First Half Pearson Correlation 1 .701**
Sig. (2-tailed) .000
N 111 111
Second Half Pearson Correlation .701** 1
Sig. (2-tailed) .000
N 111 111 **. Correlation is significant at the 0.01 level (2-tailed).
Table 4-12. Split sample correlations: Social emotional integration
First Half Second Half
First Half Pearson Correlation 1 .331**
Sig. (2-tailed) .000
N 111 111
Second Half Pearson Correlation .331** 1
Sig. (2-tailed) .000
N 111 111 **. Correlation is significant at the 0.01 level (2-tailed).
Table 4-13. Split sample correlations: Social emotional ability score
First Half Second Half
First Half Pearson Correlation 1 1.000**
Sig. (2-tailed) .000
N 111 111
Second Half Pearson Correlation 1.000** 1
Sig. (2-tailed) .000
N 111 111 **. Correlation is significant at the 0.01 level (2-tailed).
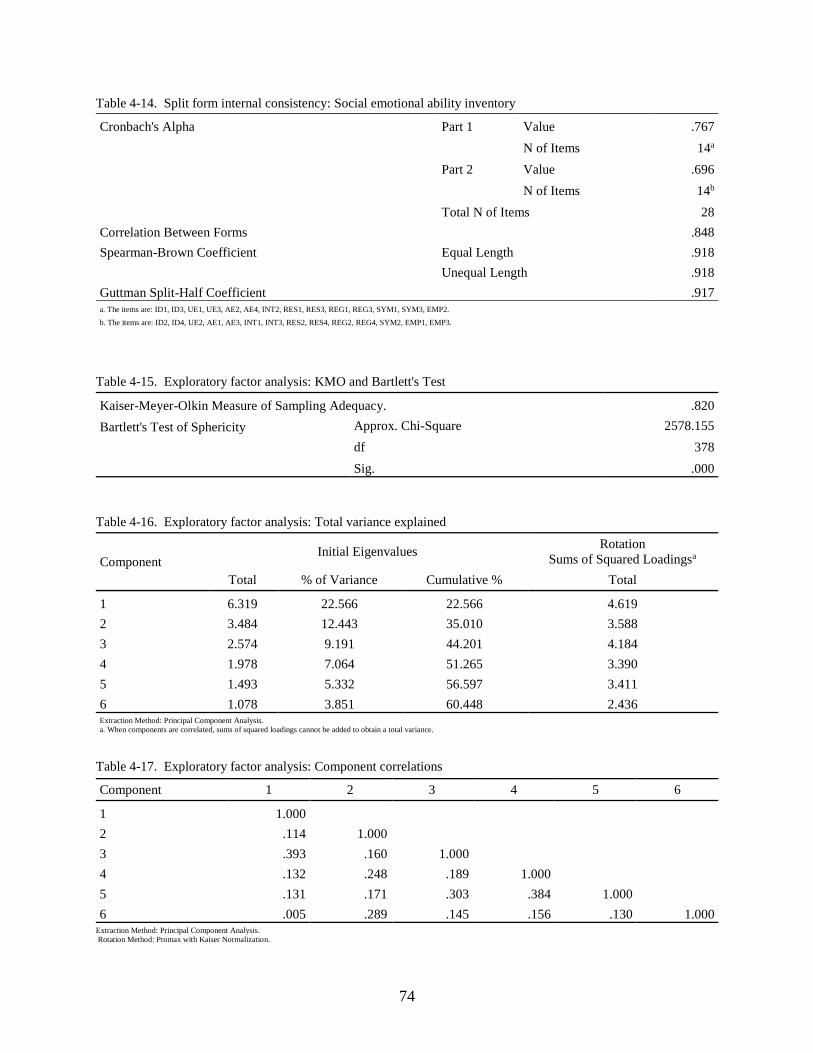
74
Table 4-14. Split form internal consistency: Social emotional ability inventory
Cronbach's Alpha Part 1 Value .767
N of Items 14a
Part 2 Value .696
N of Items 14b
Total N of Items 28
Correlation Between Forms .848
Spearman-Brown Coefficient Equal Length .918
Unequal Length .918
Guttman Split-Half Coefficient .917
a. The items are: ID1, ID3, UE1, UE3, AE2, AE4, INT2, RES1, RES3, REG1, REG3, SYM1, SYM3, EMP2.
b. The items are: ID2, ID4, UE2, AE1, AE3, INT1, INT3, RES2, RES4, REG2, REG4, SYM2, EMP1, EMP3.
Table 4-15. Exploratory factor analysis: KMO and Bartlett's Test
Kaiser-Meyer-Olkin Measure of Sampling Adequacy. .820
Bartlett's Test of Sphericity Approx. Chi-Square 2578.155
df 378
Sig. .000
Table 4-16. Exploratory factor analysis: Total variance explained
Component Initial Eigenvalues
Rotation
Sums of Squared Loadingsa
Total % of Variance Cumulative % Total
1 6.319 22.566 22.566 4.619
2 3.484 12.443 35.010 3.588
3 2.574 9.191 44.201 4.184
4 1.978 7.064 51.265 3.390
5 1.493 5.332 56.597 3.411
6 1.078 3.851 60.448 2.436 Extraction Method: Principal Component Analysis.
a. When components are correlated, sums of squared loadings cannot be added to obtain a total variance.
Table 4-17. Exploratory factor analysis: Component correlations
Component 1 2 3 4 5 6
1 1.000
2 .114 1.000
3 .393 .160 1.000
4 .132 .248 .189 1.000
5 .131 .171 .303 .384 1.000
6 .005 .289 .145 .156 .130 1.000 Extraction Method: Principal Component Analysis.
Rotation Method: Promax with Kaiser Normalization.
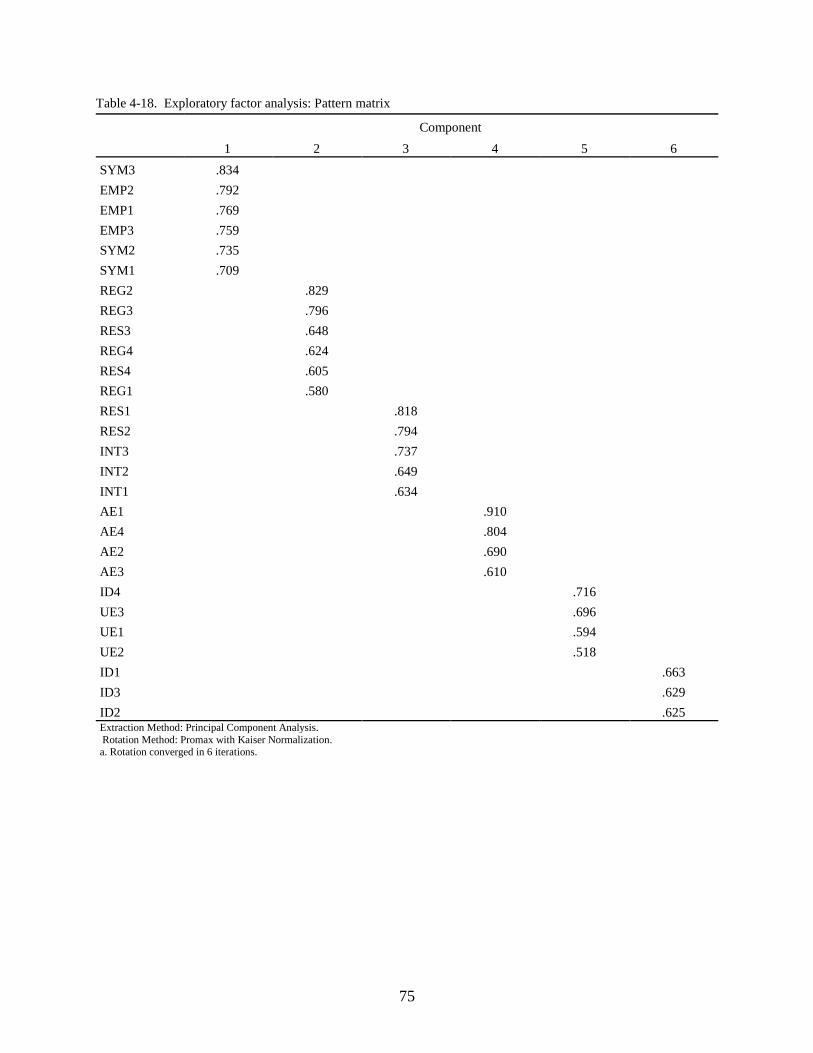
75
Table 4-18. Exploratory factor analysis: Pattern matrix
Component
1 2 3 4 5 6
SYM3 .834
EMP2 .792
EMP1 .769
EMP3 .759
SYM2 .735
SYM1 .709
REG2 .829
REG3 .796
RES3 .648
REG4 .624
RES4 .605
REG1 .580
RES1 .818
RES2 .794
INT3 .737
INT2 .649
INT1 .634
AE1 .910
AE4 .804
AE2 .690
AE3 .610
ID4 .716
UE3 .696
UE1 .594
UE2 .518
ID1 .663
ID3 .629
ID2 .625 Extraction Method: Principal Component Analysis.
Rotation Method: Promax with Kaiser Normalization. a. Rotation converged in 6 iterations.
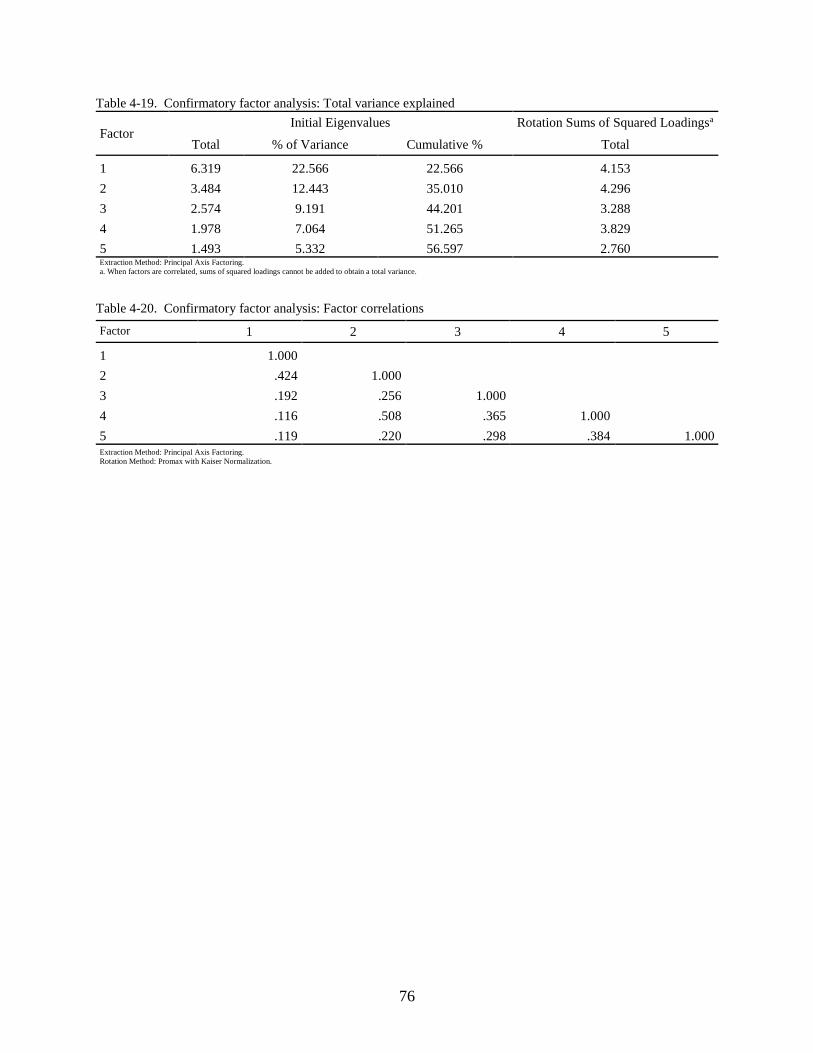
76
Table 4-19. Confirmatory factor analysis: Total variance explained
Factor Initial Eigenvalues Rotation Sums of Squared Loadingsa
Total % of Variance Cumulative % Total
1 6.319 22.566 22.566 4.153
2 3.484 12.443 35.010 4.296
3 2.574 9.191 44.201 3.288
4 1.978 7.064 51.265 3.829
5 1.493 5.332 56.597 2.760 Extraction Method: Principal Axis Factoring.
a. When factors are correlated, sums of squared loadings cannot be added to obtain a total variance.
Table 4-20. Confirmatory factor analysis: Factor correlations
Factor 1 2 3 4 5
1 1.000
2 .424 1.000
3 .192 .256 1.000
4 .116 .508 .365 1.000
5 .119 .220 .298 .384 1.000 Extraction Method: Principal Axis Factoring.
Rotation Method: Promax with Kaiser Normalization.

77
Table 4-21. Confirmatory factor analysis: Pattern matrix
Factor
1 2 3 4 5 6 (not retained)
SYM3 .779
EMP2 .750
SYM2 .712
EMP3 .697
EMP1 .691
SYM1 .640
RES1 .878
RES2 .844
INT3 .727
INT2 .596
INT1 .514
REG2 .788
REG3 .771
RES3 .571
RES4 .540
REG4 .511
REG1 .443
UE1 .767
ID1 .760
ID3 .705
ID4 .611
UE3 .506
UE2 .448
AE1 .766
AE4 .752
AE2 .543
AE3 .498
ID2 .447 -.499 Extraction Method: Principal Axis Factoring.
Rotation Method: Promax with Kaiser Normalization.
a. Rotation converged in 6 iterations.

78
Table 4-22. Pearson’s correlations, external construct validity testing: Emotional clarity
Emotional Clarity Clarity Compare
Emotional Clarity Pearson Correlation 1 .732**
Sig. (2-tailed) .000
N 223 223
Clarity Compare Pearson Correlation .732** 1
Sig. (2-tailed) .000
N 223 223 **. Correlation is significant at the 0.01 level (2-tailed).
Table 4-23. Pearson’s correlations, external construct validity testing: Emotional regulation
Emotional Regulation Regulate Compare
Emotional Regulation Pearson Correlation 1 .704**
Sig. (2-tailed) .000
N 223 223
Regulate Compare Pearson Correlation .704** 1
Sig. (2-tailed) .000
N 223 223 **. Correlation is significant at the 0.01 level (2-tailed).
Table 4-24. Pearson’s correlations, external construct validity testing: Social emotional ability level
Social
Emotional Ability Life Satisfaction
SEAD Pearson Correlation 1 .332**
Sig. (2-tailed) .000
N 223 223
Life Satisfaction Pearson Correlation .332** 1
Sig. (2-tailed) .000
N 223 223 **. Correlation is significant at the 0.01 level (2-tailed).
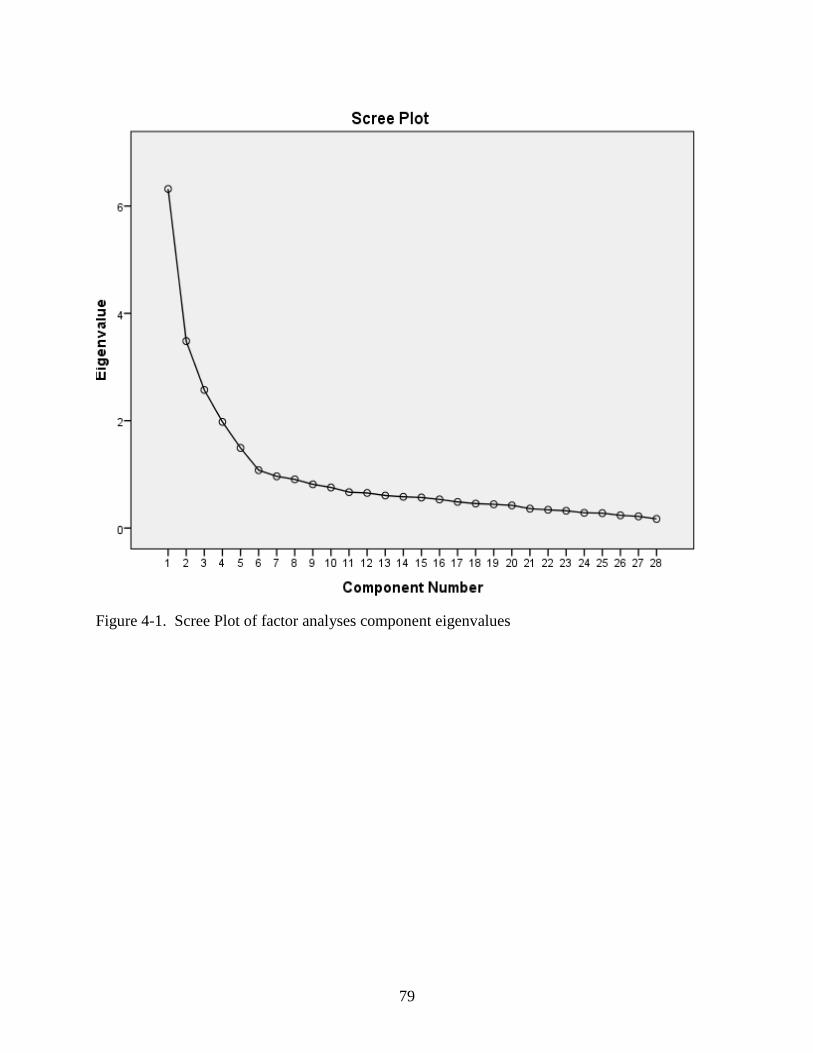
79
Figure 4-1. Scree Plot of factor analyses component eigenvalues
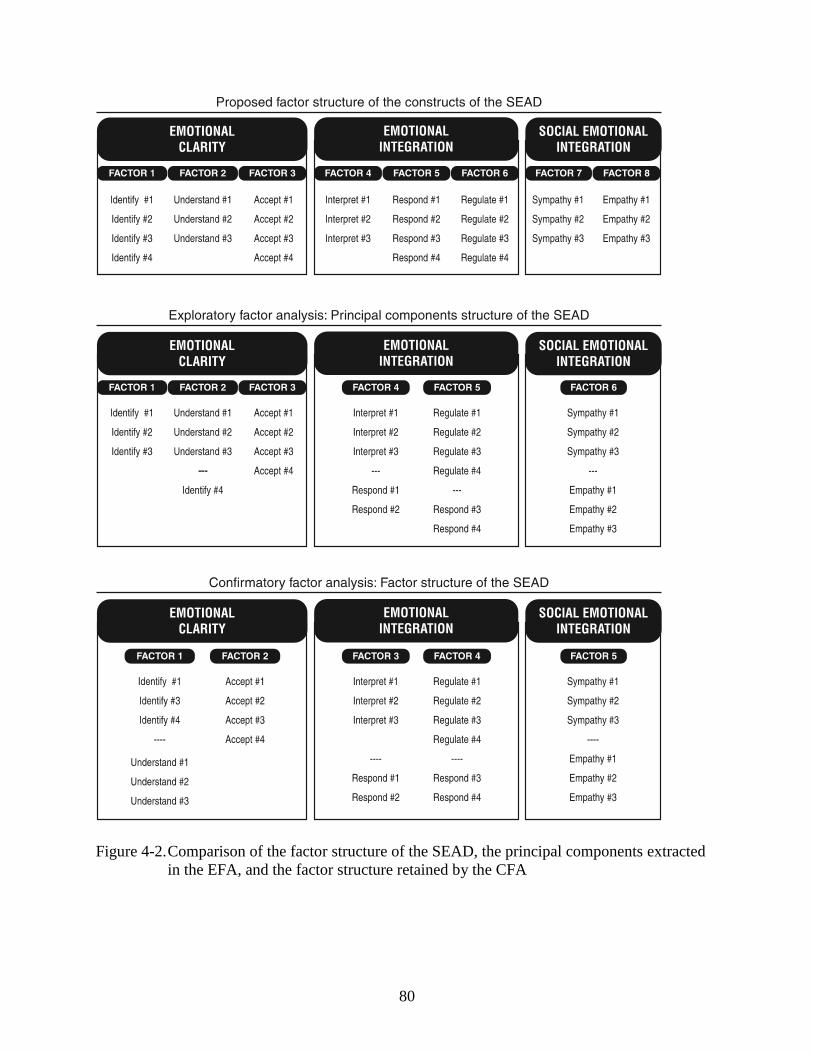
80
Figure 4-2. Comparison of the factor structure of the SEAD, the principal components extracted
in the EFA, and the factor structure retained by the CFA

81
CHAPTER 5
DISCUSSION
Overview
The purpose of this study was to expand the body of knowledge regarding developmental
processes of social emotional ability among individuals by providing justification for constructs
of the new theoretical model, the Hierarchy of Social Emotional Ability Development (Harris &
Anderson, 2015). This study was driven by the following research questions: 1). What are the
justifiable constructs of social emotional ability? 2). How can the constructs of the SEAD be
quantified in a valid and reliable survey instrument?
This current study was guided by the theoretical framework of Vygotsky’s Sociocultural
Theory of Development, and included a review of the literature that justified the validity of the
SEAD constructs, and a synthesis between constructs of the Sociocultural Theory of
Development and constructs of the SEAD theoretical model. This study also guided the
development a multi-item measurement instrument that provided reliable, valid discriminant
quantification of the constructs of the SEAD, and a Social Emotional Ability Score for
individuals.
Summary of the Findings
Research Question 1
The summary constructs of the SEAD were justified from existing research and
theoretical linkages in the body of knowledge, and the hierarchal progression of the SEAD was
shown to be logical. Empirical evidence provided by data collected utilizing the Social
Emotional Ability Inventory instrument also supported this hierarchal progression, and a
confirmatory factor analysis provided empirical evidence of the integrity of the factor structure
in relation to the constructs asserted by the SEAD.
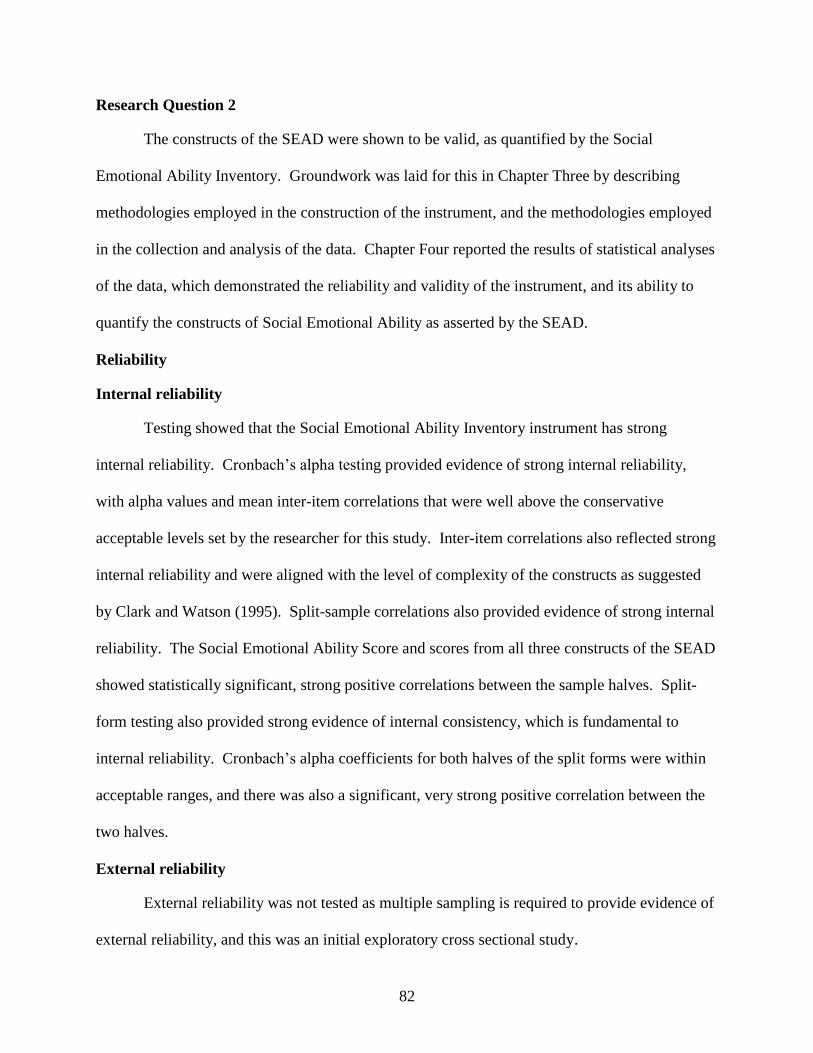
82
Research Question 2
The constructs of the SEAD were shown to be valid, as quantified by the Social
Emotional Ability Inventory. Groundwork was laid for this in Chapter Three by describing
methodologies employed in the construction of the instrument, and the methodologies employed
in the collection and analysis of the data. Chapter Four reported the results of statistical analyses
of the data, which demonstrated the reliability and validity of the instrument, and its ability to
quantify the constructs of Social Emotional Ability as asserted by the SEAD.
Reliability
Internal reliability
Testing showed that the Social Emotional Ability Inventory instrument has strong
internal reliability. Cronbach’s alpha testing provided evidence of strong internal reliability,
with alpha values and mean inter-item correlations that were well above the conservative
acceptable levels set by the researcher for this study. Inter-item correlations also reflected strong
internal reliability and were aligned with the level of complexity of the constructs as suggested
by Clark and Watson (1995). Split-sample correlations also provided evidence of strong internal
reliability. The Social Emotional Ability Score and scores from all three constructs of the SEAD
showed statistically significant, strong positive correlations between the sample halves. Split-
form testing also provided strong evidence of internal consistency, which is fundamental to
internal reliability. Cronbach’s alpha coefficients for both halves of the split forms were within
acceptable ranges, and there was also a significant, very strong positive correlation between the
two halves.
External reliability
External reliability was not tested as multiple sampling is required to provide evidence of
external reliability, and this was an initial exploratory cross sectional study.

83
Validity
According to Clark and Watson (1995), construct validity is one of the most important
aspects of research and as such is a critical component of rigor. Construct validity cannot be
measured directly, but is determined by evidence of theoretical validity and the presence of
internal and external convergent and discriminant validity. Evidence supporting theoretical
validity was provided from the literature.
Internal validity
Internal convergent and discriminant testing showed that the Social Emotional Ability
Inventory has strong internal convergent and discriminant validity and, therefore, strong internal
construct validity. Exploratory factor analysis revealed a simple six-component pattern matrix
solution for measuring the three constructs of the SEAD where none of the items cross-loaded
out of factor. This provided evidence of discriminant validity, and all items loaded onto only one
of the six components, which provided evidence of convergent validity. While several
components cross-loaded between dimensions, all did so within construct. The exploratory
factor analysis also supported the progressive, linear nature of the SEAD with each component
showing conformance with the theoretical model. Additionally, the confirmatory factor analysis
validated the theoretical construct structure of the SEAD model.
External validity
External convergent validity testing demonstrated strong external convergent validity
through significant positive strong correlations between concepts of the SEAD and the same or
very similar concepts measured by subscales adopted from the Difficulties in Emotion Regulation
Scale (Gratz & Roemer, 2004). A significant positive moderately strong correlation was also
shown to exist between Social Emotional Ability Scores provided by the SEAI and scores
provided by the Satisfaction with Life Scale (Diener, Emmons, Larsen, & Griffin, 1985).
84
External discriminant validity was not tested, as no scales measuring concepts opposite to those
proposed by the SEAD were inserted into the instrument.
Summary
Recall that the purpose of this study was to expand the body of knowledge regarding
developmental processes of social emotional ability by providing justification for the constructs
of the SEAD from the existing literature, and quantifying those constructs through the
development of a valid, reliable instrument with the ability to provide incremental measurements
for constructs of the SEAD model and a composite Social Emotional Ability Score for
individuals. According to the reported findings, these study objectives have been accomplished.
The research questions, which were designed to accomplish these goals, have also been
answered. The present study has shown that the constructs of the SEAD are justified by
providing supportive research from the literature and by developing linkages between existing
theoretical frameworks and the theoretical constructs of the SEAD model. Statistical analysis of
the data provided empirical justification for the quantification of social emotional ability and
constructs of the SEAD through measurement of the eight dimensions, as specified by the
theoretical model. Results demonstrated that the instrument has strong internal reliability and
construct validity, and measures the intended latent constructs. Confirmatory factor analysis
demonstrated that the factor structure exactly mirrors the theoretical construct structure of the
SEAD model. External convergent and congruent validity were demonstrated by significant
strong positive correlations with existing instruments. And the Social Emotional Ability Score
generated by the instrument showed a significant positive correlation with the Satisfaction with
Life Score, as predicted by the SEAD model.
85
Important Implications
Maslow’s seminal work, Hierarchy of Needs (1954) proposes that social engagement is a
basic human need (Huitt, 2007), and social engagement is an important predictor of well-being,
life satisfaction, and happiness (Baumeister, Vohs, Aaker, & Garbinsky 2013; Cialdini &
Patrick, 2009; Lambert et al., 2010).
This study holds important and far-reaching implications for individuals, educators,
practitioners, and researchers because it addresses the processes at play in development of an
individual’s ability to participate in social engagement. It is important to keep in mind that the
SEAD model provides a developmental roadmap that addresses eight social emotional abilities,
which are teachable within the domains of individuals, couple relationships, parenting,
education, and professional remediation, among others. Also, the Social Emotional Ability
Inventory provides scores for each of the abilities identified in the SEAD model; as a result, the
SEAI might therefore be used as a diagnostic instrument to provide guidance within these
domains.
Additionally, results of the Flesch Kincaid Grade Index (Wilson, Rosenberg, & Hyatt,
1997) indicate that comprehension of the Social Emotional Ability Inventory requires an 8th
grade reading level, which suggests that subject to further development, the SEAI might be
deployed among a wide range of populations.
For Individuals
Individuals might use results from the Social Emotional Ability Inventory to guide efforts
to improve their social emotional ability, and thereby improve their social engagement
experiences and level of life satisfaction. Parents might use guidance provided by the Social
Emotional Ability Development model to help provide direction for childrearing, to teach
emotional regulation, sympathy, and empathy skills, and to improve inter-familial interaction.

86
For Educators
Educators might use guidance provided by the Social Emotional Ability Development
model for developing or expanding curricula important to student development, personal and
professional development, and to address the improvement of all manner of relationships,
including curricula directed toward family relationships, couple relationships, and interactions in
the workplace.
For Practitioners
For practitioners, the eight dimensions of social emotional ability development could be
used as a diagnostic tool to increase awareness and understanding of their influences on contexts,
such as family backgrounds and childhood experiences, adaptive or maladaptive individual traits,
and learned interactional processes that promote or inhibit healthy social interaction. Each
dimension could also be incorporated into therapeutic practices such as cognitive-behavioral and
emotion-focused therapy to assist clients with better processing of their emotions and increased
empowerment toward healthy decision-making.
For Researchers
Researchers might use the model and the instrument to more completely investigate and
explain the relationship between social interaction and life satisfaction, and to develop
programming that may mediate specific impacts of low socialization. Further research is
necessary to confirm and expand the findings of this study, and to provide evidence of external
reliability and external discriminant validity. Further studies are also necessary to refine the
within-construct discriminant capability of the instrument in order to improve accuracy and to
improve its utility as a diagnostic tool. This would greatly simplify use of the instrument by
laypersons, educators, and researchers if all eight dimensions of the SEAD were discriminately
measured by the same number of items with the potential to yield comparable scores without

87
employing complex weighting formulae. And, following refinement of the instrument, it would
provide further support for the validity of the constructs of the SEAD and evidence of
scaffolding as proposed by the theoretical framework of the model to examine relationships
between Emotional Clarity mean scores and Social Emotional Integration mean scores for the
bottom quartiles of the sample to confirm that higher levels of fundamental emotional abilities
are related to higher levels of social emotional integration.
Cautions and Limitations
It should be kept in mind that this was an initial exploratory study, and results were not
intended to be and are not generalizable. Sampling was not random, and the sample was biased
in ways likely to affect the study outcome; the sample was composed of a disproportionate ratio
of females (85.6%) to males (14.4%); Research suggests that females are generally more
emotionally complex than males, and also have a greater ability to recognize and interpret
emotions (Wied, Branje, & Meeus, 2007). The sample was also composed disproportionately of
young people. The mean age was 21, and the age range was 19 - 32, which would preclude male
participants with college aged children. Research suggests that fathers with college aged
students report significantly lower emotional abilities than their respective aged college students
regardless of gender, and the mother of those children (Guastello & Guastello, 2003).
These sample biases likely had a lowering effect on variance, which would likely result
in lower correlations—making results of this study somewhat lower than those likely to be
obtained from a more representative sample. Also, there is an absence of external discriminant
testing, as no measurements of concepts opposite to those proposed in the SEAD model were
taken. As this was an initial exploratory study, there is no evidence of external reliability, which
is normatively provided by replication.
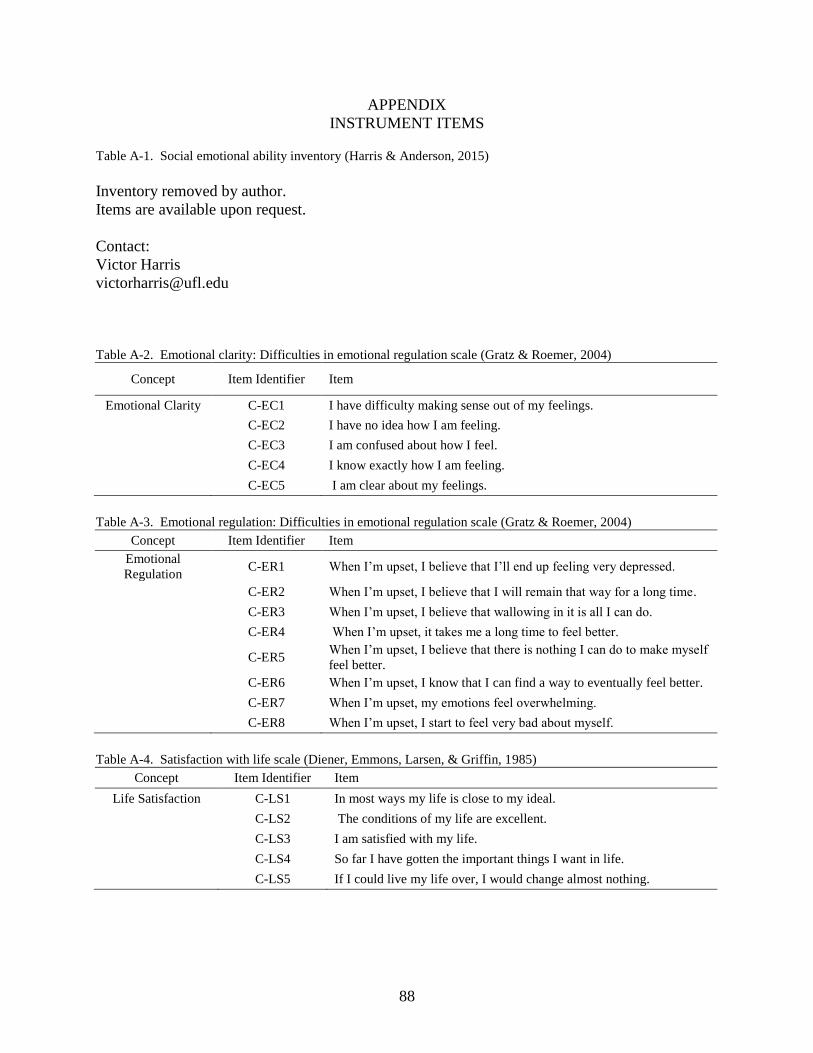
88
APPENDIX
INSTRUMENT ITEMS
Table A-1. Social emotional ability inventory (Harris & Anderson, 2015)
Inventory removed by author.
Items are available upon request.
Contact:
Victor Harris
Table A-2. Emotional clarity: Difficulties in emotional regulation scale (Gratz & Roemer, 2004)
Concept Item Identifier Item
Emotional Clarity C-EC1 I have difficulty making sense out of my feelings.
C-EC2 I have no idea how I am feeling.
C-EC3 I am confused about how I feel.
C-EC4 I know exactly how I am feeling.
C-EC5 I am clear about my feelings.
Table A-3. Emotional regulation: Difficulties in emotional regulation scale (Gratz & Roemer, 2004)
Concept Item Identifier Item
Emotional
Regulation C-ER1 When I’m upset, I believe that I’ll end up feeling very depressed.
C-ER2 When I’m upset, I believe that I will remain that way for a long time.
C-ER3 When I’m upset, I believe that wallowing in it is all I can do.
C-ER4 When I’m upset, it takes me a long time to feel better.
C-ER5 When I’m upset, I believe that there is nothing I can do to make myself
feel better.
C-ER6 When I’m upset, I know that I can find a way to eventually feel better.
C-ER7 When I’m upset, my emotions feel overwhelming.
C-ER8 When I’m upset, I start to feel very bad about myself.
Table A-4. Satisfaction with life scale (Diener, Emmons, Larsen, & Griffin, 1985)
Concept Item Identifier Item
Life Satisfaction C-LS1 In most ways my life is close to my ideal.
C-LS2 The conditions of my life are excellent.
C-LS3 I am satisfied with my life.
C-LS4 So far I have gotten the important things I want in life.
C-LS5 If I could live my life over, I would change almost nothing.
89
REFERENCES
Allemand, M., Steiger, A. E., & Fend, H. A. (2015; 2014). Empathy development in adolescence
predicts social competencies in adulthood Journal of Personality, 83(2), 229.
doi:10.1111/jopy.12098
Agarwal, N. K. (2011). Verifying survey items for construct validity: A two‐stage sorting
procedure for questionnaire design in information behavior research. Proceedings of the
American Society for Information Science and Technology, 48(1), 1-8.
Baker, R., Brick, J. M., Bates, N. A., Battaglia, M., Couper, M. P., Dever, J. A., ... &
Tourangeau, R. (2013). Summary report of the AAPOR task force on non-probability
sampling. Journal of Survey Statistics and Methodology, 1(2), 90-143.
Bar-On, R., & Parker, J. D. (2000). The handbook of emotional intelligence: Theory,
development, assessment, and application at home, school, and in the workplace. San
Francisco, CA: Jossey-Bass.
Barry, A. E., Chaney, E. H., Stellefson, M. L., & Chaney, J. D. (2011). So you want to develop a
survey: Practical recommendations for scale development. American Journal of Health
Studies, 26(2).
Bartlett, M. S. (1954). A note on the multiplying factors for various χ2 approximations. Journal
of the Royal Statistical Society. Series B (Methodological), 16(2), 296-298.
Baumeister, R., Vohs, K., Aaker, J., & Garbinsky, E. (2013). Some key differences between a
happy life and a meaningful life. Journal of Positive Psychology, 8(6), 505-516.
doi:10.1080/17439760.2013.830764
Beavers, A. S., Lounsbury, J. W., Richards, J. K., Huck, S. W., Skolits, G. J., & Esquivel, S. L.
(2013). Practical considerations for using exploratory factor analysis in educational
research. Practical assessment, research & evaluation, 18(6), 1-13.
Berger, K. S., & Thompson, R. A. (1991). The developing person through childhood and
adolescence (3rd ed.). New York, N.Y: Worth Publishers.
Bhattacherjee, A. (2012). Social science research: principles, methods, and practices. Retrieved
from http://scholarcommons.usf.edu/oa_textbooks/3/
Boden, M., Thompson, R., Dizen, M., Berenbaum, H., & Baker, J. (2013). Are emotional clarity
and emotion differentiation related? Cognition & Emotion, 27(6), 961-978.
doi:10.1080/02699931.2012.751899
Brackett, M. A., & Salovey, P. (2006). Measuring emotional intelligence with the Mayer-
Salovey-Caruso Emotional Intelligence Test (MSCEIT). Psicothema, 18, 34-41.

90
Bryman, A. (2012). Social research methods. Oxford University Press. Oxford, UK.
Broderick, P. C., & Jennings, P. A. (2012). Mindfulness for adolescents: A promising approach
to supporting emotion regulation and preventing risky behavior. New Directions for
Youth Development, 2012(136), 111-126. doi:10.1002/yd.20042
Chapman, A. L., Dixon-Gordon, K. L., & Walters, K. N. (2011). Experiential avoidance and
emotion regulation in borderline personality disorder. Journal of Rational- Emotive &
Cognitive-Behavior Therapy, 29(1), 35-52.
Cherniss, C., Extein, M., Goleman, D., & Weissberg, R. P. (2006). Emotional intelligence: What
does the research really indicate? Educational Psychologist, 41(4), 239-245.
doi:10.1207/s15326985ep4104_4
Cialdini, J. T., & Patrick, W. (2008). Loneliness. New York: Norton.
Clark, L. A., & Watson, D. (1995). Constructing validity: Basic issues in objective scale
development. Psychological assessment, 7(3), 309.
Cohen, J. (1992). A power primer. Psychological bulletin, 112(1), 155.
Cohen, M. T. (2012). The importance of self-regulation for college student learning. College
Student Journal, 46(4), 892. doi:10.1037/0033-2909.112.1.155
Corder, G. W., & Foreman, D. I. (2014). Nonparametric statistics: a step-by-step approach. John
Wiley & Sons.
Decety, J., & Lamm, C. (2006). Human empathy through the lens of social neuroscience. The
Scientific World Journal, 6, 1146-1163.
Decety, J., & Michalska, K. J. (2010). Neurodevelopmental changes in the circuits underlying
empathy and sympathy from childhood to adulthood. Developmental science, 13(6), 886-
899.
Denham, S., Bassett, H., & Wyatt, T. (2010). Gender differences in the socialization of
preschoolers' emotional competence. (pp. 29-49). San Francisco: Wiley Periodicals.
doi:10.1002/cd.267
Denham, S. A., Zinsser, K. M., & Brown, C. A. (2012). The emotional basis of learning and
development in early childhood education. In B. Spodek & O. Saracho (Eds.), Handbook
of research on the education of young children (3nd Ed., pp. 67–88). New York, NY:
Lawrence Erlbaum.
Diener, E. D., Emmons, R. A., Larsen, R. J., & Griffin, S. (1985). The satisfaction with life
scale. Journal of personality assessment, 49(1), 71-75.

91
Domitrovich, C. E., Cortes, R. C., & Greenberg, M. T. (2007). Improving young children’s
social and emotional competence: A randomized trial of the preschool “PATHS”
curriculum. The Journal of Primary Prevention, 28(2), 67-91.
Eisenberg, N. (2000). Emotion, regulation, and moral development. Annual Review of
Psychology, 51, 665-697.
Eisenberg, N., Zhou, Q., & Koller, S. (2001). Brazilian adolescents’ prosocial moral judgment
and behavior: Relations to sympathy, perspective taking, gender-role orientation, and
demographic characteristics. Child Development, 72(2), 518-534. doi: 10.1111/1467-
8624.00294
Eisenberg, N., Cumberland, A., Guthrie, I. K., Murphy, B. C., & Shepard, S. A. (2005). Age
changes in prosocial responding and moral reasoning in adolescence and early adulthood.
Journal of research on adolescence, 15(3), 235-260.
Ekman, P. (2003). Emotions revealed: Recognizing faces and feelings to improve communication
and emotional life. New York, NY: Times Books.
Fine, M. A., & Fincham, F. D. (2013). Handbook of family theories: A content-based approach.
GB: Routledge Ltd. doi:10.4324/9780203075180
Flynn, M., & Rudolph, K. D. (2010). The contribution of deficits in emotional clarity to stress
responses and depression. Journal of Applied Developmental Psychology, 31(4), 291-
297. doi:10.1016/j.appdev.2010.04.004
French, G., (2007). Children’s early learning and development. National council for curriculum
and assessment. Retrieved from http://www.ncca.ie
Friel, J., & Friel, L. (1998). Adult children: The secrets of dysfunctional families. Deerfield
Beach, Florida: Health Communications, Inc., 107-109, 117.
Garson, G. D. (2009). Reliability analysis: Statnotes. North Carolina State University [E-book
chapter]. Retrieved from http://faculty.chass.ncsu.edu/garson/PA765/statnote.htm
Gliem, R. R., & Gliem, J. A. (2003). Calculating, interpreting, and reporting Cronbach’s alpha
reliability coefficient for Likert-type scales. Midwest Research-to-Practice Conference in
Adult, Continuing, and Community Education.
Gohm, C. L., Corser, G. C., & Dalsky, D. J. (2005). Emotional intelligence under stress: Useful,
unnecessary, or irrelevant? Personality and Individual Differences, 39(1), 1017-1028.
Goodwin, L. D., & Leech, N. L. (2006). Understanding correlation: Factors that affect the size of
r. The Journal of Experimental Education, 74(3), 249-266.

92
Gratz, K. L., Bornovalova, M. A., Delany-Brumsey, A., Nick, B., & Lejuez, C. W. (2007). A
laboratory-based study of the relationship between childhood abuse and experiential
avoidance among inner-city substance users: The role of emotional nonacceptance
Behavior Therapy, 38(3), 256 - 268. doi:10.1016/j.beth.2006.08.006
Gratz, K. L. & Roemer, L. (2004). Multidimensional assessment of emotion regulation and
dysregulation: Development, factor structure, and initial validation of the Difficulties in
Emotion Regulation Scale. Journal of Psychopathology and Behavioral Assessment, 26,
41-54.
Greenberg, L. S. (2002). Emotion-focused therapy: Coaching clients to work through their
feelings. Washington, DC: American Psychological Association.
Gottman, J. M., Katz, L. F., & Hooven, C. (1997). Meta-emotion: How families communicate
emotionally. Mahwah, NJ: Lawrence Erlbaum Associates.
Gu, X., Liu, X., Van Dam, N., Hof, P., & Fan, J. (2013). Cognition-emotion integration in the
anterior insular cortex. Cerebral Cortex, 23(1), 20-27. doi:10.1093/cercor/bhr367
Guastello, D. D., & Guastello, S. J. (2003). Androgyny, gender role behavior, and emotional
intelligence among college students and their parents. Sex roles, 49(11-12), 663-673.
Helm, B. W. (2009). Emotions as evaluative feelings. Emotion Review, 1(3), 248-255.
doi:10.1177/1754073909103593
Hinkin, T. R., Tracey, J. B., & Enz, C. A. (1997). Scale construction: Developing reliable and
valid measurement instruments. Journal of Hospitality & Tourism Research, 21(1), 100-
120.
Harris, V. W. & Anderson, J. W. (2015). Validating constructs of social emotional ability
development. [Unpublished manuscript] University of Florida
Hof, M. (2012). Questionnaire evaluation with factor analysis and Cronbach’s Alpha: An
example. [Course material]. Retrieved fromhttp://www.rug.nl/?lang=en
Huitt, W. (2007). Maslow's hierarchy of needs. Educational Psychology Interactive. Valdosta,
GA: Valdosta State University. Retrieved from
http://www.edpsycinteractive.org/topics/regsys/maslow.html
Ivcevic, Z., & Brackett, M. (2014). Predicting school success: Comparing conscientiousness,
grit, and emotion regulation ability. Journal of Research in Personality, 52, 29-36.
doi:10.1016/j.jrp.2014.06.005
John-Steiner, V., & Mahn, H. (1996). Sociocultural approaches to learning and development: A
Vygotskian framework. Educational Psychologist, 31(3-4), 191-206.
doi:10.1207/s15326985ep3103&4_4

93
Kaiser, H. F. (1960). The application of electronic computers to factor analysis. Educational and
Psychology Measurement, 20, 141-151.
Kaiser, H. (1970). A second generation little jiffy. Psychometrika, 35(4), 401-415.
doi:10.1007/BF02291817
Kaiser, H. (1974). An index of factorial simplicity. Psychometrika, 39(1), 31-36.
doi:10.1007/BF02291575Kienbaum, J. (2014). The development of sympathy from 5 to 7
years: Increase, decline, or stability? A longitudinal study. Frontiers in Psychology, 5,
468. doi:10.3389/fpsyg.2014.00468
Kang, Y., & Harring, J. R. (2012). Investigating the impact of non-normality, effect size, and
sample size on two-group comparison procedures: An empirical study. Presented at the
annual meeting of the American Educational Research Association (AERA), SIG:
Educational Statisticians, Vancouver, BC.
Kihlstrom, J.F. & Cantor, N. (2011). Social intelligence. Retrieved from
http://socrates.berkeley.edu/~kihlstrm/social_intelligence.htm
Kraker, M. J. (2000). Classroom discourse: Teaching, learning, and learning disabilities.
Teaching and Teacher Education, 16(3), 295-313. doi:10.1016/S0742-051X(99)00063-3
Laible, D. J., & Carlo, G. (2004). The differential relations of maternal and paternal support and
control to adolescent social competence, self-worth, and sympathy. Journal of Adolescent
Research, 19(6), 759-782. doi:10.1177/0743558403260094
Lambert, N.M., Stillman, T.F., Baumeister, R.F., Fincham, F.R., Hicks, J.A., & Graham, S.M.
(2010). Family as a salient source of meaning in young adulthood. Journal of
PositivePsychology, 5, 367-376.
Lopes, P. N., Salovey, P., Côté, S., & Beers, M. (2005). Emotion regulation abilities and the
quality of social interaction (R. E. Petty, Ed.). Emotion, 5(1), 113-118.
doi: 10.1037/1528-3542.5.1.113
Lopes, P. N., Brackett, M. A., Nezlek, J. B., Schütz, A., Sellin, I., & Salovey, P. (2004).
Emotional intelligence and social interaction. Personality & Social Psychology Bulletin,
30(8), 1018-1034. doi:10.1177/0146167204264762
Matsumoto, D. (2009). The origin of universal human emotions. San Francisco: San Francisco
State University.
Morse, J. M. (2015). Critical analysis of strategies for determining rigor in qualitative inquiry.
Qualitative health research, 25(9), 1212-1222.Maslow, A. (1954). Motivation and
personality. New York: Harper.
94
Nolen-Hoeksema, S. (2012). Emotion regulation and psychopathology: The role of gender.
Annual Review of Clinical Psychology, 8(1), 161-187. doi:10.1146/annurev-clinpsy-
032511-143109
Neuendorf, K. A. (2016). Internal consistency reliability: Can Cronbach’s alpha be too high?
[Course material]. Retrieved from
http://academic.csuohio.edu/kneuendorf/c63111/hand5a.pdf
Ochsner, K. N., Silvers, J. A., & Buhle, J. T. (2012). Functional imaging studies of emotion
regulation: A synthetic review and evolving model of the cognitive control of emotion.
Annals of the New York Academy of Sciences, 1251(1).
Osborne, J. W., & Costello, A. B. (2005). Best practices in exploratory factor analysis: Four
recommendations for getting the most from your analysis. Practical assessment, research
& evaluation, 10(7), 1-9.
Pentimonti, J. M., & Justice, L. M. (2010). Teachers’ use of scaffolding strategies during read
alouds in the preschool classroom. Early Childhood Education Journal, 37(4), 241-248.
doi:10.1007/s10643-009-0348-6
Pett, M. A., Lackey, N. R., & Sullivan, J. J. (2003). Making sense of factor analysis: The use of
factor analysis for instrument development in health care research. Sage.
Prinz, J. (2011). Against empathy. The Southern Journal of Philosophy, 49, 214-233.
doi:10.1111/j.2041-6962.2011.00069.x
Shallcross, A. J., Troy, A. S., Boland, M., & Mauss, I. B. (2010). Let it be: Accepting negative
emotional experiences predicts decreased negative affect and depressive symptoms.
Behaviour Research and Therapy, 48(9), 921-929. doi:10.1016/j.brat.2010.05.025
Silk, J. S., Steinberg, L., & Morris, A. S. (2003). Adolescents’ emotion regulation in daily life:
Links to depressive symptoms and problem behavior. Child Development, 74(6), 1869-
1880.
Singer, T., & Lamm, C. (2009). The social neuroscience of empathy. Annals of the New York
Academy of Sciences, 1156(1), 81-96.
Spackman, M. P., Fujiki, M., & Brinton, B. (2006). Understanding emotions in context: The
effects of language impairment on children's ability to infer emotional reactions.
International Journal of Language & Communication Disorders, 41(2), 173-188.
doi:10.1080/13682820500224091
Suhr, D. D. (2005). Principal component analysis vs. exploratory factor analysis. SUGI 30
proceedings, 203, 230.

95
Swisher, M. E. (2016). Some useful techniques for operationalization. [Swisher Cheat Sheet].
Retrieved from http://fycs.ifas.ufl.edu/swisher/6802_16/Operationalization.pdf
UCLA (2016). What does Cronbach's alpha mean? Retrieved from
http://www.ats.ucla.edu/stat/spss/faq/alpha.html
Vossen, H. G., Piotrowski, J. T., & Valkenburg, P. M. (2015). Development of the adolescent
measure of empathy and sympathy (AMES). Personality and Individual Differences, 74,
66-71.
Wang, N., Wilhite, S. C., Wyatt, J., Young, T., Bloemker, G., & Wilhite, E. (2012). Impact of a
college freshman social and emotional learning curriculum on student learning outcomes:
An exploratory study. Journal of University Teaching and Learning Practice, 9(2)
Retrieved fromhttp://ro.uow.edu.au/jutlp/
Waters, H.S., (2013). Sociocultural theories of development. [Class lecture PowerPoint]. Stony
Brook University, N.Y. Retrieved from http://www.stonybrook.edu
Wied, M. D., Branje, S. J., & Meeus, W. H. (2007). Empathy and conflict resolution in
friendship relations among adolescents. Aggressive Behavior, 33(1), 48-55. doi:
10.1002/ab.20166
Williams, L. E., Bargh, J. A., Nocera, C. C., & Gray, J. R. (2009). The unconscious regulation of
emotion: nonconscious reappraisal goals modulate emotional reactivity. Emotion, 9(6),
847.
Williams, B., Brown, T., & Onsman, A. (2012). Exploratory factor analysis: A five-step guide
for novices. Australasian Journal of Paramedicine, 8(3), 1.
Williams, R. (2014). Missing data part 1: Overview, traditional methods. Retrieved from
http://www3.nd.edu/~rwilliam/
Wilson, W. M., Rosenberg, L. H., & Hyatt, L. E. (1997, May). Automated analysis of
requirement specifications. In Proceedings of the 19th international conference on
Software engineering (pp. 161-171). ACM.
Wilton, M. M., Craig, W. M., & Pepler, D. J. (2000). Emotional regulation and display in
classroom victims of bullying: Characteristic expressions of affect, coping styles and
relevant contextual factors. Social Development, 9(2), 227-245. doi: 10.1111/1467-
9507.00121
Wuensch, K.L. (2012). Karl Wuensch's statistics lessons. East Carolina University Department
of Psychology. Retrieved from http://core.ecu.edu

96
BIOGRAPHICAL SKETCH
Jonathan William Anderson attended public school in Dade County, Florida, and entered
the workforce in 1963 immediately following high school. Jonathan was drafted into the
military in 1966 and served with the U.S. Army in the Vietnam War during 1968. Following his
military service, Jonathan owned and operated several successful businesses.
After 45 years as a businessman, Jonathan decided to attend college, and began classes at
SantaFe College in Alachua County, Florida in the summer of 2010. After earning his Associate
of Arts degree in the spring of 2012, Jonathan began attending classes at the University of
Florida’s (UF) College of Agriculture and Life Science, Department of Family, Youth and
Community Science (FYCS). He earned a Bachelor of Science degree with a major in FYCS
and a minor in international studies. Jonathan graduated cum laude and was selected as one of
two outstanding scholars for the summer 2014 commencement.
As an undergraduate, Jonathan became keenly interested in the processes whereby
individuals develop social emotional abilities, and when he began attending graduate school in
the fall of 2014 he chose this as the subject area for his master’s thesis. In December of 2016,
Jon earned a Master of Science from UF in family, youth and community science. Throughout
his time in college, Jon maintained a 4.0 grade point average.