Embed Size (px)
Citation preview

© 2014
Stacy Smulowitz
ALL RIGHTS RESERVED
PLANNED ORGANIZATIONAL CHANGE IN HIGHER EDUCATION: DASHBOARD
INDICATORS AND STAKEHOLDER SENSEMAKING-A CASE STUDY
By
STACY SMULOWITZ
A dissertation submitted to the
Graduate School-New Brunswick
Rutgers, The State University of New Jersey
in partial fulfillment of the requirements
for the degree of
Doctor of Philosophy
Graduate Program in
Communication, Information and Library Studies
Written under the direction of
Professor Brent D. Ruben
And approved by
____________________________
____________________________
____________________________
____________________________
New Brunswick, New Jersey
January, 2014
ii
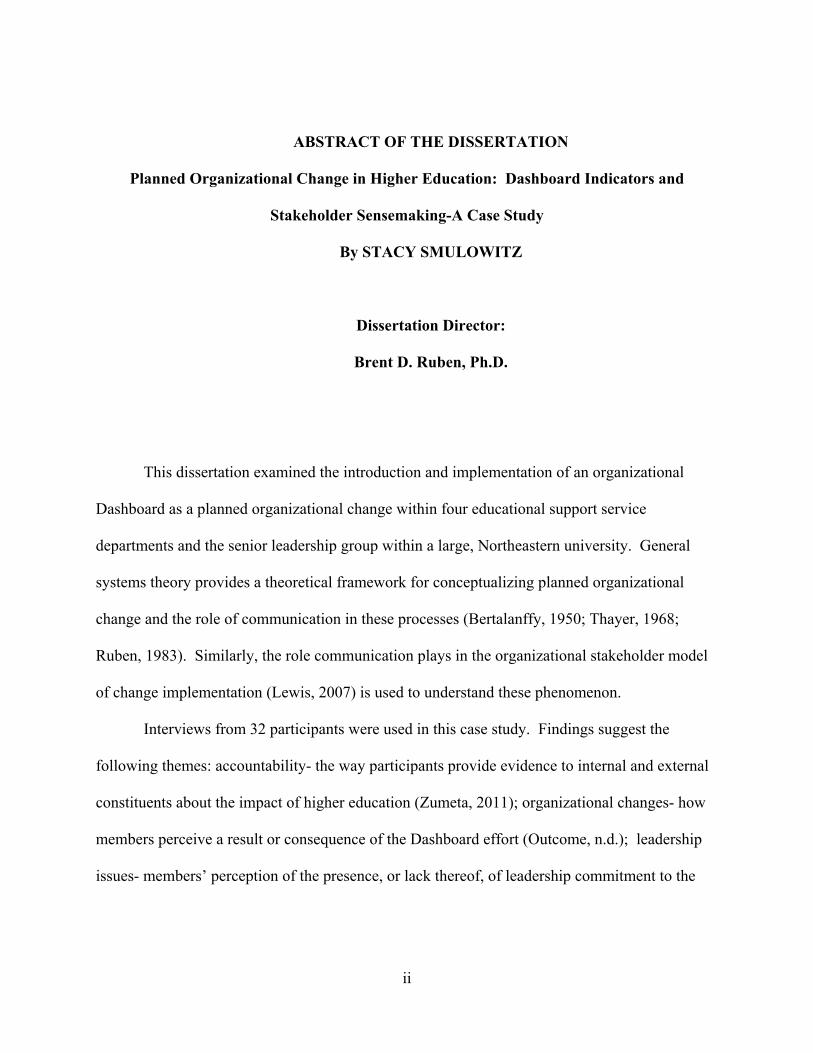
ABSTRACT OF THE DISSERTATION
Planned Organizational Change in Higher Education: Dashboard Indicators and
Stakeholder Sensemaking-A Case Study
By STACY SMULOWITZ
Dissertation Director:
Brent D. Ruben, Ph.D.
This dissertation examined the introduction and implementation of an organizational
Dashboard as a planned organizational change within four educational support service
departments and the senior leadership group within a large, Northeastern university. General
systems theory provides a theoretical framework for conceptualizing planned organizational
change and the role of communication in these processes (Bertalanffy, 1950; Thayer, 1968;
Ruben, 1983). Similarly, the role communication plays in the organizational stakeholder model
of change implementation (Lewis, 2007) is used to understand these phenomenon.
Interviews from 32 participants were used in this case study. Findings suggest the
following themes: accountability- the way participants provide evidence to internal and external
constituents about the impact of higher education (Zumeta, 2011); organizational changes- how
members perceive a result or consequence of the Dashboard effort (Outcome, n.d.); leadership
issues- members’ perception of the presence, or lack thereof, of leadership commitment to the
iii
Dashboard effort (Commitment, n.d.)1; information exchange- how members perceive the focus
on the exchange of information about the Dashboard effort; and the overarching theme of
communication- the process through which sensemaking and negotiation occur through social
interactions (Berger & Luckmann, 1967).
Findings suggest that communication is necessary to understand planned organizational
change and change effort strategies because people negotiate meanings of the change effort
through communication and as a result their perceptions of the effort based on communication
can stall, promote or halt the change effort itself (Ruben, 2009a). Many of the three
organizational levels of employees studied had different perceptions about the change effort
because of their different perceptions of reality which stem from their membership in different
organizational levels (Gallivan, 2001; Ruben, 1979; Thayer, 1979).
Findings also suggest the importance of leadership and continuous facilitation of the
change effort. A perceived shift in focus by leaders from the effort may be viewed by others in
the organization as a lack of commitment which can stall or halt the effort. A change agent of
the effort is imperative to keep the leader visibly engaged and others in the organization actively
focused on results, especially in loosely coupled organizations such as institutions of higher
education.
1 The designation for Commitment, n.d. is required by APA format to designate a term found in a resource such as a dictionary. In these instances a dictionary was used to formally define terms associated with some themes. As such, the dictionary term, i.e. commitment, was defined and listed in APA format.
iv
Acknowledgements
To complete a dissertation takes the support, advice and encouragement of many people.
I am grateful to my advisor and chairperson Dr. Brent Ruben for his guidance, support and
encouragement. His untiring reviewing of my rough drafts from locations all over the world and
at all times of the day and night were a source of inspiration to me.
I owe special thanks to the members of my committee, Dr. Laurie Lewis, Dr. Lea
Stewart, and Dr. James Giarelli, who encouraged me to reach for the stars. Thanks also to Dr.
Kate Immordino, Sherri Tromp, and Barbara Corso in the Rutgers Center for Organizational
Development and Leadership. Thanks also to Joan Chabrak; her eagerness to escort me through
the academic process provided much help to me.
To my academic family, Dr. Christina Beck, Dr. Jane Elmes-Crahall, Dr. Diane Gayeski,
and Dr. Jan Kelly, who provided unending guidance, support and encouragement; I am indebted
to them. Their dedication to my career has been paramount to my successes.
I am thankful for the best friends, Christine, Doreen & Tim, Ellen, Joan, Meredith,
Melissa, Patty, and Sue, who have supported me through the last eight years.
To my wonderful family, Grammy, Mom, Dad, Gigi, Jack, Grandma Martha, the Aukers,
Rosie, Jerry, Carol, Pat, Marty, Sta, Lois, Tony, Genene, Beth, Marc, Judy, Steve, Mark, and
Sister Carolyn, who have supported me, encouraged me, cared for my children and prayed for
me throughout this process.
This dissertation is dedicated to the most significant people in my life; my husband John,
daughter Victoria, and son Alexander. Their love, patience, and cooking while Mommy was
working allowed me to complete this lifelong dream.
v
TABLE OF CONTENTS
ABSTRACT iiACKNOWLEDGEMENTS ivTABLE OF CONTENTS vLIST OF TABLES x
INTRODUCTION PURPOSE OF THE DISSERTATION
Introduction 1Purpose of the dissertation 2Research questions 9Organization of dissertation 10
CHAPTER ONE THE NATURE OF ORGANIZATIONAL CHANGE
What is organizational change? 11Why organizational change is an important issue 12Characteristics of planned and unplanned change 12The origin of change 12The “magnitude of change” 12The effect of planned change on organizations 13Research on the success and failure of planned change efforts 14Theoretical framework 19Core concepts for understanding organizational change 22Individual reality and meaning 26The information-communication relationship 28Communication, social units and meaning 30
CHAPTER TWO APPROACHES TO THE PROCESS OF PLANNED ORGANIZATIONAL CHANGE
Strategies for planned organizational change efforts 35Fundamental research on organizational change 35Training and the promotion of change 36Change agents 37Information gathering and dissemination 37Focus on productivity and quality-of-work-life (QWL)/quality circles 38The socio-technical debate 39Models of organizational change 40Unfreeze, change, freeze 40Five-phase model of change 40Organizational change guidelines 41
vi
Readiness for change 41Stages of change 42Rational, normative and power strategies 42Performance measurement systems 44What is a performance measurement system? 44How does performance measurement fit into the bigger system? 45Why is performance measurement an important focus for many organizations? 46Examples of performance measurement strategies 46Performance measurement strategies distinctive to industry 47Balanced Scorecard 47Dashboard 48Six Sigma 48Lean 49Kaizan 50ISO 51Malcolm Baldrige National Quality Award program 51Performance measurement strategies distinctive to higher education 52Excellence in Higher Education 52Regional accreditation programs 53
CHAPTER THREE METHOD
Dissertation purpose 55Research questions 55Method: What and why? 56The case study process 57Why the case study approach? 57Research setting 58Selection of site and cases 58Background information about the University 59Structure of planned change effort 60Selection of participants 61Data collection and recording procedures 63Research instrument 64Phase one: Informal data collection and approvals 65Phase two: Pilot study 66Phase three: Senior leadership and department head data collection 66Phase four: Department staff data collection 68Phase five: Review, analyze and interpret data for each ESSD 70Phase six: Review, analyze and interpret data for cross ESSD analysis 71Coding 72Themes 72Reliability 74Member checking 74Researcher and participant roles 74
vii
CHAPTER FOUR
Results and Interpretations Themes: Accountability and Organizational Changes
Development of codes and themes 76Themes: Accountability and organizational changes 76Accountability: Introduction 77Transparency 79Justify existence 83Measure results 85Responding to national assessment trend 87Organizational changes: Introduction 90Continuous improvement 94Culture change 97Increased awareness 101Increased network collaboration 103Redundancy 105Pride 107
CHAPTER FIVE Results and Interpretations
Themes: Leadership Issues and Information Exchange
Leadership issues: Introduction 110Short term momentum 113Issues of priority 117People unaware of the effort 120Skepticism 124Resources 129Other extenuating circumstances 131Information exchange: Introduction 133Process 136Feedback 140Uncertainty 142Promote University 145Influence administration 146
CHAPTER SIX
DISCUSSION AND IMPLICATIONS Summary of research questions 148Research question 1 – purpose of initiative 149Research question 1 – value of initiative. 150Research question 1 – impact of initiative on individual and organizational performance
151
viii
Research question 1 – success of initiative 152Research question 2 – member attitudes toward measurement 153Research question 2 – member motivation 154Research question 2 – productivity 154Research question 2 – organizational values 155Research question 2 – aspirations 155Research question 2 – morale 156Research question 2 – work habits 156Research question 3 – role of communication 157Summary of findings by theme 157Accountability: Introduction 157Transparency 157Justify existence 158Measure results 158Responding to national assessment trend 159Organizational changes: Introduction 159Continuous improvement 159Culture change 160Increased awareness 160Increased network collaboration 161Redundancy 161Pride 162Leadership issues: Introduction 162Short term momentum 162Issues of priority 163People unaware of the effort 163Skepticism 163Resources 164Other extenuating circumstances 164Information exchange: Introduction 164Process 165Feedback 165Uncertainty 165Promote University 165Influence Administration 166Implications for theory 166The overarching theme communication 168The role of communication among the three levels of employees within the Institution
169
Models of planned organizational change and this case study 177Implications for practice 181Limitations and future research opportunities 201Particularity limitations and future research opportunities 201Subjectivity limitations and future research opportunities 202Generalizability limitations and future research opportunities 203Reliability limitations and future research opportunities 203
ix
Time interval limitations and future research opportunities 204Participant comments limitations and future research opportunities 205Researcher lens limitations and future research opportunities 206Loose coupling in higher education limitations and future research opportunities
206
Tensions in the themes limitations and future research opportunities 206CONCLUSION 207REFERENCES 209APPENDICES 220-260Appendix A- Performance measurement strategies: Prevalent in business and industry
220
Appendix B- Performance measurement strategies: Prevalent in higher education
222
Appendix C- Research and interview question grid 224Appendix D- Interview guide for senior leadership level 238Appendix E- Interview guide for department head level 242Appendix F- Interview guide for department staff level 246
x
LIST OF TABLES
Table 1 - Data collection and recording procedures 64Table 2 - Themes (T) and their corresponding codes (C) 73Table 3 - Accountability theme and corresponding codes 79Table 4 - Organizational Changes theme and corresponding codes 93Table 5 - Leadership Issues theme and corresponding codes 113Table 6 - Information Exchange theme and corresponding codes 135Table 7 - Relationship of communication to the themes 181Table 8 - Steps to successful planned change programs 194Table 9 - Visible leadership commitment checklist 198Table 10 - Dashboard for successful planned change 199
1
INTRODUCTION
Over the years, institutions of higher education, like all large institutions, have been faced
with the need for organizational change initiatives. One area where the impetus for change has
been particularly dramatic is in the assessment of performance and outcomes, and the use of the
resulting information to document, report upon and improve institutional effectiveness. In recent
years, the perceived need for organizational change relative to assessment, accountability and
continuous improvement has been prompted by many constituencies, and brought into the
national spotlight with the 2006 Spellings Commission Report (U.S. Department of Education,
2006).
To meet these challenges for assessment, accountability, and continuous improvement
many measurement-based strategies have been introduced to help facilitate planned
organizational change efforts. One such strategy highlighted in this dissertation is that of the
Dashboard. “The driving force behind the development and adoption of…Dashboards is simple
– accountability” (Miller & Cioffi, 2004, p. 238).
A Dashboard is a small group of key indicators – similar to what’s seen in an
automobile’s Dashboard – of an organization’s goals arranged in a manner so that organizational
members can assess performance gaps at a glance. According to Edwards and Thomas (2005) a
Dashboard “translates the strategic direction into a set of specific strategic outcomes that are
tracked and monitored” (p. 375). “The Dashboard is designed to provide a vehicle for
comprehensive reporting, review, and analysis of how well…the various operating agencies are
performing” (Edwards & Thomas, 2005, p. 376). As such, the Dashboard provides a method for
organizations to link measurable objectives to actual outcomes which provides an outlet to
2
document performance measurement, and thus show transparency and accountability. The
Dashboard concept is discussed more in-depth in Chapter Two.
Reported success rates for implementing planned organizational changes are dismal.
According to many sources 60-80 percent of change efforts do not accomplish their objectives
(Kee & Newcomer, 2008; Ruben, 2009a; Wheatley & Kellner-Rogers, 1998). Moullin (2002)
states that in health and social care alone, “seven out of ten projects fail” (p. 129). A Standish
Group (2000) report indicates that the success rate of new information technology change efforts
were a bleak 28% in 2000 (p.2).
One of the significant planned organizational changes in higher education is the need to
document; organizations must show accountability and efforts to continuously improve through
assessment measures. An increasingly popular strategy for institutions of higher education to
address the challenges for assessment is through the use of performance measurement.
Performance measurement is a well-accepted and widely used tool in business but less so in
higher education.
Purpose of the Dissertation
This dissertation studies the introduction and implementation of a specific performance
measurement system, the “Dashboard,” as the planned organizational change. In doing so, this
dissertation will consider the perspectives of the planned change effort from three organizational
levels of employees within the institution. In addition, this study seeks to improve our
understanding of the role of communication in facilitating and/or impeding this planned
organizational change by examining the social interactions and realities from these
organizational levels within the institution through an analysis of the perceptions of each about
the planned change effort. The three organizational levels of employees include senior leaders,
3
department directors and department staff levels. In this case study analysis the Dashboard
performance measurement strategy involves the creation of a set of performance indicators
which is part of a planned change effort.
In conducting this study of planned change efforts, four educational support service
departments and the senior leadership group within a large, Northeastern university were
examined using a case study analysis (Stake, 2006). The case study approach proves valuable to
this study because it gleans rich, descriptive data that allows for an exploration of the planned
organizational change effort from the perspectives of three organizational levels of employees
within the institution.
The interest in examining the three organizational levels of employees within an
institution during the implementation phase of a planned organizational change is purposeful
because it provides a communicative view of the planned change effort “to examine and explain
organizing activity” (Lewis, 2011, p. 6). Planned change occurs through the social interactions
of these organizational members (Ford & Ford, 1995; Lewis, 2011). These social interactions
take place through communication, and ultimately communication processes produce and
reproduce the social reality of the organization, and thus the planned change effort (Berger &
Luckmann, 1967; Ford & Ford, 1995; Lewis, 2011; Poole, 2009). In addition, employees from
different organizational levels within the institution, in most instances, possess a different
perception of reality and have different goals, experiences, background, etc. (Ruben, 1979;
Thayer, 1979). As such, it is important, to understand the perspectives of all three organizational
levels of employees within the institution from a communicative framework through the planned
change process.
4
Although there is a growing volume of literature focusing on issues of change in higher
education, the literature to date has predominantly focused on industry. For example, after a
review of 626 journal article titles found in several online databases dating 1990 through 2010
using performance measurement as a search requirement the author found that only 16 journal
articles concerned higher education, whereas 64 journal articles concerned industry. Other
journal articles focused on health care, government, policing, and general issues of
organizational change.
Within this search the researcher also found only two articles that concerned Dashboards
and higher education, and an additional three that concerned other performance measurement
and higher education. The articles that researched Dashboards in higher education dealt with
specific measures for the Dashboards such as “attractiveness” and “efficiency” (Secundo,
Margherita, Elia & Passiante, 2010) as well as visualization (Mohd, Embong & Zain, 2010).
Neither of these studies focused on the communicative implications from the viewpoints of
several levels of employees within the institution.
Another study uses a popular performance measurement strategy developed by Kaplan
and Norton (1992; 1993; 1996), the Balanced Scorecard, as a measure to promote a culture of
assessment within the university library (Self, 2003). However, the study is purely descriptive of
the process used to implement the strategy. It lacks any assessment of the performance
measurement strategy from the perspectives of several levels of employees of the institution.
In another study of a university library, the use of performance measurement was extolled
as essential to continuing improvement of the library’s services (Crawford, 2003). The study,
however, did not include data about the perceptions of the planned change effort from three
levels of employees within the institution, which might have led to an enhanced understanding of
5
the communicative dynamics involved. Finally, a third study recommends the use of the
Balanced Scorecard as a way to bolster support for management and best practices (Cullen,
Joyce, Hassall & Broadbent, 2003). Again, however, the study does not discuss the strategy from
perspectives of several organizational levels of employees within the institution.
The literature found shows that performance measurement was researched four times
more in industry than in higher education. It also shows that no studies examine organizational
change from the perspectives of three organizational levels of employees within an institution of
higher education such as the one proposed here. This provides evidence of a gap in the literature
regarding the research on higher education and performance measurement.
While, as a whole, institutions of higher education are different than organizations in
traditional industry, the administrative side of higher education – or those functions that view
current students as their primary stakeholders; such as alumni affairs, human resources, and
finance – operates more similarly to traditional industry than does the academic side. The
dynamics of change in higher education can be quite different from those in industry, a theme
that has received considerable attention. Because the academy tends to place greater value on
engagement, collegiality, and shared decision-making, rather than more hierarchical decision-
making styles characteristic of industry, the dynamics of change are generally more negotiated
within higher education rather than mandated as is an available option in business. However, the
combination of these two distinct environments within each institution of higher education can
make the change process even more complex. For most planned organizational change efforts,
both academic and administrative areas must be taken into account since many, if not most,
planned change initiatives will have implications that span both. For example, when an
6
institution administers university-wide budget cuts both the academic and administrative areas
are affected.
Making a distinction between the context of industry and higher education is important
for several reasons. As suggested previously, one distinction between industry and higher
education has to do with the structure of the academy. A typical institution of higher education
consists of part of a traditional organizational hierarchy with a President, Chief Financial Officer,
Unit Heads, and staff on the administrative side. The academic side typically has Chief
Academic Officer followed by group leaders, the Deans of each college or school, followed by
smaller group leaders, the Department Chairperson, and Program Chairs. (Other considerations
include differences in this structure for research institutions as compared to teaching institutions
and community colleges.)
These structural differences between administrative and academic structures within
colleges and universities correspond to differing primary missions and roles. The academic side
is focused as a whole on scholarship, teaching, and service. Generally speaking, these functions
are addressed by individual disciplinary units, with minimal institution-wide coordination or
centralization. This unique structure and differentiated missions and roles bring with it a
difference in the nature of decision-making particularly in academic areas, but also to some
extent, in administrative areas that interact with academic areas. This unique structure leads to
the more loosely structured lines of accountability that often characterize the academy (Kuo,
2005) which is another reason why the dynamics of planned organizational change initiatives in
higher education can be quite different than industry.
The academy has a structure where entities within are loosely tied – or coupled – together
(Weick, 1976) which can often make them more difficult to discern than traditional organizations
7
(Kuo, 2005). While administrative units typically have relatively little autonomy, the academic
side has considerable autonomy due to the academic goals being pursued, as well as the
members’ extensive training and demand for such freedom (Baldrige, 1983). Academic units, in
particular, operate on a daily basis with much looser lines of direct accountability – and hence
much greater autonomy – than do most organizations in industry, with their prevalent
hierarchical structures and distinct and tight lines of direct accountability. While this
circumstance is most pronounced with academic units, the philosophy of decentralized decision-
making, territoriality, academic decentralization, and loose coupling is often seen as
characteristic of the culture of higher education more generally. Such loosely-coupled (Weick,
1976) organization contributes to the complexity of change efforts in higher education versus
other settings.
The administrative side is focused on their own mission to support the institution of
higher education as a whole with everything from financial to human resources and IT services
for employees, and admissions, housing, dining services, career services, and other educational
support services for students (Ruben, 2009a). The administrative side is more closely aligned to
industry in that of its hierarchical line of human resources reporting as well as typical “business
hours.” According to Ruben (2009a) these differences in mission between the academic and
administrative departments “often have quite different priorities, work styles, and work
schedules” (p. 24).
Any planned organizational change process is difficult to implement. Given their
complex, and loosely-coupled structure and decision-making processes, as well as internally
competing values, and multiplicity of constituencies, institutions of higher education bring
additional difficulties to the implementation process than do most organizations in industry. In
8
fact, standard planned organizational change theory and concepts may not apply at all to
institutions of higher education because of these complications. If this holds true, then, perhaps
practical strategies for planned, organizational change may not apply to institutions of higher
education either. For this reason a better understanding of the dynamics of the process, actions
and reactions of multiple levels of employees within the institution and communication processes
can be extremely valuable from both a theoretical and practical point of view. In light of this,
conducting a case study analysis is important and adds to the growing literature base by
providing a new way to look at the change process, in general, and within higher education, in
particular.
This dissertation, therefore, studies the introduction and implementation of a specific
performance measurement system, the “Dashboard,” as the planned organizational change. In
doing so, this dissertation will consider the perspectives of the planned change effort from three
organizational levels of employees within the institution. In addition, this study seeks to improve
our understanding of the role of communication in facilitating and/or impeding this planned
organizational change by examining the social interactions and realities from these three
organizational levels of employees within the institution through an analysis of the perceptions
of each about the planned change effort.
Because of the complexity of higher education organizations – their complex, and
loosely-coupled structure and decision-making processes, as well as internally competing values
and multiplicity of constituencies – communication is essential to understanding and
implementing the dynamics of planned change within higher education. As noted previously
many measurement-based strategies are used to facilitate planned change within organizations.
This study will focus specifically on one of the increasingly popular strategies for institutions of
9
higher education to address the challenges for assessment, accountability and continuous
improvement—the use of performance measurement. Performance measurement is a well-
accepted and widely used tool in business but less so in higher education. This dissertation
studies the introduction and implementation of a specific performance measurement system, the
“Dashboard,” as the planned organizational change from the perspectives of three organizational
levels of employees within an institution of higher education. A Dashboard is a small group of
key indicators – similar to what’s seen in an automobile’s Dashboard – of an organization’s
goals arranged in a manner so that organizational members can assess performance gaps at a
glance. The Dashboard provides a method for organizations to link measurable objectives to
actual outcomes which provides an outlet to document performance measurement, and thus show
transparency and accountability. Dashboards are discussed more in-depth in Chapter Two.
This case study analyzed data from participant interviews. Subsequent communicative
analysis increases our understanding of the social interactions and realities of members from the
three organizational levels within the institution of the large-scale, planned organizational change
effort.
The following research questions guide this study:
RQ1: What are the perceptions of three organizational levels of employees regarding the
introduction and implementation of a performance measurement initiative? Specifically, how do
participants understand the purpose of the initiative, assess the value of the initiative, assess the
impact of the initiative on individual and organizational performance and assess the overall
success of the initiative?
RQ2: How have the values (issues of most importance and meaning)inherent in the
culture) played a role in this planned organizational change initiative with regard to member
10
attitudes and motivations? Responses to this question will include members’ attitudes toward
measurement, motivation, productivity, organizational values, aspirations, morale and previous
work habits.
RQ3: What was the role of communication in facilitating and/or impeding this planned
organizational change?
Organization of this Dissertation
This chapter has provided an overview of the study proposed here as well as reasons why
this study is important. In doing so, this chapter discussed the purpose of the study, an overview
of the proposed methodology, the gap in the literature to justify this study, reasons for studying
higher education in particular, and an introduction to the key concept of this study. Chapter Two
provides a literature review of organizational change as well as discusses the central concept of
communication in this dissertation. In doing so, the second chapter discusses the concepts of
planned organizational change, approaches to the study of organizational change, approaches to
the process of planned organizational change, and planned organizational change in higher
education. Chapter Three provides the research questions and methodology used in this study.
Chapters Four and Five detail results of the study by emergent themes and Chapter Six provides
an analysis of results by research questions and the overarching theme as well as implications for
practice and theory, conclusions, limitations and suggestions for future research.
11
CHAPTER ONE
THE NATURE OF ORGANIZATIONAL CHANGE
What is Organizational Change?
Organizational change is defined by Zorn, Christensen, and Cheney (1999) as “any
alteration or modification of organizational structures or processes” (p. 10). It may be used to
refer to circumstances that are purposefully undertaken within an organization—planned change
(Lewis, 2011, p. 37). A planned change program can be described as change of an existing
behavior or process into a new behavior or process to advance the overall performance of the
organization (Poole & Van de Ven, 2004). In many instances, this planned change is
implemented to address or anticipate a problem or failure of some sort (Weick & Quinn, 1999).
According to Poole and Van de Ven (2004), “planned change attempts to improve the situation
and has as its reference point a desired end state” (p. 4). The term organizational change may
also be used to refer to situations that are naturally occurring or uncontrollable—unplanned
change (Lewis, 2011, p. 37). It is a “change that happens to an organization” versus a “change
that is planned by organizational members” (Huse & Cummings, 1985, p. 19).
Planned change efforts may involve months of planning, such as in the case of a
strategically planned merger, while unplanned change efforts may involve a spontaneous
reaction to an event or occurrence, such as the attempts to solve the summer 2010 Gulf oil spill
crisis in the United States. While this distinction is very helpful in thinking about change, in
actual practice change initiatives typically lie somewhere between these two extremes—creating
what might be termed a continuum of organizational change. As Lewis (2011) describes this,
there is a fine line where on one hand organizational members intentionally plan a change versus
12
the other hand where organizational members react to a change due to a force that is the result of
something like a natural disaster.
WHY ORGANIZATIONAL CHANGE IS AN IMPORTANT ISSUE
Characteristics of Planned and Unplanned Organizational Change
Similar to the proposed continuum discussed previously, each change effort occurs at
different extents and from different origins. As such it is important to consider these aspects
when studying change efforts (Burke, 2008). This section of the dissertation will discuss the
“terms of degree (how much things really change)” (Zorn, Christensen & Cheney, 1999, p. 10)
by looking at the origin of change and the “magnitude of change.”
The origin of change.
The origin of change, or external versus internal change, is a distinction Zorn,
Christensen and Cheney (1999, p. 17) confer to types of change. They claim that externally
driven unplanned change is based on pressures or concerns from outside the organization.
Internally driven planned change, they claim, is based on a need determined by management.
The “magnitude of change.”
Orlikowski (1993) defines the “nature of planned or unplanned change” as either
incremental or radical (p. 331). Incremental change refers to small changes undertaken to fix the
existing condition while keeping the “big picture” intact. Radical change, on the other hand,
requires a new way of thinking and complete overhaul of the existing condition so that the “big
picture” entirely changes.
Zorn, Christensen and Cheney (1999) define the “magnitude of change” as either first or
second order planned change (p. 10). Here, first order change is looked at similarly to
13
incremental change where the purpose of the implementation is to avoid a complete overhaul or
second order change.
Weick and Quinn (1999) assert that the “characteristic rate, rhythm, or pattern of work or
activity” (p. 365) is an important type of planned or unplanned change that can be delineated by
episodic and continuous change. Here, Weick and Quinn determine episodic change as one that
occurs only infrequently whereas they determine continuous change as constant and steady.
According to Burke (2008), revolutionary change is such that a sudden and drastic “jolt”
or event occurs to spur change to the organization leaving a completely new organizational
outlook or identity (p. 68). Evolutionary change, on the other hand, is one that develops in small
steps over time leaving the organization intact. Burke (2008) notes that this distinction is best
described by an understanding of deep structure.
Deep structure, as defined by Gersick, (1991) is “a network of fundamental,
interdependent “choices,” of the basic configuration into which a system’s units are organized,
and the activities that maintain both this configuration and the system’s resource exchange with
the environment” (p. 15). A change in deep structure, then, is exemplified in revolutionary
change as it affects the way organizations are organized and function – the organization’s
culture. Evolutionary change, on the other hand, does not affect the organization’s deep
structure.
The Effect of Planned Change on Organizations
Planned, or intentional change, can affect organizations in both positive and negative
ways. Since many change efforts fail at significant rates their effects can have large or small
impact on organizational members (Lewis, 2011).
14
Costs include financial expenditures; lost productivity; lost time in training and retraining
workers; confusion, fatigue, and resentment for workers, clients, customers, suppliers and
other key stakeholders; damage to brand; disruption in workflow; and loss of high value
stakeholders including workers, supporters, clients/customers among others. (Lewis,
2011, p. 25)
But, if successfully implemented, a planned organizational change can increase employee
morale, boost productivity and overall profit for the organization (Klein & Sorra, 1996).
According to Huber and Glick (1993):
Organizational change is important to employees, as it directly affects work
environments and social relationships. It is especially important to managers, as it
so strongly impacts their workloads and stress levels. And it is important to
organizational scientists, as organizational change is a phenomenon that has
effects at all levels of analysis from individuals to industries. (p. 16)
Research on the Success and Failure of Planned Change Efforts.
Reported success rates for implementing organizational changes are dismal. According to
many sources 60-80 percent of change efforts do not accomplish their objectives (Kee &
Newcomer, 2008; Ruben, 2009a; Wheatley & Kellner-Rogers, 1998). Moullin (2002) states that
in health and social care alone, “seven out of ten projects fail” (p. 129). A Standish Group
(2000) report indicates that the success rate of new information technology change efforts was a
bleak 28% in 2000 (p. 2). In discussing success and/or failure of planned change efforts most
researchers use more general terms such as problems of implementation (Lewis, 2000a),
employee reactions to change (Lewis, 2006), the extent to which the organization met all the
objectives of the change effort (IBM, 2008), and by degrees of fidelity – “degree of departure
15
from the intended design of the change” and uniformity – “range of use of the change across
adopting unit(s)” (Lewis, 2007, p. 184). Some barriers to change occur when: organizational
leaders are not committed; funding, human resources, and/or technological capabilities are
deficient; change recipients’ reactions are not anticipated (Dent & Goldberg, 1999; Piderit,
2000); or organizational culture (Cameron & Quinn, 2006) and communication methods are
overlooked or ignored.
A review of the literature indicates that “significant and successful” examples of large-
scale change implementation efforts are rare (Burke, 2008, p. 11). Burke (2008) asserts that there
are three reasons for this: 1. “Deep organization change, especially attempting to change the
culture of an organization, is very difficult”; 2. While the best time to “plan for and bring about
significant change” is during the height of success, it’s also the most difficult time “to make a
case for change”; and 3. “Our knowledge for how to plan and implement organization change is
limited” (p. 11).
According to Zorn, Christensen and Cheney (1999), many change efforts fail because
organizations introduce too many change programs in a short amount of time which can cause
employees to become resistant, skepticism, and even just worn out to newer efforts (p. 31). The
phrase “resistance to change” has a long history dating back to the research of Kurt Lewin (Dent
& Goldberg 1999) who likened the concept to one from physics where the resistance was a force
within the system that preferred the status quo (Piderit, 2000). However, according to Dent and
Goldberg (1999), once a case was made for the change, then the process was underway in what
Lewin (1951) described as unfreezing the status quo, changing, and then freezing into a new
status quo.
16
Throughout their analysis of five management textbooks’ treatment of the concept of
resistance to change, Dent and Goldberg (1999) identified 13 causes of resistance – including
threat to job status/security, lack of trust, and personality conflicts – and nine strategies for
overcoming resistance – including participation, negotiation, and manipulation. Further, Dent
and Goldberg (1999) and Piderit (2000) assert that a majority of the literature provides a slant
towards management while placing blame on the employee for the lack of success in change
efforts. Both authors call for a better understanding of the reactions of employees to change
efforts. Piderit (2000) provides several ways to view resistance including the following: 1.)
Resistance as a behavior- an “action or intentional inaction” (Brower & Abolafia, 1995, p. 151);
purposefully leaving something out or insubordination (Ashforth & Mael, 1989); and purposeful
dishonesty toward supervisors (Shapiro, Lewicki, & Devine, 1995). 2.) Resistance as an
emotion- “frustration,” and “aggression” (Coch & French, 1948, pp. 515, 519); and worry,
unease, and defensiveness (Argyris & Schon, 1974; 1978). 3.) Resistance as cognition- “a
component of negative thoughts about the change” (Piderit, 2000, p. 786); “reluctance” (Watson,
1982, p. 261); and unreadiness (Armenakis, Harris & Mossholder, 1993). Further, Lewis (2000a)
states that “uncertainty about job security, job evaluation, personal competency, and other social
and work-related priorities…are associated with large-scale planned change” (p. 49). Lewis
(1999) turns the slant towards management around with the need for implementers to be
prepared to communicate effectively through education, information and persuasion of the
change targets – implying that the structure has accountability with regard to resistance. In
another study, resistance was seen to facilitate organizational goals in the case where a new rule
from a change initiative might impede these goals (Brower & Abolafia, 1995). In addition to
recipients’ reactions, many researchers cite participation as key to successful organizational
17
change efforts (Bordia, Hobman, Jones, Gallois, & Callan, 2004; Coch & French, 1948; Lewis,
Schmisseur, Stephens, & Weir, 2006). When recipients of the planned organizational change
effort participate in the effort rather than having the effort details decided upon for them, the
“struggles are far [less] draining and prone to failure” (Wheatley & Kellner-Rogers, 1998, p. 3).
“By being involved in and contributing to decision-making, employees experience less
uncertainty about issues affecting them, and feel more in control of change outcomes” (Bordia,
Hobman, Jones, Gallois & Callan, 2004, p. 526). In a study conducted of 24 of the “top 100
best-selling books on organizational change” half focused on the importance of communication
and participation of employees in the change effort (Lewis, Schmisseur, Stephens, & Weir,
2006).
Weaknesses in leadership also contribute to the number of change efforts that don’t meet
their objectives (Kee & Newcomer, 2008). Burke (2008) states that:
Without leadership, planned organization change will never be realized. It is the
leader who articulates and brings together the external environment with the
organizational mission, strategy, and culture and then provides a vision for the
future; the destination, the change goal(s). (pp. 225-226)
Some leadership weaknesses include underestimates of: the “complexity of the change” process
(Kee & Newcomer, 2008, p. 5); the leadership obligations towards the process (Kee &
Newcomer, 2008; Schein, 1985); the high level of support for the process (Kee & Newcomer,
2008; Schein, 1985); the formulation of a vision (Fairhurst, 1993; Lewis, 2006; Schein, 1985);
the participation and commitment of the recipients of the effort (Kee & Newcomer, 2008); the
nuances of organizational culture and subcultures (Kee & Newcomer, 2008; Schein, 1985); and
the ability of the organization to begin and sustain a change effort (Kee & Newcomer, 2008;
18
Schein, 1985). “The single most visible factor that distinguishes major cultural changes that
succeed from those that fail is competent leadership at the top” (Kotter & Heskett, 1992, p. 84).
“Leadership is the fundamental process by which organizational cultures are formed and
changed” (Schein, 1985, p. ix).
Cameron and Quinn (2006) assert that some change initiatives fail because of an
oversight of the culture of the organization. Cameron and Quinn assert that:
A strong, unique culture [can] reduce collective uncertainties (that is, facilitate a
common interpretation system for members), create social order (make clear to
members what is expected), create continuity (perpetuate key values and norms
across generations of members), create a collective identity and commitment
(bind members together), and elucidate a vision of the future (energize forward
movement) (see Trice & Beyer, 1993). (p. 5)
In all, Cameron and Quinn (2006) state that no matter the tools involved, without culture change
an organization will have “little hope of enduring improvement in organizational performance”
(p. 11). The researchers (Cameron & Quinn, 2006) give credit to the reliance of organizational
members on the status quo. “When the values, orientations, definitions, and goals stay constant
– even when procedures and strategies are altered – organizations return quickly to the status
quo” (p. 11).
Alternatively, Lewis (2006) considers success in terms of the recipient of the change
effort. Lewis (2006) defines “evaluation of success…as respondents’ own assessments of the
degree to which the change has achieved intended outcomes and has produced a sense that
success outweighs failure” (p. 24). Lewis (2006) states that:
Employee perceptions of outcomes are most likely to predict their attitudes
19
toward future change initiatives and the methods used to implement them.
Whether their own evaluations of success align with those of other participants
and observers is an interesting question, but of more immediate concern is the
degree to which their own perceptions of change success are related to their
experiences of implementer’s communication practices. Success of change
programs has been treated in the most general ways (whatever the respondent
interprets “success” to mean) in the empirical literature to date (cf. Colvin &
Kilmann, 1990; Young & Post, 1993). (p. 24)
THEORETICAL FRAMEWORK
General systems theory provides a very helpful theoretical framework for conceptualizing
planning organizational change—and more generally, human change-- and the role of
communication in these processes (Bertalanffy, 1950; Thayer, 1968; Ruben, 1983). According
to Ruben and Stewart, (2006) “communication is the essential life process through which
animals and humans create, acquire, transform, and use information to carry out the activities of
their lives” (p. 56).
The notion of open systems is a fundamental concept within the systems theory
paradigm. Open systems are defined as living systems that “exist only through continual
exchanges with the environment” (Bertalanffy, 1968, p. 32). It is through these continual
exchanges of matter-energy and information with the environment that living or open systems
create what it is to be ‘their’ system through the processes of disruption, and restoration
(Bertalanffy, 1975; Miller, 1965; Ruben 1983; Thayer, 1968). Drawing on the concept of open
systems, an organization viewed in this perspective is an open system made up of subsystems
(components or subparts) which have functions and boundaries in their own right.
20
Communication and information processing are important at each level and also in interactions
between levels (Ruben, 1979; Ruben & Kim, 1975; Ruben & Stewart, 2006; Thayer, 1979).
Within organizations there are various levels of analysis from which they can be
considered, including those that span across the organization, at the organizational level, the
group level, and the individual level (Mohrman, Mohrman & Ledford, 1989). Together
individuals at each of these levels can accomplish much more than any one of them can do alone.
Open systems generally operate in such a way as to seek a harmonization or homeostatis,
(Miller, 1965; Bertalanffy, 1975) with the environment. Natural change occurs within systems
and changes in the environment become salient through information and communication
processes, and these trigger adjustments within the system (Ruben, 1979; Thayer, 1979).
From a systems point of view, planned change can be seen as purposeful efforts to
change the dynamics of the system – and therefore involve disruption to the harmony of a system
or subsystem. The disruption and subsequent efforts to restore harmony, by definition, involve
communication and information processes. The systematic processes of disruption and
restoration occur through communication and information processing. It is through these
processes that members of a system or subsystem co-create the restored version of the system or
subsystem – just as they originally co-created their original system through their social structure
(Berger & Luckmann, 1967; Burr, 2003) to enable organization and functionality.
Lewis’ (2007) organizational stakeholder model of change implementation and the role
communication plays in this process is very consonant with the systems approach because of its
emphasis on interacting and mutually influencing open subsystems—stakeholder groups—which
interact to play a dynamic role as the disruptive and restorative forces of change take place. In
the Lewis view, communication and information processing enable the implementer of the
21
planned organizational change to base the “implementation communication strategy selection
and enactment” on elements such as their “perceptions of change context” or “institutional
factors” (Lewis, 2007, p. 181). These decisions affect “stakeholders’ perceptions, concerns,
assessments [of other stakeholders], and interactions [between other stakeholders and
implementers, and at the same time stakeholders’ reactions reciprocally affect] implementer
strategies” (Lewis, 2007, p. 181). These continual give-and-take exchanges (Bertalanffy, 1975;
Miller, 1965; Ruben, 1983; Thayer, 1968), or negotiated meaning of messages (Weick, 1979;
Westley & MacLean, 1970) continue as members of the organization seek to make sense (Weick,
2001) of information to recreate relationships between members of the organization and the
environment as well as reestablish boundaries to create harmony once again through these social
systems (Berger & Luckmann, 1967).
The previous discussion about open systems and general systems theory explains that
organizational changes can most likely affect the organization as a whole in either a positive or
negative way. While most changes to a system or subsystem are made with the best of intentions
from a particular perception, there are times when consequences to the system are not fully
thought out (Anatol & Rapaport, 1975). As changes to one organizational level most often will
affect the other organizational levels in a system, then, it is important to consider all levels within
the organization, not just the one targeted for the planned organizational change effort. This
notion of systems allows one to understand from a theoretical standpoint how change, no matter
how potentially useful, is disruptive of a systems – both individual and organizational –
harmonious state. This system disruption, then, can be seen as a source of much of the
“resistance” accompanying change efforts at all levels. Finally, the systems way of thinking
22
allows for greater understanding of the importance of communication and information processes
since changes are created, detected, and responded to through these processes.
In summary, the research presented thus far provides support for this study by
emphasizing that: 1) While planned organizational change is complex, the planned change
efforts can bring about significant and lasting benefits to an organization; 2) Communication is
an essential life process that can aid or inhibit the change effort. 3) Changes in one part of the
organization will have an impact on other parts of the organization. 4) Institutions of higher
education are a unique type of organization, characterized by loosely coupled components
(Weick, 1976) co-created by its members (Ruben 1979; 1992). Based on the understanding of
these concepts, the following section examines core concepts for understanding organizational
change, followed by a final section in chapter two that examines approaches to the process of
planned organizational change efforts including performance measurement strategies.
Core Concepts for Understanding Organizational Change
Communication is critical when considering any planned change effort – especially
planned organizational change in higher education. According to Ruben (2009a) communication
“refers to the ways in which people create, convey, select, and interpret the messages that inform
and shape their lives – including how they promote, accept, and/or resist change” (p. 20).
Examining the dynamics of communication in the introduction and implementation of
planned change is the central purpose of this study. In the change literature, communication is
used in two ways; the most frequent focus is on information exchange and strategies for
introducing, promoting and coordinating change implementation. For example, Lewis (2011)
highlights “one critical part of formal communication [as] the first official announcement of
change” (Lewis, 2011, p. 53). Timmerman (2003) notes that this announcement is typically of a
23
“preplanned, top-down nature” that is reflective of the more traditional focus on one-way
communication and information exchange. A less frequent focus is on the richer concept of
communication in terms of sensemaking—the way individuals involved negotiate interpretations
of the meaning of the change process (Lewis, 2011). In this latter sense, communication is seen
as the means by which social interactions occur (Berger & Luckmann, 1967). It is through the
social interactions of organizational members that produce and reproduce their social reality that
change is understood and transpires (Ford & Ford, 1995; Poole, 2009). Both views of
communication are considered in this study.
Communication runs through each of the approaches mentioned thus far, sometimes
explicitly and sometimes implicitly. Any planned organizational change effort, regardless of
size, is complex. According to the research detailed in this section, understanding the
organizational system where the changes will be made – not just the exact part of the
organization where the changes are to occur – is a key to preparing for a planned organizational
change effort (Porras, 1987). As discussed previously, every organization is made up of a
system where changes to one part of the organization likely result in changes to other parts of the
organization which, as a result, may be affected in either a negative or positive way (Mohrman,
Mohrman & Ledford, 1989; Ruben, 1979; Bertalanffy, 1950, 1975). Accordingly then, increases
in our understanding of the interactions, realities and sensemaking (as opposed to the mere
exchange of information) of members from three organizational levels within the institution
should allow for better planning for the large-scale, planned organizational change effort. The
three organizational levels of employees include senior leadership, department heads and
department staff levels.
24
Communication, then, is a means by which social interactions occur (Berger &
Luckmann, 1967). Organizational change is understood and occurs through the social
interactions of organizational members that produce and reproduce their social reality (Ford &
Ford, 1995; Poole, 2009). Communication is, thus, essential to understanding any organizational
change as well as always important to understanding strategies for organizational change efforts.
The literature discusses the importance of understanding the role communication plays in
a planned organizational change effort. “Problems centrally concerned with communication rank
among the most problematic in implementers’ hindsight” (Lewis, 2000a, p. 63). Understanding
that everyone has a different worldview and perception of reality can enable the selection of the
most effective communication methods and messages (Ruben, 1979, 1992; Thayer, 1979). The
literature also explains that the participants in the planned change effort interpret these messages
given their worldview and perception of reality prior to acting on them (Luckmann, 2008). In
addition, organizational members socially construct their reality over and over again in order to
produce and sustain their social group (Blumer 1979; Giddens, 1985; Luckmann, 2008; Poole,
2009; Ruben, 1979). Understanding that the frames of reference, perceptions and views of reality
differ between the three distinct organizational levels of employees within the institution will
enhance the foundation of a planned organizational change effort. Similarly, knowing that these
perceptions and views of reality can change over time will also enhance preparations for a
planned organizational change effort.
“Communication process and change implementation are inextricably linked processes”
(Lewis, 1999, p. 44). Social interactions occur through communication (Berger & Luckmann,
1967). Communication “refers to the ways in which people create, convey, select, and interpret
the messages that inform and shape their lives – including how they promote, accept, and/or
25
resist change” (Ruben, 2009a, p. 20). The following section focuses on the concept of
communication, in general, and more specifically on the way individuals attribute meanings to
events, objects and people. The next section focuses on the relationship between communication
and information. A third topic is the relationship between communication, social units and
meaning. This is important to this study because of the focus on the perceptions of three
organizational levels of employees within the institution of higher education. Each
organizational level is its own social unit and therefore has its own meaning for events, objects
and people. It is through an analysis of the way these three distinct organizational levels, or
social units, used information and communication to attribute meaning to the Dashboard planned
change effort that this dissertation sought to understand.
Essential to this discussion is the distinction between the two ways that communication is
used in the change literature. The most recurrent emphasis is given to information exchange and
strategies for introducing, promoting and coordinating change implementation. More
importantly, communication is centered as a process through which sensemaking and negotiation
occur through social interactions (Berger & Luckmann, 1967).
Social interactions occur through communication (Berger & Luckmann, 1967). It is
through information processing that communication – “the process by which living systems
interact with their environment and other systems” – is possible (Ruben, 1992, p. 21).
Over time, social units define what it is to be a part of that individual social unit by
“negotiation,” “mutual validation,” (Ruben, 1992, p. 21) and social construction of meaning
(Salancik & Pfeffer, 1978). According to Berger & Luckmann (1967) communication is a means
by which social interactions occur, and it is through these social interactions that organizational
members produce and reproduce their social reality as well as the way that organizational
26
members understand and materialize organizational change efforts (Ford & Ford, 1995; Poole,
2009).
From a practitioner’s standpoint, it is important to understand that organizational
members interpret information (Luckmann, 2008) about the planned change effort based on their
own perceptions of reality and therefore the meaning it holds for them (Blumer, 1979; Ruben,
1979; Thayer, 1979; Weick, 2001). The meanings derived (Halloran, 1985) come about based
on the individuals perception of what’s going on (Thayer, 1979) and the context within which it
takes place (Smith, 1979).
From that point Luckmann (2008) says there will be an evolution of communication
patterns that takes place over time and through reconstruction of events by members of the social
group. This evolution of communication patterns and reconstruction of events allows members to
make sense (Weick, 2001) of information and cues from the environment in terms of what they
mean individually and as part of a larger social group (Ruben, 1979, 1992; Thayer, 1979). In
doing so the social group co-creates the way their system or subsystem is organized and
functions through establishing boundaries to create harmony with their environment (Ruben,
1979, 1992; Bertalanffy, 1950, 1975). Members of the social group become aware of changes in
the environment through information and communication processes which prompt alterations
within the system or subsystem (Ruben, 1979; Thayer, 1979). These alterations, no matter their
sincerity, cause individual and organizational disruption to the harmony of the system and can be
credited with much of the “resistance” that coincides with planned change efforts. As such it is
important to understand the role of communication and information processes in creating,
detecting, and responding to organizational change efforts.
Individual reality and meaning.
27
Reviewing the literature provides many insights into individual reality, such as: contexts
give meaning (Smith, 1979), perception is reality (Thayer, 1979), objective versus internal
realities are different (Dervin, 1977), reality is a constant work in progress (Weick, 2001), and
intentions aren’t always what occurs (Halloran, 1985). When an event occurs individuals can
describe what they see (Smith, 1979), draw inferences about what they saw (Smith, 1979), and
then make decisions based on their perceptions, and thus reality (Dervin, 1977; Luckmann,
2008). Reality is determined for each individual based on their “purposes, perspectives,
capabilities, and competencies” (Smith, 1979, p. 86) and are “temporary, communicationally
created assumptions subject to continuous revision” (Smith, 1979, p. 89). According to
Luckmann (2008) these perceptions are “artificial…reconstructions of social realities based on a
social stock of knowledge…through communication” (p. 282). During a planned organizational
change effort, then, individuals “who observe the same events or receive the same messages will
interpret these as signifying different implications for the organization, even contradictory ones”
(Gallivan, 2001, p. 244).
Taking into account previous experiences and perceptions of reality, individuals
continually add new experiences that, over time, can change and recreate their perceptions of
reality. In doing so the mind helps individuals to organize and interpret (Luckmann, 2008;
Weick, 2001) their thoughts, perceptions and experiences so that they can better understand and
give meaning to them “as [they] seek to make sense of [their] life encounters” (Ruben, 1979, p.
112). In the same way the mind helps individuals to connect with others to create and maintain
significances and negotiate meaning that both influence and influences their relationships, social
units, and environments (DeSanctis & Poole, 1994; Giddens, 1985; Luckmann, 2008; Orlikowski
& Yates, 1994; Ruben, 1979), help individuals to make sense of their own reality and to develop
28
the meaning it holds for them (Dervin, 1977; Weick, 2001). The way individuals understand
things (or not), construct information, and act in response to others actions and words is
dependent on their “cognitive map” made up of previous experiences (Delgado, 1979; Miller,
1965; Ruben, 1979; Thayer, 1979; Weick, 2001), genetics (Delgado, 1979; Smith, 1979),
memories (Miller, 1965; Thayer, 1979), assumptions (Thayer, 1979), and beliefs (Ruben, 1979).
In this same way – via communication –human beings develop social systems (Mokros &
Ruben, 1991). These social systems, then, co-create boundaries of their system by defining the
way the system or subsystem is organized and functions in an effort to create and maintain
harmony within the system (Ruben, 1979, 1992; Bertalanffy, 1950, 1975). As the individual
strives to maintain this harmony within the system, then, an organizational change effort is seen
as a source of discomfort and strain (Miller, 1965; Ruben, 1979; Bertalanffy, 1975). Naturally
the individual, in most instances, will resist the lack of harmony and perceived chaos over the
calmness of the status quo (Ruben, 1979).
The information-communication relationship.
As discussed earlier in the chapter, matter-energy and information processing are both a
necessity for living systems (Miller, 1965; Thayer, 1968; Ruben, 1972). Living or open systems
“exist only through continual exchanges with the environment” (Bertalanffy, 1968, p. 32). And,
it is through information processing that communication – “the process by which living systems
interact with their environment and other systems” – is possible (Ruben, 1992, p. 21). However,
“information arises out of communication: it is the product of communication…process and
product are inseparable…and interdependent” (p. 22). “There is no occasion where information
may be viewed independently of communication” (Mokros & Ruben, 1991, p. 378).
29
Looking further into what is meant by information Ruben (1992) provides
differentiation between several orders of the concept of information. The first order of
information is “Informatione,” which “is environmental data, stimuli, messages, or cues –
artifacts and representations – which exist in the external environment” (Ruben, 1992, p. 22).
These are the “raw data…or messages” that individuals come into contact with each day (Ruben,
1992, p. 22). The second order of information is “Informationi,” which is “internalized
appropriations and representations…configured for use by a living person” (Ruben, 1992, p.
22). It is in this sense of Informationi that one individual may give meaning to an artifact as an
indispensable work aid, while another individual might view the same object as useless (Miller,
1965; Weick, 2001). The third order of information is “Informations,” which is the
“socially/culturally constructed, negotiated, validated, and sanctioned appropriations,
representations, and artifacts that comprise the shared information/knowledge base of societies
and other systems” (Ruben, 1992, p. 23). While each order is a separate function of information,
Ruben (1992) notes that they are interdependent. Ruben (1992) states,
Humans must invent and internalize – encode and decode – the messages
(Informatione) and meanings (Informationi) they need to relate to the environment
and others of the species through symbolic language. It is symbolic language
which makes it possible for (and requires) individuals to achieve a creative,
ongoing accommodation with the environment and its socially privileged
symbolic realities (Informations), and to create and use the many social systems
upon which we depend. (p. 23)
It is through these continual give-and-take exchanges (Ruben & Stewart, 2006), or
negotiated meaning of messages (Weick, 1979; Westley & MacLean, 1970), that members of the
30
organization seek to make sense (Weick, 2001) of information and recreate relationships
between members of the organization and the environment as well as reestablish boundaries to
create harmony once again through these social systems (Berger & Luckmann, 1967; Burr,
2003).
Communication, social units, and meaning.
Luckmann (2008) states that:
social worlds are historical communicative systems: historical stocks of
knowledge and historical institutional structure are constructed, maintained,
transmitted, transformed and, occasionally, destroyed in social interaction. (p.
281)
Further Ruben (1992) states that “it is through communication and information
processing that social units are defined” (p. 21). As time progresses social units define what it is
to be a part of that individual social unit by “negotiation,” “mutual validation,” (Ruben, 1992, p.
21) and social construction of meaning (Salancik & Pfeffer, 1978). In further defining the social
unit, members
construct meanings that take the form of language, common symbols,
knowledges, folklore conventions, information processing patterns, interpretive
conventions, rules, rituals, habits, life styles, values, and attitudes, that are created
and shared in common by members of a particular social system or subsystem.
(Ruben, 1992, p. 21)
These characteristics change over time as a result of an evolution of communication
patterns and through the reconstruction of events by members of the social group (Luckmann,
2008; Ruben, 1983). Therefore, some items become more meaningful than others based on the
31
perception of the member of the social group reconstructing the event (Blumer, 1979;
Luckmann, 2008). “Each person at the same time contributes to validation and perpetuation of
these standards by his or her actions” (Ruben, 1983, p. 141).
“Thus, the…social system has its own constructed, privileged meaning – its own
information/knowledge base – which serves to link individual members to one another and gives
the system an identity” (Ruben, 1992, p. 22). This information/knowledge base can also
distinguish one system from another2 (Ruben, 1992) through communication (Mokros & Ruben,
1991). Such an information/knowledge base may include organizational heroes and stories
within a culture – also called Informations (Ruben, 1992). Further, “members use of rules and
resources in interaction…produce and reproduce the social systems” (Poole, 2009, p. 237).
As individuals become socialized into their groups (be it a religion, community or work
organization, etc.) they learn how to behave appropriately through memories of previous events;
negative and positive experiences; feedback from other organizational members; evaluation of
context; and negative feedback or gaps between the status quo and a goal (Belkin & Robertson,
1976; Luckmann, 2008; Ruben, 1979, 1992; Salancik & Pfeffer, 1978; Wiener, 1961). As
individuals continuously go through socializations into various groups throughout their lifetime
these communicative systems (Luckmann, 2008) help individuals to develop their sense of self
(Thayer, 1979). Accordingly, no two individuals can duplicate exact experiences – even if they
lead similar lives and hold similar roles (Delgado, 1979; Dervin, 1977; Ruben, 1979; Smith,
1979; Thayer, 1979). This socialization into one group occurs via communication and is a
necessity to “participation in social reality” (Mokros & Ruben, 1991). Blumer (1979) asserts
2 This idea is similar to that of social identity theory based on Turner, J.C, (1975). Social comparison
and social identity: Some prospects for intergroup behaviour. European Journal of Social Psychology, 5(1), 5-34. In this article, Turner asserts that individuals look to identify with a social group – considered the in-group – versus other social groups – considered the out-groups.
32
that “meanings are social products” (p. 139). In addition, it is this socialization that allows our
unconscious self to participate in the activities of life and teaches us from an early age important
social group habits and taboos (Mokros & Ruben, 1991). However, it is the same unconscious
socialization that can permit individuals to be rigid in their thinking, which can in turn allow for
conflict and misunderstandings (Ruben & Stewart, 2006). Thus, it is the interaction between
initiator and recipients that “in part” affect the “outcomes” of a planned, organizational change
effort (Lewis, 2007). “Change as an organizational phenomenon necessarily occurs in a context
of human social interactions, which constitute and are constituted by communication” (Giddens,
1985; Poole & DeSanctis, 1990)” (Ford & Ford, 1995, p. 542). “Change is created, sustained,
and managed in and by communications” (Ford & Ford, 1995, p. 560).
Ruben (1983) offers this summary:
the individual’s ways of acting and reacting on the one hand, and his or her
symbolic environment on the other hand, are reciprocally defining and mutually
causal. The individual organizes to cope with his or her physical and symbolic
environment. As a consequence, he or she is shaped by the environment and in his
or her behavior he or she also shapes the environment. (p. 139)
Communication is further defined by Ruben (1983) as “the processing and transformation
of information by a living system in order to adapt to and adapt its environment” (p. 138). As
such Lewis (1999) states that “communication process and change implementation are
inextricably linked processes” (p. 44).
In summary, communication is a necessary concept for understanding planned
organizational change and change effort strategies because communication “refers to the ways in
which people create, convey, select, and interpret the messages that inform and shape their lives
33
– including how they promote, accept, and/or resist change” (Ruben, 2009a, p. 20). According
to Berger and Luckmann (1998), communication is a means by which social interactions occur.
It is through these social interactions that organizational members produce and reproduce their
social reality as well as the way that organizational members understand and materialize
organizational change efforts (Ford & Ford, 1995; Poole, 2009).
Knowing that change efforts occur through social interactions, this study’s concern with
three distinct organizational levels of employees of an institution of higher education during the
introduction and implementation phases of a planned organizational change provides important
implications for the study of planned organizational change efforts. Senior leaders are a key
component of this study because the communication processes and strategies they select and
implement influence the planned organizational change effort (Ford & Ford, 1995). Further, the
negotiation of meaning between the senior leaders and other members is of equal importance as
that process will also influence the overall planned organizational change effort (Ruben, 2009a).
The three distinct organizational levels of employees of the institution most likely approach the
planned organizational change effort with different perceptions of reality and from different
organizational levels and status (Gallivan, 2001; Ruben, 1979; Thayer, 1979) which has further
implications for the introduction and implementation of a planned organizational change effort –
such as interpretations and outcomes being perceived differently by some members than what
was intended by other members. Perhaps one of the major obstacles for participants in a planned
change effort is to overcome the disruption of harmony that an organizational change brings
about to their everyday way of acting (Miller, 1965; Ruben, 1979, Bertalanffy, 1975).
These concepts are important to understand the planned organizational change process
because they are the pieces to understanding the puzzle of the power of communication within
34
the organizational system. In doing so, one must analyze the structure – how does the
organizational member or members go about producing and reproducing their reality, how do
they interact with each other, how do their goals mesh or conflict, how do they socially interact
and exchange information with each other, what are the meanings of these interactions, and how
do their structures help them organize and make sense of their reality? This study seeks to
improve our understanding of the role of communication in facilitating and/or impeding this
planned organizational change by examining the social interactions and realities of these three
organizational levels of employees within the institution through an analysis of the perceptions
of each about the planned change effort.
35
CHAPTER TWO
APPROACHES TO THE PROCESS OF PLANNED ORGANIZATIONAL CHANGE
This section of the study reviews research on strategies for planned organizational change
efforts; the technical versus human side of organizational change and the implementation of
effective performance measurement systems. In doing so, the next few pages present strategies
and approaches for the process of planned organizational change efforts.
Strategies for Planned Organizational Change Efforts
The literature on planned change has a substantial history that provides a helpful context
for the present study. Here the National Training Laboratories, The Research Center for Group
Dynamics, quality-of-work-life, and quality circles will be discussed as a means to enhance work
productivity by training, team building, and the integration of technology with organizational
members.
Fundamental Research on Organizational Change.
World War II spawned many revolutionary ways of thinking and acting. During this time
it became apparent that knowledge gleaned from academic research could and did belong in the
industrial world (Bennis, 1966). Further, the Weberian style of bureaucratic organization was
being challenged by organizational leaders and academics alike to find a new way to organize
work practices and behavior (Bennis, 1966). Unto this new worldview the notion of planned
change began to explode.
One has only to review the academic journals since the 1970’s to grasp the expansive
discourse surrounding the concept of organizational change which was tied closely to the
concept of organizational development. In the literature, “adaptive change” precedes
organizational development which is said to have become an official term around 1960 (Sashkin
36
& Burke, 1987). At some point in these early years lines between organizational change and
organizational development became blurred and they were frequently used interchangeably or in
tandem (Beer & Walton, 1987; Faucheux, Amado, & Laurent, 1982; Porras & Berg, 1978; White
& Mitchell, 1976). In all, organizational change derives from “a wide variety of disciplines and
settings…including…clinical and social psychology, family group therapy, ethnography,
military psychology and psychiatry, the theater, general semantics, systems theory, mathematics
and physics, philosophy, psychodrama, client-centered therapy, survey methodology,
experimental and action research, personnel and industrial relations, organizational behavior, and
general management theory” (French & Bell, 1990, pp. 30-40).
This section looks at three specific pieces to the early history of organizational change:
training and the promotion of change through the National Training Laboratories; information
gathering and dissemination; and a focus on productivity and quality-of-work-life and quality
circles. They are significant because they reflect a change in the way the field was developed
from pure academics to a mix of academics and practical experience. These were the early
attempts at understanding organizational change processes and range in scope from broad and
cross-cutting, to more of a focused view in specific organizational settings and for particular
kinds of challenges.
Training and the promotion of change.
The National Training Laboratories (NTL) was developed by Kurt Lewin in 1945 at the
Research Center for Group Dynamics at the Massachusetts Institute of Technology (MIT) and
focuses on specific organizational settings and challenges. Lewin developed a T-group or a
small group of individuals brought together to reflect on records of their own actions as a
learning exercise for individual and group behavior which could then be continued back at their
37
office environment. From these experiments came about the studies of group dynamics and team
building. Many well-known researchers were a part of the NTL in some fashion including Chris
Argyris who later became a leading expert in organizational development and learning, training
and consulting, and wrote the timeless book Intervention Theory and Method3; others include
Robert Blake and Jane Mouton, coauthors of The Managerial Grid4 (French & Bell, 1990;
Tannenbaum, Kallejian & Weschler, 1954).
Change agents.
An outgrowth of the NTL was the concept of change agent. Change agents are described
as “trained professionals” who help the organizational system or subsystem to manage the
change effort (Beckhard, 1969; Bennis, 1964; Bennis, Benne & Chin, 1969; Lippitt, Watson &
Westley, 1958; Ottaway, 1983). Many years later Ottaway (1983) developed a taxonomy for
change agents. Within this taxonomy, change generators are the first to enter the change effort,
followed by change implementors and finally change adopters. (Ottaway, 1983). More recent
research provides three commonalities for change agents including “promote[ing]
communication and participation, facilitate[ing] the process for change, and create[ing] a vision”
(Lewis, et. al, 2006).
Information gathering and dissemination.
The Research Center for Group Dynamics was founded by Kurt Lewin in 1945, and
again focused on specific organizational settings and challenges. Lewin developed a process of
surveying group attitudes and providing feedback to the participants to spur the planned change
process. Well-known researchers from this area include Floyd Mann and Rensis Likert (French
& Bell, 1990).
3 Argyris, C. (1970). Intervention theory and method. Reading, MA: Addison-Wesley. 4 Blake, R.R., & Mouton, J. S. (1964). The managerial grid: Key orientations for achieving production through people. Houston, TX: Gulf Publishing Co.
38
Focus on productivity and quality-of-work-life (QWL)/quality circles.
The birth of sociotechnical research was first conducted at the Tavistock Institute of
Human Relations in London by Eric Trist and colleagues (French & Bell, 1990; Huse &
Cummings,1985). Researchers looked at the integration of technology and humans. Out of this
research came QWL tactics known as self-regulating work groups and quality circles (which
allow a group of employees to determine their own work rules such as participation, rewards and
punishments – more focused organizational challenges). One of the well-known researchers who
has links with the Tavistock Institute is Robert Blake (French & Bell, 1990).
Although these four approaches are discussed separately, there are many crossovers in
the literature. For example, Argyris was involved with NTL but also worked with Tavistock and
developed his own version of action research called action science (see Argyris, Putnam &
McLain Smith, 1985) and Lewin is seen as instrumental in all areas (French & Bell, 1990).
Throughout this literature there is an abundance of research that discusses the amount of
practitioner-based versus academic-based research. Kurt Lewin is credited with bridging
academic and practitioner-oriented research through the use of action research (Bennis, 1993).
Here, the concern was to provide a method for social scientists to academically study social
action and provide a means to lead to social action (Lewin, 1946) or the “practical concerns of
people” (Susman & Evered, 1978, p. 587). Lewin stated “research that provides nothing but
books will not suffice” (p. 35). For Lewin, the triad of action, research and training was the key
to success in the study of social science (1946). In 1970, Chris Argyris developed Intervention
Theory and Method, which provides a systematic approach to organizational scientists using
their research to consult, or intervene, for organizations (Argyris, Putnam & McLain Smith,
1985). A major goal for Argyris with all interventions is that the person responsible for the
39
intervention, “the intervenor [sic],” is responsible for helping the organization “to become more
effective in problem solving, decision making, and decision implementation in such a way that
the system can continue to be increasingly effective in these activities and have a decreasing
need for the intervenor [sic]” (Argyris, 1970, p. 16).
The Socio-Technical Debate
Different disciplines bring with them different worldviews and therefore different
perspectives on the nature of change. Accordingly, a strong debate came about in the literature
as to whether the purpose of organizational development, and hence organizational change, was
to improve organizational performance or to improve the “human condition” within the
organization (Sashkin & Burke, 1987, p. 397). In their pioneering study, Friedlander and Brown
(1974) conceptualized the organizational development field in two separate areas. The Human-
Processual Approach looks at individuals and how they interact while the Techno-Structural
Approach looks at technology and structure (Friedlander & Brown, 1974). This sociotechnical
gap was called to the front, once again, in an article by Faucheux, Amadio and Laurent (1982)
which they claim provides a “significant transformation” in the field of planned change (p. 365).
While much controversy surrounded which approach by Friedlander and Brown should prevail
(Beer & Walton, 1987; Faucheux, Amado, & Laurent, 1982; Sashkin & Burke, 1987) one can
look to the literature to find that the organizational change literature is also split showing a value
of both people and performance. A review shows that some of the organizational change
literature is interpersonal in nature, leading towards a Human-Processual Approach (Albrecht &
Hall, 1991; Beer & Walton, 1987; Church, 2001; Cobb & Margulies, 1981; Lewis, 2006; Lewis,
Hamel & Richardson, 2001; Porras & Berg, 1978; White & Mitchell, 1976) while other literature
40
is non-interpersonal in nature, leading towards a Techno-Structural Approach (Church 2001;
Faucheux, Amadio & Laurent, 1982; Timmerman, 2003; White & Mitchell, 1976).
Models of Organizational Change
There is much research with a focus on the phases of organizational change efforts.
Within this research all of the planned change efforts are examples of purposeful efforts to
change the dynamics and disrupt harmony of the system or subsystem. This section details such
research, including: Lewin’s (1951) three stages of change; Lippitt, Watson, and Westley’s
(1958) five-phase model of planned change; Weisbord’s (1987) organizational change
guidelines; Armenakis & Harris’ (2009) readiness for change and Ruben’s (2009a) stages of
change.
Unfreeze, change, freeze.
To begin, one must consider the three stages of change recognized as durable throughout
the ages (Weick & Quinn, 1999): 1) unfreeze the status quo; 2) move or change to a new level
of operation; and 3) freeze so the status quo remains at that level and does not regress to the
prior status quo level (Lewin. 1951)5. Lewin suggests targeting the group rather than the
individual because individuals tend to go along with the group as a whole. A few years later
another group of researchers came to the forefront with their thoughts on the change process.
Five-phase model of change.
Taking Lewin’s three stages a bit further, Lippitt, Watson, and Westley (1958) introduced
a five-phase model of planned change. The phases include the following: 1) “Development of a
need for change” which is similar to Lewin’s unfreezing of the status quo; 2) “Establishment of
a change relationship” where the client finds the consultant as both distant enough from
5 The taxonomy of change agents (Ottaway, 1983) mentioned earlier was designed to coordinate with Lewin’s three stages of change where the change generators were the unfreezers, the implementors were the movers and the adopters were the refreezers.
41
organizational habits yet close enough to understand the organization; 3) “Working toward
change” which is similar to Lewin’s move or change stage and consists of three sub areas:
clarification of the problem, examination of new avenues to solve problem, and transformation
or implementation of actions to solving the problem; 4) “Generalization and stabilization of
change” is similar to Lewin’s third step of freeze so that all parts of the system are involved in
the change process; and 5) “Achieving a terminal relationship” where the client becomes
independent and no longer needs the consultant to function (Lippitt, Watson & Westley, 1958,
pp. 130-143).
Organizational change guidelines.
Weisbord (1987) created the following organizational change guidelines: 1) Gauge the
organization’s capacity to mobilize by the “commitment of its leaders,” “good business
opportunities,” and “energized people” to determine whether or not to move forward – “should
we/shouldn’t we” 2) Involve everyone in the “system” from all ranks and tenure to enable a
mass agreement or conclusion about the process 3) Concentrate on “images for potential” in the
future versus priority lists of problems to energize and keep morale high and 4) Develop systems
and processes to provide independence to stakeholders.
Readiness for change.
Also following in the footsteps of Lewin (1945), Armenakis & Harris (2009) developed a
plan for discerning change recipient readiness by assessing five recipient beliefs. They define
readiness as the “cognitive precursor of the behaviors of resistance to or support for
organizational change (Armenakis, Harris & Mossholder, 1993). Such cognitive precursors are
the five beliefs of discrepancy, appropriateness, efficacy, principal support and valence
(Armenakis & Harris, 2009). The foundational concept here is the idea that assessing recipients
42
level of these five beliefs should enable change agents to determine whether or not recipients are
ready for the organizational change effort.
In this model, the change agent must make the case to the recipients and the recipients
must agree that there is a discrepancy between what is occurring in the organization and what
needs to occur in the organization. Next, recipients must agree that the chosen change effort is
appropriate. Efficacy is the belief that the change can be done by the change recipients and the
organization as a whole. Recipients must also agree that leaders and change agents are indeed
committed to the change effort and will maintain the momentum needed to see the effort through
to fruition. Finally, recipients must agree that they are getting something out of the change
effort.
Stages of change.
In a newer model of organizational change processes Ruben (2009a) defines the
following five stages of successful change that organizational members will undergo: 1)
Attention- where members will first determine that there is a need for a change; 2. Engagement-
where members need to be involved in the change process; 3. Commitment- where
organizational members commit to a position (either investment in the change or parting the
organization); 4. Action- where members act on one’s investment in or commitment to the
change process; and 5. Integration- where organizational members internalize the change as an
ongoing and normal part of their job.
Rational, Normative, and Power Strategies
The previous sections looked at training, team building, the integration of technology
with organizational members as a way to improve productivity via a planned change program,
43
and phases of change programs. This section of the dissertation looks at three “broad strategies”
– or processes – that can be used for change program initiatives (Burke, 2008).
Chin and Benne (1985) developed three broad strategies for planned change initiatives
that change agents can choose from prior to the actual implementation. Chin and Benne (1985)
believe that one of these broad strategies would be a best fit for each situation. Their strategies
include the following: 1.) Empirical-rational strategies argue that behavior change will be
spurred by a motivation of “rational self-interest” (Chin & Benne, 1985, p. 23). In this strategy
the change agent is responsible for finding out the personal motivations of the organizational
members in advance and then using that information to provide a rational proposition to them in
support of both the planned change initiative and the members’ self-interest. 2.) Normative-re-
educative strategies are those where organizational change agents assist members to form new
attitudes and customs about the circumstances, which in turn allows them to assume a new
behavior (Chin & Benne, 1985; Mohrman, Mohrman & Ledford, 1989). This strategy takes into
account the culture of the organization or group. The change agent must determine the rituals
and values of the culture first and then support members to change their culture to reflect the new
rituals and values of the proposed change program. 3.) Power-coercive strategies “focus on the
power and influence that can be used to create change” (Mohrman, Mohrman & Ledford, 1989,
p. 146). Here, the change agent must use the influence that those in power of the organization
hold over those with lesser power (Chin & Benne, 1985).
Once the change agent has decided on the appropriate top-level strategy for implantation
of the organizational change program, then he or she must decide on a task-specific strategy.
The following section on performance measurement systems is one such frequent strategy of
importance to highlight in this dissertation.
44
Performance measurement systems.
The previous section detailed top-level strategies from which change agents can choose
to chart their overall planned organizational change program. The following section burrows
deeper into types of planned change strategies. Here the change agent has a myriad of choices
when it comes to the actual method of implementing the change initiative. Performance
measurement systems are used frequently as implementation strategies of change agents. As such
they make a good topic of research.
What is a performance measurement system?
While performance measurement strategies abound (Bititci, Turner, & Begemann, 2000;
Neely, 1999) they all rest on the common theme of continuous improvement through
benchmarks and goals that are consistently monitored by organizational members. Performance
measurement strategies serve to promote or document change programs – where information
exchange between change agents and constituencies is key.
With an increase in popularity, there is an ever-increasing supply of performance
measurement strategies used within change program models. Likewise there is a budding
consulting, publication, and conference industry that surrounds them (Kennerley & Neely, 2002).
There have been a number of popular performance measurement strategies over the past few
decades such as the following: Balanced Scorecard, Dashboard, Six Sigma, Lean, Kaizan,
MBNQA, ISO, as well as customized applications in various settings such as the Compstat
model in law enforcement and Excellence in Higher Education. One popular example is the
book Lean Thinking by Womack and Jones (2003). This book looks at a specific performance
measurement strategy – Lean – and details its principles, action plans and case studies. Another
popular example is the book Juran’s Institute’s Six Sigma: Breakthrough and Beyond by DeFeo
45
and Barnard (2004). This book looks at a different specific performance measurement strategy –
Six Sigma – and details their strategies for raising the quality of organizational performance with
their methods.
DeFeo and Barnard (2004) claim, a “critical step…is to measure the actual performance
of the product or the process” (p. 94). While DeFeo and Barnard are proponents of Six Sigma,
this “critical step” holds true for all performance measurement strategies. Where performance
measurement strategies differ is in the measurement process. These measurement processes
contribute to the clutter of performance management strategies; some of the more prominent
ones will be detailed next.
How does performance measurement fit into the bigger picture?
In addition to measurement processes, performance measurement strategies emphasize
such processes as linking measures to strategic objectives (Kaplan & Norton, 1996) and
accountability (Tromp & Ruben, 2004). Kennerley and Neely (2002) provide six characteristics
of performance measurement frameworks wherein they say the set of measures needs to, “1.
Provide a ‘balanced’ picture of the business” 2. “Provide a succinct overview of the
organization’s performance” 3. “Measure all areas of performance that are important to the
organization” 4. “Be comprehensive – map all performance measures and show gaps” 5. “Be
integrated both across the organization’s functions and through its hierarchy” and 6. “Use results
to monitor past performance and plan for future performance.” (pp. 149-150)
Ruben (2008) summarizes the process in three steps, “1. Establishing goals 2.
Monitoring the extent to which these goals are being met and 3. Using the resulting information
to plan and execute improvements.” (p. 1)
46
Moullin (2002) defines performance measurement as, “evaluating how well organizations
are managed and the value they deliver for customers and other stakeholders” (p. 188).
Kennerley and Neely (2002) define several parts of a performance measurement system
including, “1. individual measures that quantify the efficiency and effectiveness of actions” 2. “a
set of measures that combine to assess the performance of an organization as a whole” and 3. “a
supporting infrastructure that enables data to be acquired, collated, sorted, analyzed, interpreted,
and disseminated.” (p. 145)
Performance measurement, then, is a means organizational leaders have to accomplish a
planned change effort – whether facing external threats or internal desires for enhanced
performance. A performance measurement strategy, such as a Dashboard, can help determine
gaps as well as provide ongoing indications of the impending success or failure of planned
change effort. Such a performance measurement is an important piece of the planned change
effort.
Why is performance measurement an important focus for many organizations?
Many organizations find significant benefits from performance measurement programs
including: building consensus and shared perspective on organizational strengths, weaknesses,
priorities and improvement needs; increased performance (Kennerley & Neely, 2002);
comparison of the organization’s status versus set plans and other similar organizations that are
successful (Moullin, 2002), communicate organizational status to stakeholders and the public
(Moullin, 2002), identify performance gaps and thus be certain priorities are correct (Moullin,
2002), and “compel progress” (Moullin, 2002, p. 190) by measuring and sharing results with
stakeholders.
Examples of performance measurement strategies.
47
Although a few earlier models existed, the performance measurement “revolution”
(Kennerley & Neely, 2002) came about with the critique of measures based solely on financial
indicators by Johnson and Kaplan in 19876 (Kennerley & Neely, 2002). Since then there have
been dozens of performance measurement strategies introduced. For a complete review see
Kennerley and Neely (2002). The following list and description of performance measurement
strategies is meant only to provide the reader with an overview of some of the available
strategies. Its purpose is not to provide an in-depth analysis, nor to cover all the existing
performance measurement strategies available to-date. One should note that the different types
of measurement systems have different goals, some of which are broadly focused and others
more narrow in focus. See Tables Two and Three for a comparison and contrast of several of
these strategies.
Performance Measurement Strategies Distinctive to Industry
Balanced Scorecard
One of the most popular strategies is that of the Balanced Scorecard developed by Kaplan
and Norton (1992) in the early 1990’s and has been used widely in business since its inception.
The intent of this program is to provide a system to measure effectiveness in an organization’s
overall progress by tracking performance in four key areas: customers, finances, internal
business, and innovation and learning (Kaplan & Norton, 1993, 2005). From here the
organization’s managers can set its goals in terms of a strategic plan and the paths necessary to
achieve them. This is accomplished by linking measures to the way work gets done by each
employee (Kaplan & Norton, 2005). In this way, then, the shift is made from other performance
measurement strategies which use control as motivation to the use of “strategy and vision” to
6 Johnson, H.T. & Kaplan, R.S. (1987). Relevance lost – The rise and fall of management accounting. Boston, MA: Harvard Business School Press.
48
enable employees to adapt to the new way of doing work (Kaplan & Norton, 2005, p. 180). Note
the narrow scope of this performance measurement indicator is in four areas of operation:
customers, finances, internal business and innovation and learning.
Dashboards
Another popular strategy is the Dashboard. A variety of styles and forms of Dashboards
exist depending on the organization and their goals. Dashboards are key indicators of an
organization’s goals arranged in a manner so that organizational members can assess
performance gaps at a glance. The name Dashboard was meant to refer to the Dashboard on a
vehicle that provides the driver with a quick gauge of how the system is operating (gas,
temperature, etc.). In any organization the Dashboard might refer to gross sales, profit margin,
overhead, manufacturing status, human capitol, web statistics, customer retention rates, etc.
Dashboards will vary by organization based on strategic goals. As such, departments within
organizations may have different Dashboards to reflect their responsibilities towards the overall
strategic goals and directions of the organization. Depending on the organization, employees
either create their own Dashboard measures based on what they feel are important indicators, or
the management does it for them. Note that the Dashboard performance measurement indicator
has a broad area of focus which allows complete customization for every organization.
Six Sigma
A third strategy is Six Sigma. According to iSixSigma.com (2009) the main emphasis
behind this strategy is process improvement. Specifically, Six Sigma looks at quality standards
and defect reductions by introducing a standard measurement and methodology for assessing the
organization’s progress (iSixSigma.com, 2009). In doing so the process uses the following
method to reduce and eliminate defects: determine, measure, analyze, implement and control
49
(Ferguson, 2006). While the method has proven to be successful, it has the downside of creating
silos within the organization because typically only the team members are aware of happenings
while others in the organization are left to wait to find out what’s involved (Ferguson, 2006).
“Sig Sigma is all about exclusion” (Ferguson, 2006, p. 15). Six Sigma programs are mostly used
to target a specific area within the organization by forming teams specific to that area and
typically last until that area meets its goals (Ferguson, 2006). These teams are responsible for
everything from determining the problem to implementation of the recommendations to fix the
problem and then monitoring results of the implementation (Ferguson, 2006). From there the
organization relies on measurements to control the process (Ferguson, 2006). However, due to
the exclusionary process involved with employees, “there is no effect on the culture or the
organisation as a whole” (Ferguson, 2006, p. 15). Note the narrower focus of this performance
measurement indicator.
Lean
Another type of performance measurement strategy is Lean. According to Ferguson
(2006), lean is a philosophy that uses continuous improvement to “identify and eliminate waste”
from the entire system (p. 15) while focusing on what is valued by customers using some sort of
process mapping – possibly value stream mapping or flow analysis (Lean.org, 2010). Here
everyone in the organization is aware of and involved with the philosophy through the transfer of
knowledge and learning (Ferguson, 2006). Involving everyone in the organization in a
continuous improvement process is a daily task that keeps the waste identification and
elimination effort ongoing in stakeholders mind (Ferguson, 2006). “The lean organization
educates, engages, and empowers the entire workforce to identify and eliminate waste
throughout the value stream” (Ferguson, 2006, p. 15). There are five principles of Lean
50
manufacturing: 1.) “Value” of product or service from the customer’s viewpoint (Womack &
Jones, 2003, p. 16) 2.) “Identify the value stream” of the product or service from conception
through final delivery to the customer (Womack & Jones, 2003, p. 19) 3.) Produce products or
services in a “Flow” method rather than in batches to maximize time and energy (Womack &
Jones, 2003, p. 22) 4.) Allow customers to “Pull” the product or service from the manufacturer
as they need it and not have it pushed on them as the manufacturer has the product or service
ready and waiting (Womack & Jones, 2003, p. 24) 5.) While the first four principles work
together as a continuous system “Perfection” becomes easier to achieve (Womack & Jones,
2003, p. 25). These five principles are the basis for the continuous improvement process. As the
cycle moves towards perfection it becomes easier to spot areas where value can become more
streamlined and so on, leading to increased perfection. Hence, a common measurement in Lean
is productivity. Many organizations change their employees compensation based on individual
or team productivity as a reward. Note the overall broad focus of recognizing value within the
system and at the same time eliminating waste. But also note the narrow focus within each
section of the organization. For example, the lean process can apply first to manufacturing
processes and then to the office.
Kaizan
A fifth strategy is Kaizan. Based on a change strategy from Japan, Kaizan is a
philosophy to bring change throughout a person or an organization. It is embedded within and
used as a source of strength to continuously improve over time (Value Based Management.net,
2009). The philosophy is based on the following five elements: “teamwork, personal discipline,
improved morale, quality circles, and suggestions for improvement” (Value Based
Management.net, 2009, p. 1). Three key factors occur from these elements: “elimination of
51
waste and inefficiency, good housekeeping (tidiness, orderliness, cleanliness, standardized clean-
up, discipline), and standardization (Value Based Management.net, 2009, p. 1). Involvement of
all employees is critical to the philosophy (Value Based Management.net, 2009). According to
Value Based Management.net (2009) Kaizen does well as a long-term change program within
collective cultures. Note that this performance measurement indicator has a broad focus.
ISO
The International Organization for Standardization (ISO) is a unique model in that it
is non-governmental and consists of a “network of national standards institutes in 163
countries” (ISO, 2010a, para. 2). The organization claims that it is “the world’s largest
developer and publisher of International Standards” (ISO, 2010a, para. 1). The standards
used by ISO organizations are consistent internationally which makes this an especially
important model for global organizations. Overall quality and consistency are measured
through a variety of standards created for each industry (ISO, 2010b; Mallak, Bringelson &
Lyth, 1997). In most instances employees are presented with intended changes to their work
along with training, and the employees are given the freedom to then rewrite their own work
instructions. While the ISO performance measurement system is broad in its overall scope,
the system is meant to become narrow as it evaluates the inclusion or exclusion of
organizations into its community based on individual production processes. For example,
one of the over 18,000 international standardizations to-date includes that of “telephone and
banking cards” (ISO, 2010b, para. 4).
Malcolm Baldrige National Quality Award Program
The Malcolm Baldrige National Quality Award Program (MBNQA) is another widely
used and influential model. However, this model includes a self-assessment tool designed for
52
full employee involvement and input into the program. The approach stresses the importance of
the following: leadership; strategic planning; customer focus; measurement, analysis, knowledge
management; workforce focus; process management; and results or outcomes of product,
customer, financial and market, workforce, process, and leadership categories. An underlying
theme is that review, planning, and continuous improvement are fundamental to organizational
effectiveness and should be thoroughly integrated into the fabric of every organization aspiring
to excellence. Due to its popularity, this program has had some spin-offs and adaptations
including the European Foundation for Quality Management’s (EFQM) Business Excellence
Model (http://www.eiqa.com/certification/efqm), Excellence in Higher Education (Ruben,
2009b), and Core Communication (Ruben & Smulowitz, 2007). While this performance
measurement indicator is broad in nature, it is structured into seven narrower categories.
Performance Measurement Strategies Distinctive to Higher Education
Excellence in Higher Education
The Excellence in Higher Education (EHE) strategy is based on the MBNQA program
reviewed earlier as well as standards in use by the U.S. higher education accrediting associations.
Similarly, it stresses the importance of the following: leadership; purposes and plans;
beneficiaries and constituencies; programs and services; faculty/staff and workplace; assessment
and information use. The strategy can be used at any level of analysis and institutions of higher
education can facilitate the process by either using a consultant or in-house staff. EHE can be
conducted as a self-assessment tool and total inclusion of employees is recommended for
optimum results. The EHE process is available in its entirety as a book (Ruben, 2009b) and
workbook (Ruben, 2009c) that can help guide participants, and has been used in over 40
institutions to-date. In addition, a number of studies have been conducted using this framework
53
(Ruben 2009b, 2009c). One study (Ruben, Russ, Smulowitz, & Connaughton, 2007) analyzed six
university departments that separately participated in EHE/Baldrige workshops administered by
the Center for Organizational Development and Leadership at a Northeastern University between
2003-2005. Findings indicate that participants did acquire knowledge from the workshops, and
the majority of participants demonstrated dedication to a positive change in their organizational
practices (Ruben, Russ, Smulowitz, & Connaughton, 2007). Similar to MBNQA, this
performance measurement indicator is broad in nature, but is structured into seven narrower
categories. In addition, the program is flexible so that it can be focused broadly on the entire
organization or narrowly on a single program or department.
Regional Accreditation Programs
There are six regional accreditation programs for institutions of higher education. For
purposes of this study the following two will be highlighted: Academic Quality Improvement
Program (AQIP) and Middle States Commission on Higher Education (MSCHE). These are
included in this section of the study as they relate to the discussion of performance measurement
strategies. Each accreditation program has its own set of criteria to which institutions of higher
education must meet or exceed to become accredited or retain accreditation. In this sense, then,
the accreditation programs measure performance based on their individual set of criteria.
Academic Quality Improvement Program (AQIP) is based on nine criteria as follows: helping
students learn; leading and communicating; valuing people building collaborative relationships
planning continuous improvement; supporting institutional operation; measuring effectiveness;
understanding needs of students and other stakeholders; and accomplishing other distinctive
objectives. The primary focus is on learning. The Middle States Commission on Higher
Education (MSCHE) operates on 14 standards as follows: mission, goals, objectives; planning,
54
resource allocation, institutional renewal; institutional resources; leadership and governance;
administration; integrity; institutional assessment; student admissions; student support services;
faculty; educational offerings; general education; related educational activities; and assessment
of student learning. The primary focus is on teaching and learning. These programs are broadly
focused on the overall institution and then narrowly focused on the specific unit such as student
learning outcomes.
The review of research in this section examined the evolution of strategies and
approaches to planned organizational change. In summary, while there is a vast array of
strategies available for use with planned organizational change efforts, some distinctions can be
made between the strategies depending on the scope and goal of the individual effort. The
research presented in this section support this study by emphasizing that: 1.) There is a long
history of introducing and implementing different changes in different ways within
organizations. 2.) There is a long history of academically-supported planned change strategies
for practitioners. 3.) There is a long history of tension between the technical and human side of
organizational change. 4.) There is a long history of debate over using the “right” performance
measurement system.
55
CHAPTER 3
Method
This section of the dissertation begins with a brief summary of the purpose of this
dissertation, followed by a detailed discussion on the methodology that has been employed in
this study.
Dissertation Purpose
One of the increasingly popular strategies for institutions of higher education to address
the challenges for assessment, accountability and continuous improvement is the use of
performance measurement. Performance measurement is a well-accepted and widely used tool in
business but less so in higher education. This dissertation studies the introduction and
implementation of a specific performance measurement system, the “Dashboard,” as the planned
organizational change from the perspectives of three organizational levels of employees within a
large Northeastern University using a case study method. The case study approach in this
dissertation focuses on four educational support service departments within that organization,
and particularly includes senior leadership, department heads and department staff from those
departments. In addition, this study sought to clarify the role of communication in facilitating
and/or impeding this planned organizational change by examining the social interactions and
realities from these three organizational levels of employees within the institution through an
analysis of the perceptions of each about the planned change effort.
Research Questions
Research question 1.
What are the perceptions of three organizational levels of employees about the
introduction and implementation of a performance measurement initiative? Specifically, how do
56
participants understand the purpose of the initiative, assess the value of the initiative, assess the
impact of the initiative on individual and organizational performance and assess the overall
success of the initiative?
Research question 2.
How have the values (issues of most importance and meaning inherent in the culture)
played a role in this planned organizational change initiative with regard to member attitudes and
motivations? Responses to this question will include members’ attitudes toward measurement,
motivation, productivity, organizational values, aspirations, morale and previous work habits.
Research question 3.
What was the role of communication in facilitating and/or impeding this planned
organizational change?
Method: What And Why?
This study analyzed data from interviews from four educational support service
departments and the senior leadership group in a large, Northeastern university that allowed for a
greater understanding of the commonalities and uniqueness’s that exist within each educational
support service departments. The reasons this institution of higher education was chosen for use
in this case study were because it met Stake’s (2006) criteria which include the following: 1.) the
educational support service departments and the senior leadership group were relevant to the
study in that they were involved to some extent with the introduction and implementation of a
large-scale, planned organizational change in higher education involving performance
measurement; 2.) The educational support service departments and the senior leadership group
provided diversity in that they were all separate programs in separate contexts to study the
planned change effort; and 3.) the educational support service departments and the senior
57
leadership group provided an opportunity to understand the complexities of the planned change
effort. Using the four educational support service departments and the senior leadership group
provided access to the three organizational levels of employees within the institution vital to this
study. The three organizational levels of employees include senior leaders, department heads
and department staff.
The Case Study Process
Why the case study approach?
This study examined the social history (Orum, Feagin & Sjoberg, 1991) of three
organizational levels of employees. This was accomplished by examining the social interactions
and realities from these three organizational levels of employees within the institution through an
analysis of the perceptions of each about the Dashboard planned change effort. In doing so, the
researcher “wishes to make claims that are grounded in the claims of those who make them”
(Orum, Feagin & Sjoberg, 1991, p. 8). The case study method provided the researcher with an
opportunity for “insight, discovery and interpretation” of the phenomenon in this study
(Merriam, 2009, p. 42).
There are four lessons to be learned from the case study approach (Orum, Feagin & Sjoberg,
1991). The first lesson is that a case study allows the researcher the ability to “study people in
(their) natural setting” versus the reproduction of a natural setting via experimentation (Orum,
Feagin & Sjoberg, 1991, p. 7). The second lesson is that a case study provides a more complete
view of the action and meanings of the social system. According to Orum, Feagin & Sjoberg
(1991) then, a case study that looks at performance measurement indicators
allows the observer to examine social action in its most complete form. The
investigator is better able to grasp the total complex world of social action as it
58
unfolds. For someone who is interested in how people act in organizations, and
how daily routines influence their work, such a gain can be quite considerable. (p.9)
The third lesson is that a case study provides a sense of “time and history” so that the
researcher can look at social interactions and routines to determine changes and constants (Orum,
Feagin & Sjoberg, 1991, p. 12). The fourth lesson is that a case study promotes theory
development (Orum, Feagin & Sjoberg, 1991, p. 13).
Research Setting
Selection of Site and Case
A large, Northeastern University which had just undergone a large-scale, planned
organizational change using a Dashboard effort was identified by the researcher’s advisor. In
addition, the key people for the case study analysis were approachable through a relationship
with the researchers’ advisor. This access made the use of the University an appropriate site to
locate a case for the study (Stake, 2006).
The key person for access to the division was the Vice President for Undergraduate
Education within the Division of Undergraduate Education. At the time of data collection the
Vice President had 13 direct reports including several Assistant Vice Presidents, Deans, an
Executive Associate and Administrative Assistant. Each Assistant Vice President had a number
of educational support service departments (ESSDs) reporting to them. At the time of the data
collection there were a total of 16 ESSDs reporting collectively to the four Assistant Vice
Presidents. Each educational support service departments varied from six to 30 members.
Due to the large number of units and individuals involved with the overall planned
organizational change initiative a decision to focus on a smaller number of units was based on
workload and timing. The researcher wanted to allow for greater clarity and understanding of
59
the planned organizational change process as well as allow for manageability of data and
analysis. In addition, the researcher wanted to focus on the four educational support service
departments that were involved in the initial introduction and implementation process during the
timeframe of the study. This decision, by nature, excludes other units that had not yet gone
through this process.
The four educational support service departments and the senior leadership group in this
case study were chosen because: 1.) are all relevant to the overall study in that they were all
involved with the transformation of undergraduate education and Dashboard performance
measurement system. This common bond provides a unique way to study the overall
phenomenon of large-scale, planned organizational change in higher education (Stake, 2006). 2.)
all provide diversity across contexts in that they are all separate programs in separate contexts for
undergraduate students (Stake, 2006). 3.) all provide “good opportunities to learn about
complexity and contexts” (Stake, 2006, p. 23). They each operate in separate contexts and
entities within the University while serving different groups of students.
Background Information on the University
In 2005 the University reorganized its campus structure to transform the undergraduate
education experience with a primary focus on the interaction of undergraduate students and
faculty, and also on educational support service departments (Northeastern University, 2005).
As a result of the transformation many educational support service departments (ESSD’s) were
physically relocated, in some instances from many separate locations, to one central location on
campus. In addition to the individual ESSD’s being physically moved, many of the ESSD’s now
reported to a new, and individual Vice President. This reorganization was significant because
each ESSD had distinct missions and no common history; the entire division of Undergraduate
60
Education was a newly formed entity as a result of the transformation. While the ESSD’s within
the division of Undergraduate Education existed previous to the transformation, they reported to
different Vice Presidents. This was the first time these ESSD’s reported as a group to the new
Vice President of Undergraduate Education. Organizational members in these ESSD’s didn’t
know one another and operated generally in distinct and self-contained units with their own
management structure.
Structure of Planned Change Effort.
Beginning with the four educational support service departments (ESSD) in this study –
ESSD1, ESSD2, ESSD3, and ESSD4 – each unit went through a process of reflection, structure
and measurement with the help of staff from an internal Center for Organizational Development
at the University, referred to as COD in the study7. As a part of this process the staff from the
COD facilitated a series of planning meetings to help the educational support service
departments to look deep into their organizations to determine the meaning and value, or culture,
of their individual programs and to examine and in some cases clarify their mission and purpose,
and how the work of the unit fit within the larger organizational and institutional context. In this
process, the “individual units developed or refined their mission, goals [sic] as well as learned of
the true value of their service and how it relates to undergraduate education and …[the
University]… as a whole” (Ruben, 2007b, p. 8). From here, members of the educational support
service departments chose the performance measurement indicators that appropriately captured
the mission and purposes of their programs. Next, members of the educational support service
departments collected data relative to these indicators. Finally, data were integrated into a web-
7 The internal Center for Organizational Development is used as a fictitious name to protect the confidentiality of participants in this study.
61
based Dashboard to enable internal and external constituencies’ access. The results would be
used to assess effectiveness and identify areas for improvement by the units.
Selection of Participants
To determine desired interviewees the researcher compiled a list of all potential
candidates in the overall population of the four educational support service departments and their
senior leadership group. To do so the researcher copied names, titles, and contact information
from each department website. Next the researcher contacted each department by telephone to
ask for confirmation that the website listing was correct. Once an overall population listing was
developed the researcher consulted with staff from the Center for Organizational Development
(COD) who helped the departments to create the Dashboard indicators. The COD staff members
were able to identify members of the organization who were involved with the introduction and
implementation of the Dashboard measures and could indicate the level of involvement for each
member. The identification of these key members assisted the researcher to better understand
the case study at hand (Stake, 1995). Finally, the researcher asked members of this original list
to identify other potential interviewees.
Upon compiling the population list the researcher segmented the members into three
main interview categories of Senior Leadership: those at an administrative level such as
representatives from the Center of Organizational Development (COD), Assistant Vice President
or Vice President level who were the high-level members; Department Heads: those at the
department level who were mid-level members; and Department Staff: those at the departmental
level who may or may not have been involved with the Dashboard planned change effort8. After
8 Upon data analysis the researcher changed “recipients” to “departmental staff” because in some instances these staff members either had no idea anything had occurred or they were involved in depth in the process of the Dashboard effort. In this same way, then, Unit heads description has been expanded to describe them as mid-level members. At times they acted as initiators and other times as recipients. In some instances they were completely out

62
segmentation the researcher reviewed the lists along with the input from members of the Center
for Organizational Development to determine which members of the population to include in the
sample. The researcher determined the following: a.) each of the members in the senior
leadership group would be included in the interviews because they were directly involved with
the Dashboard planned change effort; b.) each of the department heads and their direct assistants
would be included in the interviews for unit heads because they were directly involved with the
Dashboard planned change effort on the department level; and c.) a proportional stratified sample
of 20% of the staff in each department9 was used to determine the interviews for department staff
to allows for proper representation. The interview participants for the department staff were
drawn by systematic sample.
In all, the researcher contacted 61 prospective participants including eight senior leaders,
13 department heads, and 40 department staff. The researcher interviewed 32 people including
seven senior leaders, 10 department heads, and 15 department staff. One department staff
member did not return the signed consent form which made that interview invalid and the others
either declined an interview or never returned the researcher’s inquiry.
It is important to note that the inclusion of department staff into the Dashboard effort
varied greatly by department because of the size and variety of tasks performed within each
department. As such, the researcher relied on the department heads to identify additional
interview participants. Only one department head indicated additional interview participants
within their unit. Another department head identified an additional senior leader as an interview
of the loop. The Associate Vice Presidents were also at times secondary initiators as well as implementers of the change…although not implementers to the extent of their unit heads. 9 The researcher added an extra interview participant to both EESD3 and ESSD4 units because the 20% inclusion rate yielded only one person in these smaller departments.
63
participant. As such, the researcher modified the original interview participant list to include
those identified by the department heads.
A brief description of the study was orally explained to the participants, and the
researcher assured them of their confidentiality. Every effort was made on the part of the
researcher to develop sensitivity and a timeline that adhered to the participants’ schedules and
available resources – especially since data collection occurred at the beginning of a semester
when the units were most busy. Finally each participant was asked to sign an agreement to
participate in the study. Permission was granted from the Vice President for Undergraduate
Education, and approval from the Institutional Review Board was obtained prior to contact with
the participants. To be certain that the researcher took appropriate notes, “member checks” were
conducted where the researcher asked select participants to review notes to check for accuracy in
meaning (Stake, 1995, p. 56).
In all 32 in-depth personal interviews were conducted within the three organizational
levels of employees in this study. The remaining sections of Chapter Three details the data
collection and recording procedures used in this dissertation.
Data Collection and Recording Procedures
This study is organized into six phases (See Table 1.): 1) informal data collection as well
as obtaining approvals to conduct the study from various sources; 2) execution of a pilot study;
3) execution of seventeen in-depth interviews with senior leaders and department heads; 4)
execution of fifteen in-depth interviews with department staff; 5) review, analysis and
interpretation of data for each educational support service departments and the senior leadership
group; and 6) review, analysis and interpretation of data across all educational support service
departments and the senior leadership group.
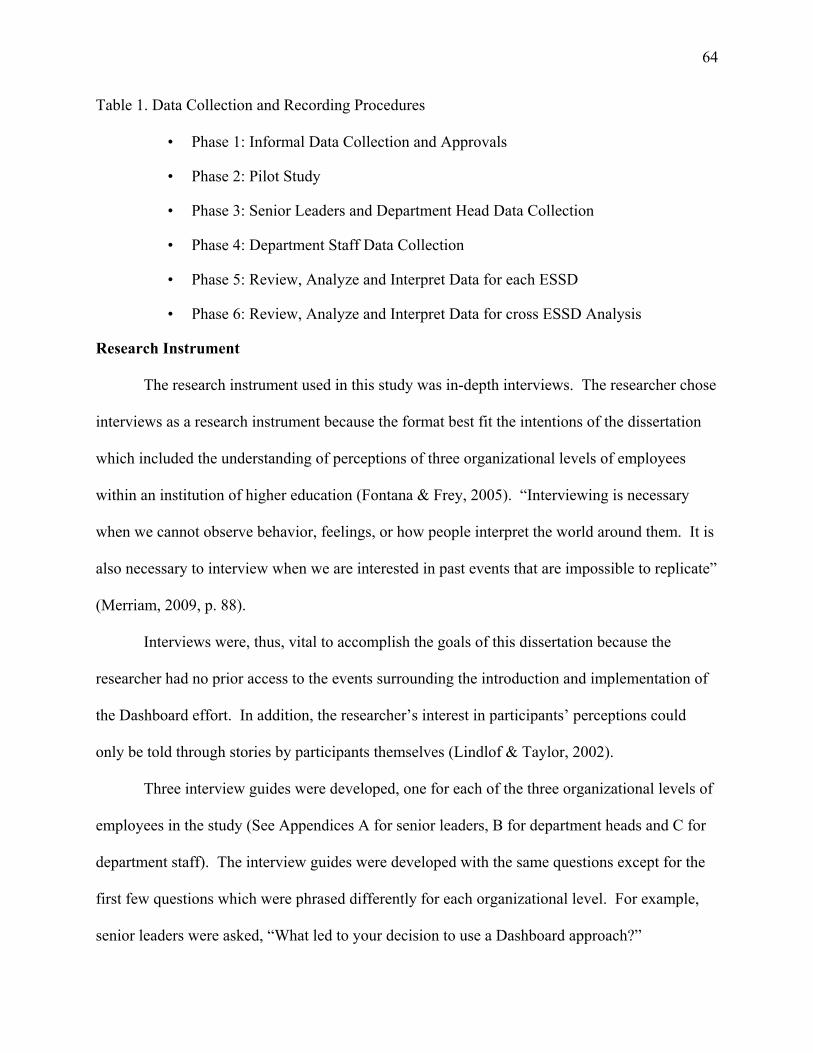
64
Table 1. Data Collection and Recording Procedures
• Phase 1: Informal Data Collection and Approvals
• Phase 2: Pilot Study
• Phase 3: Senior Leaders and Department Head Data Collection
• Phase 4: Department Staff Data Collection
• Phase 5: Review, Analyze and Interpret Data for each ESSD
• Phase 6: Review, Analyze and Interpret Data for cross ESSD Analysis
Research Instrument
The research instrument used in this study was in-depth interviews. The researcher chose
interviews as a research instrument because the format best fit the intentions of the dissertation
which included the understanding of perceptions of three organizational levels of employees
within an institution of higher education (Fontana & Frey, 2005). “Interviewing is necessary
when we cannot observe behavior, feelings, or how people interpret the world around them. It is
also necessary to interview when we are interested in past events that are impossible to replicate”
(Merriam, 2009, p. 88).
Interviews were, thus, vital to accomplish the goals of this dissertation because the
researcher had no prior access to the events surrounding the introduction and implementation of
the Dashboard effort. In addition, the researcher’s interest in participants’ perceptions could
only be told through stories by participants themselves (Lindlof & Taylor, 2002).
Three interview guides were developed, one for each of the three organizational levels of
employees in the study (See Appendices A for senior leaders, B for department heads and C for
department staff). The interview guides were developed with the same questions except for the
first few questions which were phrased differently for each organizational level. For example,
senior leaders were asked, “What led to your decision to use a Dashboard approach?”
65
Department heads and staff were asked, “What goals do you think the administration wanted the
Dashboard to accomplish?”
From these interviews the researcher was able to gather information about the perceptions
of the three organizational levels of employees within the study (Hatch, 1993). The researcher
took care to be sure that the participants spoke more than the listened. The researcher recorded
the meeting with participant approval and took notes throughout the meeting. The researcher
asked follow-up questions that allowed for a more thorough understanding of the participants’
responses. Finally, the researcher asked clarifying questions to ensure the correct interpretation
of the participant’s responses had been documented. One the interview was complete the
researcher immediately transferred and expanded on the field notes to a digital journal while the
event was fresh in the researcher’s mind (Stake, 1995).
Phase One: Informal Data Collection & Approvals
Informal data collection for this case study analysis began as the researcher was
uncovering background information about the large, Northeastern University in the study (Stake,
1995). In this sense, the researcher reviewed key documents about the large-scale planned
change initiative from public data available on the university web site. The researcher also
attended a meeting where three of the four educational support service departments (ESSD)
heads were presenting information about their experiences with the change process to the next
four ESSDs in line to undertake the Dashboard process. At this meeting the researcher had an
opportunity to ask permission from the leaders for access to information and key people within
their respective departments. Permission was granted. In addition, the researcher met with the
Vice President for Undergraduate Education to discuss the scope of the study and to ask for
66
permission to approach members of Undergraduate Education. Permission was granted. The
researcher also sought and was granted permission through the Institutional Review Board.
Phase Two: Pilot Study
A pilot study was conducted in July and August of 2011. The researcher interviewed one
participant from the senior leadership group and one participant from the department head group.
To choose these participants, the researcher consulted the original population listing determined
in the sampling method described earlier and reviewed the lists for participants within each
organizational level being studied. The desired participant for the senior leadership group
assisted with the Dashboard process and rollout. The desired participant for the department head
group met with the researcher last year and indicated a willingness to participate in the study.
During this pilot study the following important items of note became clear:
1. The number of staff within each department varied from six to 30 staff members. 2.
Each department faced a unique set of challenges to realize their goals. 3. Two of the four
departments in this study were already collecting data as a requirement for outside funding
agencies, and thus were more familiar with data collection. 4. Each department used a similar
process to create their Dashboards, but there was some variety in the way the departments
involved other members of the department. Understanding these items helped the researcher to
know that understanding each department would require flexibility.
Phase Three: Senior Leadership and Department Head Data Collection
Phase Three of the dissertation served to identify organizational members who were in
key roles as senior leaders of the planned change effort, as well as to gain insights into the
perceptions of these more senior members of the organization as to the goals, strategies and
intentions of the planned change effort. The senior leaders of the organization are further
67
segmented into those at an administrative level, such as representatives from the Center for
Organizational Development (COD), Assistant Vice President or Vice President level who were
the high-level members. Through seven in-depth, open-ended interviews the researcher sought to
discover the perceptions of senior leaders about the Dashboard effort. In addition, Phase Three
of the dissertation served to identify department heads who were in mid-level roles that served at
the organizational level between the senior leadership and the department staff. These ten in-
depth, open-ended interviews also helped the researcher to determine additional interviewees for
Phase Three as well as Phase four. In all, the researcher sought to learn the following from senior
leaders and department heads:
how the more senior members of the organization decided to use Dashboards
what goals they felt the Dashboard would accomplish
the way in which the Dashboard was developed and introduced
names of individuals responsible for initiating and implementing Dashboard
measures
what was involved with the initiation and implementation of Dashboard measures
the way the Dashboard measures were introduced
the reaction to the Dashboard measures
whether or not the senior leaders and department heads of the organization felt the
introduction of Dashboards was successful
how the Dashboard measure was implemented in each department
how members used the Dashboard measures
staff members’ perceptions about the role of communication in facilitating and/or
impeding the effort
68
key lessons learned. (See Appendix D: Interview Guide for Senior Leadership and
Appendix E: Interview Guide for Department Heads for complete listing of
interview questions.)
This phase of interviews provided insights into the perceptions of the senior leaders and
department heads about the planned change effort and provided the foundation for Phase Four.
In addition, the researcher gained knowledge to define data gathering strategies for Phase Four.
From the analysis of interviews the researcher gained insights into the way the planned
organizational change effort was introduced and implemented. This helped inform the researcher
of additional interviewees for phases three and four.
Specifically, the researcher looked for the senior leaders and department heads to identify
by organizational chart the other individuals who were involved in the planned organizational
change effort. In addition, the researcher sought to discover to what extent these identified
individuals were involved in the planned organizational change effort. Finally, the researcher
looked for the senior leaders and department heads to identify documents and/or artifacts that
could aid the researcher in answering the research questions.
Phase Four: Department Staff Data Collection
Phase Four of the dissertation examined the planned change effort from the perspective
of 15 of the departmental staff within the educational support service departments through in-
depth, open-ended interviews (see Appendix F for the interview guide). The purpose of the
interviews was to explore the staff member’s perceptions of the change effort such as the
following:
staff members’ perception of the senior leaders’ purpose or goals of the use of
Dashboard measures
69
staff members’ goals of the use of Dashboards
staff members’ thoughts as to the importance of the initiative
members involved with initiating and implementing the Dashboard measures
the way in which Dashboard measures were introduced and implemented
perceptions of differences in the way the Dashboard measures were introduced
and implemented in different departments
reactions to the introduction and implementation of Dashboard measures
attitudes and opinions towards measurement
the ways the members use the Dashboard measures
perceptions of value of the initiative to individual and organizational
performance, motivation, productivity, values, aspirations, morale and previous
work habits
staff members’ perceptions about the whether or not the change was a success
staff members’ perceptions about the role of communication in facilitating and/or
impeding the effort
and key lessons learned. (See Appendix E: Interview Guide for Senior Leaders
and Appendix F: Interview Guide for Department Heads for a complete listing of
interview questions.)
This phase of interviews directly provided insights into the perspectives of the staff
members about the planned change effort. During these interviews the researcher requested
and/or was suggested documents and other artifacts from senior leaders, department heads and
staff members. These materials consisted of the Dashboards as they were displayed on the
70
University web site, a few e-mails from senior leaders, a copy of the organizational chart for the
division and a timeline of the Dashboard effort10.
Phase Five: Review, Analyze and Interpret Data for each ESSD.
To analyze the data the researcher used the research questions as a guide to develop
categories or themes by coding data that ultimately led to answers to research questions about the
large-scale, planned organizational change from the perspective of the educational support
service departments (ESSD’s) and the senior leadership group (Merriam, 2009). Specifically,
the researcher looked at the Dashboard approach in terms of why it was chosen, who was
involved, what goals the Dashboard should serve, the way it was introduced, when it was
introduced, and what impact(s) it has had since implementation from the perspectives of the
ESSD’s and the senior leadership group.
Therefore, the following process (Merriam, 2009) was used:
1. The researcher recorded data – such as interview transcripts, field notes,
documents, researcher comments and notes.
2. Next the researcher coded, organized and labeled the data from the first data
collected through final analysis. Data were coded according to relevance to the
study, organized and labeled so that it was available to the researcher in an easy-
to-find system.
3. Then the researcher generated answers to the research questions by looking for a
key word or stories about an event as described through participant interviews.
10 During interviews with senior leaders and department heads, and in a few instances with department staff, the researcher requested documents and/or artifacts surrounding the introduction and implementation of the Dashboard effort. The researcher intended to use documents and artifacts from research participants as another means to analyze and cross-check data from interviews (Merriam, 2009). While some documents were obtained many participants either could not find or did not have easy access to documents from the Dashboard effort. In some instances participants repeatedly told the researcher they would find documents, but never followed through on their intent. The online representations of the Dashboards were the only artifacts found during this study.
71
Throughout data collection and analysis the researcher compared data to each
other to further subdivide or confirm findings by grouping alike data. “The
challenge is to construct categories or themes that capture some recurring pattern
that cuts across your data” (Merriam, 2009, p. 181).
4. Next the researcher determined themes from linking the categories together in an
effort to lead to a model of explanation about the perceptions of the three
organizational levels of employees within the institution of higher education.
Phase Six: Review, Analyze and Interpret Collected Data for Cross-ESSD Analysis.
The researcher reviewed and analyzed all data to allow for similarities and differences to
be found across ESSD’s. This enabled the researcher to build on the data from phase five to
explore whether individual ESSD findings were unique or span across all the ESSD’s within the
dissertation (Stake, 2006).
To conduct this cross ESSD analysis, the researcher looked for examples from
participants about the introduction and implementation of a specific performance measurement
system, the “Dashboard,” as the planned organizational change from the perspectives of three
organizational levels of employees of the organization. This study also sought to understand the
role of communication in facilitating and/or impeding this planned organizational change by
examining the social interactions and realities of these members. In addition, the researcher
looked for similarities or differences among ESSD’s. For example, the researcher examined the
perceptions about the goal of the Dashboard effort by members of the three organizational levels
in this study. During analysis several key words or phrases were consistently mentioned by
participants. These key words or phrases were helpful to the researcher’s development of a
coding scheme.
72
Coding.
The researcher began data analysis by reading through the transcripts to determine
potential codes (Charmaz, 2005) using key words or phrases from interview participants which
was key to the coding process (Bishop, 2005; Merriam, 2009). Research shows that the analysis
of a series of interviews can actually be used to “co-construct a mutual understanding by means
of sharing experiences and meanings” for participants (Bishop, 2005, p. 126). It is through the
subsequent analysis of these shared experiences and meanings, going back and forth through the
data to compare data (Charmaz, 2005; Merriam, 2009), that the researcher can develop a coding
procedure (Bishop, 2005). As such the researcher went through the data line-by-line to discover
key words or phrases that were common among participants. As key words or phrases emerged
from the data the researcher constantly compared the data to earlier data and kept track of how
many times the data appeared (Merriam, 2009). In addition, upon discovery of a new key word
or phrase the researcher doubled back to the transcripts to find if indeed this was a new code that
should be included in the study (Merriam, 2009). Most of the codes were taken directly from
quotes from the transcripts and a few were re-worded by the researcher for parallelism. One
example is the code redundancy that was reworded from a synopsis of data that said “we’ve
already done this,” or “we do this already.” Another example is the code resources which was
re-worded by the researcher to be all-encompassing for participant explanations of “additional
staff,” “more funding,” etc. In all, 20 coding categories were identified based on an analysis of
interview transcripts. (See Table 2.)
Themes.
Once codes were developed, the researcher further analyzed these categories for
meaningful patterns that joined the data into four themes and one overarching theme to explain
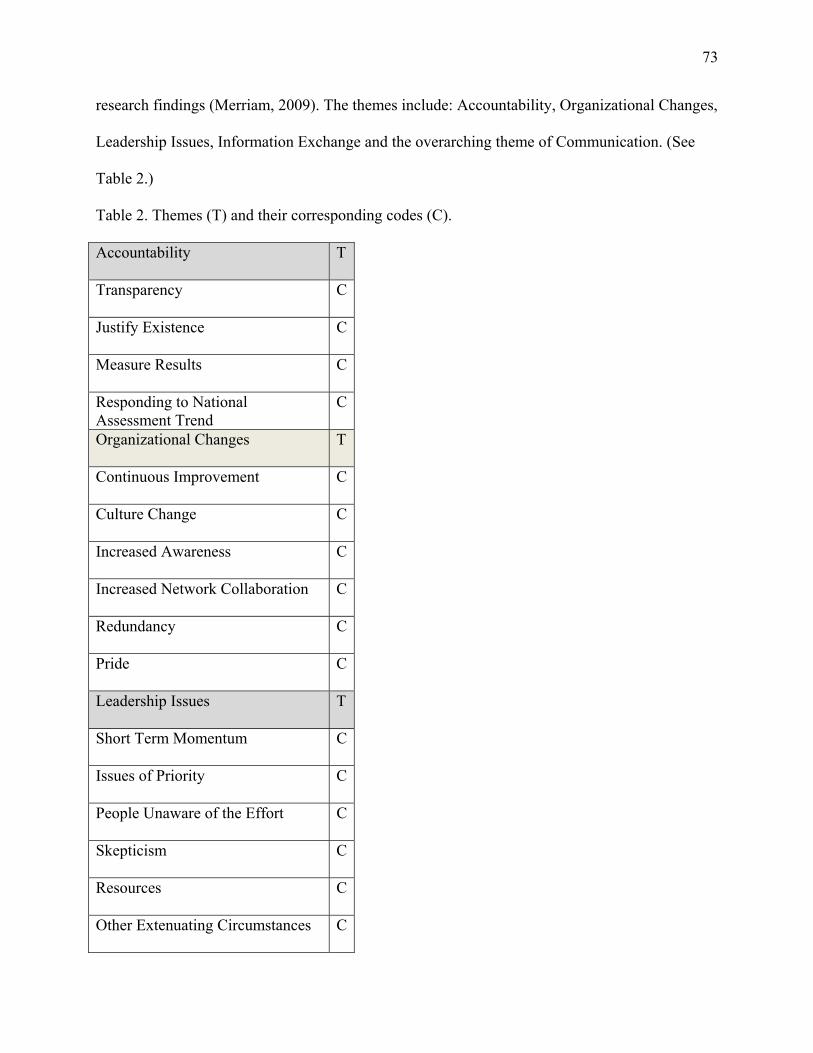
73
research findings (Merriam, 2009). The themes include: Accountability, Organizational Changes,
Leadership Issues, Information Exchange and the overarching theme of Communication. (See
Table 2.)
Table 2. Themes (T) and their corresponding codes (C).
Accountability T
Transparency C
Justify Existence C
Measure Results C
Responding to National Assessment Trend
C
Organizational Changes T
Continuous Improvement C
Culture Change C
Increased Awareness C
Increased Network Collaboration C
Redundancy C
Pride C
Leadership Issues T
Short Term Momentum C
Issues of Priority C
People Unaware of the Effort C
Skepticism C
Resources C
Other Extenuating Circumstances C
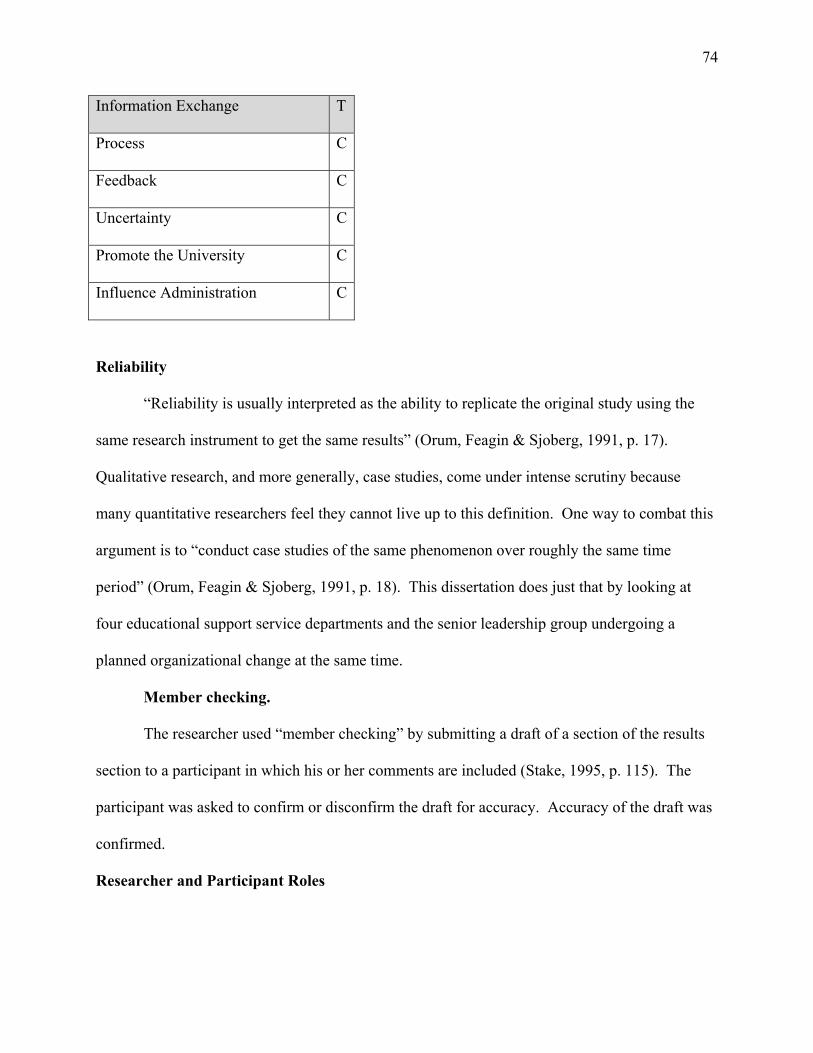
74
Information Exchange T
Process C
Feedback C
Uncertainty C
Promote the University C
Influence Administration C
Reliability
“Reliability is usually interpreted as the ability to replicate the original study using the
same research instrument to get the same results” (Orum, Feagin & Sjoberg, 1991, p. 17).
Qualitative research, and more generally, case studies, come under intense scrutiny because
many quantitative researchers feel they cannot live up to this definition. One way to combat this
argument is to “conduct case studies of the same phenomenon over roughly the same time
period” (Orum, Feagin & Sjoberg, 1991, p. 18). This dissertation does just that by looking at
four educational support service departments and the senior leadership group undergoing a
planned organizational change at the same time.
Member checking.
The researcher used “member checking” by submitting a draft of a section of the results
section to a participant in which his or her comments are included (Stake, 1995, p. 115). The
participant was asked to confirm or disconfirm the draft for accuracy. Accuracy of the draft was
confirmed.
Researcher and Participant Roles
75
The role of the researcher in this multiple case study analysis was twofold. As an
“evaluator” the researcher described each educational support service departments and the senior
leadership group’s perceptions of the planned change effort (Stake, 1995, p. 96). In another,
more prominent way, the researcher acted as an “interpreter” to identify perceptions about the
planned organizational effort from the interviews of the three organizational levels of employees
in the institution (Stake, 1995, p. 27).
Since the case study analysis involved so much interaction between the researcher and
participants whether during interviews or requests for documents, there was much to be taken
into consideration in terms of credibility of the researcher. Knowing this, the researcher took
extra care to clearly spell out her role with the participants by approaching the participants from
the standpoint of needing to learn about the planned organizational change initiative process
(Stake, 1995). No participation, assistance, or advice was offered to the participants by the
researcher (Stake, 1995). The goal of the researcher was to be able to tell the story of each
educational support service departments and the senior leadership group in a way that
contributed to the study of large-scale, planned organizational change.
While the goal of the in-depth interviews was to gain truthful insights, there was a chance
that some participants were less vocal or censored what they said, and in other instances there
was a chance that participants may have embellished what they said because the researcher was
present. This is a limitation of the study and will be included as such in Chapter six.
76
CHAPTER 4
Results and Interpretations
Themes: Accountability and Organizational Changes
This research examined the introduction, implementation and communication processes
related to a specific performance measurement system, the “Dashboard,” as the planned
organizational change effort as perceived by seven senior leaders, 10 department directors and 15
department staff of a large, Northeastern University through a grounded theory approach
(Charmaz, 2006; Glaser & Strauss, 1967). The results and interpretations in this and the
following two chapters are based on perceptions garnered from in-depth interviews with these
participants.
Development of Codes and Themes
Through a grounded theory, constant comparative method (Charmaz, 2006; Glazer &
Strauss, 1967) a set of 21 codes emerged from the data (See Appendix D). Upon further analysis
of these codes the researcher discovered four consistent main ideas or themes: accountability,
organizational changes, leadership issues and information exchange. Additional analysis
revealed relationships between the themes as well as an overall concept of communication
(Charmaz, 2006). This and the next chapter include a description and interpretation of the codes
and corresponding themes and their relationships that emerged from the data collected in this
study. Chapter Six includes a description and interpretation of the concept and its implications
for theory and practice.
Themes Accountability and Organizational Changes
Two of the themes that emerged from the codes in the study were accountability and
organizational changes (See Table 2). This section describes and interprets each of the codes and
77
their corresponding emergent themes. Codes are presented for each theme with most frequent
codes appearing first.
Accountability: Introduction11
Interpretations of the data sorted into the theme accountability describe how members
provide evidence to internal and external constituents about the impact of higher education
(Zumeta, 2011). Participants perceived that the Dashboard effort provided them with the means
to have accountability in four different areas: (a) transparency, (b) justify existence, (c) measure
results and (d) responding to national assessment trend. (See Table 3.)
The code transparency emerged from the data where participants referred to ways to
show “clear and accessible information about crucial aspects” of their department, the division or
the University for their various constituents (U.S. Department of Education, 2006). In particular,
participants were focused on providing access to their various constituents about University
programs and services, and showing how their department adds value and is meaningful to their
constituents. In addition, participants pointed out the importance of the Dashboard effort to help
increase their visibility by providing them with an outlet to tell their story to their constituents
about the impact of their programs and services. These observations show that participants are
concerned with being accountable to their constituents by making their program and service
information publicly available.
Participants remarked about ways the Dashboard effort validated the existence of their
job, the department, the division or the University as reflected in the code justify existence. In
doing so, participants discussed ways the Dashboard effort provided evidence to internal and
external constituents that the programs at this University do have a positive impact on students
11 Accountability was the third-most discussed theme with 270 of 1144 total comments from this dissertation addressing this issue.
78
and resources are being used wisely to support these successful programs. These remarks show
the responsibility participants have to report to constituents that they are effectively using
resources to achieve their goals and that they are accountable for their actions.
The code measure results emerged from the data where participants referred to ways to
“provide evidence about the impact” of their department, the division or the University to their
various constituents (Zumeta, 2011). Many interview participants discussed ways the Dashboard
effort helped them to evaluate whether or not their programs were valuable to their constituents.
In doing so, members provided evidence to constituents to help them understand department
goals and whether or not they successfully completed their goals. Participants also pointed out
the difference between using the Dashboard effort as a way to evaluate departmental goals versus
evaluation methods and anecdotes used previous to the effort. In addition, participants discussed
the importance of the Dashboard effort to provide a system of checks and balances to determine
whether or not their performance is clear and coordinated to meet goals. These remarks show
participants focus on determining whether or not their department, the division or the University
was successful by measuring the results of their work. In addition, these discussions link to their
desire to be accountable to their constituents.
The code responding to national assessment trend emerged from the data where
participants referred to ways to respond to requests from the public for increased accountability
and improvement from Universities (U. S. Department of Education, 2006; Zumeta, 2011).
Many interview participants discussed ways the Dashboard effort helped to satisfy national calls
for the transformation of accreditation processes and increased focus on student learning and
performance of universities (U. S. Department of Education, 2006). In addition, participants
discussed ways the Dashboard effort could help them with upcoming regional reaccreditation
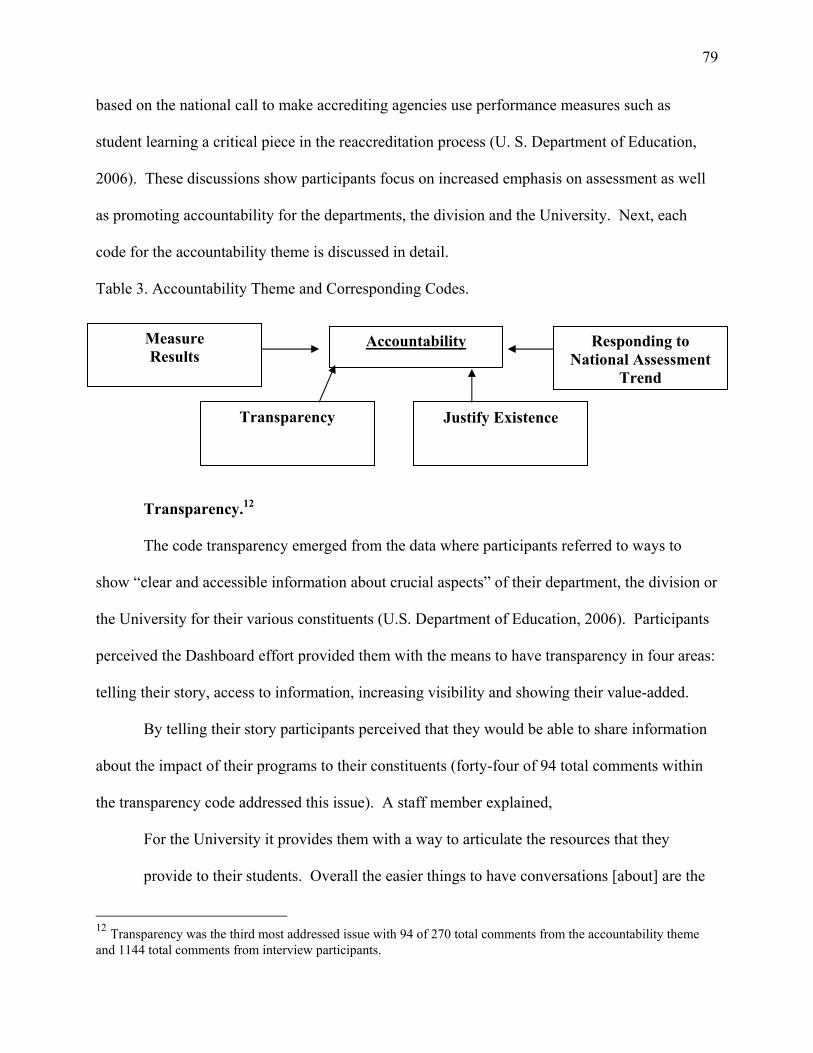
79
based on the national call to make accrediting agencies use performance measures such as
student learning a critical piece in the reaccreditation process (U. S. Department of Education,
2006). These discussions show participants focus on increased emphasis on assessment as well
as promoting accountability for the departments, the division and the University. Next, each
code for the accountability theme is discussed in detail.
Table 3. Accountability Theme and Corresponding Codes.
Transparency.12
The code transparency emerged from the data where participants referred to ways to
show “clear and accessible information about crucial aspects” of their department, the division or
the University for their various constituents (U.S. Department of Education, 2006). Participants
perceived the Dashboard effort provided them with the means to have transparency in four areas:
telling their story, access to information, increasing visibility and showing their value-added.
By telling their story participants perceived that they would be able to share information
about the impact of their programs to their constituents (forty-four of 94 total comments within
the transparency code addressed this issue). A staff member explained,
For the University it provides them with a way to articulate the resources that they
provide to their students. Overall the easier things to have conversations [about] are the
12 Transparency was the third most addressed issue with 94 of 270 total comments from the accountability theme and 1144 total comments from interview participants.
Accountability Measure Results
Justify Existence
Responding to National Assessment
Trend
Transparency
80
majors, sports and things that are quantifiable…[The Dashboard] lets the University have
a conversation about what other areas they are touching upon and how it stands and how
much it really goes to the holistic student and ensure they go through [the] University
with a clear understanding of themselves, their resources and can make the best of
their…University education. (Participant 22, 2011)
Similarly, a member of the senior leadership group clarified how telling their story can
keep their programs viable. The senior leader rationalized,
You can’t have the conversation with the taxpayers and the community about some of the
things I talked about, but you can deliver to the constituents and the community and the
taxpayers and the other faculty and staff about what it is that we do. And this is a great
way to explain what the program is about and what it does and what the division does in
the University, and also how we’re measured. (Participant 21, 2011)
Similarly, a senior leader explained,
I think it’s important and worthwhile because we tend to get very caught up in the
implementation of initiatives and in the work that we do every day and I think for an
organization that’s undergone huge transformational change which is what this effort
represented it’s important to be able to step back and say ‘here’s what we did, here’s why
we did it, here’s how we can demonstrate that it works.’ And it’s a way to tell our story to
people either inside or outside the university so that they can understand why we did
what we did. It becomes important for the internal stakeholders. It becomes important for
the public. It becomes important for students. So I think it’s a good way to demonstrate to
people that when you come through change you really need to step back and understand
that everything you went through in getting there was worthwhile because you do have
81
results. And we don’t often think about those results we just keep going (Participant 32,
2011).
In addition to addressing the need for being able to better tell the story of their
department, some participants focused on the ability of the Dashboard effort to provide
accessibility of information to internal and external constituents (twenty-seven of 94 total
comments within the transparency code addressed this issue). Participant comments centered on
the Dashboard indicators as being clear, concise and comprehensive as well as easy-to-read for
laypeople. A director stated the Dashboard indicators are, “To provide a clear and
comprehensive measure of performance which would be available to the public" (Participant 2,
2011). A staff member commented that, “The Dashboard made a way for everyone to present
their information clearly and so we can all see what was going on. It allowed you to see what
every program was doing and what their goals were and what they’ve achieved” (Participant 22,
2011). Similarly, a senior leader explained that the Dashboard “was a good way of making data
easily digestible for a non-specialist audience” (Participant 28, 2011).
Some of the departments in this study were already collecting data for external
organizations and they commented that the Dashboard effort provided them a way to make this
information accessible to people within the University. A director affirmed, “This helped all of
us to articulate certain things to the University in a better way and I think that if nothing else
that’s what makes it helpful” (Participant 21, 2011).
In addition to addressing the need for telling their story and accessibility, participants also
focused on using the transparency of the Dashboard effort to increase the visibility of their
department to their various constituents (sixteen of 94 total comments within the transparency
code addressed this issue). Some participants focused on the benefit of showing others within
82
the University the successes of their department. A staff member declared, “We can say ‘Wow,
look at us!’ They had no idea we are doing great things. It benefits our program a lot”
(Participant 17, 2011).
Other participants focused on the benefit to their department of gaining visibility to the
university administration through the Dashboard effort. A director stated, “One of the downfalls
of [this University] is that they have never had a strong discussion about what [this department]
means to the institution and I guess it was my hope that the Dashboard would be one more push
towards that discussion” (Participant 24, 2011). Similarly, other members focused on the
increase in visibility to the Vice President of their division. A senior leadership member
commented,
It was a boost. In part because they were first being asked to do this [the Dashboard] and
in some ways for two of four of them that were already collecting data and now
demonstrating publicly that we’ve been doing this all along. It’s just a new venue in
which to share the information and perhaps a new venue that hasn’t really looked at them
before. So for [two of the departments] to be on [the VP’s] radar – that’s great and they
took that seriously. For morale this was very, very nice because they had the attention of
the VP. (Participant 26, 2011)
In addition to addressing the need for telling their story, accessibility and visibility,
participants also focused on using the Dashboard effort to discuss the importance of transparency
to show various constituents the value-added of their department (seven of 94 total comments
within the transparency code addressed this issue). Most participants focused on the value their
department adds to the University experience. A staff member indicated, “People question if it’s
83
worth sending a child to four years of higher education. This shows it’s meaningful to students,
to parents and the legislature” (Participant 4, 2011). A senior leader explained,
To share the information with people. There are a lot of stakeholders here. Some of
them are faculty. Some of them are the leadership of the University. But some are just
the students and their families. I thought this was a way to make this value added clear to
them. (Participant 29, 2011).
Justify Existence.13
The code justify existence emerged from the data where participants referred to using
evidence to show internal and external constituents that their programs and services do have a
positive impact on students and resources are used wisely to support these successful programs.
Half of these participants focused on evidence for internal constituents (forty of 80 total
comments within the justify existence theme addressed this issue). Some found value in the
Dashboard effort to justify individual’s presence. A director commented, “Higher education
institutions must be held accountable for what they’re delivering given the rising costs of
education. It’s about making sure that people are doing what they are supposed to be doing and
that they are effective” (Participant 1, 2011). Similarly, another director noted, “I think it
validated in some ways the work that we do” (Participant 2, 2011). This director observed, “I
think that it helps kind of justify people’s existences in some ways. It’s kind of being put under
the microscope” (Participant 1, 2011).
Other participants commented on the ability of the Dashboard to justify to internal
constituents why their department is important. A staff member stated,
13 Justify Existence was the fourth most addressed issue with 80 of 270 total comments from the accountability theme and 1144 total comments from interview participants.
84
I think it’s very important for us to assess how well we’re doing what we want to do, and
to see if we’re having the kind of impact we need to have. Holds us accountable, I think
that’s important. Then it demonstrates to upper level management our accomplishments
and the contribution we make in the University. (Participant 6, 2011)
A director discussed the importance of justifying their department as a way to become
noticed and compete with other programs for resources. The director explained,
It’s helpful because we [in our department] need [the University] to understand why
we’re here, because we’re competing with so many other units, there’s so much
bureaucracy, they need to understand what we do, and that was very helpful in doing that,
because of the explanations given, and because Undergraduate Ed is new and it talks
about the programs and I think that follows up with Undergraduate Ed. I think it really
helps us say look - look at the quality of the programs we offer and look at what they are
already doing. So I think that 100% - we all were on board – this is great. (Participant 21,
2011)
Some members described the Dashboard effort as a way to justify the creation and
existence of the Division of Undergraduate Education. A member of the senior leadership group
explained,
The overall Dashboard indicator with bits and pieces of each of these would justify the
reorganization of the division and the existence of this division…these decisions to
reinforce this aspect. We don’t have an undergraduate education division and we should.
It could justify why they did it. Now that would be in an ideal world. (Participant 26,
2011)
85
Also concerned with justifying existence, other participants focused on the need to
defend the value of the University to external constituents (forty of 80 total comments within the
justify existence theme addressed this issue). Some, such as this senior leader focused on
purposes of reaccreditation, ties to funding sources and broader public interests,
The University is increasingly, like all universities, called upon to document the
effectiveness of what they’re doing. The efficiency, the fact that money is being well
spent and so on. And, those requests are coming from accrediting associations, they’re
coming from boards, they’re coming from parents, they’re coming from the state. And
there’s really no alternative for something like the Dashboard. You know, Dashboards
and Scorecards are metrics that – there’s not really any choice. Every institution’s having
to do this and this is a head start. (Participant 31, 2011)
Similarly, a member of the senior leadership team rationalized, “The point is with a great
research university – the public’s not going to support it if they don’t have a sense of what it is”
(Participant 30, 2011). A director explained, “People obviously are concerned and saying is this
a good way to spend money” (Participant 16, 2011)? Another participant questioned, “To the
outside world, how do we stand up” (Participant 12, 2011)? Another staff member explained
further,
Again, it’s holding them accountable. It’s good to have that kind of information to look
at the programs and services they offer and be accountable for the results and be able to
report that to outside parties. And to show that they’re using their funding appropriately.
It really contributes to the whole area of accountability. (Participant 6, 2011)
Measure Results.14
14 Measure results was the sixth most addressed issue with 68 of 270 total comments from the accountability theme and 1144 total comments from interview participants.
86
The code measure results emerged from the data where participants referred to instances
where members can provide “evidence about the impact of” the department, the division or the
University to a variety of constituents (Zumeta, 2011). Many participants interviewed discussed
the importance of the Dashboard effort on evaluation of work (thirty of 68 total comments within
the measure outcomes code addressed this issue). Within this group members provided evidence
to constituents so that they can understand department goals and whether or not they are
successfully being met. A senior leader remarked critically about the effort, “It’s been a little
less successful in suggesting how Dashboard indicators are actually measuring the outcomes and
their impact” (Participant, 30, 2011). A director stated, “I wanted a Dashboard to create better
measurements for us to use internally to gauge our effectiveness so I like that it was going to
create standards and quality control for the work that we do” (Participant 1, 2011). A staff
member recalled some questions their department members deliberated during the Dashboard
effort such as this one; “What criteria are we using for the Dashboard in order to get a sense of
our actual impact on them? It’s very difficult to measure that because [the students] are impacted
by so many things” (Participant 8, 2011).
The Dashboard effort was perceived as important to many because its presence signified
an increased focus on the clarification of and evaluation and measurement of departmental
results (twenty of 68 total comments within the measure outcomes code addressed this issue). A
staff member noted, “I think they gleaned a clearer and better understanding of what we do and
how we can measure what we do and why it’s important - why we do that so they’ll know if
we’re being successful and meeting our goals” (Participant 10, 2011). A director explained,
“Having a body of material comprising the Dashboard that is truly reflective of a unit’s work”
(Participant 2, 2011). A senior leader noted, “Making [individuals] think about their goals, their
87
departments, what they were doing, who they were serving, and then having a way of seeing how
well you did those things” (Participant 27, 2011).
Several participants pointed out that many departments were never asked nor had
attempted to evaluate their work prior to the Dashboard. Other participants were concerned with
the level of pre-Dashboard evaluation strategies, claiming there either was none, what was there
was hearsay, or what was there was ineffective (eighteen of 68 total comments within the
measure outcomes code addressed this issue). A director declared, “Typically our decisions are
based on anecdotal information or subjective ways of thinking about things” (Participant 13,
2011). A senior leader stated, “For some of the units that [the Vice President] was reporting on
there were some numbers that would relate to performance but in a lot of cases there were just
stories…people were looking for more specifics about their effectiveness” (Participant 31, 2011).
Another senior leader explained, “A lot of times we base our sense of value on just some
assumptions and I thought we really did need to become much more intentional about identifying
performance outcomes in our students” (Participant 29, 2011). A staff member indicated, “We
probably did it in a similar way, we just didn’t really have as much scientific data to base our
decisions off of. We would still review things that we did – workshops, programs and services –
but it was more just our own opinions” (Participant 6, 2011).
Responding to National Assessment Trend.15
The code responding to national assessment trend emerged from the data where
participants referred to ways to respond to requests from the public for increased accountability
and improvement from Universities (U. S. Department of Education, 2006; Zumeta, 2011).
Several participants discussed ways the Dashboard effort could help them with upcoming
15 National assessment trend was tied for the 15th most addressed issue with 28 of 270 total comments from the accountability theme and 1144 total comments from interview participants.
88
regional reaccreditation based on the national call to make accrediting agencies use performance
measures such as student learning a critical piece in the process (U. S. Department of Education,
2006). These discussions show participants focus on increased emphasis on assessment as well
as promoting accountability for the departments, the division and the University (17 of 28 total
comments within the responding to national assessment trend code addressed this issue).
Participants addressed the importance of the Dashboard to assist with the upcoming regional
reaccreditation process. A member of the senior leadership group explained,
There was a Dashboard binder that was developed for our [regional reaccreditation]
evaluation. This is my sense that, certainly after our last [regional] reaccreditation
process, there were many tough questions asked about assessment. And the university
pledged from the highest levels to develop a culture of assessment within the university.
And so from vice president's office came this call to engage in this. (Participant 29, 2011)
In addition, interviews participants discussed ways the Dashboard effort helped to satisfy
national calls for the transformation of accreditation processes and increased focus on student
learning and performance of Universities (U. S. Department of Education, 2006) (eleven of 28
total comments within the responding to national assessment trend code addressed this issue). A
compelling example of a response to the national call for assessment is reflected by this
participant from the senior leadership group,
I think everyone in a University administration position in 2011 understands the
importance of assessment and understand that we have to communicate what we do to
non-specialists including state legislatures, and that we had better communicate what we
do ourselves and come up with our own assessment mechanism because if we don’t, the
89
assessment will be imposed upon us from outside the university and most university
administrators do not want it to get that far. (Participant 28, 2011)
Another senior leader pointed out the benefit of the Dashboard effort toward answering
the national calls for assessment,
I think by putting that first set of Dashboards on the web and making them very visible
and talking about them being out there it helped [this University] be part of that whole
debate about who’s measuring what’s going on in Higher Ed because it was very
proactive for them to go out and say ‘we’d like to show you what we’re doing.’ So even
though it was a small number of units I think it gave [this University] an edge in a lot of
ways in that discussion about whether people are measuring the right things in Higher
Education. We measure a lot of things but are we measuring the right things? (Participant
32, 2011)
A participant from the senior leadership group explained how the Dashboard effort was a
means to both respond to calls as well as to assist with regional accreditation,
Why was assessment on the agenda? It was a national item already when that report was
done in 2004-5 – transformation of undergraduate education report. But so that’s number
one. They are not necessarily in one or two order. But anyhow the other thing was that at
the same time about five years ago the task force report was done first about six to seven
years ago. The University was going through one of its – every 10 years there’s a
university reaccreditation visit from the [regional accrediting organization]. And one of
their mantras from Washington obviously was does the school know how to assess what
it’s doing? Is there an assessment program in place? Whether it be in departments,
classes, any offices. So we in undergraduate education…We saw the fact that this was
90
essentially a new office even though it had units that had been here awhile – as an
opportunity from day one to develop measures of assessment. So that it was built into the
office, built into each program, ongoing, updatable. And that’s very important. So
between the task force report and the reaccreditation program assessment has become a
major thing at [this University]. Undergrad education was given new support, new
emphasis by the President. It started [with the Spellings Report]. (Participant 30, 2011)
As explained previously, the theme accountability centers on four important segments:
transparency, justify existence, measuring results and responding to national assessment trend.
Overall, participants responding to the theme of accountability focused on efforts of their
department to provide and use evidence to show internal and external constituents that the
programs and services at this University do have a positive impact on students and the funding is
used wisely to support these successful programs. In addition, participants also focused on being
able to use “clear and accessible information about crucial aspects” of this University so that
their internal and external constituents could have access to and understand the value-added of
the University-wide experience (U. S. Department of Education, 2006). Finally, participants
were focused on the ability of members of the University to provide measures for regional
accreditation as well as being a part of the trend to respond to national calls for greater
assessment and accountability. The next section focuses on the theme of organizational changes.
Organizational Changes: Introduction16
Interpretations of the data sorted into the theme organizational changes describe how
members perceive a result or consequence of the Dashboard effort (Outcome, n.d.). Participants
perceived that the Dashboard effort had the potential to provide them with the following
16 Organizational Changes was the second-most discussed theme with 309 of 1144 total comments from this dissertation addressing this issue.
91
organizational changes: (a) continuous improvement, (b) culture change, (c) increased
awareness, (d) increased network collaboration, (e) redundancy and (f) pride. (See Table 3.)
The code continuous improvement emerged from the data where participants referred to
ways the Dashboard effort led to, or failed to lead to, “evaluation and achievement through the
analysis of work output” and using this evaluation to determine how to constantly advance work
output (Vakkuri & Meklin, 2003). During interviews participants discussed ways the Dashboard
effort helped to identify and improve productivity and/or performance. In addition, participants
discussed ways the Dashboard effort clarified departmental mission and goals. Finally,
participants discussed the clarity the Dashboard effort brought to individuals in terms of the
personal fit within the organization which contributed to these individuals wanting to improve
their productivity. These discussions show participants focus on improving their current work
and contribute to the theme of organizational changes as a result of the Dashboard effort.
The code culture change emerged from the data where participants referred to ways the
Dashboard effort could have made “alterations to employee values, behaviors and assumptions
that should lead to increased organizational performance” (Ogbonna & Wilkinson, 2003, p.
1152). During interviews many participants discussed their perceptions that the Dashboard
effort did not have an impact on employee values, behaviors and assumptions. Many other
participants perceived that the Dashboard effort did have a small impact on employee values,
behaviors and assumptions. These participants cited some of the changes made within their
department as a result of the Dashboard effort. Other participants discussed that there was no
impact on employee values, behaviors and assumptions associated with the Dashboard effort.
These participants perceived that members used the same information before and after the
Dashboard effort, but in a different manner. Finally, a few participants are not sure whether
92
“alterations to employee values, behaviors and assumptions” have occurred because it’s possible
that the program has not been in existence long enough to tell (Ogbonna & Wilkinson, 2003, p.
1152). These discussions show participants perceptions about the lack of a specific
organizational change, culture change, as a result of the Dashboard effort.
The code increased awareness emerged from the data where participants referred to ways
the Dashboard provided greater knowledge than they previously had about assessment
(Awareness, n.d.; Increased, n. d.). Throughout interviews participants discussed ways the
Dashboard effort helped members to have greater knowledge about how assessment fits into
their daily jobs, to have greater knowledge about assessment in general and to provide members
with an increased comfort level with assessment. These discussions show participants focus on
increased awareness as an organizational change resulting from the Dashboard effort.
The code increased network collaboration emerged from the data where participants
referred to ways the Dashboard effort resulted in “linking different groups of” employees to gain
improved understanding, engagement and goal setting (Vakkuri & Meklin, 2003, p. 752).
During interviews participants discussed ways the Dashboard effort helped them to come
together with others in the University for meaningful discussions and collaborations about
departmental objectives and priorities. In addition, participants discussed the importance of the
Dashboard effort to help members of the University to collaborate with a shared objective in
mind. Finally, participants discussed ways the Dashboard effort helped them to meet and learn
about others within the University which in turn allowed them to collaborate across departments
and disciplines within the University. These discussions show the organizational change as a
result of the Dashboard effort where participants focus on collaborating with others in the
University to continuously improve the services and programs they offer to their constituents.
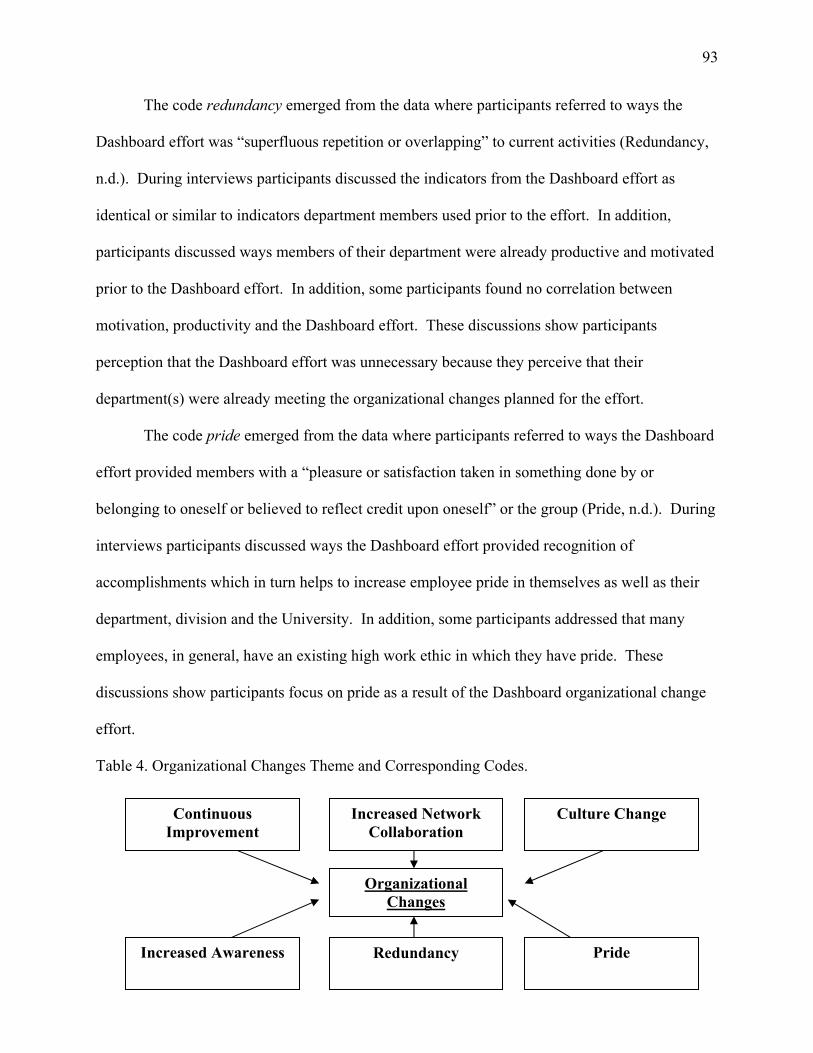
93
The code redundancy emerged from the data where participants referred to ways the
Dashboard effort was “superfluous repetition or overlapping” to current activities (Redundancy,
n.d.). During interviews participants discussed the indicators from the Dashboard effort as
identical or similar to indicators department members used prior to the effort. In addition,
participants discussed ways members of their department were already productive and motivated
prior to the Dashboard effort. In addition, some participants found no correlation between
motivation, productivity and the Dashboard effort. These discussions show participants
perception that the Dashboard effort was unnecessary because they perceive that their
department(s) were already meeting the organizational changes planned for the effort.
The code pride emerged from the data where participants referred to ways the Dashboard
effort provided members with a “pleasure or satisfaction taken in something done by or
belonging to oneself or believed to reflect credit upon oneself” or the group (Pride, n.d.). During
interviews participants discussed ways the Dashboard effort provided recognition of
accomplishments which in turn helps to increase employee pride in themselves as well as their
department, division and the University. In addition, some participants addressed that many
employees, in general, have an existing high work ethic in which they have pride. These
discussions show participants focus on pride as a result of the Dashboard organizational change
effort.
Table 4. Organizational Changes Theme and Corresponding Codes.
Organizational Changes
Increased Awareness
Redundancy Pride
Culture Change
Increased Network Collaboration
Continuous Improvement
94
Continuous improvement.17
The code continuous improvement emerged from the data where participants referred to
ways the Dashboard effort led to, or failed to lead to, “evaluation and achievement through the
analysis of work output” and using this evaluation to determine how to constantly advance work
output (Vakkuri & Meklin, 2003). A majority of participants interviewed perceived that the
Dashboard effort provided a means for them to identify and improve productivity and/or
performance (seventy-three of 123 total comments within the continuous improvement code
addressed this issue). An example of the perception of the way the Dashboard provides value to
their department is by identifying areas of improvement. A director explained, “We were
interested in finding out whether or not what we do and how we did it affected graduation rates.
We made some changes to our summer program as a result” (Participant 15, 2011). This staff
member provided a compelling example of the potential value of the Dashboard effort by stating,
I think it’s a positive contribution that it makes. It’s a chore, it’s another project, but
ultimately the information that you get can help you to plan future programs, services,
can help you to report to other departments, upper level management, outside people…It
helps you to become better organized with what you’re offering. You review what you
offered. You get to take a better look at the results. I think it helps for planning more
organized, moving forward more efficiently. (Participant 6, 2011)
Fewer participants saw only a minimal impact on the departments as a result of the
Dashboard effort. A staff member noted, “You know, little… we made a couple of adjustments
to try to measure” (Participant 10, 2011). Another staff member stated they felt the Dashboard
17 Continuous improvement was the second most addressed issue with 123 of 309 total comments from the organizational changes theme and 1144 total comments from interview participants overall.
95
effort had minimal impact, however went on to list the ways in which there was value. The staff
member remarked,
I would say it had a minimal effect. One of the things we looked at after the Dashboard
was how we evaluate our workshops…now we send out [surveys] after the fact and the
results are more meaningful. Our staff is not carrying papers during workshops. Not a
major change in overall work. We did also try to write more directed questions. We did
try to hit them with specific things. We tried to be more specific in terms of learning
objectives. We found it good in terms of the electronic survey because of a decrease in
paper and the tools such as Survey Monkey which makes running stats easier. However
it’s more challenging in terms of getting the number of participants to fill it out. Our
response rate is too low. (Participant 4, 2011)
Two participants perceived that the Dashboard effort did not help their department to
improve. A director declared, “The Dashboard as is – not working. It doesn’t help us improve.”
(Participant 1, 2011)
In addition to identifying and improving productivity and performance participants
addressed the importance of the Dashboard to clarify departmental mission and goals (forty-one
of 123 total comments within the continuous improvement code addressed this issue). A senior
leader positively stated,
I think one value is being clear on mission of the unit and its aspirations. I think it had a
very major effect from what I can see at least for the senior and some of the leaders of
departments. And I guess it would have had an effect even on people who don’t know it
had an effect on. You might ask if they know about measures or the Dashboard and they
might say ‘I don’t.’ But my guess is that if you asked them what’s our unit doing, what’s
96
our core mission, our core purpose, a lot of them would be clearer now even though they
don’t have any idea why that is. Because I would guess that as leaders got clearer on the
mission and so on they conveyed that to others. And they might not even know what
caused that. (Participant 31, 2011)
Many participants perceived that the Dashboard effort provided them with the permission
to “stop the boat” and “look at the bigger picture” – their departmental goals (Participant 11,
2011; Participant 15, 2011). A senior leader offers this compelling example of the impact of
clearly defined goals, “It helps you to turn away from certain things that are just not being
effective and then turn toward areas that are effective” (Participant 29, 2011).
In addition to the continuous organizational changes identifying and improving
productivity and performance and clarification of mission and goals participants addressed the
importance of the Dashboard effort to clarify personal and organizational fit (nine of 123 total
comments within the continuous improvement code addressed this issue). A staff member
perceived that seeing the Dashboard results provides clarity of their fit to the organization. The
staff member observed,
By seeing these measurements and realizing you’ve been part of this success helps you
understand where you fit into this and how valuable you are and creating value for the
organization. You see the success of the organization as a whole. (Participant 22, 2011)
This senior leader’s comments exemplify personal, professional and organizational
development and fit,
I think that it’s professional development for all of them to understand that this is a kind
of a best practice out there. There are other organizations that are very conversant. It’s
very hard to find someone in another sector that doesn’t know about Dashboards or
97
Scorecards and have an opinion for better or for worse so you know. So professional
development in terms of knowing what’s going on in the world of organizations. There is
also organizational development for them in the sense of moving their own organization
along and helping them advance and probably there’s some personal development in that
it’s a little different way of thinking – a little more precise way of thinking that can be
applied to other things. Can be applied to one’s own life. You know, I know a person
who uses a Scorecard, Dashboard, whatever every six months to sort of reevaluate using
his Dashboard and he takes a reading and sees if the right gauges are there and how he is
progressing in his personal life, you know, finances, health, all these things, family.
(Participant 31, 2011)
The Dashboard effort was described by a member as contributing toward clarity for
individuals seeking to find their place within the organization. The senior leader commented,
I think the value for individuals was that it helped them clarify where they fit in mission
of their department. That by looking at and kind of firming up the mission and the goals
of the organization they were able to understand what their part was and what they were
working toward and its not to say they didn’t understand the mission before but I think it
gave them some additional clarity to the discussions. And in some cases like [one person]
it really gave them a chance to show what they could do and to really contribute in a very
tangible way to what was going on through this process. (Participant 32, 2011)
Culture change.18
The code culture change emerged from the data where participants referred to ways the
Dashboard effort could have made “alterations to employee values, behaviors and assumptions
18 Culture change was the 9th most addressed issue with 53 of 309 total comments from the organizational changes theme and 1144 total comments from interview participants overall.
98
that should lead to increased organizational performance” (Ogbonna & Wilkinson, 2003, p.
1152). During interviews many participants discussed their perceptions that the Dashboard
effort did not have an impact on employee values, behaviors and assumptions (twenty-two of 53
total comments within the culture change code addressed this issue). For the most part, members
expected the Dashboard effort to become a new part of their culture and were disappointed and
let down that it didn’t happen. Participants felt as if they had wasted their time, which is a
precious resource to them. An example reflecting this expectation is from this staff member who
commented, “I’m not sure as of yet that it’s had an impact on what we do. I don’t think it’s
really changed the way we work or the way we think” (Participant 9, 2011).
Some participants perceived that the Dashboard effort did not succeed in directing their
everyday work. A director revealed, “To be honest with you, we don’t use that. We pretty much
went back to what we had been doing. It wasn’t something we needed to continue to be
effective” (Participant 13, 2011). Another director explained, “Success would be getting the
program off and running and being operational to the extent that at the end of every semester or
at the end of every year everybody is reporting this information somewhere. That’s not
happening” (Participant 13, 2011).
Some participants perceived that the Dashboard effort should direct their everyday work.
Another director commented, “It would be something that guides our work on a day-to-day basis,
and I don’t think it does at all” (Participant 3, 2011).
Fewer participants put a positive spin on the lack of integration of the Dashboard into
their culture. A staff member revealed, “I do not [think the Dashboard was integrated into our
culture]. And I don’t necessarily think that that’s a negative thing. I think from a department
99
standpoint our work habits are the same as they’ve been prior to any Dashboard initiative”
(Participant 7, 2011).
Many other participants perceived that the Dashboard effort did have a small impact on
employee values, behaviors and assumptions (twenty of 53 total comments within the culture
change code addressed this issue). Several participants cited some of the changes made within
their department as a result of the Dashboard effort. A staff member noted,
So going back to some of the things I’ve mentioned that relates such as evaluation forms,
student appointments, [and other events]. Yeah I think it did have an effect - a positive
effect on the work habits…but I didn’t really see an across the board spike in work habits
where people were really digging in deeper or because of Dashboard wanting to get to
work early or anything. (Participant 10, 2011)
One participant commented on the impact of the existing culture on their department.
The director explained, “You become a slave to what you’re accustomed to. We have state
regulations and we know what they are. You naturally migrate back to your natural shape, color,
etc” (Participant 13, 2011).
Other participants perceived that the Dashboard effort merely reported their existing data
in a different manner than what they were doing already. A director exclaimed, “If you’re going
to ask them the same question, change the name of the program at the top and say did you learn
anything before and after – well, okay, but to me that’s not good enough” (Participant 1, 2011).
A director explained,
The things that we were doing, we were putting in more formal – we were formalizing it
and documenting it but we weren’t changing what we really were doing. It’s not like we
went in and we did this program and we did it one way and completely changed how we
100
did it to address certain learning outcomes. We’re doing the same thing. We’re just taking
back information that we didn’t collect it in that way before. (Participant 1, 2011).
A few participants agreed that the Dashboard effort provided a culture change (seven of
53 total comments within the culture change code addressed this issue). A majority of
participants who perceived there was a culture change addressed the importance of the
Dashboard effort to increase individual engagement. A senior leader noted,
That is has a profound effect on the actual people who work in the areas ‘cause they’re
the people who are deciding what to measure and actually taking the temperature of their
programs. I think it increases their engagement. I think they’re invested in it. (Participant
29, 2011)
Likewise a senior leader stated, “I think for a lot of units it heightened engagement -
another value. Engagement around looking at mission and looking at what they should be
measuring and how they should be judged” (Participant 31). Similarly, a staff member stated,
“Once the initiative was put forth, everyone became much more aware, much more dedicated to
it” (Participant 6, 2011).
A few participants are not sure whether “alterations to employee values, behaviors and
assumptions” have occurred because it’s possible that the program has not been in existence long
enough to make that decision (Ogbonna & Wilkinson, 2003, p. 1152) (four of 52 total comments
within the culture change code addressed this issue). A senior leader remarked,
What I would want to know is if as the Dashboards are done, have people been doing
more or doing things differently? Or maybe it’s too soon to answer. Some units have the
Dashboard and others are just getting them. And I think that’s actually the key piece now.
I think as people start seeing what’s measured I’m sure it has had some impact on
101
productivity. In any systematic way it’s probably premature to know. (Participant 31,
2011)
Increased awareness.19
The code increased awareness emerged from the data where participants referred to ways
the Dashboard provided greater knowledge than they previously had about assessment
(Awareness, n.d.; Increased, n. d.). During interviews participants discussed ways the
Dashboard effort helped members to have greater knowledge about how assessment fits into
their daily jobs (thirty of 45 total comments within the increased awareness code addressed this
issue). In doing so many members addressed the importance of the Dashboard effort to motivate
members to think about and become aware of opportunities to use assessment in their everyday
work. A senior leader stated, “I think in at least some of the cases it really got them motivated to
change how they did business or think about how they did business, or really reexamine how
they did business” (Participant 32, 2011). Similarly, a staff member explained, “This initiative
has caused us to kind of think about what we do in a different way and place more value on the
quality of the work that we do” (Participant 9, 2011). A director commented,
It made us more conscious of the importance of gathering this information and really
stretching our student evaluation forms…So, you know, all of that I think contributed to,
you know, how we work in a positive way, and effects what we do and what we gather
and what we value. (Participant 2, 2011)
In addition to a greater level of knowledge about how assessment fits into daily work
habits, other participants discussed ways the Dashboard effort helped members to have a greater
knowledge about assessment in general (ten of 45 total comments within the increased awareness
19 Increased awareness was the 11th most addressed issue with 45 of 309 total comments from the organizational changes theme and 1144 total comments from interview participants overall.
102
code addressed this issue). A compelling example of the perception of the way the Dashboard
effort increased awareness of assessment to organizational members is by this director who
stated, “I understand now the why of decisions” (Participant 12, 2011). A staff member
confirmed, “There has been some increased awareness of measurement” (Participant 5, 2011).
This participant perceived that success was found through building awareness of the steps to
completion. A director remarked, “Success is exposing people to the concept – what and how it
needs to happen. Yes, we’ve had success” (Participant 13, 2011).
In addition to increasing awareness about assessment and how affiliated activities fit into
their daily jobs, participants addressed the importance of the Dashboard to provide
organizational members with an increased comfort level with assessment (five of 45 total
comments within the increased awareness code addressed this issue). A senior explained, “It
was a way to introduce the concept of measurement and outcomes so that people would begin to
get familiar with it and would eventually feel comfortable using it” (Participant 32, 2011).
Some participants focused on the varying levels of anxiety that came along with the
Dashboard initiative. A senior leader noted, “I would say for the most part that it showed most
people that assessment wasn’t some monster-beast thought up by bureaucrats to waste their
time” (Participant 30, 2011). Similarly, another senior leader observed,
Assessment was a big fearsome elephant on the table. That we all felt we ought to be
doing more of but it was a sort of poorly defined and seemingly mammoth task. Once we
accomplished the process we were pretty satisfied with the results and felt that we could
continue to engage in this so I think there was some satisfaction and relief – I guess our
confidence was built in our ability to engage in this kind of assessment. (Participant 29,
2011)
103
Increased network collaboration.20
The code increased network collaboration emerged from the data where participants
referred to ways the Dashboard effort resulted in ‘linking different groups of” employees to gain
improved understanding, engagement and goal setting (Vakkuri & Meklin, 2003, p. 752).
During interviews participants discussed ways the Dashboard effort helped them to come
together with others in the University for meaningful discussions and collaborations about
departmental objectives and priorities (nineteen of 43 total comments within the increased
network collaboration code addressed this issue). A compelling example of the perception of the
way the Dashboard effort triggered many important conversations is offered by this senior
leader,
[The representative from COD] then needed to reeducate us that it’s not about this piece
of paper it’s the conversations that they had, it’s how they came to these, it’s the
examination of what they’re doing and why it works and so she had to reeducate the
entire leadership group that the real work invisible inside these bullet points that is real
important and is the real goal of the process…it’s about the process. (Participant 26,
2011)
Similarly, another senior leader remarked,
And that conversation really changed the way a lot of people felt about [this specific
department]. It created a very useful dialogue. It turned out that the upper management,
you might say, did not share the same goals as the people who were actually working in
the trenches. And that is a very worthy conversation to have. So, it creates opportunities,
pursuit is the best word indicators that I have seen. It creates an opportunity for the
20 Increased network collaboration was tied for the twelfth most addressed issue with 43 of 309 total comments from the organizational changes theme and 1144 total comments from interview participants overall.
104
conversation among educators to be sure that we are all on the same page. That we are
sharing the same goals. Sometimes we are surprised what a manager of an area, a
director of an area, chooses to measure. You say why did you measure that? And then
that points out that maybe we really didn't understand what each other's goals were.
(Participant 29, 2011)
Likewise a director observed, “It opens up some of the opportunities we have and just
starts more of the conversations about what we need to do to make sure that we keep these
numbers going” (Participant 21, 2011). Another director remarked, “We had to come to a
consensus on a lot of things and people see things differently. That could be painful” (Participant
1, 2011).
In addition to coming together and collaborating about departmental objectives and
priorities participants addressed the importance of the Dashboard effort collaborate with a shared
objective in mind (thirteen of 43 total comments within the continuous improvement code
addressed this issue). A staff member explained, “Knowing what was going on made us feel like
we were part of the whole – a common purpose. It was great” (Participant 18, 2011). Similarly,
a senior leader pointed out, “I think there were moments – and this was face-to-face – where we
said it has potential and says ‘we are one large division and we are all working towards the same
goal’ even if we haven’t articulated that goal” (Participant 26, 2011).
In addition to coming together to collaborate about departmental objectives and priorities
as well as collaborating with a shared objective in mind, participants addressed the importance of
the Dashboard to help them to meet and learn about others within the University which in turn
allowed them to collaborate across departments and disciplines within the University (eleven of
43 total comments within the increased network collaboration code addressed this issue). This
105
increase in network collaboration is another of the organizational changes afforded by the
Dashboard effort. One director exclaimed, “It’s important because it allows us to get our
information out to a larger community…also to hear what others are doing…because there are so
many offices and I don’t know what you do” (Participant 12, 2011)! A director further
explained,
It was successful in getting departments to come together at a time that there was great
transition in the university. Just the opportunity to even be at a meeting and to say ‘Oh
okay this is the new vice president. And, I’ve heard your name mentioned and now I see
you.’ So in that respect, I’m connecting with people and I try to make connections on
behalf of our department and for our students, so in that way, it was a success.
(Participant 16, 2011)
Redundancy.21
The code redundancy emerged from the data where participants referred to ways the
Dashboard effort was “superfluous repetition or overlapping” to current activities (Redundancy,
n.d.). During interviews participants discussed the indicators from the Dashboard effort as
identical or similar to indicators department members used prior to the effort (twenty-three of 35
total comments within the redundancy code addressed this issue). A director explained, “No,
because for our department we’ve been doing these things. We always do these things, and a lot
of the other departments have measured things they just haven’t had the chance to articulate
them” (Participant 21, 2011). Similarly, a staff member confirmed, “We were already kind of
keeping these measures so it wasn’t really new to our program” (Participant 17, 2011).
21 Redundancy was the 14th most addressed issue with 35 of 309 total comments from the organizational changes theme and 1144 total comments from interview participants overall.
106
In addition to repetitious activities, participants discussed ways members of their
department were already productive and motivated prior to the Dashboard effort and some
participants found no correlation between motivation, productivity and the Dashboard effort (six
each of 35 total comments within the redundancy code addressed this issue for motivation and
productivity).
A compelling example of the perception of the way organizational members are motivated
beyond the Dashboard is through their passion for helping students succeed. A senior leader
explained,
The groups that I worked with were very motivated to start with in terms of the services
that they provide for students. It’s hard to say they were motivated more because these
were really motivated people who really obviously cared about what they did.
(Participant 32, 2011)
Similarly, a director stated,
Because I don’t think [the Dashboard] motivates people. I don’t feel motivated by that.
They’re motivated in making a difference and helping students and they feel like this is
just a bog down. We were already doing it and now we’re just doing it a different way.
(Participant 1, 2011)
A staff member clarified that member motivation was a reflection of factors other than
the Dashboard effort,
I don’t think it’s really changed people’s motivation in terms of what we do and how we
do it. And, you know, it hasn’t really made us any more motivated to come to work on a
daily basis. Maybe that sounds like a negative answer but I think as a staff we’re a pretty
107
motivated staff and I don’t think the Dashboard initiative has changed that motivation.
(Participant 9, 2011)
In addition to existing high motivation participants addressed the perceived intent of the
Dashboard to increase member productivity; however participants perceived that member
productivity was already high. A staff member noted, “I don’t think it’s changed much. And
again, I think our department is – personally I think it’s very productive in the work that we
do…and I don’t think that just the Dashboard has brought about any change in that” (Participant
9, 2011). A director exclaimed,
Yeah and you’re talking to a workforce unit that is already highly productive. I don’t
know how much more productive they could be. And I’m not sure just switching up some
of the evaluations would – they’d view that as changing their effectiveness either.
(Participant 1, 2011)
Similarly, a senior leader declared,
I’d have to say no change. Yeah. I mean I don’t see a direct – these were people who
were already working hard and producing a lot. This may have given them ways to refine
the way they thought about their office and what they did, but make them work harder?
(Participant 27, 2011)
Pride.22
The code pride emerged from the data where participants referred to ways the Dashboard
effort provided members with a “pleasure or satisfaction taken in something done by or
belonging to oneself or believed to reflect credit upon oneself” or the group (Pride, n.d.). During
interviews participants discussed ways the Dashboard effort provided recognition of
22 Pride was the 17th most addressed issue with 10 of 309 total comments from the organizational changes theme and 1144 total comments from interview participants overall.
108
accomplishments which in turn helps to increase employee pride in themselves as well as their
department, division and the University (eight of ten total comments within the pride code
addressed this issue). One participant coined this recognition to be a “stamp” to show
organizational members why they are individually important (Participant 13, 2011). A
compelling example of the perception of the way the Dashboard can recognize organizational
members for their hard work is given by this director who stated,
What they wanted to do is extremely important and has a lot of value within the
University. [It helps people] realize their worth. [It] helps people personally. People don’t
realize how well they do things until they see the data. (Participant 12, 2011)
A staff member further explained, “Giving clear cut direct information to these
organizations made them feel prouder of their organization since it’s a clear way of indicating
their success rates and taking more value in what they’re doing so they see where they’re
successful” (Participant 22, 2011).
Other participants focused on the pride of their staff. A senior leader explained, “I think
the process let us be proud that we could put something up and share something with faculty, and
parents, and students at orientations, and admissions” (Participant 29, 2011). Another senior
leader pointed out that being included in the first four pilot groups held a special meaning to
members of the department, and thus contributed to their departmental pride,
So we were an example. And I think being used as an example by his unit gave us a sense
of ‘Oh, you mean we’re ahead of everybody? We’re the only ones to have this online in
the entire University?’ A sense of ‘oh yeah we’re doing something that is new and good.’
They saw this as a positive motivator. (Participant 26, 2011)
109
In addition to providing recognition of accomplishments, some participants addressed
that many employees, in general, have an existing high work ethic in which they have pride (two
of 10 total comments within the pride code addressed this issue). A staff member explained, “A
lot of these organizations pride themselves and the people pride themselves of being a part of the
organization for what they stand for” (Participant 22, 2011).
The focus of the theme organizational changes is about members perceptions of a result
or consequence of the Dashboard effort and centers on six important segments: continuous
improvement, culture change, increased awareness, increased network collaboration, redundancy
and pride. Overall, participants responding to the theme of organizational changes focused on
ways the Dashboard effort (a) led to, or failed to lead to, “evaluation and achievement through
the analysis of work output” and using this evaluation to determine how to constantly advance
work output (Vakkuri & Meklin, 2003), (b) could have made “alterations to employee values,
behaviors and assumptions that should lead to increased organizational performance” (Ogbonna
& Wilkinson, 2003, p. 1152), (c) provided greater knowledge than they previously had about
assessment (Awareness, n.d.; Increased, n. d.), (d) resulted in ‘linking different groups of”
employees to gain improved understanding, engagement and goal setting (Vakkuri & Meklin,
2003, p. 752), (e) was “superfluous repetition or overlapping” to current activities (Redundancy,
n.d.) and (f) provided members with a “pleasure or satisfaction taken in something done by or
belonging to oneself or believed to reflect credit upon oneself” or the group (Pride, n.d.). The
next chapter focuses on the themes of leadership issues and information exchange.
110
CHAPTER 5
Results and Interpretations
Themes: Leadership Issues and Information Exchange
Two of the themes that emerged from the codes in the study include leadership issues and
information exchange (See Table 1). This section describes and interprets each of the codes and
their corresponding emergent themes. Codes are presented for each theme with the most
frequent codes appearing first.
Leadership Issues: Introduction23
Interpretations of the data sorted into the theme leadership issues describe how members
perceive the presence, or lack thereof, of a “pledge or obligation” from leadership towards the
Dashboard effort (Commitment, n.d.). Participants perceived that there was a lack of dedication
toward the Dashboard effort in six different areas: (a) short term momentum, (b) issues of
priority, (c) people unaware of the effort, (d) skepticism, (e) resources, and (f) other extenuating
circumstances. (See Table 4.)
While much of the literature on organizational change in higher education indicates that
everyone involved in the effort should be prepared for a lengthy process (Kezar & Eckel, 2002),
the code short term momentum that emerged from the data suggests that participants referred to
ways the “driving power or strength” (Momentum, n.d.) of the Dashboard effort lasted only for a
“limited period” of time (Short Term, n.d.). In particular, participants perceived that the
Dashboard effort lost momentum or stalled early on in the process. Some participants even
perceived that the Dashboard effort was complete, while others perceived that initially there was
some positive impact, but it was fleeting. Several participants attributed the short term
23 Leadership issues was the most discussed theme with 329 of 1144 total comments from this dissertation addressing this issue.
111
momentum of the Dashboard effort to its origin as a mandate and others to its poor timing.
These observations point directly to perceived issues with leadership by the participants.
While much of the literature on organizational change in higher education indicates the
importance of leadership to be consistent, persistent and continuously a topic of discussion
(Burke, 2008), the code issues of priority that emerged from the data suggests that participants
perceived that there were competing priorities that won out over the Dashboard effort. In
addition, participants were looking for leadership to reinforce the priority of the Dashboard effort
through discussion, incentives and rallies. Some participants perceived that the senior leaders
were dedicated toward the Dashboard effort and content with its outcome. These perceptions
about the involvement of leadership have direct impact on the Dashboard effort.
The code people unaware of the effort emerged from the data where participants
referred to ways stakeholders such as staff members were unaware or uninvolved with the
Dashboard effort (Kezar & Eckel, 2002). In particular, participants were most concerned that
staff members who are dealing with the day-to-day activities of the department and who directly
serve the constituents were not involved with the Dashboard effort. Other participants were
concerned that there were staff members who were not even aware that the Dashboard effort
existed. Some, but much less, members perceived that staff members were aware of the
Dashboard effort. These perceptions about the involvement and awareness of staff members
with the Dashboard effort are directly linked to perceptions of lack of priority on the senior
leaders’ part about the effort.
The code skepticism emerged from the data where participants referred to their mistrust
about the information collected for the Dashboard (Vakkuri & Meklin, 2003). In particular,
participants questioned the usefulness of the information collected to their department’s benefit.
112
In addition, participants questioned the objective for the Dashboard effort. Was the objective to
truly improve the organization or to defend the University to external constituents? Finally,
participants questioned whether or not the Dashboard effort was a fad. These perceptions about
the mistrust of the Dashboard effort is directly linked to perceptions of leaders’ priority and
commitment to the effort.
The code resources emerged from the data where participants referred to “support
structures” to aid members with work related to the Dashboard as well as other activities which
will in turn help protect them from cutbacks” (Kezar & Eckel, 2002, p. 300). In particular,
participants were most concerned with resources related to the Dashboard effort. In addition,
participants were concerned with resources related to department programs and services that
would, in turn, help protect the department from cutbacks. Participants perceptions about are
posed from the perspectives of subordinates who are hopeful that their leaders will provide
adequate resources.
The code other extenuating circumstances emerged from the data where participants
referred to ways organizational members became “distract[ed] from the planned, change effort”
(Kezar & Eckel, 2002, p. 299). Participants became distracted by staffing issues, their concerns
for job security and lack of salary increases over several years. These perceptions indicate issues
for leaders at the time of the Dashboard effort. Next each code for the leadership theme is
discussed in detail.
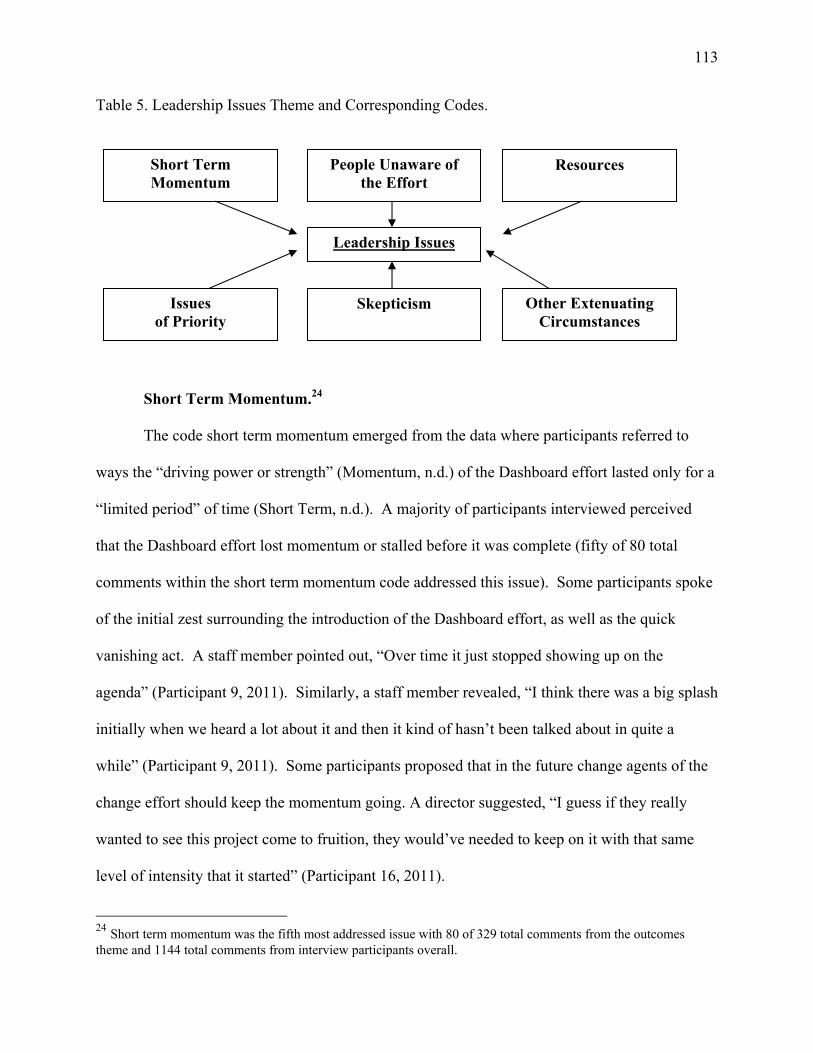
113
Table 5. Leadership Issues Theme and Corresponding Codes.
Short Term Momentum.24
The code short term momentum emerged from the data where participants referred to
ways the “driving power or strength” (Momentum, n.d.) of the Dashboard effort lasted only for a
“limited period” of time (Short Term, n.d.). A majority of participants interviewed perceived
that the Dashboard effort lost momentum or stalled before it was complete (fifty of 80 total
comments within the short term momentum code addressed this issue). Some participants spoke
of the initial zest surrounding the introduction of the Dashboard effort, as well as the quick
vanishing act. A staff member pointed out, “Over time it just stopped showing up on the
agenda” (Participant 9, 2011). Similarly, a staff member revealed, “I think there was a big splash
initially when we heard a lot about it and then it kind of hasn’t been talked about in quite a
while” (Participant 9, 2011). Some participants proposed that in the future change agents of the
change effort should keep the momentum going. A director suggested, “I guess if they really
wanted to see this project come to fruition, they would’ve needed to keep on it with that same
level of intensity that it started” (Participant 16, 2011).
24 Short term momentum was the fifth most addressed issue with 80 of 329 total comments from the outcomes theme and 1144 total comments from interview participants overall.
Leadership Issues
Issues of Priority
Skepticism Other Extenuating Circumstances
Resources People Unaware of the Effort
Short Term Momentum
114
Other participants were left wondering whether or not the work they contributed toward
the Dashboard effort was worthwhile. A staff member indicated, “I have to believe that what we
offered is helpful to them in some way and whether they’re working on it diligently now or just
kind of shelving that at the moment and going to get back to it” (Participant 10, 2011).
Other participants revealed their frustration with the Dashboard effort, concluding that it
was a waste of their time. A director revealed, “At this point it’s stalled and just another
exercise” (Participant 12). Similarly, this staff member remarked, “Well to be honest with you,
I’m not sure it went anywhere. And, if it did, no one knows about it. I think it’s dropped.
(Participant 8, 2011)
In a moment of reflection, a senior leader discussed the impact of lost momentum on the
Dashboard effort,
[A member of COD] was the best critic for the things that were working well and not
working well for our division. She said what wasn’t working well is that we would let
moments go by without capitalizing on them and if we wanted to make the stuff work we
had to keep moving forward immediately. Once you lose the momentum it’s gone.
(Participant 27, 2011).
In addition to lost momentum, some participants perceived that the Dashboard effort was
complete (five of 80 total comments within the short term momentum code addressed this issue).
A staff member stated, “I think that some may be relieved that the work is done” (Participant 11,
2011). Similarly, a staff member asked, “Where do we go from there to see continued success as
opposed to an abrupt completion” (Participant 22, 2011)? Similarly, a director pointed out,
“This jump started another conversation. But again, it jump starts the conversation, it happened,
and then it stops. And that’s the part that frustrating” (Participant 21, 2011). Some senior
115
leaders revealed that their focus was getting all the departments through the process, not
continuing the process,
I don’t know how relevant it is to talk about doing it again because it’s very recent. So I
think maybe in a couple years it would be worth having departments go back and revisit.
But at this point, I think we’re still trying to get everyone through doing it. (Participant
27, 2011)
In addition to lost momentum and some participants perceiving that the Dashboard effort
was complete, other participants perceived that initially there was some positive impact but it
was fleeting (four of 80 total comments within the short term momentum code addressed this
issue). A staff member stated, “I don’t know that it’s permeated on a consistent, sustained level”
(Participant 5, 2011).
In addition to lost momentum, the effort being complete and fleeting impact, other
participants attributed these perceptions of the Dashboard to its origin as a mandate (fifteen of 80
total comments within the short term momentum code addressed this issue) and others to its poor
timing (six of 80 total comments within the short term momentum code addressed this issue).
Some participants focused on the perception that the Dashboard effort was a mandate from
senior leadership. A director pointed out, “Certain administrative department leaders would feel
that these Dashboard measures could be useful, but didn’t want them rammed down their
throats” (Participant 24, 2011). A staff member stated, “No one asked if we wanted to do it”
(Participant 17, 2011). A staff member further explained,
Department heads have no choice but to follow the lead of the directives that come down
from the VP level, and the department staff…we just mostly do what we’re told. Not
much choice whether we like it or not is a different story. (Participant 7, 2011).
116
Some participants perceived the lack of interest as a possible result of the mandate. A
director offered,
It seemed to be kind of something imposed from the outside and I think if it had
resonated more with our program, like, ‘this is something we’re really interested in’ then
it might have kept the momentum up. (Participant 16, 2011).
Other participants focused on the timing of the Dashboard effort. A senior leader noted,
“We might need to be a little more realistic about the timeframe given everyone’s constraints”
(Participant 27, 2011). To that end, a director pointed out, “Not to diminish the importance, it’s
just kind of frustrating when you have to do that and you’re already doing all these other sorts of
reports that were all due at the same time” (Participant 21, 2011). A staff member explained,
My first reaction was why now? I consider our down time to be the summer…so to take
place in the fall or spring while we’re midstream – maybe to know that it’s coming ahead
of time…like this is something we’re going to work on and pre-plan the summer before.
The timing for me personally, I guess professionally, was like oh my gosh, now what
does this mean? How is this going to affect what we’re already doing? The committee
already had their goals for the upcoming semester, and this was something new.
(Participant 11, 2011)
Similarly, a director explained the challenge of having a major project “plopped” on the
department,
You know, for us, it always amuses me when people say, ‘We’re going to have a meeting
September 12th.’ Are you kidding me? I’m packed to the gills. I don’t even know if I’ll
have an hour to brush my teeth in the morning! You know, it’s like crazy. Other people
– I don’t know what they’re doing. Our busyness level is incredible so when something
117
like that gets layered over it’s just like, what did you think we were doing over here?
(Participant 1, 2011).
Issues of Priority.25
The code issues of priority emerged from the data where participants referred to ways the
leadership either gave consistent, persistent attention to the Dashboard effort, or failed to do so
(Burke, 2008). A majority of participants interviewed perceived that the leadership failed to
keep the Dashboard effort a top priority among other competing priorities (twenty-six of 67 total
comments within the leadership code addressed this issue). A compelling example of the
perception of the way leadership failed to prioritize the Dashboard over other activities is
provided by this director, “It was like another one of these things let’s get it off our checklist and
move on to another activity” (Participant 3, 2011). Another director explained,
There are more and more demands on our time. We are kind of overwhelmed and
stretched in many different ways. So, I wish it were different. I wish there had been
more time to really absorb everything the Dashboard represents. But anyway, with these
kinds of extenuating circumstances it’s just sort of another project. I think it could be
deeper and richer and, you know, more integrated into the work that we do, but there
seems to be just too little time. (Participant 2, 2011)
Several senior leaders tried to explain why the Dashboard effort was not kept as a top
priority. A senior leader explained,
I can tell you very honestly, we haven’t kept these up to date. We put them up last year,
and I haven’t had a discussion about Dashboard indicators with my staff for a year. We
25 Issues of priority was the seventh most addressed issue with 67 of 329 total comments from the outcomes theme and 1144 total comments from interview participants overall.
118
have had some people out sick. There are all different reasons that I can point to for that
but I am remiss in that I have not kept this as a priority. (Participant 29, 2011)
Similarly, another senior leader defended,
My sense is it’s always something that gets put on the back burner because there are so
many other more pressing concerns and daily running of an office and will take
precedence over any kind of assessment tool which doesn’t have an immediate urgency.
(Participant 28, 2011)
A participant defended the perception that at the time the Dashboard effort was
introduced the senior leaders were struggling with other priorities. The director indicated,
I think that it’s a wonderful thing for senior leaders to focus on – how can we improve,
how can we use Dashboard measures to improve what we’re doing, but at the time, most
of my discussions with anybody senior at the university centered around ‘how do we
keep our head above water.’ (Participant 24, 2011)
A senior leader condensed the issues of the Dashboard effort with this remark, “Everyone
knows it’s important but they could never prioritize it. That sums up assessment” (Participant 26,
2011).
In addition to competing priorities winning out over the Dashboard effort, participants
perceived that leaders did not reinforce the priority of the Dashboard effort through discussion,
incentives and rallies (twenty-three of 67 total comments within the leadership code addressed
this issue). Several participants discussed the need for leaders to keep programs such as the
Dashboard effort a priority. A senior leader explained the importance of leader reinforcement,
One of the things you find out in these initiatives, and I would be surprised if it didn’t
come up here too, is the importance of leadership to make these things. Leadership to
119
endorse and support. But then also leadership to keep things moving. (Participant 31,
2011)
Another senior leader reiterated the importance of leadership reinforcement, “The DB
project from the VP position doesn’t become an aspiration until he tells them it’s their aspiration
– then it is on their radar” (Participant 26, 2011). A director provided a compelling reaffirmation
of this importance, “I just need to update it because I haven’t been asked to and it’s just other
priorities seem to be in play right now” (Participant 2, 2011). A senior leader team summed the
Dashboard effort by declaring, “I think that’s evidence of if you don’t have someone driving the
bus it’s not going anywhere” (Participant 26, 2011).
Some participants offered suggestions as they tried to make sense of the lack of
leadership reinforcement. A staff member offered,
I think maybe making it - keeping it as a priority. I think initially it was a high priority
and then it kind of got pushed down on the priority list. And maybe that was because of
again things at higher levels. So I’m not sure who organizes that priority list. (Participant
9, 2011)
Similarly, a senior leader explained the Dashboard system imperfections,
Once those Dashboard measures are up online they become static and if there isn’t
someone who decides to continue to drive it….there is no internal motivation to go back
and replenish data or revisit the data to find out how you’re doing. It’s not built into the
system. And it’s a major flaw so far. (Participant 26, 2011)
Finally, other participants discussed the lack of incentives and cheerleading to work on
the Dashboard effort. A director noted,
120
Um no speeches about how we gotta get this done or any rallies from [the Vice President]
or anything where it was like ‘Yay let’s do this – you guys are part of the pilot, and what
comes out of you is gonna get spread across – it’s gonna be terrific and here’s some free
time to work on it or some incentive to do so.’ So I don’t remember any strong
incentives symbolically or literally. (Participant 24, 2011)
In addition to competing priorities winning out over the Dashboard effort, and the lack of
senior leader reinforcement, participants perceived that the senior leaders were dedicated toward
the Dashboard effort and content with its outcome (eighteen of 67 total comments within the
leadership code addressed this issue). A senior leader commented, "[ The VP] was pleased with
how it’s turned out so far” (Participant 26, 2011). Speaking about the commitment of the Vice
President a senior leader offered,
I think it was very important that [the Vice President] took an active role because it
showed not only that he wanted them to do it but that he believed in it and it had his
support. He spoke to the group. He was the initial person who when we had the group
meetings he was there and he told people why he thought it was important and I know
that he also had those discussions with his AVPs. So he was perceived throughout as
being very supportive of this...So I think that having the support of the top leader in the
organization was very important almost for some obvious reasons. It let people
participate and also showed them that it was okay to talk about what was going on in
terms of mission and really kind of take apart what was working and what wasn’t
working. (Participant 32, 2011)
People Unaware of the Effort.26
26 People unaware of the effort was the eighth most addressed issue with 60 of 329 total comments from the outcomes theme and 1144 total comments from interview participants overall.
121
The code people unaware of the effort emerged from the data where participants referred
to ways stakeholders such as staff members were unaware or uninvolved with the Dashboard
effort (Kezar & Eckel, 2002). In particular, participants were most concerned that staff members
who are dealing with the day-to-day activities of the department and who directly serve the
constituents were not involved with the Dashboard effort (thirty-one of 60 total comments within
the people unaware of the effort code addressed this issue). Staff members were quite vocal
about their lack of involvement. A staff member explained that the Dashboard effort was done,
“behind closed doors” (Participant 17, 2011). Another staff member revealed that there was no
impact from the Dashboard because of the small amount of people involved in the process,
“Nothing. It has to exist for everyone, not just a couple of people” (Participant 8, 2011).
Similarly, a staff member commented on their frustration about their lack of involvement with
the Dashboard effort,
Everyone needs to know what’s going on. I have no clue. I believe that if you have an
organization everyone needs to know what’s going on. Everyone needs to be a part of that in
some way – directly or indirectly – but you need to be aware of what’s going on. It’s about
communication. It’s about contributing to that. If that’s not happening then the questions in terms
of the Dashboard are – I have no clue. That’s almost like locking me in a closet. And life goes
on. So I have no clue. (Participant 8, 2011)
Another staff member pointed out that with an effort such as a Dashboard the people
working on everyday projects should be involved,
I think differently would be – maybe I think what happened with the project is that I think
the Sr. level members of the department were involved. I think it would have been a good
idea to include some of the [others on staff] who, you know, really do more of the day-to-
122
day service delivery to have them more involved in the Dashboard project so that we’re
more familiar with it and I think that would be more impactful in the long run.
(Participant 9, 2011)
Other participants felt that by being left out of the planning stage of the Dashboard effort
that they missed out from a complete feeling of accomplishment. A director explained,
I think the first train of thought is just that people at this institution don’t know that we do
this stuff already daily. And maybe someone could have consulted us or talked with us
about it or I thought to include us in a general conversation because they have this idea
out there especially in large institutions that maybe only – like [the office of COD], the
leadership development office can do this or only this is an org development issue and
it’s not. You want to talk to people who do this sort of work. (Participant 21, 2011)
Other participants discussed that the involvement and awareness of all employees would
improve the impact of the Dashboard effort. A director indicated,
So, I would really have the whole staff, so this, this is really important, then the whole
staff has to be involved, there has to be training, and an understanding. I think we had,
you know we had several people that were chosen to be involved in this and if it’s
something that’s very important, then the whole department needs to be involved,
undergo training and be committed to it, and understand how to do that. (Participant 3,
2011)
A director revealed, “I wish we had spent more time involving the entire department, not
just the task force” (Participant 2, 2011).
In addition to the concern about staff members who were not involved with the
Dashboard effort, other participants were troubled that some staff members were not even aware
123
that the Dashboard effort existed (twenty-two of 60 total comments within the people unaware of
the effort the code addressed this issue). In fact, four staff members from three different
departments randomly selected as a part of the interview sample had no idea what a Dashboard
was and had no idea the Dashboard effort existed on their campus and in their department. A
staff member remarked, “I don’t think any of my colleagues know anything about it” (Participant
8, 2011). Another staff member observed, “I don’t know if there’s anything that was done to
individual departments to be shared with staff members” (Participant 7, 2011). A director further
offered,
So, if it were to be successful, people would know and understand the importance of the
Dashboard, and it would be something that guides our work on a day-to-day basis, and I
don’t think it does at all. I don’t even think people could tell you what the Dashboard is.
(Participant 3, 2011)
A few participants discussed the importance of sharing information with others in the
organization. A staff member recommended, “If you introduce something new, you need to
market it to the lower level. I think if you want everybody to know what it is; you target it from
ground up instead of to VP meetings. Sometimes you walk away and that is it. Nothing’s really
shared. (Participant 7, 2011). Similarly, this staff member shows their frustration with the lack
of awareness of the Dashboard effort,
I think your questions are geared for people who - making assumptions that they created
a Dashboard, use the Dashboard – and not only created it but everyone on board is using
it in some way, is aware of it, is having a discussion about it. Um, that’s not happening
here so far as I know. If I am…using it or if the department were talking about this is how
we’re measuring and using it then everyone should be having that discussion about
124
‘that’s how we’re doing it,’ ‘what are we looking at?’ And if that’s happening, it’s not
happening on my level. It’s happening on, if at all, at a higher level. And I think if you’re
gonna have a Dashboard everyone needs to be on board about what’s going on, how’s it
being handled, how can we add to that? And that’s not a conversation. I don’t have any
information. I’m out of the loop. (Participant 8, 2011)
Leaving people out of the effort – whether by not including them in planning or not
making them aware of the effort had several effects. Some members felt left out and
unimportant, while others felt that the Dashboard effort itself was unimportant.
In addition to the concern about staff members who were not involved or aware of the
Dashboard effort, other participants, but much less, perceived that staff members were aware of
the Dashboard effort. A senior leader stated, “They were all involved” (Participant 27, 2011). A
director explained,
We have several full staff meetings during the course of the year so we certainly provided
an update to the staff through those meetings, through individual office meetings. I
wouldn’t say there was any consistent or strategic – it wasn’t like a monthly report or
monthly update. So we just tried to keep the rest of the staff informed about what we
were doing largely through email and occasional live meetings. (Participant 2, 2011).
Skepticism.27
The code skepticism emerged from the data where participants referred to their mistrust
about the information collected for the Dashboard (Vakkuri & Meklin, 2003). A majority of
participants interviewed questioned whether or not the information from the Dashboard effort
would be useful to their department (forty-one of 53 total comments within the skepticism code
27 Skepticism was tied for the 9th most addressed issue with 53 of 329 total comments from the outcomes theme and 1144 total comments from interview participants overall.
125
addressed this issue). Many participants were concerned that their efforts would only add to
their existing level of work and not amount to any real impact for the department or the
University. A senior leader revealed, “Honestly, at first [two senior leaders] were not on board.
They were skepticism it would be useful vs. an exercise that we have to do that would teach us
anything. They were on board to do it…just skeptical” (Participant 26, 2011). Similarly, a staff
member echoed the same concerns, “I think it was just questioning again to make sure that again
we were making the best use of our time and the best use of the time for the folks who had asked
us to do it” (Participant 10, 2011). A director stated, “We are notorious in education and I guess
corporate is too, and we do nothing but produce reports to say that we have reports” (Participant
12, 2011).
Other participants were concerned with how the information collected for the Dashboard
effort would be used. A staff member explained, “You start thinking there’s more work, more
paperwork. And then you also want to question if these Dashboards are going to have a negative
effect on your program and what you do” (Participant 17, 2011). Similarly, another staff
member stated,
They take it very seriously. Maybe even a little bit of alarm. That’s kind of a strong
word, but definitely they’re concerned about it because I think it reflects on the
University. It reflects on individual divisions and the departments. So I think everyone
kind of feels at attention when this topic comes up. (Participant 6, 2011).
In addition to questioning the usefulness of the information, participants questioned the
objective of the Dashboard effort. Was the objective to truly improve the organization or to
defend the University to external constituents (seven of 53 total comments within the skepticism
code addressed this issue)? A director provides a compelling example, “The skepticism part
126
comes in that I didn’t believe that the University should be spending so much energy and time to
justify its own existence” (Participant 24, 2011). A director exclaimed, “They want to say here’s
what great about what we’re doing. They don’t want to uncover dirt…they want to paint the
pretty picture. So that part creates a bit of skepticism” (Participant 1, 2011). Another director
voiced concerns about the goal of the effort,
More work. This is a huge place and I often wonder the – what is going to be the point in
doing this? Why are we doing this? Are you saying we’re using this as a tool to show a
measurement? I mean I still don’t know exactly why we did it except that it was a useful
tool to show what we do. (Participant 21, 2011).
Other participants criticized the type of Dashboard data that was shared publicly. A
senior leader explained,
I think anybody who comes from a social sciences background would look at these
[indicators] and say, ‘Okay, fine. So you came up with four graphs that show you’re good
at the following four things. But what about all these other things you didn’t measure?’ It
doesn’t take a genius to figure out that we’re gonna measure and promote things we’re
doing well. We’re not gonna put on our website some measurement that made us look
terrible. And, that’s an inherent problem. (Participant 29, 2011)
Similarly, another director explains,
So my standard would be that we would devise learning outcome assessment for every
content area we deliver a service on and that we electronically assess every time we go
out and do this whether it’s individual or in a group format, and that’s collected and
dropped into something magically that somebody else, not me, can look at and provide
additional data points for the Dashboard moving forward. And it would become a way for
127
us to gauge what we’re doing well but also help us understand what we’re not doing so
well. So, if that were really what was happening, I would say, 'wow, this is a really great
thing.' But if you’re just trying to paint a pretty picture for the sake of pictorial, visual pie
charts and bar graphs for the outside community to see, oh isn’t that great. Come on.
What is that about? Now I’m getting skeptical, right? I want to use this to show we need
to shift this around. This isn’t happening. This isn’t good or this needs to be looked – you
know if you’re really using this in the right way, it’s not a PR venture. It’s a tool to
improve the quality and the effectiveness of what you do. And so, if you’re not using it
that way and it’s just kind of there, scraping out all of the good stuff, you know, it’s like
evaluation – or what I like to call ‘happy sheets.’ You hand them to the person, they say
how great you are, they give them back to you, and you’re like, “Great!” Well, sure.
Except I don’t think that’s an effective way to capture the learning. So, I will just forget
it. If you got me in a room with [the others], and we go around and around and around,
and [one] will say, 'Yeah, you’re right. It’s antiquated.' Then [the other] will say, 'We
don’t get this – and we don’t get a good response.' And we go around and around and
around. I’m like forget it. I don’t even want to do this anymore. Do I sound jaded?
(Participant 1,2011)
In addition to questioning the usefulness of the information and the objective of the
Dashboard effort, participants questioned whether or not the effort was a fad (five of 53 total
comments within the skepticism code addressed this issue). A director asserted, “I think that this
is sort of like when total quality management came to be and everyone was all hot and now it’s
all about assessment, learning outcomes, and whether or not we’re truly effective at what we’re
doing” (Participant 1, 2011). Similarly a staff member recalled, “At the time I was just
128
wondering if it was more busy work or another fad. You know, you have these fads that come in
and out of education” (Participant 3, 2011).
A director explained,
I think most of [the directors] would think that it’s – shall we say – [Academic
Department] psychobabble? I mean I hate to denigrate [this Academic Department] – I
love what’s going on there, but I think you get a lot of faculty in traditional disciplines
who think that all this soft science is just bunk. And theories change too often and what
are we really doing here? So I think there would have been some resistance along those
folks...Not to knock your school, again…I think what’s going on there is great, and I love
what comes out of the quality centers and those types of things, but I do think that we got
TQM out of them and QCI and things like that and I think that there’s a large number of
faculty members who simply roll their eyes when these things come through. (Participant
24, 2011)
Resources.28
The code resources emerged from the data where participants referred to “support
structures” to aid members with work related to the Dashboard as well as other activities which
will in turn help protect them from cutbacks” (Kezar & Eckel, 2002, p. 300). A majority of
participants interviewed focused on resources to ensure that the Dashboard effort could work
better in their department (thirty-five of 43 total comments within the resources code addressed
this issue). Increased resources such as computer programs, access to University databases, staff
knowledgeable with surveys and statistics and were the focus of participants discussions about
the Dashboard effort. A director explained, “Success would be having a mechanism to easily
28 Resources was the thirteenth most addressed issue with 43 of 329 total comments from the outcomes theme and 1144 total comments from interview participants overall.
129
and maybe almost automatically update the Dashboard” (Participant 2, 2011). Highlighting the
desire for additional education and help with data this staff member explains,
Bring in or make available more info, benchmarking from other Universities how exactly
they did it and show examples of how they did it and maybe preparing people a little
sooner before they were asked to for the data so we could plan how we would gather the
data ahead of time so we could have set it up so that data would have been coming in
already in a way that was easy to analyze. And then of course give out any amount of
resources, money and everything to help organize data and analyze it (Participant 6,
2011).
Some participants were frustrated by a lack of expertise in their department to adequately
collect data for the Dashboard. A senior leader describes,
[In one instance] there was nobody on the staff of [the department] or even on the, in the
staff of all six units that reported to me, who had the skills to measure [the key goals they
had chosen]. They didn’t have the money, we didn’t have the time, we couldn’t do
questionnaires, we couldn’t do surveys, we didn’t have anybody to code the data if we
did interviews and we didn’t have anybody to produce a Dashboard, even if we could
have collected that data. It was beyond our background or training. (Participant 28,
2011)
Other participants focused on the need for additional change agents. A senior leader
commented,
I would identify more coaches. I would identify a support team that all the people being
asked to develop the Dashboard indicators could reach out to and I would insist that there
would be enough of them that they could give regular and timely feedback when directors
130
were developing their goals. This was very important. This was the most important
improvement we could have. (Participant 29, 2011)
In addition to the need for resources for the Dashboard effort, participants were
concerned with resources related to department programs and services (six of 43 total comments
within the resources code addressed this issue). Department staff were hopeful that the ability to
show their good work would result in increased resources. A staff member explained,
“Obviously it shows the importance and the value of your department and it can certainly have
an impact in terms of resources both in terms of maybe increasing staff or the budget”
(Participant 9, 2011). Other, but fewer, participants were more negative about the perceived lack
of help the Dashboard effort was for their department. A senior leader noted,
You know, I don’t think any planning was adjusted because of them. Not that I could see.
I didn’t receive any more funding or any more staff. And it could be that simply resource-
wise there’s less flexibility than you might think for department heads to make change.
(Participant 29, 2011)
In addition to resources for the Dashboard effort and their department, participants
addressed the importance of the Dashboard to insulate their department from cutbacks (two of 43
total comments within the resources code addressed this issue). A director justified, “[The
department was] never cut back on funding on the state level due to our Dashboard indicators”
(Participant 15, 2011). Similarly, a senior leader explained the reasoning for this insulation from
cutbacks,
I think the credibility that came to [the Vice President’s] whole area for doing this
probably insulated them against threats of cuts and so on and probably heightened
resources they were getting and it positioned them as a real leader within the University
131
and the TUE initiative because they were doing this which was progressive. Because they
were able to demonstrate and talk about their effectiveness. (Participant 31, 2011)
Other Extenuating Circumstances.29
The code other extenuating circumstances emerged from the data where participants
referred to ways organizational members became “distract[ed] from the planned, change effort”
(Kezar & Eckel, 2002, p. 299). Participants noted the struggle employees faced trying to deal
with both at the same time. A director remarked, “I think there were some that truly did believe
that Dashboard measures could help, but the state of [the University] as it was at that time didn’t
allow you to focus on that” (Participant 24, 2011).
Participants became distracted by a series of staffing issues, their concerns for job
security and lack of salary increases over several years. Addressing staffing issues (twelve of 26
total comments within the other extenuating circumstances code addressed this issue) a senior
leader explained, “Too much transition with too many people moving in the spring semester. It
became let’s survive the spring rather than let’s set this up on the strongest foot possible”
(Participant 26, 2011). Another senior leader explained the staffing issue from a department
standpoint, “Thy simply don’t have time to sit down and do these things. Everybody’s short-
staffed” (Participant 27, 2011).
In addition to staffing issues, some participants interviewed perceived that there was a
more immediate focus on the lack of salary increases over several years (eight of 26 total
comments within the other extenuating circumstances code addressed this issue). This can be
seen by the focus of this comment from a director,
29 Other extenuating circumstances was the 16th most addressed issue with 26 of 329 total comments from the outcomes theme and 1144 total comments from interview participants overall.
132
Well, I guess, maybe it’s hard to isolate the Dashboard. Just when you asked the
questions - just had the thought of, you know, more and more demands on our time as
individuals within the department, at the same time no raises for the last three years. I
mean, that’s, you know, that’s that. (Participant 2, 2011)
Similarly, another director commented on the state of the University,
I don’t think that that’s changed and I don’t think Dashboard indicators, at least at [our
university], could do that. We are a huge institution that for nearly four years has not
received an increase. Staff has not received an increase. A lot of things have been
stagnant, so any time things are changing or there’s more shifts, they are becoming
growingly frustrated. And I don’t think that Dashboard indicators or more professional
development or anything that helps them build is gonna change morale. Morale is low.
And it more has to do with the institution and bureaucracy and politics than it does
focusing on these things. (Participant 21, 2011)
Senior leaders also focused on these negative circumstances as a distraction from other
work-related issues such as the Dashboard. A senior leader reflected, “None. Employee morale
here has been high in this unit. Employee morale has also been affected by things like no salary
raises and things like that” (Participant 30, 2011). Similarly, another senior leader observed,
I think it would be impossible to tell [about the level of employee morale] because the
time period in which this occurred has been a really difficult time for the University. On one
hand there’s enthusiasm because of the new TUE when the whole thing started. On the other
hand there have been layoffs, there have been – you know it’s been a really difficult time.
Environmental factors. No salary increases. There have been some other things that have
undermined morale so I don’t know how you’d sort it out. (Participant 31, 2011)
133
In addition to staffing issues and salary increases, some participants interviewed
perceived that there was a more immediate focus on job security (six of 26 total comments
within the other extenuating circumstances code addressed this issue). A staff member discussed
the impetus to increase professional development skills, “When all these changes started if you
were worried about job security you started thinking about other options and more professional
development – learning new skills” (Participant 17, 2011). Another staff member exclaimed,
“People feared for the safety of their job because of budget cuts” (Participant 4, 2011). Similarly
another staff member explained,
There’s always talk now about vacancies and filling positions. If you don’t fill them they
will take the position away. So you have to protect your job. Keep your job. Is their job
worth keeping? The Dashboard will see what’s going on in the programs. If people are
looking at department data, will they keep your job? (Participant 17, 2011).
Overall, participants responding to the theme of leadership issues focused on the
perception that there was a loss of momentum to keep the Dashboard moving forward. In
addition, participants focused on issues of priority such as competing priorities, the need for
reinforcement from leaders and lack of incentives. Other participants focused on the lack of
awareness and involvement with the effort while some expressed their skepticism about the
usefulness and goal of the effort. Finally, some participants focused on resources to accomplish
their tasks as well as other extenuating circumstances that distracted from the Dashboard effort.
The next section focuses on the theme of information exchange.
Information Exchange: Introduction30
30 Information exchange was the fourth-most discussed theme with 237 of 1144 total comments from this dissertation addressing this issue.)
134
Interpretations of the data sorted into the theme information exchange describe how
members perceive the focus on the exchange of information about the Dashboard planned
change effort. Participants perceived information from and about the Dashboard in five key
areas: (a) process, (b) feedback, (c) uncertainty, (d) promote the university and (e) influence
administration.
The code process emerged from the data where participants referred to “a series of
actions or operations conduct[ed] to [achieve the Dashboard effort]” (Process, n.d.). In
particular, most participants addressed the change agent, or person who “helps to bring about an
outcome” to the Dashboard effort. Other participants addressed the importance of face-to-face
meetings to make decisions, and others addressed the need for education about the Dashboard
effort. These perceptions about the facilitation, meetings and education for are means that
participants exchanged information about the Dashboard effort.
The code feedback emerged from the data where participants referred to information
about the status of the Dashboard effort from directors and senior leaders as “a resource for
attaining goals within an organization” (p. 373, Ashford & Cummings, 1983). In particular,
most participants addressed the lack of feedback about the Dashboard effort. Other participants
addressed the importance of feedback in a planned, organizational change effort such as this.
These perceptions about the need for and importance of feedback represent a method for
participants to gather information about the Dashboard effort.
While much of the literature on organizational change in higher education indicates the
importance of providing clear direction and goals (Kezar & Eckel, 2002), the code uncertainty
that emerged from the data suggests that participants perceived that there was much uncertainty
surrounding the Dashboard effort. In particular, participants were unclear about the benefits of
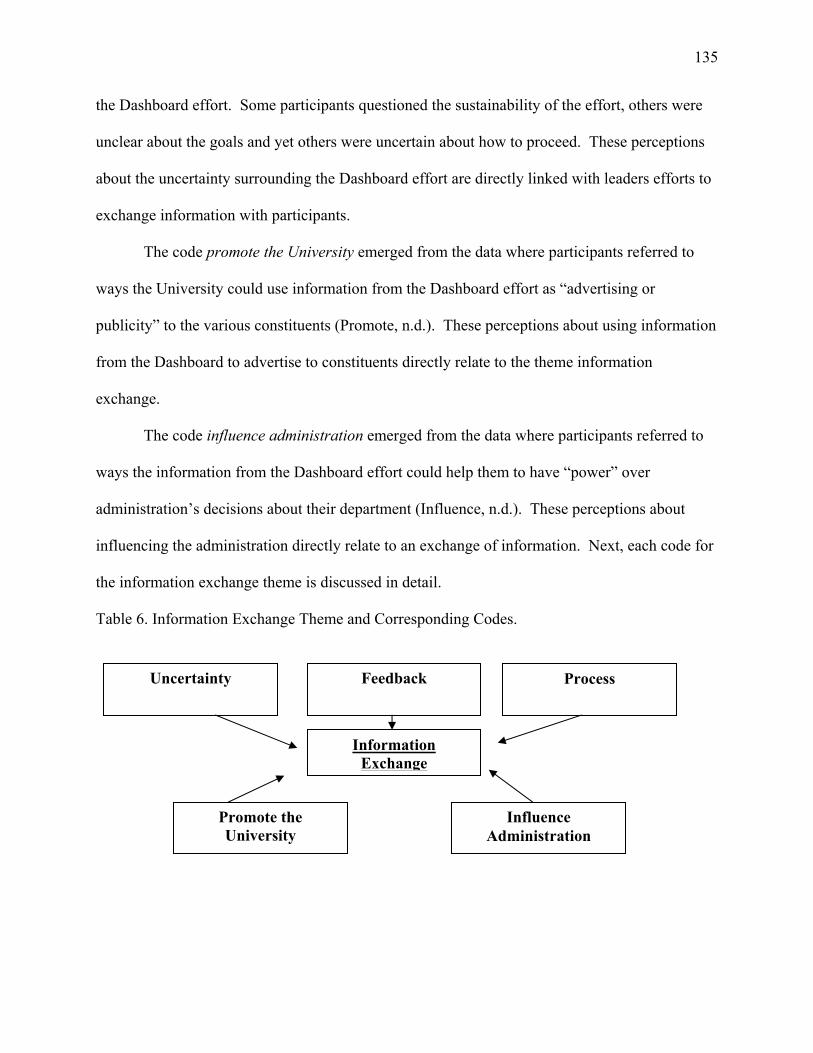
135
the Dashboard effort. Some participants questioned the sustainability of the effort, others were
unclear about the goals and yet others were uncertain about how to proceed. These perceptions
about the uncertainty surrounding the Dashboard effort are directly linked with leaders efforts to
exchange information with participants.
The code promote the University emerged from the data where participants referred to
ways the University could use information from the Dashboard effort as “advertising or
publicity” to the various constituents (Promote, n.d.). These perceptions about using information
from the Dashboard to advertise to constituents directly relate to the theme information
exchange.
The code influence administration emerged from the data where participants referred to
ways the information from the Dashboard effort could help them to have “power” over
administration’s decisions about their department (Influence, n.d.). These perceptions about
influencing the administration directly relate to an exchange of information. Next, each code for
the information exchange theme is discussed in detail.
Table 6. Information Exchange Theme and Corresponding Codes.
Information Exchange
Promote the University
Influence Administration
Process Feedback
Uncertainty
136
Process.31
The code process emerged from the data where participants referred to “a series of
actions or operations conduct[ed] to [achieve the Dashboard effort]” (Process, n.d.). A majority
of participants interviewed addressed the change agent, or person who “helps to bring about an
outcome” to the Dashboard effort. (sixty-four of 136 total comments within the information
exchange code addressed this issue). Many participants addressed the importance of the
employees who helped to facilitate the Dashboard effort. The senior leader noted, “Once they
met with [the representative from ODL], people saw that this was not gonna be a waste of time
and also was not gonna eat up their lives” (Participant 30, 2011). Another senior leader
commented,
I think that it was really helpful to have these discussions facilitated because it isn’t their
day-to-day work. It isn’t going to be the highest priority because their most important
work is what they do with students. So I think it was important that they had some
continuity in who was facilitating it and that it was facilitated. (Participant 32, 2011)
A senior leader commented,
[The representative from COD] was really an important figure and she really gently,
kindly prodded people to move this up on their list of things to do. Also [another
member of the senior leadership team] was often put in the position to gather information
from people who had a million other things to do, and she didn’t really have any way of
lighting a fire under people. (Participant 28, 2011).
Validating these perceptions a director stated thoughtfully, “I really liked working with
[the representative from COD]. I really liked how she got us to think about it. I thought
31 Process was the most addressed issue with 136 of 237 total comments from the information exchange theme and 1144 total comments from interview participants overall.
137
she was a great facilitator and she kept us on task. That made the exercise enjoyable, but
I wouldn’t call this a very enjoyable exercise. I liked how she provided that framework
and that structure and direction for us. It really mattered. (Participant 1, 2011)
Speaking about the importance of their own role in the process a participant discussed the
need for facilitation. A senior leader remarked,
I was a project manager not a decision maker. Sometimes I had to remind ‘are we doing
this or this’ or I would have felt the project was lagging behind. I made sure staff meeting
conversations were happening, kept on schedule, asked ‘where are we?’ And ‘do we have
progress?’ Tried to keep inching the progress forward and worked with [the
representative from COD] to keep things moving on schedule. (Participant 26, 2011)
In addition to the change agent, other participants addressed the importance of face-to-
face meetings to make decisions about the Dashboard effort (forty-seven of 136 total comments
within the information exchange code addressed this issue). A senior leader confirmed, “It’s
funny because I hadn’t thought about that, but the progress me made always occurred when we
sat down face-to-face” (Participant 26, 2011). A senior leader pointed out, “I thought the
[summer meeting where the first group presented to the second group] was a really important
turning point because with the first groups it was a real leap of faith…Now they heard it from
their peers” (Participant 32, 2011). A senior leader supported this thought,
When we had conversations about this and people had presented what they had found out
about themselves I think it was sort of infectious in that the other groups were
anticipating when they would become a part of this process and when they would become
tapped to do their own Dashboard measures. (Participant 26, 2011)
138
Other participants agreed that face-to-face meetings were important to moving the
Dashboard effort along. A director noted, “I think we really needed the face-to-face. We really
needed to bring in people’s opinions and I think that having that occur in a live environment is
much more effective” (Participant 1, 2011).
In addition to the change agent and the importance of face-to-face meetings, other
participants addressed the need for education about the Dashboard effort (twenty-five of 136
total comments within the information exchange code addressed this issue). Participants
describe the process of establishing and creating Dashboard measures and subsequent reports,
not the final numbers, was the valuable part. A senior leader explained their perception of staff
member reactions to the Dashboard effort,
Initially it was ‘Oh My God, something else to do that doesn’t have to do with my daily
work.’ It was an educational process to say ‘look this has directly to do with your daily
work and though it may take some time the whole point is to make your daily work more
efficient and more sensible.’ So that was an educational issue. (Participant 26, 2011)
Similarly, the senior leaders had thoughts along the same lines as the staff members. A
senior leader revealed
[When we] brought the first group of Dashboard indicators to [the Vice President] and
the seniors leaders meeting after [the department members had worked on them for] nine
months and the [Vice President] said, ‘That’s it? Why did this take so long? I could
have come up with this myself. I don’t see the point of this.’ He could have done this in
seven minutes. That’s what makes you a VP and all of that. [The representative from
COD] then needed to reeducate us that it’s not about this piece of paper. It’s the
conversations they had. It’s how they came to these. It’s the examination of what they’re
139
doing and why it works and so she had to reeducate the entire leadership group that the
real work invisible inside these bullet points that is real important and is the real goal of
this process – it’s about the process. (Participant 26, 2011)
Several participants noted that as their education about the Dashboard effort increased so
did their interest. A director explained, “As my knowledge grew and as the staff’s knowledge
about the process about the outcomes, as all that grew I think more and more people became
more enthused, if not excited and thrilled, about the whole process” (Participant 2, 2011).
Not all participants were satisfied with the education provided. Some perceived that
there was too much time for groups to come to a consensus. A senior leader pointed out, “It
needs to be simple out of the gate. People need simple instructions to follow and less time soul
searching. And they need a hard deadline” (Participant 28, 2011). Other participants never felt
fully relaxed with the process. A director stated, “I never quite go the gist of it. I never fully
understood it” (Participant 3, 2011). Similarly, another senior leader remarked,
None of us feels like we were particularly good at this. In some ways the process showed
me that it’s not rocket science. There is more common sense involved in this than you
would think. But I am left with the general feeling that there must be assessment
procedures and, you know, that I’m unaware of. I’ve never had a course in assessment.
I’ve never taken a stats course. I’m a humanities person. So I feel just a vague sense that
I ought to know more about this. And I think my staff feels the same. (Participant 29,
2011).
Yet other participants were unsure about the process. A staff member stated, “We were
not exactly sure what it was we were being asked to do” (Participant 10, 2011). A staff member
offered some advice,
140
I think I probably would just work on the communication. How am I delivering on this
information, about the changes going on in the University and the Dashboard initiative
with other staff and administrators and faculty at the University because for a lot of it, I
think it’s been kind of putting messages out there so everyone is just confused. Instead of
trying to come up with a concrete message or a complete message saying this is how
things are going to do, initially, and then kind of trickling down, because it happened
differently for different aspects of the University. So meeting with them – because
undergrad education has its own meetings so you kind of meet with them and just say this
is how things are going to go, this is how we envision it, things like that, I think things
would have gone much more smoothly. They would have had less resistance and things
like that. So I guess it’s just the delivery. (Participant 17, 2011)
Feedback.32
The code feedback emerged from the data where participants referred to information
about the status of the Dashboard effort from directors and senior leaders as “a resource for
attaining goals within an organization” (Ashford & Cummings, 1983, p. 373). Most participants
interviewed perceived that there was a lack of feedback about the Dashboard effort (thirty-six of
50 total comments within the feedback code addressed this issue). This left members feeling
frustrated and as if they had wasted much of their time which is a precious resource to them. A
staff member stated, “I didn’t get a copy” (Participant 18, 2011). Another staff member asked, “I
don’t know. I don’t know. Have we done that type of report? I have no clue” (Participant 11,
2011). A director stated, “I haven’t seen the results” (Participant 14, 2011).
A staff member declared,
32 Feedback was the tenth most addressed issue with 50 of 237 total comments from the outcomes theme and 1144 total comments from interview participants overall.
141
It would be a continuous conversation. Not just unveil it and then roll it up and then we
move on our merry way. Otherwise it’s futile. It doesn’t make any sense. It’s a waste of
time. I can’t be bothered. It doesn’t make sense. It’s not rational or logical to me. It’s
frustrating. (Participant 8, 2011)
Another staff member observed,
I don’t know. It’s like one of those things where I feel like okay someone from the top
tells you okay you need do X, Y, and Z because we need to do it, but then how it’s being
used and incorporated to better serve the students in our department or the vision within
the university? I don’t see it - I don’t see the information coming back full circle. I’d like
to think it’s positive for the University but again I don’t know. (Participant 11, 2011)
In addition to the lack of feedback, other participants addressed the importance of
feedback in a planned, organizational change effort such as this (thirteen of 50 total comments
within the feedback code addressed this issue). Some participants discussed the importance of
feedback during an effort such as the Dashboard. A staff member stated, “The more you hear,
the more it becomes less unfamiliar. More and more becomes a part of your conversation. Then
we won’t be so resistant” (Participant 7, 2011). The senior leader clarified,
If leaders then move on and fail to keep employees tuned into how important this thing
was and leaders quit talking about these things then they start to lose the benefit of these
things and then pretty soon someone could say well ‘gee that program wasn’t as effective
as we thought. Maybe we need something new.’ But the problem wasn’t the program it
was follow through and the communication. (Participant 31)
Similarly another senior leader pointed out,
142
It’s really important to identify more coaches who can provide regular and timely
feedback when directors are developing their goals. This was very important. This was
the most important improvement we could have. We had one person who was to be
available to give that feedback and it just wasn’t enough. It was high quality when we
had it but the periods in between were long and un, you know, people just had to wait in
line to get that help. (Participant 29, 2011).
Uncertainty.33
While much of the literature on organizational change in higher education indicates the
importance of providing clear direction and goals (Kezar & Eckel, 2002), the code uncertainty
that emerged from the data suggests that participants perceived that there was much uncertainty
surrounding the Dashboard effort. In particular, participants were unclear about the benefits of
the Dashboard effort (twenty-one of 45 total comments within the uncertainty code addressed
this issue). A staff member stated, “I think people’s attitude was really about disinterest to
frustration. How do we do this? And maybe shutdown because what does this have to do with
me? Why should I care” (Participant 8, 2011)? Relatedly a director commented that the added
benefit to the department was not made clear, “Speaking for our department…perhaps we didn’t
know what the additional benefit would be for us” (Participant 16, 2011). A senior leader
explains the value of conveying benefits of an effort such as this,
To someone such as myself who’s got kind of a bigger view it is really important to [staff
and department heads] and they benefit from that and if they didn’t know that then I think
that that would be a failing - a lesson learned about an important communication
component in this process that shouldn’t ever be missed which is to let the people down
33 Uncertainty was the eleventh most addressed issue with 45 of 237 total comments from the information exchange theme and 1144 total comments from interview participants overall.
143
in the trenches – and I’m referring to everybody but the senior people – really understand
the benefits that are derived from their work on this. It doesn’t just apply to the measures
it applies to things in general. If you ask people to do things and you know why they’re
important as a leader but they might not and you need to – I think a good leader is
continually finding ways to say ‘you know we asked you to do that and it really turned
out to be an important thing. It helped us. It helped you. It helped the reputation. It helped
secure resources and so on and so on.’ (Participant 31, 2011)
A senior director provides a compelling summary to understanding benefits of the effort,
From what I have heard [people didn’t understand the benefits of the Dashboard effort in]
all cases. And if it didn’t happen it’s a communication problem not a problem in the tool
because the potential for these outcomes is definitely there. If leaders didn’t find ways to
keep people involved and help them understand the benefits which often happens – not
everybody understands these – it sort of a breakdown in leadership communication and a
lesson that I increasingly and consistently learn. (Participant 31, 2011)
In addition to clarity of benefits, participants also questioned the sustainability of the
effort (nine of 45 total comments within the uncertainty code addressed this issue). A staff
member asked, “Will we be able to implement effectively? Do we have the tools and resources
to sustain and keep moving with it” (Participant 4, 2011)? Similarly a senior leader stated,
“Afterward everyone thought it was important and useful and we have to do this. Not sure if it
will continue" (Participant 26, 2011). A staff member indicated what they perceived others to be
thinking about the Dashboard effort by indicating,
They assumed it was [a] temporary focus. Will it really be an integral focus that is
sustained? I think that was something that was questioned – will we stick with it and
144
implement in terms of trying to evaluate these things and report on them. I feel like
people said its good but will the University maintain focus? Will my individual
department maintain this focus? (Participant 4, 2011)
In addition to clarity of benefits and sustainability of the effort, some participants were
unclear about the goals of the Dashboard effort (eight of 45 total comments within the
uncertainty code addressed this issue). A staff member provides a compelling example of these
perceptions, “To really have a much clearer outline of what it was and purpose and results and
kind of what would happen to it and how we would be contributing to that particular experience.
(Participant 10, 2011)
Similarly, a director revealed,
I’m always leery because I don’t understand – because my whole thing is when you do
these things, what is going to be your outcome? What do you really want to do? And
while we’ve done them, I’m not necessarily sure what the overall goal was. (Participant
21, 2011)
Other participants questioned the rationale behind their department being chosen to
participate in the early stages of the Dashboard effort, “Why did they choose the programs who
were already doing this? There are so many that are doing nothing. Why were we being targeted”
(Participant 13, 2011)?
In addition to clarity of benefits, sustainability of the effort and clarity of goals, some
participants were uncertain about how to proceed with the Dashboard effort (seven of 45 total
comments within the uncertainty code addressed this issue). Participants were interesting in
finding out more about the Dashboard effort; a description of what the Dashboard was, how they
should create the Dashboard and use the information. A staff member exclaimed, “How do we
145
do this?” (Participant 8, 2011). Another staff member stated, “The concepts are very
ambiguous” (Participant 6, 2011)
Promote the University.34
The code promote the University emerged from the data where participants referred to
ways the University could use information from the Dashboard effort as “advertising or
publicity” to the various constituents (Promote, n.d.). Participants interviewed perceived that the
Dashboard effort provided a means for the University to promote their programs to potential
students, parents and other constituents by providing positive examples of their work (five of
five total comments within the promote the university code addressed this issue). An example of
the perception of the way the Dashboard provides such promotion is exemplified by this director,
I believe that, and it’s impossible to know, whether a student decided to come
here…because of the Dashboard. But it does have that potential. I mean, I would say this
– that - and this is not a criticism or a flaw but just an observation - that clearly, it’s like
advertising…I think it’s the nature of Dashboards and it’s the nature of communication,
and you know publicity, advertising, marketing, whatever you might call it it’s just the
nature that, you know, those are gonna reflect the good things that are happening and not
reflect anything that needs major improvement. I’m not saying that’s a criticism of
Dashboards, that’s just the reality, and totally understand that I don’t, you know, any -
any negative aspects or aspects or criticisms of, you know, what we’re doing, we would
want to include that in any public setting. (Participant 2, 2011)
Similarly, other participants focused on admissions-related promotion. A staff member
explained,
34 Promote the University was the 18th most addressed issue with 5 of 237 total comments from the information exchange theme and 1144 total comments from interview participants overall.
146
Potentially, those types of results, the information can be used to promote the University
in a positive light in terms of how we assist in preparing our students for their life after
[graduation]. And I think that’s a, you know, higher education that has become really
important especially to parents. You know, we’ve noticed with a lot of…events and
things like that when parents come to visit and when they go on tours and when we have
information tables a lot of them are becoming, I think, a lot more aware of ‘okay If I pay
X number of dollars to send my student to [this University] what are you going to do for
that student? How are you going to help my son or daughter and basically is my son or
daughter gonna be able to get a job when they graduate? And again I think if we have
some qualitative data to back that up that can really help to mark and sell the University.
(Participant 9, 2011)
Influence Administration.35
The code influence administration emerged from the data where participants referred to
ways the information from the Dashboard effort could help them to have “power” over
administration’s decisions about their department (Influence, n.d.). Participants interviewed
perceived that results from the Dashboard effort have the potential to provide them with
information necessary to make their case to the administration as to why their department is most
deserving of increased assets (two of two total comments within the influence administration
code addressed this issue). A director explained,
It would have been successful from my perspective if I was able to use the Dashboard
measures to indicate to an upper administration where changes needed to be made, and if
I was able to influence the commitment to making those changes. (Participant 24, 2011)
35 Influence administration was the 19th most addressed issue with 2 of 237 total comments from the outcomes theme and 1144 total comments from interview participants overall.
147
The theme information exchange centers on five important segments: process, feedback,
uncertainty, promote the university and influence administration. Overall, participants
responding to the theme of information exchange focused on the process of the Dashboard
including the importance of facilitation, face-t-face meetings and education. In addition,
participants focused on the lack of and importance of feedback, the importance of everyone in
the organization understanding the benefits and goals of the effort, as well as the potential to use
the information from the Dashboard to promote the University to its constituents and to influence
administrators to provide increased assets to departments.
Analyzing the themes leadership issues and information exchange leads one to
understand that both themes represent the disappointments from each level of employee through
their experience with the Dashboard effort. The next chapter focuses on the analysis,
implications, limitations and future research.
Directors discussed the code influence administration twice as much as senior leaders and
staff members. Directors were more focused on positioning their department in a positive way to
encourage administration to provide them with increased assets.
The central issue found with the theme information exchange also applies to the theme of
leadership issues where there was a disparity about the amount of information being exchanged
about the Dashboard effort between the three levels of employees at the University.
148
CHAPTER 6
DISCUSSION AND IMPLICATIONS
The final chapter provides the following sections: a summary of the research questions; a
summary of the research findings by theme; implications for theory including an explanation of
the overarching theme of communication and a discussion about the comparisons and contrasts
of the findings within the three levels of employees in this organization; a comparison of several
models of change; implications for practice; and limitations of the research. Considerations for
future research are also included in this chapter.
The results of this research extends the knowledge in the field by exploring the impact of
a performance measurement system, the Dashboard, as the planned organizational change from a
communicative perspective which analyzes the similarities and differences between three levels
of employees in a large, public University – a system. The research is built on the 32 in-depth
interviews consisting of seven senior leaders, ten directors and 15 staff members.
Summary of Research Questions
The summary presented in this section of the study pertains to the research questions and
their sub-questions. As the analysis to this dissertation progressed the dissertation evolved
somewhat in focus and approach as is often the case with qualitative research. Initially the study
was to focus on the concepts of communication and culture. This focus provided to be too broad
and so the focus on communication became the primary focus, and attention to culture was
minimized. Secondly, during the interview stage the researcher discovered that viewed from the
participant point of view, parts of research questions one and two tap the same set of issues –
individual and organizational productivity and performance. To avoid duplication, all
information about individual and organizational productivity and performance is listed and
149
discussed in the section for responses to research question two as it relates to these issues of
individual and organizational performance.
Next, after the researcher did initial coding and analysis, she determined that the initial
coding scheme needed to be revised. This led to the renaming of some of the themes as well as
some refinement of codes to more clearly align with definitions of their themes. Finally, after
the researcher examined the five sets of responses to the interviews she found that based on the
similarity of responses to the interviews, there was no logical basis for treating them separately.
In fact the researcher believed that greater clarity would be realized by integrating the responses
together in a collective profile. Given that, this chapter begins with a summary of responses to
the original research questions and their sub-questions for the study, followed by a brief
summary of the thematic findings, then comparing and contrasting the similarities and
differences between the three levels of the organization, and then shifting to a focus on the
overarching theme that emerged.
Research question 1 – purpose of initiative.
The first research question of this study is: What are the perceptions of three
organizational levels of employees about the introduction and implementation of this
performance measurement initiative, and how do they understand the purpose of the initiative?
Overall, participants were not clear on the purpose of the initiative and as such most tried to
make sense of the purpose through previous experiences and cues from their environment.
As such, most participants within all three levels of employees interviewed perceived the
purpose of the Dashboard effort as a means of accountability to internal and external
constituents. Internal constituents included, but are not limited to, many employees such as
department members, senior leaders of the division, senior leaders of the University, other
150
departments, students and faculty. External constituents included, but are not limited to, parents,
community members, alumni, government officials and funding sources.
Some of the areas that all three levels of employees found particularly important were
issues of accountability such as being able to justify to internal and external constituents the
value of their department and the University. In addition, participants perceived that the effort
could help them to have a clear and concise way to show internal and external constituents the
effectiveness of their department and the University.
Research question 1 – value of initiative.
What are the perceptions of three organizational levels of employees about the
introduction and implementation of this performance measurement initiative, and how do they
assess the value of the initiative? Participants were asked to be specific in answering this
question as it relates to the following groups: individuals, their department, the Division of
Undergraduate Education and the University. Throughout interviews, the participants in most
instances preferred to answer this question “in general” because each level had little to no idea
what the value was to the levels other than their own. For example, staff members knew little to
nothing about how senior leaders might perceive the initiative. As such, staff members and
others like them were likely to answer the question “in general.”
Of those participants who responded from each level of employee, with regard to the
value of the Dashboard effort to the individual, organizational changes from the effort were
perceived to be the most important aspect. For the most part, participants perceived that the
Dashboard effort would provide individuals an opportunity for continuous improvement to their
programs and services.
151
For those participants who responded from each level of employee, with regard to the
value of the Dashboard effort to the department, the Division of Undergraduate Education and
the University, accountability was perceived to be the most important aspect. For the most part,
participants perceived that the Dashboard effort would provide departments an opportunity to be
transparent about the effectiveness of their programs and services to internal and external
constituents.
Participants who responded from each level of employee, with regard to the value of the
Dashboard effort in general, accountability was perceived to be the most important aspect. For
the most part, participants perceived that the Dashboard effort would provide departments an
opportunity to be transparent about the effectiveness of their programs and services to internal
and external constituents. In addition, staff members indicated that organizational changes of the
Dashboard effort were just as important because they perceive that they will be afforded an
opportunity to improve their programs and services.
Research question 1– impact of initiative on individual and organizational
performance.
What are the perceptions of three organizational levels of employees about the
introduction and implementation of this performance measurement initiative, and how do they
assess the impact of the initiative on individual and organizational performance? During the
interview stage the researcher discovered that viewed from the participant point of view, parts of
research questions one and two tap the same set of issues – individual and organizational
productivity and performance. To avoid duplication, all information about individual and
organizational productivity and performance is listed and discussed in the section for responses
152
to research question two as it relates to these issues of individual and organizational
performance.
Research question 1 – success of initiative.
What are the perceptions of three organizational levels of employees about the
introduction and implementation of this performance measurement initiative, and how do they
assess the overall success of the initiative? Participants at each employee level were positive
about the potential for the Dashboard effort to have success. Even though the majority of
participants stated they perceived that the Dashboard effort was not a success, most went on to
discuss that there was partial success. In most of these instances participants discussed the
increased employee awareness about assessment, and specifically the Dashboard. In addition,
participants perceived that the Dashboard effort was a success in bringing some improvements to
the departments. Some indicated that they had revised surveys and programs based on
Dashboard results. Others perceived that being able to increase their collaboration within their
department and throughout the Division of Undergraduate Education was a success from the
Dashboard effort.
Participants addressed lack of integration into the culture of the departments and the
Division of Undergraduate Education as one reason for perceiving that the Dashboard effort was
not a success. Other participants perceived that the Dashboard effort was short-lived. Many
participants perceived that the Dashboard effort started off strong but then quietly vanished.
Some directors even asked the researcher if they should be updating the Dashboard with year-
two data, and a senior leader indicated that the first groups to go through the effort were done
until the rest of the departments had a chance to go through the process for the first time.
153
Finally, other participants perceived that not many people were involved with or knew
that the Dashboard effort existed. In fact, four staff members from three different departments
randomly selected as a part of the interview sample had no idea what a Dashboard was and had
no idea the Dashboard effort existed on their campus and in their department. Further, one
department in this sample never completed the Dashboard effort.
Research question 2 – member attitudes toward measurement.
The second research question of this study is: How have the values (issues of most
importance and meaning inherent in the culture) played a role in this planned organizational
change initiative with regard to member attitudes toward measurement? Two of the four
educational support service departments (ESSD’s) studied as a part of this dissertation had
previous experience collecting and reporting data to external constituents. As a result, responses
to this question varied from senior leaders. For those ESSD’s with previous experience, senior
leaders perceived that there was minimal change in members’ attitudes toward measurement
from before to after the Dashboard effort was introduced and implemented. For ESSD’s with
little or no previous experience senior leaders perceived that there was some change. Senior
leaders perceived that these members feel some comfort knowing that the Dashboard effort
“wasn’t some monster-beast thought up by bureaucrats to waste their time” (Participant 30,
2011).
Directors and staff members were consistent with their perception that overall there was
no change to member attitudes. In the ESSD’s that had no or little previous experience with
measurement, participants perceived that some members initially thought it was just “more
work” and after completing the Dashboard effort found the information helpful to improve
154
programs. Other participants perceived that the Dashboard effort provided members with an
increased awareness about measurement.
Research question 2 – member motivation.
How have the values (issues of most importance and meaning, inherent in the culture)
played a role in this planned organizational change initiative with regard to member motivation?
Many participants discussed ways members of their department were already highly motivated
prior to the Dashboard effort. In addition, some participants found no correlation between
motivation and the Dashboard effort. A director provides a compelling example of this,
“Because I don’t think [the Dashboard effort] motivates people. I don’t feel motivated by that.
They’re motivated in making a difference and helping students and they feel like this is just a
bog down” (Participant 1, 2011).
Research question 2 – productivity36.
How have the values, or issues of most importance and meaning, inherent in the culture
played a role in this planned organizational change initiative with regard to member
productivity? Some participants, such as senior leaders, perceived that there was increased
productivity because the process of the Dashboard effort involved the creation of department
mission and goals. Further, the mission and goals would help department directors and staff
members to prioritize projects and focus on only those efforts that were directed toward the
mission and goals.
A majority of directors and staff members perceived that there was minimal impact on
productivity. In part, this lack of impact on productivity was explained as a result of the
36 During the interview stage the researcher discovered that viewed from the participant point of view, parts of research questions one and two tap the same set of issues – individual and organizational productivity and performance. To avoid duplication all information about individual and organizational productivity and performance is listed and discussed in the section for responses to research question two as it relates to these issues of individual and organizational performance.
155
perceived short-term focus of the Dashboard effort as well as the many employees who were
either uninvolved or not aware of the effort. Many participants (including some senior leaders)
discussed ways members of their department were already productive prior to the Dashboard
effort. In addition, some participants found no correlation between productivity and the
Dashboard effort. A staff member indicated, “I don’t think the Dashboard has anything to do
with in terms of what we do with productivity at all. I think it’s either individual or other factors.
It’s not anything connected to the Dashboard” (Participant 8, 2011).
Research question 2 – organizational values.
How have the values (issues of most importance and meaning inherent in the culture)
played a role in this planned organizational change initiative with regard to member
organizational values? Overall, within all three levels of employees there was consensus that a
project such as the Dashboard effort had some positive impact on values. A staff member
explained, “I think the value came from…having us stop and think and make sure that we were
doing everything we could or if we weren’t, how could we” (Participant 10, 2011). Many
participants within the three levels of employees also perceived that the Dashboard effort had no
impact on values.
Research question 2 – aspirations.
How have the values (issues of most importance and meaning inherent in the culture)
played a role in this planned organizational change initiative with regard to member aspirations?
For the most part, all three levels of employees within the University agreed that the Dashboard
effort had no impact on aspirations. Of those in the minority who perceived that there was some
potential impact on aspirations, being involved in the effort and seeing results are what they felt
made employees want to aspire to do more.
156
Research question 2 – morale.
How have the values (issues of most importance and meaning inherent in the culture)
played a role in this planned organizational change initiative with regard to member morale?
Directors and staff members perceived that the Dashboard effort had no impact on employee
morale. They believe that there were other issues happening at the University at the same time
as the Dashboard effort, such as layoffs and no salary increases, which impacted morale. Senior
leaders perceived that the Dashboard effort had a positive impact on employee morale in part
because the department members can use the information from the effort to make their work
more visible to the Vice President and other key administrative leaders. A senior leader’s
comments explain, “There was probably one Ah-ha! moment for each group…where people just
kind of lit up and thought ‘yeah this is really good stuff. I can really show people what we’re
doing” (Participant 32, 2011).
Research question 2 – work habits.
How have the values (issues of most importance and meaning inherent in the culture)
played a role in this planned organizational change initiative with regard to member previous
work habits? Across all three levels of employees within the University, responses to whether or
not the Dashboard effort had an impact on work habits was mixed. Most participants perceived
that there was some impact on work habits. Several participants stated that there had been
changes to the way they or their staff work as well as updates to surveys and programs. A staff
member explained, “Our staff is not carrying papers during workshops” (Participant 4, 2011).
Those participants who said there was a positive change to work habits cited the increase in
awareness of employees in general to know what to look for and collect for future assessment
purposes.
157
Research question 3 – role of communication.
The third research question of this study is: What was the role of communication in
facilitating and/or impeding this planned organizational change? Communication played a major
role in this study. As such the answer to this question is addressed in a section of this chapter
dedicated to the overarching theme of communication. The next section of this chapter discusses
each theme from the perspectives of the three levels of employees interviewed followed by
implications for theory and an explanation of the overarching theme of communication.
Summary of Findings by Theme
This section is a summary of the thematic findings of the study. Upon analysis of the
themes it appears that there is a correlation. The themes of accountability and organizational
outcomes represent what participants expected from the Dashboard planned change effort and as
such they are presented together in chapter four and together below. The themes of Leadership
and Information Exchange represent shortcomings of the planned change effort and are presented
together in chapter five and together below. The following summary is presented in the same
order as results chapters four and five, beginning with the theme accountability.
Accountability: Introduction.
Interpretations of the data sorted into the theme accountability describe how members
provide evidence to internal and external constituents about the impact of higher education
(Zumeta, 2011). Participants perceived that the Dashboard effort provided them with the means
to have accountability in four different areas: (a) transparency, (b) justify existence, (c) measure
results and (d) responding to national assessment trend.
Transparency.
158
The code transparency emerged from the data where participants referred to ways to
show “clear and accessible information about crucial aspects” of their department, the division or
the University for their various constituents (U.S. Department of Education, 2006). In particular,
participants were focused on providing access to their various constituents about University
programs and services, and showing how their department adds value and is meaningful to their
constituents. In addition, participants pointed out the importance of the Dashboard effort to help
increase their visibility by providing them with an outlet to create documents and tell their story
to their constituents about the impact of their programs and services.
Justify existence.
Participants remarked about ways the Dashboard effort validated the existence of their
job, the department, the division or the University as reflected in the code justify existence. In
doing so, participants discussed ways the Dashboard effort provided evidence to internal and
external constituents that the programs at this University do have a positive impact on students,
and resources are being used wisely to support these successful programs.
Measure results.
The code measure results emerged from the data where participants referred to ways to
“provide evidence about the impact” of their department, the division or the University to their
various constituents (Zumeta, 2011). Many interview participants discussed ways the Dashboard
effort helped them to evaluate whether or not their programs were valuable to their constituents.
In doing so, members provided evidence to constituents to help them understand department
goals and whether or not they successfully completed their goals. Participants also pointed out
the difference between using the Dashboard effort as a way to evaluate departmental goals versus
evaluation methods and anecdotes used previous to the effort. In addition, participants discussed
159
the importance of the Dashboard effort to provide a system of checks and balances to determine
whether or not their performance is clear and coordinated to meet goals.
Responding to national assessment trend.
The code responding to national assessment trend emerged from the data where
participants referred to ways to respond to requests from the public for increased accountability
and improvement from Universities (U. S. Department of Education, 2006; Zumeta, 2011).
Many interview participants discussed ways the Dashboard effort helped to satisfy national calls
for the transformation of accreditation processes and increased focus on student learning and
performance of universities (U. S. Department of Education, 2006). In addition, participants
discussed ways the Dashboard effort could help them with upcoming regional reaccreditation
based on the national call to make accrediting agencies use performance measures such as
student learning a critical piece in the process (U. S. Department of Education, 2006). These
discussions show participants focus of increased emphasis on assessment as well as promoting
accountability for the departments, the division and the University.
Organizational changes: Introduction.
Interpretations of the data sorted into the theme organizational changes describe how
members perceive a result or consequence of the Dashboard effort (Outcome, n.d.). The focus of
the theme organizational changes is about members perceptions of a result or consequence of the
Dashboard effort and centers on six important segments: continuous improvement, culture
change, increased awareness, increased network collaboration, redundancy and pride.
Continuous improvement.
The code continuous improvement emerged from the data where participants referred to
ways the Dashboard effort led to, or failed to lead to, “evaluation and achievement through the
160
analysis of work output” and using this evaluation to determine how to constantly advance work
output (Vakkuri & Meklin, 2003). During interviews, participants discussed ways the
Dashboard effort helped to identify and improve productivity and/or performance. In addition,
participants discussed ways the Dashboard effort clarified departmental mission and goals.
Finally, participants discussed the clarity the Dashboard effort brought to individuals in terms of
the personal fit within the organization which contributed to these individuals wanting to
improve their productivity.
Culture change.
The code culture change emerged from the data where participants referred to ways the
Dashboard effort could have made “alterations to employee values, behaviors and assumptions
that should lead to increased organizational performance” (Ogbonna & Wilkinson, 2003, p.
1152). During interviews many participants discussed their perceptions that the Dashboard
effort did not have an impact on employee values, behaviors and assumptions. Many other
participants perceived that the Dashboard effort did have a small impact on employee values,
behaviors and assumptions. These participants cited some of the changes made within their
department as a result of the Dashboard effort. Other participants discussed that there was no
impact on employee values, behaviors and assumptions associated with the Dashboard effort.
These participants perceived that members used the same information before and after the
Dashboard effort, but in a different manner. Finally, a few participants were not sure whether
“alterations to employee values, behaviors and assumptions” have occurred because it’s possible
that the program has not been in existence long enough to tell (Ogbonna & Wilkinson, 2003, p.
1152).
Increased awareness.
161
The code increased awareness emerged from the data where participants referred to ways
the Dashboard provided greater knowledge than they previously had about assessment
(Awareness, n.d.; Increased, n. d.). Throughout interviews, participants discussed ways the
Dashboard effort helped members to have greater knowledge about how assessment fits into
their daily jobs, to have greater knowledge about assessment in general and to provide members
with an increased comfort level with assessment.
Increased network collaboration.
The code increased network collaboration emerged from the data where participants
referred to ways the Dashboard effort resulted in ‘linking different groups of” employees to gain
improved understanding, engagement and goal setting (Vakkuri & Meklin, 2003, p. 752).
Participants remarked that the Dashboard effort provided them a means to come together with
others in the University for meaningful discussions and collaborations about departmental
objectives and priorities. In addition, participants stated that the Dashboard effort helped them to
meet and learn about others within the university which in turn allowed them to collaborate
across departments and disciplines within the University.
Redundancy.
The code redundancy emerged from the data where participants referred to ways the
Dashboard effort was “superfluous repetition or overlapping” to current activities (Redundancy,
n.d.). During interviews participants discussed the indicators from the Dashboard effort as
identical or similar to indicators department members used prior to the effort. In addition,
participants discussed ways members of their department were already productive and motivated
prior to the Dashboard effort. Also, some participants found no correlation between motivation,
productivity and the Dashboard effort.
162
Pride.
The code pride emerged from the data where participants referred to ways the Dashboard
effort provided members with a “pleasure or satisfaction taken in something done by or
belonging to oneself or believed to reflect credit upon oneself” or the group (Pride, n.d.). During
interviews participants discussed ways the Dashboard effort provided recognition of
accomplishments which in turn helps to increase employee pride in themselves as well as their
department, division and the University. In addition, some participants addressed that many
employees, in general, have an existing high work ethic in which they have pride.
Leadership Issues: Introduction.
Interpretations of the data sorted into the theme leadership issues describe how members
perceive the presence, or lack thereof, of a “pledge or obligation” from leadership towards the
Dashboard effort (Commitment, n.d.). The theme leadership issues centers on six important
segments: short term momentum, issues of priority, people unaware of the effort, skepticism,
resources and other extenuating circumstances.
Short term momentum.
The code short term momentum emerged from the data where participants referred to
ways the “driving power or strength” (Momentum, n.d.) of the Dashboard effort lasted only for a
“limited period” of time (Short Term, n.d.). Leaders need to make clear their confidence and
commitment to the planned change effort through efforts to instill a “sense of urgency” in others
about the effort’s vital importance to the “future of the institution” (p. 12, Guskin, 1996; Gersick,
1991). Many participants perceived that the Dashboard effort lost momentum or stalled early on
in the process. Some participants even perceived that the Dashboard effort was complete, while
others perceived that initially there was some positive impact, but it was fleeting. Several
163
participants attributed the short term momentum of the Dashboard effort to its origin as a
mandate and others to its poor timing. These observations point directly to perceived issues with
leadership by the participants.
Issues of priority.
The code issues of priority emerged from the data where participants referred to ways the
leadership either gave consistent, persistent attention to the Dashboard effort, or failed to do so
(Burke, 2008). While much of the literature on organizational change in higher education
indicates the importance of leadership to be consistent, persistent and continuously a topic of
discussion (Burke, 2008), the code issues of priority that emerged from the data suggests that
participants perceived that there were competing priorities that won out over the Dashboard
effort. In addition, participants were looking for leadership to reinforce the priority of the
Dashboard effort through discussion, incentives and rallies.
People unaware of the effort: participation.
The code people unaware of the effort emerged from the data where participants referred
to ways stakeholders such as staff members were unaware or uninvolved with the Dashboard
effort (Kezar & Eckel, 2002). A review of the literatures confirms that participation in a planned
change effort is an extremely important part of the planned change process (Smulowitz, 2013;
see also Lewis & Russ, 2011). Participants were most concerned that staff members who are
dealing with the day-to-day activities of the department and who directly serve the constituents
were not involved with the Dashboard effort. Other participants were concerned that there were
staff members who were not even aware that the Dashboard effort existed. A few members
perceived that staff members were aware of the Dashboard effort.
Skepticism.
164
The code skepticism emerged from the data where participants referred to their mistrust
about the information collected for the Dashboard (Vakkuri & Meklin, 2003). In particular,
participants questioned the usefulness of the information collected to their department’s benefit.
In addition, participants questioned the objective for the Dashboard effort. Finally, participants
questioned whether or not the Dashboard effort was a fad. These perceptions about the mistrust
of the Dashboard effort is directly linked to perceptions of leaders’ priority and commitment to
the effort.
Resources.
The code resources emerged from the data where participants referred to “support
structures” to aid members with work related to the Dashboard as well as other activities which
will in turn help protect them from cutbacks” (Kezar & Eckel, 2002, p. 300). Participants were
most concerned with resources to improve the Dashboard effort. In addition, participants were
concerned with resources related to department programs and services that would, in turn, help
protect the department from cutbacks.
Other extenuating circumstances.
The code other extenuating circumstances emerged from the data where participants
referred to ways organizational members became “distract[ed] from the planned, change effort”
(Kezar & Eckel, 2002, p. 299). Participants became distracted by staffing issues, their concerns
for job security and lack of salary increases over several years.
Information exchange: Introduction.
Interpretations of the data sorted into the theme information exchange describe how
members perceive the focus on the exchange of information about the Dashboard planned
change effort. Participants perceived information from and about the Dashboard in five key
165
areas: (a) process, (b) feedback, (c) uncertainty, (d) promote the university and (e) influence
administration.
Process.
The code process emerged from the data where participants referred to “a series of
actions or operations conduct[ed] to [achieve the Dashboard effort]” (Process, n.d.). In
particular, most participants addressed the change agent, or person who “helps to bring about an
outcome” to the Dashboard effort. Other participants addressed the importance of face-to-face
meetings to make decisions, and others addressed the need for education about the Dashboard
effort.
Feedback.
The code feedback emerged from the data where participants referred to information
about the status of the Dashboard effort from directors and senior leaders as “a resource for
attaining goals within an organization” (Ashford & Cummings, 1983, p. 373). In particular,
most participants addressed the lack of feedback about the Dashboard effort. Other participants
addressed the importance of feedback in a planned, organizational change effort such as this.
Uncertainty.
While much of the literature on organizational change in higher education indicates the
importance of providing clear direction and goals (Kezar & Eckel, 2002), the code uncertainty
that emerged from the data suggests that participants perceived that there was a lack of clarity
surrounding the Dashboard effort. Participants were also unclear about the benefits of the
Dashboard effort. Some participants questioned the sustainability of the effort; others were
uncertain how to proceed.
Promote the University.
166
The code promote the University emerged from the data where participants referred to
ways the University could use information from the Dashboard effort as “advertising or
publicity” to the various constituents (Promote, n.d.). Participants interviewed perceived that the
Dashboard effort provided a means for the University to promote their programs to potential
students, parents and other constituents by providing positive examples of their work
Influence administration.
The code influence administration emerged from the data where participants referred to
ways the information from the Dashboard effort could help them to have “power” over
administration’s decisions about their department (Influence, n.d.). Participants interviewed
perceived that results from the Dashboard effort have the potential to provide them with
information necessary to make their case to the administration as to why their department is most
deserving of increased assets.
Implications for Theory
General systems theory provides a very helpful theoretical framework for conceptualizing
planning organizational change—and more generally, human change-- and the role of
communication in these processes (Bertalanffy, 1950; Thayer, 1968; Ruben, 1983). According
to Ruben and Stewart (2006), “communication is the essential life process through which
animals and humans create, acquire, transform, and use information to carry out the activities of
their lives” (p. 56).
The notion of open systems is a fundamental concept within the systems theory
paradigm. Open systems are defined as living systems that “exist only through continual
exchanges with the environment” (Bertalanffy, 1968, p. 32). It is through these continual
exchanges of matter-energy and information with the environment that living or open systems
167
create what it is to be ‘their’ system through the processes of disruption, and restoration
(Bertalanffy, 1975; Miller, 1965; Ruben 1983; Thayer, 1968). Drawing on the concept of open
systems, the organization analyzed in this study can be viewed in this perspective as an open
system made up of subsystems, or various levels of analysis, (the division of undergraduate
education, as well as the three layers of employees studied here) which have functions and
boundaries in their own right. Communication and information processing are important at each
level and also in interactions between levels (Ruben, 1979; Ruben & Kim, 1975; Ruben &
Stewart, 2006; Thayer, 1979).
Open systems generally operate in such a way as to seek a harmonization or homeostatis,
(Miller, 1965; Bertalanffy, 1975) with the environment. From a systems point of view, planned
change can be seen as purposeful efforts to change the dynamics of the system – and therefore
involve disruption to the harmony of a system or subsystem. The disruption and subsequent
efforts to restore harmony, by definition, involve communication and information processes.
The systematic processes of disruption and restoration occur through communication and
information processing. It is through these processes that members of a system or subsystem co-
create the restored version of the system or subsystem – just as they originally co-created their
original system through their social structure (Berger & Luckmann, 1967; Burr, 2003) to enable
organization and functionality.
It is at the point of disruption to harmony with the systems, or three levels of employees
within an institution of higher education, that the current study sought to analyze. The current
study examined these layers of employees to better understand the impact of communication on
the planned change effort.
168
Lewis’ (2007) organizational stakeholder model of change implementation and the role
communication plays in this process is very consonant with the systems approach because of its
emphasis on interacting and mutually influencing open subsystems—in this dissertation the
subsystems consist of the three levels of employees within an institution of higher education—
which interact to play a dynamic role as the disruptive and restorative forces of change take
place.
The overarching theme: communication.
Communication and information processing enable the implementer of the planned
organizational change to base the “implementation communication strategy selection and
enactment” on elements such as their “perceptions of change context” or “institutional factors”
(Lewis, 2007, p. 181). These decisions affect “stakeholders’ perceptions, concerns, assessments
[of other stakeholders], and interactions [between other stakeholders and implementers, and at
the same time stakeholders’ reactions reciprocally affect] implementer strategies” (Lewis, 2007,
p. 181). These continual give-and-take exchanges (Bertalanffy, 1975; Miller, 1965; Ruben,
1983; Thayer, 1968), or negotiated meaning of messages (Weick, 1979; Westley & MacLean,
1970) continue as members of the organization seek to make sense (Weick, 1995, 2001) of
information to recreate relationships between members of the organization and the environment
as well as reestablish boundaries to create harmony once again through these social systems
(Berger & Luckmann, 1967). Therefore, it is the interaction between stakeholders of the
organization (such as leaders, change agents and other organizational members) that will in part
determine the result of the planned change effort (Lewis, 2007). It is through this interaction that
organizational members make sense of the planned organizational change and recreate their
reality (Berger & Luckmann, 1967; Lewis, 2007, Weick, 1995).
169
Taking into account the perceptions of several layers of organizational members of this
large-scale, planned organizational change provides for greater understanding of the change
process because the different perspectives allow examination of the same phenomenon from
many different viewpoints (Gallivan, 2001). Specifically, this study sought to understand from
the perspective of several layers of organizational members the way the planned organizational
change was introduced and implemented. These findings will elicit a better understanding of the
value of performance measurement, and specifically the Dashboard, in higher education, as well
as providing insight on the multiple perspectives about planned change efforts.
The role of communication among three levels of employees within the Institution.
The central issue in this study is the failure of leaders to pay attention to the
communication environment. This involves the inattention to the messages created and the
process of those messages flowing to and from others in the organization. Other leadership
shortcomings included a lack of information exchange and a lack of monitoring sensemaking
among others in the organization.
Recall that communication is “the processing and transformation of information by a
living system in order to adapt to and adapt its environment” (Ruben, 1983, p. 138). Further,
communication “refers to the ways in which people create, convey, select, and interpret the
messages that inform and shape their lives – including how they promote, accept, and/or resist
change” (Ruben, 2009a, p. 20). Communication is a means by which social interactions occur
and it is through these social interactions that organizational members produce and reproduce
their social reality as well as the way that organizational members understand and materialize
organizational change efforts (Ford & Ford, 1995; Poole, 2009). “Change is created, sustained,
and managed in and by communications” (Ford & Ford, 1995, p. 560). Thus, it is the interaction
170
between members of the organization, in this study between the three levels of employees of the
organization, that “in part” affect the outcomes of the planned organizational change effort
(Lewis, 2007).
Also implied is the importance of differentiating between information flow and
information strategy on the one hand versus communication processes and outcomes on the
other. The former has to do with purposeful, intentional message sending and the latter with
sensemaking and the sense people make of the messages and situations they encounter and their
interpretations of them. As the following paragraphs will show, the two concepts are closely
linked.
Reviewing the perceptions of the three levels of employees within the organization, there
appears to be a great disparity in focus on many issues. The first hint of this disparity stemmed
from an analysis of the theme accountability. Out of the four main concepts in this theme, three
of them (transparency, justify existence and responding to national assessment trend) were
discussed two to three times more by senior leaders than by directors and staff members.
Conversely, directors and staff members discussed the concept of measure results twice more
than senior leaders.
A close review of participant transcripts pertaining to these issues shows a vast difference
in the perception of the senior leaders compared to directors and staff members about the
audience and goal of the Dashboard effort. While senior leaders were concerned with Dashboard
indicators that showcased the strengths of their division as a defense to external constituents,
directors and staff members were more concerned with Dashboard indicators that could help
with internal improvements to their departmental operations and effectiveness.
171
A second hint of the disparity between the three levels of the organization stemmed from
the theme organizational changes. Out of the six main concepts in this theme, three of them
(culture change, network collaboration and redundancy) were discussed one-and-a-half to four
times more by directors than by senior leaders and staff members. Conversely, staff members
discussed another concept of this theme, continuous improvement, twice more than directors
and one-and-a-half times more than senior leaders. The final concept of this theme, increased
awareness, was discussed by senior leaders twice more than directors and one-and-a-half times
more than staff members.
A close look at participant transcripts pertaining to these issues shows a vast difference in
the perception of the senior leaders compared to directors and staff members about the
understanding of the goal(s) of the Dashboard effort. While senior leaders were concerned with
increasing awareness among directors and staff members, staff members were concerned with
continuous improvement. Directors were more concerned with the ability of the Dashboard
effort to increase their network collaboration and enact culture change within their department.
Directors were also most concerned with issues of redundancy. Some directors explained that
because they already collect similar data there was an outlay of labor to transfer the information
into a new format. Others were concerned that because their department was part of the first four
groups to use the Dashboard indicators, they were being “targeted.”
The perspectives of participants for the themes of accountability and organizational
changes also reflect a disparity between employees in different levels of the organization in
terms of their understanding of the goals and expectations for the Dashboard effort. As members
of the organization undergo a disruption to the harmony of their system when a planned change,
such as the Dashboard effort, occurs, they use communication and information processing to
172
help them co-create the restored version of their system (Berger & Luckmann, 1967). In
addition, leaders and change agents can use communication and information processing to plan
the message strategy and or information flow to the other members of the organization (Lewis,
2007). In turn, these messages affect the sensemaking and interpretations of the messages of
other members in the organization (Lewis, 2007). This is a back-and-forth negotiation of the
meaning of messages between leaders, change agents and others in the organization (Bertalanffy,
1975; Miller, 1965; Ruben, 1983; Thayer, 1968; Weick, 1979, 1995; Westley & MacLean,
1970). It is this interaction between the three levels of employees within the institution that can,
in part, affect the outcome of the Dashboard effort (Lewis, 2007). The lack of corrective
messages from leaders about the goal(s) of the Dashboard effort led members to believe that
their interpretation of the goal(s) was the correct one.
Examining the communication environment, with the concepts in the theme information
exchange and leadership, helps to understand this disparity in greater detail and also shows some
tension throughout the themes that emerged from this study (See Table 6 for a graphic of the
relationship of communication to the themes). Staff members and directors were one-and-a-half
more times likely to discuss their uncertainty within the information exchange theme about the
Dashboard effort than were senior leaders.
A close review of participant transcripts pertaining to this issue shows a difference in the
perception of the directors and staff members versus the senior leaders about the reason and
goal(s) of the Dashboard effort. Specifically, directors and staff members commented that they
were unclear as to why the Dashboard effort was implemented. In addition, they were unclear
about the expectations for the Dashboard effort.
173
The concept of feedback was discussed by staff members nearly four times as much as
directors and three-and-a-half times as much as senior leaders. Looking closely at participant
transcripts pertaining to this issue shows a difference in the perception of the staff members
versus the senior leaders and directors about the amount of information exchange surrounding
the Dashboard effort. Staff members who were more involved and aware of the effort were the
most vocal about the lack of feedback. They were extremely concerned about the time they
spent collecting data for the Dashboard effort and wanted a confirmation as to whether or not
their time spent was useful or wasted.
Involvement and awareness about the Dashboard effort is a part of the leadership theme
which also relates to understanding the perceived lack of information flow. The greatest
disparity between members in different organizational levels came from this concept. Staff
members were eleven times more likely and directors were seven times more likely to discuss
issues of organizational members who were either unaware or uninvolved with the Dashboard
effort. Senior leaders barely mentioned this concept. This was a topic of high focus on the
criticisms of leadership. Perhaps this could be explained as another failure of information flow
and exchange as senior leaders may have expected the directors to involve and keep their staff
aware of the Dashboard effort.
Priority was another concept in the leadership theme related to participant sensemaking.
Senior leaders and directors discussed issues of priority more than twice as much as staff
members. A closer look at participant transcripts pertaining to this issue shows a difference in
the idea about priority for the staff members versus the senior leaders and directors. The
criticism of leadership was that the Dashboard effort was not kept as a priority and therefore
understood as urgent by other organizational members. Most senior leaders also had this
174
complaint. Most members didn’t understand the benefit of the Dashboard effort; they viewed it
as an obstacle that got in the way of their “real” work, making the Dashboard effort a lower
priority for them.
Related to the issue of priority is the concept of short term momentum. Directors were
one-and-a-half times more likely as staff members and two-and-a-half times more likely than
senior leaders to discuss short term momentum. Looking closely at the transcripts, directors and
staff members state that the Dashboard effort began with gusto and then just fizzled out. As a
result they were left wondering whether or not they had wasted their time. In addition, they were
unsure if the Dashboard effort had ceased or if they should continue to collect data for year-two
reporting purposes.
Further, resources were discussed one-and-a-half times more by directors and staff
members than senior leaders. A closer look at participant transcripts revealed the major concern
of directors and staff members was with regard to resources that they perceived would enable
them to successfully collect and analyze data for the Dashboard indicators. Senior leaders also
expressed this concern, but not as often.
Directors were nearly twice as likely as senior leaders and staff members to be skeptical
about the Dashboard effort. Transcripts show that they were concerned that the effort would
divert staff and department resources away from their primary responsibilities toward something
that would not prove fruitful in the end. Diversions for staff members in terms of other
extenuating circumstances such as a lack of salary increases and staffing issues were highlighted
more than one-and-a-half times as much than by senior leaders and directors. Perhaps this is
because employees at this lower level in the organization aren’t as attuned to some of the other,
175
more pressing concerns. Or perhaps employees at this level are already being asked to perform
at a high rate, and may rely more on paycheck-to-paycheck to get by.
The perspectives of the participants for the themes of leadership and information
exchange suggest some of the reasons why there is such disparity between employees in different
levels of the organization in terms of their understanding of the goals and expectations for the
Dashboard effort. To co-create a restored version of their system, members rely on
communication and information processing (Berger & Luckmann, 1967). In this study, most
participants perceived that information about the Dashboard effort came to a halt. This lack of
information provided members with an unintentional cue from leaders that the Dashboard effort
either stalled or had ceased. In addition, members found other unintentional cues from leaders
such as a perceived lack of priority, urgency, resources, feedback, momentum, awareness and
involvement of other members of the organization.
The culmination of these environmental cues aided most organizational members to
process this information as they tried to make sense and interpret the situation surrounding the
Dashboard effort. As such, most organizational members assumed the Dashboard effort was
stalled or ceased and as a result there was a lack of action on their part and a lack of corrective
messages from leaders which reinforced their interpretation of the Dashboard effort as having
failed.
The tensions here lie in the themes. While the themes accountability and organizational
outcomes represent the expected outcome for each level of employee, the themes leadership and
information exchange represent barriers to success. For instance, some senior leaders expected
the Dashboard effort to yield results they could use to defend their division to external
constituents, perhaps accrediting bodies or the government. Similarly, some directors and staff
176
members expected the Dashboard effort to produce results they could use internally to improve
the operations of their departments. A few of these results were realized; some Dashboard
indicators were published in an online format for external constituents to see and some changes
were made to programs and assessment forms in the departments. However, many participants
commented that the issues of leadership and information exchange prevented a full-scale effort
toward making the best use of the Dashboard effort.
Another apparent tension relates to transparency and a lack of awareness by those who
were uninvolved with the effort. While much focus was on capturing, displaying and getting
Dashboard information onto the public web site for external constituents to view, little focus and
energy was spent on making people inside the organization aware of and involved in the effort.
In fact, the concept of invisibility is striking given the time some participants spent discussing
the Dashboard effort as a way to promote visibility of the University, the division and the
departments.
A third tension in the study is that of a mandate to complete the Dashboard effort, yet the
leadership commitment was lacking. Many participants stated that the Dashboard effort was the
result of a mandate. When asked why they were completing the effort one senior leader replied
that they were told to do so. While the language varied, the sentiment of the mandate was
persistent in participant comments. In fact the Vice President reported that the motivation for
organizational members to complete the Dashboard effort “came from the top.” Mandating
change can lead to a difficult path for employee acceptance and institutionalization of the change
(Klein & Sorra, 1996). A practical issue for mandating change, especially in loosely coupled
systems, is that such mandates might not only uninspire “local managers,” but they may also
lessen their understanding of the key reasons that particular change effort was chosen (Klein &
177
Sorra, 1996). Further, the combination of uninspired managers and a lack of leadership are most
certain to be lethal to any planned change effort.
Finally, the tension between faculty and staff cultures is to be noted. While most of the
participants in this study were staff members, some of the senior leaders were faculty members.
As noted early in the dissertation there are many distinct differences between the two cultures. A
major difference is the perspective of each about the “core values” of the institution which lead
to further differences in “priorities, work styles and work schedules” (Ruben, 2009a, p. 24).
Other differences in perspective include language and decision making styles. All these
differences may have contributed toward the lack of leadership and information exchange in this
study. These tensions are only speculative and should therefore, be tested further.
Models of planned organizational change and this case study.
Earlier in chapter two several models of organizational change were outlined. This
section of the dissertation will detail each of these models along with the perspectives gleaned
from participants in this study. The models begin with the need for planning (Ruben, 2009a) and
gauging the organizational capacity to mobilize (Weisbord, 1987). These models speak to the
need for determining the reason, goals and vision for change, identification of those areas where
change is required, preparing and completing plans for action (Tromp & Ruben, 2004), assessing
the leaders’ and others’ commitment and energy as well as the business reasons to make the
change (Weisbord, 1987). A review of the findings from this study indicate that while there may
very well have been a planning stage, the lack of information exchange prevented most
participants from understanding the reason, goals and vision for change and the business reason
to make the change.
178
The next stage of change from this combination of literatures appears to be when the
members of the organization see the need, priority and urgency for change. This stage is similar
to Lewin’s (1945) unfreeze stage, Lippit, Watson, and Westley’s (1958) development of a need
for change, Ruben’s (2009a) attention stage and Armenakis and Harris’ discrepancy belief.
These models share the importance of awareness on the part of the organizational members that
there is a need for the organization to change. To get to this stage, researchers admit there is
much work for change agents and leaders to do. Likewise, crafting specific and consistent
messages about the need for change is vital to acceptance of the planned change effort by
organizational members. In this study, it appears that most participants, even senior leaders,
were open to the need to change. However, there was a consistent lack of information exchange
from leaders that there was an urgent need for the Dashboard effort and that the effort should be
placed high on the priority list. The unintended effect of this lack of information exchange was
that the other organizational members followed through with the same lackluster sense of
urgency about the Dashboard effort.
Engagement (Ruben, 2009a) or involvement (Armenakis & Harris, 2009; Lippitt, Watson
& Westley, 1958; Weisbord, 1987) are terms used throughout these literatures to describe the
third stage of change. Researchers agree that the more organizational members are involved in
the change process, from defining goals to choosing a change strategy, the more likely they are
to support the program and see it through to fruition. Further, involving organizational members
throughout the change process also increases the likelihood that they will share in the beliefs that
they can accomplish change (efficacy), that the appropriate change strategy was chosen
(appropriateness), that there really is a need for change (discrepancy), and that even though the
implementation of the change effort may be difficult it will bring them benefits (valence)
179
(Armenakis & Harris, 2009). A close look at the findings from this study indicate that there
were very few organizational members involved with the planning and strategies for the
Dashboard effort. In fact, one of the loudest complaints from directors and staff members was
that many organizational members were either unaware or uninvolved with the Dashboard effort.
The fourth stage of change discerned from a combination of these literatures is
commitment. There is an established commitment on the part of leaders and other organizational
members to support not only the change that’s needed, but the specific change strategy chosen
(Armenakis & Harris, 2009; Ruben, 2009a). Further organizational members will be committed
with the belief that they can make the changes needed and that the changes will benefit them
ultimately (Armenakis & Harris, 2009; Ruben, 2009a). Leadership in this study appeared to
have a lack of commitment to the Dashboard effort from the perspective of the participants.
Furthermore, many organizational members perceived that they did not have the ability to make
the changes required to complete the Dashboard effort properly.
Action is the fifth stage of change and infers the implementation of the change effort.
For this to take place organizational members must hold the five beliefs (Armenakis & Harris,
2009): discrepancy – the change is necessary; appropriateness – the strategy chosen is the right
one; efficacy – it is possible for organizational members to make the change; principal support –
leadership is supportive; and valence – there is a benefit for organizational members.
Researchers indicate that the action stage is the implementation, or where organizational
members are working toward a change (Lippitt, Watson & Westley, 1958; Lewin, 1945; Ruben,
2009a). All four of the educational support service departments (ESSD’s) in this case study
began the Dashboard effort, although not all of them completed the indicators.
180
A review of the five beliefs will be helpful to understand potential reasons for this lack of
persistence for all the ESSD’s (Armenakis & Harris, 2009). In this study not all members had
discrepancy, the belief that change was necessary. However, many of the participants remarked
that they were very open to trying new programs in an effort to continuously improve their
services. A few participants questioned the Dashboard effort as the chosen change strategy, but
none challenged its appropriateness. Most participants did not have efficacy – the belief that
they could make the changes necessary for the Dashboard effort. Many participants were
concerned because they felt they lacked expertise, such as statistical skills, to contribute to the
Dashboard effort. A majority of participants expressed the concern that the effort lacked
principal support from their leaders. However, most participants perceived that they did receive
principal support from the change agents, although they desired more. Many participants did not
experience valence – the belief that they will benefit from the results of the Dashboard effort. In
fact, most participants remarked that they were unsure of the benefits and many were scared that
the results from the Dashboard effort would be used against them. While some participants saw
a discrepancy and most did not challenge the appropriateness of the Dashboard effort as the
chosen change strategy, the other three beliefs (efficacy, principal support and valence) were not
met. This could provide evidence as to some of the key indicators that the Dashboard effort
would fail.
Integration or institutionalization is recognized as the sixth stage of change. Researchers
indicate that this is the stage where the change effort becomes integrated into the culture or way
of doing things in the organization and is similar to Lewin’s freeze stage (Lippit, Watson &
Westley, 1958; Ruben, 2009a; Weisbord, 1987). Armenakis & Harris’ (2009) five beliefs are
also expected to help move the process to this stage.
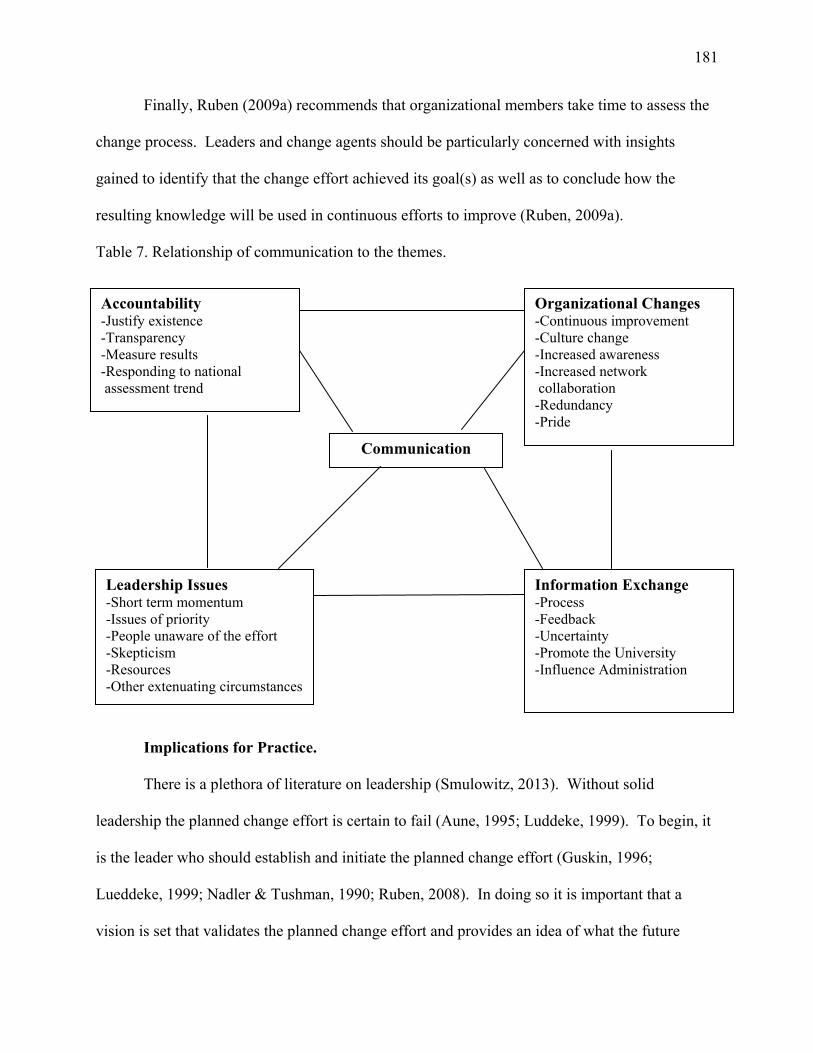
181
Finally, Ruben (2009a) recommends that organizational members take time to assess the
change process. Leaders and change agents should be particularly concerned with insights
gained to identify that the change effort achieved its goal(s) as well as to conclude how the
resulting knowledge will be used in continuous efforts to improve (Ruben, 2009a).
Table 7. Relationship of communication to the themes.
Implications for Practice.
There is a plethora of literature on leadership (Smulowitz, 2013). Without solid
leadership the planned change effort is certain to fail (Aune, 1995; Luddeke, 1999). To begin, it
is the leader who should establish and initiate the planned change effort (Guskin, 1996;
Lueddeke, 1999; Nadler & Tushman, 1990; Ruben, 2008). In doing so it is important that a
vision is set that validates the planned change effort and provides an idea of what the future
Communication
Leadership Issues -Short term momentum -Issues of priority -People unaware of the effort -Skepticism -Resources -Other extenuating circumstances
Organizational Changes -Continuous improvement -Culture change -Increased awareness -Increased network collaboration -Redundancy -Pride
Information Exchange -Process -Feedback -Uncertainty -Promote the University -Influence Administration
Accountability -Justify existence -Transparency -Measure results -Responding to national assessment trend
182
might hold given success with the change effort (ASHE-ERIC, 2001; Guskin, 1996; Lewis,
Schmisseur, Stephens & Weir, 2006). A challenge with the Dashboard effort in this study is that
setting the vision was not a priority. The change agent from the Vice President’s office
addressed this as a concern and a failure.
Creating a vision of the future necessitates confidence by the leader in the methods
chosen to get there, for example, a Dashboard. The leader needs to exude this confidence with
others in the organization (Guskin, 1996) and this confidence is a requirement for showing
leadership commitment to the planned change effort (Lewis, et al., 2006). A lack of clarity of
goals of the planned change effort was cited as having a negative impact on the change effort
itself (Colvin & Kilmann, 1990). Further, Ford and Ford (1995) claim that this lack of clarity on
goals, or vision, produces a “failure to create a shared understanding among participants to
produce a clear statement of the conditions of satisfaction for the change” (p. 557).
Several participants in this study addressed the hesitance, and at first skepticism, of the
senior leadership group for the Dashboard effort. Participants stated that they perceived that the
senior leaders, including the Vice President, were willing to complete the Dashboard effort, but
had to “see it to believe it” and were concerned that the effort would end up causing more work
for members without adding value. This sort of “‘wait and see’ attitude [stems from a lack of]
trust in the new system” (Kezar, 2005, p. 653).
Leaders should become adept at telling stories about the vision, values and meaning of
the planned change effort as well as stories about successes along the way (Bolman & Deal,
1991; Simsek & Louis, 1994). In this study most of the initial four educational support service
department’s (EDDSs) Dashboard indicators were represented on the division’s web site.
However, most participants noted that they didn’t know what the other ESSD’s were doing,
183
whether or not the other ESSD’s had completed their Dashboard indicators and in some instances
didn’t know whether or not their own departmental Dashboard indicator was completed. Giving
meaning to the planned change effort is viewed as a more effective leadership strategy than
focusing on vision alone as it allows for sensemaking (Bolman & Deal, 1991; Simsek & Louis,
1994).
By gathering information through information exchange (such as stories about the vision)
stakeholders try to reduce uncertainty and gain control (Kramer, Dougherty & Pierce, 2004;
Lewis & Seibold, 1996). The lack of clarity by participants in this study about the purpose of the
goal of the Dashboard effort could have been a result of a lack of information exchange from
senior leaders about the vision for the planned change effort which, in turn, would lead to
uncertainty among members. Vision establishes direction for the change program, provides
consistent and compelling justification for the change, provides focus for the organization and
increases the likelihood that employees will “stay the course” (Lewis, et al., 2006, p. 122).
The issue of leadership commitment was a major shortcoming repeated by participants
who reflected on the Dashboard effort. Part of this shortcoming was the lack of feedback to and
from participants. “Feedback gathering from employees concerning implementation issue serves
an important evaluative function for organizational leaders” (Lewis, 2000b, p. 145). However,
Lewis (2007) states that while research shows gathering of feedback from employees about their
perceptions of the implementation is vital to the change effort, most programs only disseminate
information from a top-down approach. Holding true to what Lewis (2007) found, other than
issues that would arise in small group meetings with the member from the Center for
Organizational Development (COD), the researcher came across no formal means to gather
feedback from any of the institution’s members.
184
Feedback to members of the institution was also lacking. Lewis (2000b) also cites this
type of feedback as essential to the planned change effort because it can provide “channels that
are likely to provide opportunities to re-vitalize dying change programs or reinvent poorly
operationalized programs” (p. 146). Leaders who fail to keep employees tuned into the
importance of the change effort lose the benefit of change, will end up thinking the program
wasn’t as effective as it could have been and might begin looking for a new change program.
The problem wasn’t the program; the problem was follow through and communication
(Smulowitz, 2011).
People look for cues to help them make sense of what’s happening (Weick, 1995) and
they attach meaning to them (Schneider, 1990). Participants in this study paid attention to cues
such as the lack of rewards, symbols of achievement, “cheerleading,” stories, message
reinforcement and importance placed on the effort by senior leaders (Bolman & Deal, 1991;
Gersick, 1991; Lewis, 2000b; Simsek & Louis, 1994). “Leaders need to instill optimism,
confidence, enthusiasm and urgency to keep momentum going because it is easy for members to
stick to patterns from the previous deep structure or give up” (Gersick, 1991, p. 27). Participants
did not recall such enthusiasm or incentives by the Vice President or any of the senior leaders,
with the exception of the always-positive and encouraging nature of the interventionist from the
COD during department meetings.
In this study, participants were concerned with the perceived loss of momentum of the
Dashboard effort. Some members described the due dates for their Dashboard data collection as
one that kept moving. Others remarked about the extended period of time since they, or anyone
else, had discussed the Dashboard. Other members thought the planned change effort had
concluded.
185
Erratic activities by those in charge of the planned change effort were cited as having a
negative impact on the change effort itself (Colvin & Kilmann, 1990). Participants in a planned
change effort may feel the event has failed if they were to discontinue work on the effort for a
time because of perceived inactivity (Gersick, 1991; Levinson, 1978). These literatures are
reflected by participants who commented that over time the Dashboard stopped appearing on
agendas.
Newcombe and Conrad (1981) assert that one of the reasons that change programs fail is
that there are some who do not complete the program and there are only irregular attempts to
make them fulfill their duties. One of the four educational support service departments included
in this dissertation never completed their Dashboard measures. Through interviews it became
apparent that the department never saw the benefits of the Dashboard effort. In addition,
attempts by the researcher to interview members of the department were met with hostility. In
one instance a prospective interviewee asked the researcher why she kept contacting different
members of the department about a program that no one knew anything about. In two related
interviews one member of this department was suggested as a resource and potential interviewee
because of their involvement with the early stages of the Dashboard effort. When the researcher
contacted this person she was told that the potential interviewee knew nothing about the effort
and was referred to a former director. Upon speaking with the former director the researcher was
again told that this member was the best resource. To the researchers knowledge, no formal
attempts were made by senior leaders to enforce this educational support service departments
participation in the planned change effort.
The uncertainty of vision (Fairhurst, 1993) coupled with the seemingly short term
momentum (Bordia, et. al, 2004) and lack of feedback and information exchange (Kramer,
186
Dougherty & Pierce, 2004; Lewis & Seibold, 1996) led some participants in this study to believe
that the effort had ended abruptly. Directors were unsure if the effort had vanished or if they
were still responsible to produce a year two report. Some directors reported that it had been well
over a year since anyone senior to them had discussed the Dashboard. Many staff members
knew little to nothing about the Dashboard effort. Even many of those who had been involved
with a sub-committee knew nothing about the status of the effort.
The lack of information exchange or “talk” by senior leaders about the status of the effort
created a sense of lack of urgency and lack of priority about continuing or creating a new
Dashboard. As a result many competing activities gained prominence over the Dashboard effort
by many participants. Further, many participants questioned leadership commitment to the
Dashboard effort. The consensus of those who felt that there was a lack of “talk” about the
Dashboard effort was that if leaders were not asking about it or discussing it then it must not be a
priority. This perception, in turn, had a damaging impact on the progress of the change effort
throughout the organization. Members, then, shifted priorities away and/or discontinued work
from the change effort to other more pressing daily work activities.
Also contributing to the perceived lack of leadership commitment is the issue of
resources, particularly as it pertains to those resources participants felt they needed – but didn’t
get – to complete the Dashboard effort (Kimber, Barwick & Fearing, 2012). Examples of these
types of resources include, but are not limited to, the following: benchmarking, survey software,
access to data, access to statisticians, people to enter and code data and additional change agents.
Many participants continuously addressed these needs as being unaddressed or unmet. One of
the real challenges of a planned change effort is securing resources so that the effort can be
continued (Ludekke, 1999).
187
Relatedly, some members had concerns about their ability to create Dashboard indicators
and collect and analyze data. Members’ attitudes coupled with these performance concerns will
contribute to the level at which the planned change effort will be used in their own work (Lewis
and Seibold, 1993). As shown in this study, member’s uses of the results of the Dashboard effort
were limited.
In some instances these performance concerns were cause for a major pause to the
continuation of the Dashboard effort. One educational support service department, for example,
had several heated discussions about the virtues of using paper versus online surveys. Once
paper surveys were selected there was more heated discussion about who could perform data
entry. The lack of identification and coordination of resources between levels of the
organization such as the three levels of employees in this study are often the cause of a failed
change effort (Ludekke, 1999).
One resource that many participants addressed intensely was the need for additional
change agents. At first glance, the line between a change agent and a leader might be blurred.
As such it is possible that participants who indicated the need for additional change agents may
actually be indicating the need for stronger and clearer leadership, or both.
Ottaway (1983) provides a useful taxonomy for understanding people who are involved
with a planned organizational change effort. Lewin’s (1952) three stages of change play a large
role in understanding this taxonomy. As discussed in Chapter Two, the first stage of change is
“freeze” (Lewin, 1952) which relates to a “change generator” whose responsibilities include
various duties such as recognizing the need, showing support, generating support and defending
the change effort (Ottaway, 1983).
188
The second stage of change is “moving” (Lewin, 1952) which relates to a “change
implementor [sic]” who can be internal or external and whose responsibilities include carrying
out the change effort into the organization (Ottaway, 1983). The third stage of change is
“refreezing” (Lewin, 1952) which relates to “change adopters” who range in scope from those
who are the first to use the new change, to those who use the new change to allow the
organization to succeed, and those who “integrate” or “institutionalize” (Ruben, 2009a) the
change into their everyday work habits (Ottaway, 1983).
While Ottaway’s (1983) taxonomy can be debated, it provides a useful way to
conceptualize the many roles necessary for a planned organizational change effort. For purposes
of this study the “change generators” included a member of the Center for Organizational
Development (COD) who recognized the need for the change effort and a senior leader who
initially approved the change effort and provided resources (such as the change agents from the
COD and the senior leadership team) to see the change effort to fruition.
A review of the literatures suggests that the change agent is responsible for three key
functions of a planned change effort. The first is participation and empowerment through
communication (Lewis, Schmisseur, Stephens & Weir, 2006). Here, change agents use
strategies such as meetings where members can talk and make sense of versus being talked to
about the planned change effort (Lewis, et al., 2006). While there was one meeting where the
first wave of four educational support service departments spoke to the second wave, the
researcher did not uncover more than one opportunity for the first wave to talk among
themselves throughout the planned change effort. Senior leaders addressed the importance of
this meeting and some senior leaders and directors contemplated doing more of this in the future.
The importance of the arrangement of this type of face-to-face meeting should be noted as a way
189
to combat the “uncoordinated” characteristic associated with loosely coupled systems (ASHE-
ERIC, 2001, p. 117).
Participants perceived that people within their department were generally either
uninvolved or unaware of the Dashboard effort. Several participants interviewed had no idea
what a Dashboard was, let alone that there was an effort on in their department to develop one.
Consequently, senior leadership commitment to the planned change effort was questioned.
Employee participation during implementation would provide an “increased commitment
to change by the stakeholders, increase in accuracy in perceptions about reasons for and goals of
change initiatives, improvement in system design from a user perspective and decrease in
employee resistance to change” (Lewis, Hamel, & Richardson, 2001, p. 50). In addition, Lewis
& Russ (2011) note that using participation as a resource also allows members to contribute their
expertise to the planned change effort. Some participants were irritated that they were not asked
to be a part of the planning for the Dashboard effort since their department already collects and
reports on similar data. Including employees as participants in a planned change program also
helps make them feel as if they are “authors of change” versus “targets of change,” which Aune
(1995) claims will make them less likely to resist planned change efforts.
Johnstone, Dye and Johnson. (1998) found that combining various groups of
stakeholders, such as the three levels of members in this dissertation, allow for each group to
have an increased appreciation for the others’ perspectives, and garners support for the planned
change effort from those included. In addition, members of each group will come to realize that
they are all working together, rather than one group asking why this planned change is being
“done” to them (Johnstone, et al., 1998). This is consonant with the findings of this study that
suggest that in many instances the three organizational levels of employees of the institution had
190
different perceptions of reality which stem from their membership in different organizational
levels (Gallivan, 2001; Ruben, 1979; Thayer, 1979).
Participation in a planned change effort can lead to stakeholders feeling empowered
which can provide them with a sense of ownership in and the impetus to complete the change
effort (Johnstone et al., 1998; Lewis, Schmisseur, Stephens, & Weir, 2006). Further, Lewis, et
al. (2006) found that empowered stakeholders will most likely spread the messages about the
planned change effort into the organization through their informal networks. Similarly, Aune’s
1995 case study of a system-wide initiative affecting 34 technical college campuses found that
empowerment led to better accommodations for students with disabilities, as well as less impact
on those involved.
Collaboration can help to bring about successful change implementation in institutions of
higher education (Guskin, 1996). This is possible because participants can discuss their fears
about the planned change program and discover collectively that those fears will most likely
never occur (Aune, 1995). Similarly, uncertainty can be reduced in a planned change effort
through participation in decisions (Bordia, Hobman, Jones, Gallois & Callan, 2004). Despite the
popularity of participation in the literature Lewis and Russ (2011) found that participation is
underused in practice. Participant perceptions from this dissertation confirm their findings. A
part of the leadership issues theme, participants questioned the level of leadership commitment
toward the Dashboard if all members of the department were not involved or at least aware of its
existence.
A second responsibility of the change agent is to assist the progress of “the change
process” (Lewis, et al., 2006, p. 118). The change agents from the COD and the Vice President’s
191
office played the role of change agent. In fact, when participants spoke about the change agent
from the COD they did so in a very positive light. Some asked for clones.
The change agent from the COD was helpful in pulling together groups of participants.
Initially there was a meeting with the directors from the four educational support service
departments (ESSDs) to introduce the concept of the Dashboard as well as discuss their
involvement. Next, this change agent met with each of the department heads and in some
instances more members of the department. These meetings continued sporadically until the
Dashboards were complete and ready to be included on the division web site.
The change agent who worked with the Vice President assumed the role of project
manager. This change agent was the person who would ask the Associate Vice Presidents for
status updates on the Dashboard effort at the division meetings. Both change agents would
“nudge” the departments to keep the effort moving forward. This concept of “nudging” was
referenced by many participants as crucial to moving the Dashboard effort forward. Ironically,
neither change agent had authority over the employees they were charged with moving through
the change process. However, they had the ability to “facilitate groups of people through the
processes to develop, organize, and sell new ideas” (Lewis, et. al, 2006, p. 119).
Unfortunately, only the change agent from the COD was assigned to meet with
educational support service departments (ESSD) members to help them understand and complete
the Dashboard effort. This resulted in several ESSD’s competing for attention from the same
change agent (Lewis & Seibold, 1993). Further, once the initial four ESSD’s detailed in this
dissertation “went through” the program the change agent quickly moved onto the next four
groups, and so on. This left little to no time to double back to the original four ESSD’s. In
192
addition, the change agent who worked closely with the Vice President of the division to keep
the Dashboard effort a topic of discussion and a key priority resigned, leaving a void.
The third responsibility of a change agent according to Lewis et al. (2006) is the creation
of a vision. As previously stated this step was missed in the planned change effort as detailed in
this study. Perhaps a vision could have saved some time for the change agent from the COD
who needed to continually reeducate participants about the process and benefits of the
Dashboard effort.
Stemming from issues such as unclear goals, “uncertainty is one of the most commonly
reported psychological states in the context of organizational change” (Bordia, Hobman, Gallois
& Jones, 2004, p. 509). It is “an aversive state that motivates strategies aimed at reducing or
managing it” (p. 508). Further Bordia, et. al. distinguish three types of uncertainty: strategic,
structural and job-related. This study finds that members of the university experienced all three
types of uncertainty.
The focus of strategic uncertainty is on the organizational level and concerns issues of
“reasons for change, planning and future direction of the organization” (p. 510). Many
participants stated they did not know the purpose of the Dashboard initiative.
The second type, structural uncertainty, focuses on changes to “the inner workings of the
organization…such as reporting structures…reallocation of services and staff are physically
relocated to different parts of the organization (Terry, et al, 1996)” (Bordia, et. al, 2004, p. 510).
Throughout data collection, many participants referred to the transformation of undergraduate
education, which was the catalyst for the new Department of Undergraduate Education to which
each of these ESSD’s now report. Prior to the transformation of undergraduate education, these
ESSD’s had a different reporting structure. In addition, some of the ESSD’s went through
193
reorganization where members were physically relocated to different campuses within the
University.
The focus of job-related uncertainty is on “job security, promotion opportunities, changes
to the job role, and so forth” (p. 511). All levels of employees within the institution echoed
similar distractions in this case study.
Lack of knowledge of benefits and the way the Dashboard information helped the
division as well as the department and the individual employee also contributed to participant
uncertainty. Data showed that those in the trenches had no idea of the potential benefits of the
Dashboard to them or their department. By not providing this type of information to members
the planned change effort will suffer negatively (Colvin and Kilmann, 1990). In addition, when
a planned change effort has a good fit for one layer of the organization, but a weak fit in another
typically the part of the organization that finds the results of the planned change effort to be
weakly related to them will either use it sporadically or not at all (Klein and Sorra, 1996). The
results of this dissertation found that while senior leaders had a good fit for the Dashboard
information, some department members felt there was a weak fit because they did not understand
the benefits of the planned change effort. As a result, members with a perceived weak fit found
no use for the Dashboard. A director remarked that the Dashboards were finally visible online
for anyone to see, although the director was at a loss as to who might be looking for them, and
when they might be looking. Conversely, a senior leader was elated that the Dashboards were
helpful in a board meeting.
Lueddeke (1999) asserts that as a foundation, participants in organizational change efforts
need to understand the benefits of the planned change effort in order for them to be fully
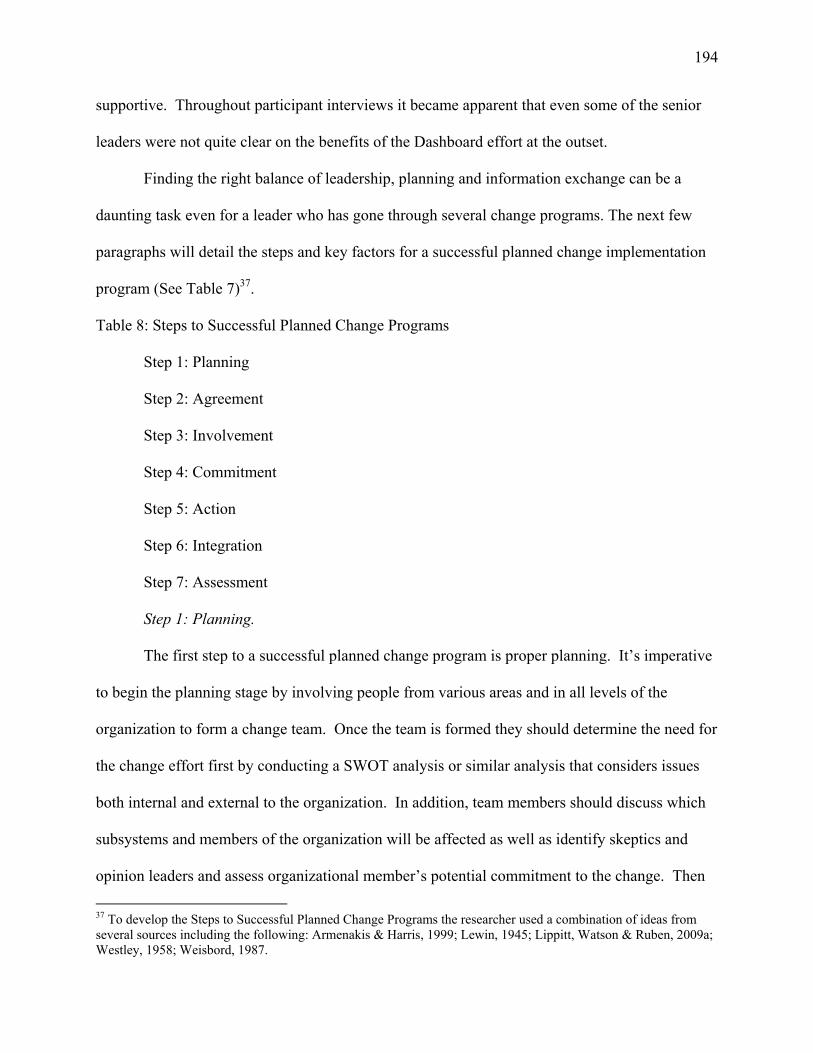
194
supportive. Throughout participant interviews it became apparent that even some of the senior
leaders were not quite clear on the benefits of the Dashboard effort at the outset.
Finding the right balance of leadership, planning and information exchange can be a
daunting task even for a leader who has gone through several change programs. The next few
paragraphs will detail the steps and key factors for a successful planned change implementation
program (See Table 7)37.
Table 8: Steps to Successful Planned Change Programs
Step 1: Planning
Step 2: Agreement
Step 3: Involvement
Step 4: Commitment
Step 5: Action
Step 6: Integration
Step 7: Assessment
Step 1: Planning.
The first step to a successful planned change program is proper planning. It’s imperative
to begin the planning stage by involving people from various areas and in all levels of the
organization to form a change team. Once the team is formed they should determine the need for
the change effort first by conducting a SWOT analysis or similar analysis that considers issues
both internal and external to the organization. In addition, team members should discuss which
subsystems and members of the organization will be affected as well as identify skeptics and
opinion leaders and assess organizational member’s potential commitment to the change. Then
37 To develop the Steps to Successful Planned Change Programs the researcher used a combination of ideas from several sources including the following: Armenakis & Harris, 1999; Lewin, 1945; Lippitt, Watson & Ruben, 2009a; Westley, 1958; Weisbord, 1987.
195
the goal(s) and vision must be defined, made clear and agreed upon. Next a rollout plan
including strategies and tactics should be developed. This should include the crafting of key
messages to be used throughout the effort such as the vision, competitive need to change,
urgency, plan, goals, benefits and expectations for the change program. The planning team
should agree on and document the plan. Finally, team members must begin their campaign to
prepare organizational members for step two.
Step 2: Agreement about the Need to Change.
Think of the second step as a continuum from unaware to fully aware. Team members
will begin a campaign to make all organizational members fully aware of the competitive need to
change as developed in the SWOT analysis. Part of the awareness program will involve a
weekly team activity report indicating key happenings with the change program. Depending on
the organization there may be several channels to distribute the report. For example, in a
manufacturing facility where the majority of employees are working on a line all day, postings in
the cafeteria along with paycheck stuffers and inclusion in any rolling information slides on
televisions in break areas would be appropriate. For employees who work at their desks and
have ready access to computers, emails or inclusion in the portal might make a better channel to
display team updates. Another part of the awareness program will be to provide a way for the
change team to monitor and provide a way to promote sensemaking and decrease levels of
uncertainty and skepticism. This might include time for employees from all levels to get
together formally to catch up with each other, discuss the change effort and ask questions.
Communication should also be an important part of each step in the process. Remember that
communication involves the way organizational members use information to make sense of their
situation and restore harmony to their social structure.
196
Step 3: Involvement.
As team members are rolling out their awareness campaign throughout the organization,
they will be recruiting organizational members who are interested in taking a larger role in the
effort. This stage of involvement may happen in two different phases. The first phase may
occur prior to the formation of the change team and the second may occur just prior to the rollout
plan. Regardless, the point is to involve everyone at some point, even if some people are
involved only in meetings about the change effort. There will be members on the change team
from all levels of the organization.
Step 4: Commitment.
Commitment to the change effort is key for leaders, change agents and organizational
members. As such, there should be time to assess the amount of commitment to the change
effort from all levels of the organization. One way to do this is for the change team to interview
organizational members. However, if the organization is large, spans several states and/or
countries and consists of people working in dispersed locations (such as telecommuting) then a
quantitative survey similar to the five beliefs scale developed by Armenakis & Harris (2009) is
ideal.
The survey should focus on the five beliefs and the awareness program: a) discrepancy-
people see a reason to change; b) appropriateness- the change strategy chosen is the right one; c)
efficacy- we are capable of making the change; d) visible leadership commitment- leaders and
change agents are visibly supportive of the change effort e) valence- there is a benefit that is
appealing to me; and f) awareness program- the information provided by the weekly team
activity report and other discussion opportunities keep me informed about the change effort.
197
In addition to the survey a leadership checklist (See Table 8) will be completed by the
leader of the organization and the results from both will be compiled into a Dashboard of key
planned change indicators (See Table 9) which will be kept by the change agent. Results of the
survey, checklist and Dashboard will be presented quarterly to the change team, leader and
organizational members. The importance of measuring these items periodically throughout the
change program is to ensure that organizational members have confidence that the change
program is important to the health of the organization and that it is fully supported by everyone
in the organization. If the change agent finds that organizational members show a decrease in
any of the indicators then the change agent, along with the change team and any other employees
who want to be involved, can determine the appropriate strategy to improve. For example,
should the survey reveal that the people do not perceive that they are fully aware of the progress
of the change program, then the change agent can increase or add elements to the awareness
program. If the survey shows that all or most of the indicators are declining then the change
agent can modify the program so that it does not fail. It is important to include organizational
members in this step so that they feel part of and buy into the process.
Step 5: Action.
Implement the change effort. Begin with some fanfare where the leaders, change agents
and change team gather all employees to celebrate the start of the new vision. This is a key
opportunity for leaders to show they are committed to the change effort by telling the story of the
vision and showing confidence in the rollout. Periodically throughout the change program
process the survey and leadership checklist should be administered again. In addition, keeping
up with the awareness program is essential as is monitoring employee sensemaking of the change
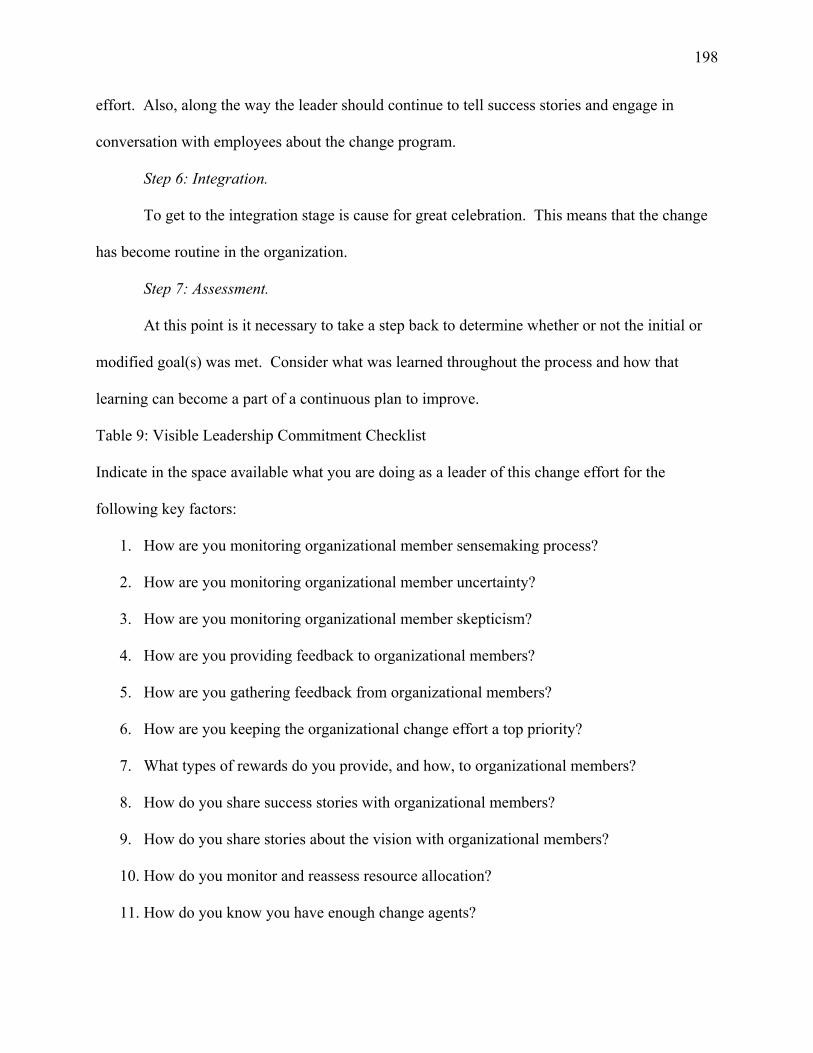
198
effort. Also, along the way the leader should continue to tell success stories and engage in
conversation with employees about the change program.
Step 6: Integration.
To get to the integration stage is cause for great celebration. This means that the change
has become routine in the organization.
Step 7: Assessment.
At this point is it necessary to take a step back to determine whether or not the initial or
modified goal(s) was met. Consider what was learned throughout the process and how that
learning can become a part of a continuous plan to improve.
Table 9: Visible Leadership Commitment Checklist
Indicate in the space available what you are doing as a leader of this change effort for the
following key factors:
1. How are you monitoring organizational member sensemaking process?
2. How are you monitoring organizational member uncertainty?
3. How are you monitoring organizational member skepticism?
4. How are you providing feedback to organizational members?
5. How are you gathering feedback from organizational members?
6. How are you keeping the organizational change effort a top priority?
7. What types of rewards do you provide, and how, to organizational members?
8. How do you share success stories with organizational members?
9. How do you share stories about the vision with organizational members?
10. How do you monitor and reassess resource allocation?
11. How do you know you have enough change agents?
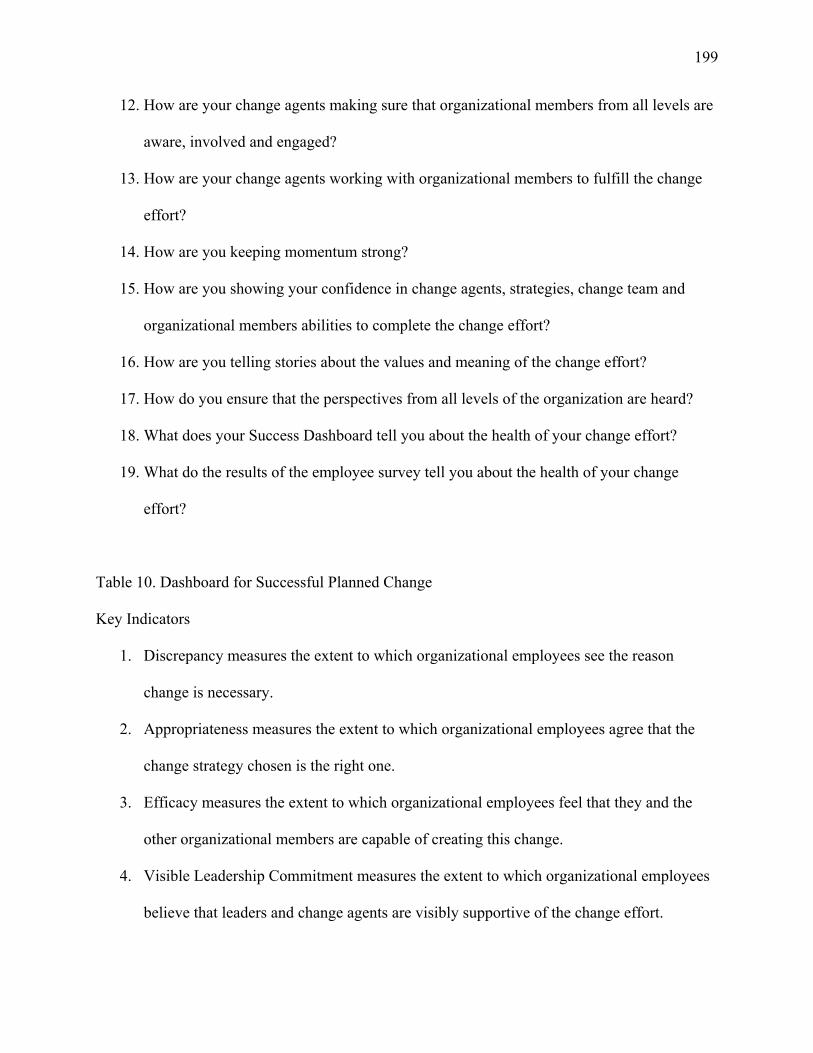
199
12. How are your change agents making sure that organizational members from all levels are
aware, involved and engaged?
13. How are your change agents working with organizational members to fulfill the change
effort?
14. How are you keeping momentum strong?
15. How are you showing your confidence in change agents, strategies, change team and
organizational members abilities to complete the change effort?
16. How are you telling stories about the values and meaning of the change effort?
17. How do you ensure that the perspectives from all levels of the organization are heard?
18. What does your Success Dashboard tell you about the health of your change effort?
19. What do the results of the employee survey tell you about the health of your change
effort?
Table 10. Dashboard for Successful Planned Change
Key Indicators
1. Discrepancy measures the extent to which organizational employees see the reason
change is necessary.
2. Appropriateness measures the extent to which organizational employees agree that the
change strategy chosen is the right one.
3. Efficacy measures the extent to which organizational employees feel that they and the
other organizational members are capable of creating this change.
4. Visible Leadership Commitment measures the extent to which organizational employees
believe that leaders and change agents are visibly supportive of the change effort.
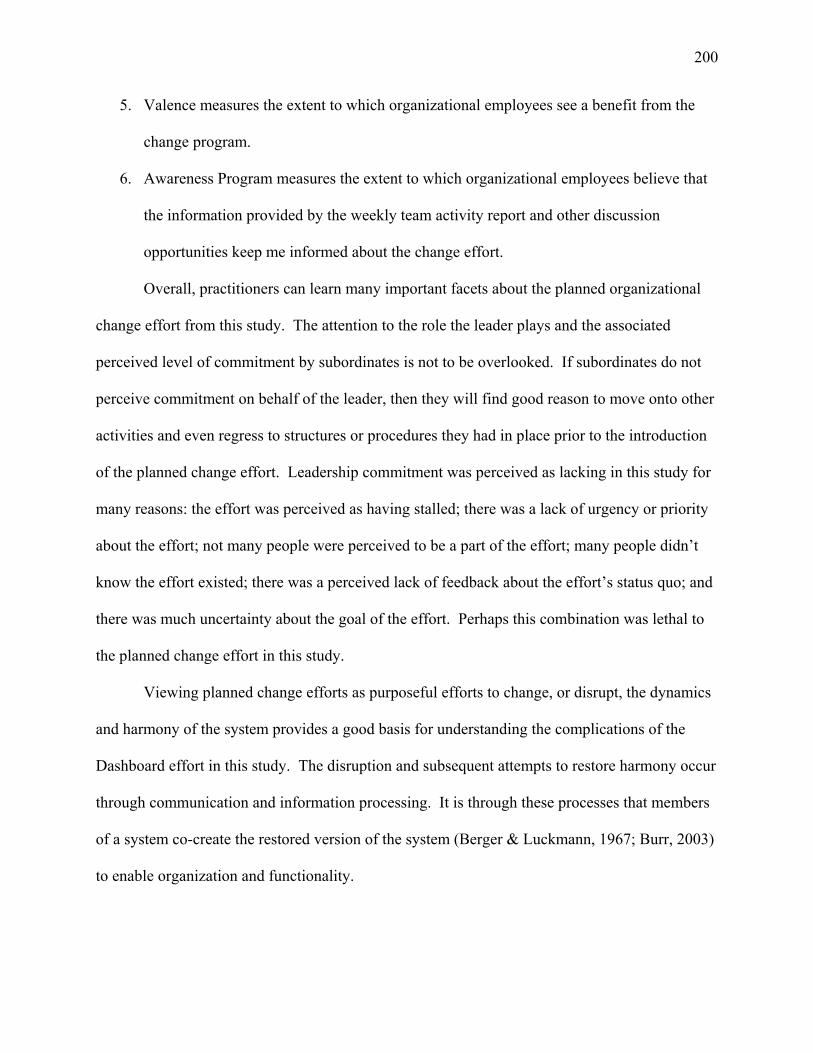
200
5. Valence measures the extent to which organizational employees see a benefit from the
change program.
6. Awareness Program measures the extent to which organizational employees believe that
the information provided by the weekly team activity report and other discussion
opportunities keep me informed about the change effort.
Overall, practitioners can learn many important facets about the planned organizational
change effort from this study. The attention to the role the leader plays and the associated
perceived level of commitment by subordinates is not to be overlooked. If subordinates do not
perceive commitment on behalf of the leader, then they will find good reason to move onto other
activities and even regress to structures or procedures they had in place prior to the introduction
of the planned change effort. Leadership commitment was perceived as lacking in this study for
many reasons: the effort was perceived as having stalled; there was a lack of urgency or priority
about the effort; not many people were perceived to be a part of the effort; many people didn’t
know the effort existed; there was a perceived lack of feedback about the effort’s status quo; and
there was much uncertainty about the goal of the effort. Perhaps this combination was lethal to
the planned change effort in this study.
Viewing planned change efforts as purposeful efforts to change, or disrupt, the dynamics
and harmony of the system provides a good basis for understanding the complications of the
Dashboard effort in this study. The disruption and subsequent attempts to restore harmony occur
through communication and information processing. It is through these processes that members
of a system co-create the restored version of the system (Berger & Luckmann, 1967; Burr, 2003)
to enable organization and functionality.
201
The decisions about communication strategy and frequency of information exchange
made by the senior leaders “affect the perceptions, concerns, assessments and interactions” of
other members of the organization (Lewis, 2007, p. 181). Without a continual give-and-take of
information (Bertalanffy, 1975; Miller, 1965; Ruben, 1983; Thayer, 1968), or negotiated
meaning of messages (Weick, 1979; Westley & MacLean, 1970) organizational members will
have a tough time making sense (Weick, 1995, 2001) of the planned change effort and as a result
will find it difficult to find harmony and restore the system (Berger & Luckmann, 1967). It is the
interaction between the different levels of employees that “in part” affect the outcomes of a
planned, organizational change effort (Lewis, 2007). Thus, it was communication in the sense of
a shared understanding of the purpose and goal of the effort as a key reason for a perceived lack
of leadership commitment throughout the organization about the planned change effort (see also,
Lewis, 2000b, p. 151).
Some of the questions raised by this study include the following: a) how can a leader turn
around a floundering planned change program; b) what effect will this outcome have on the next
planned change effort at this institution; c) how can a change agent ensure commitment from
leadership? These questions could easily become topics for future research by examining the
same or a similar population. The next section will discuss limitations of the study as well as
future research opportunities.
Limitations and Future Research Opportunities
No study is without limitations. This dissertation is no exception and includes the
following limitations: particularity, subjectivity, generalizability, reliability, time interval,
participant comments, researcher lens, loose coupling and tensions in the themes.
Particularity limitations and future research opportunities.
202
The researcher particularly chose three levels of employees within an institution of higher
education for this study because she wanted to be able to discover similarities and differences of
perceptions between the three levels of employees in a planned, organizational change effort.
“No system beyond a certain level of complexity can be completely known in all if its details.
Therefore the system theorist is interested in singling out certain global properties of systems that
characterize systems of a given type” (Anatol & Rapoport, 1975, p. 40).
The ability to be particular about a phenomenon, such as being able to determine
similarities and differences of perceptions between three levels of employees within this
University setting, provides the researcher with an in-depth understanding of this aspect of this
specific planned organizational change effort (Merriam, 2009). In doing so, the researcher can
better tell the story of the groups involved, rather than a more general synopsis of similar groups.
However, this leaves a gap for future researchers to study other details of the organizational
system. In addition, future researchers may wish to study the same aspects of planned
organizational change efforts in general.
Subjectivity limitations and future research opportunities.
The findings of this research are based on the interpretations of participant perceptions by
the researcher. Inherent in this kind of research are limitations based on the subjectivity of each
interview participant’s perceptions as well as the interpretations of those perceptions by the
researcher. Thus by its nature qualitative research inherently involves subjectivity from the
research participants and the researcher (Lindlof & Taylor, 2002). It is unavoidable because
participant perceptions and researcher interpretations constitute qualitative research (Lindlof &
Taylor, 2002). Future researchers could take the themes that emerged from this study and use
them and their subthemes in a survey or other quantitative method.
203
Generalizability limitations and future research opportunities.
In this case study analysis, all the educational support service departments report to the
same vice president making it possible to reflect on the way in which each educational support
service department handles department meetings, reporting structure, physical location, and other
items that many other institutions of higher education have in common. Should the findings
from the educational support service departments and the senior leadership group in this
dissertation show constant findings in one area, then one can generalize those findings to other
institutions of higher education (Yin, 1993). In all but a few instances findings were different
between members of the three organizational levels of the University. In fact, findings typically
demonstrated that one of the three groups of organizational levels of the University were in
disagreement with the other two. For example, while participants overall were highly concerned
with the ability of the Dashboard effort to help them to justify the existence of their department
and the University to internal and external constituencies, senior leaders were twice as likely to
discuss this code as were directors and staff members.
However, qualitative methods in general do not appropriately provide generalizability
because of their characteristic subjective nature (Lindlof & Taylor, 2002). As such future
researchers could use the themes that emerged from this study in quantitative studies with
additional institutions to confirm their generalizability. With the growing influence of
accrediting agencies and the federal government, the opportunity to study additional institutions
of higher education should be bountiful.
Reliability limitations and future research opportunities.
This study used interviews to gather data (Lindlof & Taylor, 2002). By their nature,
interviews are not repeatable because participants are asked a set of questions only once (Lindlof
204
& Taylor, 2002). Each interview participant has a unique view of the world and their situation
and as such it would be impossible to replicate the interview with others and have the consistent
outcomes (Lindlof & Taylor, 2002; Merriam, 2009).
In an effort to combat the lack of reliability, the researcher used four educational support
service departmentss and the senior leadership group within the University to study the perceived
impact of the same Dashboard effort (Merriam, 2009; Orum, Feagin & Sjoberg, 1991, p. 18). In
addition, the researcher conducted member checks by submitting a draft of a section of the
results section to a participant in which his or her comments are included (Stake, 1995, p. 115).
The participant was asked to confirm or disconfirm the draft for accuracy. Accuracy of the draft
was confirmed.
While reliability is not as much a focus in qualitative studies as in quantitative studies,
one could argue that the results of this qualitative study are not fully reliable (Lindlof & Taylor,
2002). Future research could use quantitative methods, known for reliability.
Time Interval limitations and future research opportunities.
According to interview participants, about a year had passed between their initial
introduction to the Dashboard effort and the researcher’s inquiries. It is possible that some of the
participants could have forgotten facts about the Dashboard effort. Several interview
participants promised the researcher that they would send meeting notes, emails and other
documents; most participants could not find these materials. This was likely due to the length of
time since the Dashboard effort had been part of their daily work. Future researchers could time
their interviews and requests for documentation closer to the time of the planned organizational
change effort.
205
All the departments within the Division of Undergraduate Education had not yet
completed the Dashboard effort and a few participants mentioned that they felt they had a hard
time answering or could not answer some questions because they thought it was too soon to tell
whether or not the Dashboard effort could be attributed to things such as employee productivity
or even if the effort itself was successful. Future researchers could complete a longitudinal study
to determine perceptions at several stages of the planned organizational change effort.
Participant comments limitations and future research opportunities.
A common limitation of interviews is that participants might either censor what they say
or be more forthright than normally because of concerns about confidentiality, of the presence of
an interviewer or the interview process itself. In this study it is hard to discern whether or not
either of these instances occurred. However there were several occasions where interview
participants appeared to be choosing their words very carefully and others where participants
appeared to be letting off some steam about their feelings of frustration about the planned change
effort. For example, early during the interview one director repeatedly told the researcher that “it
was an honor and a privilege for my department to have been chosen for the pilot study”
(Participant 2, 2011). While the researcher had not previously known this participant one can
make the case that this participant was testing out the researcher’s credibility and to ensure that
positive comments would be attributed to them. In another instance it was apparent that a
director was letting off some steam about their frustrations surrounding the Dashboard effort. In
fact, the participant at one point apologized for “venting” (Participant 1, 2011).
In addition, responses to the research questions asking participants to assert their opinions
of other non-peer levels of employees about certain aspects of the Dashboard were mostly met
with hesitancy. For example, when staff members were asked to assert their opinion of the value
206
of the Dashboard effort to the senior leaders and directors, many staff members noted that they
were unable to speak for the other levels. However, in many instances staff members would
assert their opinions for other staff members as a whole. Interestingly senior leaders for the most
part also declined to assert their opinions about staff members.
It would be interesting for future studies to evaluate the frequency of either participant
censorship or venting during interviews. In addition, future studies could focus more on the
reasons behind levels of employees unwillingness to speak for other levels of employees.
Researcher lens limitations and future research opportunities.
This study was conducted by a researcher using a communicative lens to study the
planned organizational change effort. As such there was a heightened focus on issues of
communication. Other researchers might use a different lens and thus see the same data in a
different way. Future studies could include researchers each using a different lens to view the
data. The comparison of a communication researcher versus an economics researcher would
yield interesting results.
Loose coupling and higher education limitations and future research opportunities.
Many participants talked about what they saw as “insufficient facilitator support” during
the change effort. Perhaps that expressed need was, in part, due to the loosely coupled nature of
institutions of higher education. While this study acknowledges that institutions of higher
education tend to be loosely coupled, the study did not address this directly. Future studies could
make a point to study whether or not the loosely coupled nature of institutions of higher
education plays a role in the level of support participants seek from change agents.
Tensions in the themes limitations and future research opportunities.
207
As noted, a review of the findings reveals several tensions. The first tension is that
between the themes of accountability and organizational changes. The tension comes into play
with the addition of the last two themes of leadership and information exchange as the issues in
these themes were barriers to the success of the first two themes.
The second tension was between transparency and people unaware or uninvolved in the
effort. The irony here is the time participants spent remarking about the need for visibility to
external constituents when their internal constituents were reported being largely unaware of the
Dashboard effort.
A third tension is that even though there was mandate “from the top” about the
Dashboard effort, there was a perceived lack of leadership throughout. A fourth tension was the
tension between the cultures of faculty and staff, which may have contributed to some of the
failure in this planned change effort. These tensions are appropriate topics for further
examination in future research.
CONCLUSION
The need for ongoing, planned organizational change in organizations is growing. This is
true especially in institutions of higher education where the impetus for change has been
particularly dramatic in the assessment of performance and outcomes, and the use of the
resulting information to document, report upon and improve institutional effectiveness.
One of the many measurement-based strategies of assessment is the Dashboard which is
widely used in industry but new to higher education. Success for Dashboards in higher
education must account for its inherent loosely coupled nature which leads to impediments and
facilitators of any planned, organizational change effort. Communication can be both an
impediment and a facilitator and, as such, is vital to any change effort.
208
Communication was an important focus in this dissertation because it was found to be the
basis of many of the impediments and facilitators of the planned organizational change effort
studied. Findings indicate that communication is important in this planned organizational
change effort so that all members can have a shared understanding about the effort. The lack of
information exchange previous to and throughout the planned organizational change effort can
lead to member uncertainty and skepticism about the following: a) purpose of the effort; b)
commitment behind the effort; c) benefit of the effort; d) usefulness of the effort; e) importance,
and hence, priority of the effort; and f) sustainability of the effort. The culmination of these
issues leads participants of the planned organizational change effort to experience frustration,
disgust and even shut-down which can contribute to the perception that the effort failed.
To summarize, communication is vital to planned organizational change efforts such as
the one studied here. Change agents considering a planned organizational change effort should
review the results found in this study and determine the fit to their own institution. Researchers
who study planned organizational change should review the results found in this study to
determine further areas of research to advance the field.
209
References
Albrecht, T. & Hall, B. (1991). Facilitating talk about new ideas: Extrarole efforts to initiate workplace change. Academy of Management Journal, 42, 403-419. Anatol & Rapoport, A. (1975). Modern systems theory: An outlook for coping with
change. In R. W Budd, B. D. Ruben (Eds.), Interdisciplinary approaches to human communication. (pp. 95-118). Rochelle Park, New Jersey: Hayden Book
Company, Inc. Argyris, C. (1970). Intervention theory and method: A behavioral science view. Reading, MA:Addison-Wesley Publishing Company. Argyris, C., Putnam,R., & McLain Smith, D. (1985). Action science. San Francisco, CA: Jossey-Bass. Argyris, C., & Schon, D. A. (1974). Theory in practice: Increasing professional effectiveness. San Francisco, CA: Jossey-Bass. Argyris, C., & Schon, D. A. (1978). Organizational learning. Reading, MA: Addison- Wesley. Armenakis, A. A., & Harris, S. G. (2009). Reflections: Our journey of organizational change research and practice, Journal of Change Management, 9(2), 127-142. Armenakis, A. A., Harris, S. G., and Mossholder, K. W. (1993). Creating readiness for organizational change, Human Relations, 46 (June), 681–703. ASHE-ERIC Higher Education Report. (2001). Special issue: Understanding and
facilitating organizational change in the 21st Century: Recent research and conceptualizations [Electronic version]. ASHE-ERIC Higher Education Report, 28(4), 1-162.
Ashford, S. J., & Cummings, L. L. (1983). Feedback as an individual resource: Personal strategies of creating information. Organizational Behavior and Human Decision Processes, 32, 370-398. Ashforth, B. E., & Mael, F. (1989). Social identity theory and the organization. Academy of Management Review, 12(1), 20-39. Aune, B. P. (1995). The human dimension of organizational change [Electronic version].
Review of Higher Education, 18(2), 149-173. Awareness, n. d. In Merriam-Webster’s online dictionary (11th ed.). Retrieved from http://www.merriam-webster.com/dictionary/awareness Baldridge, J. V. (1983). Organizational characteristics of colleges and universities. In J. V. Baldridge, & T. Deal (Eds.). The dynamics of organizational change in education (pp. 38-59). Berkeley, CA: McCutchan Publishing Company. Beckhard, R. (1969). Organizational development: Strategies and methods. Reading, MA: Addison-Wesley. Beer, M. & Walton, A. E. (1987). Organization change and development. Annual Review
of Psychology, 38, 339-367. Belkin, N. J., & Robertson, S. E. (1976). Information science and the phenomenon of
information. Journal of the American Society for Information Science. 27(4), 197- 204.
Bennis, W. G. (1964). The change agents. In R. T. Golembiewski, A. Blumberg (Eds.), Sensitivity training and the laboratory approach. Itasca, IL: F.E. Peacock Publishers.
210
Bennis, W. G. (1966). Changing organizations. New York, NY: McGraw-Hill Book Company. Bennis, W. G. (1993). Beyond bureaucracy: Essays on the development and evolution of
human organization. San Francisco, CA: Jossey-Bass Publishers. Bennis, W. G., Benne, K. D., & Chin, R. (1969). The planning of change, 2nd Ed. New York: Rinehart & Winston. Berger, P. L., & Luckmann, T. (1967). The social construction of reality: A treatise in the sociology of knowledge. Garden City, NY: Doubleday. Bertalanffy, L. v. (1950). An outline of general system theory. The British Journal for the
Philosophy of Science, 1(2), 134-165. Bertalanffy, L. v. (1968). General systems theory, foundations, developments, applications. New York, NY: Braziller. Bertalanffy, L. v. (1975). General system theory. In R. W Budd, B. D. Ruben (Eds.),
Interdisciplinary approaches to human communication. (pp. 95-118). Rochelle Park, New Jersey: Hayden Book Company, Inc.
Bishop, R. (2005). Freeing ourselves from neocolonial domination in research. In N. K. Denzin, Y. S. Lincoln (Eds.), The Sage handbook of qualitative research, 3rd Ed. Thousand Oaks, CA: Sage Publications, Inc. Bititci, U. S., Turner, T., & Begemann, C. (2000). Dynamics of performance measurement systems. International Journal of Operations and Production Management, 20(6), 692-704. Blake, R. R., & Mouton, J. S. (1964). The managerial grid: Key orientations for achieving production through people. Houston, TX: Gulf Publishing Co. Blumer, H. (1979). Symbolic interaction. In R. W. Budd, B. D. Ruben (Eds.), Interdisciplinary approaches to human communication. (pp. 7-31). Rochelle Park, New Jersey: Hayden Book Company, Inc. Bolman, L. G., & Deal, T. E. (1991). Reframing organizations: Artistry, choice and leadership. San Fransisco, CA: Jossey-Bass. Bordia, P., Hobman, E., Jones, E., Gallois, C., & Callan, V. J. (2004). Uncertainty during organizational change: Types, consequences, and management strategies. Journal of Business and Psychology, 18(4), 507-532. Brower, R. S., & Abolafia, M. Y. (1995). The structural embeddedness of resistance among public managers. Group and Organization Management, 20(2), 149-166. Burke, W. W. (2008). Organization change: Theory and practice. (2nd ed.). Thousand Oaks, CA: Sage Publishing. Burr, V. (2003). Social constructionism. 2nd ed. New York, NY: Routledge. Cameron, K. S., & Quinn, R. E. (2006). Diagnosing and changing organizational culture. San Francisco, CA: Jossey-Bass. Charmaz, K. (2005). Grounded theory in the 21st century: Applications for advancing social justice studies. In N. K. Denzin, Y. S. Lincoln (Eds.), The Sage handbook of qualitative research, 3rd Ed. Thousand Oaks, CA: Sage Publications, Inc. Chin, R. & Benne, K. D. (1985). General strategies for effecting change in human systems. In W.G. Bennis, K. D. Benne, and R. Chin (Eds.), The planning of change. (4th ed.) New York: Holt, Rinehart & Winston. Church, A. H. (2001). The professionalization of organization development: The next step in an evolving field. Research in Organizational Change and Development,
211
1-42. Cobb, A. T. & Margulies, N. (1981). Organization development: A political perspective. The Academy of Management Review, 6(1), 49-59. Coch, L. ; & French, J. L. P. Jr. (1948). Overcoming resistance to change. Human Relations, 1(4), 512-532. Colvin, T. J., & Kilmann, R. H. (1990). Participant perceptions of positive and negative influences on large-scale change. Group and Organizational Studies, 15, 233-248. Commitment, n.d. In Merriam-Webster’s online dictionary (11th ed.). Retrieved from http://www.merriam-webster.com/dictionary/commitment Crawford, J. (2003). Reviewing a programme of evaluation in an academic library: The case of Glasgo Caledonian University. Performance Measurement and Metrics, 4(3), 113-121. doi:10.1108/14678040310507860 Cullen, J., Joyce, J., Hassall, T., & Broadbent, M. (2003). Quality in higher education:
From monitoring to management. Quality Assurance in Higher Education, 11(1), 5-14.
DeFeo, J. A., & Barnard, W. W. (2004). Juran Institute’s Six Sigma: Breakthrough and beyond. New York, NY: McGraw-Hill Book Company. Delgado, J. M. R. (1979). Neurophysiology. In R. W Budd, B. D. Ruben (Eds.), Interdisciplinary approaches to human communication. (pp. 119-134). Rochelle Park, New Jersey: Hayden Book Company, Inc. Dent, E. B., & Goldberg, S. G. (1999). Challenging “Resistance to change.” Journal of Applied Behavioral Science, 35(1), 45-47. Retrievedfrom ABI/INFORM Global. (Document ID: 39370613). Dervin, B. (1977). Useful theory for librarianship: Communication, not information. Drexel Library Quarterly, 13(3), 16-32. DeSanctis, G., & Poole, M. S. (1994). Capturing the complexity in advanced technology use: Adaptive structuration theory, Organization Science, 5(2), 121-147. Eccles, R. G. (1991). The performance measurement manifesto. Harvard Business Review, 69(1), 131-137. Edwards, D.; & Thomas, J. C. (2005). Developing a municipal performance measurement system: Reflections on the Atlanta Dashboard. Public Administration Review, 65(3), 369-376. Fairhurst, G. T. (1993). Echoes of the vision: When the rest of the organization talks Total Quality. Management Communication Quarterly, 6, 331 - 371. Faucheux, C., Amado, G., & Laurent, A. (1982). Organizational development and change. Annual Review of Psychology, 33, 343-370. Ferguson, D. (2006). Lean and Six Sigma: The same or different? Management Services, 14-16. Fontana, A., & Frey, J. H. (2005). The interview: From neutral stance to political involvement. In N. K. Denzin, Y. S. Lincoln (Eds.), The Sage handbook of qualitative research, 3rd Ed. Thousand Oaks, CA: Sage Publications, Inc. Ford, J. D., & Ford. L. W. (1995). The role of conversations in producing intentional change in organizations. The Academy of Management Review, 20 (3), 541-570. Retrieved from http://www.aom.pace.edu/amr/ French, W. L., & Bell, Jr., C. H. (1990). Organization development: Behavioral science
interventions for organization improvement. (4th Ed.) Englewood Cliffs, NJ:
212
Prentice-Hall. Friedlander, F. & Brown, L. D. (1974). Organization development. Annual Review of Psychology, 33, 313-341. Gallivan, M. J. (2001). Meaning to change: How diverse stakeholders interpret organizational communication about change initiatives. IEEE Transactions on Professional Communication, 44(4), 243-266. Gersick, C. J. G. (1991). Revolutionary change theories: A multilevel exploration of the
punctuated equilibrium paradigm [Electronic version]. The Academy of Management Review, 16(1), 10-36.
Giddens, A. (1985). Marx's correct views on everything: (With apologies to L. Kolowkowski). Theory and Society, 14(2), 167-174. Giddens, A. (2003). Runaway world: How globalization is reshaping our lives. New York, NY: Routledge. Glaser, G. G., & Strauss, A. L. (1967). The discovery of grounded theory: Strategies for
qualitative research. Chicago, IL: Aldine Publishing Co. Guskin, A. (1996). Facing the future [Electronic version]. Change, 28(4). Halloran, J. D. (1985). Information and communication: Information is the answer, but what is the question? In B. D. Ruben (Ed.), Information & Behavior: Vol. 1. (pp. 27-39). New Brunswick: Transaction Books. Hatch, M. J. (1993). The dynamics of organizational culture. Academy of Management Review, 18(4), 657-693. Huber, G. P., & Glick, W. H. (1993). Sources and forms of organizational change. In G. P. Huber & W. H. Glick (Eds.), Organizational change and redesign (pp. 3 - 15). N.Y.: Oxford University Press. Huse, E. F. & Cummings, T. G. (1985).Organization development and change. (3rd. Ed.). St. Paul, MN: West Publishing Co. IBM Corporation. (2008). Making change work. Somers, NY: IBM Corporation. Retrieved from http://www-935.ibm.com/services/us/gbs/bus/pdf/gbe03100-usen- 03-making-change-work.pdf Increased, n. d. In Merriam-Webster’s online dictionary (11th ed.). Retrieved from http://www.merriam-webster.com/dictionary/increased Influence, n. d. In Merriam-Webster’s online dictionary (11th ed.). Retrieved from http://www.merriam-webster.com/dictionary/influence ISO. (2010a, July 20). About ISO [Online website content]. Retrieved from http://www.iso.org/iso/about.htm ISO. (2010b, July 20). About ISO: Discover ISO [Online website content]. Retrieved from http://www.iso.org/iso/about/discover-iso_examples-of-the-benefits- standards-provide.htm iSixSigma.com. (2009, April 29) New to Six Sigma [Online content provider for the Six
SigmaCommunity]. Retrieved from http://www.isixsigma.com/six-sigma/six sigma.asp
Johnson, H. T., & Kaplan, R. S. (1987). Relevance lost – The rise and fall of management accounting. Boston, MA: Harvard Business School Press. Johnstone, D. B., Dye, N. S. & Johnson, R. (1998). Collaborative leadership for institutional change [Electronic version]. Liberal Education, 84(2). Kaplan, R. S., & Norton, D. P. (1992). The balanced scorecard – Measures that drive
performance. Harvard Business Review, 70(1), 71-79.
213
Kaplan, R. S., & Norton, D. P. (1993). Putting the balanced scorecard to work. Harvard Business Review, 71(5), 134-147.
Kaplan, R. S., & Norton, D. P. (1996). The balanced scorecard: Translating strategy into action. Boston, MA: Harvard Business School Press. Kee, J. E., & Newcomer, K. E. (2008). Why do change efforts fail?: What can leaders do about it? The Public Manager, 37(3), 5-12. Retrieved from ABI/INFORM Global.
(Document ID: 1592581511). Kennerley, M. & Neely, A. (2002). Performance measurement frameworks: A review. In
Neely, A (Ed.), Business performance measurement: Theory and practice. (pp. 145-155). Cambridge, UK: Cambridge University Press.
Kezar, A. (2005). Consequences of radical change in governance: A grounded theory approach. The Journal of Higher Education, 76(6), 634-668. Kezar, A., & Eckel, P. (2002). Examining the institutional transformation process: The importance of sensemaking, interrelated strategies and balance. Research in Higher Education, 43(3), 295-328.Klein, K. J. & Sorra, J. S. (1996). The challenge of innovation implementation. Academy of Management Review, 21(4),
1055-1080. Kimber, M., Barwick, M. & Fearing, G. (2012). Becoming an evidence-based service provider: Staff perceptions and experiences of organizational change. The Journal for Behavioral Health Services and Research, 39 (3), 314-332. Klein, K. J., & Sorra, J. S. (1996). The challenge of innovation implementation. Academy
of Management Review, 21(4), 1055-1080. Kotter, J. P., & Heskett, J. L. (1992). Corporate culture and performance. New York, NY: The Free Press. Kramer, M. W., Dougherty, D. S., & Pierce, T. A. (2004). Managing uncertainty during a
corporate acquisition. Human Communication Research, 30(1), 71-101. Kuo, H.-M. (2005). Communication, culture, relationships, and collaboration between faculty
and administrators in higher education. (Unpublished doctoral dissertation.) Rutgers, The State University of New Jersey, New Brunswick, NJ.
Lean.org (2010, January 11). Home Page. [Online website content.] Retrieved from http://www.lean.org/
Levinson, D. J. (1978). The seasons of a man’s life. New York, NY: Knopf. Lewin, K. (1946). Action research and minority problems. Journal of Social Issues, 2(4), 34-46. Lewin, K. (1951). Field theory in social science. New York: Harper & Brothers Publishers. Lewis, L. K. (1999). Disseminating information and soliciting input during planned
organizational change: Implementers’ targets, sources, and channels for communicating. Management Communication Quarterly, 13(1), 43-75. Retrieved from ABI/INFORM Global. (Document ID: 43697065).
Lewis, L. K. (2000a). “Blindsided by that one” and “I saw that one coming”: The relative anticipation and occurrence of communication problems and other problems in implementers’ hindsight, Journal of Applied Communication Research, 28(1), 44-67.
Lewis, L. K. (2000b). Communicating change: Four cases of quality programs. The Journal of Business Communication, 37(2), 128-155. Lewis, L. K. (2006). Employee perspectives on implementation communication as predictors of
perceptions of success and resistance. Western Journal of Communication, 70(1), 23-46. Lewis, L. K. (2007). An organizational stakeholder model of change implementation
214
communication. Communication Theory, 17, 176-204. Lewis, L. K. (2011). Organizational change: Creating change through strategic
communication. Malden, MA: Wiley-Blackwell. Lewis, L. K., Hamel, S. A., & Richardson, B. K (2001). Communicating change to nonprofit stakeholders: Models and predictors of implementers’ approaches. Management Communication Quarterly, 15, 5 – 41. Lewis, L. K., & Russ, T. L. (2011). Soliciting and using input during organizational change initiatives: What are practitioners doing? Management Communication Quarterly, 26(2), 267-294. Lewis, L. K., & Seibold, D. R. (1993). Innovation modification during
intraorganizational adoption. Academy of Management Review, 18, 322-354. Lewis, L. K., & Seibold, D. R. (1996). Communication during intraorganizational innovation adoption: Predicting users' behavioral coping responses to innovations in organizations. Communication Monographs,63, 131 - 157. Lewis, L. K., Schmisseur, A., Stephens, K., & Weir, K. (2006). Advice on
communicating during organizational change: The content of popular press books. Journal of Business Communication, 43 (2), 1-25.
Lindlof, T. R., & Taylor, B. C. (2002). Qualitative communication research methods. (2nd ed.). Thousand Oaks, CA: Sage Publications, Inc. Lippitt, R., Watson, J., & Westley, B. (1958). Dynamics of planned change. New York: Harcourt, Brace. Luckmann, T. (2008). On social interaction and the communicative construction of personal identity, knowledge and reality. Organization Studies, 29(02), 277-290. Lueddeke, G. R. (1999). Toward a constructivist framework for guiding change and innovation in higher education [Electronic version]. The Journal of Higher Education, 70(3), 235-260. Mallak, L. A., Bringelson, L. S., & Lyth, D. M. (1997). A cultural study of ISO 9000
certification. International Journal of Quality & Reliability Management, 14(4), 328-348.
Merriam, S. B. (2009). Qualitative research: A guide to design and implementation. San Francisco, CA: Jossey-Bass.
Miller, A., & Cioffi, J. (2004). Measuring marketing effectiveness and value: the Unisys marketing Dashboard. Journal of Advertising Research, 44(3), 237-243. Miller, J. G. (1965). Living systems: Basic concepts. Behavioral Science. 10(3), 193-237. Mohd, W. M. B. W., Embong, A. & Zain, J. M. (2010). A framework of Dashboard system for higher education using graph-based visualization technique. Nephrology, Dialysis, Transplantation, Part I, CCIS 87, 55-69. Mohrman, S. A., Mohrman, A. M. & Ledford, G. E. (1989). Interventions that change
organizations. In A. M. Mohrman, S. A. Mohrman, G. E. Ledford, E. E. Lawler & Associates (Eds.), Large scale organizational change. San Francisco, CA: Jossey- Bass Inc., Publishers.
Mokros, H. B. & Ruben, B. D. (1991). Understanding the communication-information relationship: Levels of information and contexts of availabilities. Knowledge: Creation, Diffusion, Utilization, 12(4), 373-388.
Momentum, n. d. In Merriam-Webster’s online dictionary (11th ed.). Retrieved from http://www.merriam-webster.com/dictionary/momentum
215
Moullin, M. (2002). Delivering excellence in health and social care. Buckingham, UK: Open University Press. Nadler, D. A. & Tushman, M. L. (1990). Beyond the charismatic leader: Leadership and organizational change. California Management Review, 32(2), 77-97. Neely, A. (1999). The performance measurement revolution: Why now and what next?
International Journal of Operations and Production Management, 19(2), 205- 228.
Newcombe, J. P., & Conrad, C. F. (1981). A theory of mandated academic change. The Journal of Higher Education, 52(6), 555-577.
Northeastern University, Task force on undergraduate education. (2005). Transforming undergraduate education: Report of the task force on undergraduate education. (Third printing.) Retrieved from http://ur.rutgers.edu/ugtaskforce Ogbonna, E., & Wilkinson, B. (2003). The false promise of organizational culture change: A case study of middle managers in grocery retailing. Journal of Management Studies, 40, 1151-1178. Orlikowski, W. J. (1993). The duality of technology: Rethinking the concept of technology in organizations. Organization Science, 3(3), 398-427. Orlikowski, W. J. & Yates, J. (1994). Genre repertoire: The structuring of Communicative practices in organizations. Administrative Science Quarterly, 39, 541-574. Orum, A. M., Feagin, J. R., & Sjoberg, G. (1991). Introduction: The nature of the case study. In A. M. Orum, J. R. Feagin, G. Sjoberg (Eds.), A case for the case study. Chapel Hill, NC: The University of North Carolina Press. Ottaway, R. N. (1983). The change agent: A taxonomy in relation to the change process.
In M. Foster, L. Hilgendorf (Eds.), Human Relations, 36(1), p. 361-392. Outcome. (n.d.). In Merriam-Webster’s online dictionary (11th ed.). Retrieved from http://www.merriam-webster.com/dictionary/outcomes Piderit, S. K. (2000). Rethinking resistance and recognizing ambivalence: A multidimensional view of attitudes toward an organizational change. Academy of Management Review, 25(4), 783 – 794. Poole, M. S. (2009). Adaptive structuration theory. In E. Griffin (Ed.), A first look at
communication theory. (7th ed., pp. 235-246). New York: McGraw Hill. Poole, M. S., & DeSanctis, G. (1990). Understanding the use of group decision support systems. In J. Fulk & J. Steinfield (Eds.), Organizations and Communication Technology, Beverly Hills, CA: Sage, 173-193. Poole, M. S., & Van de Ven, A. H. (2004). Handbook of organizational change and
innovation. New York: Oxford University Press. Porras, J. I. (1987). Stream analysis. Reading, MA: Addison-Wesley. Porras, J. I. & Berg, P. O. (1978). The impact of organization development. Academy of
Management Review, 3, 249-266. Pride, n. d. In Merriam-Webster’s online dictionary (11th ed.). Retrieved from http://www.merriam-webster.com/dictionary/pride Process, n. d. In Merriam-Webster’s online dictionary (11th ed.). Retrieved from http://www.merriam-webster.com/dictionary/process Promote, n. d. In Merriam-Webster’s online dictionary (11th ed.). Retrieved from http://www.merriam-webster.com/dictionary/promote Redundancy, n. d. In Merriam-Webster’s online dictionary (11th ed.). Retrieved from
216
http://www.merriam-webster.com/dictionary/redundancy Ruben, B. D. (1979). General system theory. In R. W Budd, B. D. Ruben (Eds.),
Interdisciplinary approaches to human communication. (pp. 95-118). Rochelle Park, New Jersey: Hayden Book Company, Inc.
Ruben, B. D. (1983). A system-theoretic view. In W. B. Gudykunst (Ed.), Intercultural Communication Theory (pp. 131-145). Beverly Hills, CA: SAGE. Ruben, B. D. (1992). The communication-information relationship in system-theoretic perspective. Journal of the American Society for Information Science, 43(1), 15- 27. Ruben, B. D. (2007a). Higher education assessment: Linking accreditation standards and
the Malcolm Baldrige criteria [Electronic version]. New Directions for Higher Education, (137), 59-82.
Ruben, B. D. (2007b, September 15, 2009). Organizational assessment and outcomes measures.[PowerPoint presentation]. The Center for Organizational Development and Leadership. Rutgers, The State University of New Jersey, New Brunswick, NJ.
Ruben, B. D. (2008a). Understanding, Leading and Planning Social and Organizational Change. Washington, DC: National Association of College and University Business Officers.
Ruben, B. D. (2009a). Understanding, planning, and leading organizational change: Core concepts and strategies. Washington, DC: National Association of College and University Business Officers. Ruben, B. D. (2009b). Excellence in Higher Education Guide 2009: An Integrated Approach to Assessment, Planning and Improvement in Colleges and Universities. Washington, DC: National Association of College and University Business Officers. Ruben, B. D. (2009c). Excellence in Higher Education Workbook 2009: An Integrated
Approach to Assessment, Planning and Improvement in Colleges and Universities. Washington, DC: National Association of College and University Business Officers.
Ruben, B. D. & Kim, J. Y. Eds. (1975). General systems and human communication theory. Rochelle Park, NJ: Hayden.
Ruben, B. D., Lewis. L., Sandmeyer, L., Russ, T., Smulowitz, S., & Immordino, K. (2008). Assessing the impact of the Spellings commission: The message, the messenger, and the dynamics of change in higher education. Washington D.C.: National Association of Business Officers.
Ruben, B. D., Russ, T., Smulowitz, S., & Connaughton, S. L. (2007). Evaluating the impact of organizational self-assessment in higher education: The Malcolm Baldrige/Excellence in Higher Education framework. The Leadership & Organization Development Journal, 28(3), 230-250. Ruben, B. D., & Smulowitz, S. (2007). Core Communication. San Francisco, CA: IABC. Ruben, B. D., & Stewart, L. P. (2006). Communication and human behavior (5th ed.). Boston, Massachusetts, Pearson Education. Salancik, G. R., & Pfeffer, J. (1978). A social information approach to job attitudes and task design. Administrative Science Quarterly, 23, 224-252. Sashkin, M. & Burke, W. W. (1987). Organization development in the 1980’s. Journal of
217
Management, 13(2), 393-417. Schein, E. H. (1985). Organizational culture and leadership. San Francisco, CA: Jossey
-Bass. Schneider, B. (1990). The climate for service: An application for the climate construct. In B. Schneider (Ed.), Organizational climate and culture. (pp. 383-412). San Francisco, CA: Jossey-Bass Publishers. Secundo, G., Margherita, A., Elia, G., & Passiante, G. (2010). Intangible assets in higher education research: Mission, performance or both? Journal of Intellectual Capital, 11(2), 140-157). doi10.1108/14691931011039651 Self, J. (2003). From values to metrics: Implementation of the balanced scorecard at a university library. Performance Measurement and Metrics, 4(2), 57-73.
doi:10.1108/14678040310486891 Shapiro, D. L., Lewicki, R. J., & Devine, P. (1995). When do employees choose deceptive tactics to stop unwanted organizational change? Research on Negotiation in Organizations, 5: 155-184. Short Term, n. d. In Merriam-Webster’s online dictionary (11th ed.). Retrieved from http://www.merriam-webster.com/dictionary/short term Simsek, H, & Louis, K. S. (1994). Organizational change as paradigm shift: Analysis of
the change process in a large, public university [Electronic version]. The Journal of Higher Education, 65(6), 670-695.
Smith, A. G. (1979). Anthropology. In R. W Budd, B. D. Ruben (Eds.), Interdisciplinary approaches to human communication. (pp. 57-70). Rochelle Park, New Jersey: Hayden Book Company, Inc.
Smulowitz, S. M. (2006). When does culture really matter and to whom? Intercultural Communication Studies, 16(1), 1-13.
Smulowitz, S. (2011). An interview with Brent D. Ruben, Ph.D., Rutgers University, New Jersey.
Smulowitz, S. (2013). A review of the literature on planned organizational change in higher education versus industry. Unpublished manuscript. Stake, R. E. (2006). Multiple case study analysis. New York, NY: The Guilford Press. Stake, R. E. (1995). The art of case study research. Thousand Oaks, CA: Sage Publications, Inc. Standish Group. (2000). Extreme CHAOS. Retrieved from
www.standishgroup.com/sample_research/index.php Susman, G. I., & Evered, R. D. (1978). An Assessment of the Scientific Merits of Action
Research. Administrative Science Quarterly, 23 (4), 582-603 Tannenbaum, R., Kallejian, V., & Weschler, I. R. (1954). Training managers for leadership. Personnel, 30, 1-8. Terry, D. J., Callan, V. J., & Sartori, G. (1996). Employee adjustment to an organizational merger: Stress, coping and intergroup differences. Stress Medicine, 12, 105-122. Thayer, L. (1968). Communication and communication systems. Homewood, IL: Irwin. Thayer, L. (1979). Communication: Sine qua non of the behavioral sciences. In R. W Budd, B. D. Ruben (Eds.), Interdisciplinary approaches to human communication. (pp. 7-31). Rochelle Park, New Jersey: Hayden Book Company, Inc.
218
Timmerman, C. E. (2003). Media selection during the implementation of planned organizational change: A predictive framework based on implementation approach and phase. Management Communication Quarterly, 16 (3), 301-340. Turner, J. C. (1975). Social comparison and social identity: Some prospects for intergroup behaviour. European Journal of Social Psychology, 5(1), 5-34. Trice, H. M., & Beyer, J. M. (1993). The cultures of work organizations. Upper Saddle
River, NJ: Prentice Hall. Tromp, S. A, & Ruben, B. D. (2009). Strategic planning in higher education: A leader’s guide. Planning and Improvement in Colleges and Universities. 2nd Ed. Washington, DC: NACUBO. U.S. Department of Education. (2006). The Spellings Commission report. Washington, DC: Department of Education. Vakkuri, J, & Meklin, P. (2003). The impact of culture on the use of performance measurement information in the university setting. Management Decision, 41(8), 751-759. ValueBasedManagement.net (2009, April 29). Kaizen philosophy and Kaizen method. Retrieved from http://valuebasedmanagement.net/methods_kaizen.html Watson, T. J. (1982). Group ideologies and organizational change. Journal of Management Studies, 19 (3), 259-275. Weick, K. E. (1976). Educational organizations as loosely coupled systems. Administrative Science Quarterly, 21, 1-19. Retrieved from http://www2.johnson.cornell.edu/publications/asq/ Weick, K. E. (1979). The social psychology of organizing. (2nd ed.). Reading, MA: Addison-Wesley. Weick, K. E. (1995). Sensemaking in organizations. Thousand Oaks, CA: Sage. Weick, K. E. (2001). Making sense of the organization. Malden, MA: Blackwell Publishing. Weick, K. E., & Quinn, R. E. (1999). Organizational change and development. Annual Review of Psychology, 50, 361-386. Weisbord, M. R. (1987). Toward third-wave managing and consulting. Organizational Dynamics, 15(3), 5-24. Westley, B. H. & MacLean, M. S. (1970). A conceptual model for communications research. In K. K. Sereno & C. D. Mortensen (Eds.), Foundations of Communication Theory (pp. 103-107), New York, NY: Harper and Row Publishers. Wheatley, M. J., & Kellner-Rogers, M. (1998). Bringing life to organizational change. Journal of strategic performance measurement, April/May, 6-13. White, S. E. & Mitchell, T. R. (1976). Organization development: A review of research content and research design. The Academy of Management Review, 1(2), 57-73. Wiener, N. (1961). Cybernetics: or control and communication in the animal and the machine. New York, NY: MIT Press. Womack, J. P., & Jones, D. T. (2003). Lean thinking: Banish waste and create wealth in your corporation. New York, NY: Free Press. Yin, R. K. (1993). Case study research: Design and methods. 2nd Ed. In Applied Social Research Methods Series, Vol. 5, Thousand Oaks, CA: Sage Publications. Young, M., & Post, J. (1993). Managing to communicate, communicating to manage:
219
How leading companies communicate with employees. Organizational Dynamics, 22 , 31-43 Zorn, T., Christensen, L. T., & Cheney, G. (1999). Do we really want constant change?
Beyond the bottom line series. San Francisco, CA Berrett-Koehler Communications Inc.
Zumeta, W. M. (2011). What does it mean to be accountable? Dimensions and implications of higher education’s public accountability. Review of Higher Education, 35(1), 131-148.
"It must be considered that there is nothing more difficult to carry out, nor more doubtful of success, nor more dangerous to handle, than to initiate a new order of things."
~ Niccolo Machiavelli, The Prince ~
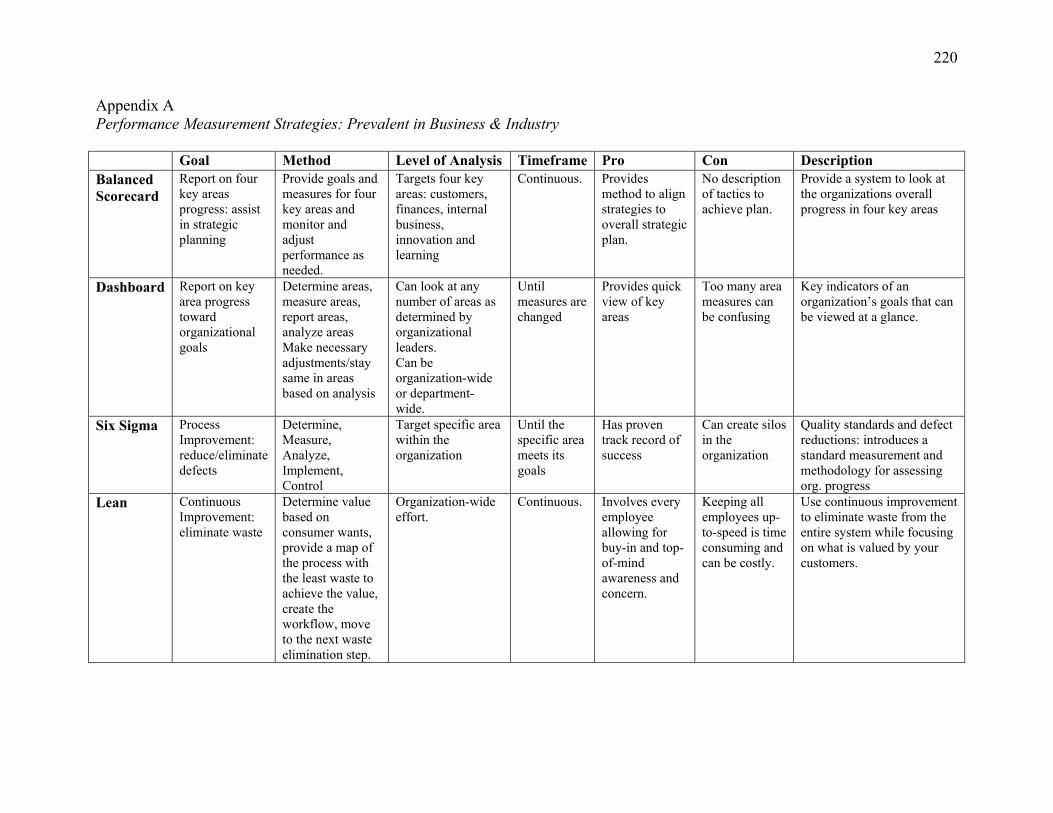
220
Appendix A Performance Measurement Strategies: Prevalent in Business & Industry Goal Method Level of Analysis Timeframe Pro Con Description Balanced Scorecard
Report on four key areas progress: assist in strategic planning
Provide goals and measures for four key areas and monitor and adjust performance as needed.
Targets four key areas: customers, finances, internal business, innovation and learning
Continuous. Provides method to align strategies to overall strategic plan.
No description of tactics to achieve plan.
Provide a system to look at the organizations overall progress in four key areas
Dashboard Report on key area progress toward organizational goals
Determine areas, measure areas, report areas, analyze areas Make necessary adjustments/stay same in areas based on analysis
Can look at any number of areas as determined by organizational leaders. Can be organization-wide or department-wide.
Until measures are changed
Provides quick view of key areas
Too many area measures can be confusing
Key indicators of an organization’s goals that can be viewed at a glance.
Six Sigma Process Improvement: reduce/eliminate defects
Determine, Measure, Analyze, Implement, Control
Target specific area within the organization
Until the specific area meets its goals
Has proven track record of success
Can create silos in the organization
Quality standards and defect reductions: introduces a standard measurement and methodology for assessing org. progress
Lean Continuous Improvement: eliminate waste
Determine value based on consumer wants, provide a map of the process with the least waste to achieve the value, create the workflow, move to the next waste elimination step.
Organization-wide effort.
Continuous. Involves every employee allowing for buy-in and top-of-mind awareness and concern.
Keeping all employees up-to-speed is time consuming and can be costly.
Use continuous improvement to eliminate waste from the entire system while focusing on what is valued by your customers.

221
Kaizen Continuous Improvement: bring change throughout the individual or organization.
Teamwork Personal Discipline Improved Morale Quality Circles Suggestions for Improvement
Can be used individually or at the organizational level.
Meant for long-term programs.
Good results in long-term programs with collective cultures.
Timeframe too long for many organizations.
Continuous improvement to eliminate waste and inefficiency, good housekeeping, and standardization.
MBNQA Review, planning, continuous improvement: integrate into everyday life.
Self-assessment tool.
Can be used at the organizational, departmental or project level.
Continuous. Self-assessment tool can be used at any level of analysis.
Implementation requires buy-in, time and resources from leadership.
Leadership, strategic planning, customer focus, measurement, analysis, knowledge management, workforce focus, process management, and results or outcome of product, customer, financial and market, workforce, process and leadership categories.
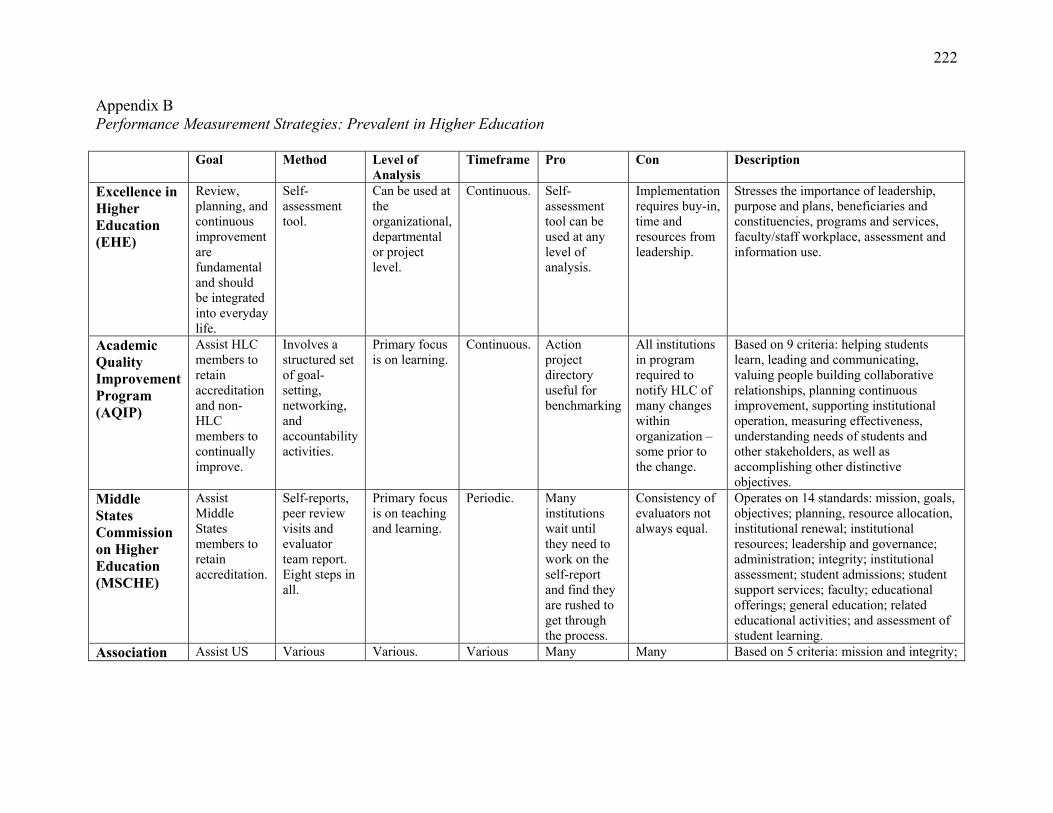
222
Appendix B Performance Measurement Strategies: Prevalent in Higher Education Goal Method Level of
Analysis Timeframe Pro Con Description
Excellence in Higher Education (EHE)
Review, planning, and continuous improvement are fundamental and should be integrated into everyday life.
Self-assessment tool.
Can be used at the organizational, departmental or project level.
Continuous. Self-assessment tool can be used at any level of analysis.
Implementation requires buy-in, time and resources from leadership.
Stresses the importance of leadership, purpose and plans, beneficiaries and constituencies, programs and services, faculty/staff workplace, assessment and information use.
Academic Quality Improvement Program (AQIP)
Assist HLC members to retain accreditation and non-HLC members to continually improve.
Involves a structured set of goal-setting, networking, and accountability activities.
Primary focus is on learning.
Continuous. Action project directory useful for benchmarking
All institutions in program required to notify HLC of many changes within organization – some prior to the change.
Based on 9 criteria: helping students learn, leading and communicating, valuing people building collaborative relationships, planning continuous improvement, supporting institutional operation, measuring effectiveness, understanding needs of students and other stakeholders, as well as accomplishing other distinctive objectives.
Middle States Commission on Higher Education (MSCHE)
Assist Middle States members to retain accreditation.
Self-reports, peer review visits and evaluator team report. Eight steps in all.
Primary focus is on teaching and learning.
Periodic. Many institutions wait until they need to work on the self-report and find they are rushed to get through the process.
Consistency of evaluators not always equal.
Operates on 14 standards: mission, goals, objectives; planning, resource allocation, institutional renewal; institutional resources; leadership and governance; administration; integrity; institutional assessment; student admissions; student support services; faculty; educational offerings; general education; related educational activities; and assessment of student learning.
Association Assist US Various Various. Various Many Many Based on 5 criteria: mission and integrity;
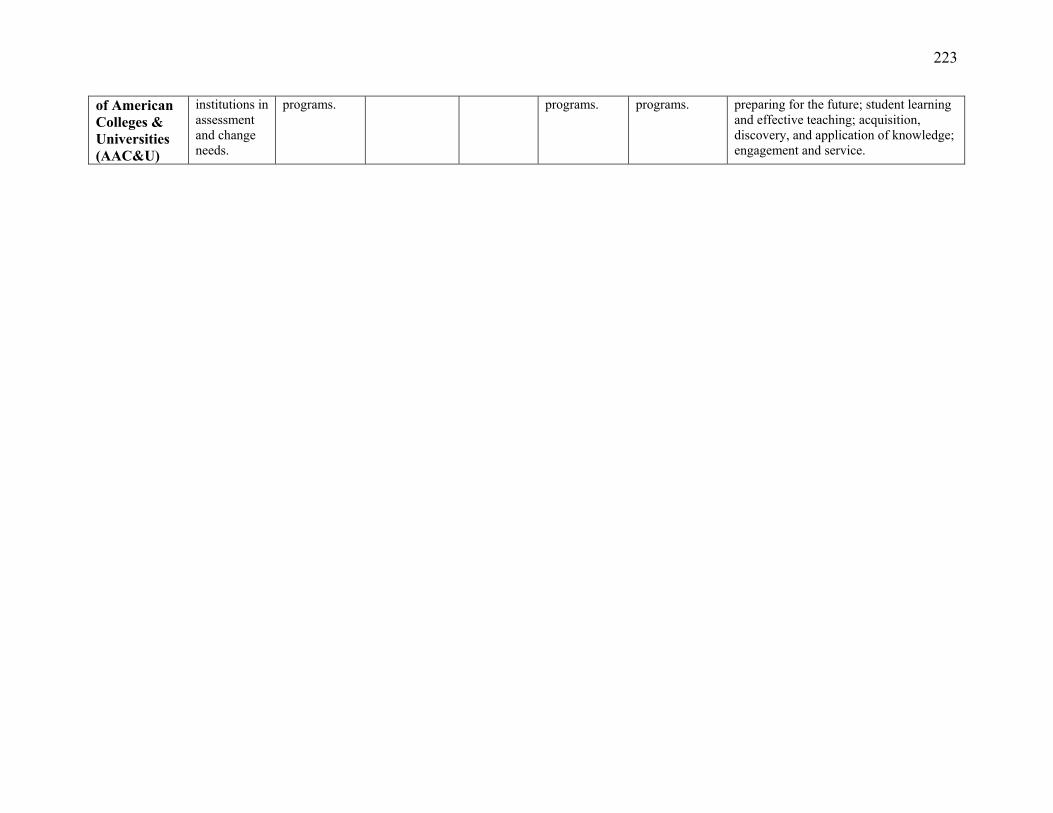
223
of American Colleges & Universities (AAC&U)
institutions in assessment and change needs.
programs. programs. programs. preparing for the future; student learning and effective teaching; acquisition, discovery, and application of knowledge; engagement and service.
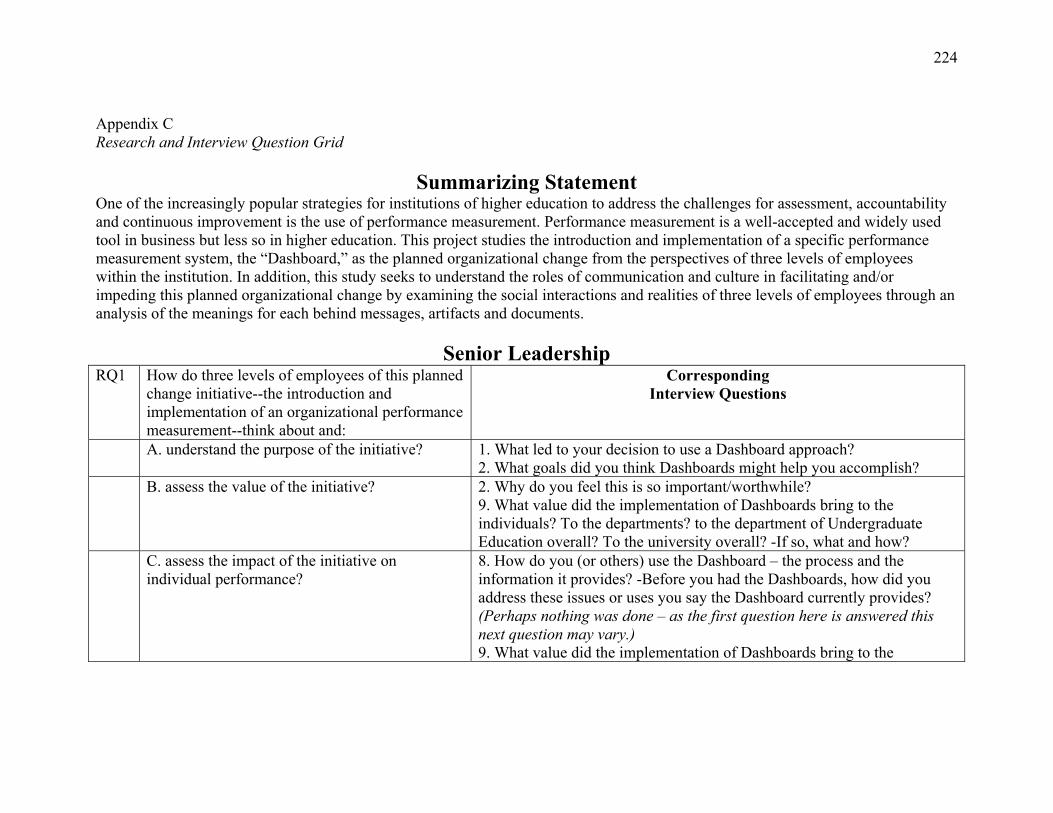
224
Appendix C Research and Interview Question Grid
Summarizing Statement One of the increasingly popular strategies for institutions of higher education to address the challenges for assessment, accountability and continuous improvement is the use of performance measurement. Performance measurement is a well-accepted and widely used tool in business but less so in higher education. This project studies the introduction and implementation of a specific performance measurement system, the “Dashboard,” as the planned organizational change from the perspectives of three levels of employees within the institution. In addition, this study seeks to understand the roles of communication and culture in facilitating and/or impeding this planned organizational change by examining the social interactions and realities of three levels of employees through an analysis of the meanings for each behind messages, artifacts and documents.
Senior Leadership RQ1 How do three levels of employees of this planned
change initiative--the introduction and implementation of an organizational performance measurement--think about and:
Corresponding Interview Questions
A. understand the purpose of the initiative? 1. What led to your decision to use a Dashboard approach? 2. What goals did you think Dashboards might help you accomplish?
B. assess the value of the initiative? 2. Why do you feel this is so important/worthwhile? 9. What value did the implementation of Dashboards bring to the individuals? To the departments? to the department of Undergraduate Education overall? To the university overall? -If so, what and how?
C. assess the impact of the initiative on individual performance?
8. How do you (or others) use the Dashboard – the process and the information it provides? -Before you had the Dashboards, how did you address these issues or uses you say the Dashboard currently provides? (Perhaps nothing was done – as the first question here is answered this next question may vary.) 9. What value did the implementation of Dashboards bring to the
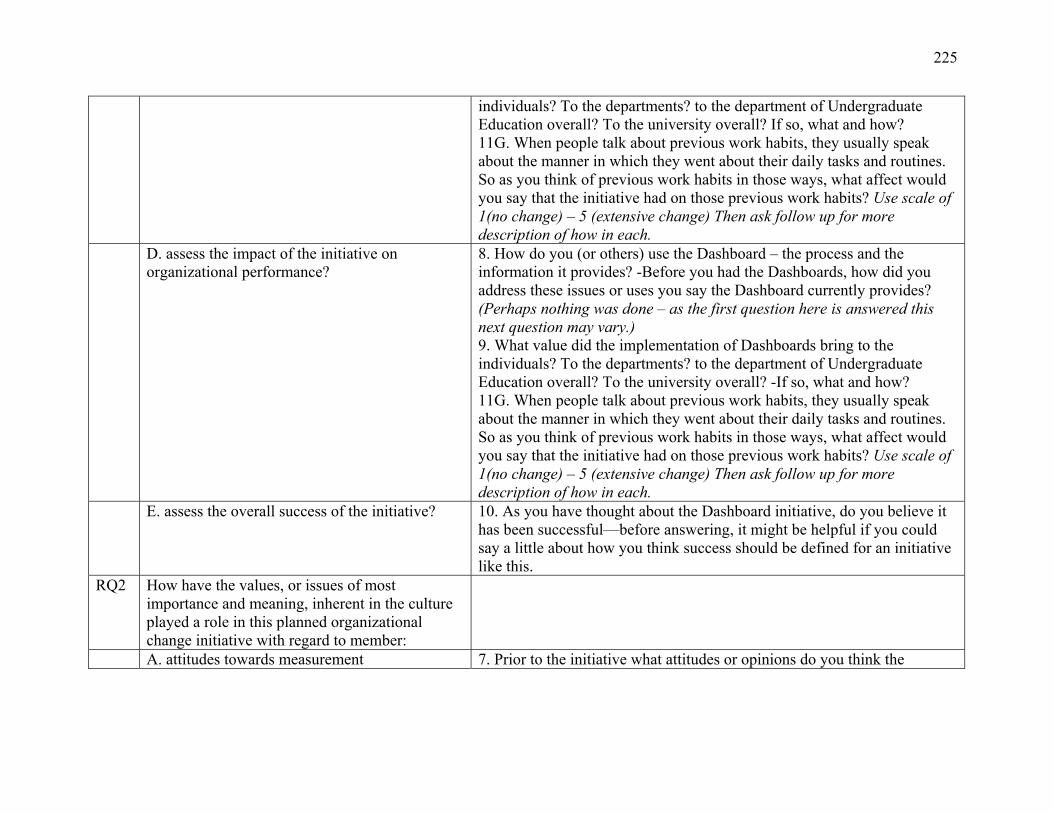
225
individuals? To the departments? to the department of Undergraduate Education overall? To the university overall? If so, what and how? 11G. When people talk about previous work habits, they usually speak about the manner in which they went about their daily tasks and routines. So as you think of previous work habits in those ways, what affect would you say that the initiative had on those previous work habits? Use scale of 1(no change) – 5 (extensive change) Then ask follow up for more description of how in each.
D. assess the impact of the initiative on organizational performance?
8. How do you (or others) use the Dashboard – the process and the information it provides? -Before you had the Dashboards, how did you address these issues or uses you say the Dashboard currently provides? (Perhaps nothing was done – as the first question here is answered this next question may vary.) 9. What value did the implementation of Dashboards bring to the individuals? To the departments? to the department of Undergraduate Education overall? To the university overall? -If so, what and how? 11G. When people talk about previous work habits, they usually speak about the manner in which they went about their daily tasks and routines. So as you think of previous work habits in those ways, what affect would you say that the initiative had on those previous work habits? Use scale of 1(no change) – 5 (extensive change) Then ask follow up for more description of how in each.
E. assess the overall success of the initiative? 10. As you have thought about the Dashboard initiative, do you believe it has been successful—before answering, it might be helpful if you could say a little about how you think success should be defined for an initiative like this.
RQ2 How have the values, or issues of most importance and meaning, inherent in the culture played a role in this planned organizational change initiative with regard to member:
A. attitudes towards measurement 7. Prior to the initiative what attitudes or opinions do you think the
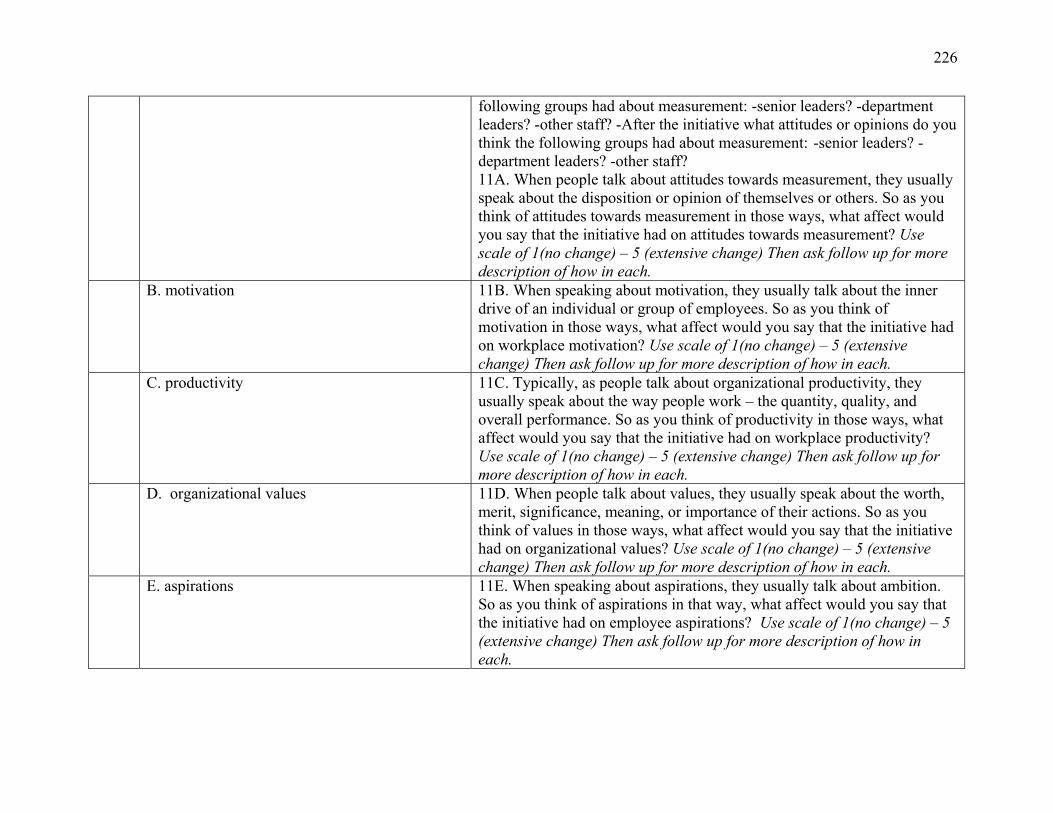
226
following groups had about measurement: -senior leaders? -department leaders? -other staff? -After the initiative what attitudes or opinions do you think the following groups had about measurement: -senior leaders? -department leaders? -other staff? 11A. When people talk about attitudes towards measurement, they usually speak about the disposition or opinion of themselves or others. So as you think of attitudes towards measurement in those ways, what affect would you say that the initiative had on attitudes towards measurement? Use scale of 1(no change) – 5 (extensive change) Then ask follow up for more description of how in each.
B. motivation 11B. When speaking about motivation, they usually talk about the inner drive of an individual or group of employees. So as you think of motivation in those ways, what affect would you say that the initiative had on workplace motivation? Use scale of 1(no change) – 5 (extensive change) Then ask follow up for more description of how in each.
C. productivity 11C. Typically, as people talk about organizational productivity, they usually speak about the way people work – the quantity, quality, and overall performance. So as you think of productivity in those ways, what affect would you say that the initiative had on workplace productivity? Use scale of 1(no change) – 5 (extensive change) Then ask follow up for more description of how in each.
D. organizational values 11D. When people talk about values, they usually speak about the worth, merit, significance, meaning, or importance of their actions. So as you think of values in those ways, what affect would you say that the initiative had on organizational values? Use scale of 1(no change) – 5 (extensive change) Then ask follow up for more description of how in each.
E. aspirations 11E. When speaking about aspirations, they usually talk about ambition. So as you think of aspirations in that way, what affect would you say that the initiative had on employee aspirations? Use scale of 1(no change) – 5 (extensive change) Then ask follow up for more description of how in each.
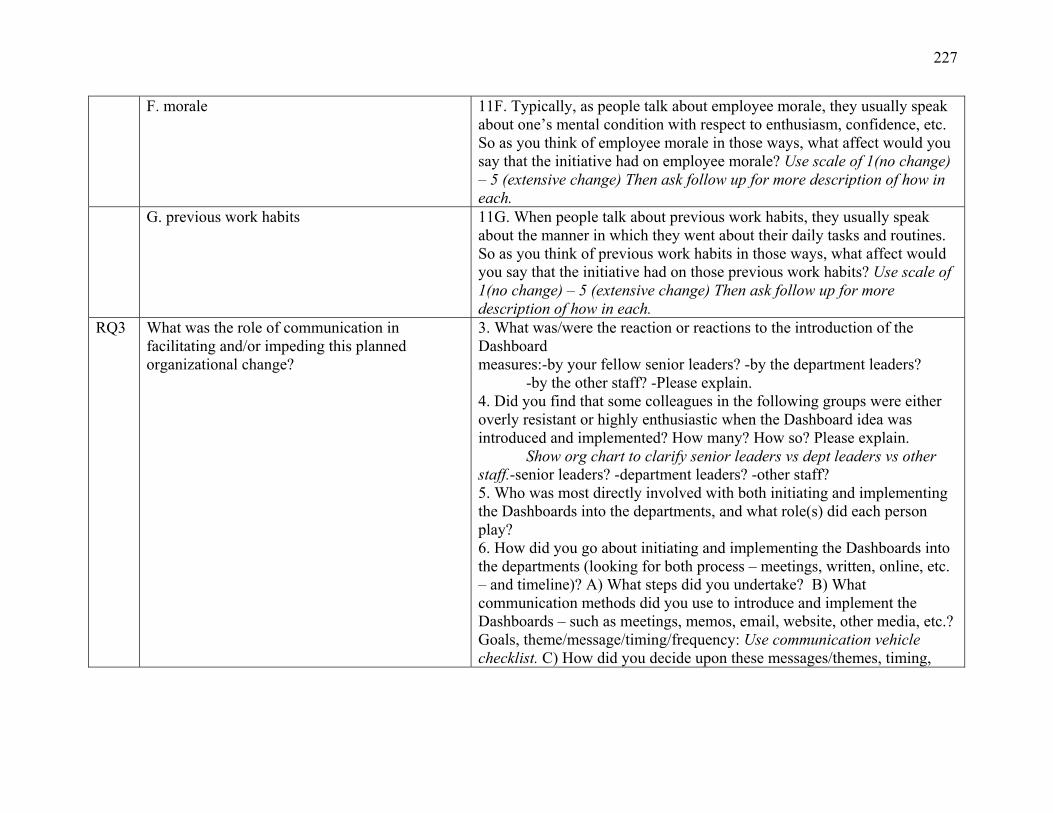
227
F. morale 11F. Typically, as people talk about employee morale, they usually speak about one’s mental condition with respect to enthusiasm, confidence, etc. So as you think of employee morale in those ways, what affect would you say that the initiative had on employee morale? Use scale of 1(no change) – 5 (extensive change) Then ask follow up for more description of how in each.
G. previous work habits 11G. When people talk about previous work habits, they usually speak about the manner in which they went about their daily tasks and routines. So as you think of previous work habits in those ways, what affect would you say that the initiative had on those previous work habits? Use scale of 1(no change) – 5 (extensive change) Then ask follow up for more description of how in each.
RQ3 What was the role of communication in facilitating and/or impeding this planned organizational change?
3. What was/were the reaction or reactions to the introduction of the Dashboard measures:-by your fellow senior leaders? -by the department leaders? -by the other staff? -Please explain. 4. Did you find that some colleagues in the following groups were either overly resistant or highly enthusiastic when the Dashboard idea was introduced and implemented? How many? How so? Please explain. Show org chart to clarify senior leaders vs dept leaders vs other staff.-senior leaders? -department leaders? -other staff? 5. Who was most directly involved with both initiating and implementing the Dashboards into the departments, and what role(s) did each person play? 6. How did you go about initiating and implementing the Dashboards into the departments (looking for both process – meetings, written, online, etc. – and timeline)? A) What steps did you undertake? B) What communication methods did you use to introduce and implement the Dashboards – such as meetings, memos, email, website, other media, etc.? Goals, theme/message/timing/frequency: Use communication vehicle checklist. C) How did you decide upon these messages/themes, timing,
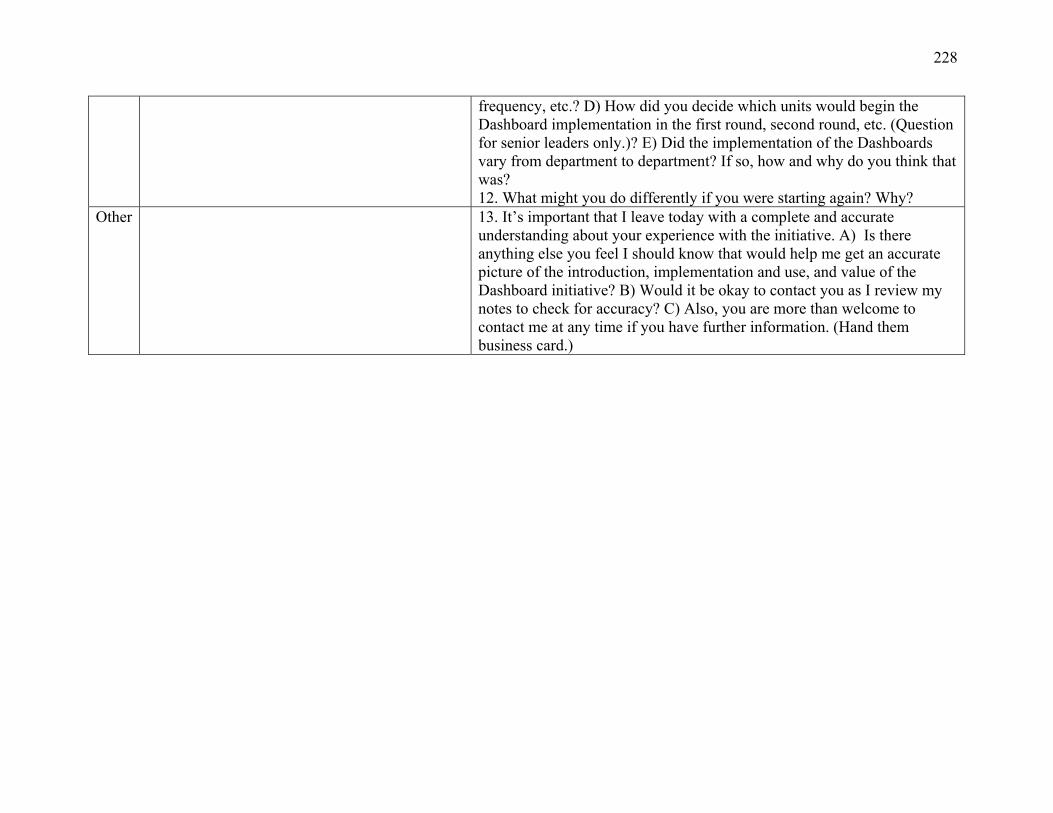
228
frequency, etc.? D) How did you decide which units would begin the Dashboard implementation in the first round, second round, etc. (Question for senior leaders only.)? E) Did the implementation of the Dashboards vary from department to department? If so, how and why do you think that was? 12. What might you do differently if you were starting again? Why?
Other 13. It’s important that I leave today with a complete and accurate understanding about your experience with the initiative. A) Is there anything else you feel I should know that would help me get an accurate picture of the introduction, implementation and use, and value of the Dashboard initiative? B) Would it be okay to contact you as I review my notes to check for accuracy? C) Also, you are more than welcome to contact me at any time if you have further information. (Hand them business card.)
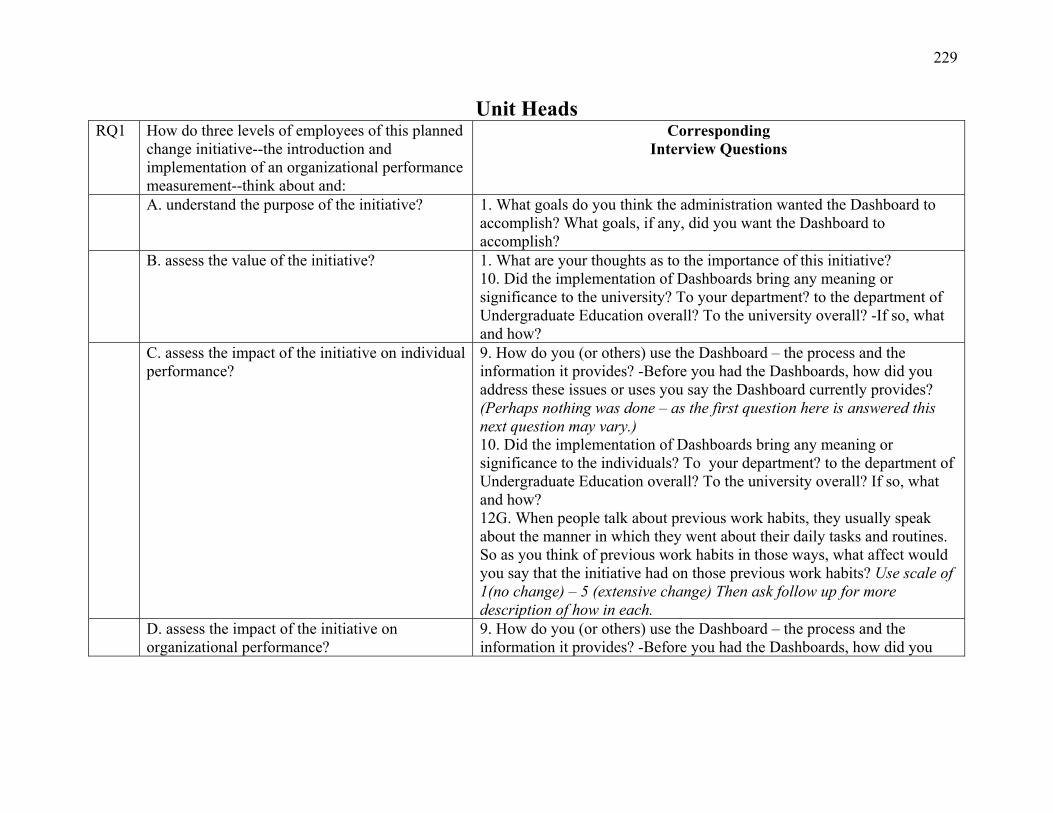
229
Unit Heads RQ1 How do three levels of employees of this planned
change initiative--the introduction and implementation of an organizational performance measurement--think about and:
Corresponding Interview Questions
A. understand the purpose of the initiative? 1. What goals do you think the administration wanted the Dashboard to accomplish? What goals, if any, did you want the Dashboard to accomplish?
B. assess the value of the initiative? 1. What are your thoughts as to the importance of this initiative? 10. Did the implementation of Dashboards bring any meaning or significance to the university? To your department? to the department of Undergraduate Education overall? To the university overall? -If so, what and how?
C. assess the impact of the initiative on individual performance?
9. How do you (or others) use the Dashboard – the process and the information it provides? -Before you had the Dashboards, how did you address these issues or uses you say the Dashboard currently provides? (Perhaps nothing was done – as the first question here is answered this next question may vary.) 10. Did the implementation of Dashboards bring any meaning or significance to the individuals? To your department? to the department of Undergraduate Education overall? To the university overall? If so, what and how? 12G. When people talk about previous work habits, they usually speak about the manner in which they went about their daily tasks and routines. So as you think of previous work habits in those ways, what affect would you say that the initiative had on those previous work habits? Use scale of 1(no change) – 5 (extensive change) Then ask follow up for more description of how in each.
D. assess the impact of the initiative on organizational performance?
9. How do you (or others) use the Dashboard – the process and the information it provides? -Before you had the Dashboards, how did you
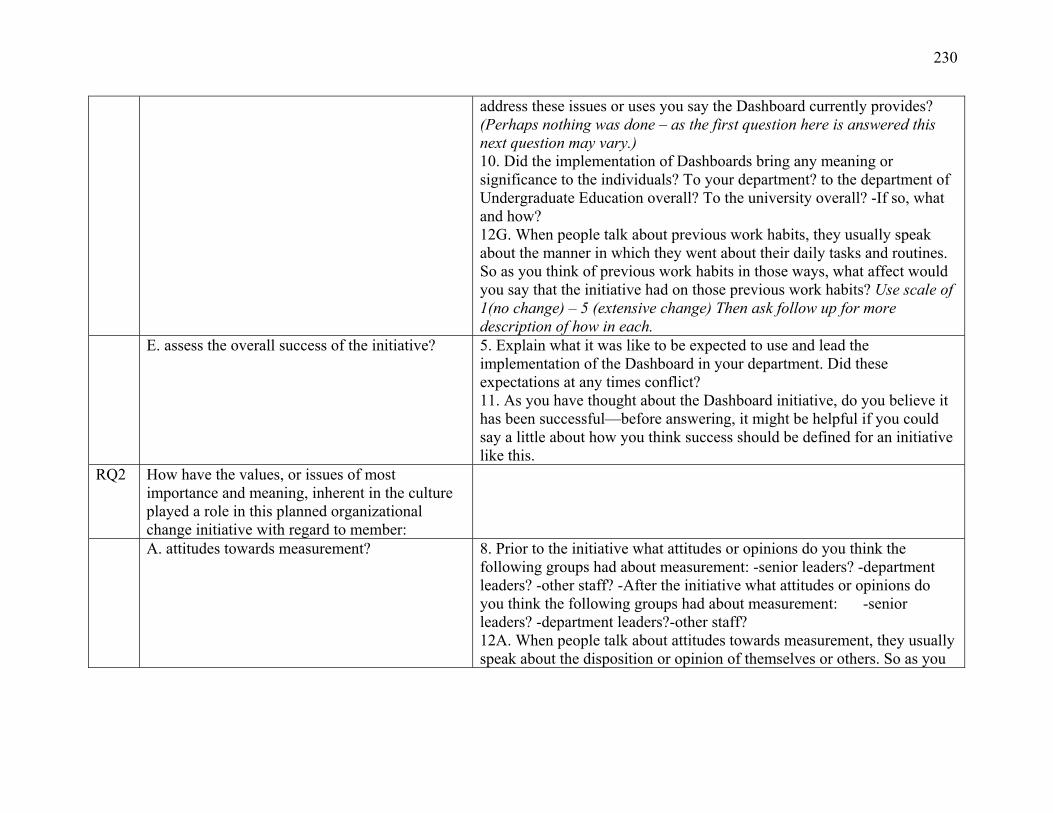
230
address these issues or uses you say the Dashboard currently provides? (Perhaps nothing was done – as the first question here is answered this next question may vary.) 10. Did the implementation of Dashboards bring any meaning or significance to the individuals? To your department? to the department of Undergraduate Education overall? To the university overall? -If so, what and how? 12G. When people talk about previous work habits, they usually speak about the manner in which they went about their daily tasks and routines. So as you think of previous work habits in those ways, what affect would you say that the initiative had on those previous work habits? Use scale of 1(no change) – 5 (extensive change) Then ask follow up for more description of how in each.
E. assess the overall success of the initiative? 5. Explain what it was like to be expected to use and lead the implementation of the Dashboard in your department. Did these expectations at any times conflict? 11. As you have thought about the Dashboard initiative, do you believe it has been successful—before answering, it might be helpful if you could say a little about how you think success should be defined for an initiative like this.
RQ2 How have the values, or issues of most importance and meaning, inherent in the culture played a role in this planned organizational change initiative with regard to member:
A. attitudes towards measurement? 8. Prior to the initiative what attitudes or opinions do you think the following groups had about measurement: -senior leaders? -department leaders? -other staff? -After the initiative what attitudes or opinions do you think the following groups had about measurement: -senior leaders? -department leaders?-other staff? 12A. When people talk about attitudes towards measurement, they usually speak about the disposition or opinion of themselves or others. So as you
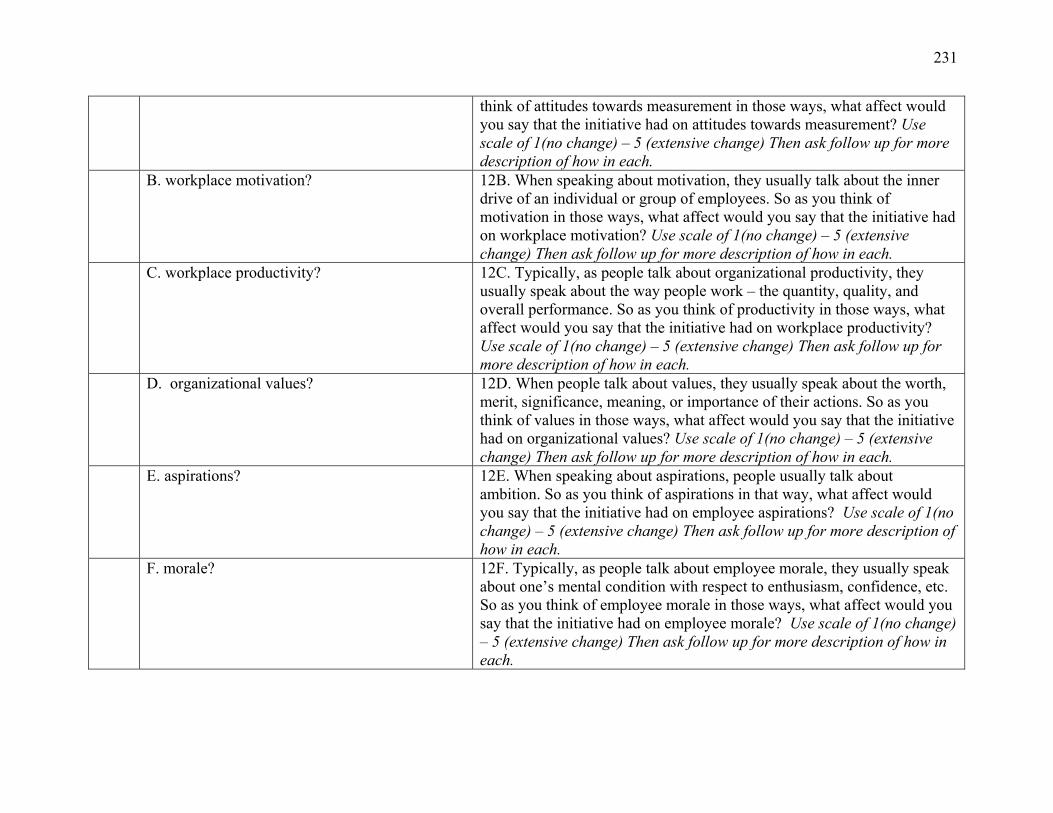
231
think of attitudes towards measurement in those ways, what affect would you say that the initiative had on attitudes towards measurement? Use scale of 1(no change) – 5 (extensive change) Then ask follow up for more description of how in each.
B. workplace motivation? 12B. When speaking about motivation, they usually talk about the inner drive of an individual or group of employees. So as you think of motivation in those ways, what affect would you say that the initiative had on workplace motivation? Use scale of 1(no change) – 5 (extensive change) Then ask follow up for more description of how in each.
C. workplace productivity? 12C. Typically, as people talk about organizational productivity, they usually speak about the way people work – the quantity, quality, and overall performance. So as you think of productivity in those ways, what affect would you say that the initiative had on workplace productivity? Use scale of 1(no change) – 5 (extensive change) Then ask follow up for more description of how in each.
D. organizational values? 12D. When people talk about values, they usually speak about the worth, merit, significance, meaning, or importance of their actions. So as you think of values in those ways, what affect would you say that the initiative had on organizational values? Use scale of 1(no change) – 5 (extensive change) Then ask follow up for more description of how in each.
E. aspirations? 12E. When speaking about aspirations, people usually talk about ambition. So as you think of aspirations in that way, what affect would you say that the initiative had on employee aspirations? Use scale of 1(no change) – 5 (extensive change) Then ask follow up for more description of how in each.
F. morale? 12F. Typically, as people talk about employee morale, they usually speak about one’s mental condition with respect to enthusiasm, confidence, etc. So as you think of employee morale in those ways, what affect would you say that the initiative had on employee morale? Use scale of 1(no change) – 5 (extensive change) Then ask follow up for more description of how in each.
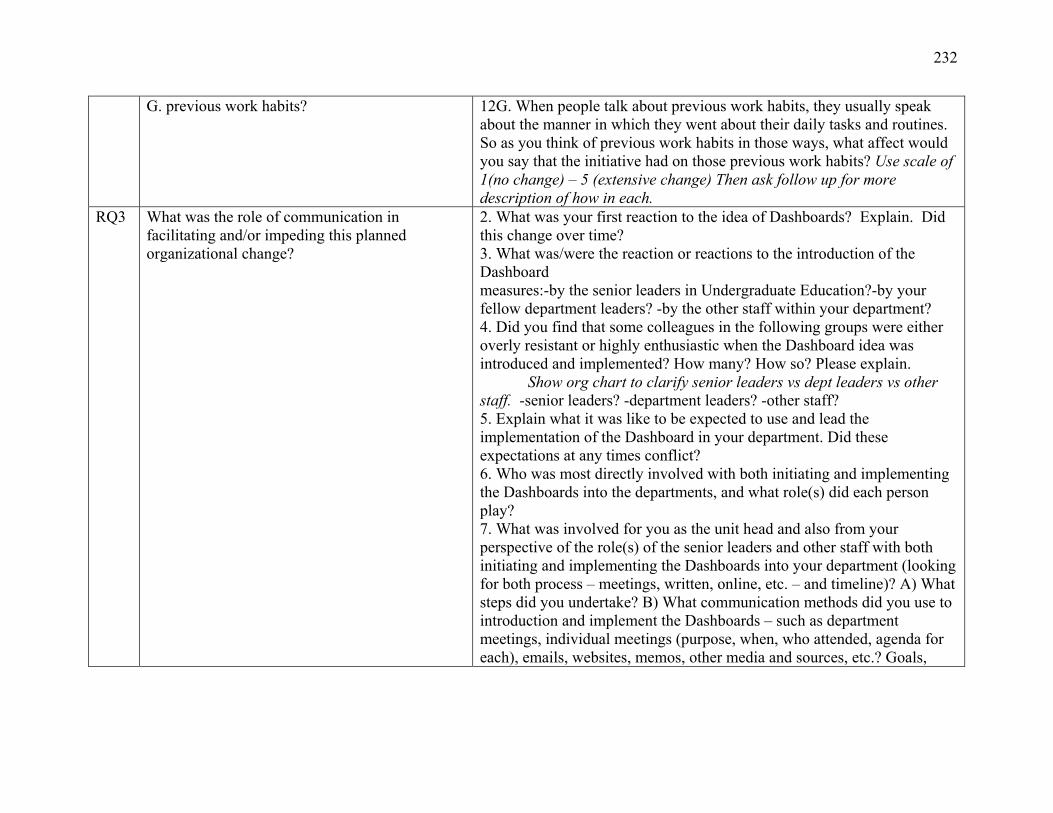
232
G. previous work habits? 12G. When people talk about previous work habits, they usually speak about the manner in which they went about their daily tasks and routines. So as you think of previous work habits in those ways, what affect would you say that the initiative had on those previous work habits? Use scale of 1(no change) – 5 (extensive change) Then ask follow up for more description of how in each.
RQ3 What was the role of communication in facilitating and/or impeding this planned organizational change?
2. What was your first reaction to the idea of Dashboards? Explain. Did this change over time? 3. What was/were the reaction or reactions to the introduction of the Dashboard measures:-by the senior leaders in Undergraduate Education?-by your fellow department leaders? -by the other staff within your department? 4. Did you find that some colleagues in the following groups were either overly resistant or highly enthusiastic when the Dashboard idea was introduced and implemented? How many? How so? Please explain. Show org chart to clarify senior leaders vs dept leaders vs other staff. -senior leaders? -department leaders? -other staff? 5. Explain what it was like to be expected to use and lead the implementation of the Dashboard in your department. Did these expectations at any times conflict? 6. Who was most directly involved with both initiating and implementing the Dashboards into the departments, and what role(s) did each person play? 7. What was involved for you as the unit head and also from your perspective of the role(s) of the senior leaders and other staff with both initiating and implementing the Dashboards into your department (looking for both process – meetings, written, online, etc. – and timeline)? A) What steps did you undertake? B) What communication methods did you use to introduction and implement the Dashboards – such as department meetings, individual meetings (purpose, when, who attended, agenda for each), emails, websites, memos, other media and sources, etc.? Goals,
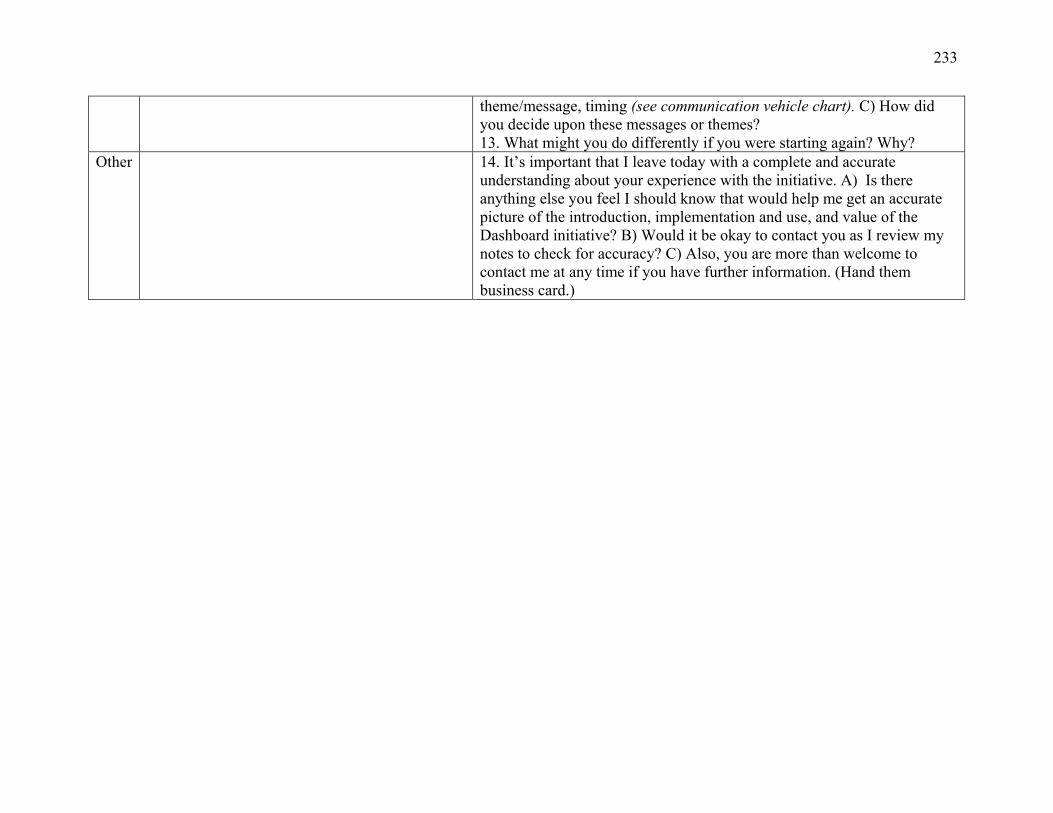
233
theme/message, timing (see communication vehicle chart). C) How did you decide upon these messages or themes? 13. What might you do differently if you were starting again? Why?
Other 14. It’s important that I leave today with a complete and accurate understanding about your experience with the initiative. A) Is there anything else you feel I should know that would help me get an accurate picture of the introduction, implementation and use, and value of the Dashboard initiative? B) Would it be okay to contact you as I review my notes to check for accuracy? C) Also, you are more than welcome to contact me at any time if you have further information. (Hand them business card.)
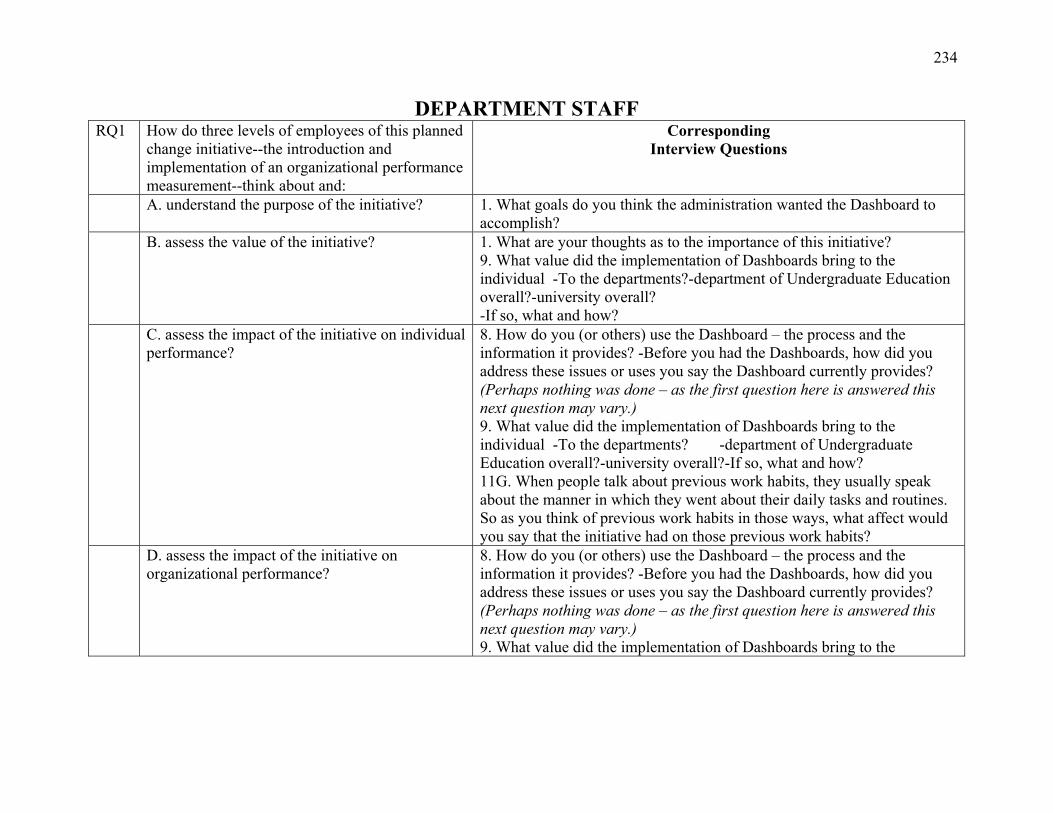
234
DEPARTMENT STAFF RQ1 How do three levels of employees of this planned
change initiative--the introduction and implementation of an organizational performance measurement--think about and:
Corresponding Interview Questions
A. understand the purpose of the initiative? 1. What goals do you think the administration wanted the Dashboard to accomplish?
B. assess the value of the initiative? 1. What are your thoughts as to the importance of this initiative? 9. What value did the implementation of Dashboards bring to the individual -To the departments?-department of Undergraduate Education overall?-university overall? -If so, what and how?
C. assess the impact of the initiative on individual performance?
8. How do you (or others) use the Dashboard – the process and the information it provides? -Before you had the Dashboards, how did you address these issues or uses you say the Dashboard currently provides? (Perhaps nothing was done – as the first question here is answered this next question may vary.) 9. What value did the implementation of Dashboards bring to the individual -To the departments? -department of Undergraduate Education overall?-university overall?-If so, what and how? 11G. When people talk about previous work habits, they usually speak about the manner in which they went about their daily tasks and routines. So as you think of previous work habits in those ways, what affect would you say that the initiative had on those previous work habits?
D. assess the impact of the initiative on organizational performance?
8. How do you (or others) use the Dashboard – the process and the information it provides? -Before you had the Dashboards, how did you address these issues or uses you say the Dashboard currently provides? (Perhaps nothing was done – as the first question here is answered this next question may vary.) 9. What value did the implementation of Dashboards bring to the
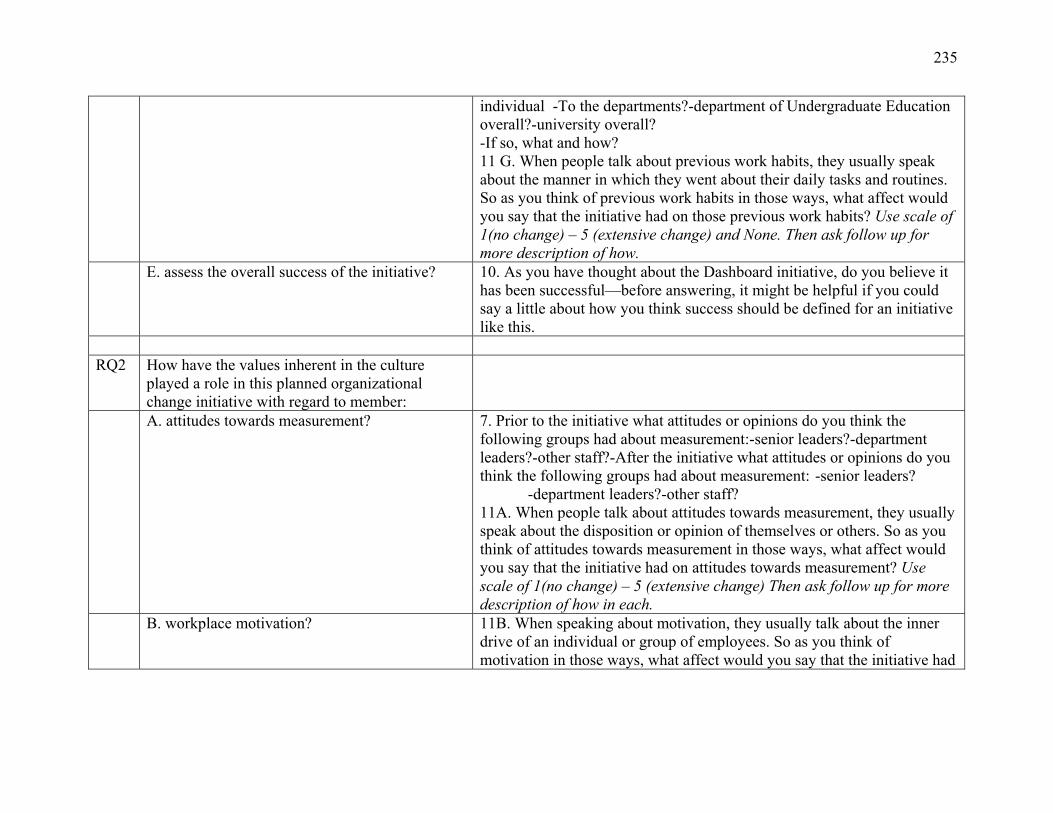
235
individual -To the departments?-department of Undergraduate Education overall?-university overall? -If so, what and how? 11 G. When people talk about previous work habits, they usually speak about the manner in which they went about their daily tasks and routines. So as you think of previous work habits in those ways, what affect would you say that the initiative had on those previous work habits? Use scale of 1(no change) – 5 (extensive change) and None. Then ask follow up for more description of how.
E. assess the overall success of the initiative? 10. As you have thought about the Dashboard initiative, do you believe it has been successful—before answering, it might be helpful if you could say a little about how you think success should be defined for an initiative like this.
RQ2 How have the values inherent in the culture
played a role in this planned organizational change initiative with regard to member:
A. attitudes towards measurement? 7. Prior to the initiative what attitudes or opinions do you think the following groups had about measurement:-senior leaders?-department leaders?-other staff?-After the initiative what attitudes or opinions do you think the following groups had about measurement: -senior leaders? -department leaders?-other staff? 11A. When people talk about attitudes towards measurement, they usually speak about the disposition or opinion of themselves or others. So as you think of attitudes towards measurement in those ways, what affect would you say that the initiative had on attitudes towards measurement? Use scale of 1(no change) – 5 (extensive change) Then ask follow up for more description of how in each.
B. workplace motivation? 11B. When speaking about motivation, they usually talk about the inner drive of an individual or group of employees. So as you think of motivation in those ways, what affect would you say that the initiative had
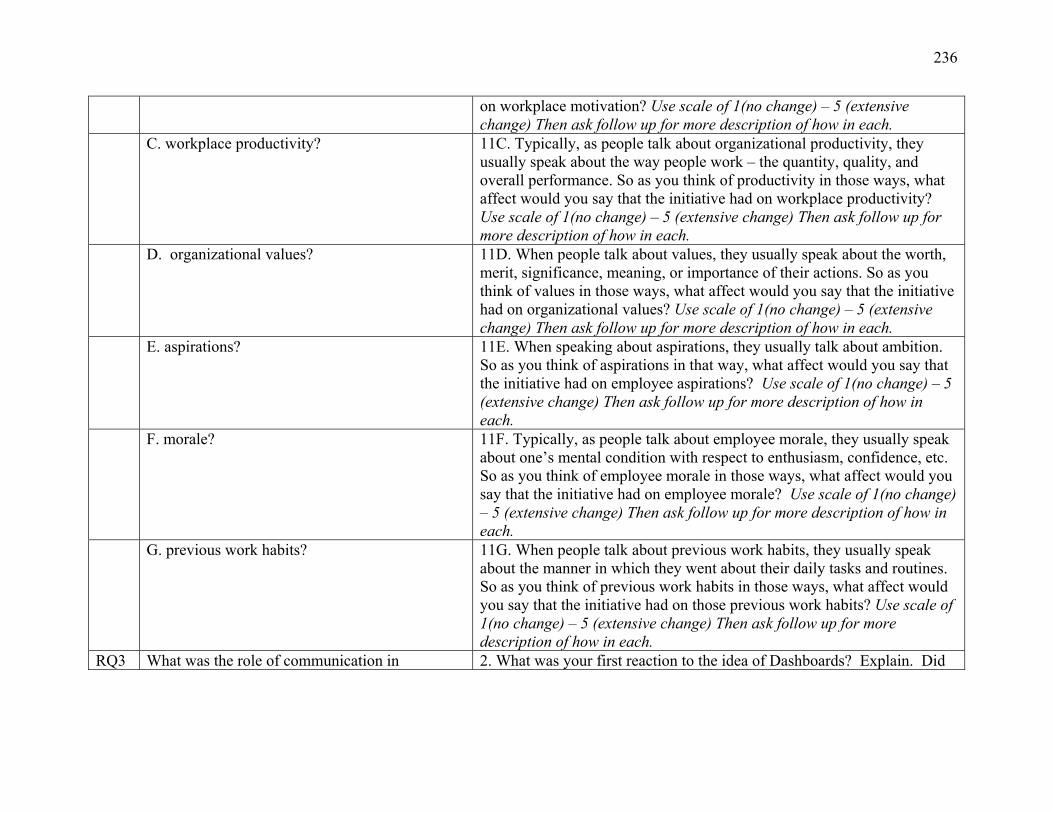
236
on workplace motivation? Use scale of 1(no change) – 5 (extensive change) Then ask follow up for more description of how in each.
C. workplace productivity? 11C. Typically, as people talk about organizational productivity, they usually speak about the way people work – the quantity, quality, and overall performance. So as you think of productivity in those ways, what affect would you say that the initiative had on workplace productivity? Use scale of 1(no change) – 5 (extensive change) Then ask follow up for more description of how in each.
D. organizational values? 11D. When people talk about values, they usually speak about the worth, merit, significance, meaning, or importance of their actions. So as you think of values in those ways, what affect would you say that the initiative had on organizational values? Use scale of 1(no change) – 5 (extensive change) Then ask follow up for more description of how in each.
E. aspirations? 11E. When speaking about aspirations, they usually talk about ambition. So as you think of aspirations in that way, what affect would you say that the initiative had on employee aspirations? Use scale of 1(no change) – 5 (extensive change) Then ask follow up for more description of how in each.
F. morale? 11F. Typically, as people talk about employee morale, they usually speak about one’s mental condition with respect to enthusiasm, confidence, etc. So as you think of employee morale in those ways, what affect would you say that the initiative had on employee morale? Use scale of 1(no change) – 5 (extensive change) Then ask follow up for more description of how in each.
G. previous work habits? 11G. When people talk about previous work habits, they usually speak about the manner in which they went about their daily tasks and routines. So as you think of previous work habits in those ways, what affect would you say that the initiative had on those previous work habits? Use scale of 1(no change) – 5 (extensive change) Then ask follow up for more description of how in each.
RQ3 What was the role of communication in 2. What was your first reaction to the idea of Dashboards? Explain. Did
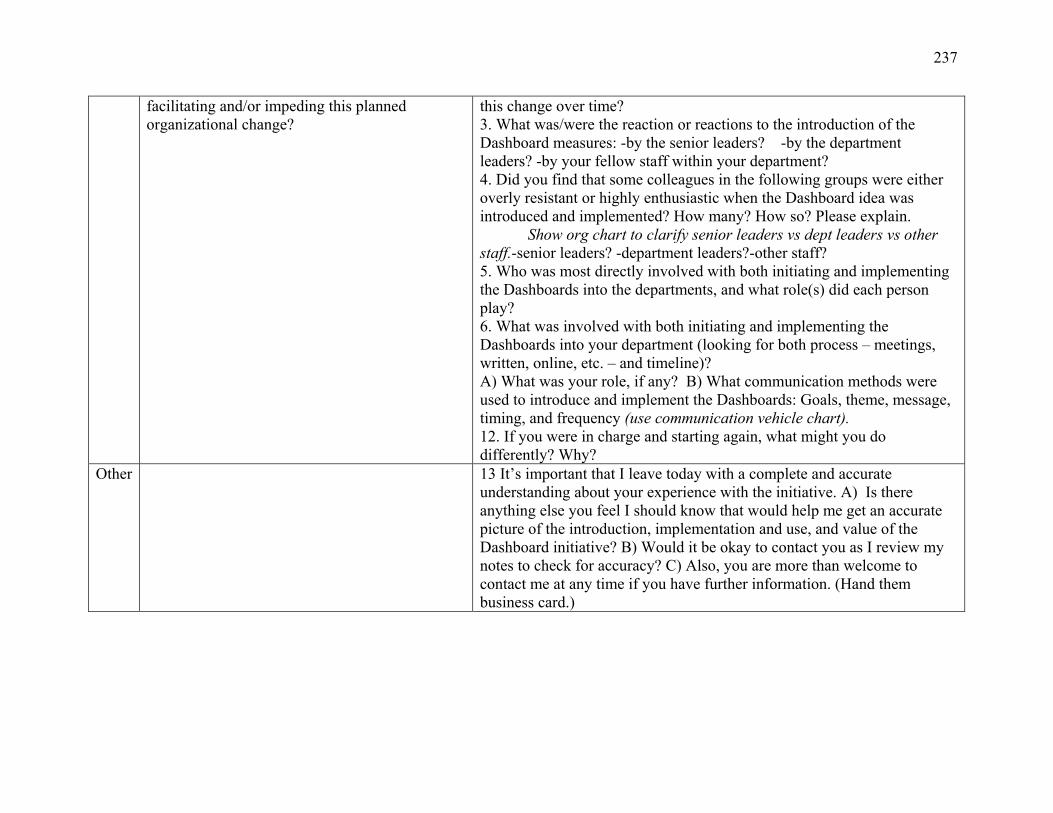
237
facilitating and/or impeding this planned organizational change?
this change over time? 3. What was/were the reaction or reactions to the introduction of the Dashboard measures: -by the senior leaders? -by the department leaders? -by your fellow staff within your department? 4. Did you find that some colleagues in the following groups were either overly resistant or highly enthusiastic when the Dashboard idea was introduced and implemented? How many? How so? Please explain. Show org chart to clarify senior leaders vs dept leaders vs other staff.-senior leaders? -department leaders?-other staff? 5. Who was most directly involved with both initiating and implementing the Dashboards into the departments, and what role(s) did each person play? 6. What was involved with both initiating and implementing the Dashboards into your department (looking for both process – meetings, written, online, etc. – and timeline)? A) What was your role, if any? B) What communication methods were used to introduce and implement the Dashboards: Goals, theme, message, timing, and frequency (use communication vehicle chart). 12. If you were in charge and starting again, what might you do differently? Why?
Other 13 It’s important that I leave today with a complete and accurate understanding about your experience with the initiative. A) Is there anything else you feel I should know that would help me get an accurate picture of the introduction, implementation and use, and value of the Dashboard initiative? B) Would it be okay to contact you as I review my notes to check for accuracy? C) Also, you are more than welcome to contact me at any time if you have further information. (Hand them business card.)
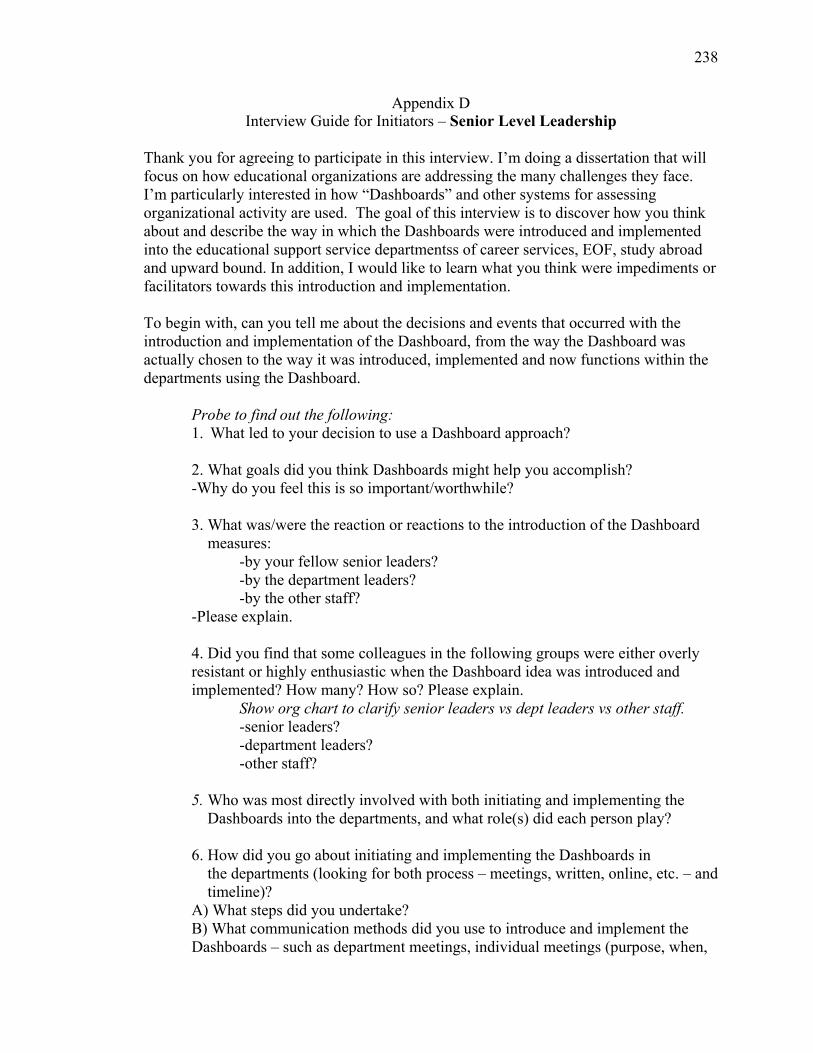
238
Appendix D Interview Guide for Initiators – Senior Level Leadership
Thank you for agreeing to participate in this interview. I’m doing a dissertation that will focus on how educational organizations are addressing the many challenges they face. I’m particularly interested in how “Dashboards” and other systems for assessing organizational activity are used. The goal of this interview is to discover how you think about and describe the way in which the Dashboards were introduced and implemented into the educational support service departmentss of career services, EOF, study abroad and upward bound. In addition, I would like to learn what you think were impediments or facilitators towards this introduction and implementation. To begin with, can you tell me about the decisions and events that occurred with the introduction and implementation of the Dashboard, from the way the Dashboard was actually chosen to the way it was introduced, implemented and now functions within the departments using the Dashboard.
Probe to find out the following: 1. What led to your decision to use a Dashboard approach? 2. What goals did you think Dashboards might help you accomplish? -Why do you feel this is so important/worthwhile? 3. What was/were the reaction or reactions to the introduction of the Dashboard measures:
-by your fellow senior leaders? -by the department leaders?
-by the other staff? -Please explain. 4. Did you find that some colleagues in the following groups were either overly resistant or highly enthusiastic when the Dashboard idea was introduced and implemented? How many? How so? Please explain. Show org chart to clarify senior leaders vs dept leaders vs other staff. -senior leaders? -department leaders? -other staff? 5. Who was most directly involved with both initiating and implementing the Dashboards into the departments, and what role(s) did each person play? 6. How did you go about initiating and implementing the Dashboards in the departments (looking for both process – meetings, written, online, etc. – and timeline)? A) What steps did you undertake? B) What communication methods did you use to introduce and implement the Dashboards – such as department meetings, individual meetings (purpose, when,
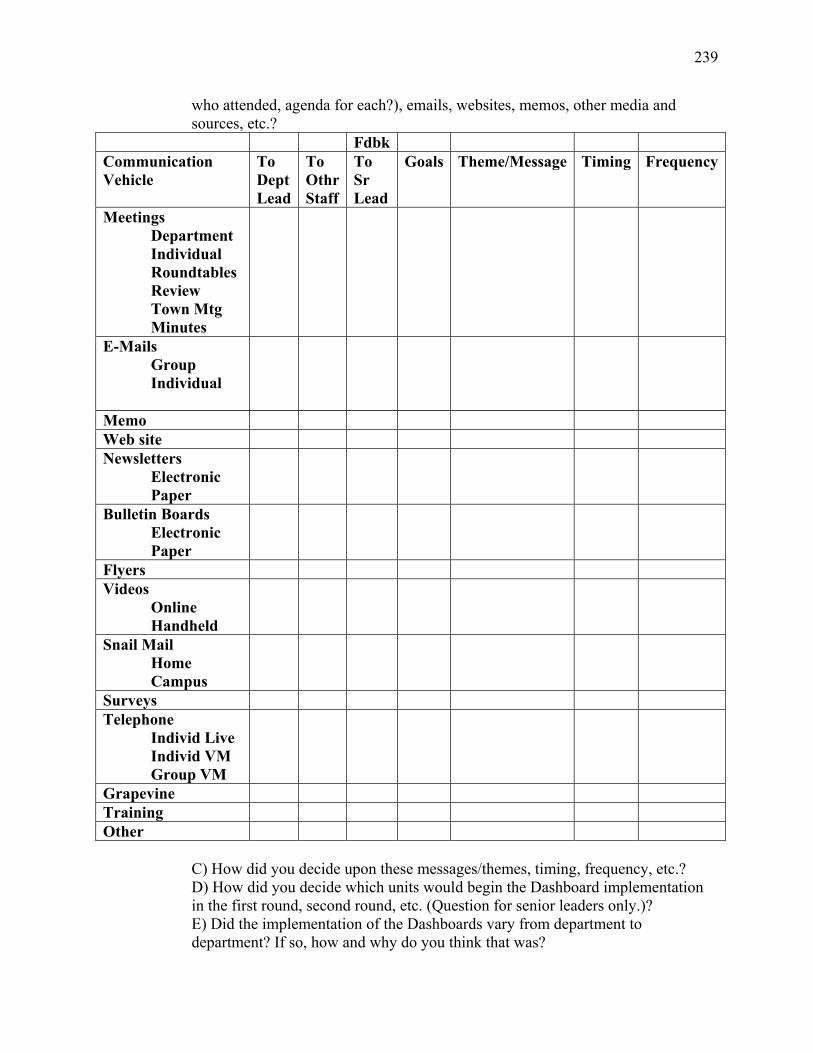
239
who attended, agenda for each?), emails, websites, memos, other media and sources, etc.?
Fdbk Communication Vehicle
To Dept Lead
To Othr Staff
To Sr Lead
Goals Theme/Message Timing Frequency
Meetings Department Individual Roundtables Review Town Mtg Minutes
E-Mails Group Individual
Memo Web site Newsletters Electronic Paper
Bulletin Boards Electronic Paper
Flyers Videos Online Handheld
Snail Mail Home Campus
Surveys Telephone Individ Live Individ VM Group VM
Grapevine Training Other
C) How did you decide upon these messages/themes, timing, frequency, etc.? D) How did you decide which units would begin the Dashboard implementation in the first round, second round, etc. (Question for senior leaders only.)? E) Did the implementation of the Dashboards vary from department to department? If so, how and why do you think that was?
240
7. Prior to the initiative what attitudes or opinions do you think the following groups had about measurement: -senior leaders? -department leaders? -other staff? -After the initiative what attitudes or opinions do you think the following groups had about measurement: -senior leaders? -department leaders? -other staff? 8 . How do you (or others) use the Dashboard – the process and the information it provides? -Before you had the Dashboards, how did you address these issues or uses you say the Dashboard currently provides? (Perhaps nothing was done – as the first question here is answered this next question may vary.) 9. What value did the implementation of Dashboards bring to the:
-individuals? -departments? -department of Undergraduate Education overall? -university overall?
-If so, what and how?
10. As you have thought about the Dashboard initiative, do you believe it has been successful—before answering, it might be helpful if you could say a little about how you think success should be defined for an initiative like this. 11. Use scale of 1(no change) – 5 (extensive change)
Then ask follow up for more description of how in each. A. When people talk about attitudes towards measurement, they usually
speak about the disposition or opinion of themselves or others. So as you think of attitudes towards measurement in those ways, what affect would you say that the initiative had on attitudes towards measurement?
B. When speaking about motivation, people usually talk about the inner drive of an individual or group of employees. So as you think of motivation in those ways, what affect would you say that the initiative had on workplace motivation?
C. Typically, as people talk about organizational productivity, they usually speak about the way people work – the quantity, quality, and overall performance. So as you think of productivity in those ways, what affect would you say that the initiative had on workplace productivity?
D. When people talk about values, they usually speak about the worth, merit, significance, meaning, or importance of their actions. So as you think of
241
values in those ways, what affect would you say that the initiative had on organizational values?
E. When speaking about aspirations, people usually talk about ambition. So as you think of aspirations in that way, what affect would you say that the initiative had on employee aspirations?
F. Typically, as people talk about employee morale, they usually speak about one’s mental condition with respect to enthusiasm, confidence, etc. So as you think of employee morale in those ways, what affect would you say that the initiative had on employee morale?
G. When people talk about previous work habits, they usually speak about the manner in which they went about their daily tasks and routines. So as you think of previous work habits in those ways, what affect would you say that the initiative had on those previous work habits? 12. What might you do differently if you were starting again? Why? 13. It’s important that I leave today with a complete and accurate understanding about your experience with the initiative. A) Is there anything else you feel I should know that would help me get an accurate picture of the introduction, implementation and use, and value of the Dashboard initiative? B) Would it be okay to contact you as I review my notes to check for accuracy? C) Also, you are more than welcome to contact me at any time if you have further information. (Hand them business card.)
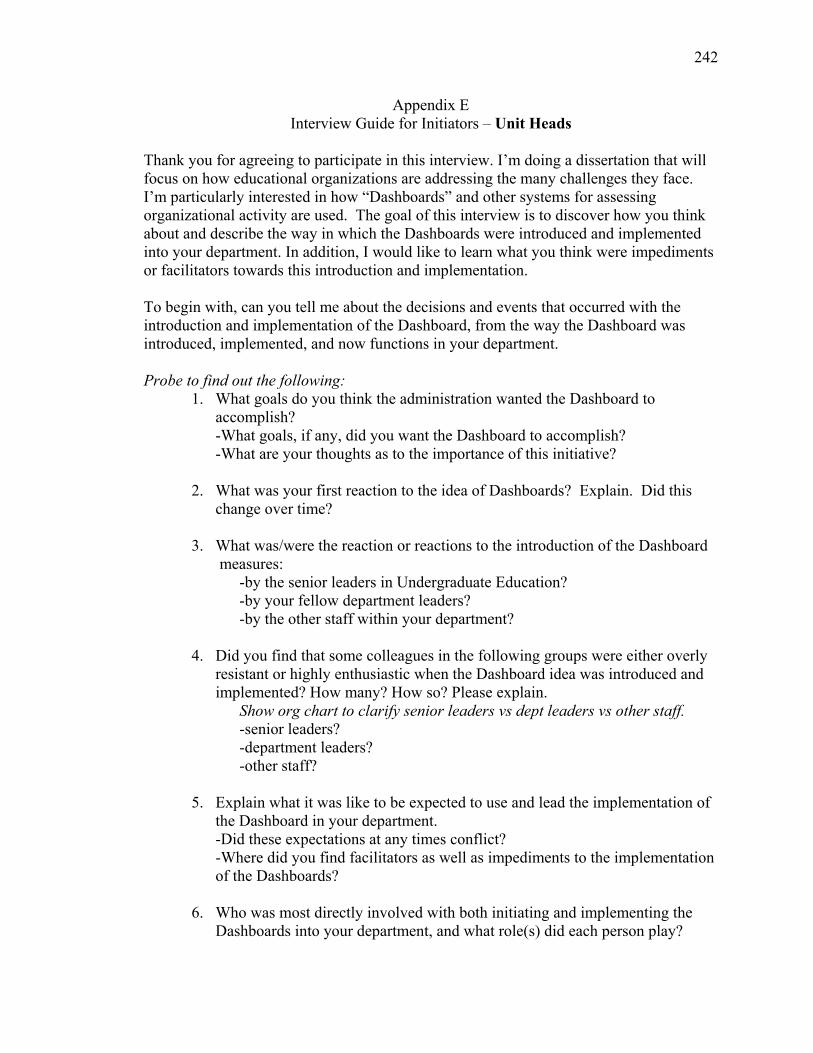
242
Appendix E Interview Guide for Initiators – Unit Heads
Thank you for agreeing to participate in this interview. I’m doing a dissertation that will focus on how educational organizations are addressing the many challenges they face. I’m particularly interested in how “Dashboards” and other systems for assessing organizational activity are used. The goal of this interview is to discover how you think about and describe the way in which the Dashboards were introduced and implemented into your department. In addition, I would like to learn what you think were impediments or facilitators towards this introduction and implementation. To begin with, can you tell me about the decisions and events that occurred with the introduction and implementation of the Dashboard, from the way the Dashboard was introduced, implemented, and now functions in your department. Probe to find out the following:
1. What goals do you think the administration wanted the Dashboard to accomplish? -What goals, if any, did you want the Dashboard to accomplish? -What are your thoughts as to the importance of this initiative?
2. What was your first reaction to the idea of Dashboards? Explain. Did this change over time?
3. What was/were the reaction or reactions to the introduction of the Dashboard measures: -by the senior leaders in Undergraduate Education? -by your fellow department leaders? -by the other staff within your department?
4. Did you find that some colleagues in the following groups were either overly resistant or highly enthusiastic when the Dashboard idea was introduced and implemented? How many? How so? Please explain. Show org chart to clarify senior leaders vs dept leaders vs other staff. -senior leaders? -department leaders? -other staff?
5. Explain what it was like to be expected to use and lead the implementation of the Dashboard in your department. -Did these expectations at any times conflict? -Where did you find facilitators as well as impediments to the implementation of the Dashboards?
6. Who was most directly involved with both initiating and implementing the Dashboards into your department, and what role(s) did each person play?
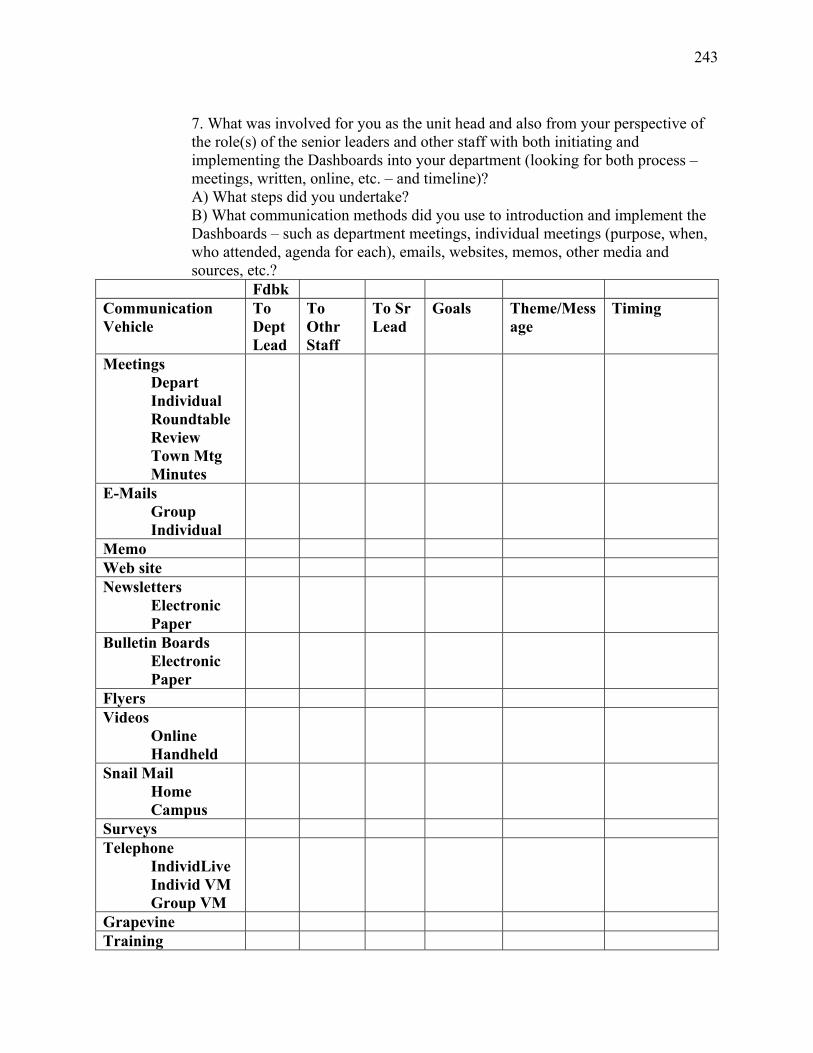
243
7. What was involved for you as the unit head and also from your perspective of the role(s) of the senior leaders and other staff with both initiating and implementing the Dashboards into your department (looking for both process – meetings, written, online, etc. – and timeline)? A) What steps did you undertake? B) What communication methods did you use to introduction and implement the Dashboards – such as department meetings, individual meetings (purpose, when, who attended, agenda for each), emails, websites, memos, other media and sources, etc.?
Fdbk Communication Vehicle
To Dept Lead
To Othr Staff
To Sr Lead
Goals Theme/Message
Timing
Meetings Depart Individual Roundtable Review Town Mtg Minutes
E-Mails Group Individual
Memo Web site Newsletters Electronic Paper
Bulletin Boards Electronic Paper
Flyers Videos Online Handheld
Snail Mail Home Campus
Surveys Telephone IndividLive Individ VM Group VM
Grapevine Training
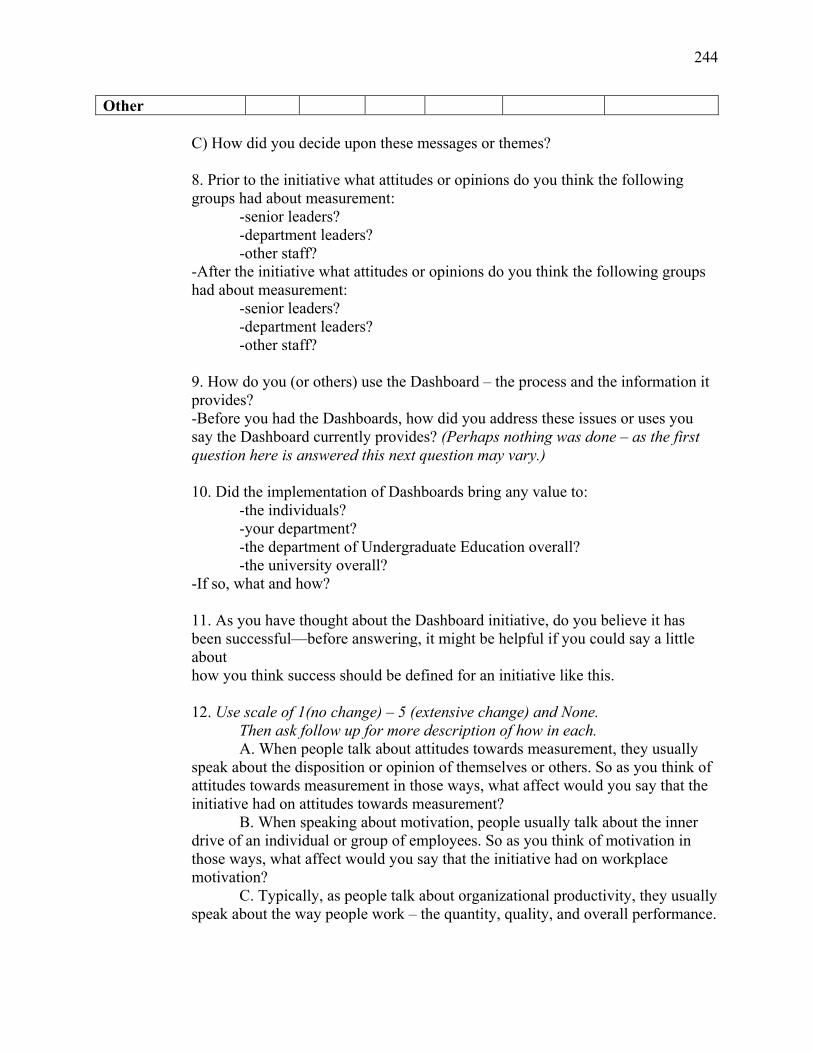
244
Other C) How did you decide upon these messages or themes?
8. Prior to the initiative what attitudes or opinions do you think the following groups had about measurement: -senior leaders? -department leaders? -other staff? -After the initiative what attitudes or opinions do you think the following groups had about measurement: -senior leaders? -department leaders? -other staff? 9. How do you (or others) use the Dashboard – the process and the information it provides? -Before you had the Dashboards, how did you address these issues or uses you say the Dashboard currently provides? (Perhaps nothing was done – as the first question here is answered this next question may vary.) 10. Did the implementation of Dashboards bring any value to:
-the individuals? -your department? -the department of Undergraduate Education overall? -the university overall?
-If so, what and how? 11. As you have thought about the Dashboard initiative, do you believe it has been successful—before answering, it might be helpful if you could say a little about how you think success should be defined for an initiative like this. 12. Use scale of 1(no change) – 5 (extensive change) and None.
Then ask follow up for more description of how in each. A. When people talk about attitudes towards measurement, they usually
speak about the disposition or opinion of themselves or others. So as you think of attitudes towards measurement in those ways, what affect would you say that the initiative had on attitudes towards measurement?
B. When speaking about motivation, people usually talk about the inner drive of an individual or group of employees. So as you think of motivation in those ways, what affect would you say that the initiative had on workplace motivation?
C. Typically, as people talk about organizational productivity, they usually speak about the way people work – the quantity, quality, and overall performance.
245
So as you think of productivity in those ways, what affect would you say that the initiative had on workplace productivity?
D. When people talk about values, they usually speak about the worth, merit, significance, meaning, or importance of their actions. So as you think of values in those ways, what affect would you say that the initiative had on organizational values?
E. When speaking about aspirations, people usually talk about ambition. So as you think of aspirations in that way, what affect would you say that the initiative had on employee aspirations?
F. Typically, as people talk about employee morale, they usually speak about one’s mental condition with respect to enthusiasm, confidence, etc. So as you think of employee morale in those ways, what affect would you say that the initiative had on employee morale?
G. When people talk about previous work habits, they usually speak about the manner in which they went about their daily tasks and routines. So as you think of previous work habits in those ways, what affect would you say that the initiative had on those previous work habits? 13. What might you do differently if you were starting again? Why? 14. It’s important that I leave today with a complete and accurate understanding about your experience with the initiative. A) Is there anything else you feel I should know that would help me get an accurate picture of the introduction, implementation and use, and value of the Dashboard initiative? B) Would it be okay to contact you as I review my notes to check for accuracy? C) Also, you are more than welcome to contact me at any time if you have further information. (Hand them business card.)
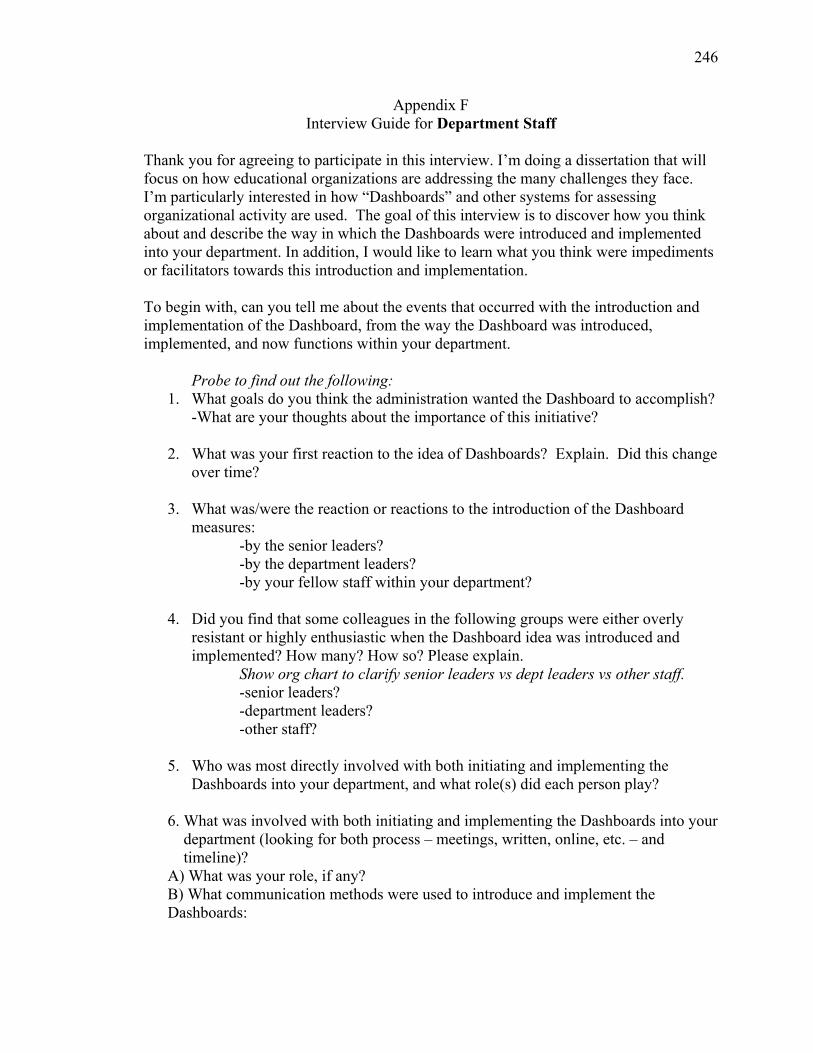
246
Appendix F Interview Guide for Department Staff
Thank you for agreeing to participate in this interview. I’m doing a dissertation that will focus on how educational organizations are addressing the many challenges they face. I’m particularly interested in how “Dashboards” and other systems for assessing organizational activity are used. The goal of this interview is to discover how you think about and describe the way in which the Dashboards were introduced and implemented into your department. In addition, I would like to learn what you think were impediments or facilitators towards this introduction and implementation. To begin with, can you tell me about the events that occurred with the introduction and implementation of the Dashboard, from the way the Dashboard was introduced, implemented, and now functions within your department.
Probe to find out the following: 1. What goals do you think the administration wanted the Dashboard to accomplish?
-What are your thoughts about the importance of this initiative?
2. What was your first reaction to the idea of Dashboards? Explain. Did this change over time?
3. What was/were the reaction or reactions to the introduction of the Dashboard measures: -by the senior leaders? -by the department leaders? -by your fellow staff within your department?
4. Did you find that some colleagues in the following groups were either overly resistant or highly enthusiastic when the Dashboard idea was introduced and implemented? How many? How so? Please explain. Show org chart to clarify senior leaders vs dept leaders vs other staff. -senior leaders? -department leaders? -other staff?
5. Who was most directly involved with both initiating and implementing the Dashboards into your department, and what role(s) did each person play?
6. What was involved with both initiating and implementing the Dashboards into your department (looking for both process – meetings, written, online, etc. – and timeline)? A) What was your role, if any? B) What communication methods were used to introduce and implement the Dashboards:
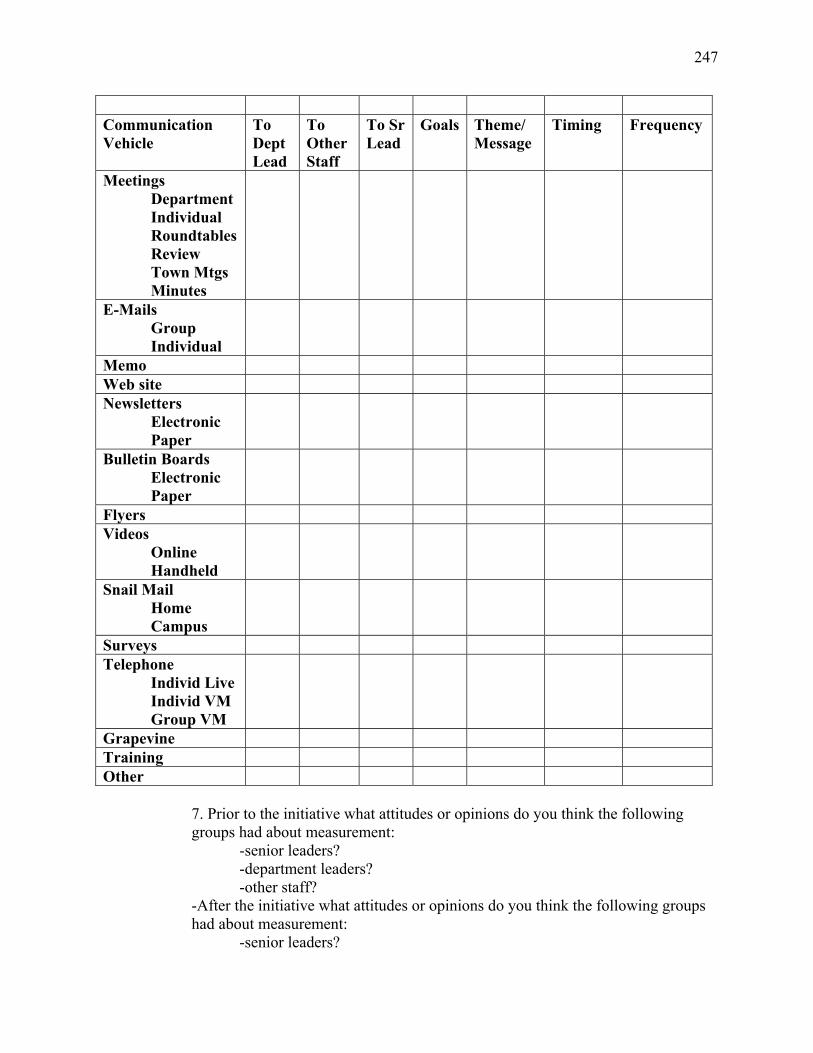
247
Communication Vehicle
To Dept Lead
To Other Staff
To Sr Lead
Goals Theme/Message
Timing Frequency
Meetings Department Individual Roundtables Review Town Mtgs Minutes
E-Mails Group Individual
Memo Web site Newsletters Electronic Paper
Bulletin Boards Electronic Paper
Flyers Videos Online Handheld
Snail Mail Home Campus
Surveys Telephone Individ Live Individ VM Group VM
Grapevine Training Other
7. Prior to the initiative what attitudes or opinions do you think the following groups had about measurement: -senior leaders? -department leaders? -other staff? -After the initiative what attitudes or opinions do you think the following groups had about measurement: -senior leaders?
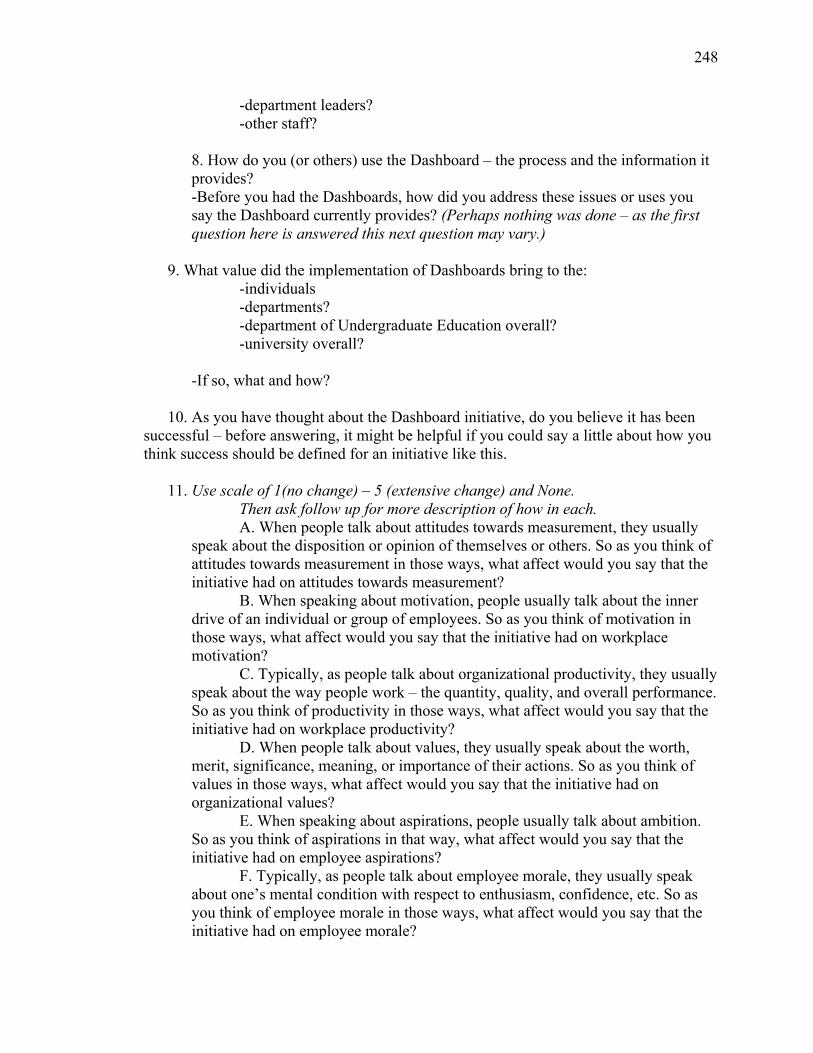
248
-department leaders? -other staff?
8. How do you (or others) use the Dashboard – the process and the information it provides? -Before you had the Dashboards, how did you address these issues or uses you say the Dashboard currently provides? (Perhaps nothing was done – as the first question here is answered this next question may vary.)
9. What value did the implementation of Dashboards bring to the: -individuals
-departments? -department of Undergraduate Education overall? -university overall?
-If so, what and how? 10. As you have thought about the Dashboard initiative, do you believe it has been
successful – before answering, it might be helpful if you could say a little about how you think success should be defined for an initiative like this.
11. Use scale of 1(no change) – 5 (extensive change) and None.
Then ask follow up for more description of how in each. A. When people talk about attitudes towards measurement, they usually
speak about the disposition or opinion of themselves or others. So as you think of attitudes towards measurement in those ways, what affect would you say that the initiative had on attitudes towards measurement?
B. When speaking about motivation, people usually talk about the inner drive of an individual or group of employees. So as you think of motivation in those ways, what affect would you say that the initiative had on workplace motivation?
C. Typically, as people talk about organizational productivity, they usually speak about the way people work – the quantity, quality, and overall performance. So as you think of productivity in those ways, what affect would you say that the initiative had on workplace productivity?
D. When people talk about values, they usually speak about the worth, merit, significance, meaning, or importance of their actions. So as you think of values in those ways, what affect would you say that the initiative had on organizational values?
E. When speaking about aspirations, people usually talk about ambition. So as you think of aspirations in that way, what affect would you say that the initiative had on employee aspirations?
F. Typically, as people talk about employee morale, they usually speak about one’s mental condition with respect to enthusiasm, confidence, etc. So as you think of employee morale in those ways, what affect would you say that the initiative had on employee morale?
249
G. When people talk about previous work habits, they usually speak about the manner in which they went about their daily tasks and routines. So as you think of previous work habits in those ways, what affect would you say that the initiative had on those previous work habits?
12. If you were in charge and starting again, what might you do differently? Why?
13. It’s important that I leave today with a complete and accurate understanding about your experience with the initiative.
A) Is there anything else you feel I should know that would help me get an accurate picture of the introduction, implementation and use, and value of the Dashboard initiative? B) Would it be okay to contact you as I review my notes to check for accuracy? C) Also, you are more than welcome to contact me at any time if you have further information. (Hand them business card.)