Embed Size (px)
Citation preview
1
MEAN VS. VARIANCE: HYDROLOGIC CONTROLS ON WETLAND STRUCTURE AND FUNCTION
By
JOSEPH M. DELESANTRO
A THESIS PRESENTED TO THE GRADUATE SCHOOL OF THE UNIVERSITY OF FLORIDA IN PARTIAL FULFILLMENT
OF THE REQUIREMENTS FOR THE DEGREE OF MASTER OF SCIENCE
UNIVERSITY OF FLORIDA
2013

2
© 2013 Joseph M. Delesantro

3
To my friends and family

4
ACKNOWLEDGMENTS
I would like to thank my advisor, Matthew Cohen, and committee members,
Katherine Ewel and Mark Brown for all their guidance and support. I would also like to
thank Lawrence Korhnak who spent untold hours knee deep in muck with me along the
Silver River. Without Larry’s experience and patience this project would not have been
possible. I would also like to thank Daniel Mclaughlin and David Kaplan who were
always there when I needed a sounding bored or advice in my work.

5
TABLE OF CONTENTS page
ACKNOWLEDGMENTS .................................................................................................. 4
LIST OF TABLES ............................................................................................................ 7
LIST OF FIGURES .......................................................................................................... 8
LIST OF ABBREVIATIONS ............................................................................................. 9
ABSTRACT ................................................................................................................... 10
CHAPTER
1 INTRODUCTION .................................................................................................... 12
2 METHODS .............................................................................................................. 19
Study Area .............................................................................................................. 19 Hydrologic Evaluation ............................................................................................. 20 Productivity ............................................................................................................. 23 Forest Community Structure ................................................................................... 24 Organic Matter Accumulation .................................................................................. 24 Microtopography ..................................................................................................... 26 Statistical Analysis .................................................................................................. 26
3 RESULTS ............................................................................................................... 31
Sit Hydrology and Orthogonal Gradients ................................................................ 31 Forest Community Structure ................................................................................... 31 Productivity ............................................................................................................. 32 Morphological Adaptations ...................................................................................... 34 Organic Matter Accumulation .................................................................................. 34 Microtopography ..................................................................................................... 35
4 DISCUSSION ......................................................................................................... 47
Comparing Silver River Floodplain to Other Floodplains ........................................ 48 Dual Control of Ecosystem Metrics ......................................................................... 49 Cypress Knees ....................................................................................................... 52 Contingent Effects of Hydrology ............................................................................. 53 Soil Organic Matter Recalcitrance Peak ................................................................. 54
Management Implications ...................................................................................... 55

6
APPENDIX
A ADDITIONAL SITE CHARACTERISTICS ............................................................... 57
B BASAL AREA AND COVER BY SPECIES ............................................................. 58
C ANNUAL LITTERFALL ........................................................................................... 60
D SOIL CORE DATA .................................................................................................. 61
LIST OF REFERENCES ............................................................................................... 64
BIOGRAPHICAL SKETCH ............................................................................................ 71

7
LIST OF TABLES
Table page 3-1 Hydrologic characteristics of study sites along the Silver River .......................... 37
3-2 Characteristics of study sites along the Silver River ........................................... 38
3-3 Litterfall of study sites along the Silver River ...................................................... 39
A-1 Leaf litterfall indexed to species basal area ........................................................ 57
A-2 Additional Site Characteristics ............................................................................ 57
B-1 Long hydroperiod site percent cover by species ................................................ 58
B-2 Short hydroperiod site percent cover by species ................................................ 58
B-3 Basal area by species ........................................................................................ 59
D-1 Soil core data...................................................................................................... 61
8
LIST OF FIGURES
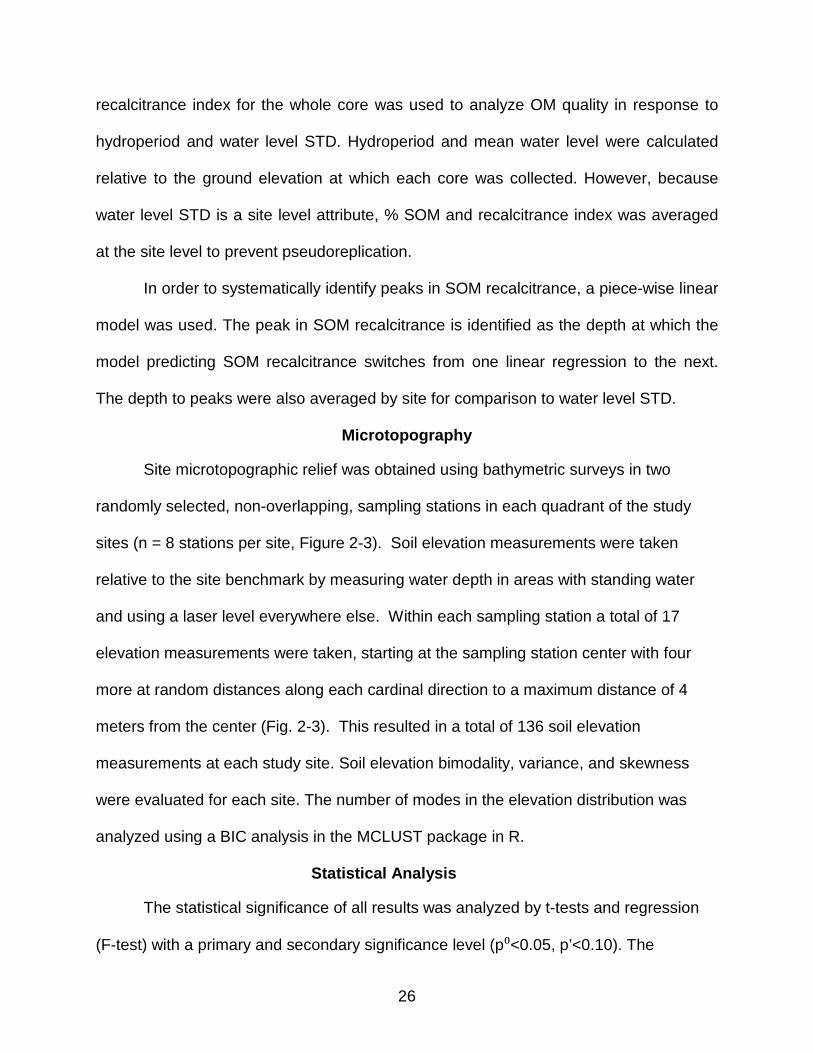
Figure page 2- 1 Land surface elevation mapping of the Silver River, showing study sites for
the comparison of ecological responses to hydrologic mean and variation. . .... 28
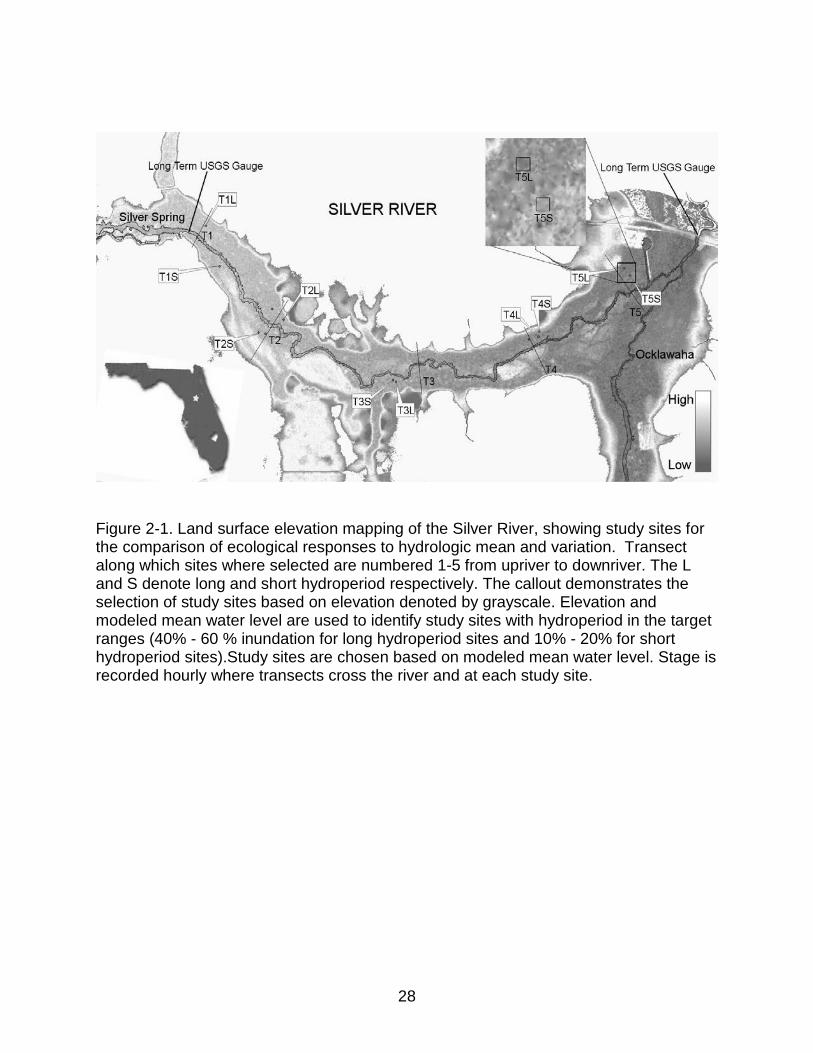
2- 2 Gradient in water level variation along the length of the Silver River. ................. 29
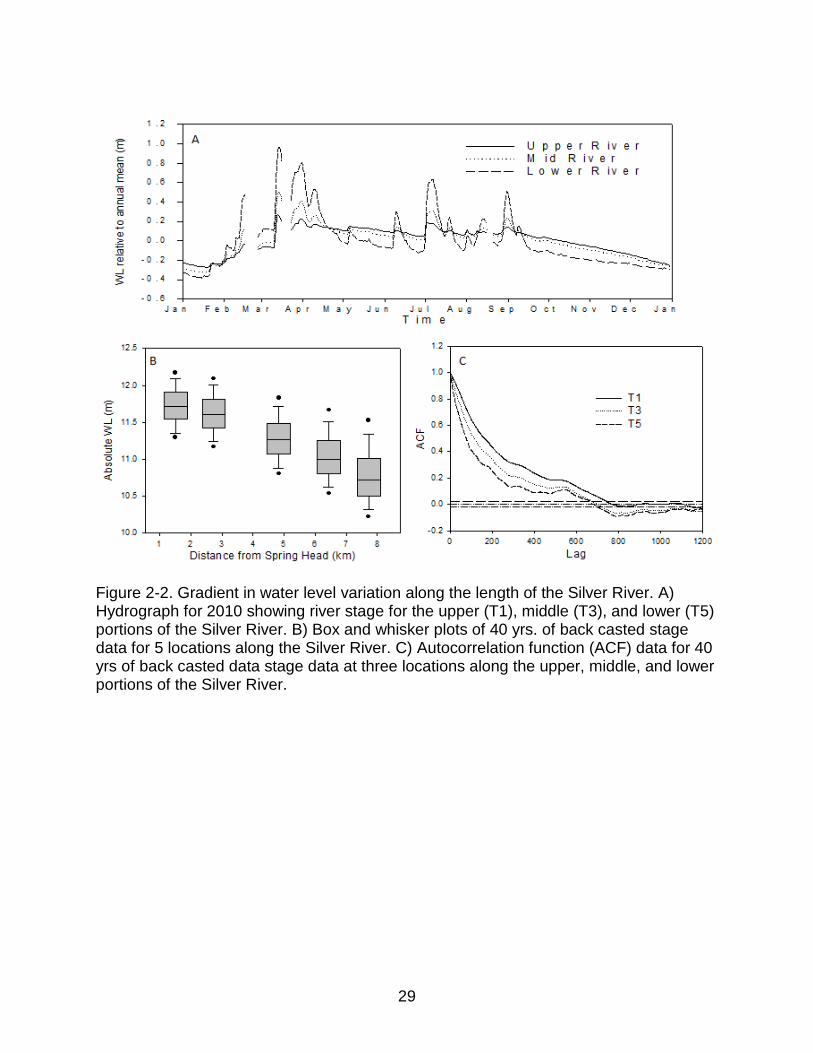
2- 3 Schematic of a 30 m by 30 m study site and the sampling frames for forest community structure (8 m by 8 m), understory vegetation (0.25 m2), bathymetry (on N-S, E-W 4 m axis) and litterfall collection (0.5 m2). .................. 30
3-1 Independence of hydrologic metrics. .................................................................. 36
3-2 Multivariate regression of the response of non-Taxodium leaf litterfall to water level STD and hydroperiod by class. .................................................................. 40
3-3 Leaf area index. .................................................................................................. 41
3-4 Cypress knee structure compared to hydrologic metrics. ................................... 42
3-5 Soil organic matter content depth profile from three sites which demonstrate trends in soil organic matter quantity and quality with depth.. ............................ 43
3-6 Soil organic matter (SOM) content response to hydrologic metrics... ................. 44
3-7 Histograms of relative elevation measurements at sites with low, moderate, and high microtopographic relief.. ....................................................................... 45
3-8 The STD of soil elevation measurements modeled by multivariate regression to hydroperiod and water level STD... ................................................................ 46
C-1 Annual litterfall for four study sites in the Silver River floodplain......................... 60
D-1 Soil core profiles for long hydroperiod sites... ..................................................... 62
D-2 Soil core profiles for short hydroperiod sites... .................................................... 63

9
LIST OF ABBREVIATIONS
HP Hydroperiod
MWL Mean water level
OM Organic matter
SOM Soil organic matter
STD Standard deviation
10
Abstract of Thesis Presented to the Graduate School of the University of Florida in Partial Fulfillment of the Requirements for the Degree of Master of Science
MEAN VS. VARIANCE: HYDROLOGIC CONTROLS ON WETLAND STRUCTURE
AND FUNCTION
By
Joseph M. Delesantro
May 2013
Chair: Matthew J. Cohen Major: Forest Resources and Conservation
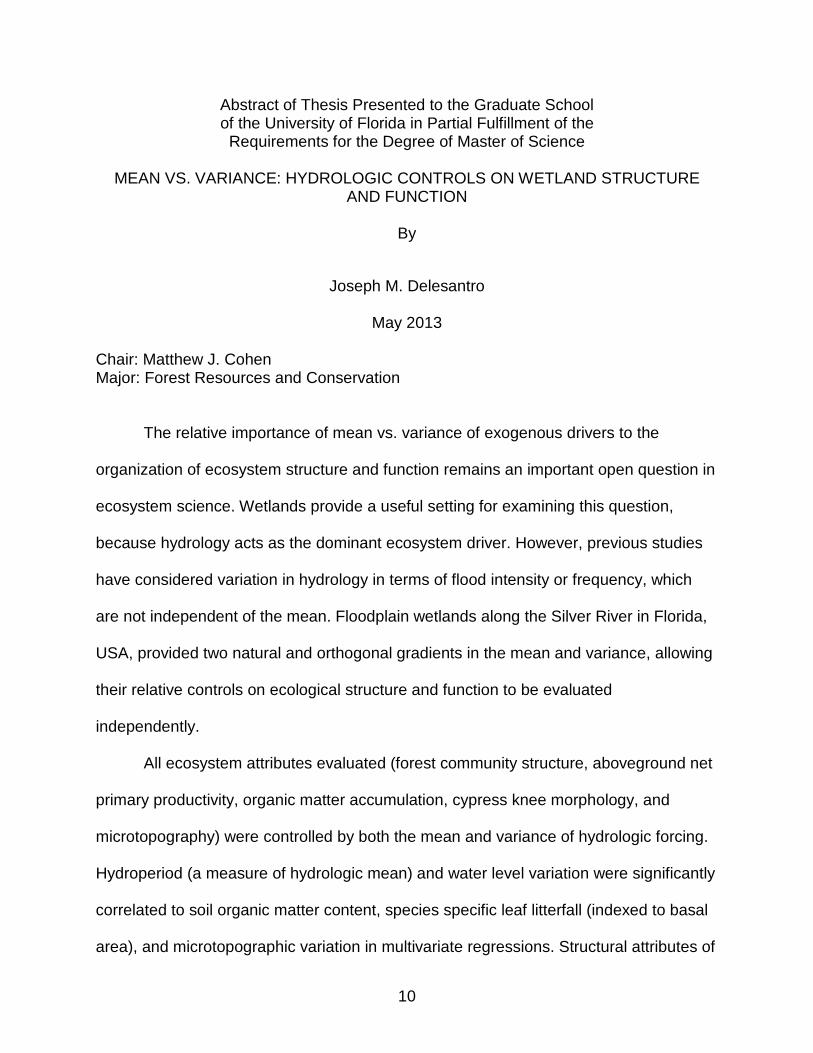
The relative importance of mean vs. variance of exogenous drivers to the
organization of ecosystem structure and function remains an important open question in
ecosystem science. Wetlands provide a useful setting for examining this question,
because hydrology acts as the dominant ecosystem driver. However, previous studies
have considered variation in hydrology in terms of flood intensity or frequency, which
are not independent of the mean. Floodplain wetlands along the Silver River in Florida,
USA, provided two natural and orthogonal gradients in the mean and variance, allowing
their relative controls on ecological structure and function to be evaluated
independently.
All ecosystem attributes evaluated (forest community structure, aboveground net
primary productivity, organic matter accumulation, cypress knee morphology, and
microtopography) were controlled by both the mean and variance of hydrologic forcing.
Hydroperiod (a measure of hydrologic mean) and water level variation were significantly
correlated to soil organic matter content, species specific leaf litterfall (indexed to basal
area), and microtopographic variation in multivariate regressions. Structural attributes of

11
cypress knees and the prevalence of wetland taxa were also correlated to hydroperiod
and water level variation. However, the magnitude of response to the mean was
consistently larger, suggesting that widespread use of hydroperiod as a predictor of
wetland organization is tenable. However, hydrologic variation was an important control,
with effects often contingent upon the mean, such that water level variation had a
greater ecological impact under short hydroperiod conditions. This study underscores
the need to consider variation in exogenous drivers when evaluating, managing, and
restoring ecosystems.
12
CHAPTER 1 INTRODUCTION
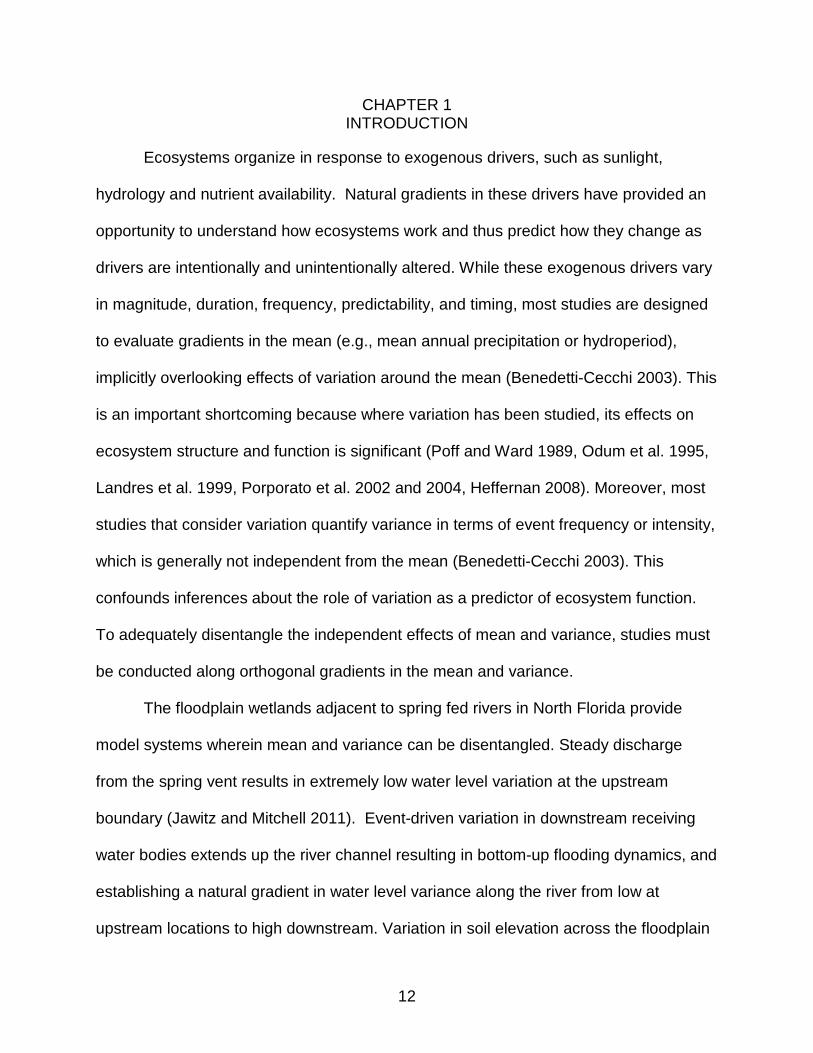
Ecosystems organize in response to exogenous drivers, such as sunlight,
hydrology and nutrient availability. Natural gradients in these drivers have provided an
opportunity to understand how ecosystems work and thus predict how they change as
drivers are intentionally and unintentionally altered. While these exogenous drivers vary
in magnitude, duration, frequency, predictability, and timing, most studies are designed
to evaluate gradients in the mean (e.g., mean annual precipitation or hydroperiod),
implicitly overlooking effects of variation around the mean (Benedetti-Cecchi 2003). This
is an important shortcoming because where variation has been studied, its effects on
ecosystem structure and function is significant (Poff and Ward 1989, Odum et al. 1995,
Landres et al. 1999, Porporato et al. 2002 and 2004, Heffernan 2008). Moreover, most
studies that consider variation quantify variance in terms of event frequency or intensity,
which is generally not independent from the mean (Benedetti-Cecchi 2003). This
confounds inferences about the role of variation as a predictor of ecosystem function.
To adequately disentangle the independent effects of mean and variance, studies must
be conducted along orthogonal gradients in the mean and variance.
The floodplain wetlands adjacent to spring fed rivers in North Florida provide
model systems wherein mean and variance can be disentangled. Steady discharge
from the spring vent results in extremely low water level variation at the upstream
boundary (Jawitz and Mitchell 2011). Event-driven variation in downstream receiving
water bodies extends up the river channel resulting in bottom-up flooding dynamics, and
establishing a natural gradient in water level variance along the river from low at
upstream locations to high downstream. Variation in soil elevation across the floodplain
13
creates a second natural gradient, in the water level mean. These gradients are relevant
because hydrology is the dominant exogenous driver of wetland ecosystems (Gosselink
et al. 1978). Hydrology exerts control over any system by providing water to organisms,
but in wetland ecosystems, standing water commonly controls the transport of gasses to
and from the soil column and rooting zone. Prolonged inundation results in anoxia and
the buildup of toxic chemicals, which in turn results in inundation stress. Because
hydrology is the dominant exogenous driver of wetland ecosystem organization, these
two orthogonal hydrologic gradients provide an appropriate setting for measuring the
relative effects of mean and variance on ecosystem structure and function.
To evaluate the role of these orthogonal hydrologic gradients on ecosystem
organization, I chose a suite of ecological metrics responsive to inundation and
integrative over time so as not to be confounded by event scale variation. Gradient
studies often focus on variation in ecosystem productivity, and vegetation structure and
composition (Connell 1976, Brown 1981, Megonigal et al. 1997). These metrics, general
to ecosystems, evaluate the stress imposed along a gradient and the adaptations of the
system in response to the stress. In wetlands specifically, soil organic matter (SOM)
processes are also affected by inundation and the formation of elevated microsites that
result from the interaction of productivity and decomposition are an important
morphological adaptation of wetland ecosystems (Beatty 1984, Titus 1990, Scarano et
al. 1997, Vivian-Smith 1997, Pollock et al. 1998, Simmons et al. 2011). As such, I
evaluated the impacts of mean and variance in hydrology on surface morphology and
SOM accumulation in addition to ecosystem productivity, and vegetation structure and
14
composition. These ecosystem attributes were expected to be controlled by both the
mean and variance.
Primary production is among the most important ecosystem functions and
responds strongly to environmental gradients (Schuur and Matson 2001). Wetland
primary productivity is sensitive to gradients in hydrology (Conner and Day 1976, Mitsch
and Ewel 1979, Brinson et al. 1981, Brown 1981, Conner and Day 1992, Megonigal et
al. 1997). Flooding frequency has been used to define hydrologic gradients of many
studies on wetland productivity (Johnson and Bell 1976, Keeley 1979, Gosselink et al.
1981, Taylor et al. 1990, Conner and Day 1992, Odum et al. 1995). While it has been
demonstrated that flood frequency strongly influences wetland ecosystems, it is not a
priori independent of mean water level, making it unclear whether mean or variation
exerts greater control. The mean water level may positively (via moisture or oxygen
availability) or negatively (via prolonged inundation or desiccation stress) influence
productivity. Similarly, variation in water level may regulate wetland function via multiple
pathways, including promoting productivity when high water events deliver moisture to
elevated microsites or when low water events oxygenate sites that are otherwise
anoxic. Variation may also limit productivity when changes in water level occur too
rapidly or frequently for plants to adjust, or where extreme water levels cause hypoxia or
desiccation. In light of the multiple pathways by which the water level regime can affect
primary production, and reasoning that water availability would not be a limiting factor in
this floodplain ecosystem, I hypothesized that higher mean water level and greater
water level variation would lower productivity.
15
Wetland forest communities respond to multiple scales of hydrologic forcing by
adjusting community composition (Cronk and Fennessey 2001). Wetland species have
developed adaptations that allow them to survive under stressful hydrologic regimes.
Some (e.g. Taxodium distuchum) can tolerate a range of hydroperiods, while others are
confined to areas of long (e.g. Nyssa aquatica) or short hydroperiod (e.g. Acer rubrum).
I hypothesized that hydrology exerts strong control on forest composition, with greater
hydroperiod and water level variation exerting control via selection for inundation
tolerant species. In accordance with the intermediate disturbance hypothesis, which
predicts diversity patterns along gradients in tidal magnitude (Sousa 1979, Hacker
1999), I also predicted higher diversity at intermediate levels of hydrologic variation.
Notably, however, tidal wetlands are subject to frequent and highly predictable flooding,
not observed in non-tidal floodplain ecosystems where flooding is stochastic. As such,
the applicability of the intermediate disturbance hypothesis to non-tidal wetlands is
unknown.
Wetlands accumulate large quantities of organic matter (OM), making them
important settings for carbon storage and associated biogeochemical functions. OM
accumulation in an ecosystem represents the balance between production and
decomposition and is under strong hydrologic control (Sahrawat 2003). Moreover,
decomposition is responsible for the release and transformation of nutrients from
detritus, which may greatly affect ecosystem productivity (Lockaby et al. 1996).
Hydrology exerts control on the rate of decomposition in multiple ways. Standing water
impedes oxygen transport into the soil, which limits decomposition. In contrast, the rate
of decomposition may be enhanced by water availability when water is limiting, or when
16
flooding distributes exoenzymes (Reddy and DeLaune 2008). Evidence that water
level variation, and specifically more frequent wetting and drying cycles, increases the
rate of decomposition comes from both laboratory and field studies (Reddy and Patrick
1975, Baker III et al. 2001, Battle and Golladay 2001). Spatial variation in
decomposition rates due to microtopography, uneven distributions of organic matter
from roots and litterfall and strong impacts of temporal variation in temperature and
water level make direct measurements of decomposition complicated and often poorly
representative of long term conditions. However, the quantity and quality of
accumulated organic matter can be used to measure integrated hydrologic controls on
organic matter dynamics. Organic matter quality refers to how easily organic matter can
be mineralized. Generally, high quality organic matter is mineralized before low quality
organic matter. Therefore, the quality of soil organic matter may respond to hydrology
when inundation affects the rate of decomposition. I hypothesized that the quantity and
quality of SOM would increase with longer hydroperiod and that greater variation in
water level would decrease SOM quantity and quality.
Wetland taxa can withstand varying levels of inundation stress, with a variety of
morphological adaptations. Despite a rich literature on these adaptations (Coutts and
Armstrong 1976, Kozlowski 1984, 1997, Jackson and Colmer 2005,), it remains unclear
which aspects of hydrology control their expression. Among these morphological
adaptation, cypress knees are particularly charismatic, and a ubiquitous feature of these
floodplain forests. Cypress knee variation has been attributed to hydrology (Brown and
Montz 1986, Kernell and Levy 1990, Kummer et al. 1991, Briand 2000), but the role of
knees in tree metabolism remain unclear, as do the controls on knee morphology and
17
frequency. Because it has been suggested that cypress knees play an important role in
gas exchange (Kernell and Levy 1990), I predicted that cypress knees will increase in
frequency with longer hydroperiod (i.e., conditions requiring greater gas exchange), and
increase in height with both greater mean water level and water level variation (i.e., to
ensure atmospheric exchange under all inundation conditions). Furthermore, I
predicted that variation in cypress knee height will correspond to variation in water level
(i.e., to provide a range of knees that balance the cost of taller knees with the benefit of
gas exchange during frequent high water events).
Microtopographic variation is a critically important feature of many wetland
ecosystems, contributing to productivity and biodiversity (Beatty 1984, Titus 1990,
Scarano et al. 1997, Vivian-Smith 1997, Pollock et al. 1998, Simmons et al. 2011,
Washuta 2011). The mechanisms controlling formation of high and low areas, often
referred to as hummocks and hollows respectively, are thought to be self-reinforcing
feedbacks between soil elevation and below-ground root production. In brief, plant
growth is enhanced on hummocks because of reduced inundation stress. This
enhanced productivity on hummocks yields more detritus and below-ground biomass.
The rate of OM decomposition is also enhanced on hummocks, constraining hummock
growth (Hilbert et al. 2000, Eppinga et al. 2009, Belyea and Clymo 2001). Soil
elevations are stable where the rate of litter deposits and belowground biomass growth
equal the rate of decomposition, which can happen in deeper water (hollows) where
production and respiration are low, and at higher elevation (hummocks) where both OM
fluxes are high. I hypothesized that the prevalence of hummocks will increase with
longer hydroperiod. To that end, I predicted that soil elevations will be bimodal and that

18
the elevation between modes will be positively correlated to hydroperiod. I also
predicted that variation in microtopographic relief around a mode would increase with
greater water level variation.
These predictions span a wide array of ecosystem attributes, from organismal
responses to community composition to ecosystem processes. Together, they help
isolate effects due to water level mean and variation, and provide a system-specific test
of the hypothesis that both mean conditions and the variation around the mean exert
control on ecosystem organization.
19
CHAPTER 2 METHODS
Study Area
The Silver River is a minimally disturbed spring fed river that flows into the
Ocklawaha River, a major tributary of the St. Johns River (Figure 2-1). Because the
source of the spring flow is the Floridan Aquifer, underlying several southeastern U.S.
states, water level variation near the spring head is extremely low, both for rivers
broadly, and also relative to water levels in the Ocklawaha River, which is subject to
significant event-driven variation. This bottom up flooding regime creates a marked
gradient in water level variation along the river (Figure 2-2). Orthogonal to river flow,
variation in soil elevation creates a second axis of hydrologic variation in mean depth.
The deeper areas of the floodplain are dominated by bald cypress (Taxodium distichum)
and water tupelo (Nyssa aquatica) with an understory comprised of deep water habitat
emergent macropytes like pickerel weed (Pontedaria cordata). Higher elevation areas
are populated with green ash (Fraxinas caroliniana), red maple (Acer rubrum), sabal
palmetto (Sabal palmetto) and numerous understory plants, including maindencane
(Panicum hemitomon), lizard’s tail (Saururus cernuus), and marigold (Bidens laevis).
Because river and floodplain water levels are regulated by the downstream Oklawaha
River (i.e., backwater flooding), flow velocities throughout the floodplain are very low
regardless of flooding depth.
Five transects were established perpendicular to the river (Figure 2-1), spaced
evenly along the river starting 1.5 km from the spring head and extending 6.7 km
downstream to a location 0.65 km upstream of the confluence with the Ocklawaha
River. Stage data from Jan-1-1970 to March-1-2011 were obtained from two gauging
20
stations, one 1200 m from the spring head (USGS ID #02239500) and the other 300
meters downstream of the Silver River on the Ocklawaha (USGS ID #02240000).
Continuous stage records between these end-points were interpolated to estimate daily
stage at each of the five transects. Four years of overlapping river stage data at each
transect location allowed us to refine the end-point interpolation (R2=0.96, p<0.001),
yielding modeled daily stage data since 1970 for any point along the river between the
two long-term gauges. Water elevation exceedance probabilities at each location were
developed from this 41 year interpolated record, and two target elevations were
obtained corresponding to long (40-60% exceedance probability) and short
hydroperiods (10-20% exceedance probability). Using a high resolution Light Detection
and Ranging (LiDAR) derived elevation map with a resolution of 5 ft by 5 ft, we identified
long and short hydroperiod locations in the floodplain along each transect. Two study
sites, each 30 m by 30 m, were selected along each transect for a total of 10 study
sites, 5 of which were long hydroperiod, and 5 short hydroperiod, spanning a
longitudinal gradient in water level variation. The corners and centers of each study site
were marked, and a benchmark was placed in each plot, to which hydrologic,
bathymetric, and soil core elevation measurements could be compared. At each site,
forest community structure, aboveground net primary productivity (ANNP), soil
bathymetry and soil cores for organic matter accumulation measurements were taken
(Figure 2-3).
Hydrologic Evaluation
A broad array of hydrologic metrics might be used to represent the variance and
mean of site hydrology. Critically, however, any metrics for the mean must be
orthogonal to metrics for variation to be useful in decomposing their relative causal
21
effects. Many metrics examined were highly correlated to other metrics, providing little
additional value. After evaluating over 30 possible metrics, mean water level (MWL) and
hydroperiod (HP) were chosen to represent the mean hydrologic conditions, and the
standard deviation (STD) of water level was chosen to represent water level variance.
While these metrics are intuitive and common, they may be quantified at many temporal
scales (e.g., period of record, annual, monthly, weekly, 5 day moving average).
Evaluation at many scales yielded highly correlated results and little evidence to support
one time-window over another. As such, all hydrologic metrics were calculated for the
entire 41 year period of record as it is both simple and most integrative.
Mean water level and hydroperiod both describe the mean hydrologic condition
but in different ways. Hydroperiod describes how often flooding occurs regardless of
depth, whereas mean water level can be strongly influenced by extreme water levels.
Because many ecosystem processes may exhibit no additional response to waters level
above or below certain elevations, mean water level may be less informative than
hydroperiod. Therefore, hydroperiod is the most appropriate metric of mean. I retained
both hydrologic metrics, however, because mean water level is important when an
ecological response is driven by a distinct level (e.g., cypress knee height, depth to soil
horizon) rather than just the fraction of time a site is inundated.
To test the assumption that river and floodplain stage are directly connected, we
installed high precision pressure transducers (Solinst Level Loggers) in 5 cm diameter
shallow wells at least 1 m below ground elevation at each of the 10 sites. The water
depths reported by the transducers were linked to surveyed site benchmarks using
standing water elevation as the datum, yielding water surface elevations with the same
22
datum as river stage measurements. Stage data from site wells were compared to river
stage data at each transect to test the concordance of floodplain and river stage, and to
identify conditions during which the records diverge. Long term stage data from the two
permanent gages indicate that average river stage for the one year period of site data
collection was fairly representative at the 54 percentiles and 64 percentile for the long
term stage gauges (USGS ID #02239500 and USGS ID #02240000 respectively).
During the period of site stage measurements, there was a period (February to May)
during which river and site stage diverged; this corresponded to the end of the dry
season and the beginning of the growing season, and indicates that there are regular
periods during which rainfall and evapotranspiration control site water level. This period
of disconnection between the river and floodplain was removed when assessing the
relationship used for predicting site stage with river stage. When the floodplain operates
independently of the river, the water level under the floodplain varies more than the river
and is generally lower. Therefore predicting site stage with river stage will
underestimate water level variation and overestimate stage for the period of
disconnection. The stage dynamics during this period are expected to have lower
impact on ecosystem structure and function relative to the rest of the year because the
water level is generally below the soil and not impeding gas transfer.
To estimate site mean water level and hydroperiod, I used the short term
relationship between site water level and the interpolated river water level to construct a
relationship that was then used to back-cast conditions over the last 40 years. Note that
both hydrologic metrics (mean water level and hydroperiod) vary with surface elevation
within sites, so all hydrologic metrics are reported for the median elevation, obtained
23
from site bathymetry surveys. Measured site hydroperiods were all within the intended
hydroperiod ranges except for the two T1 sites (upper river), which both had a shorter
hydroperiod than the targets, though both show characteristics consistent with their
original long and short hydroperiod classifications, principally in SOM content.
Productivity
To compare productivity between study sites, I used litterfall traps to estimate
minimum aboveground net annual production. Litterfall measurements are a common
and proven method for estimating minimum aboveground net primary production
(ANPP) (Bray and Gorham 1964). Six litter traps (0.5 m2) elevated 1 m off the wetland
surface were sampled monthly July 2011 to June 2012. Litter trap locations within sites
were random (Figure 2-3), but were preferentially placed away from Sabal palmetto
because the large palm fronds may intercept and collect litter. Litterfall mass was dried
at 80 degrees C for 72 hours before being separated into leafy, woody, reproductive,
Taxodium reproductive and miscellaneous components. Leaf litter was further
subdivided into Taxodium and “other” (consisting mainly of Nyssa aquatica, Acer
rubrum and Fraxinas caroliniana). Each category of litter was weighed and reported as
grams per square meter per year. Litter and leaf litterfall per unit basal area was also
calculated to provide a measure of productivity that accounts for site forest community
structure and age variation. The productivity of Sabal palmetto was assessed separately
from canopy litterfall. At the onset of the project, a randomly placed 8 m by 8 m plot was
marked off and cleared of all existing Sabal palmetto litter at each short hydroperiod
site. The Sabal palmetto litter was collected monthly from the ground of plot. Litter was
not collected for two months when substantial flooding was known to have occurred on
the sites. As a result, the annual total Sabal palmetto litterfall was calculated as the 10
24
month average multiplied by 12 months. Sabal palmetto litterfall was not assessed at
long hydroperiod sites because of the species very low occurrence at these sites.
Projected leaf area index (LAI) was also measured as a proxy for site productivity
(Brown 1981, Gholz 1982). Leaf area index was measured by ceptometer (AccuPar
LP-80), which evaluates the light passing through the canopy. Measurements, each of
which integrates 80 point readings of incident light, were taken every 5 m along seven
transects spanning the study site.
Forest Community Structure
Forest community structure was surveyed in 8 m by 8 m subplots randomly
placed within each of four study site quadrants at each site. Diameter at breast height
and species of each tree within the subplots was recorded. Ground cover was surveyed
and recorded by percent cover within 3 randomly selected 0.5 m2 areas within each
subplot (Figure 2-3).The dominance of facultative and obligate wetland species (as
defined by the 2012 National Wetlands Plant List; Lichvar et al. 2012) within each study
site was evaluated by the proportion of basal area, plant density, and ground cover,
contributed by wetland taxa. Cypress knee density was measured in each forest
structure subplot, and height was measured using a laser level elevation relative to the
site bench mark. Cypress knees were characterized by their density, site average
height, and the variance in heights at each site.
Organic Matter Accumulation
Soil organic matter accumulation between sites was compared by evaluating the
quantity and quality of organic matter in soil cores. Three 5 cm diameter soil cores, 50
cm long, were taken from random locations within each study site; I avoided taking
cores from hummocks. Because cores were collected when sites were dry in winter,
25
the elevation of the top of each soil core was measured by laser level relative to the
benchmark. Sharpened 5 cm diameter PVC pipe was driven into the ground to a depth
of 50 cm. An airtight seal was placed on the top of the pipe and the core was carefully
removed. Cores that compacted more than 10 cm or that lost material from the bottom
during extraction were rejected and the sites were resampled. Each core was separated
in 2 cm segments. Live root mass was removed and samples were dried at 105 degrees
C for 72 hours. Samples were then ground and passed through a #10 sieve. A two-step
combustion process was utilized to provide an index of recalcitrance (Schnitzer and
Hoffman 1966, Kristensesn and Andersen 1987, Angehrn-Bettinazzi et al. 1988,
Sharma 1989, Kristensen 1990, Lopez-Capel et al. 2005). Pilot testing indicated that a
1 g sample of soil was sufficient to represent each core segment and would undergo
complete combustion of organic matter in 4 h. The exact weight of each sample plus the
weight of the aluminum trays were recorded. The samples were placed into a preheated
muffle furnace at 350 degrees C for 2 hours, then removed and placed in a desiccation
chamber to cool for 15 min before being weighed again. Samples were then placed into
the preheated muffle furnace at 550 degrees C for an additional 2 hours, after which
samples were once again removed and placed in a desiccation chamber to cool for 15
min before being weighed a final time. The total mass of organic matter was measured
by the total fractional loss from the combined two step combustion and the recalcitrance
index was reported as the mass lost in the second combustion step over the total mass
lost. The average % SOM was well correlated (R2 = 0.84, p < 0.001) to the % SOM of
the top 10 cm. Therefore, the whole core average % SOM was used to analyze OM
accumulation in response to hydroperiod and water level STD. Likewise, the mean
26
recalcitrance index for the whole core was used to analyze OM quality in response to
hydroperiod and water level STD. Hydroperiod and mean water level were calculated
relative to the ground elevation at which each core was collected. However, because
water level STD is a site level attribute, % SOM and recalcitrance index was averaged
at the site level to prevent pseudoreplication.
In order to systematically identify peaks in SOM recalcitrance, a piece-wise linear
model was used. The peak in SOM recalcitrance is identified as the depth at which the
model predicting SOM recalcitrance switches from one linear regression to the next.
The depth to peaks were also averaged by site for comparison to water level STD.
Microtopography
Site microtopographic relief was obtained using bathymetric surveys in two
randomly selected, non-overlapping, sampling stations in each quadrant of the study
sites (n = 8 stations per site, Figure 2-3). Soil elevation measurements were taken
relative to the site benchmark by measuring water depth in areas with standing water
and using a laser level everywhere else. Within each sampling station a total of 17
elevation measurements were taken, starting at the sampling station center with four
more at random distances along each cardinal direction to a maximum distance of 4
meters from the center (Fig. 2-3). This resulted in a total of 136 soil elevation
measurements at each study site. Soil elevation bimodality, variance, and skewness
were evaluated for each site. The number of modes in the elevation distribution was
analyzed using a BIC analysis in the MCLUST package in R.
Statistical Analysis
The statistical significance of all results was analyzed by t-tests and regression
(F-test) with a primary and secondary significance level (p⁰<0.05, p’<0.10). The

27
secondary significance level was selected to reduce the probability of type II errors
because of the study’s low statistical power (n=10), and to allow us to investigate trends
among the long and short hydroperiod sites independently (n=5). The following methods
were utilized in the analysis of each hypothesis on ecosystem metric response.
Method 1: The influence of hydroperiod or mean water level, and water level STD on
each metric of structure and function was analyzed in a multivariate regression.
Method 2: Hydroperiod is discretized into short and long hydroperiod classes and
hypotheses are tested again by multivariate regression.
Method 3: In order to identify countervailing effects in each hydroperiod class, water
level STD is compared to metrics of ecosystem structure and function in a single
variable regression for each hydroperiod class.
Method 4: All hypotheses are tested for long and short hydroperiod sites separately in
order to identify sensitivity of ecological metric to hydrologic metric dependent upon
hydroperiod class.
28
Figure 2-1. Land surface elevation mapping of the Silver River, showing study sites for the comparison of ecological responses to hydrologic mean and variation. Transect along which sites where selected are numbered 1-5 from upriver to downriver. The L and S denote long and short hydroperiod respectively. The callout demonstrates the selection of study sites based on elevation denoted by grayscale. Elevation and modeled mean water level are used to identify study sites with hydroperiod in the target ranges (40% - 60 % inundation for long hydroperiod sites and 10% - 20% for short hydroperiod sites).Study sites are chosen based on modeled mean water level. Stage is recorded hourly where transects cross the river and at each study site.
29
Figure 2-2. Gradient in water level variation along the length of the Silver River. A) Hydrograph for 2010 showing river stage for the upper (T1), middle (T3), and lower (T5) portions of the Silver River. B) Box and whisker plots of 40 yrs. of back casted stage data for 5 locations along the Silver River. C) Autocorrelation function (ACF) data for 40 yrs of back casted data stage data at three locations along the upper, middle, and lower portions of the Silver River.
30
Figure 2- 3. Schematic of a 30 m by 30 m study site and the sampling frames for forest community structure (8 m by 8 m), understory vegetation (0.25 m2), bathymetry (on N-S, E-W 4 m axis) and litterfall collection (0.5 m2).
31
CHAPTER 3 RESULTS
Site Hydrology and Orthogonal Gradients of Mean and Variance
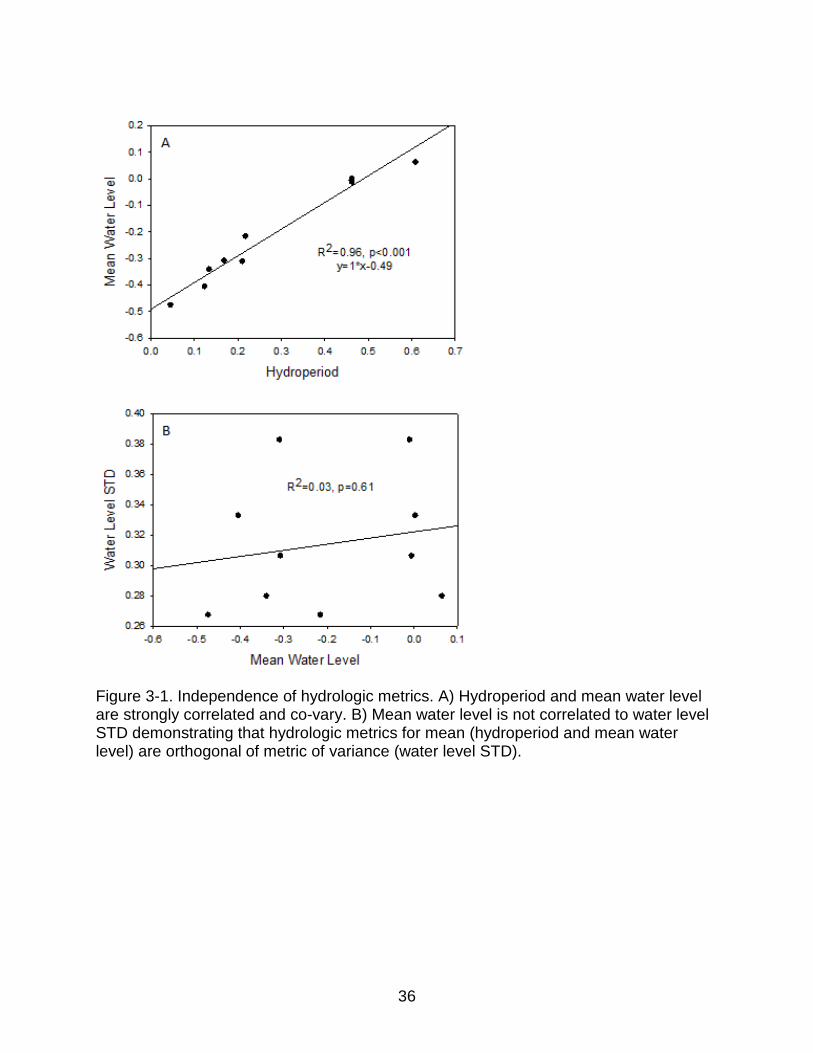
The observed gradients in mean and variance varied independently along the
length of the river (Fig 3-1). Flooding frequency, a metric used commonly to describe
hydrologic variation, was much better correlated to mean water level than was water
level STD (R2=0.22 vs. R2=0.03). When flooding frequency was defined by the number
of floods of X duration, the correlation between mean water level and flood frequency
increased with X (e.g., When X=60 days, R2=0.96). Original estimates of site elevation
and hydroperiod were made from LIDAR data. Later estimates of hydroperiod were
obtained by comparing the recorded water level in the floodplain and river at high stage.
The original hydroperiod predictions were generally accurate and within the defined
hydroperiod classes (Table 3-1), however the post-hoc estimate of hydroperiod was
much lower than expected at both T1 sites. Despite this the T1 sites share many
attributes with their original classification of hydroperiod, especially %SOM, and as such
are kept in the original classification.
While mean water level and hydroperiod are very well correlated (R2=0.96), both
metrics were still used to accommodate the evaluation of processes where actual
depths were relevant (mean water level) as well as processes where the wet/dry
fractions were more relevant (hydroperiod).
Forest Community Structure
Basal areas ranged from 31 to 132 m2/ha, and were dominated by Taxodium
distichum at all sites except T3L and T5S where a handful of large Fraxinas
carolinanand Acer rubrum dominated the basal area (Table 3-2). Basal area was
32
negatively correlated to the variation in hydroperiod among sites with in the short
hydroperiod class (R2=0.59, p=0.08). Understory percent cover was generally larger at
long hydroperiod sites, but was a function of LAI (R2=0.54) and not hydrologic metrics.
The prevalence of obligate wetland (OBL) and facultative wetlands (FACW)
plants, as defined by the national wetland plant list (Lichvar 2012), was generally higher
(Table 3-2) and was moderately significantly greater at long hydroperiod sites than at
short hydroperiod sites (p=0.07). However, variation in hydroperiod among sites was
only a significant predictor of the prevalence of OBL and FACW plant species at long
hydroperiod sites (R2=0.68, p=0.05). The prevalence of OBL and FACW plant species
was negatively correlated to water level STD at short hydroperiod sites (R2=0.92,
p<0.001) but that strong correlation was absent at long hydroperiod sites. I observed no
significant correlation between species richness and any hydrologic metrics.
Productivity
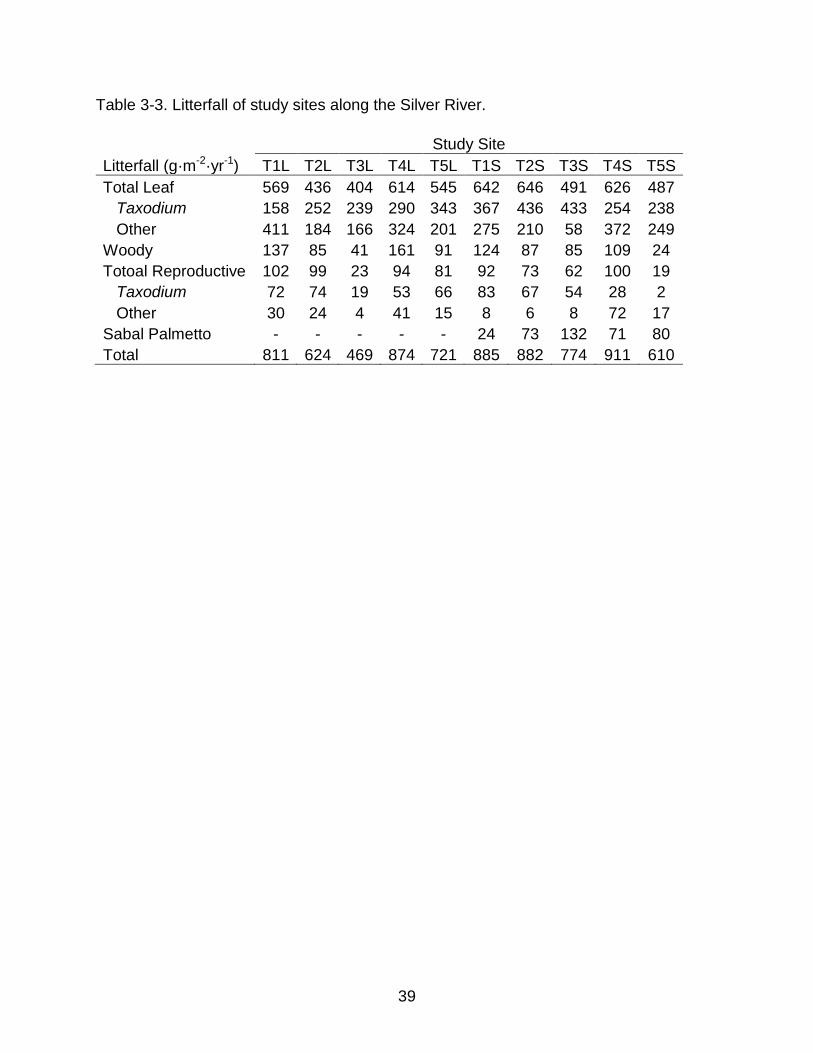
Litterfall (Table 3-3) was strongly concentrated in the autumn, with 79% of total
annual litterfall occurring between September and December and 91% of leaf litterfall
occurring during this period. Litterfall at all sites was dominated by leaf litter; non-leaf
litter (branches, reproductive material) comprised a small fraction (23% ± 7%; mean ± 1
STD) of the total mass, and was pooled for all subsequent analyses. Taxodium
accounted for the majority of leaf litterfall throughout the floodplain (56%), but across
sites there was a large range in the proportion of Taxodium leaf litterfall (28% - 88%).
Sabal palmetto accounted for a significant proportion of the ANPP estimate of the T2S,
T3S, T4S, and T5S sites (9 % - 20 %). Total litterfall (including Sabal palmetto litter)
was moderately correlated to hydroperiod (R2=0.26, p=0.076) and decreased with

33
longer hydroperiod. Litterfall excluding Sabal palmetto was not correlated to metrics of
hydrology. Leaf litterfall including Sabal palmetto was also well correlated to
hydroperiod (R2=0.59, p=0.006) exhibiting the same trend, however, canopy leaf litterfall
was only moderately correlated to hydroperiod (R2=0.28, p=0.067). There was no
significant response to water level STD in either case. Taxodium leaf litterfall was
positively correlated to water level STD, but only among long hydroperiod sites
(R2=0.78, p=0.03). Litterfall per unit basal area as a whole did not correlate to any
hydrologic metric. Similarly, Taxodium distchum leaf litterfall per unit basal area alone
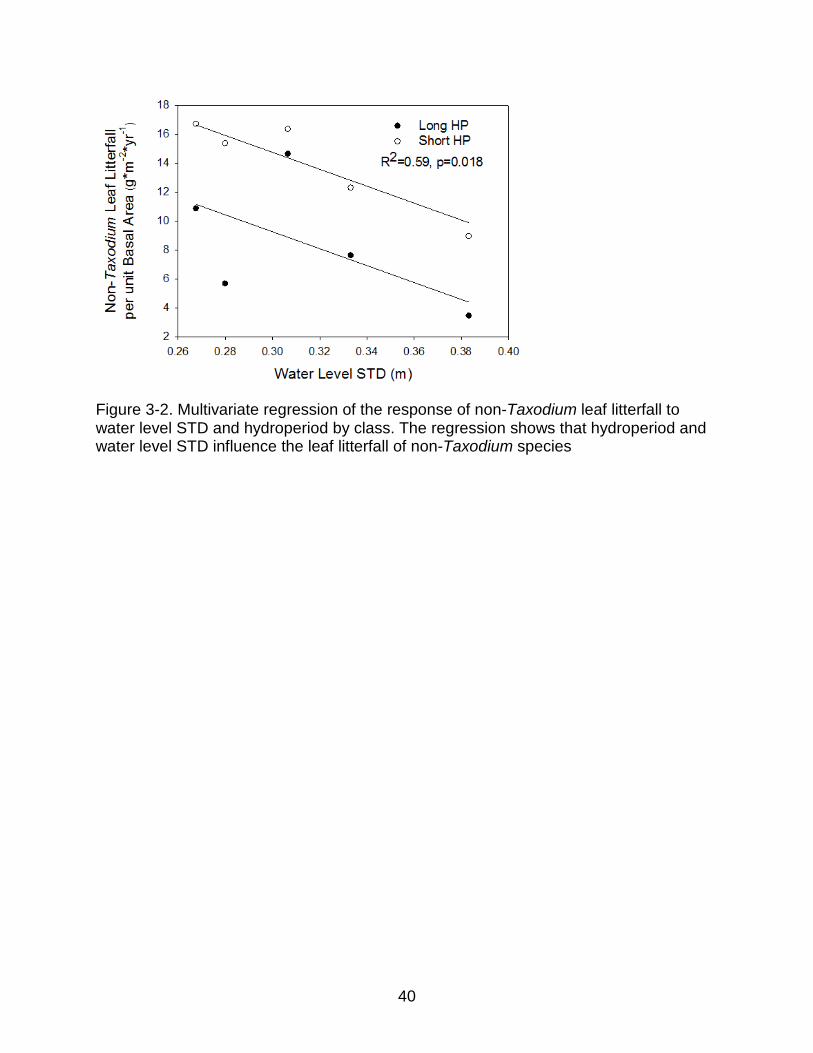
was not correlated to any hydrologic metrics (Figure 3-2.a) However, litterfall per unit
basal area excluding Taxodium distichum was significantly negatively correlated to
water level STD and hydroperiod class in a multivariate model (Figure 3-2.b). The
slopes of independent fits of the data for each hydroperiod class are not significantly
different. The non-Taxodium leaf litterfall data for the short hydroperiod sites had a
better fit to water level STD than did the long hydroperiod sites (R2=0.53, p=0.09 vs.
R2=0.18, p=0.26).
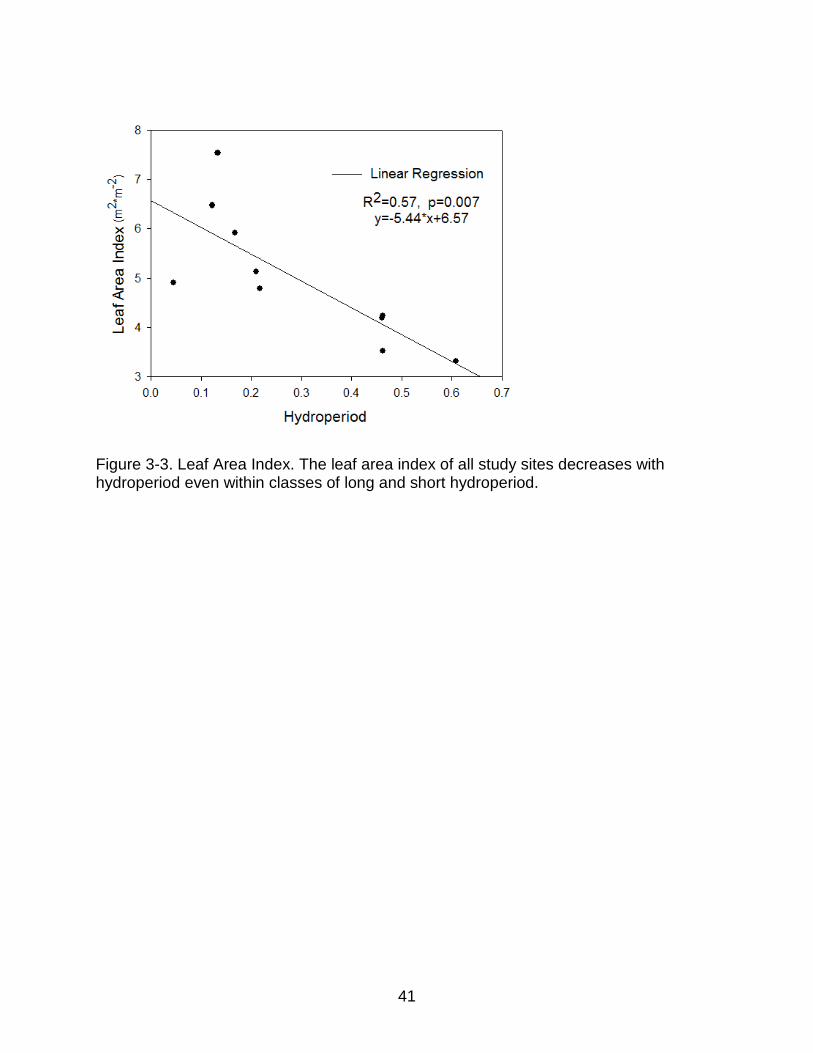
Leaf area index varied significantly across sites, but was generally high (range
3.31 to 7.54 m2 m-2; Table 1). Replicate measurement of LAI in subsequent growing
seasons was highly correlated (R2 = 0.57) suggesting that site variation observed is
fairly robust to inter-annual variation. Leaf area index was significantly negatively
correlated to hydroperiod (Figure 5). Water level STD was not a significant predictor of
LAI and there was no correlation between LAI and water level STD within hydroperiod
classes. While both LAI and leaf litterfall declined with longer hydroperiod, they were
34
only significantly correlated when Sabal palmetto litter was included in leaf litterfall (R2
=0.57, p<0.001).
Morphological Adaptations
Cypress knees were present at all sites, and varied dramatically in their density,
mean height, and height variance (Table 3-2). Cypress knee density was moderately
well correlated to hydroperiod (R2=0.25, p=0.08), decreasing with longer hydroperiod.
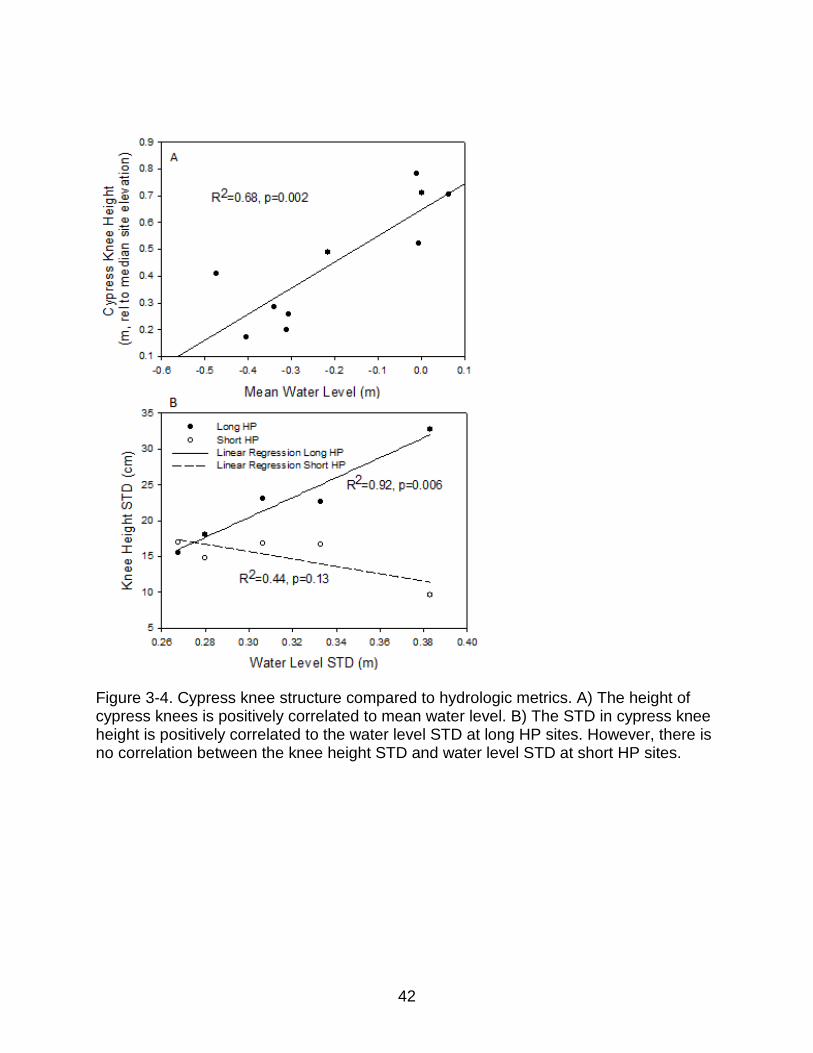
Cypress knee height was strongly correlated to mean water level (Figure 3-4.a).
Variation in knee height was also positively correlated to water level STD, but only at
the long hydroperiod sites (Figure 3-4.b). The mean elevation of cypress knees was
inundated only 5.5% of the year at any site, suggesting that knees respond to high
water conditions. The mean elevation of cypress knees was between 50 and 80 cm
above the mean water level at all but one site, T1L, which had the shortest modeled
hydroperiod of any site (ca. 4%).
Organic Matter Accumulation
Soil organic matter content was high at all sites (Table 3-2), but histic epipedons
(i.e., > 20% OM) occurred only at the long hydroperiod sites. Soil organic matter content
was strongly depth dependent, but the pattern varied between short and long
hydroperiod sites. At short hydroperiod sites there was a consistent pattern of declining
SOM content with depth. In contrast, at long hydroperiod sites, there was an initial
decline in SOM with depth, but a consistent inflection below which SOM increased
again (Figure 3-5.a,b). Soil organic matter recalcitrance also varied with depth,
increasing to a threshold, below which it declined (Figure 3-5.a,b). Unlike SOM content,
35
this peak was observed at both long and short hydroperiod sites. The depth to this peak
was negatively correlated to mean water level (R2=0.16, p=0.018).
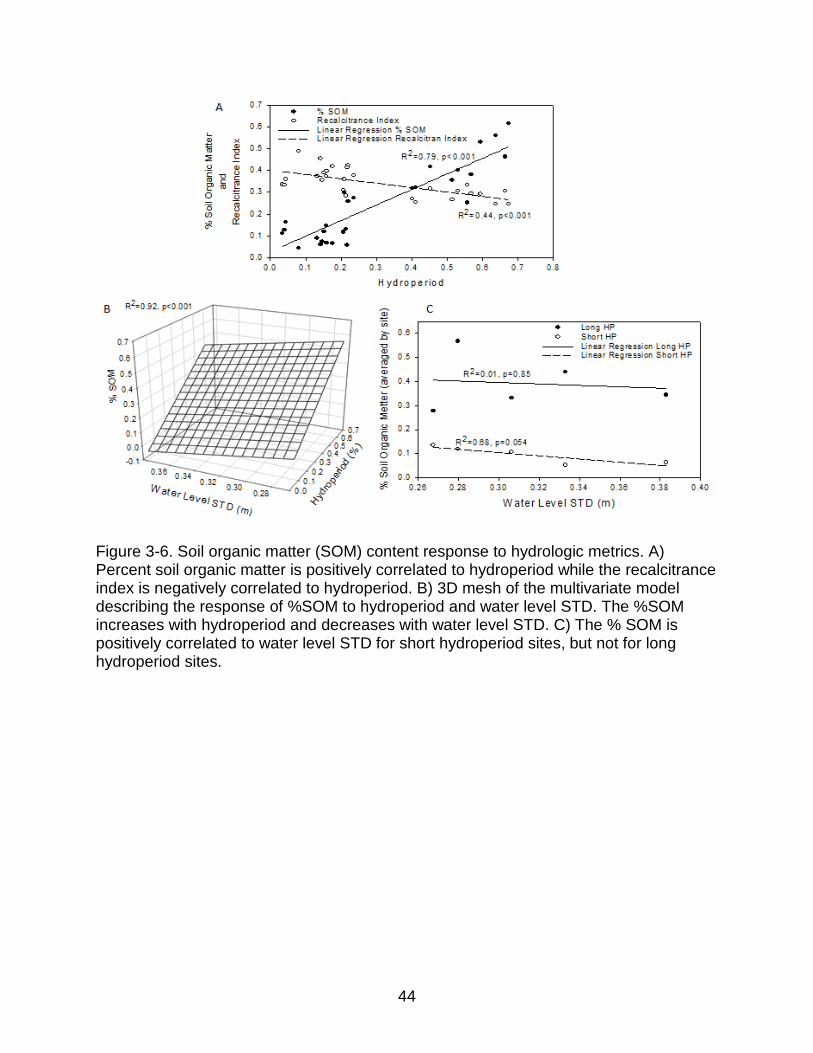
Depth averaged % SOM and recalcitrance index were strongly correlated to
hydroperiod (Figure 3-6.a). Average site %SOM was negatively correlated to water
level STD and positively correlated to hydroperiod in a multivariate regression (Figure 3-
6.b). While hydroperiod explains most of the variation in SOM content, the effects of
water level STD are significant and exert strong effects within hydroperiod classes,
especially for short hydroperiod sites (Figure 3-6.c). Soil organic matter recalcitrance
was not correlated to water level STD.
Microtopography
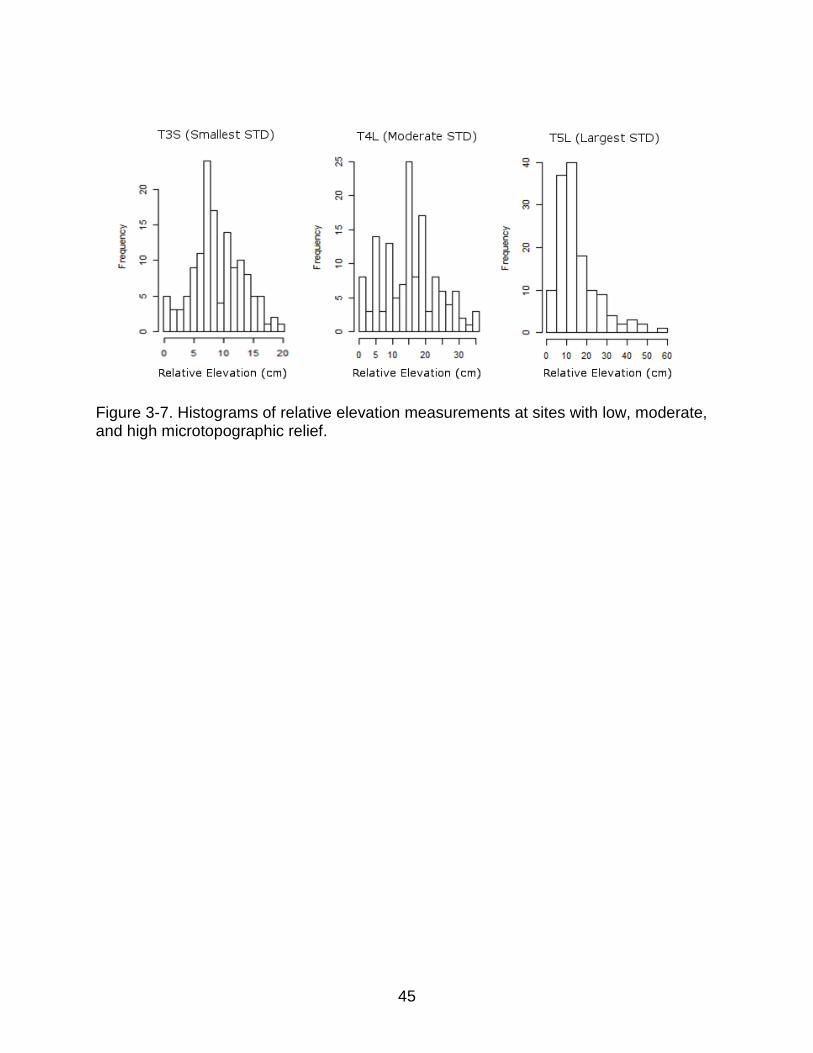
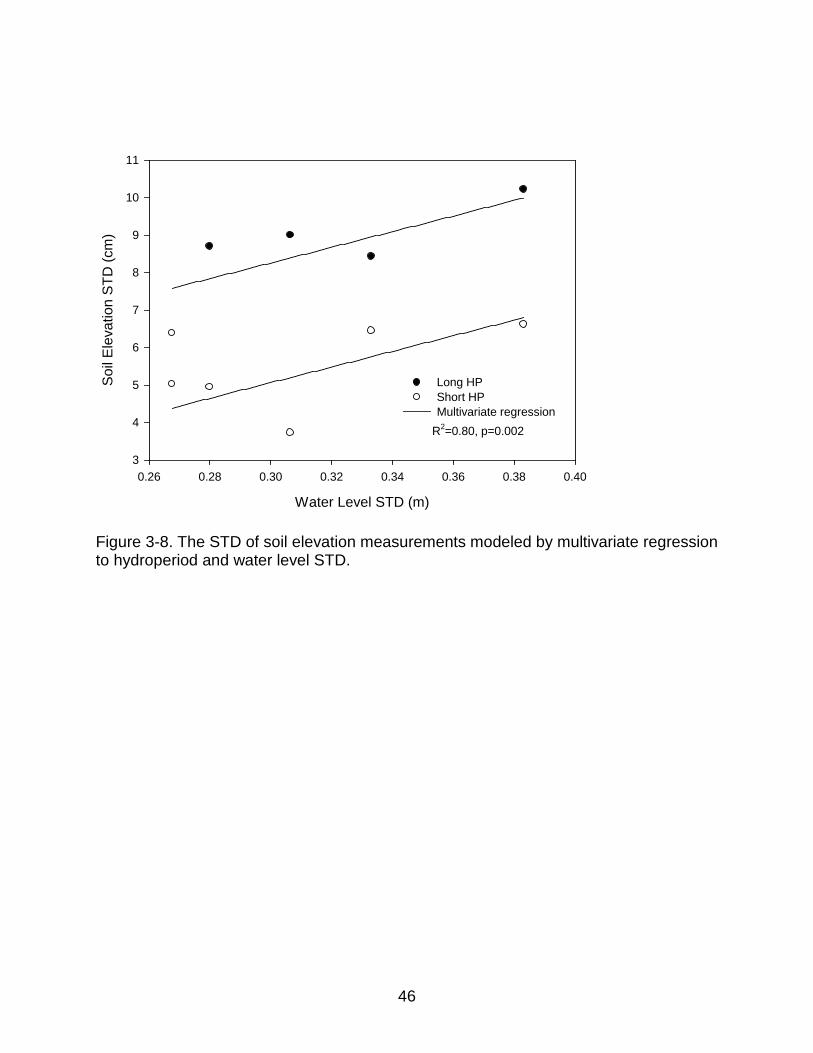
Although the distributions of soil elevation data were not bimodal (Fig 3-7),
elevation variation was positively correlated to hydroperiod class and water level STD in
a multivariate model (Fig. 3-8). The slopes of independent fits of soil elevation data for
each hydroperiod class were not significantly different. Soil elevation distributions for all
sites were skewed left (Table 3-2). However, the degree of skewness did not correlate
to hydrologic metrics.
36
Figure 3-1. Independence of hydrologic metrics. A) Hydroperiod and mean water level are strongly correlated and co-vary. B) Mean water level is not correlated to water level STD demonstrating that hydrologic metrics for mean (hydroperiod and mean water level) are orthogonal of metric of variance (water level STD).

37
Table 3-1. Hydrologic characteristics of study sites along the Silver River.
Study Site
Metric T1L T2L T3L T4L T5L T1S T2S T3S T4S T5S Hydroperiod (% inundation) 21.7 60.8 46.1 46.2 46.2 4.5 13.3 16.8 12.3 21.0 Mean Water Level (m) -0.22 0.06 -0.01 0.00 -0.01 -0.47 -0.34 -0.31 -0.40 -0.31 Water level STD (m) 0.27 0.28 0.31 0.33 0.38 0.27 0.28 0.31 0.33 0.38
38
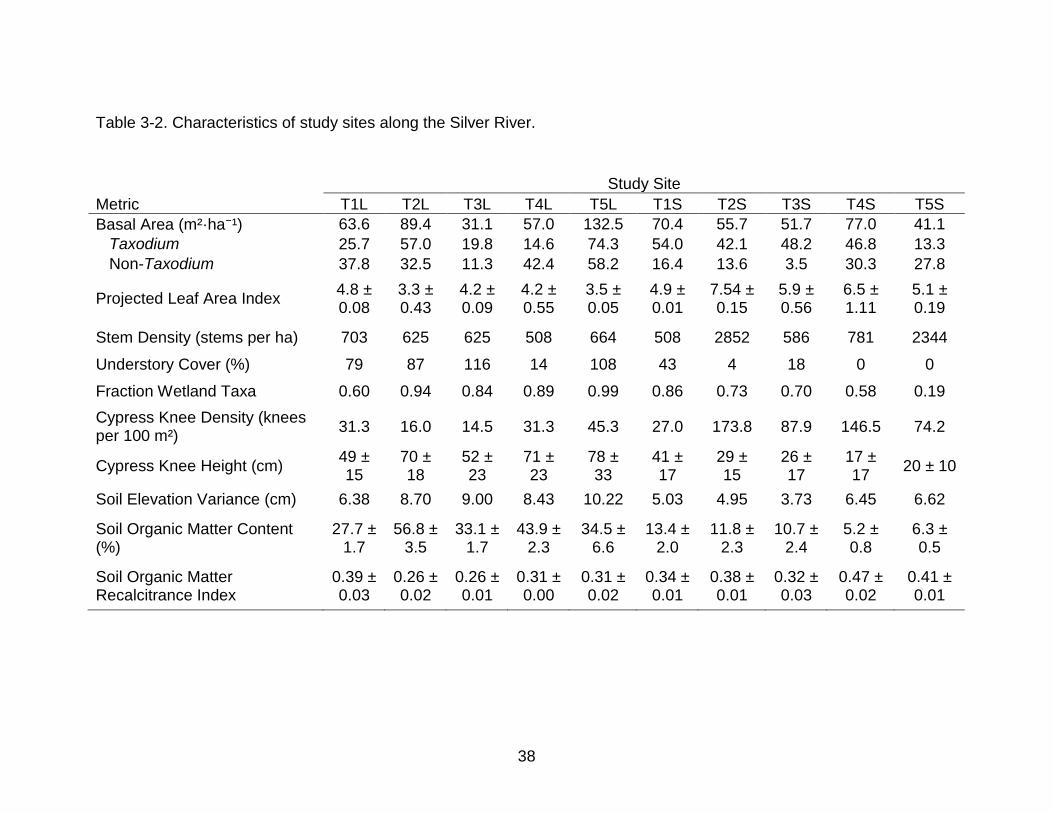
Table 3-2. Characteristics of study sites along the Silver River.
Study Site
Metric T1L T2L T3L T4L T5L T1S T2S T3S T4S T5S Basal Area (m²·ha⁻¹) 63.6 89.4 31.1 57.0 132.5 70.4 55.7 51.7 77.0 41.1 Taxodium 25.7 57.0 19.8 14.6 74.3 54.0 42.1 48.2 46.8 13.3 Non-Taxodium 37.8 32.5 11.3 42.4 58.2 16.4 13.6 3.5 30.3 27.8
Projected Leaf Area Index 4.8 ± 0.08
3.3 ± 0.43
4.2 ± 0.09
4.2 ± 0.55
3.5 ± 0.05
4.9 ± 0.01
7.54 ± 0.15
5.9 ± 0.56
6.5 ± 1.11
5.1 ± 0.19
Stem Density (stems per ha) 703 625 625 508 664 508 2852 586 781 2344 Understory Cover (%) 79 87 116 14 108 43 4 18 0 0 Fraction Wetland Taxa 0.60 0.94 0.84 0.89 0.99 0.86 0.73 0.70 0.58 0.19 Cypress Knee Density (knees per 100 m²) 31.3 16.0 14.5 31.3 45.3 27.0 173.8 87.9 146.5 74.2
Cypress Knee Height (cm) 49 ± 15
70 ± 18
52 ± 23
71 ± 23
78 ± 33
41 ± 17
29 ± 15
26 ± 17
17 ± 17 20 ± 10
Soil Elevation Variance (cm) 6.38 8.70 9.00 8.43 10.22 5.03 4.95 3.73 6.45 6.62
Soil Organic Matter Content (%)
27.7 ± 1.7
56.8 ± 3.5
33.1 ± 1.7
43.9 ± 2.3
34.5 ± 6.6
13.4 ± 2.0
11.8 ± 2.3
10.7 ± 2.4
5.2 ± 0.8
6.3 ± 0.5
Soil Organic Matter Recalcitrance Index
0.39 ± 0.03
0.26 ± 0.02
0.26 ± 0.01
0.31 ± 0.00
0.31 ± 0.02
0.34 ± 0.01
0.38 ± 0.01
0.32 ± 0.03
0.47 ± 0.02
0.41 ± 0.01
39
Table 3-3. Litterfall of study sites along the Silver River.
Study Site
Litterfall (g·m-2·yr-1) T1L T2L T3L T4L T5L T1S T2S T3S T4S T5S Total Leaf 569 436 404 614 545 642 646 491 626 487 Taxodium 158 252 239 290 343 367 436 433 254 238 Other 411 184 166 324 201 275 210 58 372 249 Woody 137 85 41 161 91 124 87 85 109 24 Totoal Reproductive 102 99 23 94 81 92 73 62 100 19 Taxodium 72 74 19 53 66 83 67 54 28 2 Other 30 24 4 41 15 8 6 8 72 17 Sabal Palmetto - - - - - 24 73 132 71 80 Total 811 624 469 874 721 885 882 774 911 610
40
Figure 3-2. Multivariate regression of the response of non-Taxodium leaf litterfall to water level STD and hydroperiod by class. The regression shows that hydroperiod and water level STD influence the leaf litterfall of non-Taxodium species
41
Figure 3-3. Leaf Area Index. The leaf area index of all study sites decreases with hydroperiod even within classes of long and short hydroperiod.
42
Figure 3-4. Cypress knee structure compared to hydrologic metrics. A) The height of cypress knees is positively correlated to mean water level. B) The STD in cypress knee height is positively correlated to the water level STD at long HP sites. However, there is no correlation between the knee height STD and water level STD at short HP sites.

43
Figure 3-5. Soil organic matter content depth profile from three sites which demonstrate trends in soil organic matter quantity and quality with depth. A) Soil organic matter content depth profile of core T2L-1 demonstrating the trend amoung long hydroperiod sites. Notice the pronouced inflection at intermediate depth. B) Soil organic matter content depth profile of core T2S-1 that demonstrates the trend amoung short hydroperiod sites. C) Recalcitrance index depth profile of core T4L-3 that demonstrates the trend observed at long and short hydroperiod sites. Notice the inflection in recalcitrance at depth.
44
Figure 3-6. Soil organic matter (SOM) content response to hydrologic metrics. A) Percent soil organic matter is positively correlated to hydroperiod while the recalcitrance index is negatively correlated to hydroperiod. B) 3D mesh of the multivariate model describing the response of %SOM to hydroperiod and water level STD. The %SOM increases with hydroperiod and decreases with water level STD. C) The % SOM is positively correlated to water level STD for short hydroperiod sites, but not for long hydroperiod sites.
45
Figure 3-7. Histograms of relative elevation measurements at sites with low, moderate, and high microtopographic relief.
46
Water Level STD (m)
0.26 0.28 0.30 0.32 0.34 0.36 0.38 0.40
Soil
Elev
atio
n ST
D (c
m)
3
4
5
6
7
8
9
10
11
Long HPShort HPMultivariate regression
R2=0.80, p=0.002
Figure 3-8. The STD of soil elevation measurements modeled by multivariate regression to hydroperiod and water level STD.
47
CHAPTER 4 DISCUSSION
The floodplain of the Silver River provides a model system for investigating
effects of mean environmental conditions independent from those of variation around
the mean. Several features are of particular note. First, the backwater flooding and
length of the river create a strong gradient in hydrologic variation between stable
conditions at the spring vent and marked event-driven variation at the downstream
confluence. This longitudinal gradient is orthogonal to the typical lateral gradients in
hydroperiod present in riparian swamps. Second, the absence of scouring floods
(floodwaters are typically the slowest velocity flows during these backwater flooding
rivers) means that flooding events are not characterized by variable flow throughout the
floodplain, and measured conditions are integrative over long time periods. Finally,
because the gradients occur over relatively short distances (ca. 8 km), concerns about
dispersal and climate variation confounding comparisons among more distant sites are
alleviated.
Despite site aspects that are well suited to addressing the core question of this
research, several important aspects of historical land use and floodplain morphology
merit consideration. First and foremost, this floodplain was subject to timber extraction
in the last 100 years, but the timing and spatial extent of this is largely unknown.
Second, water quality in the river has declined over the last 50 years, principally from
nitrate enrichment, which may have altered floodplain wetland function (though
presumably relatively uniformly across sites). Finally, there are several notable relict
channels and lateral inputs of unknown variation across the floodplain. However, sites
were located so as to minimize the possible influence of these inputs. While these
48
issues merit consideration in the interpretation of results, none seems to significantly
occlude the findings of the study.
There were a couple possible issues with the data analysis of the study. First, the
shorter than expected hydroperiod of the most upstream “long hydroperiod” site (T1L)
may merit its inclusion in the short hydroperiod class; however, it was kept in the long
hydroperiod class because it exhibited many of the characteristics of long hydroperiod
sites, in particular, the high SOM content. Second, Sabal Palmetto may have biased LAI
and total litterfall measurements as it was only prevalent at short hydroperiod sites.
Comparing Silver River Floodplain to Other Floodplains
Although the Silver River floodplain has features that distinguish it from other
floodplains in the region, I observed important similarities with other riparian and non-
riparian wetlands of the southeastern United States. While average leaf litterfall (545 ±
83 g/m2/yr) fell within the range reported for southeastern floodplain forests (405-837
g/m2/yr) (Brown 1981, Megonigal et al. 1997, Shure et al. 1985, Cuffney 1988, Conner
and Day 1992, Clawson et al. 1996), T3L was just below the range. Stem density is not
widely reported in the literature and available figures suggest a large range (530 – 2000
stems/ha; Dabel and Day 1977, Brown 1981, Megonigal et al. 1997), but mean stem
density in the Silver River was within this range (1010 stems/ha >2.5 cm DBH) despite
two study sites above (T2S and T5S) and two below (T4L and T1S) the range. Mean
basal area across sites (67 ± 27 m2/ha, 60 ± 17 m2/ha excluding T5L: 132 m2/ha) was
higher than values reported for other floodplains (22-47 m2/ha; Brown 1981, Megonigal
et. al. 1997, Jones 1981, Clawson et al. 1996), potentially as a result of the timing and
extent of historical logging, which may have been greater in the large southeastern
49
floodplain forests that have been the focus of most ecological research. This may also
be evident in observed Taxodium distchum dominance along the Silver River. Taxodium
distchum is a commercially attractive wetland tree species and is very slow to
reestablish after harvest (Conner et al. 1986, Dunn and Shartiz 1987). Taxodium
distchum accounts for 59% of basal area and 55% of leaf litterfall in the Silver River
floodplain. The large basal area and dominance of Taxodium compare more favorably
to alluvial swamps such as the Okefenokee Swamp and the Dismal Swamp (52 - 87
m2/ha of which 50 – 73 % is from Taxodium), which are less accessible to harvest
equipment and have a legacy of protection (Dabel and Day 1977, Schlesinger 1978).
The large range in SOM content throughout the Silver River floodplain was
consistent with other southeastern wetlands. The SOM content of the short hydroperiod
sites was within the range of reported SOM content for floodplains (Bruland and
Richardson 2006, Craft 2000). However, SOM content for the long hydroperiod sites
was outside this range, but well within the reported range for non-riverine swamps
(Bruland and Richardson 2006). While this is likely partially due to variation in
hydroperiod, this may also result from the lack of high flow velocities during large floods,
which limits flooding scour that may arise in other rivers. In either case, SOM in the
Silver River floodplain is typical of southeastern wetlands and spans the range of
reported values for both floodplain and non-riverine wetlands.
Dual Control of Ecosystem Metrics
Across all ecosystem attributes measured, my results lend strong support to the
primary hypothesis of this study, and suggest that both hydroperiod and water level
variation regulate the structure and function of floodplain wetlands. Perhaps more
50
importantly, the results also indicate that hydroperiod and water level variation exert
interdependent control on ecosystem structure and function.
Hydroperiod consistently exerted a stronger effect than water level STD,
supporting the use of hydroperiod as the primary metric of hydrology. However, water
level STD explained a significant portion of the variation in ecosystem metrics,
especially within hydroperiod classes and clearly merits consideration.
Both mean and variance appeared to be important regulators of primary
production, though the impact of water level variation was species dependent.
Aboveground net primary productivity estimates (from tree and palm litterfall) and LAI
both decreased with increased hydroperiod, but were not significantly influenced by
water level variation. Taxodium distichum leaf litterfall was positively correlated to water
level variation at long hydroperiod sites; however, Taxodium distichum leaf litterfall per
unit basal area was independent of hydrologic metrics. In contrast, leaf litterfall per unit
basal area of all other tree species decreased with both hydroperiod and water level
variation, as I hypothesized. This suggests that other variables contribute to the
regulation of Taxodium distichum productivity (e.g., reduced competitive stress from
other taxa) and highlights the species adaptability to a wide range of hydrologic
conditions.
Both mean and variance in water levels also regulated wetland organic matter
dynamics. While my results support the hypothesis that SOM quantity increases with
longer hydroperiod and decreases with greater water level variation, SOM quality only
responded to hydroperiod. Numerous studies have investigated the effects of flooding
and inundation on soil processes with varied findings (Brinson et. al. 1981, Day 1983,
51
Shure and Gottschalk 1986, Lockaby 1996). However, few studies have demonstrated a
role of water level variation (Reddy and Patrick 1975, Baker III et al. 2001, Battle and
Golladay 2001), increases in which led to decreased SOM content. While hydroperiod
effects were generally stronger, water level STD explained most of the remaining SOM
content variation. Water level variation may enhance decomposition, reducing SOM
content either by promoting frequent switching from anaerobic to aerobic decomposition
or by allowing more oxygen to enter the soil while still widely dispersing exoenzymes
(Reddy and Patrick 1975). Due to very low flow velocities within the floodplain, scour of
OM is unlikely to be significant.
Hydrology appears to exert less control on SOM recalcitrance than SOM content.
Inferences about SOM recalcitrance are likely limited by low method resolution;
however, because labile OM is preferentially consumed, it seems unlikely that water
level variation would impact SOM quantity without also influencing SOM quality.
Soil elevation bimodality is a hallmark feature of patterned landscapes such as
boreal bogs (Foster et al. 1983, Charman 2002) and the ridge-slough mosaic of the
Everglades (Wu et al. 2006, Watts et al. 2010). However the absence of the predicted
bimodal elevations suggests that feedbacks between hummock elevation and
productivity are not as regular. Floodplain wetlands produce more woody debris than
the marsh and moss-dominated wetlands where bimodality is most often observed. It is
possible that woody debris such as large branches and fallen trees may be creating
elevated microsites stochastically at a rate greater than self-reinforcing processes (i.e.,
balance of SOM production and respiration) can regulate their abundance or height.
However, the increase in soil elevation variation in response to increasing hydroperiod
52
and water level variation as well as the skewness of the distributions towards higher
elevations may be diagnostic of low prevalence hummocks which form as a result of
feedbacks between organic matter accumulation, primary production and reduced
hydroperiod. While hydroperiod explains most of the total variation in soil elevation
variance, water level variation explained a significant portion of the variation in
topography within hydroperiod classes. Although I found no evidence of increased
species richness with water level variation or soil elevation variation, other studies have
observed that microtopography is an important factor in maintaining and enhancing
biodiversity (Beatty 1984, Titus 1990, Scarano et al. 1997, Vivian-Smith 1997, Pollock et
al. 1998, Simmons et al. 2011, Washuta 2011).
Cypress Knees
Despite insufficient evidence to demonstrate that cypress knees provide direct
benefits to the tree, my data clearly support the hypothesis that mean and variation in
cypress knee height is regulated by hydrology. This, in turn, strongly suggests a
dynamic feedback between tree investments in cypress knee development and
exogenous drivers. I note in particular that across sites, knees consistently grew to a
height not inundated more than 5% of the time. The ongoing debate about the role of
knees remains unresolved, but these data provide evidence that may help reject some
prevailing hypotheses. For example, Kummer et al. (1991) suggested that the primary
function of cypress knees was to extract nutrients from stumps. Brown and Montz
(1986) suggested that knees may store starches. Lamborn (1890) proposed that knees
helped to stabilize cypress trees by penetrating the subsurface root mat. Finally,
Kramer et al. (1952) suggested that cypress knees growth is triggered by inundation
53
stress. In this work, longer hydroperiod did not result in greater knee prevalence, but did
affect knee height, which would suggest a feedback between environmental controls on
inundation stress and tree investment in knee biomass. I posit that even modest gas
exchange is sufficient to alleviate inundation stress creating a feedback that regulates
cypress knee growth. Within the long hydroperiod sites, water level variation is strongly
correlated with variation in cypress knee heights, suggesting that cypress invests in a
range of knee heights that balance the increasing metabolic costs of knees as they get
taller with the relative frequency of high stage events; in short, cypress trees invest in a
portfolio of knees that is commensurate with their hydrologic regime. These results
support the contention in Kernell and Levy (1990) that cypress knees respond to
hydrology and that the height of the tallest knees correlates to high water events.
Contingent Effects of Hydrology
Many measured attributes of ecosystem structure and function exhibited greater
sensitivity to water level variation within a single hydroperiod class, suggesting strong
interaction effects wherein the influence of hydroperiod and water level variation are
interdependent. These interactions are difficult to identify due to the low power of the
study, however, several significant results support this supposition. I observed strong
effects of water level variation on leaf litterfall per unit basal area (decrease), wetland
taxa prevalence (decrease), and SOM content (decrease) at short hydroperiod sites.
Similarly I observed strong effects of hydroperiod variation on basal area, but principally
at short hydroperiod sites. This likely arises because all of these functions are controlled
by impacts of soil saturation on gas exchange with the atmosphere. At short
hydroperiod sites, mean water levels are typically below the soil surface. As a result,
54
variation in water level may result in greater change to the status of gas transfer.
Likewise, even small differences in mean water level or hydroperiod among short
hydroperiod sites may result in significantly greater gas exchange. In contrast, water
levels during the growing season in the long hydroperiod sites are generally above the
soil surface. Consequently, differences in mean water level are less likely to significantly
expose the soil column to allow gas exchange, muting the impacts of both variation in
mean water level across long hydroperiod sites and the effects of water level variation
within sites.
The mean and variation in the height of cypress knees was more responsive to
hydrology at the long hydroperiod sites. Cypress knees at the short hydroperiod site
may not have been particularly sensitive to hydrology because soil saturation, not
inundation depth, controls knee formation at short hydroperiod sites. Therefore knees
need only to break the soil surface at short hydroperiod sites to be useful to the tree.
Soil Organic Matter Recalcitrance Peak
I expected that SOM recalcitrance would increase with depth as decomposition
incrementally consumes labile SOM deposited at the soil surface. This prediction
assumes that the age of organic matter increases with depth in the soil column.
However, in every soil core, SOM recalcitrance increased to a peak and then decreased
indicating that labile OM is being introduced into the soil column throughout the soil
profile. This OM may be introduced by roots and root exudates. Furthermore, this
suggests that below the SOM recalcitrance peak (usually 20-30 cm below the soil
surface), the OM lability is conserved due to increased anoxia and thus reduced
decomposition. This provides evidence that a periodically aerobic soil layer (acrotelm)
55
overlays a permanently anoxic soil layer (catotelm) throughout the floodplain and that
the thickness and depth of the acrotelm is a function of mean water level.
Management Implications
Wetlands are conferred special protections because of their significant role in
delivery of ecosystem services. Among the most important services are biodiversity,
carbon storage, and nutrient retention and transformations (Gren et al. 1994), the loss
of which has implications at multiple scales. This study shows that carbon storage is
partially controlled by water level variation. The accumulation of organic matter also
stores and retains nutrients. This study has also shown that microtopography is also
influenced by water level variation and other studies have shown microtopography to
enhancing biodiversity (Beatty 1984, Titus 1990, Scarano et al. 1997, Pollock et al.
1998, Vivian-Smith 1997, Simmons et al. 2011, Washuta 2011).
While managing for water level variation is clearly important in maintaining
ecosystem services, current regulatory approaches to managing environmental flows
often fail to adequately consider hydrologic variation (though see Richter et al. 1997).
The majority of regulatory methods for determining the maximum allowable withdrawal
from a water body are based on maintaining flows and levels which prevent significant
harm to dependent water bodies and wetlands; such is the case with the Minimum
Flows and Levels (MFLs) mandate placed on Florida’s environmental regulators by the
1972 Florida Water Resources Act. Minimum flows and levels are often quantified and
represented largely by flow-duration curves which relate flow/stage to the percentage of
the time it is exceeded (Beecher 1990, Gillilan and Brown 1997, Tharme 2003,
Neubauer et al. 2008). While this method acknowledges that there is no meaningful
56
“minimum” but rather a suitable regime, it does not allow for management of the
duration and return intervals of flooding events, which are crucial components of the
hydrologic regime and characterize water level variation (Gordon et. al. 1991, Neubauer
et al. 2008). More robust methods, like those implemented by the St.Johns River Water
Management District (SJRWMD) in north east Florida, define the duration and
frequency of a handful of flooding events (Neubauer et al. 2008). While this practice
addresses the importance of variation, it only maintains a few hydrologic events rather
than protecting the water level variation regime. As we seek to conserve our valuable
ecosystems and the underlying drivers that regulate their structure and function, we
need to evaluate and manage for both aspects of the drivers, defining not only a
characteristic mean, but also a characteristic variance.
57
APPENDIX A ADDITIONAL SITE CHARACTERISTICS
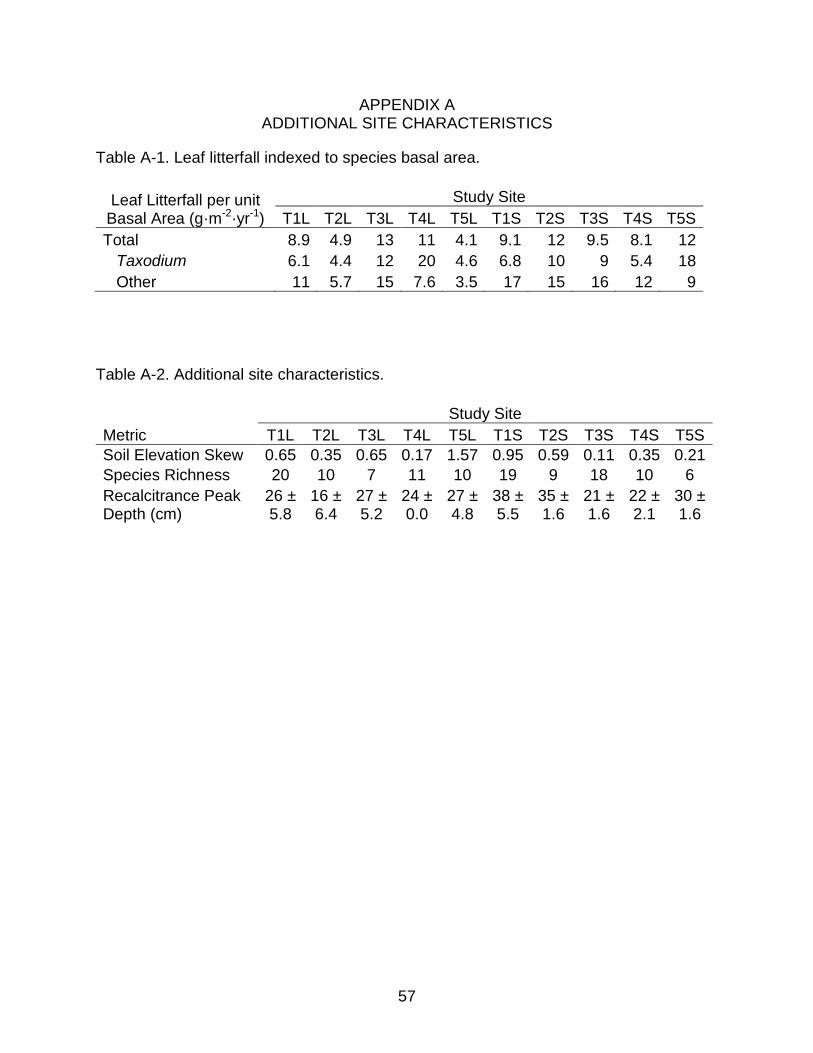
Table A-1. Leaf litterfall indexed to species basal area.
Leaf Litterfall per unit Basal Area (g·m-2·yr-1)
Study Site T1L T2L T3L T4L T5L T1S T2S T3S T4S T5S
Total 8.9 4.9 13 11 4.1 9.1 12 9.5 8.1 12 Taxodium 6.1 4.4 12 20 4.6 6.8 10 9 5.4 18 Other 11 5.7 15 7.6 3.5 17 15 16 12 9
Table A-2. Additional site characteristics.
Study Site
Metric T1L T2L T3L T4L T5L T1S T2S T3S T4S T5S Soil Elevation Skew 0.65 0.35 0.65 0.17 1.57 0.95 0.59 0.11 0.35 0.21 Species Richness 20 10 7 11 10 19 9 18 10 6 Recalcitrance Peak Depth (cm)
26 ± 5.8
16 ± 6.4
27 ± 5.2
24 ± 0.0
27 ± 4.8
38 ± 5.5
35 ± 1.6
21 ± 1.6
22 ± 2.1
30 ± 1.6
58
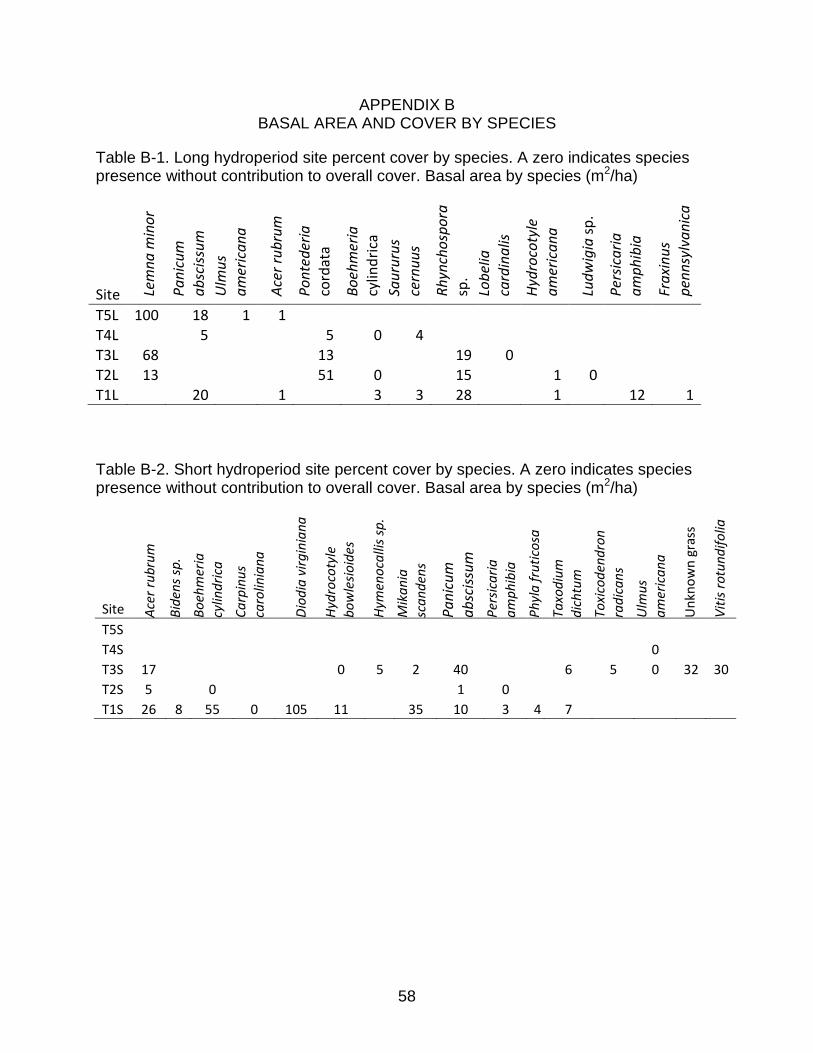
APPENDIX B BASAL AREA AND COVER BY SPECIES
Table B-1. Long hydroperiod site percent cover by species. A zero indicates species presence without contribution to overall cover. Basal area by species (m2/ha)
Table B-2. Short hydroperiod site percent cover by species. A zero indicates species presence without contribution to overall cover. Basal area by species (m2/ha)
Site Acer
rubr
um
Bide
ns sp
.
Boeh
mer
ia
cylin
dric
a
Carp
inus
ca
rolin
iana
Diod
ia v
irgin
iana
Hydr
ocot
yle
bow
lesio
ides
Hym
enoc
allis
sp.
Mik
ania
sc
ande
ns
Pani
cum
ab
sciss
um
Pers
icar
ia
amph
ibia
Phyl
a fr
utic
osa
Taxo
dium
di
chtu
m
Toxi
code
ndro
n ra
dica
ns
Ulm
us
amer
ican
a
Unk
now
n gr
ass
Vitis
rotu
ndifo
lia
T5S
T4S
0
T3S 17
0 5 2 40
6 5 0 32 30 T2S 5
0
1 0
T1S 26 8 55 0 105 11
35 10 3 4 7
Site Lem
na m
inor
Pani
cum
ab
sciss
um
Ulm
us
amer
ican
a
Acer
rubr
um
Pont
eder
ia
cord
ata
Boeh
mer
ia
cylin
dric
a Sa
urur
us
cern
uus
Rhyn
chos
pora
sp
. Lo
belia
ca
rdin
alis
Hydr
ocot
yle
amer
ican
a
Ludw
igia
sp.
Pers
icar
ia
amph
ibia
Frax
inus
pe
nnsy
lvan
ica
T5L 100 18 1 1 T4L
5
5 0 4
T3L 68
13
19 0 T2L 13
51 0
15
1 0
T1L
20
1
3 3 28
1
12 1
59
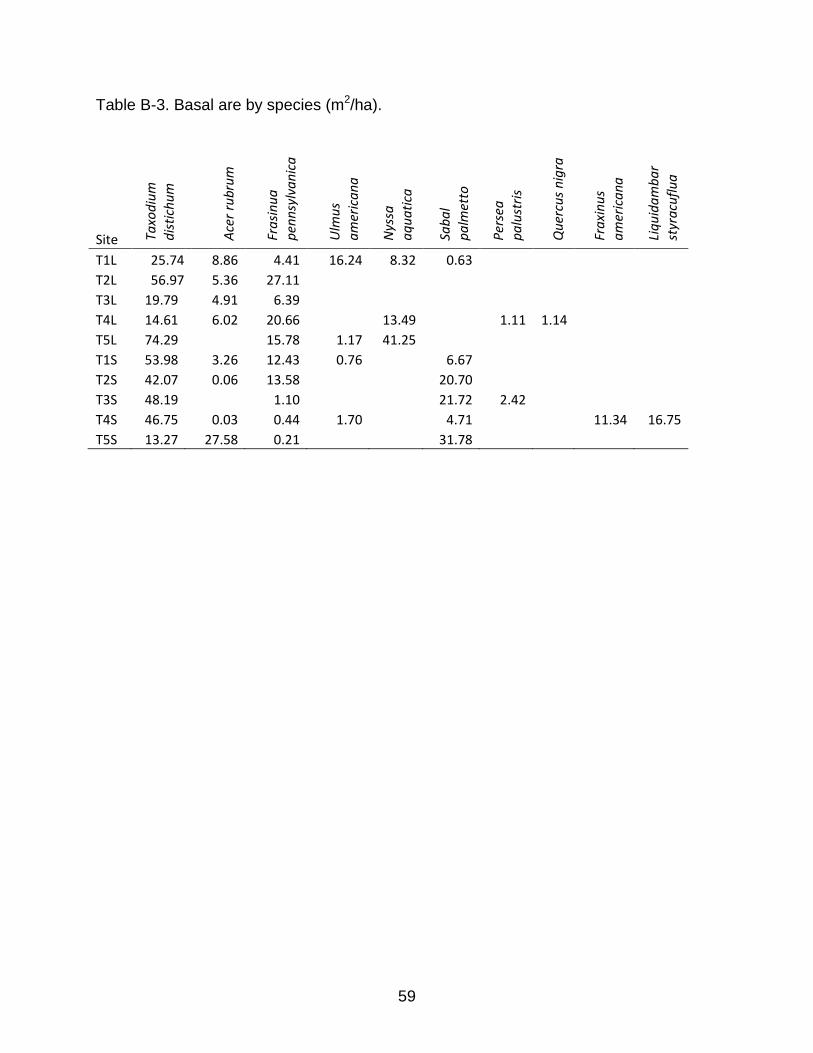
Table B-3. Basal are by species (m2/ha).
Site Ta
xodi
um
dist
ichu
m
Acer
rubr
um
Fras
inua
pe
nnsy
lvan
ica
Ulm
us
amer
ican
a
Nys
sa
aqua
tica
Saba
l pa
lmet
to
Pers
ea
palu
stris
Que
rcus
nig
ra
Frax
inus
am
eric
ana
Liqu
idam
bar
styr
acuf
lua
T1L 25.74 8.86 4.41 16.24 8.32 0.63 T2L 56.97 5.36 27.11
T3L 19.79 4.91 6.39 T4L 14.61 6.02 20.66
13.49
1.11 1.14 T5L 74.29
15.78 1.17 41.25
T1S 53.98 3.26 12.43 0.76
6.67 T2S 42.07 0.06 13.58
20.70
T3S 48.19
1.10
21.72 2.42 T4S 46.75 0.03 0.44 1.70
4.71
11.34 16.75
T5S 13.27 27.58 0.21
31.78
60
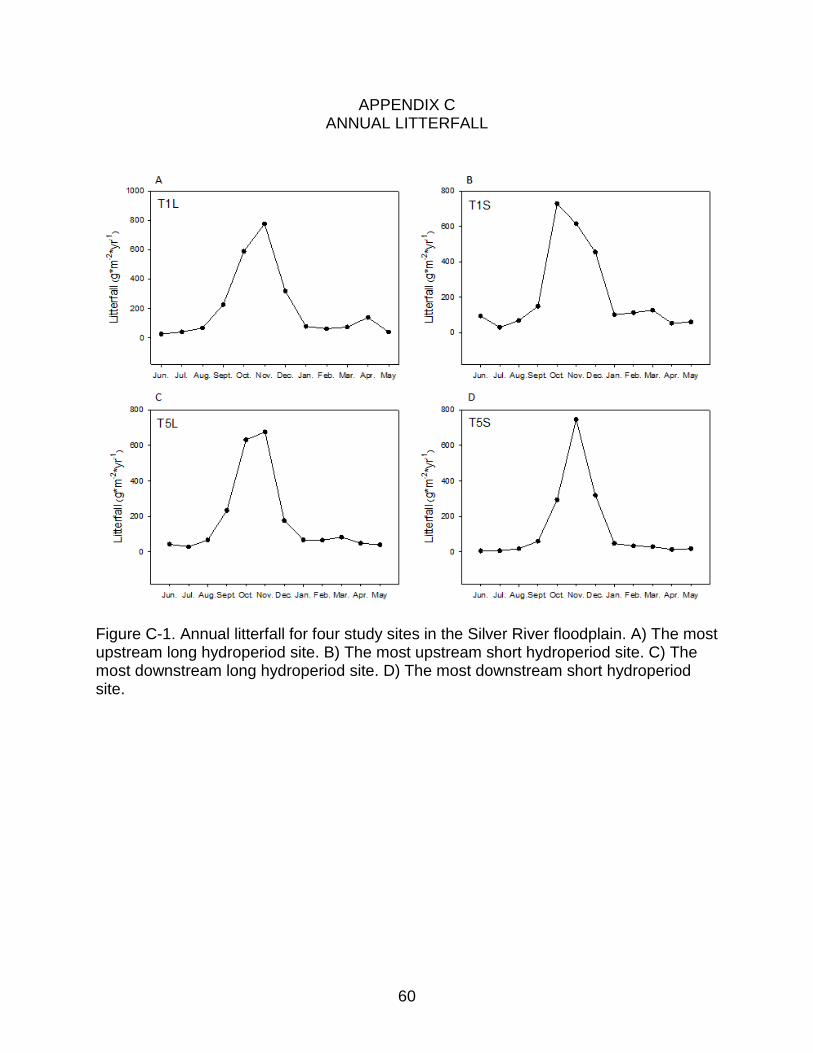
APPENDIX C ANNUAL LITTERFALL
Figure C-1. Annual litterfall for four study sites in the Silver River floodplain. A) The most upstream long hydroperiod site. B) The most upstream short hydroperiod site. C) The most downstream long hydroperiod site. D) The most downstream short hydroperiod site.
61
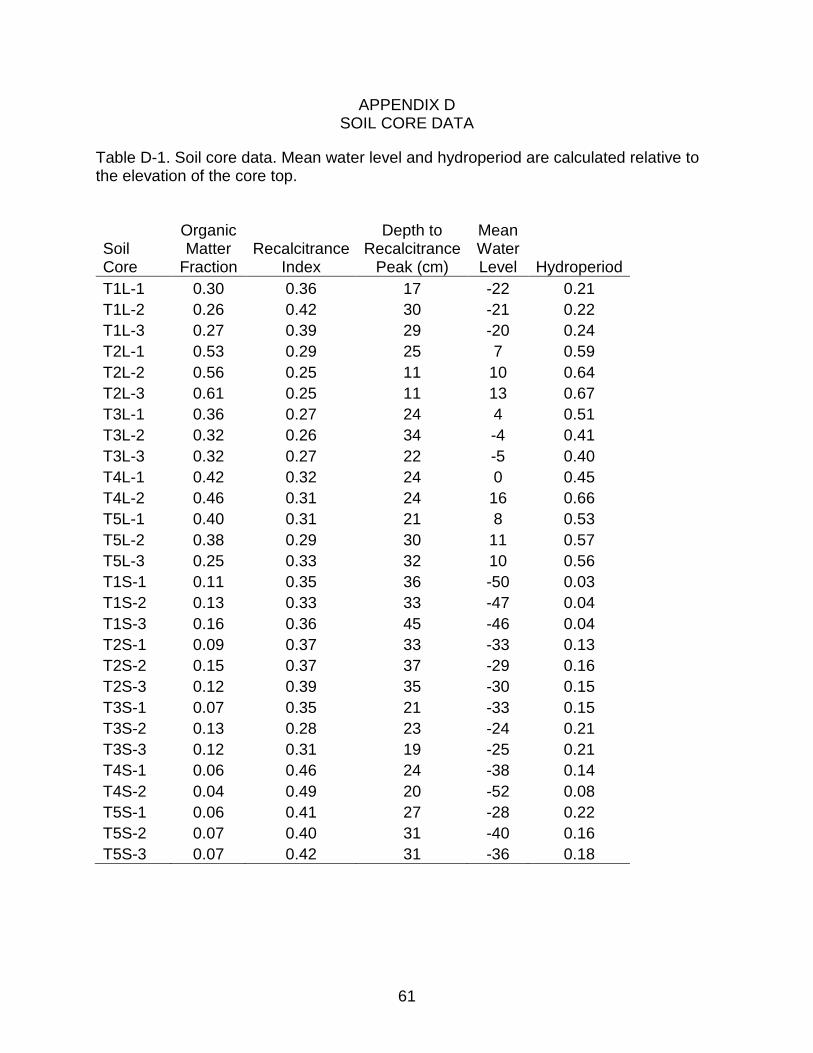
APPENDIX D SOIL CORE DATA
Table D-1. Soil core data. Mean water level and hydroperiod are calculated relative to the elevation of the core top.
Soil Core
Organic Matter
Fraction Recalcitrance
Index
Depth to Recalcitrance
Peak (cm)
Mean Water Level Hydroperiod
T1L-1 0.30 0.36 17 -22 0.21 T1L-2 0.26 0.42 30 -21 0.22 T1L-3 0.27 0.39 29 -20 0.24 T2L-1 0.53 0.29 25 7 0.59 T2L-2 0.56 0.25 11 10 0.64 T2L-3 0.61 0.25 11 13 0.67 T3L-1 0.36 0.27 24 4 0.51 T3L-2 0.32 0.26 34 -4 0.41 T3L-3 0.32 0.27 22 -5 0.40 T4L-1 0.42 0.32 24 0 0.45 T4L-2 0.46 0.31 24 16 0.66 T5L-1 0.40 0.31 21 8 0.53 T5L-2 0.38 0.29 30 11 0.57 T5L-3 0.25 0.33 32 10 0.56 T1S-1 0.11 0.35 36 -50 0.03 T1S-2 0.13 0.33 33 -47 0.04 T1S-3 0.16 0.36 45 -46 0.04 T2S-1 0.09 0.37 33 -33 0.13 T2S-2 0.15 0.37 37 -29 0.16 T2S-3 0.12 0.39 35 -30 0.15 T3S-1 0.07 0.35 21 -33 0.15 T3S-2 0.13 0.28 23 -24 0.21 T3S-3 0.12 0.31 19 -25 0.21 T4S-1 0.06 0.46 24 -38 0.14 T4S-2 0.04 0.49 20 -52 0.08 T5S-1 0.06 0.41 27 -28 0.22 T5S-2 0.07 0.40 31 -40 0.16 T5S-3 0.07 0.42 31 -36 0.18
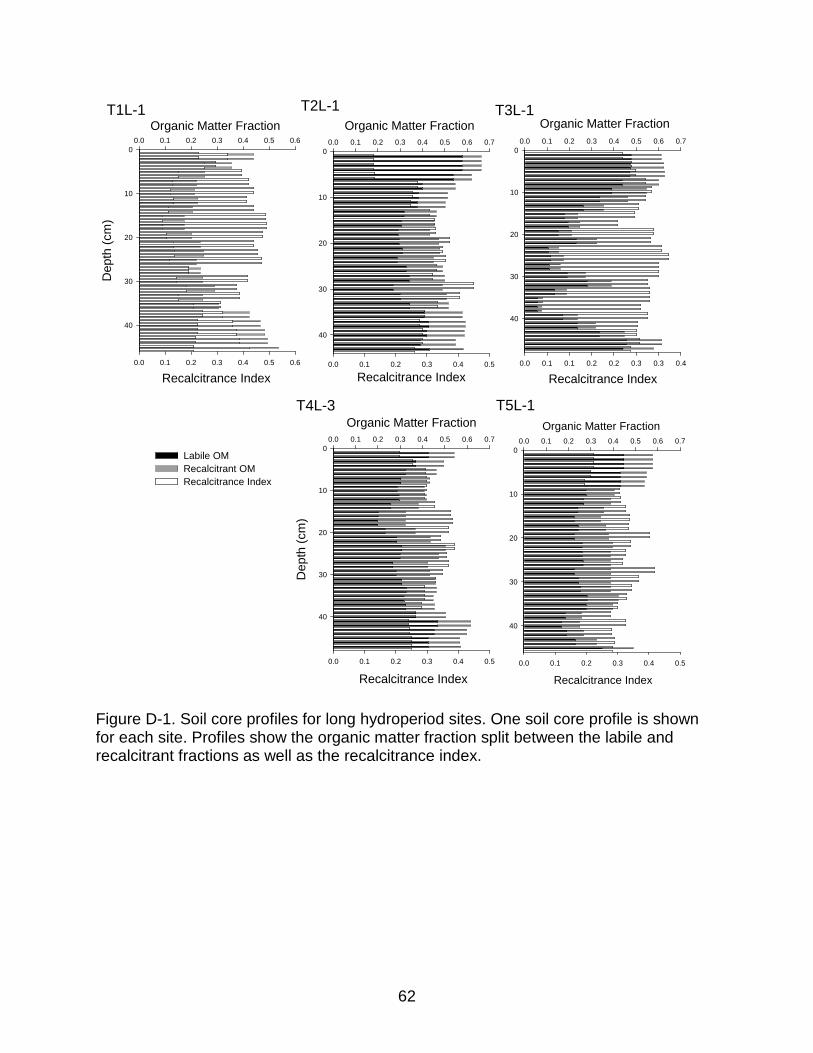
62
Organic Matter Fraction0.0 0.1 0.2 0.3 0.4 0.5 0.6
Dep
th (c
m)
0
10
20
30
40
Recalcitrance Index0.0 0.1 0.2 0.3 0.4 0.5 0.6
Labile OM Recalcitrant OM Recalcitrance Index
T2L-1Organic Matter Fraction
0.0 0.1 0.2 0.3 0.4 0.5 0.6 0.70
10
20
30
40
Recalcitrance Index0.0 0.1 0.2 0.3 0.4 0.5
T3L-1Organic Matter Fraction
0.0 0.1 0.2 0.3 0.4 0.5 0.6 0.70
10
20
30
40
Recalcitrance Index0.0 0.1 0.1 0.2 0.2 0.3 0.3 0.4
T4L-3Organic Matter Fraction
0.0 0.1 0.2 0.3 0.4 0.5 0.6 0.7
Dep
th (c
m)
0
10
20
30
40
Recalcitrance Index0.0 0.1 0.2 0.3 0.4 0.5
T5L-1Organic Matter Fraction
0.0 0.1 0.2 0.3 0.4 0.5 0.6 0.70
10
20
30
40
Recalcitrance Index0.0 0.1 0.2 0.3 0.4 0.5
T1L-1
Figure D-1. Soil core profiles for long hydroperiod sites. One soil core profile is shown for each site. Profiles show the organic matter fraction split between the labile and recalcitrant fractions as well as the recalcitrance index.
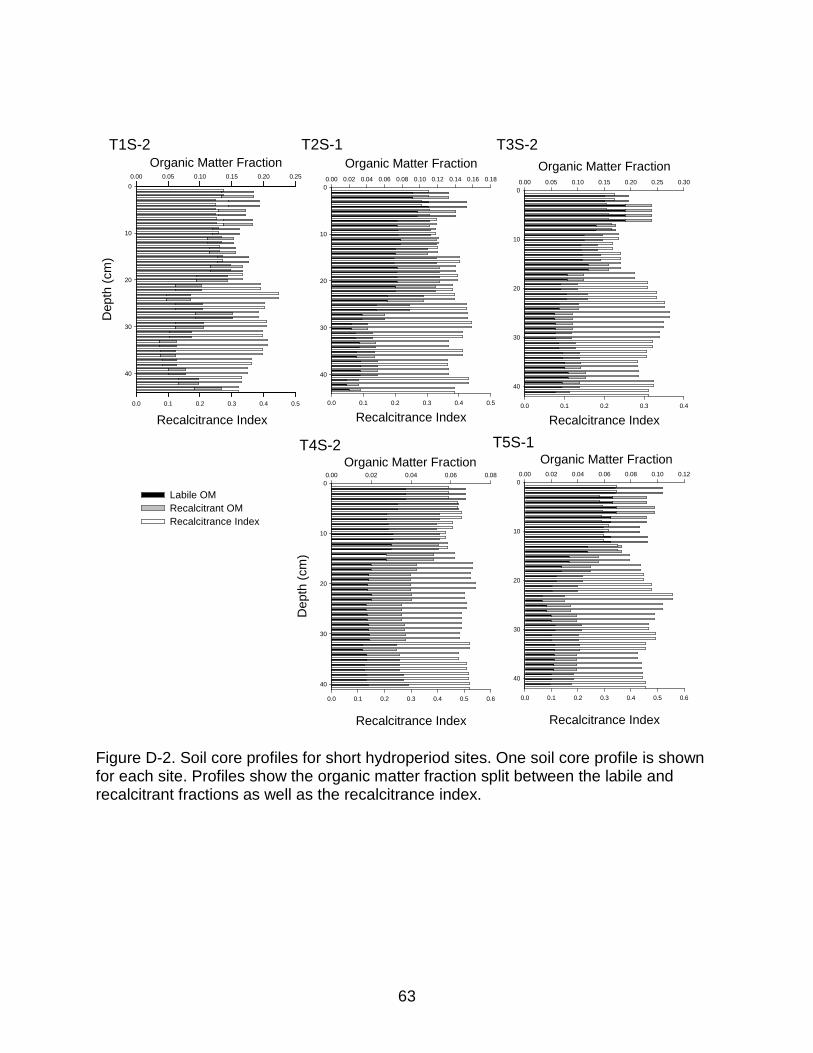
63
T1S-2Organic Matter Fraction
0.00 0.05 0.10 0.15 0.20 0.25
Dep
th (c
m)
0
10
20
30
40
Recalcitrance Index0.0 0.1 0.2 0.3 0.4 0.5
Labile OMRecalcitrant OMRecalcitrance Index
T2S-1Organic Matter Fraction
0.00 0.02 0.04 0.06 0.08 0.10 0.12 0.14 0.16 0.180
10
20
30
40
Recalcitrance Index0.0 0.1 0.2 0.3 0.4 0.5
T3S-2Organic Matter Fraction
0.00 0.05 0.10 0.15 0.20 0.25 0.300
10
20
30
40
Recalcitrance Index0.0 0.1 0.2 0.3 0.4
T4S-2Organic Matter Fraction
0.00 0.02 0.04 0.06 0.08
Dep
th (c
m)
0
10
20
30
40
Recalcitrance Index
0.0 0.1 0.2 0.3 0.4 0.5 0.6
T5S-1Organic Matter Fraction
0.00 0.02 0.04 0.06 0.08 0.10 0.120
10
20
30
40
Recalcitrance Index
0.0 0.1 0.2 0.3 0.4 0.5 0.6
Figure D-2. Soil core profiles for short hydroperiod sites. One soil core profile is shown for each site. Profiles show the organic matter fraction split between the labile and recalcitrant fractions as well as the recalcitrance index.
64
LIST OF REFERENCE
Angehrn-Bettinazzi, C., P. Lüscher, et al. (1988). "Thermogravimetry as a Method for Distinguishing Various Degrees of Mineralisation in Macromorphologically-defined Humus horizons." Zeitschrift für Pflanzenernährung und Bodenkunde 151(3): 177-183. Baker III T. T., B. G. Lockaby, et al. (2001). "Leaf Litter Decomposition and Nutrient Dynamics in Four Southern Forested Floodplain Communities." Soil Sci. Soc. Am. J. 65(4): 1334-1347. Battle, J. M. and S. W. Golladay (2001). "Hydroperiod Influence on Breakdown of Leaf Litter in Cypress-Gum Wetlands." American Midland Naturalist 146(1): 128-145. Beecher H.A. (1990). “Standards for instream flows.” Rivers 1(2):97–109 Beatty, S. W. (1984). "Influence of Microtopography and Canopy Species on Spatial Patterns of Forest Understory Plants." Ecology 65(5): 1406-1419. Belyea, L. R. and R. S. Clymo (2001). "Feedback control of the rate of peat formation." Proceedings of the Royal Society of London. Series B: Biological Sciences 268(1473): 1315-1321. Benedetti-Cecchi, L. (2003). "The Importance of the Variance Around the Mean Effect Size of Ecological Processes." Ecology 84(9): 2335-2346. Bond-Lamberty, B. and A. Thomson (2010). "Temperature-associated increases in the global soil respiration record." Nature 464(7288): 579-582. Bray, J. R. and E. Gorham (1964). Litter Production in Forests of the World. Advances in Ecological Research. J. B. Cragg, Academic Press. Volume 2: 101-157. Briand, C. H. (2001). "Cypress knees: an enduring enigma." Arnoldia (Jamaica Plain) 60(4): 19-25. Brinson, M. M, A. E. Lugo, and S. Brown. (1981). “Primary productivity, decomposition and consumer activity in freshwater wetlands.” Annual Review of Ecology and Systematics 12:123-161. Brown, S. (1981). “A comparison of the structure, primary productivity, and transpiration of cypress ecosystems in Florida.” Ecological Monographs 51:403-427. Brown, C. A. and G. N. Montz (1986). Baldcypress : the tree unique, the wood eternal. Baton Rouge, Claitor's Pub. Division.

65
Bruland, G. and C. Richardson (2006). "Comparison of Soil Organic Matter in Created, Restored and Paired Natural Wetlands in North Carolina." Wetlands Ecology and Management 14(3): 245-251. Charman, D. J. (2002). Peatlands and environmental change. Chichester, West Sussex, England; New York, J. Wiley. Clawson, R. G., B. G. Lockaby, et al. (2001). "Changes in Production and Nutrient Cycling across a Wetness Gradient within a Floodplain Forest." Ecosystems 4(2): 126-138. Connell, J.H. (1976). “Diversity in tropical rain forest and coral reefs.” Science 199: 1302-1310. Conner, W. H., and J. W. Day, Jr. (1976). “Productivity and composition of a baldcypress-water tupelo site and a bottomland hardwood site in a Louisiana swamp.” American Journal of Botany 63:1354-1364. Conner, W. H., et al. (1986). "Natural regeneration of baldcypress (Taxodium distichum (L.) Rich.) in a Louisiana swamp." Forest Ecology and Management 14(4): 305-317. Conner, W. H., and J. W. Day, Jr. (1992). “Water level variability and litterfall productivity of forested freshwater wetlands in Louisiana.” American Midland Naturalist 128:237-245. Coutts, M. and W. Armstrong (1976). "Role of oxygen transport in the tolerance of trees to waterlogging." Tree physiology and yield improvement: 361-385. Craft, C. B. and W. P. Casey (2000). "Sediment and nutrient accumulation in floodplain and depressional freshwater wetlands of Georgia, USA." Wetlands 20(2): 323-332. Cronk, J. K. and S. Fennessy (2001). Wetland Plants: Biology and Ecology, Taylor & Francis. Cuffney, T. F. (1988). "Input, movement and exchange of organic matter within a subtropical coastal black water river-flood plain system." Freshwater Biology 19(3): 305-320. Dabel, C. V. and F. P. Day, Jr. (1977). "Structural Comparisons of Four Plant Communities in the Great Dismal Swamp, Virginia." Bulletin of the Torrey Botanical Club 104(4): 352-360. Day, F. P., Jr. (1983). "Effects of Flooding on Leaf Litter Decomposition in Microcosms." Oecologia 56(2/3): 180-184.
66
Dunn, C. and R. Sharitz (1987). "Revegetation of a Taxodium-Nyssa forested wetland following complete vegetation destruction." Vegetatio 72(3): 151-157. Eppinga, M. B., et al. (2009). "Nutrients and Hydrology Indicate the Driving Mechanisms of Peatland Surface Patterning." The American Naturalist 173(6): 803-818. Foster, D. R., G. A. King, et al. (1983). "Origin of string patterns in boreal peatlands." Nature 306(5940): 256-258. Gillilan, D. M. and T. C. Brown (1997). Instream Flow Protection: Seeking A Balance In Western Water Use, Island Press. Gholz, H. L. (1982). "Environmental Limits on Aboveground Net Primary Production, Leaf Area, and Biomass in Vegetation Zones of the Pacific Northwest." Ecology 63(2): 469-481. Gosselink, J., et al. (1981). “Ecological factors in the determination of riparian wetland boundaries.” Wetlands of bottomland hardwood forests in J. R. Clark and J.Benforado, editors. Elsevier Scientific, New York, New York, p 197-219 Gosselink, J. and R. Turner (1978). "The role of hydrology in freshwater wetland ecosystems." Freshwater Wetlands: Ecological Processes and Management Potential 1978, R. E. Good, D. F. Whigham and R. L. Simpson, editors, Academic Press, New York, p 63-78. 6 fig, 3 tab, 36 ref. Gordon, N. D., et al. (1991). Stream hydrology: an introduction for ecologists, John Wiley and Sons Ltd. Gren, I.-M., et al. (1994). "Primary and secondary values of wetland ecosystems." Environmental and Resource Economics 4(1): 55-74. Hacker, S. D. and M. D. Bertness (1999). "Experimental Evidence for Factors Maintaining Plant Species Diversity in a New England Salt Marsh." Ecology 80(6): 2064-2073. Heffernan, J. B. (2008). "Wetlands as an Alternative Stable State in Desert Streams." Ecology 89(5): 1261-1271. Hilbert, D. W., et al. (2000). "Modelling and Analysis of Peatlands as Dynamical Systems." Journal of Ecology 88(2): 230-242. Jackson, M. B. and T. D. Colmer (2005). "Response and Adaptation by Plants to Flooding Stress." Annals of Botany 96(4): 501-505. Jawitz, J. W. and J. Mitchell (2011). "Temporal inequality in catchment discharge and solute export." Water Resources Research 47(10): W00J14.

67
Jones, R. H. (1981). “A classification of lowland forests in the northern coastal plain of South Carolina” (Doctoral dissertation, Clemson University). Johnson, F. L. and D. T. Bell (1976). "Plant Biomass and Net Primary Production along a Flood-Frequency Gradient in the Streamside Forest." Castanea 41(2): 156-165. Keeley, J. E. (1979). "Population Differentiation along a Flood Frequency Gradient: Physiological Adaptations to Flooding in Nyssa sylvatica." Ecological Monographs 49(1): 89-108. Kernell, J. L. and G. F. Levy (1990). "The Relationship of Bald Cypress [Taxodium distichum (L.) Richard] Knee Height to Water Depth." Castanea 55(4): 217-222. Kozlowski, T. T. (1984). "Plant Responses to Flooding of Soil." BioScience 34(3): 162-167. Kozlowski, T. T. (1997). "Responses of woody plants to flooding and salinity." Tree Physiology 17(7): 490. Kramer, P. J., W. S. Riley, et al. (1952). "Gas Exchange of Cypress Knees." Ecology 33(1): 117-121. Kristensen, E. (1990). "Characterization of biogenic organic matter by stepwise thermogravimetry (STG)." Biogeochemistry 9(2): 135-159. Kristensen, E. and F. Ø. Andersen (1987). "Determination of organic carbon in marine sediments: a comparison of two CHN-analyzer methods." Journal of Experimental Marine Biology and Ecology 109(1): 15-23. Kummer, H., M. Brandt, et al. (1991). "Nutritional exploitation of dead trunks: another function of cypress knees (Taxodium distichum)?" Trees 5(2): 122-123. Lamborn, R. H. (1890). "The knees of the bald cypress tree: a new theory of their function." Science ns-15(365): 65-67. Lichvar, R., E. United States. Army. Corps of, et al. (2012). The National Wetland Plant List. Hanover, NH, US Army Engineer Research and Development Center, Cold Regions Research and Engineering Laboratory. Landres, P., et al. (1999). Overview of the use of natural variability concepts in managing ecological systems. 9: 1179–1188. Lockaby, B. G., et al. (1996). "Hydroperiod Influences on Nutrient Dynamics in Decomposing Litter of a Floodplain Forest." Soil Sci. Soc. Am. J. 60(4): 1267-1272.
68
Lopez-Capel, E., S. P. Sohi, et al. (2005). "Use of Thermogravimetry–Differential Scanning Calorimetry to Characterize Modelable Soil Organic Matter Fractions." Soil Sci. Soc. Am. J. 69(1): 136-140. Lugo, A. E. (1978). Stress and ecosystems. Energy and Environmental Stress in Aquatic Systems, Selected Papers from a Symposium held at Augusta, Georgia November 2-4, 1977. CONF-771114. p 62-101, 1978, 8 fig, 5 tab, 114 ref. Megonigal, J. P., W. H. Conner, et al. (1997). "Aboveground Production in Southeastern Floodplain Forests: A Test of the Subsidy-Stress Hypothesis." Ecology 78(2): 370-384. Mitsch, W. J., and K. C. Ewel. (1979). “Comparative biomass and growth of cypress in Florida wetlands.” American Midland Naturalist 101:417-426. Neubauer, C., G. Hall, et al. (2008). "Minimum Flows and Levels Method of the St. Johns River Water Management District, Florida, USA." Environmental Management 42(6): 1101-1114. Poff, N. L. and J. V. Ward (1989). "Implications of Streamflow Variability and Predictability for Lotic Community Structure: A Regional Analysis of Streamflow Patterns." Canadian Journal of Fisheries and Aquatic Sciences 46(10): 1805-1818. Pollock, M. M., R. J. Naiman, et al. (1998). "Plant Species Richness in Riparian Wetlands—A Test Of Biodiversity Theory." Ecology 79(1): 94-105. Porporato, A., P. D’Odorico, et al. (2002). "Ecohydrology of water-controlled ecosystems." Advances in Water Resources 25(8–12): 1335-1348. Porporato, A., E. Daly, et al. (2004). "Soil Water Balance and Ecosystem Response to Climate Change." The American Naturalist 164(5): 625-632. Odum, W. E., E. P. Odum, et al. (1995). "Nature's Pulsing Paradigm." Estuaries 18(4): 547-555. Reddy, K. R. and R. D. DeLaune (2008). Biogeochemistry of wetlands: science and applications, CRC PressI Llc. Reddy, K. R. and W. H. Patrick (1975). "Effect of alternate aerobic and anaerobic conditions on redox potential, organic matter decomposition and nitrogen loss in a flooded soil." Soil Biology and Biochemistry 7(2): 87-94. Richter BD, Baumgartner JV, Braun DP (1997) “How much water does a river need?” Freshwater Biology 37:231–249 Sahrawat, K. L. (2003). Organic matter accumulation in submerged soils. Advances in Agronomy, Academic Press. Volume 81: 169-201.
69
Schnitzer, M. and I. Hoffman (1966). "A Thermogravimetric Approach To The Classification Of Organic Soils." Soil Sci. Soc. Am. J. 30(1): 63-66. Schuur, E. and P. Matson (2001). "Net primary productivity and nutrient cycling across a mesic to wet precipitation gradient in Hawaiian montane forest." Oecologia 128(3): 431-442. Schlesinger, W. H. (1978). "Community Structure, Dynamics and Nutrient Cycling in the Okefenokee Cypress Swamp-Forest." Ecological Monographs 48(1): 43-65. Sharma, H. S. S. (1989). "Thermogravimetric analysis of flax shives degraded by pleurotus ostreatus and ceraceomyces sublaevis." Thermochimica Acta 138(2): 347-357. Shure, D. J., M. R. Gottschalk, et al. (1986). "Litter Decomposition Processes in a Floodplain Forest." American Midland Naturalist 115(2): 314-327. Scarano, F. R., et al. (1997). "Plant establishment on flooded and unflooded patches of a freshwater swamp forest in southeastern Brazil." Journal of Tropical Ecology 13(06): 793-803. Simmons, M. E., X. Ben Wu, et al. (2011). "Plant and Soil Responses to Created Microtopography and Soil Treatments in Bottomland Hardwood Forest Restoration." Restoration Ecology 19(1): 136-146. Sousa, W. P. (1979). "Experimental Investigations of Disturbance and Ecological Succession in a Rocky Intertidal Algal Community." Ecological Monographs 49(3): 227-254. Taylor, J. R., et al. (1990). "Bottomland hardwood forests: their functions and values." Ecological processes and cumulative impacts: Illustrated by bottomland hardwood wetland ecosystems: 13-86. Tharme, R.E. (2003). “A global perspective on environmental flow assessment: emerging trends in the development and application of environmental flow methodologies for rivers.” River Research and Applications 19:397–441 Titus, J. H. (1990). "Microtopography and Woody Plant Regeneration in a Hardwood Floodplain Swamp in Florida." Bulletin of the Torrey Botanical Club 117(4): 429-437. Vivian-Smith G. (1997). “Microtopographic Heterogeneity and Floristic Diversity in Experimental Wetland Communities.” Journal of Ecology 85(1): 71-82.

70
Ward, J. and J. Stanford (1983). “Intermediate-Disturbance Hypothesis: An Explanation for Biotic Diversity Patterns in Lotic Ecosystems.” Dynamics of Lotic Systems 347-356 p, 2 Watts, D., M. Cohen, et al. (2010). "Hydrologic Modification and the Loss of Self-organized Patterning in the Ridge–Slough Mosaic of the Everglades." Ecosystems 13(6): 813-827. Washuta, A. B. (2011). Microtopographical effects of clearcutting of Taxodium-Nyssa swamps. Gainesville, Fla, University of Florida. Wu, Y., N. Wang, et al. (2006). "An analysis of spatial complexity of ridge and slough patterns in the Everglades ecosystem." Ecological Complexity 3(3): 183-192.

71
BIOGRAPHICAL SKETCH
Joseph Delesantro received his bachelor’s degree in environmental engineering
from the University of Florida in 2010. He remained at the University of Florida, moving
over to the School of Forest Resources and Conservation to pursue his master’s
degree, completed in 2013. He plans to find employment in the field of environmental
hydrology and work towards the sustainable use of water resources.


![UFDC Image Array 2ufdcimages.uflib.ufl.edu/IR/00/00/10/00/00001/SECC_Sondeo_in_nort… · Three teams first conducted transects of the local area [kT110]to ascertain the natural and](https://img.pdfslide.us/doc/110x75/5f46e7336b5aab29a26a1080/ufdc-image-array-three-teams-first-conducted-transects-of-the-local-area-kt110to.jpg)