Embed Size (px)
Citation preview

© 2010 by Fei Wen. All rights reserved.

i
CELL SURFACE DISPLAY
IN BIOMEDICAL APPLICATIONS AND BIOFUELS PRODUCTION
BY
FEI WEN
DISSERTATION
Submitted in partial fulfillment of the requirements
for the degree of Doctor of Philosophy in Chemical Engineering
in the Graduate College of the
University of Illinois at Urbana-Champaign, 2010
Urbana, Illinois
Doctoral Committee:
Professor Huimin Zhao, Chair
Associate Professor Paul J. A. Kenis
Assistant Professor Christopher V. Rao
Professor David M. Kranz
ii
Abstract
Cell surface display allows peptides or proteins to be expressed on the cell exterior as
fusions to natural host anchoring motifs. It is a powerful technique with a myriad of applications
in protein engineering, environmental bioremediation, biocatalysis, as well as vaccine and
therapeutics development. Compared to intracellular expression, the main advantages of this
technology include direct access to large target molecules that cannot diffuse into the cell,
stabilization of enzymes or proteins by attaching them to the cell surface, and elimination of
time-consuming protein purification steps. This thesis describes our efforts of applying the cell
surface display technology to address some of the challenges in biomedical research and biofuels
production.
Identification of T cell epitopes is a critical, but often difficult step in developing peptide-
based vaccines and T cell immunotherapies. Unlike antibody that recognizes free soluble
antigens, T cell receptor (TCR) recognizes its epitope bound to major histocompatibility
complex (MHC) expressed on antigen presenting cells (APCs). In addition, the examination of T
cell epitope activity requires the use of professional APCs, which are difficult to isolate, expand,
and maintain. To address these issues, we have developed a facile, accurate, and high-throughput
method for T cell epitope mapping by displaying pathogen-derived peptide libraries in complex
with MHC on yeast cell surface. Using human MHC class II protein DR1 and influenza A virus
as a model system, this method was successfully used to pinpoint a 17-amino-acid-long T cell
epitope from the entire influenza A virus genome.
The production of peptide-MHC (pMHC) tetramer, especially class II pMHC tetramer, is
very time-consuming and labor-intensive and often show low avidity, thus represents another
iii
challenge in the biomedical research area. To address these limitations, we sought to engineer
MHC monomers with high TCR-binding affinity. The wild-type DR2-MBP85-99 complex, which
is associated with multiple sclerosis, was successfully displayed on insect cell surface and bound
specific TCR tetramers in an epitope-dependent manner, providing the basis of a high throughput
screening method to identify DR2 variants with improved affinity by directed evolution. A
library of DR2 variants in complex with MBP was created and screened using specific TCR
tetramers. After one round of cell sorting, potential variants with improved TCR-binding affinity
have been enriched. Further rounds of enrichment are in process.
Lignocellulosic biofuels represent a sustainable, renewable, and the only foreseeable
alternative energy source to transportation fossil fuels. The central technological impediment to a
more widespread utilization of lignocellulose is the absence of low-cost technology to break
down its major component – cellulose. Consolidated bioprocessing (CBP), which combines
enzyme production, cellulose hydrolysis, and fermentation in a single step, has been proposed to
significantly lower the cellulosic ethanol production cost. However, the great potential of CBP
cannot be realized using microorganisms available today. In an effort to develop a CBP-enabling
microorganism, we developed an engineering strategy to enable yeast cells to hydrolyze and
ferment cellulose simultaneously by displaying trifunctional minicellulosomes on the surface.
The system developed here solved the technical difficulties of displaying multiple proteins and
represents a useful platform for elucidating principles of cellulosome construction and mode of
action. Continuing efforts are being directed to improving the hydrolytic efficiency of the surface
engineered yeast with a focus of increasing the enzyme display levels.

iv
Acknowledgements
First of all, I would like to thank my advisor, Professor Huimin Zhao. Without his
guidance and support, this work certainly would not have been possible. His advice has
contributed greatly to my work as a graduate student and will continuously have a positive
influence on my academic career in the future. I would also like to thank Professor Richard
Masel for guiding me through NSF proposal writing and submission process, which has really
been a valuable experience for me. His insightful suggestions and criticism during numerous
meetings have greatly helped me to develop as a scientist. I would also like to thank my
committee members, Professor Paul Kenis and Professor Christopher Rao for their insightful
input, constructive suggestions, and generous help in preparing me for my future academic career,
and Professor David Kranz for introducing the insect cell expression system, which later inspired
my insect cell surface display work. I would also like to thank Professor Jonathan Higdon,
Professor Mary Kraft, Professor Edmund Seebauer, and Professor Charles Schroeder for their
helpful discussions and suggestions in pursuing a successful academic career.
I am also very indebted to every former and current group members of Zhao laboratory
for their helpful discussions. I am particularly grateful to Dr. Olga Esteban for being a great
mentor, Jie Sun, Jing Liang, and Tong Si for their assistance with the minicellulosome work, and
Dr. Zengyi Shao, Dr. Tyler Johannes, Dr. Sheryl Rubin-Pitel, Dr. Ryan P. Sullivan, Dr. Zhilei
Chen, Jing Du, and Michael Mclachlan for their friendship and assistance. I would also like to
thank Dr. Ben Montez, Dr. Barbara Pilas, and Dr. Alexander Ulanov for their assistance with cell
sorting at the Keck Biotechnology Institute and GC-MS analysis at the Carver Metabolomics
Center, respectively.

v
Last but not least, I would like to thank my family for their continuous support and
encouragement. My boyfriend Nikhil Nair has my deepest gratitude for also being a friend and a
colleague. We have been through numerous ups and downs in life and research; his passion,
humor, and above all, generosity have been, and will always be, the solid and fertile ground for
our relationship to grow stronger. My parents also deserve special honors for providing
tremendous educational opportunities that laid solid foundation for me to pursue an academic
career.

vi
Table of Contents
Chapter 1. Introduction...............................................................................................................1
1.1. Overview of Cell Surface Display Systems............................................................................1
1.2. Cell Surface Display and Cellular Immunity Modulation......................................................4
1.2.1. Major Histocompatibility Complex ...............................................................................5
1.2.2. T Cell Receptor ..............................................................................................................8
1.2.3. T Cell Epitope ..............................................................................................................10
1.2.4. Antigen Presenting Cell ...............................................................................................13
1.3. Cell Surface Display and Biofuels Production .....................................................................14
1.3.1. Consolidated Bioprocessing for Cellulosic Biofuels Production.................................16
1.3.2. Surface Engineered Yeast for Consolidated Bioprocessing ........................................18
1.4. Project Overview ..................................................................................................................20
1.5. References.............................................................................................................................22
Chapter 2. Rapid T Cell Epitope Identification Using Yeast Displaying Single-chain
Peptide-MHC Complexes as Artificial APCs .......................................................35
2.1. Introduction...........................................................................................................................35
2.2. Results and Discussion .........................................................................................................38
2.2.1. Functional Expression of Single-chain DR1-HA306-318 Complexes on Yeast Cell
Surface .........................................................................................................................38
2.2.2. A Positive Correlation between Yeast Surface Expression Level and Peptide-
binding Affinity ...........................................................................................................41
2.2.3. Functional Analysis of the DR1-HA306-318 Complex Displayed on Yeast Cell
Surface .........................................................................................................................44
2.2.4. Use of Yeast Cells Displaying Single-chain Peptide-MHC Complexes as AAPCs....47
2.2.5. Design of a T Cell Epitope Identification Method.......................................................48
2.2.6. Epitope Identification from a Single Antigenic Protein - Haemagglutinin .................50
2.2.7. Epitope Identification from a Pathogenic Organism - Influenza A Virus ...................53
2.3. Conclusions and Outlook......................................................................................................58
2.4. Materials and Methods..........................................................................................................61
2.4.1. Vector Construction .....................................................................................................63
2.4.2. Yeast Transformation...................................................................................................64
2.4.3. DNA Sequencing .........................................................................................................64
2.4.4. Yeast Surface Display..................................................................................................65
2.4.5. Flow Cytometry Analysis ............................................................................................65
2.4.6. Extraction of Aga2-DR1-peptide Complexes from Yeast Cell Surface ......................66
2.4.7. Thermostability Assay .................................................................................................66
2.4.8. Western Blot ................................................................................................................66
2.4.9. Library Construction....................................................................................................67
2.4.10. FACS Analysis of Yeast Library .................................................................................69
2.4.11. Stimulation of HA1.7 T cell Hybridomas and IL-2 Detection ....................................70
2.5. References.............................................................................................................................71
Chapter 3. In vitro Evolution of pMHC Complexes with High Affinity toward TCRs
Using Cell Surface Display.....................................................................................76
3.1. Introduction...........................................................................................................................76

vii
3.2. Results and Discussion .........................................................................................................78
3.2.1. Cloning, Expression, and Purification of DR1-HA-specific TCR...............................78
3.2.2. Engineering of Folded DR2 Using Yeast Surface Display..........................................81
3.2.3. Affinity Engineering of DR2-MBP85-99 Complexes Using Yeast Surface Display .....82
3.2.4. Insect Cell Surface Display of Wild-type DR2-MBP85-99 Complexes ........................83
3.2.5. Functional Analysis of the DR2-MBP85-99 Complexes Displayed on Insect Cell
Surface .........................................................................................................................84
3.2.6. Detection of Insect Cell Surface Displayed DR2-MBP85-99 Complexes with
Specific TCR Tetramers ..............................................................................................85
3.2.7. Affinity Engineering of DR2-MBP85-99 Complexes Using Insect Cell Surface
Display .........................................................................................................................87
3.3. Conclusions and Outlook......................................................................................................88
3.4. Materials and Methods..........................................................................................................90
3.4.1. Cloning and Expression of Single-chain HA1.7 TCR in E. coli .................................92
3.4.2. Generation of Recombinant Bacmid DNA..................................................................93
3.4.3. Insect Cell Culture and Protein Expression .................................................................94
3.4.4. Protein Analyses ..........................................................................................................96
3.4.5. Yeast Display Library Construction and Screening.....................................................97
3.4.6. TCR Tetramer Preparation and Staining......................................................................99
3.4.7. Insect Cell Surface Display Library Creation and Screening ......................................99
3.4.8. Other Assays ..............................................................................................................100
3.5. References...........................................................................................................................100
Chapter 4. Yeast Surface Display of Functional Minicellulosomes for Synergistic
Hydrolysis of Cellulose .....................................................................................................104
4.1. Introduction.........................................................................................................................104
4.2. Results and Discussion .......................................................................................................107
4.2.1. Design and Construction of Minicellulosomal Components for Yeast Surface
Display .......................................................................................................................107
4.2.2. Yeast Surface Assembly of Unifunctional Minicellulosomes ...................................110
4.2.3. Yeast Surface Assembly of Bifunctional and Trifunctional Minicellulosomes ........113
4.2.4. Functional Analysis of the Enzyme Components in the Surface Displayed
Minicellulosomes.......................................................................................................116
4.2.5. Enhanced Synergy of Bifunctional and Trifunctional Minicellulosomes..................118
4.2.6. Direct Conversion of Cellulose to Ethanol by Resting Yeast Cells Displaying
Trifunctional Minicellulosomes.................................................................................122
4.3. Conclusions and Outlook....................................................................................................123
4.4. Materials and Methods........................................................................................................126
4.4.1. Strains, Media, and Reagents.....................................................................................126
4.4.2. Plasmid Construction.................................................................................................127
4.4.3. Yeast Surface Display and Flow Cytometry Analysis...............................................131
4.4.4. Substrate Preparation and Carbohydrate Assays .......................................................132
4.4.5. Enzyme Activity Assays ............................................................................................134
4.4.6. Ethanol Production from PASC Using Resting Cells................................................135
4.5. References...........................................................................................................................136
viii
Chapter 5. Simultaneous Hydrolysis and Fermentation of Cellulose to Ethanol by
Recombinant Saccharomyces cerevisiae ..............................................................141
5.1. Introduction.........................................................................................................................141
5.2. Results and Discussion .......................................................................................................142
5.2.1. Optimizing the Protein Induction Conditions ............................................................142
5.2.2. Reducing the Metabolic Burden ................................................................................144
5.2.3. Alternative Endoglucanases and Exoglucanases .......................................................147
5.2.4. In vitro Enzyme Loading onto the Yeast Surface Displayed Miniscaffoldin............148
5.2.5. Development of a Constitutive Yeast Surface Display System.................................151
5.3. Conclusions and Outlook....................................................................................................154
5.4. Materials and Methods........................................................................................................156
5.4.1. Strains, Media, and Reagents.....................................................................................156
5.4.2. Plasmid Construction.................................................................................................157
5.4.3. In vitro Loading of Cellulases....................................................................................161
5.4.4. Cell Growth Analysis on PASC.................................................................................161
5.4.5. Other Assays ..............................................................................................................162
5.5. References...........................................................................................................................162
1
Chapter 1. Introduction
1.1. Overview of Cell Surface Display Systems
Cell surface display is a technique that allows the target protein to be expressed on the
cell exterior by fusing it to a carrier protein, which is typically a cell membrane-associated
protein or its subunit [1]. There are several inherent features of the surface display technology
that make it an effective library screening tool for protein engineering, directed evolution, and
drug discovery. First of all, the display of a combinatorial protein library on the cell surface
establishes a physical linkage between the DNA and the protein, allowing fast enrichment of rare
events using high throughput methods such as fluorescence-activated cell sorting (FACS) in a
quantitative manner [2]. Second, the target substrates or ligands/receptors are directly accessible
to proteins displayed on the surface without the need of crossing the cell membrane barrier, thus
no labor-intensive protein purification steps are required. Third, the cell attachment stabilizes the
proteins displayed on the surface. Finally, the library screening conditions could be well
controlled, such as pH, ionic strength, reduction potential, and oxygen content.
Since its development in the mid-1980s, cell surface display has proved to be a powerful
tool for basic and applied biomedical, industrial, and environmental research [3-5]. Using this
technology, a wide range of proteins with improved and/or novel function have been created,
including peptides, antibodies, cytokines, receptors, and enzymes [6-12]. In the past few decades,
numerous cell surface display systems have been developed using phage (although phage is not
considered a living cell, it’s included in this chapter since phage display was developed the
earliest and has been most often utilized), bacteria, yeast, insect cells, and mammalian cells.

2
Different platforms have advantages and disadvantages that make them more conducive to
certain protein engineering applications.
As the first surface display system developed, phage display has been the most
commonly used technique for combinatorial library screening [13]. In a phage display library,
the protein variants are expressed on the surface of phage particles as fusions to the phage coat
protein, such as pIII for low copy display and pVIII for high copy display, and are usually
screened by panning on a matrix of purified and immobilized molecules, whereby binding
phages are captured while non-binding phages are washed away [13]. Recent advances have
enabled screening of phage display libraries in more complex biological systems, such as
cultured cells and in vivo [14]. Although phage display has been successfully used for epitope
mapping and engineering of peptides, antibodies, and enzymes [13-16], it is almost impossible to
develop a generic phage display system for all applications. In addition, its bacterial host has
limited ability in terms of protein folding and post-translational modifications, therefore the
phage display has achieved very limited success with more complex mammalian proteins, such
as major histocompatibility complex (MHC) and T cell receptor (TCR) (see Sections 1.2.1 and
1.2.2 below).
Bacterial surface display was developed one year after phage display and addressed some
of the issues associated with the latter system [4, 5]. A bacterial surface display library is usually
generated by transforming DNA variants into Escherichia coli cells, which are easier to cultivate,
quantify, and work with than phage [17, 18]. Depending on the carrier protein used, the protein
variants are displayed either on the bacterial outer membrane (e.g. Lpp-OmpA [19]) or periplasm
(e.g. NlpA [20]), which are more suitable for displaying proteins with larger size than phage
particles [21]. The resulting display library is then screened by FACS, which can analyze and

3
sort up to 100,000 cells per second but is not applicable for phage display due to the small size of
phage particles [18, 22]. Compared to panning on a matrix, FACS enables fast enrichment of
positive clones in a more quantitative manner. However, as with phage display, the biggest
drawback of bacterial surface display is the lack of protein folding and post-translational
modification machineries found in eukaryotes.
Yeast surface display has attracted the most attention among all cell surface display
systems since its development about a decade ago [2, 23]. To display a protein library on yeast
cell surface, Saccharomyces cerevisiae and the cell-wall-anchored mating protein α/a-agglutinin
are commonly used as the host and the carrier protein, respectively [24, 25]. As an eukaryotic
host, yeast has the advantage of possessing post-translational processing pathways, which enable
folding and glycosylation of complex proteins [2, 24]. Starting with the same library, yeast
display was shown to sample the immune antibody repertoire considerably more fully than phage
display, selecting twice as many novel antibodies as phage display [26]. Recent advances in
glycoengineering have demonstrated the possibility of creating humanized yeast strains that are
capable of producing proteins with native human glycosylation patterns [27]. In addition to being
a useful library screening tool, the surface engineered yeast has a wide range of applications in
vaccine and therapeutics development, environmental bioremediation, and biofuels and
chemicals production for its generally-regarded-as-safe status and robustness in industrial
processes ([28-30] and Chapter 2-5). Although yeast is capable of expressing a wider range of
proteins compared to phage and bacteria, as the protein folds get more complex, it usually
requires a more sophisticated design or protein engineering to enable a successful surface display
of the target protein as illustrated by MHC and TCR in Sections 1.2.1 and 1.2.2 below. In such

4
cases, higher eukaryotic insect (see Chapter 3) and mammalian cells could be used as the
expression hosts.
While both insect and mammalian cell surface display are well established systems for
biological and immunological studies [31-34], they have not been widely used for library
screening probably due to some drawbacks such as high cell culture cost, slow growth rate, lack
of well-established library creation and screening procedures, and requirement of higher
experimental expertise compared to microbial systems. Nevertheless, a few recent studies have
demonstrated the potential of these systems as useful library screening tools for drug discovery
and protein engineering. By using the major baculovirus envelop protein gp64 or influenza
haemagglutinin as the carrier protein, peptide libraries have been displayed on the insect cell
surface for TCR [11] or antibody [35] epitope mapping and engineering, respectively. As proof
of concept, several antibody libraries have also been displayed on the surface of mammalian
cells as fusions to various cell membrane proteins [36-38]. Despite the limited examples of
library screening using insect/mammalian cell surface display, these systems represent
indispensable alternatives to the phage/microbial display for engineering human enzymes or
proteins for therapeutic purposes ([39] and Chapter 3).
1.2. Cell Surface Display and Cellular Immunity Modulation
Cellular immunity is mediated by T cells, which respond to selected peptides (epitopes)
in complex with MHC molecules expressed on antigen presentation cells (APCs) through their
unique surface TCRs. The nature of the induced cellular immunity could be either destructive or
protective, depending on the nature of this tri-molecular (TCR-peptide-MHC) interaction at the
interface of T cells and APCs. As a result, all of the three interacting protein members as well as

5
the two immune cells are potential targets for immunotherapy. In the past few decades, various
cell surface display systems have been applied to engineer the function of these proteins and
cells with the aim of improving cellular immunity modulation.
1.2.1. Major Histocompatibility Complex
Malfunction of the MHC system, consisting of the class I (MHCI) and class II (MHCII)
MHC proteins, has been implicated in many diseases, such as malaria, rheumatoid arthritis, type-
I diabetes, and graft rejection [40-44]. This has spurred great interests in developing MHC-based
immunotherapeutics and immunodiagnostics methods. The development of pMHC tetramer, a
multimeric form of pMHC complexes, has revolutionized the field of T cell research [45].
However, there are several limitations associated with the pMHC tetramer technology [46, 47],
including (1) difficult MHC monomer production using recombinant techniques, (2) time-
consuming and labor-intensive pMHC tetramer preparation that requires enzymatic biotinylation
and protein purification steps, and (3) low detection sensitivity, especially for CD4+ T cells.
Therefore, it is highly desirable to engineer MHC molecules with improved solubility or higher
TCR-binding affinity.
MHC engineering by phage display is challenging, because MHC molecules are large
heterodimeric membrane proteins that are highly glycosylated and there are multiple disulfide
bonds present in the protein. In addition, in the absence of their transmembrane domains, the two
polypeptide chains are unable to assemble properly and/or tend to aggregate [48]. To date, there
are only three successful examples of phage display of MHC proteins, with the first one reported
in 2000 [49]. In this study, a single-chain construct of a murine MHCI protein was displayed on
the surface of filamentous phage as a fusion with its pIII protein. The displayed complex was

6
functional as judged by binding of conformation-sensitive monoclonal antibodies (mAbs). And a
small fraction of the phage particles (<0.01%) were bivalent and capable of binding immobilized
specific TCRs. However, no significant interaction with relevant T cells was detected. Similar
results were reported later for another murine MHCI and a human MHCI protein [50, 51]:
although the pMHC complexes were correctly folded [50] and capable of binding specific
antigenic peptide [51], no T cell interaction was observed [50]. Therefore, it is necessary to
further optimize and/or develop novel design of the pMHC phage display system for efficient
and stable T cell recognition.
Compared to phage display, yeast is a more suitable host for the display of MHC proteins
and has been used to express both MHCI [52, 53] and MHCII [54-56] proteins. A single-chain
murine MHCI protein was expressed on yeast cell surface either with or without an N-terminal
covalently linked peptide [52]. The functional display was evidenced not only by recognition of
conformation-specific antibodies but also by direct binding of a specific TCR that has been
engineered to have high affinity (see Section 1.2.2). More significantly, yeast cells displaying
pMHC complexes upregulated the surface expression level of an early activation marker, CD69,
on naïve T cells isolated from mice. Although the authors did not rule out the possibility of T cell
autostimulation as the T cells used in the assay also expressed the same MHCI protein, this study
clearly suggested that yeast display could be used for MHC engineering. Indeed, the same group
later successfully isolated stabilized mutants of a murine MHCII protein, which is known to be
unstable and difficult to work with, from a mutagenesis library displayed on yeast cell surface
[55]. These mutants revealed the important roles of two residues of the β-chain in stabilizing the
pMHC complex. In a similar study, mutants of a single-chain human MHCII (DR1) without
covalently attached peptide were selected from a random mutagenesis library and stably
7
displayed on yeast cell surface [54]. They exhibited specific and fast peptide-binding kinetics, as
well as high thermostability. By aligning the mutant sequences, three sites were identified to be
critical for proper folding of DR1. Interestingly, although the single-chain gene construct did not
include any peptide, the peptide-binding groove of the displayed DR1 mutants was not empty,
but occupied presumably by yeast endogenous peptides, indicating the importance of binding
peptides in stabilizing the DR1 display on yeast cell surface.
Although yeast cell surface display coupled with directed evolution has been shown
useful in studies of MHC structural stability and peptide-binding, mutations are usually
introduced to stabilize the protein expression. These mutations, as well as the linkers in the
single-chain constructs, might affect the conformation and/or peptide-binding kinetics of the
mutant MHC proteins, and consequently alter their physiological property that is critical for
pathogenesis studies and therapeutic applications. In an attempt to display non-covalent wild-
type MHC heterodimeric complex, peptide-DR4β-chain was expressed as a fusion to the Aga2p
(a subunit of yeast a-agglutinin mating receptor), while DR4α-chain was expressed as a soluble
protein from a separate cassette [56]. The heterodimer surface display was confirmed by mAbs
that are specific to correctly assembled DR molecules, demonstrating that yeast display could be
used to express non-covalent multimers. Unfortunately, this non-covalent peptide-DR4 complex
displayed on yeast cell surface failed to activate T cells.
Recently, insect cells have also been used for MHC display [11, 57, 58]. Being higher
eukaryotic cells, insect cells have fewer problems with functional MHC expression. In a
baculovirus display system, the α- and β-chains of a MHC protein are cloned separately in two
expression cassettes with the binding peptide attached to the N-terminus of the β-chain, which is
8
in turn fused to the transmembrane and cytosolic domain of gp64. The resulting non-covalent
pMHC complexes displayed on the insect cell surface were capable of binding specific TCR
tetramers and activating relevant T cells [57, 58]. To date, the insect cell surface display of MHC
has only been used to identify T cell epitopes/mimotopes from peptide libraries. Nevertheless,
the ability of the insect-cell-displayed pMHC complexes to bind specific TCR tetramers makes
this system a promising platform for pMHC engineering.
1.2.2. T Cell Receptor
TCR is a pivotal element in almost every aspect of T lymphocytes, including their
development, proliferation, differentiation, activity, and specificity. Therefore, researchers have
been exploring their potential applications as immunotherapeutic or immunodiagnostic reagents
to specifically target pMHC complexes [59], just as antibodies are used to neutralize or opsonize
their antigens. However, there are several obstacles impeding therapeutic applications of TCRs.
First, TCRs are naturally expressed as heterodimeric integral membrane proteins, thus having
low solubility and tend to aggregate [60]. Second, soluble TCRs are not stable compared to
antibodies [61]. Third, TCRs have low affinity towards the pMHC complexes, typically in the
range of 1-100 µM [62]. Therefore, efforts have been devoted to engineering and design of
soluble, stable and high-affinity TCRs.
TCR engineering using phage display was not reported until 2005 mainly due to the lack
of generally applicable method of producing soluble TCRs in bacteria [63]. Many of the initial
strategies, such as removing exposed hydrophobic residues [60], fusing to antibody constant
regions [64] or thioredoxin [65], and single-chain TCR constructs [61, 66, 67], worked for very
limited number of TCRs. Later, the Jun/Fos leucine zipper domains were introduced as fusions
9
to the C-termini of the α/β TCR extracellular domains, respectively [68]. The incorporation of
leucine zipper domains significantly stabilized the TCR, while maintaining its ligand specificity
[69]; on the other hand, it raised the potential of immunogenicity. Another generally applicable
method involves introducing a non-native interchain disulfide bond, predicted by molecular
modeling based on the TCR crystal structure, into the TCR invariant region [70]. The resulting
disulfide-stabilized TCR (dsTCR) was highly stable; and compared to the wild-type TCR, the
sequence/structural change was minimal, reducing the possibility of being immunogenic. More
importantly, it enabled the engineering of TCRs by phage display. Using the dsTCR format, ten
different human class I- and class II-restricted TCRs were displayed on phage particles through
the linkage between the TCR β-chain and the phage pIII coat protein [71].
TCRs with the highest affinity ever reported (with picomolar affinities for their specific
pMHC ligand) were isolated from a phage display library [71]. By using random mutagenesis,
human TCR mutants with affinities up to 26 pM were isolated, representing more than a million-
fold improvement over the wild-type TCR. And the half-life of binding was also improved by
approximately 8000-fold to ~1000 minutes at 25 °C. More significantly, these high affinity
TCRs showed high degree of antigen specificity and no cross-reactivity with endogenous pMHC
complexes, and, for the first time, they enabled direct visualization of specific pMHC complexes
on tumor cells [72]. However, when transfected into human T cells, the mutant TCR with highest
affinity completely lost its antigen specificity, while those expressing TCRs with lower affinity
(with KD values of 450 nM or 4 µM) responded in an antigen-specific manner [73]. These results
indicated that genetically engineered T cells with midrange affinity receptors might be more
effective in immunotherapeutics.

10
Yeast cell surface display has also been applied to engineer soluble TCRs. Using an E.
coli mutator strain, a TCR library was created and mutants with increased thermal stability and
secretion efficiency were isolated after FACS screening [61, 74]. Selected mutations were
combined and resulted in a TCR mutant that was stable for >1 hour at 65 °C, had a solubility of
>4 mg/mL, and had a shake-flask expression level of 7.5 mg/L [75]. More importantly, although
mutations were introduced, the resulting TCRs retained their ligand-binding specificity, making
yeast display an attractive platform for engineering high affinity TCRs [74, 75]. In fact, the first
example of in vitro affinity engineering of TCR was reported in 2000 using yeast surface display
[76]. A library of MHCI-restricted single-chain TCR was constructed by mutating the CDR3
(complementarity-determining region three) of α-chain, and mutants with greater than 100-fold
higher affinity were identified. Unlike the wild-type TCR, the soluble monomeric form of the
high-affinity TCR was capable of directly detecting specific pMHC complexes on APCs. In vivo
studies showed that mouse T cell hybridoma transfected with the high affinity TCR responded to
a significantly lower concentration of antigenic peptide [77]. In several follow-up studies, it was
shown that mutations in the CDR1 and CDR2 regions could also contribute to improving the
affinity of TCRs [78, 79].
1.2.3. T Cell Epitope
Peptides recognized by T cells are termed T cell epitopes. The epitopes present in the
thymus are very important in T cell development. In the thymus, T cells that recognize self-
peptides presented by MHC are eliminated from the immune system; the survived T cells that
migrate into the peripheral lymph nodes do not undergo proliferation or differentiation, because
all the pMHC complexes they sample in a healthy individual are self-products. Upon infection,
protein components derived from the pathogens are processed into small peptides and then

11
loaded onto MHC molecules for surface presentation [80]. Some of these peptides are recognized
by T cells and activate their effector/helper functions to kill the infected cells and clear the
infection. Therefore, T cell epitopes in the peripheral serve as flags for T cell targeting. With
their critical role in T cell development and activation, identification of T cell epitopes is very
important in studying T cells lineages and phenotypes [81, 82], elucidating self-tolerance
mechanisms [83], vaccine design and assessment [84, 85], tracking T cells in vivo [86], and etc.
Great efforts have been devoted to identification of these T cell epitopes in the last two decades
and some of the commonly used methods are summarized in Table 1.1.
Table 1.1 Limitations of current T cell epitope identification methods.
Current T-cell epitope
identification methods Limitations
Biochemistry (MS) Limited by the amounts of peptides sample available; labor-intensive and
time-consuming.
cDNA library Require the use of professional APCs that are always difficult and time-
consuming to isolate, expand and maintain or engineering of artificial
APCs.
Overlapping peptides Require the knowledge of antigenic protein sequence and the use of
autologous APCs; reagent- and time-consuming.
Synthetic peptide library Limited by library size; require the knowledge of MHC-binding motif and
the use of professional APCs.
Predictive algorithms Require the knowledge of both antigenic protein sequence and MHC-
binding motif, and the use of professional APCs.
The most straightforward T cell epitope identification method is to use HPLC-MS to
determine the sequence of the peptides extracted directly from the pMHC complexes on the
surface of professional APCs [87]. However, this method has met limited success due to the
limited amount of peptides and representation of antigenic peptides as nested sets with
heterogeneous lengths. When the antigenic protein sequence is known, the most commonly used
T cell epitope identification method is to synthesize overlapping peptides covering the entire
12
protein, which are then individually loaded onto the surface of professional APCs (usually
irradiated PBMC) and tested for their ability of activating specific T cells. If the MHC-binding
motif is also available, a computational method, TEPITOPE, could be used to predict the
MHCII-restricted T cell epitopes systematically [88], but may overlook some potential epitope
candidates due to the complexity of peptide-MHC interaction (see Section 2.2.6). When the
sequence is unknown, combinatorial synthetic peptide libraries with up to a trillion variants, such
as positional scanning combinatorial libraries [89] and bead-bound libraries [90], can be used to
identify T cell epitopes. Synthesis of peptides, however, is expensive. Therefore, expression of a
DNA library encoding either random peptides or antigens has been employed.
When the MHC binding motif is known, a random peptide library can be constructed
using degenerate primers. As with the combinatorial peptide library-based methods described
above, the library screening usually results in the identification of T cell mimotopes rather than
epitopes due to the random nature of the peptide library. The mimotopes could be used to
elucidate the sequence of a biological relevant epitope, however, they could also be very
different. For example, by co-expressing the peptide library in complex with a restriction murine
MHCI molecule on the surface of insect cells, a mimotope was successfully isolated and
subsequently used to identify a self peptide [58]. In contrast, screening of a peptide library
created in a similar way on the surface of murine fibroblasts resulted in three mimotopes that had
little resemblance to the epitope [91]. To directly identify T cell epitopes, several expression
cloning approaches have been developed by either expressing a cDNA library in engineered
APCs [92] or expressing viral cDNA libraries in E. coli [93] to identify the antigenic protein first,
so that the epitope could be identified using the method of testing overlapping peptides. In
addition to their own limitations, most of the T cell epitope identification methods described

13
above suffer from two common limitations: first, they rely on the use of professional APCs that
are often difficult to isolate, expand and maintain, and second, the screening process is often
time-consuming, laborious, and reagent-intensive. The development of artificial APC (see
Section 1.2.4) might overcome these drawbacks.
1.2.4. Antigen Presenting Cell
There are three main types of professional APCs: dendritic cells (DCs), macrophages,
and B cells with DCs being the most potent. There are several features of the DC contributing to
its proficiency. First, immature DCs circulating in the tissues are equipped with antigen-
capturing machineries, such as phagocytosis [94] and macropinocytosis [95], thus are efficient at
taking up antigens. Second, DCs are specialized in antigen processing to produce peptides and
form pMHC complexes, and then transport them onto their cell surface for T cell recognition.
Third, after being activated, DCs migrate to peripheral lymphoid tissues and undergo maturation
[96] that is crucial for T cell activation. Matured DCs no longer have antigen-capturing skills;
instead, they express high levels of MHC proteins, costimulatory molecules CD80/86, as well as
many other cell adhesion molecules, such as ICAM and LFA. The co-stimulatory molecules are
required for efficient activation of naïve T cells and the adhesion molecules are important for the
initial transient interaction between T cells and DCs. Finally, DCs modulate the T cell responses
(Th1-, Th2-, or Treg- type) by secreting different combinations of cytokines [97] and inform the
location of the infection site by upregulating specific homing-receptors on primed T cells [98].
Because of their crucial role in initiating and modulating the cellular and humoral
immunity, DCs and other professional APCs have a great potential in clinical applications that
involve T cells. Studies have shown that, adoptive transfer of T cells is important in elucidating

14
autoimmunity [99, 100], and is effective against infectious diseases [101], cancers [102],
autoimmune diseases [103], and GVHD [104]. Therefore, it is highly desirable to culture these T
cells in vitro using professional APCs. However, isolation and expansion of these cells are time-
and reagent-consuming even with improved methods [105, 106]. Therefore, it would be much
more convenient if less complex systems could be used as artificial APCs (aAPCs).
Virtually any surface decorated with pMHC complexes and/or other immune-potentiating
molecules is a potential aAPC [34]. In the past few decades, several aAPC systems have been
developed and can be divided into two major groups: cellular and acellular systems. The latter is
better with respect to that acellular systems do not require cell culture, thus they are clean,
avoiding potential contamination issues in clinical applications. However, manufacture of such
systems is relatively difficult. For example, using magnetic beads involves expression and
purification of MHC [107]; using exosomes requires purification of exosomes from large scale
of DC culture [108]. Cellular systems that have been exploited so far include Drosophila
melanogaster cells [34], Spodoptera frugiperda cells [11], mouse fibroblasts [34], a human
leukemia cell line K32 [34], and a human kidney embryonic cell line [92]. The complexity of
these systems is significantly reduced compared to that of professional APCs, while some
features of the professional APCs are retained, such as antigen specificity and antigen processing.
1.3. Cell Surface Display and Biofuels Production
In addition to being a useful tool for engineering proteins and immune cells with
improved cellular immunity modulating function, cell surface display has also been applied to
address some of the challenges in the production of biofuels as alternatives to fossil fuels. While
the fossil fuels accounted for 88% of the global energy supply as of year 2007, the oil, natural

15
gas, and coal could only last for approximately 40, 60, and 130 years, respectively, based on
current fossil fuel reserves-to-production ratios [109]. To alleviate the society’s dependence on
fossil fuels and reduce greenhouse gas emissions, biofuels are drawing rapidly growing interests
[110-112]. The first-generation biofuel technologies have been used to produce ethanol from
corn and sugar cane on a large scale in the United States and Brazil, respectively. However, the
limited crop supply will not satisfy the ever increasing energy demand; thus, the second-
generation biofuel technologies based on cellulosic biomass are under intense investigation.
Cellulosic biomass, the fibrous, woody, and generally inedible portions of plant biomass,
is the only foreseeable sustainable source of transportation fuels [111, 113]. Its major component
(up to 50%), cellulose (linear chains of glucose linked by β-1,4-glycosidic bonds) is embedded in
a matrix of polymers formed mainly by hemicellulose and lignin, of which the interaction limits
the access of hydrolytic enzymes, resulting limited hydrolysis [113, 114]. In addition, cellulose
forms a distinct crystalline structure, which is so tightly packed that even small molecules, such
as water, cannot penetrate [115]. What makes cellulose utilization more complicated is the
diverse architecture of plant cells themselves, and different plant cell types might require
completely different deconstructing methods [111, 115]. These features protect plants from
moisture and microbial degradation, but also impede the conversion of plant biomass to value-
added products. To overcome these and many other challenges in enabling the second generation
biofuel technologies, concerted efforts are required ranging from feedstock construction,
pretreatment, hydrolysis and fermentation, processing design, product recovery, and marketing
(comprehensively reviewed in [111]). Among numerous strategies currently undergoing
development, consolidated bioprocessing (CBP) using yeast S. cerevisiae offers a promising
solution [116] .
16
1.3.1. Consolidated Bioprocessing for Cellulosic Biofuels Production
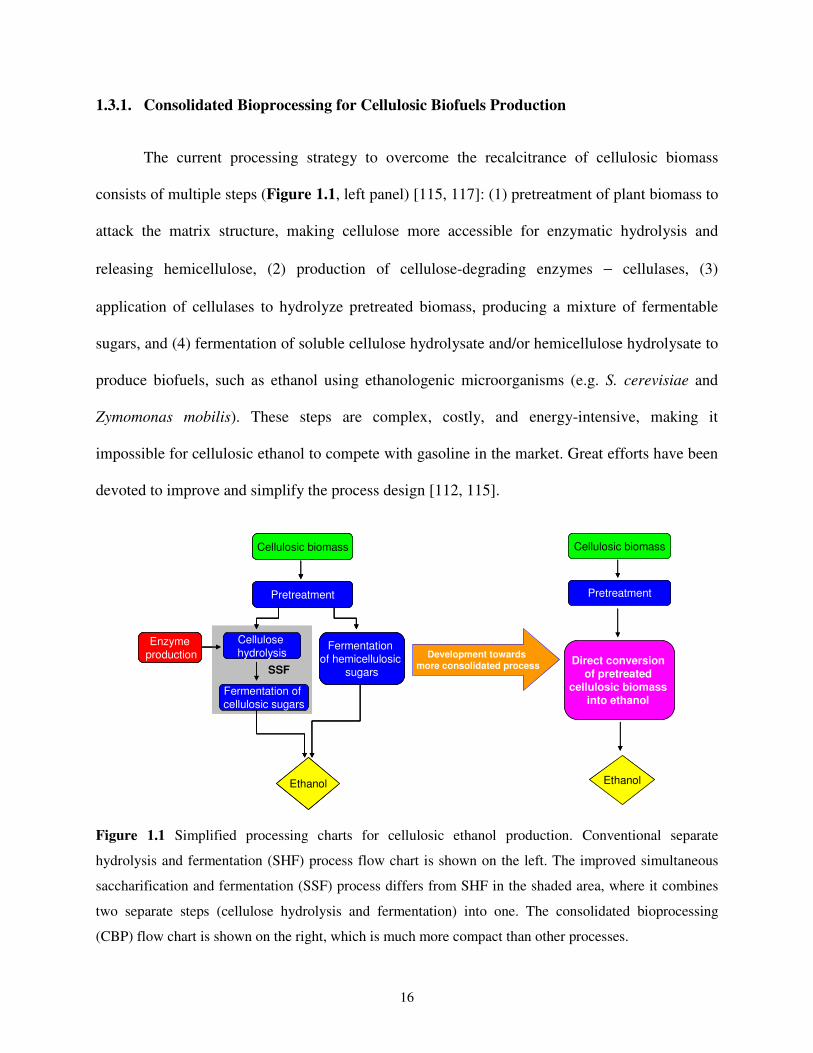
The current processing strategy to overcome the recalcitrance of cellulosic biomass
consists of multiple steps (Figure 1.1, left panel) [115, 117]: (1) pretreatment of plant biomass to
attack the matrix structure, making cellulose more accessible for enzymatic hydrolysis and
releasing hemicellulose, (2) production of cellulose-degrading enzymes − cellulases, (3)
application of cellulases to hydrolyze pretreated biomass, producing a mixture of fermentable
sugars, and (4) fermentation of soluble cellulose hydrolysate and/or hemicellulose hydrolysate to
produce biofuels, such as ethanol using ethanologenic microorganisms (e.g. S. cerevisiae and
Zymomonas mobilis). These steps are complex, costly, and energy-intensive, making it
impossible for cellulosic ethanol to compete with gasoline in the market. Great efforts have been
devoted to improve and simplify the process design [112, 115].
SSF
Cellulosic biomass
Pretreatment
Enzymeproduction
Cellulose hydrolysis
Fermentation of cellulosic sugars
Fermentation of hemicellulosic
sugars
Ethanol
SSF
Cellulosic biomass
Pretreatment
Enzymeproduction
Cellulose hydrolysis
Fermentation of cellulosic sugars
Fermentation of hemicellulosic
sugars
Ethanol
Cellulosic biomass
Pretreatment
Enzymeproduction
Cellulose hydrolysis
Fermentation of cellulosic sugars
Fermentation of hemicellulosic
sugars
Ethanol
Cellulosic biomass
Pretreatment
Ethanol
Direct conversion of pretreated
cellulosic biomass into ethanol
Cellulosic biomass
Pretreatment
Ethanol
Direct conversion of pretreated
cellulosic biomass into ethanol
Development towards more consolidated process
Figure 1.1 Simplified processing charts for cellulosic ethanol production. Conventional separate
hydrolysis and fermentation (SHF) process flow chart is shown on the left. The improved simultaneous
saccharification and fermentation (SSF) process differs from SHF in the shaded area, where it combines
two separate steps (cellulose hydrolysis and fermentation) into one. The consolidated bioprocessing
(CBP) flow chart is shown on the right, which is much more compact than other processes.
17
Prior to the mid-1980s, enzymatic hydrolysis and fermentation were carried out
separately (separate hydrolysis and fermentation, SHF) (Figure 1.1, left panel). Since the
development of simultaneous saccharification and fermentation (SSF) by Wright and coworkers
in 1988 (Figure 1.1, shaded area in left panel) [118], the process have been advancing towards
more consolidated configurations. In 1996, a highly compact design, later termed consolidated
bioprocessing (CBP) was proposed by Lynd [119]. It combines enzyme production, pretreated
biomass hydrolysis, and hydrolysate fermentation into a single step (Figure 1.1, right panel).
Recent studies have shown that CBP holds great promise to lower the cost of the cellulosic
ethanol production [112, 116, 120]. However, this great potential cannot be realized by
organisms available today and requires the development of new and improved organisms that
can both efficiently break down cellulosic biomass and convert the hydrolysate into ethanol.
There are two strategies for CBP-enabling organism development: the native cellulolytic
strategy and the recombinant cellulolytic strategy, both of which have shown great potential and
have attracted broad attention (comprehensively reviewed in [115]). The native cellulolytic
strategy aims to engineer naturally occurring cellulolytic microorganisms, such as Clostridia
[121] with improved biofuels production yield and titer through metabolic engineering. The
major challenge in applying this strategy is the lack of efficient genetic engineering tools. For
example, the gene transformation method for C. cellulolyticum and C. thermocellum was not
available until year 2000 and 2004, respectively, and the latter requires a specialized
electroporation pulse generator and cuvette [122, 123]. The recombinant cellulolytic strategy
involves the engineering of microorganisms that are proficient in biofuels production, such as S.
cerevisiae [116] and Z. mobilis [124] with the ability to utilize cellulose and hemicellulose by
expressing a heterologous cellulolytic enzyme system. The major challenge in applying this
18
strategy is to express multiple active enzymes at a very high level of ~1-10% of total cellular
protein [112]. To date, there is no breakthrough advance in the development of cellulosic biofuel
technology, both strategies merit continuing investigation in the future.
1.3.2. Surface Engineered Yeast for Consolidated Bioprocessing
Yeast S. cerevisiae possesses several unique features making it an attractive host for CBP,
including high ethanol productivity at a close-to-theoretical yield producing 0.51 gram of ethanol
per gram of glucose consumed, high ethanol tolerance, versatility and robustness in industrial
fermentation, generally-regarded-as-safe status, and a diverse collection of engineering tools
available. In the past few decades, yeast has been used as a heterologous host to study and
engineer dozens of cellulolytic enzymes, either as secreted or surface displayed proteins [115,
116]. Compared to the secreted version, the β-glucosidase displayed on yeast cell surface as an
α-agglutinin fusion showed enhanced stability and activity [125], suggesting the advantages of
displaying hydrolytic enzymes on yeast cell surface. This finding was further supported by the
fact that the cellulose-enzyme-microbe complexes showed several-fold higher specific
hydrolysis rates than purified enzymes [126]. In addition, such a cell-bound format is also
amenable for protein engineering and analysis on insoluble substrates [127].
To engineer recombinant yeast strains with the ability to hydrolyze and ferment
hemicellulose hydrolysate (mainly consists of xylose and arabinose), it is necessary to
simultaneously display hemicellulases on the cell surface and express xylose- and/or arabinose-
utilization pathway genes intracellularly (metabolic engineering of S. cerevisiae for pentose
utilization was reviewed in [128, 129]). As an initial step, a xylanase II (XYNII) from
Trichoderma reesei was displayed on yeast cell surface as a fusion protein to the α-agglutinin
19
receptor and enabled the yeast cell to degrade xylan [130]. In a follow-up study, a second
xylanolytic enzyme − β-xylosidase (XYLA) from Aspergillus oryzae was co-displayed with
XYNII on the cell surface, and additional three enzymes (a xylose reductase and a xylitol
dehydrogenase from Pichia stipitis and a xylulokinase from S. cerevisiae) responsible for xylan-
utilization were expressed intracellularly [131]. The resulting yeast strain produced 7.1 g/L of
ethanol within 62 hours directly from birchwood xylan. When the same xylose-utilization
pathway was expressed in a yeast strain displaying a β-glucosidase from Aspergillus aculeatus
on the surface, it co-fermented xylose and cello-oligosaccharides present in a sulfuric-acid-
treated woodchip into ethanol with a titer of 30 g/L [132]. Although arabinose-fermenting S.
cerevisiae strains have been created [129], no enzymes with α-L-arabinofuranosidase activity
have yet been displayed on yeast cell surface to enable simultaneous release of arabinose from
cellulosic material and its fermentation.
Cellulose-fermenting yeast strains have also been created by displaying cellulases on the
cell surface. Using the α-agglutinin receptor as the carrier protein, a β-glucosidase from A.
aculeatus was immobilized on the yeast cell surface and enabled cell growth using cello-
oligosaccharides as the sole carbon source [133]. With the same experimental design, an
endoglucanase II from T. reesei was immobilized on the yeast cell surface and showed
significantly elevated hydrolytic activity towards barley β-glucan, which is a linear, soluble
polysaccharide composed of an average of 1200 glucose residues linked by ~70% β-1,4-
glycosidic linkages and ~30% β-1,3-glycosidic linkages [134]. By co-displaying these two
cellulases on the yeast cell surface, the strain directly fermented barley β-glucan to ethanol with
a titer of 16.8 g/L and a yield of 0.48 gram of ethanol produced per gram of β-glucan consumed

20
(93.3% of the theoretical yield) [134]. Taking a step further, co-display of a third cellulase –
cellobiohydrolase II from T. reesei on the same yeast strain enabled simultaneous
saccharification and fermentation of insoluble amorphous cellulose to ethanol [135]. Although
this recombinant yeast strain showed relatively low ethanol titer of 3 g/L and no cell growth data
was reported, it demonstrated the potential of engineering yeast strain as a CBP host.
1.4. Project Overview
This thesis focuses on applying the abovementioned cell surface display systems,
specifically yeast and insect cell surface display, to address some of the challenges in (1)
biomedical research, including T cell epitope mapping, artificial APC development, and pMHC
complex affinity engineering, and (2) biofuels production, including displaying complex
cellulolytic enzyme systems on yeast cell surface, improving cellulose hydrolysis synergy, and
increasing enzyme expression levels.
In the second chapter of this thesis, a high throughput and accurate T cell epitope
identification method was developed [136]. This new approach combined the advantages of
expression cloning and random peptide library strategies by generating a pathogen-derived
peptide library. It was demonstrated that yeast cells displaying the pMHC complexes could be
used as artificial APCs (aAPCs) to activate hybridoma T cells in a peptide-specific manner,
avoiding the use of professional APCs. Using human MHCII molecule DR1 and influenza A
virus (X31/A/Aichi/68) as a model system, a high throughput screening method for rapid and
accurate epitope mapping was established, which was then used to screen a library of all possible
peptides present in the virus in complex with the wild-type DR1. After as few as two rounds of
fluorescence-activated cell sorting (FACS), the epitope-containing clones were enriched to ~1%.

21
Following a second screening step using specific T hybridoma cells, the antigenic epitope was
pinpointed. Although the method was demonstrated by identifying a viral epitope, it could be
adapted to the identification of T cell epitopes from other systems such as cancer and
autoimmune diseases.
The third chapter of this thesis reports the results of pMHC affinity engineering using two
different cell surface display systems: yeast surface display and insect cell surface display. The
human MHCII molecule DR2 and a myelin basic protein derived peptide MBP85-99 that have
been associated with multiple sclerosis were chosen to be our engineering target. Using the yeast
surface display system, the DR2-MBP complex failed to show any TCR-tetramer-binding,
indicating that this system was not suitable for engineering pMHC complexes with improved
TCR-binding affinity. In contrast, the DR2-MBP complex displayed on the insect cell surface
showed specific and peptide-dependent TCR-tetramer-binding. Coupled with directed evolution
and FACS, a library of DR2 variants in complex with MBP was created and screened using R-
Phycoerythrin (PE)-labeled TCR tetramers. After one round of cell sorting, potential variants
with improved TCR-binding affinity have been enriched.
In the fourth chapter of this thesis, a recombinant cellulolytic and fermentative yeast
strain was created by displaying a multi-cellulase-containing complex, namely minicellulosome
on the cell surface [137]. The minicellulosome was formed by co-expressing a miniscaffoldin
derived from C. thermocellum and three types of cellulases − an endoglucanase, a
cellobiohydrolase, and a β-glucosidase. The multi-enzyme complex was tethered to the yeast cell
surface using the a-agglutinin adhesion receptor. Using phosphoric acid swollen cellulose
(PASC) as a model substrate, the surface displayed minicellulosomes exhibited both enzyme-

22
enzyme synergy and enzyme proximity synergy. More importantly, resting cell study showed
that the recombinant strain displaying the trifunctional minicellulosomes was able to hydrolyze
and ferment PASC to ethanol, supporting the feasibility of constructing cellulolytic and
fermentative yeast by displaying recombinant minicellulosomes on the cell surface [110].
Furthermore, the display system described in this chapter was shown to be a useful tool for
producing minicellulosomes with different activities and studying their synergistic cellulolytic
function.
The fifth chapter of this thesis reports our continuing efforts to improve the cellulolytic
efficiency of the yeast strain developed in Chapter 4. Various strategies have been employed
with a focus of improving the minicellulosomal enzyme display levels. All of the attempts to
improve the in vivo protein expression failed, including optimization of the protein induction
conditions, reduction of the plasmid copy number, expression of fewer enzymes, and different
combinations of alternative endoglucanases (CelG and CelC) and exoglucanases (CelE and
CelF) isolated from C. cellulolyticum. In contrast, in vitro loading of cellulases onto the
miniscaffoldin displayed on the yeast cell surface enabled cell doubling over a period of ~8 days,
confirming that the low enzyme expression level was the limiting step. This result also suggested
that the minicellulosomes should be continuously synthesized to support a sustained cell culture
for consolidated bioprocessing. As such, a yeast display system was developed to enable
constitutive minicellulosome synthesis and assembly on the cell surface.
1.5. References
1. Lee, S.Y., J.H. Choi, and Z. Xu, Microbial cell-surface display. Trends Biotechnol, 2003.
21(1): p. 45-52.

23
2. Boder, E.T. and K.D. Wittrup, Yeast surface display for screening combinatorial
polypeptide libraries. Nat Biotechnol, 1997. 15(6): p. 553-7.
3. Smith, G.P., Filamentous fusion phage: novel expression vectors that display cloned
antigens on the virion surface. Science, 1985. 228(4705): p. 1315-7.
4. Freudl, R., et al., Cell surface exposure of the outer membrane protein OmpA of
Escherichia coli K-12. J Mol Biol, 1986. 188(3): p. 491-4.
5. Charbit, A., et al., Probing the topology of a bacterial membrane protein by genetic
insertion of a foreign epitope; expression at the cell surface. Embo J, 1986. 5(11): p. 3029-
37.
6. Wittrup, K.D., Protein engineering by cell-surface display. Curr Opin Biotechnol, 2001.
12(4): p. 395-9.
7. Benhar, I., Biotechnological applications of phage and cell display. Biotechnol Adv, 2001.
19(1): p. 1-33.
8. Chen, W. and G. Georgiou, Cell-Surface display of heterologous proteins: From high-
throughput screening to environmental applications. Biotechnol Bioeng, 2002. 79(5): p.
496-503.
9. Wernerus, H. and S. Stahl, Biotechnological applications for surface-engineered bacteria.
Biotechnol Appl Biochem, 2004. 40(Pt 3): p. 209-28.
10. Wen, F., S. Rubin-Pitel, and H. Zhao, Engineering of Therapeutic Proteins, in Protein
Engineering and Design, S. Park and J. Cochran, Editors. 2009, CRC Press, Taylor &
Francis Group: Florida. p. 153-77.
11. Crawford, F., et al., Use of baculovirus MHC/peptide display libraries to characterize T-
cell receptor ligands. Immunol Rev, 2006. 210: p. 156-70.
12. Possee, R.D., Baculoviruses as expression vectors. Curr Opin Biotechnol, 1997. 8(5): p.
569-72.
13. Paschke, M., Phage display systems and their applications. Appl Microbiol Biotechnol,
2006. 70(1): p. 2-11.

24
14. Sergeeva, A., et al., Display technologies: application for the discovery of drug and gene
delivery agents. Adv Drug Deliv Rev, 2006. 58(15): p. 1622-54.
15. Jestin, J.L., P. Kristensen, and G. Winter, A method for the selection of catalytic activity
using phage display and proximity coupling. Angew Chem Int Ed Engl, 1999. 38: p. 1124-
1127.
16. Demartis, S., et al., A strategy for the isolation of catalytic activities from repertoires of
enzymes displayed on phage. J Mol Biol, 1999. 286(2): p. 617-33.
17. Georgiou, G., et al., Practical applications of engineering gram-negative bacterial cell
surfaces. Trends Biotechnol, 1993. 11(1): p. 6-10.
18. Georgiou, G., et al., Display of heterologous proteins on the surface of microorganisms:
from the screening of combinatorial libraries to live recombinant vaccines. Nat Biotechnol,
1997. 15(1): p. 29-34.
19. Francisco, J.A., C.F. Earhart, and G. Georgiou, Transport and anchoring of beta-lactamase
to the external surface of Escherichia coli. Proc Natl Acad Sci U S A, 1992. 89(7): p. 2713-
7.
20. Harvey, B.R., et al., Anchored periplasmic expression, a versatile technology for the
isolation of high-affinity antibodies from Escherichia coli-expressed libraries. Proc Natl
Acad Sci U S A, 2004. 101(25): p. 9193-8.
21. Little, M., et al., Bacterial surface presentation of proteins and peptides: an alternative to
phage technology? Trends Biotechnol, 1993. 11(1): p. 3-5.
22. Shapiro, H., Practical Flow Cytometry. 4th
ed. 2003, New York: Wiley & Sons.
23. Gai, S.A. and K.D. Wittrup, Yeast surface display for protein engineering and
characterization. Curr Opin Struct Biol, 2007. 17(4): p. 467-73.
24. Kondo, A. and M. Ueda, Yeast cell-surface display--applications of molecular display.
Appl Microbiol Biotechnol, 2004. 64(1): p. 28-40.
25. Pepper, L.R., et al., A decade of yeast surface display technology: where are we now?
Comb Chem High Throughput Screen, 2008. 11(2): p. 127-34.

25
26. Bowley, D.R., et al., Antigen selection from an HIV-1 immune antibody library displayed
on yeast yields many novel antibodies compared to selection from the same library
displayed on phage. Protein Eng Des Sel, 2007. 20(2): p. 81-90.
27. Hamilton, S.R., et al., Humanization of yeast to produce complex terminally sialylated
glycoproteins. Science, 2006. 313(5792): p. 1441-3.
28. WHO, Global Advisory Committee on Vaccine Safety. Wkly Epidemiol Rec, 2005. 80(1): p.
3-7.
29. Akram, D.S., et al., Immunogenicity of a recombinant, yeast-derived, anti-hepatitis-B
vaccine after alternative dosage and schedule vaccination in Pakistani children. Vaccine,
2005. 23(50): p. 5792-7.
30. Zuberi, S.J., et al., Immunogenicity of yeast-derived hepatitis B vaccine in Pakistani adults.
1990. J Pak Med Assoc, 2004. 54(8 Suppl): p. S61-2.
31. Hu, Y.C., Baculoviral vectors for gene delivery: a review. Curr Gene Ther, 2008. 8(1): p.
54-65.
32. Oker-Blom, C., K.J. Airenne, and R. Grabherr, Baculovirus display strategies: Emerging
tools for eukaryotic libraries and gene delivery. Brief Funct Genomic Proteomic, 2003.
2(3): p. 244-53.
33. Smits EL, A.S., Cools N, Berneman ZN, Van Tendeloo VF., Dendritic Cell-Based Cancer
Gene Therapy. Hum Gene Ther. , 2009. 20: p. DOI: 10.1089/hum.2009145.
34. Kim, J.V., et al., The ABCs of artificial antigen presentation. Nat Biotechnol, 2004. 22(4): p.
403-10.
35. Ernst, W., et al., Baculovirus surface display: construction and screening of a eukaryotic
epitope library. Nucleic Acids Res, 1998. 26(7): p. 1718-23.
36. Wolkowicz, R., G.C. Jager, and G.P. Nolan, A random peptide library fused to CCR5 for
selection of mimetopes expressed on the mammalian cell surface via retroviral vectors. J
Biol Chem, 2005. 280(15): p. 15195-201.
26
37. Beerli, R.R., et al., Isolation of human monoclonal antibodies by mammalian cell display.
Proc Natl Acad Sci U S A, 2008. 105(38): p. 14336-41.
38. Akamatsu, Y., et al., Whole IgG surface display on mammalian cells: Application to
isolation of neutralizing chicken monoclonal anti-IL-12 antibodies. J Immunol Methods,
2007. 327(1-2): p. 40-52.
39. Chen, K.C., et al., Directed evolution of a lysosomal enzyme with enhanced activity at
neutral pH by mammalian cell-surface display. Chem Biol, 2008. 15(12): p. 1277-86.
40. Hill, A.V., et al., Common west African HLA antigens are associated with protection from
severe malaria. Nature, 1991. 352(6336): p. 595-600.
41. Rowe, J.R., et al., T-cell-defined DR4 subtypes as markers for type 1 diabetes. Hum
Immunol, 1988. 22(1): p. 51-60.
42. Garrido, F., et al., Implications for immunosurveillance of altered HLA class I phenotypes
in human tumours. Immunol Today, 1997. 18(2): p. 89-95.
43. Colvin, R.B., Cellular and molecular mechanisms of allograft rejection. Annu Rev Med,
1990. 41: p. 361-75.
44. Flowers, M.E., E. Kansu, and K.M. Sullivan, Pathophysiology and treatment of graft-
versus-host disease. Hematol Oncol Clin North Am, 1999. 13(5): p. 1091-112, viii-ix.
45. Klenerman, P., V. Cerundolo, and P.R. Dunbar, Tracking T cells with tetramers: new tales
from new tools. Nat Rev Immunol, 2002. 2(4): p. 263-72.
46. Nepom, G.T., et al., HLA class II tetramers: tools for direct analysis of antigen-specific
CD4+ T cells. Arthritis Rheum, 2002. 46(1): p. 5-12.
47. Crawford, F., et al., Detection of antigen-specific T cells with multivalent soluble class II
MHC covalent peptide complexes. Immunity, 1998. 8(6): p. 675-82.
48. Cosson, P. and J.S. Bonifacino, Role of transmembrane domain interactions in the assembly
of class II MHC molecules. Science, 1992. 258(5082): p. 659-62.

27
49. Le Doussal, J., et al., Phage display of peptide/major histocompatibility complex. J
Immunol Methods, 2000. 241(1-2): p. 147-58.
50. Vest Hansen, N., et al., Phage display of peptide / major histocompatibility class I
complexes. Eur J Immunol, 2001. 31(1): p. 32-8.
51. Kurokawa, M.S., et al., Expression of MHC class I molecules together with antigenic
peptides on filamentous phages. Immunol Lett, 2002. 80(3): p. 163-8.
52. Brophy, S.E., P.D. Holler, and D.M. Kranz, A yeast display system for engineering
functional peptide-MHC complexes. J Immunol Methods, 2003. 272(1-2): p. 235-46.
53. Jones, L.L., et al., Engineering and characterization of a stabilized alpha1/alpha2 module
of the class I major histocompatibility complex product Ld. J Biol Chem, 2006. 281(35): p.
25734-44.
54. Esteban, O. and H. Zhao, Directed evolution of soluble single-chain human class II MHC
molecules. J Mol Biol, 2004. 340(1): p. 81-95.
55. Starwalt, S.E., et al., Directed evolution of a single-chain class II MHC product by yeast
display. Protein Eng, 2003. 16(2): p. 147-56.
56. Boder, E.T., et al., Yeast surface display of a noncovalent MHC class II heterodimer
complexed with antigenic peptide. Biotechnol Bioeng, 2005. 92(4): p. 485-91.
57. Crawford, F., et al., Mimotopes for alloreactive and conventional T cells in a peptide-MHC
display library. PLoS Biol, 2004. 2(4): p. E90.
58. Wang, Y., et al., Using a baculovirus display library to identify MHC class I mimotopes.
Proc Natl Acad Sci U S A, 2005. 102(7): p. 2476-81.
59. Miles, J.J., S.L. Silins, and S.R. Burrows, Engineered T cell receptors and their potential in
molecular medicine. Curr Med Chem, 2006. 13(23): p. 2725-36.
60. Novotny, J., et al., A soluble, single-chain T-cell receptor fragment endowed with antigen-
combining properties. Proc Natl Acad Sci U S A, 1991. 88(19): p. 8646-50.

28
61. Shusta, E.V., et al., Yeast polypeptide fusion surface display levels predict thermal stability
and soluble secretion efficiency. J Mol Biol, 1999. 292(5): p. 949-56.
62. van der Merwe, P.A. and S.J. Davis, Molecular interactions mediating T cell antigen
recognition. Annu Rev Immunol, 2003. 21: p. 659-84.
63. Molloy, P.E., A.K. Sewell, and B.K. Jakobsen, Soluble T cell receptors: novel
immunotherapies. Curr Opin Pharmacol, 2005. 5(4): p. 438-43.
64. Eilat, D., et al., Secretion of a soluble, chimeric gamma delta T-cell receptor-
immunoglobulin heterodimer. Proc Natl Acad Sci U S A, 1992. 89(15): p. 6871-5.
65. Schodin, B.A., C.J. Schlueter, and D.M. Kranz, Binding properties and solubility of single-
chain T cell receptors expressed in E. coli. Mol Immunol, 1996. 33(9): p. 819-29.
66. Andrews, B., et al., A tightly regulated high level expression vector that utilizes a
thermosensitive lac repressor: production of the human T cell receptor V beta 5.3 in
Escherichia coli. Gene, 1996. 182(1-2): p. 101-9.
67. Weidanz, J.A., et al., Display of functional alphabeta single-chain T-cell receptor
molecules on the surface of bacteriophage. J Immunol Methods, 1998. 221(1-2): p. 59-76.
68. Willcox, B.E., et al., Production of soluble alphabeta T-cell receptor heterodimers suitable
for biophysical analysis of ligand binding. Protein Sci, 1999. 8(11): p. 2418-23.
69. Willcox, B.E., et al., TCR binding to peptide-MHC stabilizes a flexible recognition
interface. Immunity, 1999. 10(3): p. 357-65.
70. Boulter, J.M., et al., Stable, soluble T-cell receptor molecules for crystallization and
therapeutics. Protein Eng, 2003. 16(9): p. 707-11.
71. Li, Y., et al., Directed evolution of human T-cell receptors with picomolar affinities by
phage display. Nat Biotechnol, 2005. 23(3): p. 349-54.
72. Purbhoo, M.A., et al., Quantifying and imaging NY-ESO-1/LAGE-1-derived epitopes on
tumor cells using high affinity T cell receptors. J Immunol, 2006. 176(12): p. 7308-16.

29
73. Zhao, Y., et al., High-affinity TCRs generated by phage display provide CD4+ T cells with
the ability to recognize and kill tumor cell lines. J Immunol, 2007. 179(9): p. 5845-54.
74. Kieke, M.C., et al., Selection of functional T cell receptor mutants from a yeast surface-
display library. Proc Natl Acad Sci U S A, 1999. 96(10): p. 5651-6.
75. Shusta, E.V., et al., Directed evolution of a stable scaffold for T-cell receptor engineering.
Nat Biotechnol, 2000. 18(7): p. 754-9.
76. Holler, P.D., et al., In vitro evolution of a T cell receptor with high affinity for peptide/MHC.
Proc Natl Acad Sci U S A, 2000. 97(10): p. 5387-92.
77. Holler, P.D., et al., CD8(-) T cell transfectants that express a high affinity T cell receptor
exhibit enhanced peptide-dependent activation. J Exp Med, 2001. 194(8): p. 1043-52.
78. Weber, K.S., et al., Class II-restricted T cell receptor engineered in vitro for higher affinity
retains peptide specificity and function. Proc Natl Acad Sci U S A, 2005. 102(52): p.
19033-8.
79. Chlewicki, L.K., et al., High-affinity, peptide-specific T cell receptors can be generated by
mutations in CDR1, CDR2 or CDR3. J Mol Biol, 2005. 346(1): p. 223-39.
80. Klein, J. and A. Sato, The HLA system. First of two parts. N Engl J Med, 2000. 343(10): p.
702-9.
81. Park, H., et al., A distinct lineage of CD4 T cells regulates tissue inflammation by
producing interleukin 17. Nat Immunol, 2005. 6(11): p. 1133-41.
82. Altman, J.D., et al., Phenotypic analysis of antigen-specific T lymphocytes. Science, 1996.
274(5284): p. 94-6.
83. Klein, L. and B. Kyewski, "Promiscuous" expression of tissue antigens in the thymus: a key
to T-cell tolerance and autoimmunity? J Mol Med, 2000. 78(9): p. 483-94.
84. Huang, C.H., et al., Cancer immunotherapy using a DNA vaccine encoding a single-chain
trimer of MHC class I linked to an HPV-16 E6 immunodominant CTL epitope. Gene Ther,
2005. 12(15): p. 1180-6.
30
85. Coulie, P.G., et al., Cytolytic T-cell responses of cancer patients vaccinated with a MAGE
antigen. Immunol Rev, 2002. 188: p. 33-42.
86. Jenkins, M.K., et al., In vivo activation of antigen-specific CD4 T cells. Annu Rev Immunol,
2001. 19: p. 23-45.
87. Henderson, R.A., et al., Direct identification of an endogenous peptide recognized by
multiple HLA-A2.1-specific cytotoxic T cells. Proc Natl Acad Sci U S A, 1993. 90(21): p.
10275-9.
88. Bian, H., J.F. Reidhaar-Olson, and J. Hammer, The use of bioinformatics for identifying
class II-restricted T-cell epitopes. Methods, 2003. 29(3): p. 299-309.
89. Sospedra, M., C. Pinilla, and R. Martin, Use of combinatorial peptide libraries for T-cell
epitope mapping. Methods, 2003. 29(3): p. 236-47.
90. Hiemstra, H.S., et al., The identification of CD4+ T cell epitopes with dedicated synthetic
peptide libraries. Proc Natl Acad Sci U S A, 1997. 94(19): p. 10313-8.
91. Boen, E., et al., Identification of T cell ligands in a library of peptides covalently attached
to HLA-DR4. J Immunol, 2000. 165(4): p. 2040-7.
92. Wang, R.F., et al., Cloning genes encoding MHC class II-restricted antigens: mutated
CDC27 as a tumor antigen. Science, 1999. 284(5418): p. 1351-4.
93. Koelle, D.M., Expression cloning for the discovery of viral antigens and epitopes
recognized by T cells. Methods, 2003. 29(3): p. 213-26.
94. Inaba, K., et al., Dendritic cell progenitors phagocytose particulates, including bacillus
Calmette-Guerin organisms, and sensitize mice to mycobacterial antigens in vivo. J Exp
Med, 1993. 178(2): p. 479-88.
95. Sallusto, F., et al., Dendritic cells use macropinocytosis and the mannose receptor to
concentrate macromolecules in the major histocompatibility complex class II compartment:
downregulation by cytokines and bacterial products. J Exp Med, 1995. 182(2): p. 389-400.

31
96. Kitajima, T., et al., A novel mechanism of glucocorticoid-induced immune suppression: the
inhibiton of T cell-mediated terminal maturation of a murine dendritic cell line. J Clin
Invest, 1996. 98(1): p. 142-7.
97. O'Garra, A. and N. Arai, The molecular basis of T helper 1 and T helper 2 cell
differentiation. Trends Cell Biol, 2000. 10(12): p. 542-50.
98. Iwata, M., et al., Retinoic acid imprints gut-homing specificity on T cells. Immunity, 2004.
21(4): p. 527-38.
99. Bendelac, A., et al., Adoptive T cell transfer of autoimmune nonobese diabetic mouse
diabetes does not require recruitment of host B lymphocytes. J Immunol, 1988. 141(8): p.
2625-8.
100. Taurog, J.D., et al., Susceptibility to inflammatory disease in HLA-B27 transgenic rat lines
correlates with the level of B27 expression. J Immunol, 1993. 150(9): p. 4168-78.
101. Papadopoulos, E.B., et al., Infusions of donor leukocytes to treat Epstein-Barr virus-
associated lymphoproliferative disorders after allogeneic bone marrow transplantation. N
Engl J Med, 1994. 330(17): p. 1185-91.
102. Fontaine, P., et al., Adoptive transfer of minor histocompatibility antigen-specific T
lymphocytes eradicates leukemia cells without causing graft-versus-host disease. Nat Med,
2001. 7(7): p. 789-94.
103. Malek, T.R., et al., CD4 regulatory T cells prevent lethal autoimmunity in IL-2Rbeta-
deficient mice. Implications for the nonredundant function of IL-2. Immunity, 2002. 17(2):
p. 167-78.
104. Zakrzewski, J.L., et al., Adoptive transfer of T-cell precursors enhances T-cell
reconstitution after allogeneic hematopoietic stem cell transplantation. Nat Med, 2006.
12(9): p. 1039-47.
105. Bender, A., et al., Improved methods for the generation of dendritic cells from
nonproliferating progenitors in human blood. J Immunol Methods, 1996. 196(2): p. 121-35.
106. Romani, N., et al., Generation of mature dendritic cells from human blood. An improved
method with special regard to clinical applicability. J Immunol Methods, 1996. 196(2): p.
137-51.

32
107. Oelke, M., et al., Ex vivo induction and expansion of antigen-specific cytotoxic T cells by
HLA-Ig-coated artificial antigen-presenting cells. Nat Med, 2003. 9(5): p. 619-24.
108. Andre, F., et al., Exosomes as potent cell-free peptide-based vaccine. I. Dendritic cell-
derived exosomes transfer functional MHC class I/peptide complexes to dendritic cells. J
Immunol, 2004. 172(4): p. 2126-36.
109. BP Statistical Review of World Energy,June 2008. www.bp.com/statisticalreview.
110. Wen, F., N.U. Nair, and H. Zhao, Protein engineering in designing tailored enzymes and
microorganisms for biofuels production. Curr Opin Biotechnol, 2009. 20(4): p. 412-9.
111. DOE, U., Breaking the biological barriers to cellulosic ethanol: a joint research Agenda,
DOE/SC-0095. U.S. Department of Energy Office of Science and Office of Energy
Efficiency and Renewable Energy; www.doegenomestolife.org/biofuels/. 2006.
112. Lynd, L.R., et al., Consolidated bioprocessing of cellulosic biomass: an update. Curr Opin
Biotechnol, 2005. 16(5): p. 577-83.
113. Lynd, L.R., C.E. Wyman, and T.U. Gerngross, Biocommodity Engineering. Biotechnol
Prog, 1999. 15(5): p. 777-793.
114. Hatfield, R.D., J. Ralph, and J.H. Grabber, Cell wall structural foundations: Molecular
basis for improving forage digestibilities. Crop Science, 1999. 39(1): p. 27-37.
115. Lynd, L.R., et al., Microbial cellulose utilization: fundamentals and biotechnology.
Microbiol Mol Biol Rev, 2002. 66(3): p. 506-77.
116. van Zyl, W.H., et al., Consolidated bioprocessing for bioethanol production using
Saccharomyces cerevisiae. Adv Biochem Eng Biotechnol, 2007. 108: p. 205-35.
117. Bayer, E.A., R. Lamed, and M.E. Himmel, The potential of cellulases and cellulosomes for
cellulosic waste management. Curr Opin Biotechnol, 2007. 18(3): p. 237-45.
118. Wright, J.D., C.E. Wyman, and K. Grohmann, Simultaneous Saccharification and
Fermentation of Lignocellulose - Process Evaluation. Applied Biochemistry and
Biotechnology, 1988. 18: p. 75-90.
33
119. Lynd, L.R., Overview and evaluation of fuel ethanol from cellulosic biomass: Technology,
economics, the environment, and policy. Annual Review of Energy and the Environment,
1996. 21: p. 403-465.
120. Zhang, Y.H. and L.R. Lynd, Cellulose utilization by Clostridium thermocellum:
bioenergetics and hydrolysis product assimilation. Proc Natl Acad Sci U S A, 2005.
102(20): p. 7321-5.
121. Demain, A.L., M. Newcomb, and J.H. Wu, Cellulase, clostridia, and ethanol. Microbiol
Mol Biol Rev, 2005. 69(1): p. 124-54.
122. Jennert, K.C., et al., Gene transfer to Clostridium cellulolyticum ATCC 35319.
Microbiology, 2000. 146 Pt 12: p. 3071-80.
123. Tyurin, M.V., S.G. Desai, and L.R. Lynd, Electrotransformation of Clostridium
thermocellum. Appl Environ Microbiol, 2004. 70(2): p. 883-90.
124. Rogers, P.L., et al., Zymomonas mobilis for fuel ethanol and higher value products. Adv
Biochem Eng Biotechnol, 2007. 108: p. 263-88.
125. Pack, S.P., K. Park, and Y.J. Yoo, Enhancement of β-glucosidase stability and cellobiose-
usage using surface-engineered recombinant Saccharomyces cerevisiae in ethanol
production Biotechnol Lett, 2002. 24(22): p. 1919-25.
126. Lu, Y., Y.H. Zhang, and L.R. Lynd, Enzyme-microbe synergy during cellulose hydrolysis
by Clostridium thermocellum. Proc Natl Acad Sci U S A, 2006. 103(44): p. 16165-9.
127. Percival Zhang, Y.H., M.E. Himmel, and J.R. Mielenz, Outlook for cellulase improvement:
screening and selection strategies. Biotechnol Adv, 2006. 24(5): p. 452-81.
128. Hahn-Hagerdal, B., et al., Metabolic engineering of Saccharomyces cerevisiae for xylose
utilization. Adv Biochem Eng Biotechnol, 2001. 73: p. 53-84.
129. Hahn-Hagerdal, B., et al., Metabolic engineering for pentose utilization in Saccharomyces
cerevisiae. Adv Biochem Eng Biotechnol, 2007. 108: p. 147-77.

34
130. Fujita, Y., et al., Construction of whole-cell biocatalyst for xylan degradation through cell-
surface xylanase display in Saccharomyces cerevisiae. J Mol Catal B Enzym, 2002. 17(3-
5): p. 189-95.
131. Katahira, S., et al., Construction of a xylan-fermenting yeast strain through codisplay of
xylanolytic enzymes on the surface of xylose-utilizing Saccharomyces cerevisiae cells. Appl
Environ Microbiol, 2004. 70(9): p. 5407-14.
132. Katahira, S., et al., Ethanol fermentation from lignocellulosic hydrolysate by a recombinant
xylose- and cellooligosaccharide-assimilating yeast strain. Appl Microbiol Biotechnol,
2006. 72(6): p. 1136-43.
133. Murai, T., et al., Assimilation of cellooligosaccharides by a cell surface-engineered yeast
expressing beta-glucosidase and carboxymethylcellulase from aspergillus aculeatus. Appl
Environ Microbiol, 1998. 64(12): p. 4857-61.
134. Fujita, Y., et al., Direct and efficient production of ethanol from cellulosic material with a
yeast strain displaying cellulolytic enzymes. Appl Environ Microbiol, 2002. 68(10): p.
5136-41.
135. Fujita, Y., et al., Synergistic saccharification, and direct fermentation to ethanol, of
amorphous cellulose by use of an engineered yeast strain codisplaying three types of
cellulolytic enzyme. Appl Environ Microbiol, 2004. 70(2): p. 1207-12.
136. Wen, F., O. Esteban, and H. Zhao, Rapid identification of CD4+ T-cell epitopes using yeast
displaying pathogen-derived peptide library. J Immunol Methods, 2008. 336(1): p. 37-44.
137. Wen, F., J. Sun, and H. Zhao, Yeast surface display of trifunctional minicellulosomes for
simultaneous saccharification and fermentation of cellulose to ethanol. Appl Environ
Microbiol, 2010. 76(4): p. 1251-60.

35
Chapter 2. Rapid T Cell Epitope Identification Using Yeast
Displaying Single-chain Peptide-MHC Complexes as Artificial APCs
2.1. Introduction
Cellular immunity is mediated by T cells, which respond to selected peptides in complex
with major histocompatibility complex (MHC) expressed on antigen presenting cells (APCs)
through their unique surface receptors (T cell receptors, TCRs) [1]. Identification of these
specific antigenic peptides − T cell epitopes − is a critical but often slow and difficult step in
studying the immune response to tumors, infectious agents, and autoantigens, as well as in
developing pertinent vaccines and therapeutic strategies [2-4]. As shown in Table 1.1, the
expression cloning and combinational peptide library based approaches suffer from two common
limitations: first, they rely on the use of professional APCs that are often difficult to isolate,
expand and maintain; and second, the screening process is often time-consuming, laborious, and
reagent-intensive. Therefore, the goal of this project is to develop a facile and high-throughput
method for T cell epitope identification using an aAPC system that is easier to establish and
cheaper to manipulate than the existing ones. Between the two types of aAPC systems described
in Section 1.2.4, acellular and cellular, the latter was chosen to avoid large scale expression and
purification of MHC molecules, which are required to coat an acellular aAPC surface, such as
magnetic beads [5].
A human MHC class II (MHCII) allele, HLA-DR1, was chosen to be the model system.
While most research efforts to date have focused on MHC class I (MHCI) proteins, recent
studies have shown that CD8+ T cell immunity is not sufficient on its own to eradicate cancer
cells [6] or viral infection [7, 8], and a combination of CD4+ and CD8+ T cell responses is
36
necessary to generate an efficient and long-lasting immunity. Therefore identification of CD4+ T
cell epitope is highly desirable.
The key step in developing a successful cellular aAPC system is the functional
expression of the MHC protein on the cell surface. MHC molecules are large heterodimeric
membrane proteins that are highly glycosylated and contain multiple disulfide bonds. In the
absence of their transmembrane domains, the two polypeptide chains are unable to assemble
properly and/or tend to aggregate [9]. Furthermore, it requires the binding of a peptide to
stabilize the native conformation of MHC molecules [10, 11]. Therefore, soluble expression of
MHC molecules, especially class II, has been proven to be difficult [12] and represents the first
challenge of this project.
Although several cellular aAPC systems that are less complex than professional APC
have been developed [13, 14], they are still not simple enough and require the use of complex
culture media and long cell culture time. Our attention was attracted by the two most commonly
used and well-studied organisms: bacterium Escherichia coli and yeast Saccharomyces
cerevisiae. Thanks to the development of cell surface display technique [15], both of the
organisms have the potential to be aAPCs. We sought to use yeast S. cerevisiae for artificial
antigen presentation. Compared to bacteria display, yeast display is a preferred method for
expressing complex eukaryotic proteins due to its several advantages, such as the availability of
posttranslational modifications and protein folding quality control mechanism [16]. Coupled
with fluorescence activated cell sorting (FACS) using fluorescent labels, target protein displayed
on yeast surface can be analyzed in a high-throughput and quantitative manner. Since its
development in 1997 [17], yeast surface display has been successfully used to engineer
antibodies, MHC molecules, and TCRs [18].

37
To date, there are only five successful examples [19-23] of using yeast surface display to
express MHC proteins, three of which are expression of MHCII molecules [21-23]. In four of the
examples [19-22], engineering of the MHC molecules was required and mutations were
introduced to stabilize the surface expression of MHC molecules. These mutations might affect
the conformation and/or peptide-binding kinetics of the mutant MHC proteins, and consequently
alter their physiological property that is critical for pathogenesis studies and therapeutic
applications. Although in one of these four examples, the surface displayed murine MHCI
molecule was shown to be functional, the observed T cell activation was inconclusive due to
alternative activation mechanisms [19]. Therefore, none of these mutant MHC proteins were
shown to activate T cells conclusively. Recently, the wild-type human class II HLA-DR4
molecules with a covalently attached peptide have been displayed on the yeast surface in their
native state, but the resulting complex was incapable of stimulating antigen-specific T cells [23].
Therefore, the use of yeast cell displaying functional MHCII proteins as an aAPC has yet to be
demonstrated, thus representing the second challenge of this project.
The third challenge of this project is to develop a facile and cost-effective T cell epitope
identification method. In theory, if yeast cells were successfully demonstrated to activate T cells
in a peptide specific manner, epitopes could be identified readily by analyzing each peptide in an
expression cloning library individually for their antigenic ability the same way as in the
conventional methods [24]. However, this procedure has very low throughput. It would be
convenient if we could use the fluorescence activated cell sorter (FACS) to enrich the potential
epitopes from the library first, so that epitopes could be identified easily by analyzing only a
small fraction of the peptide library, such as one hundred clones or even less. Previously, the
expression level of yeast cell surface display was used as a proxy-screening variable for
38
enhanced thermostability [25]. Therefore, we hypothesized that it might be possible to select
“good binders” from a peptide library based on the yeast surface expression level of the single-
chain peptide-DR1 complexes.
In this chapter, each of the three challenges described above is addressed using DR1 and
its well-defined CD4+ T cell epitope, HA306-318, as a model system [26]. A single-chain construct,
in which the HA epitope was covalently intercalated between the α- and β-chain of DR1, was
used to enable the functional display of MHC on yeast cell surface. A positive correlation
between the yeast surface expression level of the peptide-DR1 complexes and the peptide-
binding affinity was established. For the first time, it was demonstrated that yeast cells
displaying the DR1-HA complexes can be used as aAPC to activate T hybridoma cells in a
peptide-specific manner. Based on these findings, a two-step T cell epitope identification method
was proposed and validated by identifying the HA-derived CD4+ T cell epitope from either a
single antigenic protein (haemagglutinin) or the entire influenza virus X31/A/Aichi/68 genome.
2.2. Results and Discussion
2.2.1. Functional Expression of Single-chain DR1-HA306-318 Complexes on Yeast Cell
Surface
Native MHCII molecules are heterodimeric proteins, a single-chain construct is thus
chosen for yeast surface display of DR1. Other studies have shown that a flexible linker can be
used to express proteins that are naturally non-covalent heterodimers, including antibodies [27],
MHCI [28, 29], and MHCII proteins [22]. Previously, Olga Esteban in our group attempted to
express soluble wild-type single-chain DR1 molecules (scDR1αβ) on the yeast cell surface
without success [21]. However, directed evolution strategy was successfully applied and enabled

39
yeast surface display of DR1. More specifically, a library of mutant scDR1αβ molecules was
generated by error-prone PCR and screened by FACS with DR-specific conformation-sensitive
antibodies, yielding three well-expressed, properly folded scDR1αβ variants displayed on the
yeast cell surface. The resulting soluble scDR1αβ mutants were shown to specifically bind
peptide HA306-318. Interestingly, the peptide binding grooves of these mutant proteins were not
empty, but presumably occupied by yeast endogenous peptides or peptides from the culture
media [21]. This result indicated that mutations alone were not sufficient for stabilizing the DR1
molecules although they were necessary; and peptide binding also contributed to the stabilization
of the native conformation of DR1 molecules displayed on the yeast cell surface, consistent with
other reports [30, 31]. Therefore, it was hypothesized that the wild type DR1 molecules might be
possible to be functionally displayed on the yeast cell surface by co-expressing a covalently
bound peptide, HA306-318.
To test this hypothesis, a single polypeptide chain, scDR1αHAβ, in which peptide HA306-
318 was covalently intercalated between the C-terminus of DR1α-chain and the N-terminus of
DR1β-chain through two flexible linkers (Figure 2.1), was constructed, cloned into pYD1 yeast
display vector, and transformed into EBY100 S. cerevisiae strain [17].
BstXI XhoI NotI SpeI
DR1αααα DR1ββββ stop AGA2 GAL1 P L L V5 His Xpress
Figure 2.1 Schematic representation of the single-chain DR1- HA306-318 construct used in yeast display.
GAL1= yeast GAL1 promoter, AGA2= an adhesion subunit of a-agglutinin of a-yeast-cells [17],
Xpress=Xpress epitope, L=linker, P= HA306-318 peptide, V5=V5 epitope, His=His6 tag.
The surface expression level of the scDR1αHAβ protein was analyzed by flow cytometry

40
using two different antibodies: anti-V5 antibody was used to detect the full-length protein; and
LB3.1, a conformation-sensitive antibody that can only bind correctly assembled DR
heterodimers [10], was used to detect properly folded protein. As shown in Figure 2.2 (middle
panel), a positive staining yeast cell population was detected with anti-V5 antibody and the
relative mean fluorescence units (MFU) of ~100 indicated a high surface expression level of the
wild type scDR1αHAβ protein. Expression of the properly folded wild type scDR1αHAβ
protein was also detected as indicated by the LB3.1-positive staining population (Figure 2.2,
right panel). A comparison of the MFU obtained with anti-V5 and LB3.1 antibody indicated that
only a fraction of the displayed proteins were in their native conformation, consistent with the
previous result [21]. Taken together, these data clearly suggested that, with the stabilizing effect
of the binding peptide HA306-318, the wild type DR1 protein can be displayed on yeast cell surface
in its native state.
no 1°
PE
Anti-DR (LB3.1)
PE
Anti-V5
PE
Figure 2.2 Flow cytometric analysis of single-chain DR1-HA expression on yeast cell surface. Yeast
cells transformed with pYD1-scDR1αHAβ were stained with anti-V5 antibody to detect full-length
protein expression, or with LB3.1 (anti-DR) antibody to detect correctly folded complexes. Yeast cells
stained only with secondary antibody (no 1°) were used as a negative control.
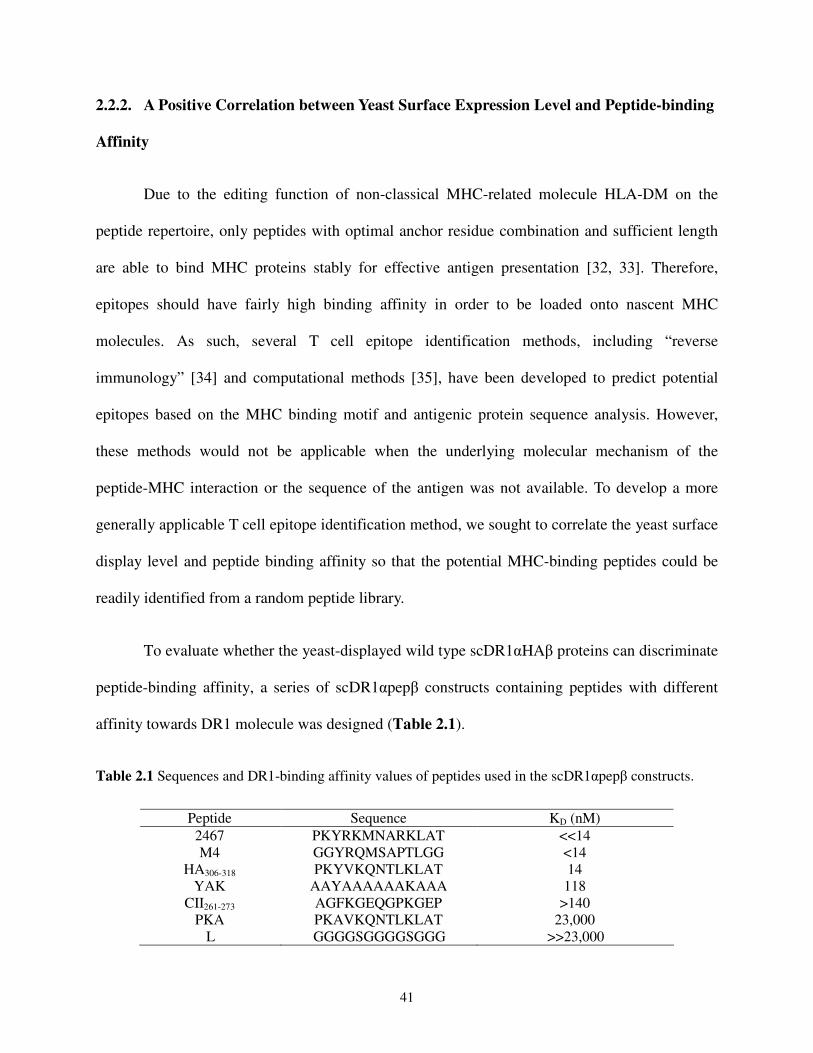
41
2.2.2. A Positive Correlation between Yeast Surface Expression Level and Peptide-binding
Affinity
Due to the editing function of non-classical MHC-related molecule HLA-DM on the
peptide repertoire, only peptides with optimal anchor residue combination and sufficient length
are able to bind MHC proteins stably for effective antigen presentation [32, 33]. Therefore,
epitopes should have fairly high binding affinity in order to be loaded onto nascent MHC
molecules. As such, several T cell epitope identification methods, including “reverse
immunology” [34] and computational methods [35], have been developed to predict potential
epitopes based on the MHC binding motif and antigenic protein sequence analysis. However,
these methods would not be applicable when the underlying molecular mechanism of the
peptide-MHC interaction or the sequence of the antigen was not available. To develop a more
generally applicable T cell epitope identification method, we sought to correlate the yeast surface
display level and peptide binding affinity so that the potential MHC-binding peptides could be
readily identified from a random peptide library.
To evaluate whether the yeast-displayed wild type scDR1αHAβ proteins can discriminate
peptide-binding affinity, a series of scDR1αpepβ constructs containing peptides with different
affinity towards DR1 molecule was designed (Table 2.1).
Table 2.1 Sequences and DR1-binding affinity values of peptides used in the scDR1αpepβ constructs.
Peptide Sequence KD (nM)
2467 PKYRKMNARKLAT <<14
M4 GGYRQMSAPTLGG <14
HA306-318 PKYVKQNTLKLAT 14
YAK AAYAAAAAAKAAA 118
CII261-273 AGFKGEQGPKGEP >140
PKA PKAVKQNTLKLAT 23,000
L GGGGSGGGGSGGG >>23,000
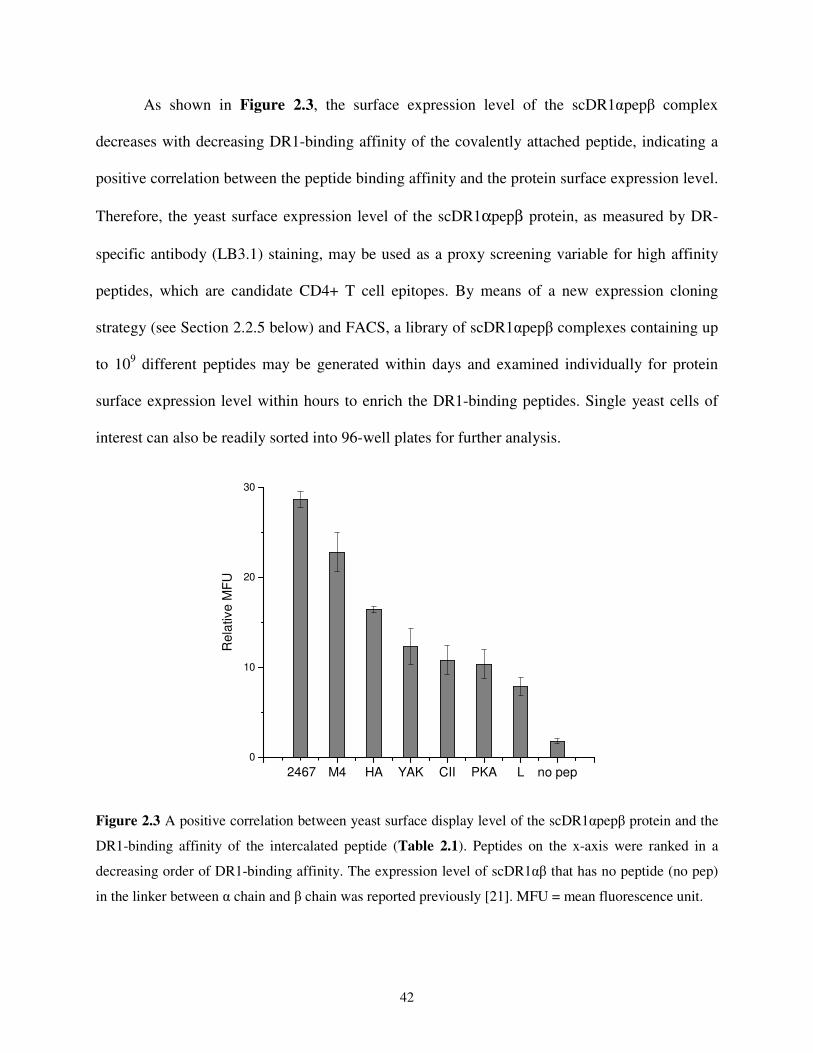
42
As shown in Figure 2.3, the surface expression level of the scDR1αpepβ complex
decreases with decreasing DR1-binding affinity of the covalently attached peptide, indicating a
positive correlation between the peptide binding affinity and the protein surface expression level.
Therefore, the yeast surface expression level of the scDR1αpepβ protein, as measured by DR-
specific antibody (LB3.1) staining, may be used as a proxy screening variable for high affinity
peptides, which are candidate CD4+ T cell epitopes. By means of a new expression cloning
strategy (see Section 2.2.5 below) and FACS, a library of scDR1αpepβ complexes containing up
to 109 different peptides may be generated within days and examined individually for protein
surface expression level within hours to enrich the DR1-binding peptides. Single yeast cells of
interest can also be readily sorted into 96-well plates for further analysis.
-- M4 HA YAK CII PKA L no pep
0
10
20
30
Rela
tive M
FU
2467
Figure 2.3 A positive correlation between yeast surface display level of the scDR1αpepβ protein and the
DR1-binding affinity of the intercalated peptide (Table 2.1). Peptides on the x-axis were ranked in a
decreasing order of DR1-binding affinity. The expression level of scDR1αβ that has no peptide (no pep)
in the linker between α chain and β chain was reported previously [21]. MFU = mean fluorescence unit.
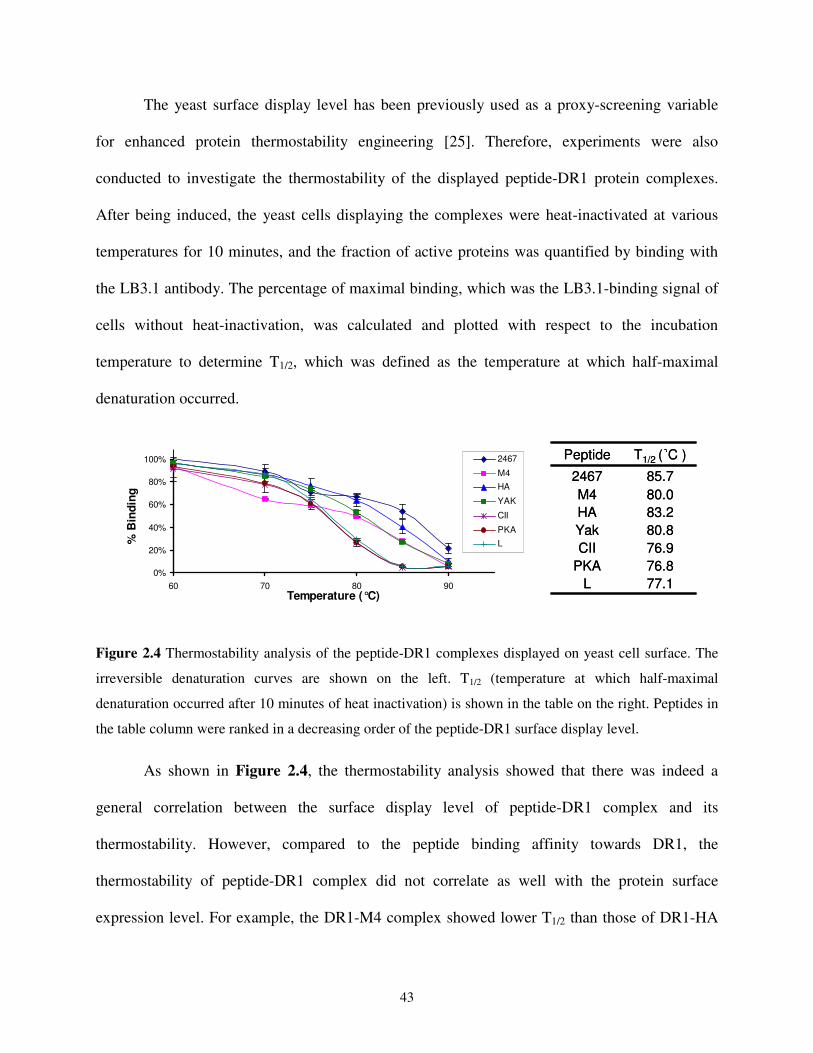
43
The yeast surface display level has been previously used as a proxy-screening variable
for enhanced protein thermostability engineering [25]. Therefore, experiments were also
conducted to investigate the thermostability of the displayed peptide-DR1 protein complexes.
After being induced, the yeast cells displaying the complexes were heat-inactivated at various
temperatures for 10 minutes, and the fraction of active proteins was quantified by binding with
the LB3.1 antibody. The percentage of maximal binding, which was the LB3.1-binding signal of
cells without heat-inactivation, was calculated and plotted with respect to the incubation
temperature to determine T1/2, which was defined as the temperature at which half-maximal
denaturation occurred.
0%
20%
40%
60%
80%
100%
60 70 80 90Temperature (°C)
% B
ind
ing
2467
M4
HA
YAK
CII
PKA
L
83.2HA
80.0M4
85.72467
76.9CII
77.1L
76.8PKA
80.8Yak
T1/2 (°C )Peptide
83.2HA
80.0M4
85.72467
76.9CII
77.1L
76.8PKA
80.8Yak
T1/2 (°C )Peptide
Figure 2.4 Thermostability analysis of the peptide-DR1 complexes displayed on yeast cell surface. The
irreversible denaturation curves are shown on the left. T1/2 (temperature at which half-maximal
denaturation occurred after 10 minutes of heat inactivation) is shown in the table on the right. Peptides in
the table column were ranked in a decreasing order of the peptide-DR1 surface display level.
As shown in Figure 2.4, the thermostability analysis showed that there was indeed a
general correlation between the surface display level of peptide-DR1 complex and its
thermostability. However, compared to the peptide binding affinity towards DR1, the
thermostability of peptide-DR1 complex did not correlate as well with the protein surface
expression level. For example, the DR1-M4 complex showed lower T1/2 than those of DR1-HA
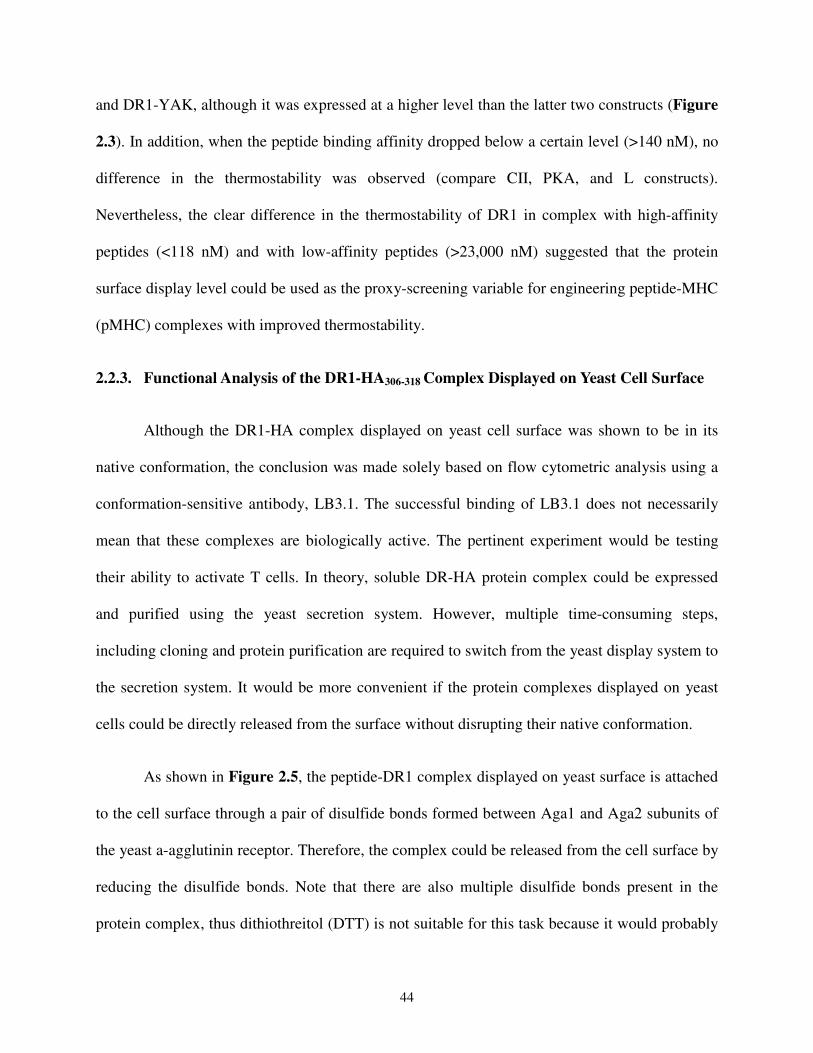
44
and DR1-YAK, although it was expressed at a higher level than the latter two constructs (Figure
2.3). In addition, when the peptide binding affinity dropped below a certain level (>140 nM), no
difference in the thermostability was observed (compare CII, PKA, and L constructs).
Nevertheless, the clear difference in the thermostability of DR1 in complex with high-affinity
peptides (<118 nM) and with low-affinity peptides (>23,000 nM) suggested that the protein
surface display level could be used as the proxy-screening variable for engineering peptide-MHC
(pMHC) complexes with improved thermostability.
2.2.3. Functional Analysis of the DR1-HA306-318 Complex Displayed on Yeast Cell Surface
Although the DR1-HA complex displayed on yeast cell surface was shown to be in its
native conformation, the conclusion was made solely based on flow cytometric analysis using a
conformation-sensitive antibody, LB3.1. The successful binding of LB3.1 does not necessarily
mean that these complexes are biologically active. The pertinent experiment would be testing
their ability to activate T cells. In theory, soluble DR-HA protein complex could be expressed
and purified using the yeast secretion system. However, multiple time-consuming steps,
including cloning and protein purification are required to switch from the yeast display system to
the secretion system. It would be more convenient if the protein complexes displayed on yeast
cells could be directly released from the surface without disrupting their native conformation.
As shown in Figure 2.5, the peptide-DR1 complex displayed on yeast surface is attached
to the cell surface through a pair of disulfide bonds formed between Aga1 and Aga2 subunits of
the yeast a-agglutinin receptor. Therefore, the complex could be released from the cell surface by
reducing the disulfide bonds. Note that there are also multiple disulfide bonds present in the
protein complex, thus dithiothreitol (DTT) is not suitable for this task because it would probably

45
disrupt the native structure of the protein. In contrast, tris-(2-carboxyethyl) phosphine (TCEP) is
a reducing reagent generally impermeable to cell membranes or to the hydrophobic protein core,
allowing its use for selective reduction of disulfides that have aqueous exposure [36]. Therefore,
TCEP was chosen to selectively reduce the disulfide bonds formed between Aga1 and Aga2,
leaving those buried in the folded scDR1αpepβ protein intact.
S=S
S=S
Aga1p
Yeast cell
wall
Xpress
ααααdom
ain
V5ββββ domain
HA
Aga2p
HIS
S=S
S=S
S=S
S=S
Aga1p
Yeast cell
wall
Xpress
ααααdom
ain
V5ββββ domain
HA
Aga2p
HIS
Figure 2.5 Schematic representation of the single-chain peptide-DR1 complex displayed on yeast surface.
Adapted from reference [17].
After treatment with TCEP, the Aga2-DR1-HA306-318 fusion protein was detected using
western blot probed with anti-V5 antibody (Figure 2.6). The fusion protein showed an apparent
molecular weight of ~90 KDa, consistent with the previous study [21]. To test the biological
activity of the protein complex released from the yeast cell surface, DR1-HA protein was
immobilized in a 96-well plate coated with anti-V5 antibody and then incubated with T cells. To
obviate the need to establish and maintain functional T cell clones, HA1.7 hybridoma cells that
are specific for DR1-HA or DR4-HA [24] were used in the T cell activation study.
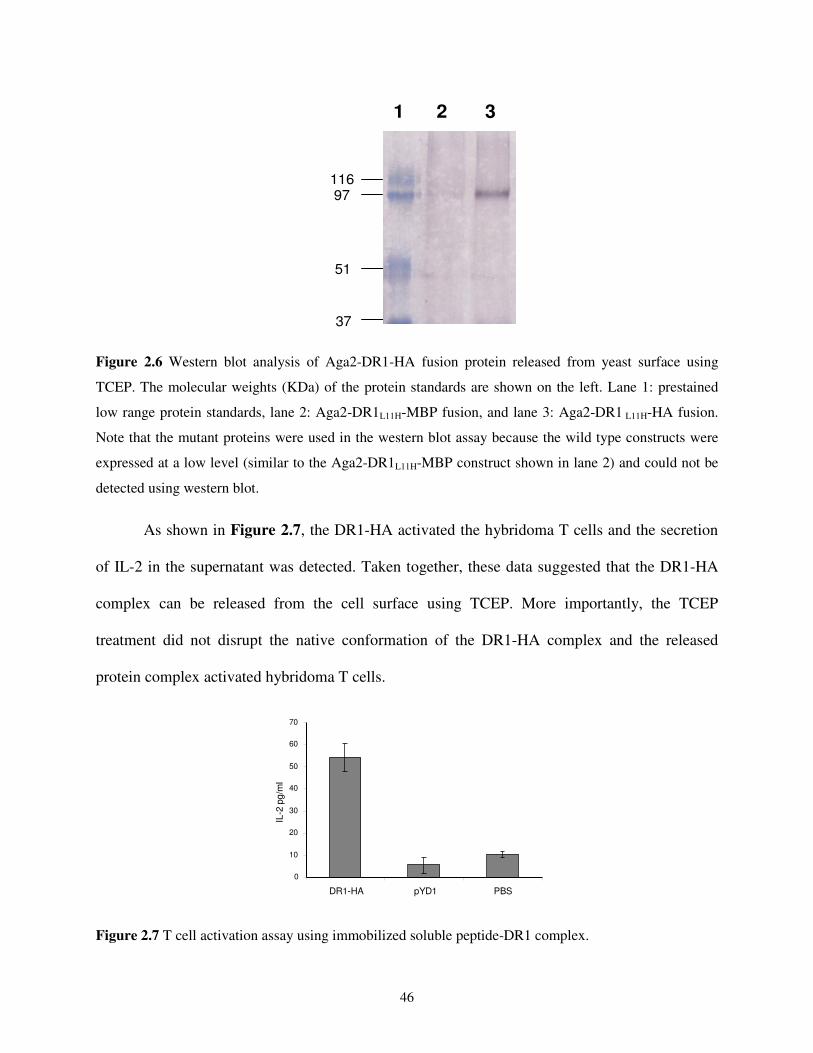
46
97116
51
37
1 2 3
Figure 2.6 Western blot analysis of Aga2-DR1-HA fusion protein released from yeast surface using
TCEP. The molecular weights (KDa) of the protein standards are shown on the left. Lane 1: prestained
low range protein standards, lane 2: Aga2-DR1L11H-MBP fusion, and lane 3: Aga2-DR1 L11H-HA fusion.
Note that the mutant proteins were used in the western blot assay because the wild type constructs were
expressed at a low level (similar to the Aga2-DR1L11H-MBP construct shown in lane 2) and could not be
detected using western blot.
As shown in Figure 2.7, the DR1-HA activated the hybridoma T cells and the secretion
of IL-2 in the supernatant was detected. Taken together, these data suggested that the DR1-HA
complex can be released from the cell surface using TCEP. More importantly, the TCEP
treatment did not disrupt the native conformation of the DR1-HA complex and the released
protein complex activated hybridoma T cells.
0
10
20
30
40
50
60
70
DR1-HA pYD1 PBS
IL-2
pg/m
l
Figure 2.7 T cell activation assay using immobilized soluble peptide-DR1 complex.
47
2.2.4. Use of Yeast Cells Displaying Single-chain Peptide-MHC Complexes as AAPCs
To avoid the use of professional APCs, which are required in most CD4+ T cell epitope
mapping methods, the protein extraction method described in the previous section could be used.
However, it requires TCEP treatment, dialysis, centrifugal concentration, and the use of
antibodies to immobilize the protein complex (see Section 2.4.11), making the identification
process low throughput. To address this issue, the ability of the yeast cells displaying the
scDR1αpepβ complexes to directly induce antigen-specific T cell activation was examined next.
Consistent with previous reports [21-23], no IL-2 secretion was detected when HA1.7 hybridoma
cells were stimulated with yeast cells displaying DR1-HA complexes in suspension. This
inability to induce T cell activation may be caused by the lack of costimulatory molecules on the
yeast cell surface. Without the aid of costimulatory molecules, TCR signaling is weak. In
addition, the spatially restricted MHC-peptide complexes displayed on yeast surface may not
reach the density threshold that is important for stable interaction with TCRs [37]. Therefore, it
was postulated that immobilization of yeast cells on a plastic surface might increase the relative
density of pMHC complexes available for TCR interaction and consequently enable T cell
activation.
To test this hypothesis, yeast cells displaying various scDR1αpepβ constructs were first
immobilized in the wells of a 96-well round-bottom plate and then incubated with HA1.7
hybridoma cells. As shown in Figure 2.8, the hybridoma cells only responded to yeast
displaying the scDR1αpepβ construct harboring the HA306-318 peptide, but not to yeast displaying
scDR1αpepβ construct harboring any other peptide. These data clearly suggested that yeast cells
displaying the scDR1αpepβ complexes, when immobilized, can activate hybridoma T cells in a
peptide specific manner, and thus could be used as aAPCs.

48
-- M4 HA YAK CII PKA L EV PBS
0
10
20
30
40
50
60
70
80
2467
IL-2
pg
/ml
Figure 2.8 Yeast cells displaying peptide-DR1 complexes acted as aAPCs and activated HA1.7
hybridoma in an antigen-specific manner. Yeast cells containing empty plasmid pYD1 (EV) were
cultured, induced, and analyzed in the same way as yeast displaying other constructs.
2.2.5. Design of a T Cell Epitope Identification Method
In the previous sections, it has been successfully demonstrated that: (1) yeast cells can be
engineered to display functional pMHC complexes on the surface, (2) a high throughput
screening method can be established based on the positive correlation between the peptide
binding affinity towards MHC and the surface display level of the pMHC complexes, and (3) the
surface engineered yeast cells can act as aAPCs and activate T cells of interest directly. Based on
these findings, a new CD4+ T cell epitope identification method was proposed to overcome
some of the aforementioned issues presented by existing approaches.
As shown in Figure 2.9, DNA encoding the pathogenic protein(s) is obtained by PCR or
RT-PCR using sequence-specific primers and random hexamer primers (Figure 2.12) for known
and unknown antigens, respectively. Unlike professional APCs, yeast does not have antigen
processing pathways to load antigenic peptides onto MHCII molecules. To address this issue, the
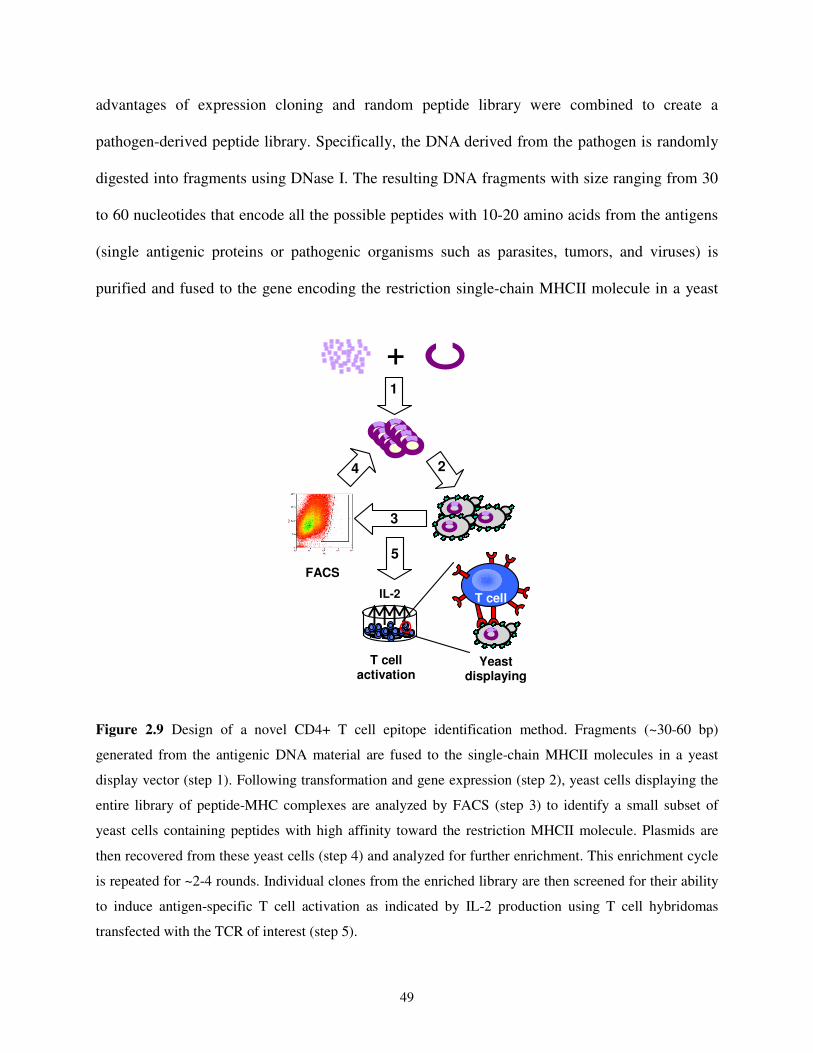
49
advantages of expression cloning and random peptide library were combined to create a
pathogen-derived peptide library. Specifically, the DNA derived from the pathogen is randomly
digested into fragments using DNase I. The resulting DNA fragments with size ranging from 30
to 60 nucleotides that encode all the possible peptides with 10-20 amino acids from the antigens
(single antigenic proteins or pathogenic organisms such as parasites, tumors, and viruses) is
purified and fused to the gene encoding the restriction single-chain MHCII molecule in a yeast
+
IL-2 T cell
1
5
3
2 4
FACS
T cell activation
Yeast displaying
Figure 2.9 Design of a novel CD4+ T cell epitope identification method. Fragments (~30-60 bp)
generated from the antigenic DNA material are fused to the single-chain MHCII molecules in a yeast
display vector (step 1). Following transformation and gene expression (step 2), yeast cells displaying the
entire library of peptide-MHC complexes are analyzed by FACS (step 3) to identify a small subset of
yeast cells containing peptides with high affinity toward the restriction MHCII molecule. Plasmids are
then recovered from these yeast cells (step 4) and analyzed for further enrichment. This enrichment cycle
is repeated for ~2-4 rounds. Individual clones from the enriched library are then screened for their ability
to induce antigen-specific T cell activation as indicated by IL-2 production using T cell hybridomas
transfected with the TCR of interest (step 5).
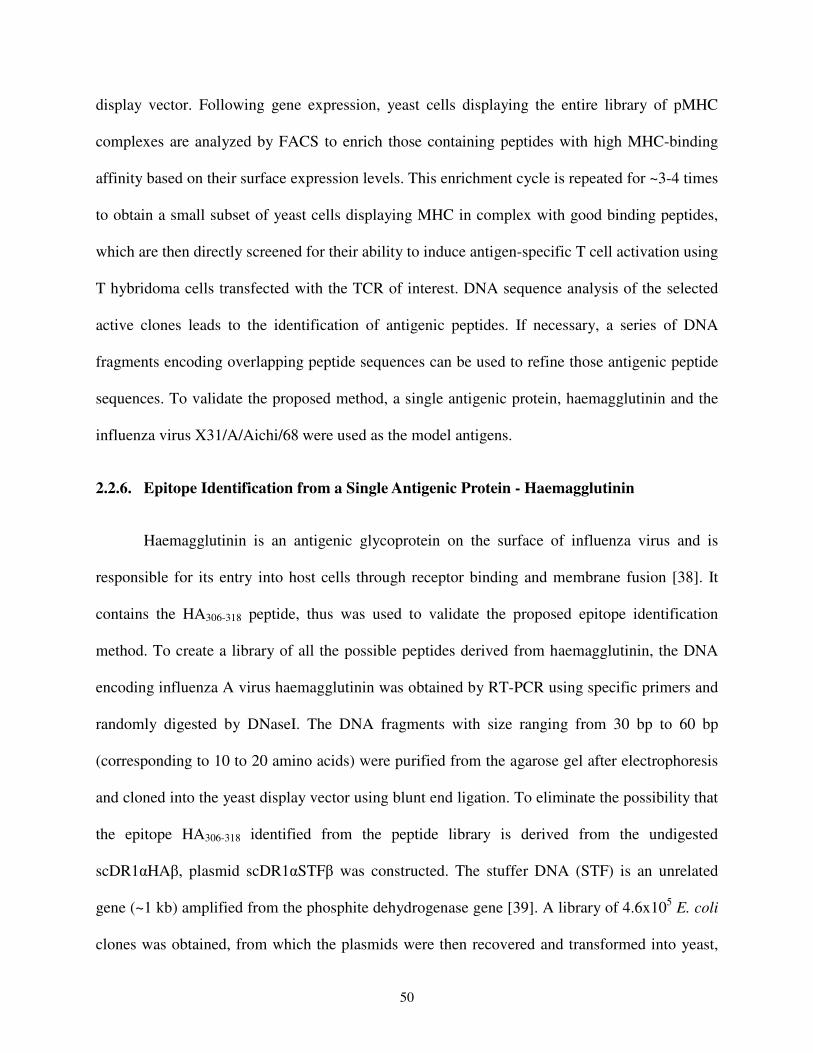
50
display vector. Following gene expression, yeast cells displaying the entire library of pMHC
complexes are analyzed by FACS to enrich those containing peptides with high MHC-binding
affinity based on their surface expression levels. This enrichment cycle is repeated for ~3-4 times
to obtain a small subset of yeast cells displaying MHC in complex with good binding peptides,
which are then directly screened for their ability to induce antigen-specific T cell activation using
T hybridoma cells transfected with the TCR of interest. DNA sequence analysis of the selected
active clones leads to the identification of antigenic peptides. If necessary, a series of DNA
fragments encoding overlapping peptide sequences can be used to refine those antigenic peptide
sequences. To validate the proposed method, a single antigenic protein, haemagglutinin and the
influenza virus X31/A/Aichi/68 were used as the model antigens.
2.2.6. Epitope Identification from a Single Antigenic Protein - Haemagglutinin
Haemagglutinin is an antigenic glycoprotein on the surface of influenza virus and is
responsible for its entry into host cells through receptor binding and membrane fusion [38]. It
contains the HA306-318 peptide, thus was used to validate the proposed epitope identification
method. To create a library of all the possible peptides derived from haemagglutinin, the DNA
encoding influenza A virus haemagglutinin was obtained by RT-PCR using specific primers and
randomly digested by DNaseI. The DNA fragments with size ranging from 30 bp to 60 bp
(corresponding to 10 to 20 amino acids) were purified from the agarose gel after electrophoresis
and cloned into the yeast display vector using blunt end ligation. To eliminate the possibility that
the epitope HA306-318 identified from the peptide library is derived from the undigested
scDR1αHAβ, plasmid scDR1αSTFβ was constructed. The stuffer DNA (STF) is an unrelated
gene (~1 kb) amplified from the phosphite dehydrogenase gene [39]. A library of 4.6x10⁵ E. coli
clones was obtained, from which the plasmids were then recovered and transformed into yeast,

51
generating a library of 2.1x10⁶ variants. The haemagglutinin gene is ~1.7 kb in size, thus the
library created here has ~100% chance of covering all possible ~20-residue-peptides [40]. After
protein induction, the yeast cells displaying scDR1αpepβ proteins were stained with LB3.1
antibody and those harboring high affinity binding peptides were enriched by FACS (Figure
2.10).
.
1° library
Sort 1
Sort 2 Sort 3
Figure 2.10 FACS enrichment of potential good binders from the haemagglutinin-derived peptide library.
LB3.1 antibody was used to stain cells as a measurement of surface expression level of correctly folded
peptide-DR1 complexes. Comparison between the histogram of the library before enrichment (shade) and
that after three-rounds of cell sorting (red line) clearly showed that the good binders were greatly
enriched.
After three rounds of cell sorting, ten clones were randomly picked from the top 0.05%
population of the enriched library and evaluated for their protein surface expression levels
(Figure 2.11a) and the ability to activate HA1.7 T hybridoma cells (Figure 2.11b). All ten
clones showed higher or comparable expression levels as the yeast displaying the scDR1αHAβ
complex and five of them (clone 3, 4, 5, 7, and 9), representing 50% of the enriched library, were
capable of stimulating hybridoma T cells to secret IL-2. DNA sequencing analysis of the five
active clones revealed that all of them displayed an identical peptide
PKYVKQNTLKLATGMRNVPEKQT, which contained the HA306-318 epitope underlined.
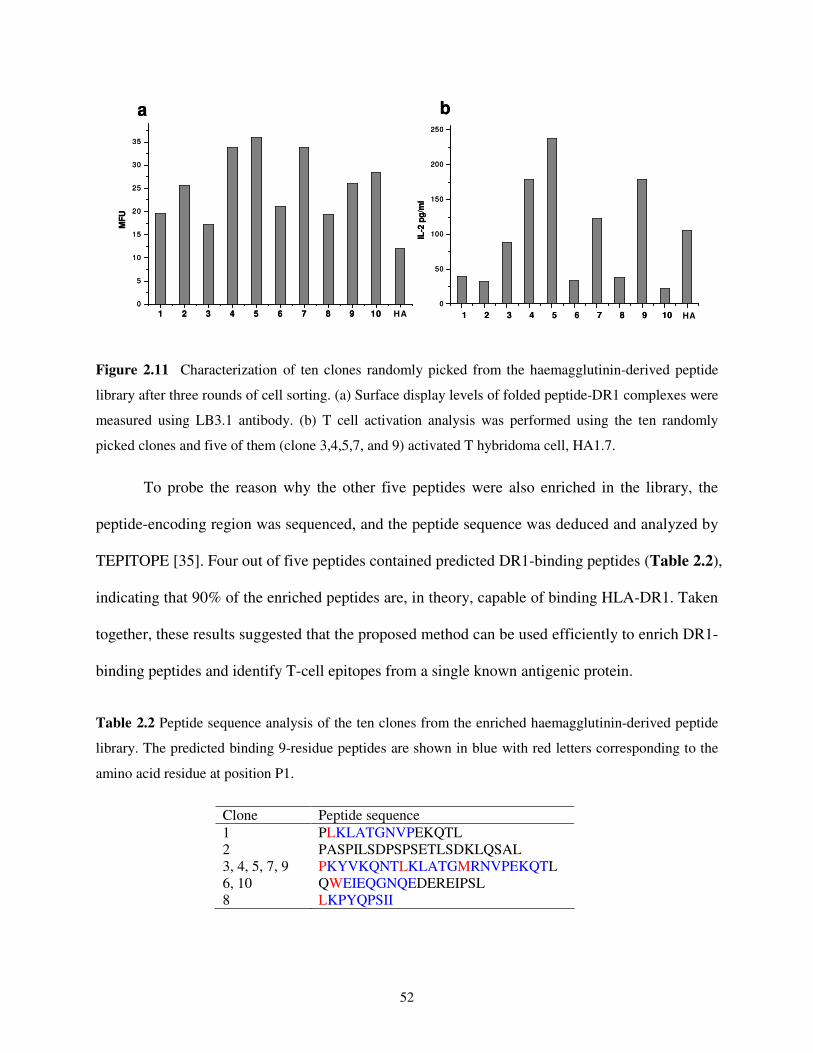
52
1 2 3 4 5 6 7 8 9 10 110
5
10
15
20
25
30
35
HA
MF
U
1 2 3 4 5 6 7 8 9 10 11
0
50
100
150
200
250
HA
IL-2
pg
/ml
a b
1 2 3 4 5 6 7 8 9 10 110
5
10
15
20
25
30
35
HA
MF
U
1 2 3 4 5 6 7 8 9 10 11
0
50
100
150
200
250
HA
IL-2
pg
/ml
a b
Figure 2.11 Characterization of ten clones randomly picked from the haemagglutinin-derived peptide
library after three rounds of cell sorting. (a) Surface display levels of folded peptide-DR1 complexes were
measured using LB3.1 antibody. (b) T cell activation analysis was performed using the ten randomly
picked clones and five of them (clone 3,4,5,7, and 9) activated T hybridoma cell, HA1.7.
To probe the reason why the other five peptides were also enriched in the library, the
peptide-encoding region was sequenced, and the peptide sequence was deduced and analyzed by
TEPITOPE [35]. Four out of five peptides contained predicted DR1-binding peptides (Table 2.2),
indicating that 90% of the enriched peptides are, in theory, capable of binding HLA-DR1. Taken
together, these results suggested that the proposed method can be used efficiently to enrich DR1-
binding peptides and identify T-cell epitopes from a single known antigenic protein.
Table 2.2 Peptide sequence analysis of the ten clones from the enriched haemagglutinin-derived peptide
library. The predicted binding 9-residue peptides are shown in blue with red letters corresponding to the
amino acid residue at position P1.
Clone Peptide sequence
1 PLKLATGNVPEKQTL
2 PASPILSDPSPSETLSDKLQSAL
3, 4, 5, 7, 9 PKYVKQNTLKLATGMRNVPEKQTL
6, 10 QWEIEQGNQEDEREIPSL
8 LKPYQPSII
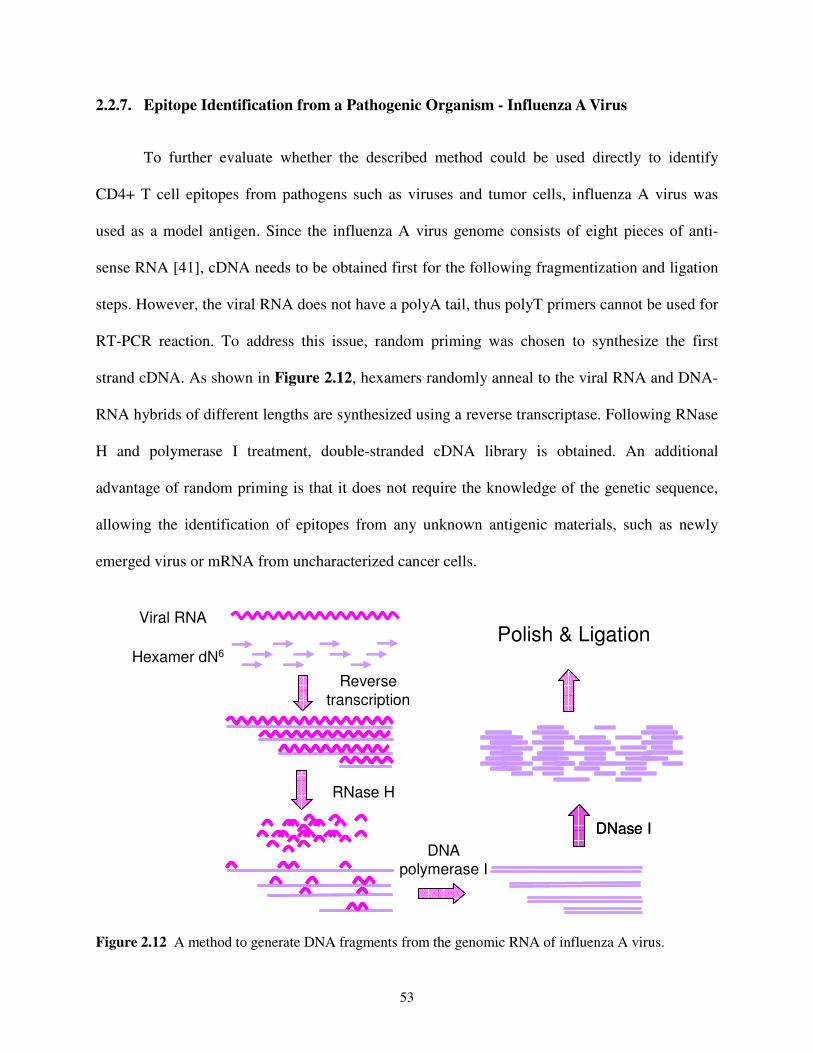
53
2.2.7. Epitope Identification from a Pathogenic Organism - Influenza A Virus
To further evaluate whether the described method could be used directly to identify
CD4+ T cell epitopes from pathogens such as viruses and tumor cells, influenza A virus was
used as a model antigen. Since the influenza A virus genome consists of eight pieces of anti-
sense RNA [41], cDNA needs to be obtained first for the following fragmentization and ligation
steps. However, the viral RNA does not have a polyA tail, thus polyT primers cannot be used for
RT-PCR reaction. To address this issue, random priming was chosen to synthesize the first
strand cDNA. As shown in Figure 2.12, hexamers randomly anneal to the viral RNA and DNA-
RNA hybrids of different lengths are synthesized using a reverse transcriptase. Following RNase
H and polymerase I treatment, double-stranded cDNA library is obtained. An additional
advantage of random priming is that it does not require the knowledge of the genetic sequence,
allowing the identification of epitopes from any unknown antigenic materials, such as newly
emerged virus or mRNA from uncharacterized cancer cells.
Hexamer dN6
Viral RNA
Reverse transcription
RNase H
DNA polymerase I
DNase IDNase I
Polish & Ligation
Figure 2.12 A method to generate DNA fragments from the genomic RNA of influenza A virus.

54
Using random priming, a library (3.0×10⁵) of DR1 protein in complex with peptides
derived from the genome of influenza virus A/Aichi/2/68 was created first in E. coli. Plasmids
were then recovered and transformed into yeast, generating a library of 2.1×10⁶ variants. After
four rounds of FACS enrichment (Figure 2.13a), a significant peak shift was observed,
indicating that yeast cells displaying peptides with high DR1-binding affinity were enriched.
Twenty clones were randomly picked and analyzed for their surface display level and activity.
As shown in Figure 2.13b, majority of the twenty clones showed higher expression level than
scDR1αHAβ. Unfortunately, none of them activated T cells (data not shown). Screening of
additional five plates still did not reveal any active clones.
1°library
Sort 1
Sort 2
Sort 3
Sort 4
a
b
0
5
10
15
20
25
30
35
40
45
1 2 3 4 5 6 7 8 9 10 11 12 13 14 15 16 17 18 19 20 HA
MF
U
Figure 2.13 Enrichment of potential good binders from the influenza A/Aichi/2/68 virus genome-derived
peptide library. (a) Four rounds of FACS analysis of the peptide library using LB3.1 as the primary
staining antibody. (b) Surface expression levels of 20 clones randomly picked from the enriched library
after four rounds of cell sorting.
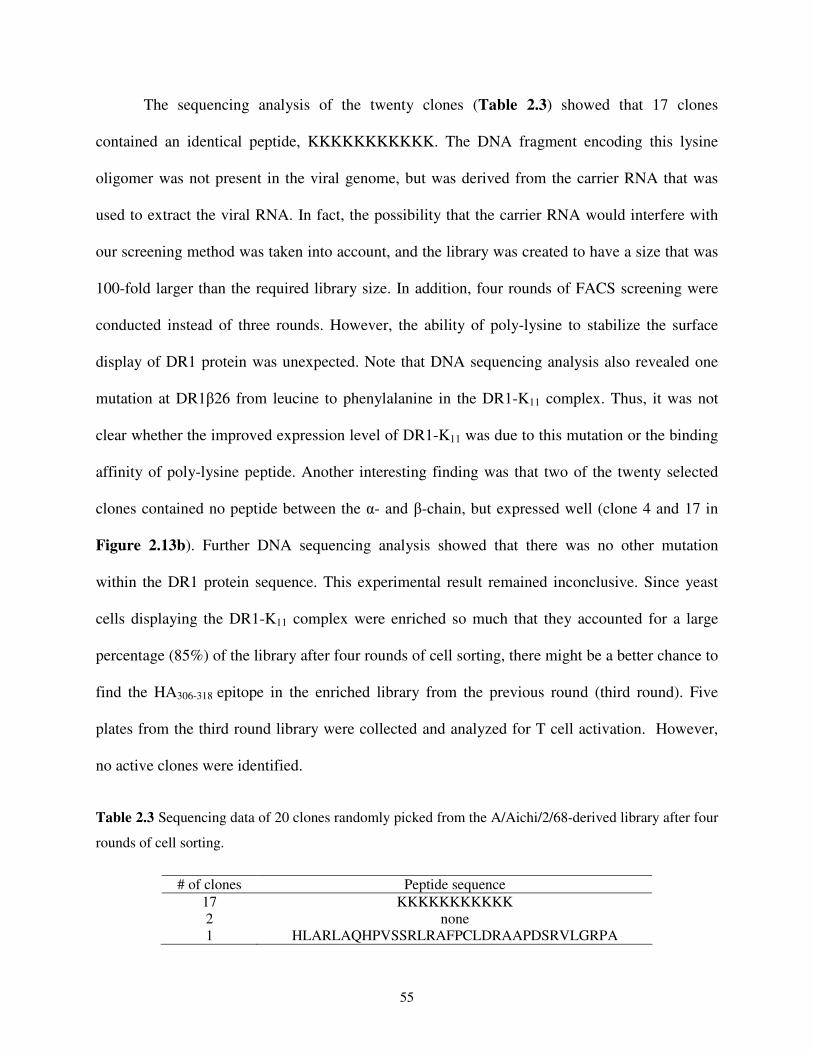
55
The sequencing analysis of the twenty clones (Table 2.3) showed that 17 clones
contained an identical peptide, KKKKKKKKKKK. The DNA fragment encoding this lysine
oligomer was not present in the viral genome, but was derived from the carrier RNA that was
used to extract the viral RNA. In fact, the possibility that the carrier RNA would interfere with
our screening method was taken into account, and the library was created to have a size that was
100-fold larger than the required library size. In addition, four rounds of FACS screening were
conducted instead of three rounds. However, the ability of poly-lysine to stabilize the surface
display of DR1 protein was unexpected. Note that DNA sequencing analysis also revealed one
mutation at DR1β26 from leucine to phenylalanine in the DR1-K11 complex. Thus, it was not
clear whether the improved expression level of DR1-K11 was due to this mutation or the binding
affinity of poly-lysine peptide. Another interesting finding was that two of the twenty selected
clones contained no peptide between the α- and β-chain, but expressed well (clone 4 and 17 in
Figure 2.13b). Further DNA sequencing analysis showed that there was no other mutation
within the DR1 protein sequence. This experimental result remained inconclusive. Since yeast
cells displaying the DR1-K11 complex were enriched so much that they accounted for a large
percentage (85%) of the library after four rounds of cell sorting, there might be a better chance to
find the HA306-318 epitope in the enriched library from the previous round (third round). Five
plates from the third round library were collected and analyzed for T cell activation. However,
no active clones were identified.
Table 2.3 Sequencing data of 20 clones randomly picked from the A/Aichi/2/68-derived library after four
rounds of cell sorting.
# of clones Peptide sequence
17 KKKKKKKKKKK
2 none
1 HLARLAQHPVSSRLRAFPCLDRAAPDSRVLGRPA

56
To avoid the carrier RNA contamination, the genomic RNA of the influenza A virus
strain X31/A/Aichi/68 was purchased and used as the template for random priming. The average
length of the peptides was determined to be ~14 amino acids. Following the procedures as
depicted in Figure 2.12, a library of ~1.9x10⁶ yeast clones displaying scDR1αpepβ complexes
was created. The genome size of influenza A virus is ~12kb, the library size required to have a
95% chance of being 100% complete is calculated to be ~3x10⁵ [40],
thus the library created had
~100% chance of being 100% complete. To probe the diversity of the peptides in the primary
library, twenty clones were randomly picked, sequenced, and mapped to the viral genome. There
was at least one peptide derived from each of the eight pieces of viral genomic RNA displayed in
either sense or anti-sense orientations (data not shown), indicating a good representation of the
whole viral genome.
After two rounds of FACS enrichment (Figure 2.14a, red line), four plates of yeast
clones (with no more than one cell per well) were collected and screened for their ability to
activate HA1.7 T cell hybridomas. Four clones (1G6, 2D12, 4H9, 5G9), representing ~1% of the
enriched library, activated T cell hybridomas (data not shown and Figure 2.14b). Compared to
yeast displaying scDR1αHAβ, the four identified clones showed comparable surface expression
level and reduced antigenicity by ~2-3 fold (Figure 2.14b and c). This might be due to the
reduced binding capacity engendered by the extra amino acids at the N- and/or C- terminus of
the HA306-318 peptide [42] (Figure 2.14d). Sequence alignment of the four peptides revealed a T
cell epitope, PKYVKQNTLKLATGMRN with the HA306-318 epitope sequence underlined, and a
T cell mimotope QYVKQNTLKLATGMRN that differed from the epitope by two residues:
proline at the P-2 position was absent and the lysine at the P-1 position was replaced with
glutamine (Figure 2.14d). The presence of the mimotope, not unexpectedly, was a result of an

57
open reading frame fusion at the junction of the vector-encoded and virus-encoded DNA regions
as described [43]. After two more rounds of FACS screening (top 0.5% population of sort 3,
Figure 2.14a, blue line), the active clone occurrence frequency was further improved to ~6%
(data not shown). Taken together, these results clearly suggested that the proposed method was
PE
Count
100 101 102 103 104
0
1000
2000
3000
4000
1°°°°library
Sort 1Sort 2
Sort 3
HA 1G6 2D12 4H9 5G9 L0
100
200
300
400
500
600
700
800
900
IL-2
pg
/mL
1G9 2D12 4H9 5G90.0
0.2
0.4
0.6
0.8
1.0
Rela
tive M
FU
no
rmalized
to
HA
a b
c d
Figure 2.14 Identification of HA306-318 epitope from the influenza X31/A/Aichi/68 virus genome-derived
peptide library. (a) FACS enrichment of potential good binders. LB3.1 antibody was used to stain cells as
a measurement of surface expression level of correctly folded peptide-DR1 complexes. Profiles of the
peptide library before and after enrichment are shown in black and colored lines, respectively. (b) T-cell
activation analysis of the four clones identified from the peptide library. (c) The four active clones
showed comparable surface expression levels as yeast displaying scDR1αHAβ. The relative MFU was
normalized to HA for direct comparison. (d) The peptide sequences from the four clones were aligned
with the HA306-318 epitope sequence. * = fully conserved residues, : = conservation of strong groups.

58
able to rapidly pinpoint a 17-residue CD4+ T cell epitope from the entire influenza A virus
genome [26], and it can be used to identify T cell epitopes from an unknown antigen.
2.3. Conclusions and Outlook
A simple and efficient approach was developed to identify CD4+ T cell epitopes from
both known and unknown antigens using surface engineered yeast cells for artificial antigen
presentation. By means of a new expression cloning method, a pathogen-derived peptide library
was displayed on yeast surface in the context of wild-type single-chain DR1 protein. The ability
of the recombinant yeast cells to distinguish the peptide binding affinity towards DR1 allowed
efficient enrichment of DR1-binding peptides using a DR-specific antibody, LB3.1, and the
epitope occurrence frequency was enriched to ~50% and ~6% of the resulting library for the
haemagglutinin- and influenza viral genome-derived peptide library, respectively. In the
subsequent T cell activity screening assay, the recombinant yeast cells can be used directly to
activate T hybridoma cells in a peptide specific manner, enabling the identification of the epitope.
This study represents the first demonstration that yeast surface peptide-MHCII display can be
used to identify T cell epitopes.
Compared to other existing methods [2], the approach described here is faster, simpler,
less reagent-intensive, and offers the following advantages. First, unlike other peptide libraries,
the expression cloning peptide library created in this study consists, in theory, all possible
peptides derived from a pathogen. Thus it allows direct identification of T cell epitopes, rather
than mimotopes that are less biological relevant to the natural TCRs. Second, the fragmentation
of pathogenic protein(s) is carried out at DNA level in vitro and these peptides are genetically
fused to yeast surface protein, therefore, no complex MHCII peptide processing and presentation
59
pathways are required for artificial antigen presentation, which is the major obstacle for
conventional expression cloning libraries [14, 43]. Third, the occurring frequency of the epitope
is greatly increased after enrichment by FACS, thus only a small number of yeast cells (100-200)
need to be examined for their ability to activate T cells, obviating the brute-force screening.
Finally, the surface engineered yeast cells can be used directly in the T cell activity assay, thus
obviating the use of professional APCs.
To achieve rapid and accurate identification of antigenic CD4+ T-cell epitopes, the two-
step screening method described in this chapter is necessary; because the peptide is covalently
attached to MHCII protein through flexible linkers, which might enable binding of MHCII
molecules with peptides that normally do not bind or bind weakly. And these “false-positive”
binders can be readily eliminated in the secondary screening step using T cells that bear TCRs
specific for the antigenic peptide. However, this method on its own is not sufficient for more
complex situations, such as epitope identification from unknown antigens using T cell lines, of
which the antigen specificity is not well defined. In this case, peptides that do not normally
activate T cells might also be selected from the library after two steps of screening, because the
local concentration of covalently attached peptides in the single-chain construct is much higher
than that found under normal physiological conditions. To address this issue, further examination
of the isolated peptides should be conducted by using conventional T cell function analysis,
which involves testing chemically synthesized peptides and using professional APCs.
Although the CD4+ T cell epitope identification method described above was
demonstrated with DR1 allele, the generality of this system was partially demonstrated by the
functional expression of another human MHCII allele, DR4 on yeast cell surface, which also
activated HA1.7 hybridoma T cells in a peptide specific manner (Figure 2.15).

60
b
no 1°
Anti-V5
Anti-DRα
PE
a no 1°
Anti-V5
Anti-DRα
PE
no 1°
Anti-V5
Anti-DRα
no 1°
Anti-V5
Anti-DRα
no 1°
Anti-V5
Anti-DRα
PE
a
0
20
40
60
80
DR4-CII DR4-HA DR1-HA PBS
IL-2
pg/m
L
Figure 2.15 Analysis of yeast cells displaying single-chain wild type DR4 in complex with different
binding peptides. (a) Flow cytometric analysis of single-chain DR4-HA306-318 expression level on yeast
surface. (b) Yeast displaying DR4-HA activated HA1.7 hybridomas in a peptide-specific manner.
Compared to DR1-HA complexes, DR4-HA elicited a much weaker response of HA1.7 hybridoma cells.
Nonetheless, since MHC proteins are highly polygenic and polymorphic, it might be
difficult to functionally display every target MHCII allele on yeast cell surface. Fortunately, this
limitation may be overcome by introduction of a few point mutations via directed evolution into
the target MHC protein [21, 22]. However, there may be concerns about the effect of the
introduced mutations on the biological activity of MHC molecules. Recently, one of the DR1
mutants identified earlier, which has a leucine to histidine mutation at position 11 of β-chain,
was analyzed [21]. It was found that this mutant actually elicited a much stronger T cell response
than the wild-type DR1 did (data not shown). This was probably a result of the increased surface
expression level of the mutant, which increased the ligand density for TCR recognition.
61
Therefore, it is possible that mutations could be introduced to only improve the solubility and/or
expression level of the MHC proteins, and leave their biological function intact.
Finally, although this method was demonstrated by identifying a viral epitope, it should
be generally applicable to identification of T cell epitopes from other systems, such as cancers
and autoimmune diseases. For such applications, the sensitivity of the yeast cells functioning as
aAPCs needs to be improved so that they could be used to stimulate T cell lines or primary T
cells, which are much more fastidious in their activation requirements than T hybridoma cells.
Therefore, the future work would be trying to include the co-stimulatory molecules and
accessory molecules in yeast, which have been shown to be important for activation of primary T
cells or T cell lines [13]. It should be noted that this yeast display system is amenable to
engineering by directed evolution approaches. As such, it provides a technology platform for
engineering the displayed MHC molecules for the development of various MHC-based reagents
for basic and applied biomedical research.
2.4. Materials and Methods
The sequences of the PCR primers were listed in Table 2.4 and were synthesized by
Integrated DNA Technologies (Coralville, IA). For PCR amplification, unless otherwise
specified, the reaction was performed in a 100 µL of mixture (25 µL was used for PCR check,
such as colony PCR or gene integration verification) consisting of 10 ng of DNA template, 1x
phusion buffer, 50 pmol of forward primer, 50 pmol of reverse primer, 0.25 mM (each) dNTPs,
and 2U of phusion DNA polymerase. The typical PCR program consisted of an initial
denaturation of 2 minutes at 98 °C, followed by 25-30 cycles of denaturation at 98 °C for 30
seconds, annealing at 55 °C for 30 seconds, and extension at 72 °C for 30 seconds per 1kb long

62
gene, and a final 10-minute elongation at 72 °C. All restriction enzymes were obtained from
New England Biolabs (Ipswich, MA). Unless otherwise indicated, all chemicals were purchased
from Sigma (St. Louis, MO). See Fei Wen Notebook 1, pp.18.
Table 2.4 Primers used in cloning and peptide library creation.
Name Sequence
α-5BX 5’GTACCAGGATCCAGTGTGGTGGAAAGGAAAGAAGAACATGTGATC3’
β-3XH 5’-CCCTCTAGACTCGAGCTTGCTCTGTGCAGATTCAGAC3’
pYD1For 5’-AGTAACGTTTGTCAGTAATTGC3’
NotIRev 5’TGCCAACTTCAGGGTGTTTTGCTTAACATACTTGGGGCGGCCGCCTCCTG
AGCCTCCACC3’
NotIFor 5’GCAAAACACCCTGAAGTTGGCAACAGGTACCGGTGGCTCACTAG3’
βRev73-67 5’GGCCCGCCTCTGCTCCAGGA3’
StfFor 5’GGAGGCGGCCGCTTT TTG GATGGAGGAATTCATATG3’
StfRev 5’CTCACTAGTCGGGAAGACGTACGGGGTATACATGT3’
AichiFor 5’ATTCGCGGCCGCATGAAGACCATCATTGCTTTGAGCTACATTTTC3’
AichiRev 5’CTAATAACTAGTAATGCAAATGTTGCACCTAATGTTGCCTCTCTG3’
2467For 5’GGCCGCCCCAAGTATAGAAAGATGAACGCACGAAAGTTGGCAACAGGT
ACCGGTGGCTCA3’
2467Rev 5’CTAGTGAGCCACCGGTACCTGTTGCCAACTTTCGTGCGTTCATCTTTCTAT
ACTTGGGGC3’
M4For 5’GGCCGCGGAGGTTATAGACAGATGTCAGCACCAACTTTGGGAGGCGGTA
CCGGTGGCTCA 3’
M4Rev 5’CTAGTGAGCCACCGGTACCGCCTCCCAAAGTTGGTGCTGACATCTGTCTA
TAACCTCCGC3’
YAKFor 5’GGCCGCGCCGCATATGCCGCAGCGGCTGCCGCAAAGGCTGCCGCAGGTA
CCGGTGGCTCA3’
YAKRev 5’CTAGTGAGCCACCGGTACCTGCGGCAGCCTTTGCGGCAGCCGCTGCGGC
ATATGCGGCGC3’
CIIFor 5’GGCCGCGCTGGGTTTAAGGGGGAACAGGGACCTAAAGGAGAGCCTGGT
ACCGGTGGCTCA3’
CIIRev 5’CTAGTGAGCCACCGGTACCAGGCTCTCCTTTAGGTCCCTGTTCCCCCTTA
AACCCAGCGC3’
PKAFor 5’GGCCGCCCCAAGGCTGTTAAGCAAAACACCCTGAAGTTGGCAACAGGTA
CCGGTGGCTCA3’
PKARev 5’CTAGTGAGCCACCGGTACCTGTTGCCAACTTCAGGGTGTTTTGCTTAACA
GCCTTGGGGC3’
LFor 5’GGCCGCGGAGGTGGAGGCTCCGGAGGTGGAGGCTCAGGAGGTGGAGGT
ACCGGTGGCTCA3’
LRev 5’CTAGTGAGCCACCGGTACCTCCACCTCCTGAGCCTCCACCTCCGGAGCCT
CCACCTCCGC 3’
MBPNotI 5’GGAGGCGGCCGCGAAAACCCGGTTGTTCACTTCTTCAAAAACATCGTTA
CCCCGCGTGGTACCGGTGGCTCACTAGTGA3’
63
2.4.1. Vector Construction
DNA encoding a single-chain polypeptide consisting of the α-chain of DR1, the peptide
HA306-318, and the β-chain of DR1 (Figure 2.1) was prepared by PCR amplification using primer
pairs α-5BX and β-3XH and plasmid pJ3/238 (a gift from M. Mage, NIH, Bethesda, MD) as a
template. The amplification product was cloned into pYD1 (Invitrogen, Carlsbad, CA) via BstXI
and XhoI to generate pYD1scαHAβ. To facilitate plasmid construction of different peptides, a
NotI restriction site was introduced by splicing overlapping extension PCR (SOE-PCR) [44] to
directly precede HA306-318 using primer pairs pYD1For/NotIRev and NotIFor/βRev73-67. The
SOE-PCR product was cotransformed with the BstXI/SpeI fragment of pYD1scαHAβ into
EBY100 strain (Invitrogen) to generate pYD1αHAβ. To eliminate the possibility that the epitope
HA306-318 identified from the peptide library was the undigested pYD1αHAβ, plasmid
pYD1αSTFβ was constructed. The stuffer DNA (STF) is an unrelated gene (~1 kb) amplified
from the phosphite dehydrogenase gene [39] using primers StfFor and StfRev. The PCR product
was cloned into pYD1 via BstXI and XhoI to generate plasmid pYD1αSTFβ. Plasmids
pYD1α2467β, pYD1αM4β, pYD1αYAKβ, pYD1αCIIβ, pYD1αPKAβ and pYD1αLβ were
generated in two steps. First, the double stranded DNA insert encoding the peptide was obtained
by hybridization of the sense and anti-sense oligonucleotides (Table 2.4) encoding the peptide.
Second, the resulting DNA insert was phosphorylated by Optikinase (USB, Cleveland, OH), and
ligated into the same restricted pYD1αSTFβ. Plasmid pYD1αMBPβ was generated in a slightly
different way: the insert was obtained by annealing, extension and digestion of a self-annealing
primer MBPNotI. All plasmids were transformed into chemical competent DH5α cells
(University of Illinois Biochemistry Department’s Media Preparation Facility, Urbana, IL),

64
recovered, and confirmed by DNA sequencing. See Fei Wen Notebook 1, pp.22, 26, 46, 80 and
Notebook 2, pp.16, 109-110.
2.4.2. Yeast Transformation
A single colony of EBY100 yeast strain was picked into 3 mL of YPAD (10 g/L yeast
extract, 20 g/L peptone, 20 g/L glucose) and incubated on a rotary shaker at 250 rpm and 30 °C
overnight. On the second day, the overnight culture was inoculated into 50 mL YPAD (this is
enough for 10 transformations, scale down proportionally for less transformations) to a final
OD600 of 0.2 and incubated at 200 rpm and 30 °C till OD600 reached at least 0.8. The cells were
washed once with 25 mL of sterile ddH2O, once with 1 mL of 0.1M LiAc, and then resuspended
in 400 µL of 0.1 M LiAc. 1 mL of ssDNA was boiled in a water bath for 5 min and chilled
immediately on ice. The transformation mixture was prepared as following: 240 µL of PEG
(50%w/v), 36 µL of 1 M LiAc, 50 µL of boiled ssDNA, 0.1-10 µg of plasmid DNA and sterile
ddH2O was add to a final volume of 360 µL. The mixture was mixed extensively by vigorous
vortexing, incubated at 42 °C for 40-60 minutes. The cells were spun down at 6000 rpm for 30
seconds and the transformation mixture was carefully removed. The cell pellet was resuspended
in 1 mL ddH2O gently with pipetting and 50-200 µL of the resuspension was plated on SD-CAA
(2 % dextrose, 0.67 % yeast nitrogen base, 1 % casamino acids) plate and incubated at 30 °C for
2-3 days. See Fei Wen Notebook1, pp. 35-38, 62-63.
2.4.3. DNA Sequencing
All DNA sequencing reactions were run following the protocols provided by the
Biotechnology Center Core DNA Sequencing Laboratory at the University of Illinois at Urbana-
Champaign (Urbana, IL). Specifically, ~100-200 ng of plasmid or gel-purified PCR product, 5.2
65
µL of 12.5% glycerol, 2 µL of 2.5 mM primer, 2 µL of 5x sequencing reaction buffer, and 1 µL
of BigDye V3.1 (Applied Biosystems, Foster City, CA) were added into a PCR tube and the final
reaction volume was adjusted to 13 µL with ddH2O. The reaction was carried out using MJ
Research PTC-200 thermocycler (Bio-Rad, Hercules, CA): 96 °C 2 min, 24 cycles of 96 °C 30
sec, 50 °C 15 sec and 60 °C 4 min. See Fei Wen Notebook 1, pp. 88.
2.4.4. Yeast Surface Display
S. cerevisiae EBY100 clones transformed with different plasmid constructs were grown
in SD-CAA at 30 ºC for ~20 h or till OD600 reached ~5. To induce AGA2 fusion protein
expression, yeast cells were washed twice (benchtop centrifuge at 6000 rpm for 1 min) with YPG
medium (10 g/L yeast extract, 20 g/L peptone, 20 g/L galactose), resuspended to an OD600 ~1.0
in YPG medium supplemented with 50 µg kanamycin in a glass tube and incubated on a rotary
shaker at 20 ºC and 250 rpm for ~48 hours. The induced yeast cells were stored at 4 ºC up to 4
months. See Fei Wen Notebook 1, pp. 98-99.
2.4.5. Flow Cytometry Analysis
For flow cytometric analysis, ~2.5×10⁶ cells were washed with phosphate buffered saline
(PBS) containing 0.5% bovine serum albumin (BSA) and incubated for 1 h at 4 ºC with the
primary antibody staining reagent at a 100-fold dilution rate. The antibodies used were LB3.1
(American Tissue Culture Collection (ATCC), Manassas, VA) and anti-V5 (Invitrogen). Cells
were washed with PBS containing 0.5% BSA and incubated for 1 h at 4 ºC with biotinylated
goat-anti-mouse (GAM) IgG (Rockland, Gilbertsville, PA) followed by streptavidin-
phycoerythrin (SA-PE) for 30 min at 4 ºC. After washing away unbound SA-PE, labeled yeast
cells were analyzed on a Coulter Epics XL flow cytometer at the Biotechnology Center of
66
University of Illinois at Urbana-Champaign (Urbana, IL). See Fei Wen Notebook 1, pp. 102.
2.4.6. Extraction of Aga2-DR1-peptide Complexes from Yeast Cell Surface
About 2.5 ×10⁸ yeast cells were incubated for 1-2 h with 1 mL of 5 mM TCEP-neutral in
PBS (EMD Biosciences, Inc. San Diego, CA) at 37 ºC and 200 rpm. The reaction mixture was
spun down at maximum speed for 5 minutes to remove the cells. The supernatant containing the
Aga2-DR1-peptide fusion protein was dialyzed against PBS at 4 ºC overnight with gentle mixing
and used for subsequent analysis. See Fei Wen Notebook 1, pp. 14, 139.
2.4.7. Thermostability Assay
The thermostability of the peptide-DR1 variants was monitored directly on the yeast cell
surface as described elsewhere [21]. Briefly, samples of 4x10⁶ yeast cells were incubated at
temperatures of 60, 70, 75, 80, 85, or 90 ºC for ten minutes. Immediately after the incubation
period, the samples were put on ice and protein denaturation was halted with ice-cold PBS
containing 0.5% BSA. Yeast cells were spun down and the fraction of folded DR1 protein was
determined by incubation with conformation-sensitive LB3.1 antibodies followed by
biotinylated-labeled GAM IgG and SA-PE as described in Section 2.4.5. For each construct,
three individual yeast clones were examined. Thermal denaturation curves were generated and
the T50 values (temperature at which half-maximal denaturation occurred) were calculated. See
Fei Wen Notebook 1, pp. 111, 135.
2.4.8. Western Blot
Protein standards, Powerpac 300 power supply, Mini-PROTEAN 3 assembly, sodium
dodecyl sulfate (SDS), and pre-cast 4-20% acrylamide gels were purchased from Bio-Rad
67
(Hercules, CA). 24 µL of concentrated protein sample extracted from yeast surface was mixed
with 6 µL of SDS-PAGE loading buffer (50% glycerol, 5% SDS, 10 mg bromophenol blue, 0.5
M Tris-HCl, 5mM EDTA, pH 6.8). Samples were denatured at 95 ºC for ten minutes, cooled to
4 ºC, and then loaded onto the gel in a Bio-Rad Mini-PROTEAN 3 assembly. Voltage was
supplied by a Bio-Rad Powerpac 300 at constant 120 V for 90 minutes. The proteins were then
transferred to a polyvinylidene fluoride (PVDF) membrane using the Mini Trans-Blot Cell and a
voltage of 100V for 1 hour. The PVDF membrane was then blocked with the blocking buffer
(3% non-fat milk in PBS) overnight. The primary antibody V5 was added to 15 mL of blocking
buffer at a 1:2500 dilution and the membrane was incubated at room temperature for ~1.5 hours.
The membrane was then washed with PBST (PBS with 0.05% TWEEN-20) 3-4 times over a
period of 10 minutes. A secondary antibody, alkaline phosphatase-conjugated GAM IgG
(GAMAP
), was added at a dilution of 1:4000 in 15 mL blocking buffer and the membrane was
incubated at room temperature for ~1 hour. The membrane was then washed extensively to
remove unbound GAMAP
IgG over a period of 20 minutes. The western blot substrate buffer was
added and the membrane to equilibrate for ~1 minute; and subsequently 330 µL of 10 mg/mL
nitro blue tetrazolium chloride (NBT) in dimethyl formamide and 175 µL of 10 mg/mL 5-bromo-
4-chloro-3’-indolyl-phosphate p-toluidine (BCIP) in dimethyl formamide were added to 10 mL
of substrate buffer. The membrane was then allowed to develop till the bands appear, after which
the NBT/BCIP reaction was stopped by rinsing with distilled water several times. See Fei Wen
Notebook 1, pp. 2, 155.
2.4.9. Library Construction
DNA encoding haemagglutinin was obtained by one-step RT-PCR using influenza
A/Aichi/2/68 viral RNA (a gift from Dr. R. Donis at CDC, Atlanta, GA) as the template and
68
AichiFor and AichiRev as primers. The PCR-amplified DNA encoding haemagglutinin was
fragmentized using DNaseI (0.075 U/µg DNA for 1 minute) as described elsewhere [45]. DNA
fragments with size between 30-60 bp were collected and purified from agarose gel, blunt-end
polished as described [46], and ligated into similarly prepared SpeI and NotI restricted
DR1αSTFβ vector. The ligation mixture was transformed into ElectroMax DH5α competent
cells (Invitrogen) and a library of 4.6×10⁵
clones was obtained. Plasmids were then recovered
and transformed into EBY100 and a library of 2.1×10⁶ clones was generated. After two passages
in the selection media, the library was induced for protein expression using YPG and subjected
to FACS. The difficulties in cloning small pieces of DNA include: (1) optimization of DNaseI
digestion step to have majority of the digested DNA fragments within a desired size range; (2)
intramolecular circularization, which results in high ligation background; (3) occurrence of
multiple inserts, which result in splicing peptides that are not present in the natural peptide
repertoire. Accordingly, when constructing the peptide library, it is important to (1) optimize
DNaseI concentration and digestion time; (2) dephosphorylate the vector and include 15%PEG
in the ligation mixture to promote intermolecular ligation over intramolecular circularization
[47]; (3) optimize insert to vector molar ratio. See Fei Wen Notebook 2, pp. 130, 189, 196, 202-
205, 233, 237, 240.
Genomic RNA purified from influenza virus X31/A/Aichi/68 (Charles River Laboratories,
Wilmington, MA) was used as the template for cDNA synthesis. First strand cDNA was
synthesized using a first stand cDNA synthesis kit following the manufacturer’s protocol for
random priming (Roche, Indianapolis, IN). DNA polymerase I (5 U / 20 µL reaction) and RNase
H (0.16 U / 20 µL reaction) were then used to synthesize double-stranded cDNA. The cDNA
encoding the antigenic protein/proteins was fragmented using DNase I (0.075 U/µg DNA for 1
69
minute) as described elsewhere [45]. DNA fragments with size between 30-60 bp were collected
and purified from agarose gel, blunt-end polished as described [46], and ligated into SpeI and
NotI restricted pYD1αSTFβ vector that was similarly blunt-end polished. The ligation mixture
was transformed into ElectroMax DH5α competent cells (Invitrogen, Carlsbad, CA) and a
library of 1.9×10⁶
clones was obtained. Plasmids were then recovered and transformed into
EBY100 and a library of 6.6×10⁶ clones was generated. After two passages in selection media,
the library was induced for protein expression using YPG and subjected to FACS. See Fei Wen
Notebook 3, pp. 76-78, 86, 89-90, 112, 119, 121.
2.4.10. FACS Analysis of Yeast Library
The library of yeast clones displaying DR1 in complex with different peptides derived
from haemagglutinin was enriched through three cycles of FACS. An aliquot of induced library
culture containing 7.4x10⁶ yeast cells was stained with LB3.1 followed by treatment with biotin-
conjugated GAM IgG and SA-PE as described in Section 2.4.5 and sorted by a Coulter 753
bench FACS (Flow Cytometry Facility, University of Illinois at Urbana-Champaign). About
1.3% of the population with the highest fluorescence was collected and recovered for the next
round of cell sorting. During the second and third round screening, the top 0.5% of the
population was collected from the previous sorted library. Cells from the top 0.05% population
of the enriched library were sorted into a 96-well plate. Ten of these cells were randomly picked
and analyzed individually for their ability to stimulate T cell hybridoma. DNA sequencing was
carried out to determine the sequence of the peptide insert. See Fei Wen Notebook 2, pp. 242-246,
249.
The library of yeast clones displaying DR1 in complex with different peptides derived

70
from the influenza A virus genome was enriched through two cycles of FACS. An aliquot of
induced library culture containing 108 yeast cells was stained with LB3.1 followed by treatment
with biotin-conjugated GAM IgG and SA-PE as described in Section 2.4.5 and sorted by a
Coulter 753 bench FACS at the Biotechnology Center of the University of Illinois (Urbana, IL).
About 1.5% of the population with the highest fluorescence was collected and recovered in the
first round of cell sorting. In the second round of cell sorting, cells from the top 0.5% of the
population were sorted into four 96-well plates and analyzed individually for their ability to
stimulate T-cell hybridoma. Two more rounds were carried out in the same manner. See Fei Wen
Notebook 3, pp. 122-130.
2.4.11. Stimulation of HA1.7 T Cell Hybridomas and IL-2 Detection
The HA1.7 hybridoma T cells [24] were used as an indicator cell line for productive
MHC-peptide-TCR interactions that produce IL-2 upon receptor engagement. They were
maintained in IMDM (Invitrogen) with 10% fetal bovine serum (FBS) at 37 ºC with 5% CO2.
About 106
yeast cells were washed once with 300 µL PBS, resuspended in 300 µL PBS and
loaded into each well of a 96-well tissue-culture plate. After incubation at 4 ºC overnight,
unattached yeast were washed off three times with 350 µL PBS. HA1.7 hybridoma cells were
added to wells (105 cells per well) and incubated for ~24 h at 37 ºC with 5% CO2. The
supernatant was tested for IL-2 production using a murine IL-2 ELISA kit (eBiosciences, San
Diego, CA). See Fei Wen Notebook 1, pp. 136-137,143.
In some experiments, soluble Aga2-DR1-peptide complexes released from yeast cell
surface were added into wells pre-coated with rabbit anti-V5 polyclonal antibodies and incubated
overnight at 4 ºC. The peptide-DR1 protein was immobilized onto the plate by binding to anti-

71
V5 antibodies adsorbed to the wells. 105 HA1.7 hybridoma cells in 300 µL of IMDM medium
were added into the each well and incubated for ~24 h at 37ºC with 5% CO2. The amount of
interleukin-2 (IL-2) produced by the hybridoma was quantified using a murine IL-2 detection
sandwich enzyme-linked immunosorbent assay kit (eBiosciences, San Diego, CA). See Fei Wen
Notebook 1, pp. 142-143.
2.5. References
1. Germain, R.N., MHC-dependent antigen processing and peptide presentation: providing
ligands for T lymphocyte activation. Cell, 1994. 76(2): p. 287-99.
2. Kwok, W.W. and G.T. Nepom, T-cell epitope mapping. Methods, 2003. 29(3): p. 211-2.
3. Stone, J.D., W.E. Demkowicz, and L.J. Stern, HLA-restricted epitope identification and
detection of functional T cell responses by using MHC-peptide and costimulatory
microarrays. Proc Natl Acad Sci USA, 2005. 102(10): p. 3744-9.
4. Rosenberg, S.A., Progress in human tumour immunology and immunotherapy. Nature, 2001.
411(6835): p. 380-4.
5. Oelke, M., et al., Ex vivo induction and expansion of antigen-specific cytotoxic T cells by
HLA-Ig-coated artificial antigen-presenting cells. Nat Med, 2003. 9(5): p. 619-24.
6. Walter, E.A., et al., Reconstitution of cellular immunity against cytomegalovirus in recipients
of allogeneic bone marrow by transfer of T-cell clones from the donor. N Engl J Med, 1995.
333(16): p. 1038-44.
7. Garcia, F., et al., Therapeutic immunization with dendritic cells loaded with heat-inactivated
autologous HIV-1 in patients with chronic HIV-1 infection. J Infect Dis, 2005. 191(10): p.
1680-5.
8. Lu, W., et al., Therapeutic dendritic-cell vaccine for chronic HIV-1 infection. Nat Med, 2004.
10(12): p. 1359-65.

72
9. Cosson, P. and J.S. Bonifacino, Role of transmembrane domain interactions in the assembly
of class II MHC molecules. Science, 1992. 258(5082): p. 659-62.
10. Stern, L.J. and D.C. Wiley, The human class II MHC protein HLA-DR1 assembles as empty
alpha beta heterodimers in the absence of antigenic peptide. Cell, 1992. 68(3): p. 465-77.
11. Ljunggren, H.G., et al., Empty MHC class I molecules come out in the cold. Nature, 1990.
346(6283): p. 476-80.
12. Townsend, A., et al., Assembly of MHC class I molecules analyzed in vitro. Cell, 1990.
62(2): p. 285-95.
13. Kim, J.V., et al., The ABCs of artificial antigen presentation. Nat Biotechnol, 2004. 22(4): p.
403-10.
14. Wang, R.F., et al., Cloning genes encoding MHC class II-restricted antigens: mutated
CDC27 as a tumor antigen. Science, 1999. 284(5418): p. 1351-4.
15. Li, M., Applications of display technology in protein analysis. Nat Biotechnol, 2000. 18(12):
p. 1251-6.
16. Chao, G., et al., Isolating and engineering human antibodies using yeast surface display.
Nature Protocols, 2006. 1(2): p. 755-68.
17. Boder, E.T. and K.D. Wittrup, Yeast surface display for screening combinatorial polypeptide
libraries. Nat Biotechnol, 1997. 15(6): p. 553-7.
18. Wen, F., S. Rubin-Pitel, and H. Zhao, Engineering of Therapeutic Proteins, in Protein
Engineering and Design, S. Park and J. Cochran, Editors. 2009, CRC Press, Taylor &
Francis Group: Florida. p. 153-77.
19. Brophy, S.E., P.D. Holler, and D.M. Kranz, A yeast display system for engineering functional
peptide-MHC complexes. J Immunol Methods, 2003. 272(1-2): p. 235-46.
20. Jones, L.L., et al., Engineering and characterization of a stabilized alpha1/alpha2 module of
the class I major histocompatibility complex product Ld. J Biol Chem, 2006. 281(35): p.
25734-44.
73
21. Esteban, O. and H. Zhao, Directed evolution of soluble single-chain human class II MHC
molecules. J Mol Biol, 2004. 340(1): p. 81-95.
22. Starwalt, S.E., et al., Directed evolution of a single-chain class II MHC product by yeast
display. Protein Eng, 2003. 16(2): p. 147-56.
23. Boder, E.T., et al., Yeast surface display of a noncovalent MHC class II heterodimer
complexed with antigenic peptide. Biotechnol Bioeng, 2005. 92(4): p. 485-91.
24. Boen, E., et al., Identification of T cell ligands in a library of peptides covalently attached to
HLA-DR4. J Immunol, 2000. 165(4): p. 2040-7.
25. Shusta, E.V., et al., Yeast polypeptide fusion surface display levels predict thermal stability
and soluble secretion efficiency. J Mol Biol, 1999. 292(5): p. 949-56.
26. Wen, F., O. Esteban, and H. Zhao, Rapid identification of CD4+ T-cell epitopes using yeast
displaying pathogen-derived peptide library. J Immunol Methods, 2008. 336(1): p. 37-44.
27. Boder, E.T., K.S. Midelfort, and K.D. Wittrup, Directed evolution of antibody fragments with
monovalent femtomolar antigen-binding affinity. Proc Natl Acad Sci U S A, 2000. 97(20): p.
10701-5.
28. Kurokawa, M.S., et al., Expression of MHC class I molecules together with antigenic
peptides on filamentous phages. Immunol Lett, 2002. 80(3): p. 163-8.
29. Le Doussal, J., et al., Phage display of peptide/major histocompatibility complex. J Immunol
Methods, 2000. 241(1-2): p. 147-58.
30. Germain, R.N. and A.G. Rinker, Jr., Peptide binding inhibits protein aggregation of
invariant-chain free class II dimers and promotes surface expression of occupied molecules.
Nature, 1993. 363(6431): p. 725-8.
31. Arimilli, S., et al., Peptide binding inhibits aggregation of soluble MHC class II in solution.
IUBMB Life, 1999. 48(5): p. 483-91.
32. Kropshofer, H., et al., Editing of the HLA-DR-peptide repertoire by HLA-DM. Embo J, 1996.
15(22): p. 6144-54.
74
33. Vogt, A.B., et al., Kinetic analysis of peptide loading onto HLA-DR molecules mediated by
HLA-DM. Proc Natl Acad Sci U S A, 1996. 93(18): p. 9724-9.
34. Van Der Bruggen, P., et al., Tumor-specific shared antigenic peptides recognized by human
T cells. Immunol Rev, 2002. 188: p. 51-64.
35. Bian, H., J.F. Reidhaar-Olson, and J. Hammer, The use of bioinformatics for identifying class
II-restricted T-cell epitopes. Methods, 2003. 29(3): p. 299-309.
36. Invitrogen and MolecularProbes, The Handbook-A guide to fluorescent probes and labeling
technologies. Section 2.1.
37. Grakoui, A., et al., The immunological synapse: a molecular machine controlling T cell
activation. Science, 1999. 285(5425): p. 221-7.
38. Skehel, J.J. and D.C. Wiley, Receptor binding and membrane fusion in virus entry: the
influenza hemagglutinin. Annu Rev Biochem, 2000. 69: p. 531-69.
39. Woodyer, R., W.A. van der Donk, and H. Zhao, Relaxing the nicotinamide cofactor
specificity of phosphite dehydrogenase by rational design. Biochemistry, 2003. 42(40): p.
11604-14.
40. Patrick, W.M., A.E. Firth, and J.M. Blackburn, User-friendly algorithms for estimating
completeness and diversity in randomized protein-encoding libraries. Protein Eng, 2003.
16(6): p. 451-7.
41. Lamb, R.A. and P.W. Choppin, The gene structure and replication of influenza virus. Annu
Rev Biochem, 1983. 52: p. 467-506.
42. O'Sullivan, D., et al., Truncation analysis of several DR binding epitopes. J Immunol, 1991.
146(4): p. 1240-6.
43. Koelle, D.M., Expression cloning for the discovery of viral antigens and epitopes recognized
by T cells. Methods, 2003. 29(3): p. 213-26.
44. Horton, R.M., et al., Gene splicing by overlap extension: tailor-made genes using the
polymerase chain reaction. Biotechniques, 1990. 8(5): p. 528-35.

75
45. Zhao, H. and F.H. Arnold, Optimization of DNA shuffling for high fidelity recombination.
Nucleic Acids Res, 1997. 25(6): p. 1307-8.
46. Margulies, M., et al., Genome sequencing in microfabricated high-density picolitre reactors.
Nature, 2005. 437(7057): p. 376-80.
47. Upcroft, P. and A. Healey, Rapid and efficient method for cloning of blunt-ended DNA
fragments. Gene, 1987. 51(1): p. 69-75.

76
Chapter 3. In vitro Evolution of pMHC Complexes with High
Affinity toward TCRs Using Cell Surface Display
3.1. Introduction
Identification and quantitative analysis of antigen-specific T cell populations is important
in studying T cell behavior, cellular immune responses, and immune memory development [1-3].
Until recently, these analyses were possible only based on T cell functions, such as proliferation,
cytotoxicity, and cytokine secretion [1]. These function-based assays have several limitations.
First, they require in vitro stimulation of T cells, thus significantly alter the T cell differentiation
status making them not suitable for downstream experiments [4]. Second, they generate varying
results between experimental runs, and probably underestimate the true number of antigen-
specific T cells [1]. Third, they are carried out in vitro, thus not applicable for studying T cell
behavior in the native environment. To address these issues, a structure-based assay, in which T
cells are directly identified by virtue of their antigen-binding specificity, has been developed
− pMHC tetramer staining.
Due to the natural low affinity (typically in a range of 1-100 µM) between TCR and its
pMHC ligand [5], a pMHC monomer cannot be used as a staining reagent to detect antigen-
specific T cells. The pMHC tetramer staining technology overcame this obstacle by using
multimerized pMHC molecules (normally in the form of tetramers), which bind T cells stably as
a result of multivalent interactions [6]. More importantly, multimerization of biotinylated pMHC
monomers using fluorescently labeled streptavidin allows the use of high throughput flow
cytometry for fast and accurate T cell isolation and phenotype analysis. Since the development
in 1996, the use of pMHC tetramers has enabled direct detection [6] and identification [7] of

77
antigen-specific T cells, modulation of T cell responses in vivo to treat graft rejection [8] and
autoimmune diseases [9], and detailed monitoring of cellular immune responses induced by
immunotherapy, which is critical for a better understanding of tumor immunology and
improving immune-based therapies [10].
Although the development of the pMHC tetramer staining technology has revolutionized
the field of T cell research, it has some drawbacks. First, it has been reported that the binding
avidity of the pMHC tetramer is directly proportional to the binding affinity of the pMHC
monomer [11], therefore, there exists a lower limit of the TCR affinity that can be detected by
using pMHC tetramers. In addition, compared to MHCI restricted CD8+ T cells, MHCII
restricted CD4+ T cells occur at a much lower frequency and bind pMHCII tetramers with a
lower avidity, making the detection of CD4+ T cells even more difficult [12]. Second, the
production of MHC monomers using recombinant techniques has been proven to be difficult,
especially in the case of MHCII proteins [12]. Third, the preparation of the pMHC tetramer
involves multiple protein purification and modification steps, making the process time-
consuming and labor-intensive. To address the limitations associated with the pMHC tetramer
staining technology, the goal of this project is to engineer pMHC monomers with high TCR-
binding affinity so that the resulting pMHC mutants can be used directly for T cell staining
without being tetramerized. In addition, the pMHC tetramer made of the resulting mutants
should in theory exhibit higher avidity for target TCRs, thus improve the T cell detection
sensitivity.
In this chapter, we report the results of pMHC affinity engineering using two different
cell surface display systems: yeast surface display (Section 3.2.1-3.2.3) and insect cell surface
display (Section 3.2.4-3.2.7). Using the yeast surface display system, the pMHC complexes

78
failed to show any TCR-tetramer-binding, indicating that this system was not suitable for
engineering pMHC with improved TCR-binding affinity. In contrast, pMHC complexes
displayed on insect cell surface showed specific and peptide-dependent TCR-tetramer-binding.
Coupled with directed evolution and fluorescence-activated cell sorting (FACS), a library of
pMHC complexes was created and screened using R-Phycoerythrin (PE)-labeled TCR tetramers.
After one round of cell sorting, potential variants with improved TCR-binding affinity have been
enriched.
3.2. Results and Discussion
3.2.1. Cloning, Expression, and Purification of DR1-HA-specific TCR
To engineer pMHC complexes with high TCR-binding affinity, their specific TCR
tetramers are required for library screening due to the unstable interaction between pMHC and
TCR monomers as described above. With the successful functional display of single-chain wild-
type DR1-HA306-318 protein on yeast surface, we sought to produce the HA1.7 TCR specific for
DR1-HA complex. An initial attempt to produce single-chain HA1.7 TCR with a C-terminal
fusion of a human constant kappa domain (huCκ) and co-expression of a chaperon skp [13] did
not yield any soluble TCR expression in E. coli. This result indicated the limited applicability of
the reported expression system. Therefore, the baculovirus-insect expression system was chosen
next since it has been successfully used to produce a wide range of complex proteins, including
TCRs [14-17].
HA1.7 TCR extracellular α- and β-chain encoding genes [18] with a BirA tag fused to
the C-terminus of β-chain were expressed under the control of ph and p10 promoters,
respectively. TCR protein expression using baculovirus infected Sf9 insect cells was analyzed by

79
ELISA. A set of four monoclonal antibodies (mAbs) raised against different epitopes of the
natural membrane-anchored receptor was used: H28-710 and ADO-304 that are specific for two
different epitopes in murine constant α-chain [15, 19], H57-597 that specifically binds the FG-
loop of murine constant β-chain [20], and a clonotypic mAb specific to the variable region of
human β3 TCR [21]. As shown in Figure 3.1, the soluble TCR reacted with all four mAbs,
indicating a successful expression of HA1.7 TCR.
0
0.05
0.1
0.15
0.2
0.25
0.3
0.35
H28-710 ADO-304 H57-597 anti-Vββββ3.1
A6
50
0
0.05
0.1
0.15
0.2
0.25
0.3
0.35
H28-710 ADO-304 H57-597 anti-Vββββ3.1
A6
50
Figure 3.1 ELISA analysis of HA1.7 TCR expression. Four monoclonal antibodies, H28-710, ADO-304,
H57-597, and anti-Vβ3.1 were used in the assay. The supernatant absorbance of insect cells infected with
baculovirus containing empty bacmid was normalized to zero.
After optimizing the infection and protein expression conditions, the HA1.7 TCR was
purified from 1 L of cell culture supernatant using H57-597-coupled sepharose beads.
Unfortunately, the TCR expression level was too low to be detected by SDS-PAGE and resulted
in contamination of H57-597 mAb in the eluate (data not shown). To further improve the protein
expression level, a different insect cell line High Five, which has been reported to have ~5-10
fold higher secreted expression level than Sf9 cells [22], was used. By using a lower expression
temperature of 19 °C, the TCR expression level was improved by ~7-fold (data not shown), but
it still required a large scale protein expression to obtain enough TCR for tetramer preparation.
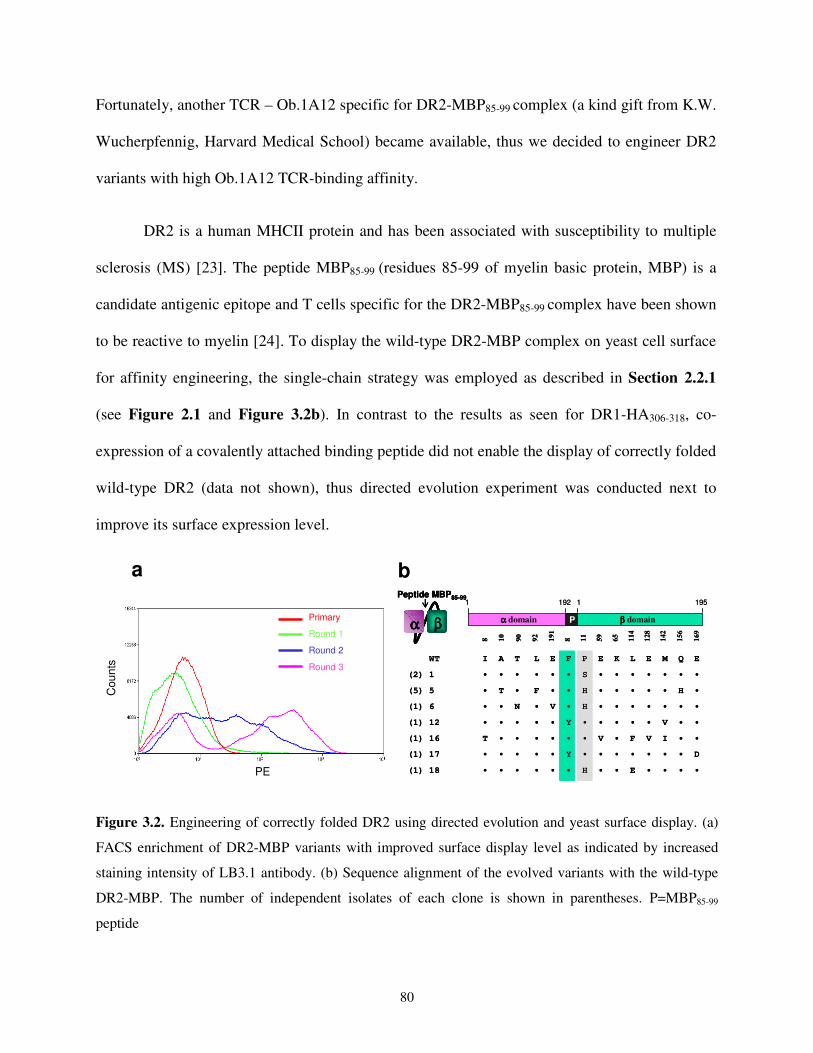
80
Fortunately, another TCR – Ob.1A12 specific for DR2-MBP85-99 complex (a kind gift from K.W.
Wucherpfennig, Harvard Medical School) became available, thus we decided to engineer DR2
variants with high Ob.1A12 TCR-binding affinity.
DR2 is a human MHCII protein and has been associated with susceptibility to multiple
sclerosis (MS) [23]. The peptide MBP85-99 (residues 85-99 of myelin basic protein, MBP) is a
candidate antigenic epitope and T cells specific for the DR2-MBP85-99 complex have been shown
to be reactive to myelin [24]. To display the wild-type DR2-MBP complex on yeast cell surface
for affinity engineering, the single-chain strategy was employed as described in Section 2.2.1
(see Figure 2.1 and Figure 3.2b). In contrast to the results as seen for DR1-HA306-318, co-
expression of a covalently attached binding peptide did not enable the display of correctly folded
wild-type DR2 (data not shown), thus directed evolution experiment was conducted next to
improve its surface expression level.
Primary
Round 1
Round 2
Round 3
1 192 1 195
ββββ domainαααα domain P
8
10
90
92
191
8 11
59
65
114
128
142
156
169
Peptide MBP85-99
αααα ββββ
WTWT I A T L E F P E K L E M Q E
(2) 1 • • • • • • S • • • • • • •
(5) 5 • T • F • • H • • • • • H •
(1) 6 • • N • V • H • • • • • • •
(1) 12 • • • • • Y • • • • • V • •
(1) 16 T • • • • • • V • F V I • •
(1) 17 • • • • • Y • • • • • • • D
(1) 18 • • • • • • H • • E • • • •
1 192 1 195
ββββ domainαααα domain P
8
10
90
92
191
8 11
59
65
114
128
142
156
169
Peptide MBP85-99
αααα ββββ
Peptide MBP85-99
αααα ββββαααα ββββ
WTWT I A T L E F P E K L E M Q E
(2) 1 • • • • • • S • • • • • • •
(5) 5 • T • F • • H • • • • • H •
(1) 6 • • N • V • H • • • • • • •
(1) 12 • • • • • Y • • • • • V • •
(1) 16 T • • • • • • V • F V I • •
(1) 17 • • • • • Y • • • • • • • D
(1) 18 • • • • • • H • • E • • • •
a b
PE
Cou
nts
Figure 3.2. Engineering of correctly folded DR2 using directed evolution and yeast surface display. (a)
FACS enrichment of DR2-MBP variants with improved surface display level as indicated by increased
staining intensity of LB3.1 antibody. (b) Sequence alignment of the evolved variants with the wild-type
DR2-MBP. The number of independent isolates of each clone is shown in parentheses. P=MBP85-99
peptide
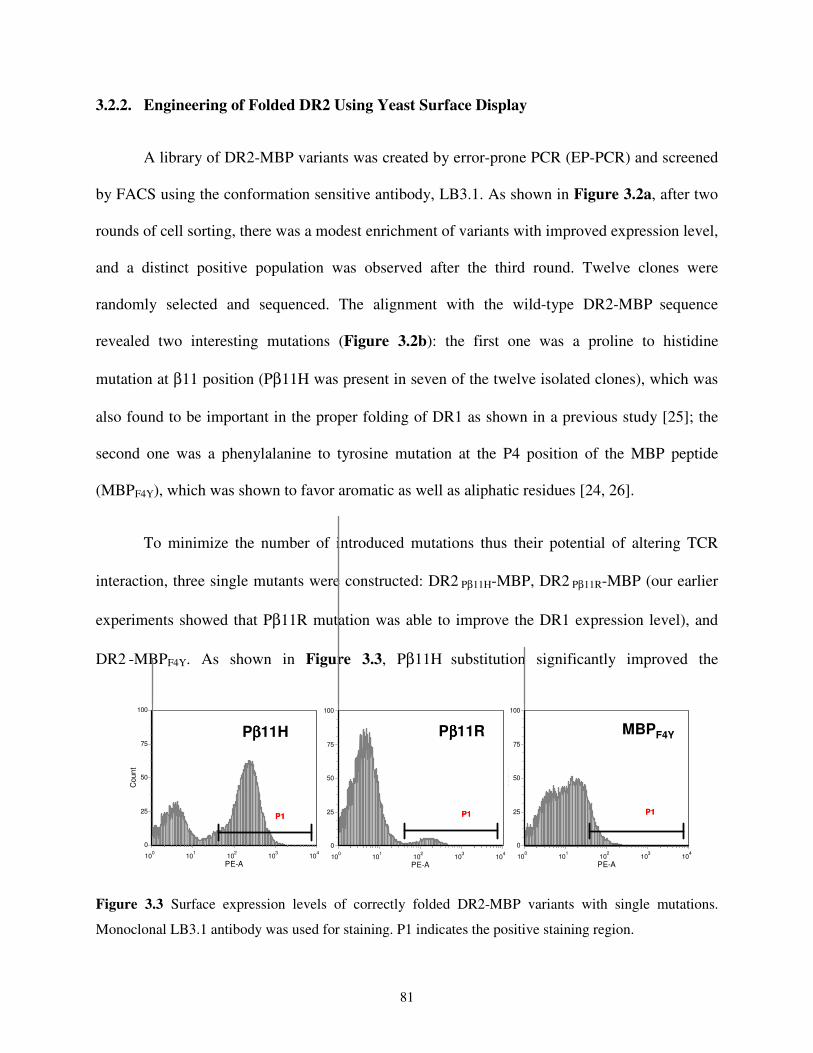
81
3.2.2. Engineering of Folded DR2 Using Yeast Surface Display
A library of DR2-MBP variants was created by error-prone PCR (EP-PCR) and screened
by FACS using the conformation sensitive antibody, LB3.1. As shown in Figure 3.2a, after two
rounds of cell sorting, there was a modest enrichment of variants with improved expression level,
and a distinct positive population was observed after the third round. Twelve clones were
randomly selected and sequenced. The alignment with the wild-type DR2-MBP sequence
revealed two interesting mutations (Figure 3.2b): the first one was a proline to histidine
mutation at β11 position (Pβ11H was present in seven of the twelve isolated clones), which was
also found to be important in the proper folding of DR1 as shown in a previous study [25]; the
second one was a phenylalanine to tyrosine mutation at the P4 position of the MBP peptide
(MBPF4Y), which was shown to favor aromatic as well as aliphatic residues [24, 26].
To minimize the number of introduced mutations thus their potential of altering TCR
interaction, three single mutants were constructed: DR2 Pβ11H-MBP, DR2 Pβ11R-MBP (our earlier
experiments showed that Pβ11R mutation was able to improve the DR1 expression level), and
DR2 -MBPF4Y. As shown in Figure 3.3, Pβ11H substitution significantly improved the
PE-A
Co
unt
100
101
102
103
104
0
25
50
75
100
P1P1
PE-A
Coun
t
100
101
102
103
104
0
25
50
75
100
P1P1
PE-A
Coun
t
100
101
102
103
104
0
25
50
75
100
P1P1
Pββββ11H Pββββ11R MBPF4Y
PE-A
Co
unt
100
101
102
103
104
0
25
50
75
100
P1P1
PE-A
Coun
t
100
101
102
103
104
0
25
50
75
100
P1P1
PE-A
Coun
t
100
101
102
103
104
0
25
50
75
100
P1P1
Pββββ11H Pββββ11R MBPF4Y
Figure 3.3 Surface expression levels of correctly folded DR2-MBP variants with single mutations.
Monoclonal LB3.1 antibody was used for staining. P1 indicates the positive staining region.
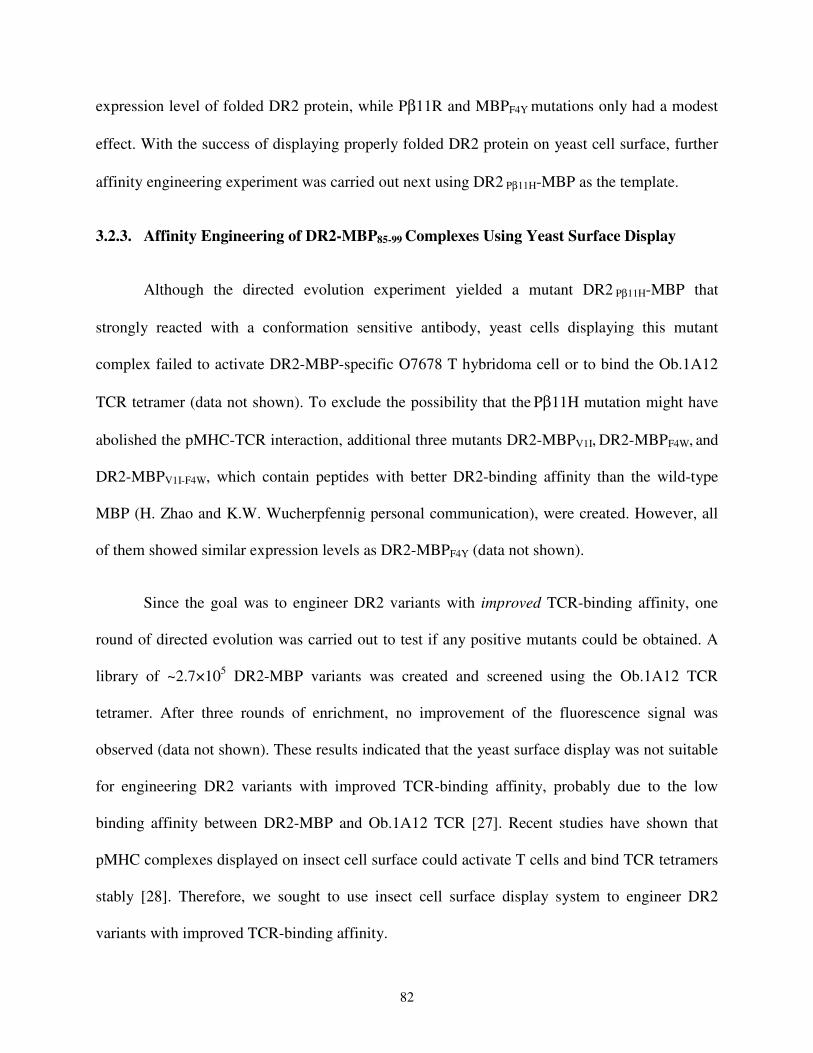
82
expression level of folded DR2 protein, while Pβ11R and MBPF4Y mutations only had a modest
effect. With the success of displaying properly folded DR2 protein on yeast cell surface, further
affinity engineering experiment was carried out next using DR2 Pβ11H-MBP as the template.
3.2.3. Affinity Engineering of DR2-MBP85-99 Complexes Using Yeast Surface Display
Although the directed evolution experiment yielded a mutant DR2 Pβ11H-MBP that
strongly reacted with a conformation sensitive antibody, yeast cells displaying this mutant
complex failed to activate DR2-MBP-specific O7678 T hybridoma cell or to bind the Ob.1A12
TCR tetramer (data not shown). To exclude the possibility that the Pβ11H mutation might have
abolished the pMHC-TCR interaction, additional three mutants DR2-MBPV1I, DR2-MBPF4W, and
DR2-MBPV1I-F4W, which contain peptides with better DR2-binding affinity than the wild-type
MBP (H. Zhao and K.W. Wucherpfennig personal communication), were created. However, all
of them showed similar expression levels as DR2-MBPF4Y (data not shown).
Since the goal was to engineer DR2 variants with improved TCR-binding affinity, one
round of directed evolution was carried out to test if any positive mutants could be obtained. A
library of ~2.7×10⁵ DR2-MBP variants was created and screened using the Ob.1A12 TCR
tetramer. After three rounds of enrichment, no improvement of the fluorescence signal was
observed (data not shown). These results indicated that the yeast surface display was not suitable
for engineering DR2 variants with improved TCR-binding affinity, probably due to the low
binding affinity between DR2-MBP and Ob.1A12 TCR [27]. Recent studies have shown that
pMHC complexes displayed on insect cell surface could activate T cells and bind TCR tetramers
stably [28]. Therefore, we sought to use insect cell surface display system to engineer DR2
variants with improved TCR-binding affinity.
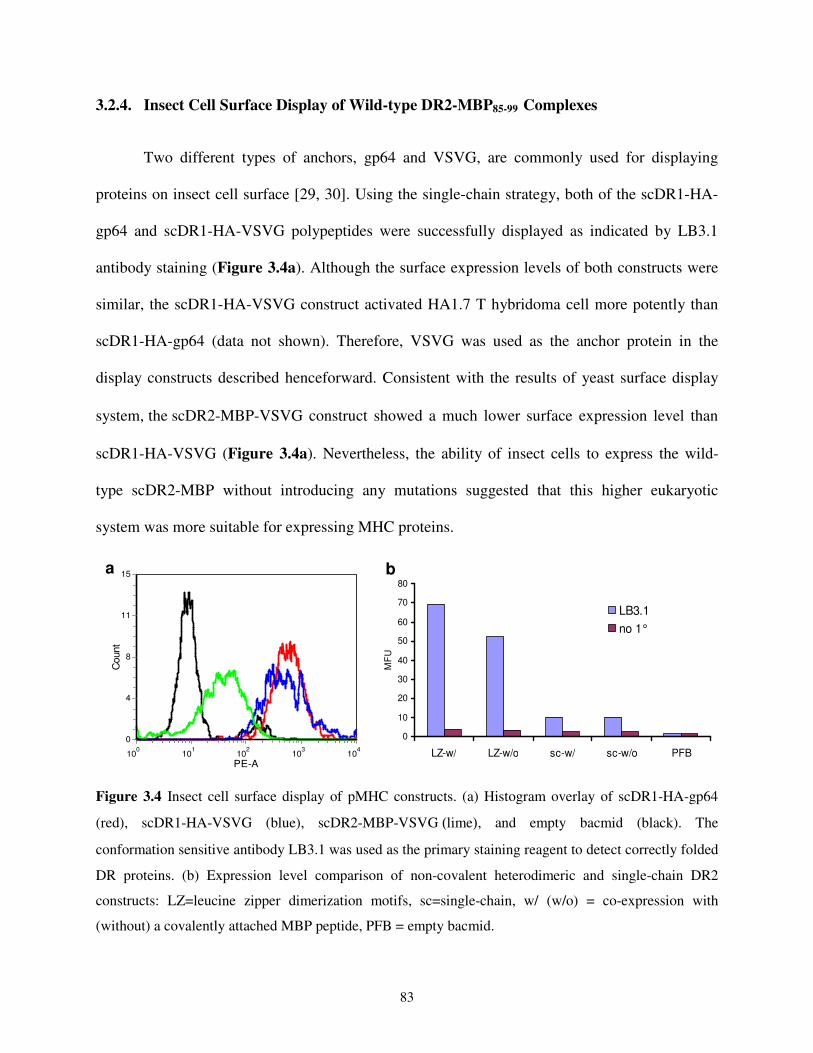
83
3.2.4. Insect Cell Surface Display of Wild-type DR2-MBP85-99 Complexes
Two different types of anchors, gp64 and VSVG, are commonly used for displaying
proteins on insect cell surface [29, 30]. Using the single-chain strategy, both of the scDR1-HA-
gp64 and scDR1-HA-VSVG polypeptides were successfully displayed as indicated by LB3.1
antibody staining (Figure 3.4a). Although the surface expression levels of both constructs were
similar, the scDR1-HA-VSVG construct activated HA1.7 T hybridoma cell more potently than
scDR1-HA-gp64 (data not shown). Therefore, VSVG was used as the anchor protein in the
display constructs described henceforward. Consistent with the results of yeast surface display
system, the scDR2-MBP-VSVG construct showed a much lower surface expression level than
scDR1-HA-VSVG (Figure 3.4a). Nevertheless, the ability of insect cells to express the wild-
type scDR2-MBP without introducing any mutations suggested that this higher eukaryotic
system was more suitable for expressing MHC proteins.
0
10
20
30
40
50
60
70
80
LZ-w/ LZ-w/o sc-w/ sc-w/o PFB
MF
U
LB3.1
no 1°
PE-A
Count
100
101
102
103
104
0
4
8
11
15a b
Figure 3.4 Insect cell surface display of pMHC constructs. (a) Histogram overlay of scDR1-HA-gp64
(red), scDR1-HA-VSVG (blue), scDR2-MBP-VSVG (lime), and empty bacmid (black). The
conformation sensitive antibody LB3.1 was used as the primary staining reagent to detect correctly folded
DR proteins. (b) Expression level comparison of non-covalent heterodimeric and single-chain DR2
constructs: LZ=leucine zipper dimerization motifs, sc=single-chain, w/ (w/o) = co-expression with
(without) a covalently attached MBP peptide, PFB = empty bacmid.

84
To improve the surface expression level of the DR2-MBP complex, the leucine zipper
dimerization motifs from transcription factors Fos and Jun [31] were fused to the C-terminus of
DR2α- and DR2β-chain, respectively. The DR2α-Fos and DR2β-Jun-VSVG (with or without a
MBP85-99 peptide covalently attached to the N-terminus of DR2β−chain) constructs were co-
expressed in insect cells under the control of ph and p10 promoters, respectively. As shown in
Figure 3.4b, the leucine zipper dimerization motifs significantly improved the surface display
level of properly assembled DR2 heterodimers compared to single-chain constructs. In addition,
the presence of a covalently attached MBP85-99 peptide further increased the DR2 heterodimer
expression, consistent with the stabilizing effect of a binding peptide observed in our previous
study ([25, 32] and Chapter 2).
3.2.5. Functional Analysis of the DR2-MBP85-99 Complexes Displayed on Insect Cell
Surface
To test the function of the insect cell surface displayed DR2 protein, T cell activation
analysis using DR2-MBP-specific O7678 T hybridoma cells was conducted by incubating insect
cells directly with hybridomas. As shown in Figure 3.5, the empty DR2 (LZ-DR2) heterodimer
was capable of binding MBP85-99 peptide and induced IL-2 secretion by O7678 cells in a peptide-
dependent manner. The DR2 heterodimer with a covalently linked MBP85-99 peptide (LZ-DR2-
MBP) also activated O7678 cells, but to a lesser extent. Surprisingly, although the expression
levels of the leucine zipper DR2 constructs were much higher than those of single-chain DR2
constructs, their IL-2 induction levels were only ~2-fold higher than those induced by single-
chain constructs (data not shown). This result may indicate that the T cell activation threshold
that provides maximal sensitivity is at low antigen levels [33]. Taken together, these data clearly
85
suggested that both the empty DR2 and DR2-MBP complex displayed on the insect cell surface
were functional. To avoid in vitro peptide loading, the LZ-DR2-MBP construct was used in the
following TCR staining assay and affinity engineering.
0
0.02
0.04
0.06
0.08
0.1
0.12
0.14
0.16
0.18
1 2 3O
D0
0.02
0.04
0.06
0.08
0.1
0.12
0.14
0.16
0.18
1 2 3 4 5
A6
50
54321
--+-+MBP
+--++Sf9
-++++O7678
54321
--+-+MBP
+--++Sf9
-++++O7678
321
+-+
-++
321
+-+
-++
07678 activation by LZ-DR2 O7678 activation by LZ-DR2-MBP
Figure 3.5 Functional analysis of insect cell surface displayed non-covalent DR2 heterodimers. The DR2-
MBP-specific O7678 T hybridoma cells were incubated with Sf9 insect cells displaying DR2 with LZ-
DR2-MBP or without LZ-DR2)-MBP85-99 peptide covalently attached. The activation was indicated by IL-
2 secretion in the supernatant monitored using ELISA at 650 nm.
3.2.6. Detection of Insect Cell Surface Displayed DR2-MBP85-99 Complexes with Specific
TCR Tetramers
With the success of displaying a functional wild-type DR2-MBP85-99 complex on insect
cell surface, its ability to bind the specific Ob.1A12 TCR tetramer was tested next. Insect cells
displaying single-chain DR1-HA306-318 complexes (scDR1-HA) and empty DR2 heterodimers
(LZ-DR2), both of which showed similar DR display levels as LZ-DR2-MBP (Figure 3.6a),
were used as negative controls. As shown in Figure 3.6b, PE-labeled Ob.1A12 TCR tetramers
bound to insect cells displaying LZ-DR2-MBP, but not to the negative control cells. The

86
fluorescent staining signal-to-noise ratio was ~4 (Figure 3.6c). Such low level of staining was
expected based on the reported Biacore study with purified Ob.1A12 TCR and DR2-MBP [27].
After optimizing the staining conditions, the signal-to-noise ratio was improved to ~12 (data not
shown) using 25 µg/mL TCR tetramer and incubation temperature of 27 °C. These results
0
5
10
15
20
25
DR1-HA DR2-MBP DR2 PFB
MF
U
SA:PE:Ob.1A12
SA:PE
PE-A
Count
100 101 102 103 104
0
21
43
64
85
scDR1-HA
LZ-DR2-MBP
LZ-DR2
Bacmid
PE-A
Count
100 101 102 103 104
0
21
43
64
85
scDR1-HA
LZ-DR2-MBP
LZ-DR2
Bacmid
scDR1-HA
LZ-DR2-MBP
LZ-DR2
Bacmid
PE-A
FS
C-A
100
101
102
103
104
0
256
512
768
1024
scDR1-HA
PE-A
FS
C-A
100
101
102
103
104
0
256
512
768
1024
LZ-DR2-MBP
PE-A
FS
C-A
100
101
102
103
104
0
256
512
768
1024
LZ-DR2
PE-A
FS
C-A
100
101
102
103
104
0
256
512
768
1024
scDR1-HA
PE-A
FS
C-A
100
101
102
103
104
0
256
512
768
1024
scDR1-HA
PE-A
FS
C-A
100
101
102
103
104
0
256
512
768
1024
LZ-DR2-MBP
PE-A
FS
C-A
100
101
102
103
104
0
256
512
768
1024
LZ-DR2-MBP
PE-A
FS
C-A
100
101
102
103
104
0
256
512
768
1024
LZ-DR2
PE-A
FS
C-A
100
101
102
103
104
0
256
512
768
1024
LZ-DR2
a b
c
Figure 3.6 Detection of insect cell surface displayed DR2-MBP complex with Ob.1A12 TCR tetramers.
(a) Histogram overlay of cells expressing scDR1-HA, LZ-DR2, LZ-DR2-MBP, and empty bacmid (PFB)
stained with LB3.1 antibody. (b) Dot plots of TCR tetramer staining of insect cells displaying three
different constructs. Positive staining events were shown in the red box. (c) A bar diagram of the TCR
tetramer staining results. The fluorescence staining intensity was measured as mean fluorescence units
(MFU) from (b).

87
suggested that the DR2-MBP complex displayed on the insect cell surface was capable of
binding specific TCR tetramers in an epitope-dependent manner. Coupled with directed
evolution and FACS, DR2 variants with improved TCR-binding affinity could be readily
identified from a mutagenesis library in a high throughput manner.
3.2.7. Affinity Engineering of DR2-MBP85-99 Complexes Using Insect Cell Surface Display
A random mutagenesis library of DR2 was created using the Bac-to-Bac baculovirus
expression system [34]. To minimize the possibility of altering peptide specificity and maintain
the function of leucine zipper dimerization motifs, mutations were introduced into the DR2α-
and DR2β-encoding regions using EP-PCR. A library of 3.1x10⁶ DH5α clones was created, from
which the plasmids were recovered and transformed into DH10Bac. Following blue-and-white
screening, ~7000 transformants containing recombinant bacmids were selected, pooled together,
and grown overnight. The recombinant bacmid DNA was then isolated and used to transfect
insect cells, generating a display library of DR2 variants in complex with the MBP85-99
PE-A
Count
100
101
102
103
104
0
13
25
38
50
PE-A
Count
100
101
102
103
104
0
3750
7500
11250
15000a b
Figure 3.7 Affinity engineering of DR2 variants with improved TCR-binding affinity. (a) Surface
expression level of correctly folded DR2 variants in the primary library. (b) FACS enrichment of DR2
variants with improved TCR-binding affinity. Ob.1A12 TCR tetramer was used to stain the library.
Comparison between the histogram of the library before enrichment (black) and that after one round of
cell sorting (red) indicated that potential DR2 variants with improved TCR-binding affinity were
enriched.
88
peptide. The expression levels of correctly folded DR2 variants (Figure 3.7a) were comparable
to that of the wild-type DR2-MBP (Figure 3.6a), suggesting that the mutation rate (~2 amino
acid change per gene) was well tolerated for DR2 protein folding. The DR2-MBP-specific
Ob.1A12 TCR tetramer was used as the staining reagent for sorting the library, and one round of
enrichment has been completed. As shown in Figure 3.7b, the fluorescence peak shift indicated
that potential DR2 variants with improved TCR-binding affinity were successfully enriched.
Further rounds of enrichment are in process.
3.3. Conclusions and Outlook
The pMHC tetramer staining technology has overcome the major limitations associated
with function-based T cell assays and enabled in vivo T cell analyses. However, pMHC tetramers
are very time-consuming and labor-intensive to prepare and often show low avidity. To address
these limitations, we sought to engineer pMHC monomers with high TCR-binding affinity.
Using the DR2-MBP85-99 complex implicated in multiple sclerosis as the engineering target, a
random mutagenesis library was created and screened using two different cell surface display
systems − yeast surface display and insect cell surface display. The former system failed to
express functional wild-type DR2-MBP complex. Although a folded mutant DR2 Pβ11H-MBP was
identified through directed evolution, it failed to activate DR2-MBP-specific T hybridoma cell or
to bind the Ob.1A12 TCR tetramer. Using the DR2 Pβ11H-MBP as the template for EP-PCR
library creation and the Ob.1A12 TCR tetramer as the staining reagent for library screening, no
positive mutants were isolated. Therefore, yeast surface display was not a suitable system for
engineering DR2-MBP with improved TCR-binding affinity.

89
In contrast, the wild-type DR2-MBP complex was successfully displayed on insect cell
surface and was capable of activating specific T hybridoma cell. More importantly, the surface
displayed DR2-MBP complex bound the Ob.1A12 TCR tetramers in an epitope-dependent and
specific manner, providing us a high throughput screening method for directed evolution
experiments. After one round of cell sorting, potential DR2 variants with improved TCR-binding
affinity have been successfully enriched from a random mutagenesis library. Currently, further
enrichment is in process.
Once a distinct fluorescence peak shift is observed (typically require another 2-3 rounds
of cell sorting), the future work should focus on further improvement and characterization of the
isolated mutants. Specifically, individual mutants will be isolated and analyzed to identify the
“hot spots” affecting the pMHC-TCR binding, which could then serve as the target sites for
saturation mutagenesis study. Alternatively, DR2 residues that form direct contact with the TCR
could be identified from the solved crystal structure (PDB accession code: 1YMM) and
mutagenized to further improve the TCR-binding affinity. The resulting mutants will then be
examined for their antigen-binding specificity, TCR-binding affinity and kinetics, and T cell
staining and function.
Since the library creation and screening using insect cell surface display is quite time-
consuming compared to yeast surface display, the resulting mutants isolated from the studies
described above should be tested using the latter system to check if it is feasible to be used to
conduct further engineering work. In theory, TCR tetramer staining should be observable if the
pMHC exhibits affinity above a certain threshold [33]. Using the yeast surface display system,
the affinity engineering study could be significantly accelerated. If successful, such engineered
high affinity pMHC complexes may provide a new class of diagnostic reagents capable of

90
monitoring disease progression and T cell therapy efficacies. In addition, they may be used as
novel reagents to treat infectious diseases and prevent autoimmunity, and the engineered MHC in
complex with antagonist might be used as an immune suppressor to treat established
autoimmunity.
3.4. Materials and Methods
The primer sequences are listed in Table 3.1. All restriction enzymes were purchased
from New England Biolabs (Ipswich, MA). Unless otherwise indicated, all chemicals were
purchased from Sigma (St. Louis, MO).
Table 3.1 Primers used in this study.
Name Sequences 5’→3’
TAFor TATAAGGCCCAGCCGGCCATGCTCCTGCTGCTCGTCCCAGTG
TARev GGAGCCTCCACCTCCTGAGCCTCCACCTCCGGAGCCTCCACCTCCTGAGCCTCC
ACCTCCTATGATGGTGAGTCTTGTTCCAGT
TBFor GGAGGTGGAGGCTCAGGAGGTGGAGGCTCCGGAGGTGGAGGCTCAGGAGGTG
GAGGCTCCATGGGAATCAGGCTCCTCTGTCGT
TBRev GAATTCGGCCCCCGAGGCCCCCTCTACAACGGTTAACCTGGTCCC
BamHIalphaFor CGCGGATCCATGCTCCTCCTGCTCGTCCC
EcoRIalphaRev TTTGAATTCTTAAACTGACAGGTTTTGAAAG
BamHIbetaFor CGCGGATCCATGGGAATCAGGCTCCTCTGTCG
EcoRIbetaRev TTTGAATTCTCAGTCCCGCAGCTCCATCTTCAT
M13For GTTTTCCCAGTCACGAC
M13Rev CAGGAAACAGCTATGAC
NotICIIFor AGAGACGGCGGCCGCATCGCTGGCTTTAAAGGCGAGCAGGG
DR4betaXhoIRev TCCACCCTCGAGAGCAGATTCAGACCGTGCTCTCC
SpeIDR2betaFor GGCTCACTAGTGCCACGGGGCTCTGGAGGAGGTGGGTCCGGGGACACCCGAC
CACGTTTCCTGTGGCAGCCTAAGAGGGAGTGTCATTTCTTCAATGGG
DR4betaXhoIRev TCCACCCTCGAGAGCAGATTCAGACCGTGCTCTCC
pYD1For AGTAACGTTTGTCAGTAATTGC
pYD1Rev GTCGATTTTGTTACATCTACAC
P11RRev CCCATTGAAGAAATGACACTCCCTCTTGCGCTGCCACAGGAAACGTGGTCGGG
P11HRev CCCATTGAAGAAATGACACTCCCTCTTATGCTGCCACAGGAAACGTGGTCGGG
MBPF4YFor
GGCTCAGGAGGCGGCCGCGAAAACCCGGTTGTTCACTTCTACAAAAACATCGT
TACCCCGCGTGGTACC
DR2-XhoIRev TCTAGACTCGAGCTTGCTCTGTGCAGATTCAGACCGTGCTCTCCATTCC
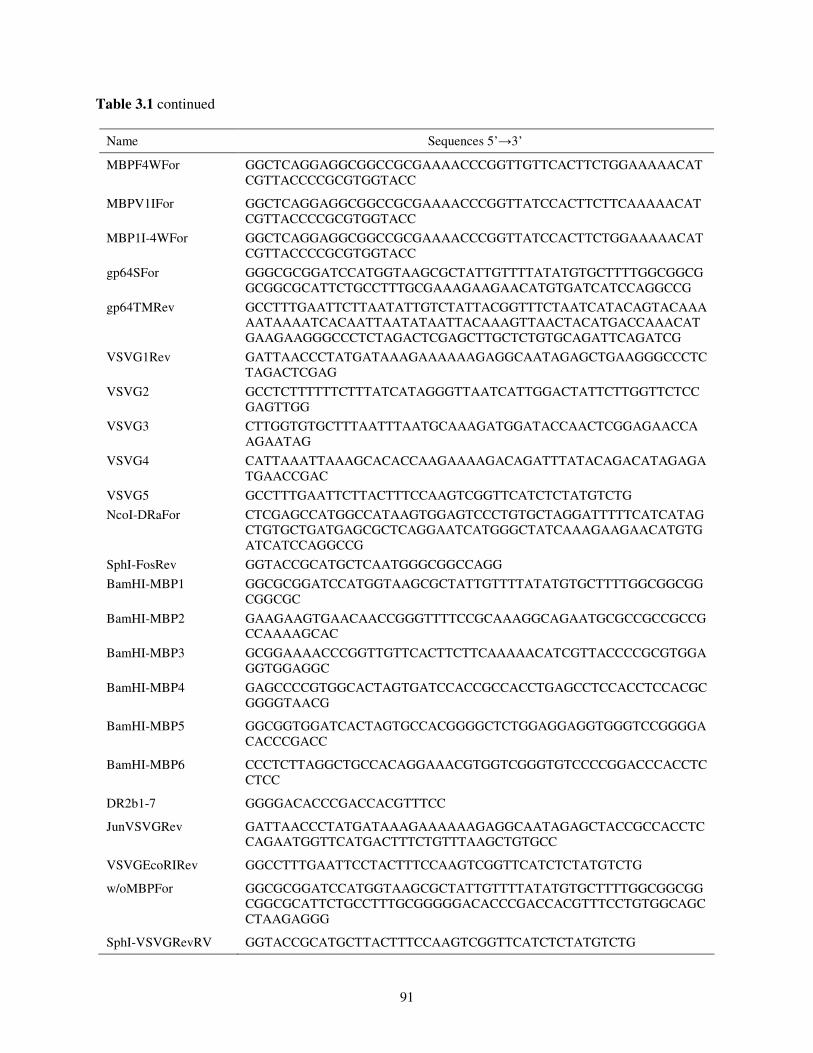
91
Table 3.1 continued
Name Sequences 5’→3’
MBPF4WFor GGCTCAGGAGGCGGCCGCGAAAACCCGGTTGTTCACTTCTGGAAAAACAT
CGTTACCCCGCGTGGTACC
MBPV1IFor GGCTCAGGAGGCGGCCGCGAAAACCCGGTTATCCACTTCTTCAAAAACAT
CGTTACCCCGCGTGGTACC
MBP1I-4WFor GGCTCAGGAGGCGGCCGCGAAAACCCGGTTATCCACTTCTGGAAAAACAT
CGTTACCCCGCGTGGTACC
gp64SFor GGGCGCGGATCCATGGTAAGCGCTATTGTTTTATATGTGCTTTTGGCGGCG
GCGGCGCATTCTGCCTTTGCGAAAGAAGAACATGTGATCATCCAGGCCG
gp64TMRev GCCTTTGAATTCTTAATATTGTCTATTACGGTTTCTAATCATACAGTACAAA
AATAAAATCACAATTAATATAATTACAAAGTTAACTACATGACCAAACAT
GAAGAAGGGCCCTCTAGACTCGAGCTTGCTCTGTGCAGATTCAGATCG
VSVG1Rev GATTAACCCTATGATAAAGAAAAAAGAGGCAATAGAGCTGAAGGGCCCTC
TAGACTCGAG
VSVG2 GCCTCTTTTTTCTTTATCATAGGGTTAATCATTGGACTATTCTTGGTTCTCC
GAGTTGG
VSVG3 CTTGGTGTGCTTTAATTTAATGCAAAGATGGATACCAACTCGGAGAACCA
AGAATAG
VSVG4 CATTAAATTAAAGCACACCAAGAAAAGACAGATTTATACAGACATAGAGA
TGAACCGAC
VSVG5 GCCTTTGAATTCTTACTTTCCAAGTCGGTTCATCTCTATGTCTG
NcoI-DRaFor CTCGAGCCATGGCCATAAGTGGAGTCCCTGTGCTAGGATTTTTCATCATAG
CTGTGCTGATGAGCGCTCAGGAATCATGGGCTATCAAAGAAGAACATGTG
ATCATCCAGGCCG
SphI-FosRev GGTACCGCATGCTCAATGGGCGGCCAGG
BamHI-MBP1 GGCGCGGATCCATGGTAAGCGCTATTGTTTTATATGTGCTTTTGGCGGCGG
CGGCGC
BamHI-MBP2 GAAGAAGTGAACAACCGGGTTTTCCGCAAAGGCAGAATGCGCCGCCGCCG
CCAAAAGCAC
BamHI-MBP3 GCGGAAAACCCGGTTGTTCACTTCTTCAAAAACATCGTTACCCCGCGTGGA
GGTGGAGGC
BamHI-MBP4 GAGCCCCGTGGCACTAGTGATCCACCGCCACCTGAGCCTCCACCTCCACGC
GGGGTAACG
BamHI-MBP5 GGCGGTGGATCACTAGTGCCACGGGGCTCTGGAGGAGGTGGGTCCGGGGA
CACCCGACC
BamHI-MBP6 CCCTCTTAGGCTGCCACAGGAAACGTGGTCGGGTGTCCCCGGACCCACCTC
CTCC
DR2b1-7 GGGGACACCCGACCACGTTTCC
JunVSVGRev GATTAACCCTATGATAAAGAAAAAAGAGGCAATAGAGCTACCGCCACCTC
CAGAATGGTTCATGACTTTCTGTTTAAGCTGTGCC
VSVGEcoRIRev GGCCTTTGAATTCCTACTTTCCAAGTCGGTTCATCTCTATGTCTG
w/oMBPFor GGCGCGGATCCATGGTAAGCGCTATTGTTTTATATGTGCTTTTGGCGGCGG
CGGCGCATTCTGCCTTTGCGGGGGACACCCGACCACGTTTCCTGTGGCAGC
CTAAGAGGG
SphI-VSVGRevRV GGTACCGCATGCTTACTTTCCAAGTCGGTTCATCTCTATGTCTG
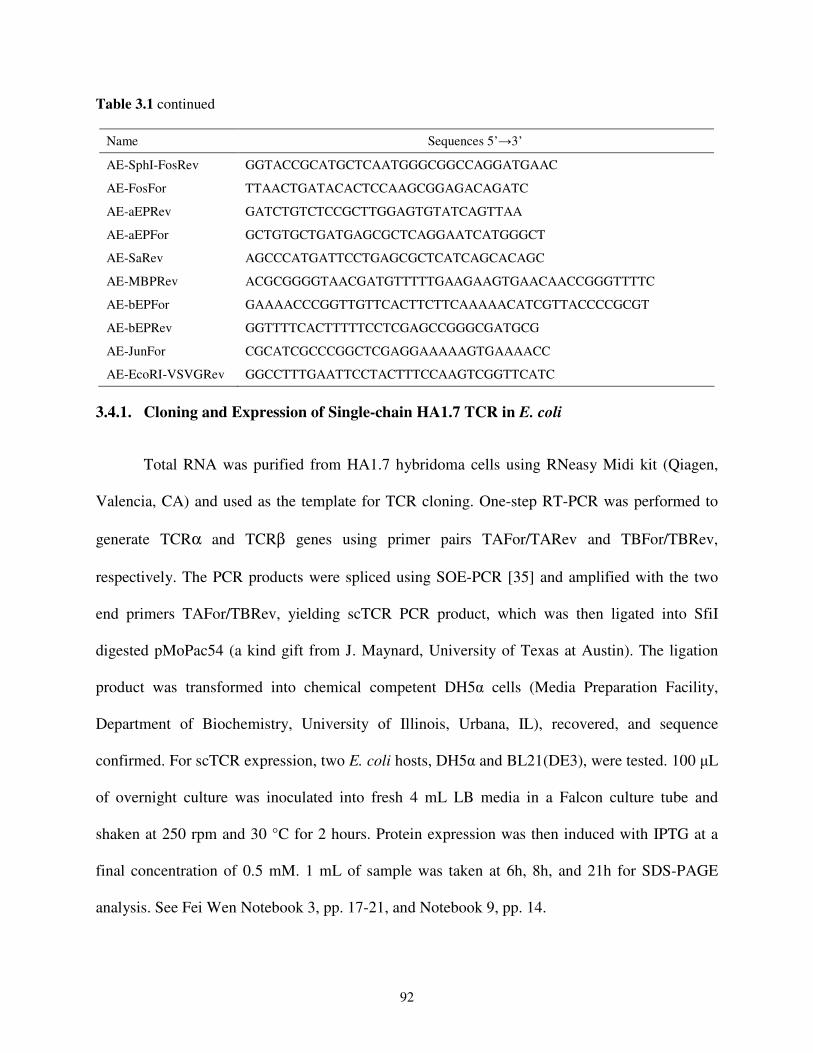
92
Table 3.1 continued
3.4.1. Cloning and Expression of Single-chain HA1.7 TCR in E. coli
Total RNA was purified from HA1.7 hybridoma cells using RNeasy Midi kit (Qiagen,
Valencia, CA) and used as the template for TCR cloning. One-step RT-PCR was performed to
generate TCRα and TCRβ genes using primer pairs TAFor/TARev and TBFor/TBRev,
respectively. The PCR products were spliced using SOE-PCR [35] and amplified with the two
end primers TAFor/TBRev, yielding scTCR PCR product, which was then ligated into SfiI
digested pMoPac54 (a kind gift from J. Maynard, University of Texas at Austin). The ligation
product was transformed into chemical competent DH5α cells (Media Preparation Facility,
Department of Biochemistry, University of Illinois, Urbana, IL), recovered, and sequence
confirmed. For scTCR expression, two E. coli hosts, DH5α and BL21(DE3), were tested. 100 µL
of overnight culture was inoculated into fresh 4 mL LB media in a Falcon culture tube and
shaken at 250 rpm and 30 °C for 2 hours. Protein expression was then induced with IPTG at a
final concentration of 0.5 mM. 1 mL of sample was taken at 6h, 8h, and 21h for SDS-PAGE
analysis. See Fei Wen Notebook 3, pp. 17-21, and Notebook 9, pp. 14.
Name Sequences 5’→3’
AE-SphI-FosRev GGTACCGCATGCTCAATGGGCGGCCAGGATGAAC
AE-FosFor TTAACTGATACACTCCAAGCGGAGACAGATC
AE-aEPRev GATCTGTCTCCGCTTGGAGTGTATCAGTTAA
AE-aEPFor GCTGTGCTGATGAGCGCTCAGGAATCATGGGCT
AE-SaRev AGCCCATGATTCCTGAGCGCTCATCAGCACAGC
AE-MBPRev ACGCGGGGTAACGATGTTTTTGAAGAAGTGAACAACCGGGTTTTC
AE-bEPFor GAAAACCCGGTTGTTCACTTCTTCAAAAACATCGTTACCCCGCGT
AE-bEPRev GGTTTTCACTTTTTCCTCGAGCCGGGCGATGCG
AE-JunFor CGCATCGCCCGGCTCGAGGAAAAAGTGAAAACC
AE-EcoRI-VSVGRev GGCCTTTGAATTCCTACTTTCCAAGTCGGTTCATC

93
3.4.2. Generation of Recombinant Bacmid DNA
3.4.2.1. HA1.7 TCRαααα and TCRββββ Constructs
Plasmid pBACp10ph encoding HA1.7 TCR (a kind gift from E. Boder, University of
Tennessee) was used as the PCR template, and TCRα and TCRβ genes were obtained by PCR
using primer pairs BamHIalphaFor/EcoRIalphaRev and BamHIbetaFor/EcoRIbetaRev,
respectively. The PCR products were BamHI/EcoRI digested and ligated into pFastBac vector
(Invitrogen), yielding two donor plasmids, which were then transformed into DH5α cells,
recovered, and sequence confirmed. The recombinant bacmid DNA encoding TCRα/TCRβ gene
was obtained by transforming the corresponding donor plasmid into DH10Bac (Invitrogen,
Carlsbad, California) and blue-and-white screening. Bacmid DNA from 4 white colonies of each
construct was purified using HiPure plasmid miniprep kit (Invitrogen, Carlsbad, California) and
analyzed by PCR using M13For/M13Rev primers. After verifying the transposition, recombinant
bacmid DNA was used to transfect Sf9 cells for virus production (see Section 3.4.3). See Fei
Wen Notebook 9, pp. 18-21, 23-24.
3.4.2.2. Single-chain and Non-covalent pMHC Constructs
The scDR1-HA-gp64 donor plasmid was created by ligating the PCR product, which was
obtained by using pYD1αHAβ encoding single-chain DR1-HA (see Section 2.4.1) as the
template and gp64SFor/gp64TMRev as the primer pair, into BamHI/EcoRI digested pFastBac
plasmid. The gene encoding the VSVG transmembrane domain was obtained by splicing
VSVG2-5 together. The resulting PCR fragment was spliced with another fragment obtained by
using pYD1αHAβ as the template and gp64SFor/VSVG1Rev as the primer pair, and then ligated

94
into BamHI/EcoRI digested pFastBac plasmid, yielding the scDR1-HA-VSVG donor plasmid.
The DR2α-Fos-encoding gene was obtained by PCR using pPIC-DR2α (a kind gift from K.W.
Wucherpfennig, Harvard Medical School) as the template and NcoI-DRaFor/SphI-FosRev as the
primer pair, and then ligated into NcoI/SphI digested pFastBacDual vector (Invitrogen), yielding
pFastBacDual-DR2α. The DR2β-MBP-Jun-VSVG-encoding gene was obtained by splicing
three PCR products: product 1 was obtained by splicing BamHI-MBP1-6, product 2 was
obtained by PCR using pPIC-DR2β (K.W. Wucherpfennig) as the template and DR2b1-
7/JunVSVGRev as the primer pair, and product 3 was obtained by splicing VSVG2-4 and
VSVGEcoRIRev. The spliced PCR product was then ligated into BamHI/EcoRI digested
pFastBacDual-DR2α to generate LZ-DR2-MBP donor plasmid. The DR2β-Jun-VSVG-encoding
gene was obtained by splicing two PCR products: product 1 was obtained by PCR using pPIC-
DR2β as the template and w/oMBPFor /JunVSVGRev as the primer pair, and product 2 was by
splicing VSVG2-4 and VSVGEcoRIRev. The spliced PCR product was then ligated into
BamHI/EcoRI digested pFastBacDual-DR2α to generate LZ-DR2 donor plasmid. The single-
chain scDR2(-MBP)-VSVG donor plasmid was created by ligating the PCR product, which was
obtained by using the LZ-DR2(-MBP) donor plasmid as the template and gp64SForS/SphI-
VSVGRevRV as the primer pair, into BamHI/SphI digested pFastBac plasmid. The recombinant
bacmid DNA was obtained by transforming the corresponding donor plasmid into DH10Bac as
described in Section 3.4.2.1. See Fei Wen Notebook 8, pp. 60-62, 69-70, 74, 77.
3.4.3. Insect Cell Culture and Protein Expression
To initiate an insect cell culture, a frozen stock was removed from liquid nitrogen, placed
in a 37 °C water bath, and thawed rapidly with gentle agitation until the cells were almost
95
thawed (leaving cells at 37 °C after they have thawed will result in cell death). The cells were
then transferred into a 25 cm2 flask pre-wet with 4 mL of complete medium (Sf-900 II SFM
medium supplemented with 10% heat inactivated fetal bovine serum and 100 µg/mL penicillin-
streptomycin, Invitrogen). After incubation for ~40 minutes at 27 °C, the medium was removed
and replaced with 5 mL of fresh complete medium. After another 24 hours, the medium was
changed again and the cells were grown to confluency. The cells were then subcultured until they
doubled every 18-24 hours and were 95% viable before they could be used for bacmid
transfection or viral infection. Once a stable cell culture was established, a frozen stock could be
made by resuspending 107 insect cells (>90% viable and ~80-90% confluent) in 1 mL of freezing
medium (60% Sf-900 II SFM Medium, 30% FBS, and 10% DMSO).
Recombinant baculovirus was obtained by transfecting insect cells with recombinant
bacmid DNA following manufacturer’s protocol (Bac-to-Bac, Invitrogen). Briefly, 106 cells were
seeded in each well of a 6-well plate and allowed to attach for at least 1 hour at 27 °C. 5 µL of
bacmid DNA, 6 µL of CellFECTIN (Invitrogen), and 189 µL of Sf-900 II SFM medium were
mixed gently, incubated at room temperature for 45 minutes, and then 800 µL of Sf-900 II SFM
medium was added. The cells were washed three times with 2 mL of Sf-900 II SFM medium and
the 1 mL transfection mixture was added to each well. The resulting plate was incubated at 27 °C
for 5 hours and the transfection mixture was replaced with 2 mL of complete medium. The virus
was harvested after 72 hours by centrifugation at 500×g for 5 minutes and stored at 4 °C. To
amplify the virus, 1.2×10⁷ cells were seeded in a 75 cm
2 flask and allowed to attach for at least 1
hour at 27 °C. 500 µL of the viral stock from the initial transfection step was added into the flask
and mixed gently. The virus was harvested after 48 hours by centrifugation at 500×g for 5
minutes and stored at 4 °C. The virus amplification was carried out twice to bring up the virus
96
titer to ~108 pfu/mL before it was used for protein expression. For long term storage, a 1 mL
aliquot of the amplified virus stock was stored at -80 °C.
For protein expression in insect cells, 8×10⁶ cells were seeded in a tissue culture plate
(Corning Inc., Corning, NY) and allowed to attach for at least 1 hour at 27 °C. The infection
conditions including multiplicity of infection (MOI), expression temperature, and infection time
were optimized for expressing different proteins. For example, the optimal condition for HA1.7
TCR expression was determined to be 5 µL virus stock (MOI ~ 1), 19 °C for 6 days. See Fei
Wen Notebook 9, pp. 24-25, 31-32, 37, 46.
3.4.4. Protein Analyses
3.4.4.1. Native PAGE and Western Blot
Protein standards, Powerpac 300 power supply, Mini-PROTEAN 3 assembly, Mini
Trans-Blot Cell, and pre-cast 4-20% acrylamide gels were purchased from Bio-Rad (Hercules,
CA). All steps were carried out at 4 ºC. 15 µL of protein sample was mixed with 15 µL of
native-PAGE loading buffer (62.5 mM Tris-HCl, pH 6.8, 40% glycerol, 0.01% Bromophenol
Blue). Samples were loaded onto the gel in a Bio-Rad Mini-PROTEAN 3 assembly and ran in
native electrophoresis buffer (25 mM Tris, pH 8.3, 192 mM glycine) at a current of 100 V for
120 minutes. For native PAGE, the gel was stained with Coomassie Blue followed by destaining
with a destaining solution (40% methanol, 10% glacial acetic acid). For native western blot, the
proteins were then transferred to a polyvinylidene fluoride (PVDF) membrane using the Mini
Trans-Blot Cell and a voltage of 100V for 1 hour. The PVDF membrane was then developed as
described in Section 2.4.8 except that the primary antibody used was H28-710 at a 1:2500
dilution. See Fei Wen Notebook 8, pp. 79, and Notebook 9, pp. 32-35.

97
3.4.4.2. ELISA
90 µL of protein sample was mixed with 10 µL of 1× coating buffer (eBiosciences, San
Diego, CA) and loaded into the Immuno 96-MicroWell plate (Thermo Fisher Scientific,
Rochester, NY). After incubation at 4 °C overnight, each well was washed three times with 400
µL PBST (phosphate buffered saline (PBS) supplemented with 0.05% Tween-20) and then
blocked with 200 µL 1× assay diluent (eBiosciences) for 2 hours at room temperature. Wells
were then washed with 400 µL PBST three time and incubated with detection antibody,
biotinylated H57-597 (BD Bioscience, San Jose, CA) at a 1:200 dilution for ~3 hours at room
temperature, followed by avidin-HRP (eBiosciences) for 30 min at room temperature. After
washing away unbound avidin-HRP, substrate solution was added and the absorbance at 650 nm
was measured after 15 min using a SpectraMax microplate reader (Molecular Devices,
Sunnyvale, CA). See Fei Wen Notebook 9, pp. 32-35.
3.4.5. Yeast Display Library Construction and Screening
3.4.5.1. Engineering of Folded DR2 Variants in Yeast
Plasmid pYD1-DR2-MBP was generated by replacing the DR1β gene in DR1αMBPβ
(see Section 2.4.1) with DR2β gene through SpeI/XhoI digestion and ligation. DR2β gene was
obtained by PCR using pPIC-DR2β as template and primer pair SpeIDR2betaFor/
DR4betaXhoIRev. Using pYD1-DR2-MBP as template and pYD1For/pYD1Rev as primers, EP-
PCR was carried out with 0.15mM MnCl2. The mutation rate was determined to be ~3 amino
acid changes per gene. The EP-PCR product was then digested with BstXI and SpeI and ligated
into DR1αSTFβ (see Section 2.4.1). The ligation mixture was transformed into ElectroMax
98
DH5α competent cells (Invitrogen) and a library of 1.7×10⁶
clones was obtained. Plasmids were
recovered and transformed into EBY100 and a library of 1.8×10⁶ clones was generated. After
two passages in the selection media SD-CAA (2% dextrose, 0.67% yeast nitrogen base, 1%
casamino acids), the library was induced for protein expression using YPG (1% yeast extract, 2%
peptone, 2% galactose) and subjected to FACS. The FACS analysis was carried out in the same
way as described in Section 2.4.10 except that after the third round of enrichment, full-length
DR2 variants were selected using anti-V5 antibody (Invitrogen) in the primary staining step.
Twenty clones were randomly picked and analyzed individually for their surface display levels.
DNA sequencing was carried out to determine the mutations and DR2 variants with single
mutation were created as the following: DR2Pβ11H-MBP was created by co-transforming a PCR
product (obtained by using pYD1-DR2-MBP as template and primer pair pYD1For/P11HRev)
and BstXI/SpeI digested pYD1-DR2-MBP into EBY100. DR2Pβ11R-MBP was created in the
same way except that P11RRev was used in the PCR reaction in place of P11HRev. DR2-
MBPF4Y was created by ligating a PCR product (obtained by using pYD1-DR2-MBP as template
and primer pair MBPF4YFor/DR2-XhoIRev) into NotI/XhoI digested pYD1-DR2-MBP. DR2-
MBPV1I, DR2-MBPF4W, and DR2-MBPV1I-F4W were created similarly except that primers
MBPF4WFor, MBPV1IFor, and MBP1I-4WFor were used in PCR reaction in place of
MBPF4YFor, respectively. See Fei Wen Notebook 4, pp. 1-4, 28, 35-36, and Notebook 5, pp.
10-12.
3.4.5.2. Affinity Engineering of DR2 Variants in Yeast
An EP-PCR library was created in the same way as described above except that plasmid
pYD1-DR2Pβ11H-MBP was used as the template. The mutation rate was determined to be ~2-3

99
amino acid changes per gene and the yeast library size was 2×10⁶. The cells were stained with
the Ob.1A12 TCR tetramer (described in Section 3.4.6) and subjected to FACS. ~1% and ~
0.5% of the population with the highest fluorescence was collected in the first and second round
of sorting, respectively, and recovered for further enrichment. In the third round, cells from top
0.1% population were sorted into a 96-well plate and individual clones were analyzed for
tetramer staining and sequencing. See Fei Wen Notebook 5, pp. 11-15.
3.4.6. TCR Tetramer Preparation and Staining
The volume of streptavidin-PE conjugate required to give a 1:1 molar ratio of
biotinylated TCR to biotin binding sites was calculated and tested using native PAGE (see
Section 3.4.4.1). The streptavidin-PE conjugate was then slowly added to the biotinylated TCR
solution stepwise in 1/10 volume aliquots every 5 minutes. This step was performed at room
temperature and away from light. The resulting tetramer solution was then diluted to 100 µg/mL
for yeast cell staining and 50 µg/mL for insect cell staining. The staining was carried out at 30 °C
(yeast cell) or 27 °C (insect cell) for 2 hours and unbound TCR tetramer was washed away three
times using PBS. See Fei Wen Notebook 5, pp. 13, 32, 41-42, and Notebook 8, pp. 79.
3.4.7. Insect Cell Surface Display Library Creation and Screening
The LZ-DR2-MBP donor plasmid was used as template to amplify five DNA fragments
with primer pairs AE-SphI-FosRev/AE-FosFor, AE-aEPRev/AE-aEPFor, AE-SaRev/AE-
MBPRev, AE-bEPFor/AE-bEPRev, and AE-JunFor/AE-EcoRI-VSVGRev for fragments 1
through 5, respectively. High fidelity PCR condition was used for amplifying fragments 1, 3, and
5, while EP-PCR condition (0.15mM MnCl2) was used for amplifying fragment 2 and 4. After
splicing the five fragments, the resulting product was SphI/EcoRI digested and ligated into
100
pFastBacDual vector. The ligation mixture was then transformed into DH5α, generating a donor
plasmid library with a size of ~3.1x10⁶. The donor plasmids were then recovered and
transformed into DH10Bac. After blue-and-white screening, 7000 white colonies were picked
and pooled to generate a recombinant bacmid library, which was then used to transfect insect
cells to create a recombinant baculovirus library encoding DR2 variants in complex with MBP85-
99 peptide. The insect cells infected with the recombinant baculovirus library were stained with
the Ob.1A12 TCR tetramer (described in Section 3.4.6) and subjected to FACS. ~15% and ~
0.5% of the population with the highest fluorescence was collected in the first and second round
of sorting, respectively, and recovered for further enrichment. See Fei Wen Notebook 5, pp. 31-
38.
3.4.8. Other Assays
Please refer to Section 2.4.2 for yeast transformation, Section 2.4.3 for DNA sequencing,
Section 2.4.4 for yeast surface display, Section 2.4.5 for flow cytometry analysis, Section 2.4.8
for SDS-PAGE, and Section 2.4.11 for T cell hybridoma activation and IL-2 detection.
3.5. References
1. Klenerman, P., V. Cerundolo, and P.R. Dunbar, Tracking T cells with tetramers: new tales
from new tools. Nat Rev Immunol, 2002. 2(4): p. 263-72.
2. Pape, K.A., et al., Use of adoptive transfer of T-cell-antigen-receptor-transgenic T cell for
the study of T-cell activation in vivo. Immunol Rev, 1997. 156: p. 67-78.
3. Doherty, P.C., D.J. Topham, and R.A. Tripp, Establishment and persistence of virus-specific
CD4+ and CD8+ T cell memory. Immunol Rev, 1996. 150: p. 23-44.
4. Knabel, M., et al., Reversible MHC multimer staining for functional isolation of T-cell
populations and effective adoptive transfer. Nat Med, 2002. 8(6): p. 631-7.
101
5. van der Merwe, P.A. and S.J. Davis, Molecular interactions mediating T cell antigen
recognition. Annu Rev Immunol, 2003. 21: p. 659-84.
6. Altman, J.D., et al., Phenotypic analysis of antigen-specific T lymphocytes. Science, 1996.
274(5284): p. 94-6.
7. Kwok, W.W., et al., Use of class II tetramers for identification of CD4+ T cells. J Immunol
Methods, 2002. 268(1): p. 71-81.
8. Maile, R., et al., Antigen-specific modulation of an immune response by in vivo
administration of soluble MHC class I tetramers. J Immunol, 2001. 167(7): p. 3708-14.
9. Casares, S., et al., Down-regulation of diabetogenic CD4+ T cells by a soluble dimeric
peptide-MHC class II chimera. Nat Immunol, 2002. 3(4): p. 383-91.
10. Yee, C., Adoptive T cell therapy--immune monitoring and MHC multimers. Clin Immunol,
2003. 106(1): p. 5-9.
11. Crawford, F., et al., Detection of antigen-specific T cells with multivalent soluble class II
MHC covalent peptide complexes. Immunity, 1998. 8(6): p. 675-82.
12. Nepom, G.T., et al., HLA class II tetramers: tools for direct analysis of antigen-specific
CD4+ T cells. Arthritis Rheum, 2002. 46(1): p. 5-12.
13. Maynard, J., et al., High-level bacterial secretion of single-chain alphabeta T-cell receptors.
J Immunol Methods, 2005. 306(1-2): p. 51-67.
14. Kappler, J., et al., Binding of a soluble alpha beta T-cell receptor to superantigen/major
histocompatibility complex ligands. Proc Natl Acad Sci U S A, 1994. 91(18): p. 8462-6.
15. Liu, C.P., et al., T cell positive selection by a high density, low affinity ligand. Proc Natl
Acad Sci U S A, 1998. 95(8): p. 4522-6.
16. Aydintug, M.K., et al., Detection of cell surface ligands for the gamma delta TCR using
soluble TCRs. J Immunol, 2004. 172(7): p. 4167-75.
17. Hahn, M., et al., Unconventional topology of self peptide-major histocompatibility complex
binding by a human autoimmune T cell receptor. Nat Immunol, 2005. 6(5): p. 490-6.
102
18. Boen, E., et al., Identification of T cell ligands in a library of peptides covalently attached to
HLA-DR4. J Immunol, 2000. 165(4): p. 2040-7.
19. Becker, M.L., et al., Expression of a hybrid immunoglobulin-T cell receptor protein in
transgenic mice. Cell, 1989. 58(5): p. 911-21.
20. Kubo, R.T., et al., Characterization of a monoclonal antibody which detects all murine alpha
beta T cell receptors. J Immunol, 1989. 142(8): p. 2736-42.
21. Viney, J.L., et al., Generation of monoclonal antibodies against a human T cell receptor beta
chain expressed in transgenic mice. Hybridoma, 1992. 11(6): p. 701-13.
22. Davis, T.R., et al., Baculovirus expression of alkaline phosphatase as a reporter gene for
evaluation of production, glycosylation and secretion. Biotechnology (N Y), 1992. 10(10): p.
1148-50.
23. Steinman, L., Multiple sclerosis: a coordinated immunological attack against myelin in the
central nervous system. Cell, 1996. 85(3): p. 299-302.
24. Wucherpfennig, K.W., et al., Structural requirements for binding of an immunodominant
myelin basic protein peptide to DR2 isotypes and for its recognition by human T cell clones.
J Exp Med, 1994. 179(1): p. 279-90.
25. Esteban, O. and H. Zhao, Directed evolution of soluble single-chain human class II MHC
molecules. J Mol Biol, 2004. 340(1): p. 81-95.
26. Smith, K.J., et al., Crystal structure of HLA-DR2 (DRA*0101, DRB1*1501) complexed with
a peptide from human myelin basic protein. J Exp Med, 1998. 188(8): p. 1511-20.
27. Appel, H., et al., Kinetics of T-cell receptor binding by bivalent HLA-DR. Peptide complexes
that activate antigen-specific human T-cells. J Biol Chem, 2000. 275(1): p. 312-21.
28. Crawford, F., et al., Use of baculovirus MHC/peptide display libraries to characterize T-cell
receptor ligands. Immunol Rev, 2006. 210: p. 156-70.
29. Grabherr, R., et al., Expression of foreign proteins on the surface of Autographa californica
nuclear polyhedrosis virus. Biotechniques, 1997. 22(4): p. 730-5.

103
30. Chapple, S.D. and I.M. Jones, Non-polar distribution of green fluorescent protein on the
surface of Autographa californica nucleopolyhedrovirus using a heterologous membrane
anchor. J Biotechnol, 2002. 95(3): p. 269-75.
31. Kalandadze, A., et al., Expression of recombinant HLA-DR2 molecules. Replacement of the
hydrophobic transmembrane region by a leucine zipper dimerization motif allows the
assembly and secretion of soluble DR alpha beta heterodimers. J Biol Chem, 1996. 271(33):
p. 20156-62.
32. Wen, F., O. Esteban, and H. Zhao, Rapid identification of CD4+ T-cell epitopes using yeast
displaying pathogen-derived peptide library. J Immunol Methods, 2008. 336(1): p. 37-44.
33. Weber, K.S., et al., Class II-restricted T cell receptor engineered in vitro for higher affinity
retains peptide specificity and function. Proc Natl Acad Sci U S A, 2005. 102(52): p. 19033-
8.
34. Ciccarone, V., D. Polayes, and V. Luckow, Generation of Recombinant Baculovirus in E.
coli Using Baculovirus Shuttle Vector. 1997, Humana Press Inc: Totowa, NJ.
35. Horton, R.M., et al., Gene splicing by overlap extension: tailor-made genes using the
polymerase chain reaction. Biotechniques, 1990. 8(5): p. 528-35.
104
Chapter 4. Yeast Surface Display of Functional Minicellulosomes
for Synergistic Hydrolysis of Cellulose
4.1. Introduction
The development of alternatives to fossil fuels has attracted intense political and
academic attention due to the increasing concerns about energy security, sustainability, and
global climate change [1-4]. Among all forms of renewable energy sources, lignocellulosic
biofuels, such as ethanol, have been widely regarded as a promising and the only foreseeable
alternative to petroleum products for transportation, and cellulosic ethanol is expected to replace
at least 30% of current US petroleum consumption by 2030 [3, 5, 6]. Currently, the central
technological impediment to lignocellulosic biofuel production is the absence of a low-cost
technology to break down its major component – cellulose [5, 7]. Cellulose (a linear
homopolymer of glucose linked by β-1,4-glycosidic bonds) is insoluble, forms a distinct
crystalline structure, and is protected by a complex plant cell wall structural matrix [8, 9]. As a
result, a separate processing step is required to produce large amounts of cellulases for the
hydrolysis of cellulose into fermentable glucose (shown in Figure 1.1), making cellulosic
ethanol too expensive to compete with gasoline. To address this issue, consolidated
bioprocessing (CBP), which combines cellulase production, cellulose hydrolysis, and
hydrolysate fermentation in a single step, has been proposed to significantly lower the cost of
cellulosic ethanol production [1, 10]. However, the great potential of CBP cannot be realized
using microorganisms available today and requires the development of new and improved
organisms that can both efficiently hydrolyze cellulose and convert the hydrolysate (glucose)
into ethanol.

105
Between the two strategies for CBP-enabling organism development: native cellulolytic
strategy (engineer naturally occurring cellulolytic microorganisms to improve their ethanol
production) and recombinant cellulolytic strategy (engineer non-cellulolytic microorganisms that
are proficient in ethanol production to utilize cellulose, see Section 1.3.1), the latter approach
was chosen considering the difficulties in engineering native cellulolytic microorganisms. In
contrast, yeast Saccharomyces cerevisiae is easy to manipulate with a large collection of genetic
engineering tools available. Additionally, yeast is widely known for its high ethanol tolerance,
high ethanol productivity (close-to-theoretical yield of 0.51 g ethanol /g glucose), and robustness
in industrial fermentation processes. Therefore, the goal of this project is to engineer yeast S.
cerevisiae with the ability to hydrolyze cellulose by heterologously expressing a functional
cellulolytic system.
Nature has provided us two ways of designing cellulolytic systems: (i) noncomplexed
cellulase systems, in which free enzymes are secreted and act discretely, and (ii) complexed
cellulase systems, namely cellulosomes, in which enzymes with complementary activities are
held together by a non-catalytic scaffoldin protein through high affinity interactions between
cohesins and enzyme-borne dockerins [1]. By mimicking the noncomplexed cellulase system,
several groups have successfully constructed cellulolytic S. cerevisiae strains that directly
convert amorphous cellulose to ethanol, although the titer and yield were relatively low [11-13].
Compared to the noncomplexed cellulase systems, the cellulosome exhibits much greater
degradative potential as a result of its highly ordered structural organization that enables enzyme
proximity synergy and enzyme-substrate-microbe complex synergy [14-17], and could provide a
“quantum leap” in the biomass-to-biofuels technology development [18]. Therefore, we sought
to display cellulosome on yeast cell surface. The format of cell surface display was chosen over

106
secretory proteins to potentially incorporate the cellulose-enzyme-microbe complex synergy
unique to native cellulolytic microorganisms [14]. In addition, coupled with flow cytometry,
yeast surface display provides us a more convenient engineering platform, avoiding labor-
intensive protein purification steps. Such cell-bound format is also amenable for enzyme activity
analysis on insoluble substrates [19].
To date, in vivo production of recombinant cellulosomes has been limited to
unifunctional complexes containing only one type of cellulolytic enzyme [20-22]. Since
complete enzymatic hydrolysis of cellulose to glucose requires synergistic action of three types
of cellulases: endoglucanases (EC 3.2.1.4), exoglucanases (including cellodextrinases, EC
3.2.1.74 and cellobiohydrolases, EC 3.2.1.91), and β-glucosidases (EC 3.2.1.21) [1],
cellulosomes with higher complexity are necessary to be synthesized and assembled on yeast cell
surface to enable its cellulose utilization. Recent studies have revealed a modular nature of
cellulosome assembly: by simply appending a dockerin domain, up to three enzymes (either
cellulosomal or noncellulosomal) with different origins could be incorporated into a chimeric
miniscaffoldin consisting of divergent cohesin domains to form a minicellulosome in vitro. The
chimeric miniscaffoldin was in the form of either purified [23-25] or yeast surface displayed
protein [26]. In both cases, the resulting recombinant minicellulosomes showed enhanced
hydrolytic activity towards cellulose. These results indicate that the high affinity cohesin-
dockerin interactions are sufficient to dictate the assembly of a functional cellulosome. Therefore,
we hypothesized that the same results could also be achieved in vivo by co-expressing the
cellulosomal components in yeast.
In this chapter, we describe the design and development of a yeast display system that
enabled the first successful surface assembly of a series of unifunctional, bifunctional, and

107
trifunctional minicellulosomes. Using phosphoric acid swollen cellulose (PASC) as a model
substrate, the surface displayed minicellulosomes exhibited both enzyme-enzyme synergy and
enzyme proximity synergy. More importantly, resting cell study showed that the recombinant
strain displaying the trifunctional minicellulosomes was able to hydrolyze and ferment PASC to
ethanol, supporting the feasibility of constructing cellulolytic and fermentative yeast by
displaying recombinant minicellulosomes on the cell surface. Furthermore, we demonstrated that
the display system described here can be a useful tool for producing minicellulosomes with
different activities and studying their synergic cellulolytic function. The following experiments
were designed by Fei Wen and carried out by Fei Wen with Jie Sun’s assistance.
4.2. Results and Discussion
4.2.1. Design and Construction of Minicellulosomal Components for Yeast Surface
Display
Complete and efficient enzymatic hydrolysis of cellulose requires synergistic action of at
least three types of cellulases. Therefore, a trifunctional minicellulosome, which consists of a
miniscaffoldin, an endoglucanase (EG), a cellobiohydrolase (CBH), and a β-glucosidase (BGL),
Yeast cell wall
CipA3-EGII-CBHII-BGL1
Coh1 Coh2 Coh3
CBD
EGII BGL1CBHII
Aga1-Aga2
Yeast cell wall
CipA3-EGII-CBHII-BGL1
Coh1 Coh2 Coh3
CBD
EGII BGL1CBHII
Coh1 Coh2 Coh3
CBD
EGIIEGII BGL1BGL1CBHIICBHII
Aga1-Aga2
Figure 4.1 Design of a yeast surface display system for assembly of minicellulosomes. CipA3 (Coh1-
Coh2-CBD-Coh3) enables display of cellulosomes with up to three enzymatic activities. The cohesin
domains are numbered as described elsewhere [27]. CBD = cellulose binding domain, Coh = cohesin.

108
is the minimum requirement for cellulose utilization by yeast (Figure 4.1). The miniscaffoldin
CipA3 used in this study was designed based on the well-characterized scaffoldin protein CipA
from Clostridium thermocellum [28]. It contains a cellulose binding domain (CBD) and three
cohesin modules (Coh1-Coh2-CBD-Coh3), and allows the surface assembly of minicellulosomes
with up to three enzymatic activities. By fusing the gene encoding CipA3 to the C-terminus of
AGA2 protein in the yeast pYD1 display vector (Figure 4.2), the miniscaffoldin was expected to
be tethered to the yeast a-agglutinin mating adhesion receptor [29], thus displayed on the cell
surface.
pRS425-CBHII-BGL1
GAL1 GAL10GAL1 GAL10
ss1 CBHIIFLAGc-MycBGL1 ss2docA docS
pYD1-CipA3-EGII
GAL10 GAL1
Aga2 V5HisEGII ss1docS CipA3
pYD1-CipA3-EGII
GAL10 GAL1GAL10 GAL1
Aga2 V5HisEGII ss1docS CipA3
TADH1TADH2TMTααααTADH1
Figure 4.2 Plasmids used for constructing strain CipA3-EGII-CBHII-BGL1 (Table 4.1) displaying
trifunctional minicellulosomes. ss1 = synthetic prepro signal peptide [30], ss2 = α-factor signal peptide
with AG dipeptide spacer [31], T = terminator. V5 (GKPIPNPLLGLDST), His (HHHHHH), FLAG
(DYKDDDDK), and c-Myc (EQKLISEEDL) are epitope tags used for detection of minicellulosomal
components on yeast cell surface.
The enzyme components used in this study were of fungal origin, including EGII and
CBHII isolated from Trichoderma reesei and BGL1 isolated from Aspergillus aculeatus, all of
which had been functionally expressed in S. cerevisiae [11]. The non-cellulosomal enzymes were
chosen to demonstrate the feasibility of using yeast to produce designer cellulosomes [18]. To
enable the surface assembly of minicellulosomes, three expression cassettes each consisting of a
promoter, a secretion signal peptide, an epitope tag, a cellulase, a dockerin module, and a
terminator were assembled in two plasmids (pYD1 and pRS425) in different combinations
(Figure 4.2 and Table 4.1): GAL10-(prepro signal peptide)-His-EGII-docS-ADH1, GAL10-
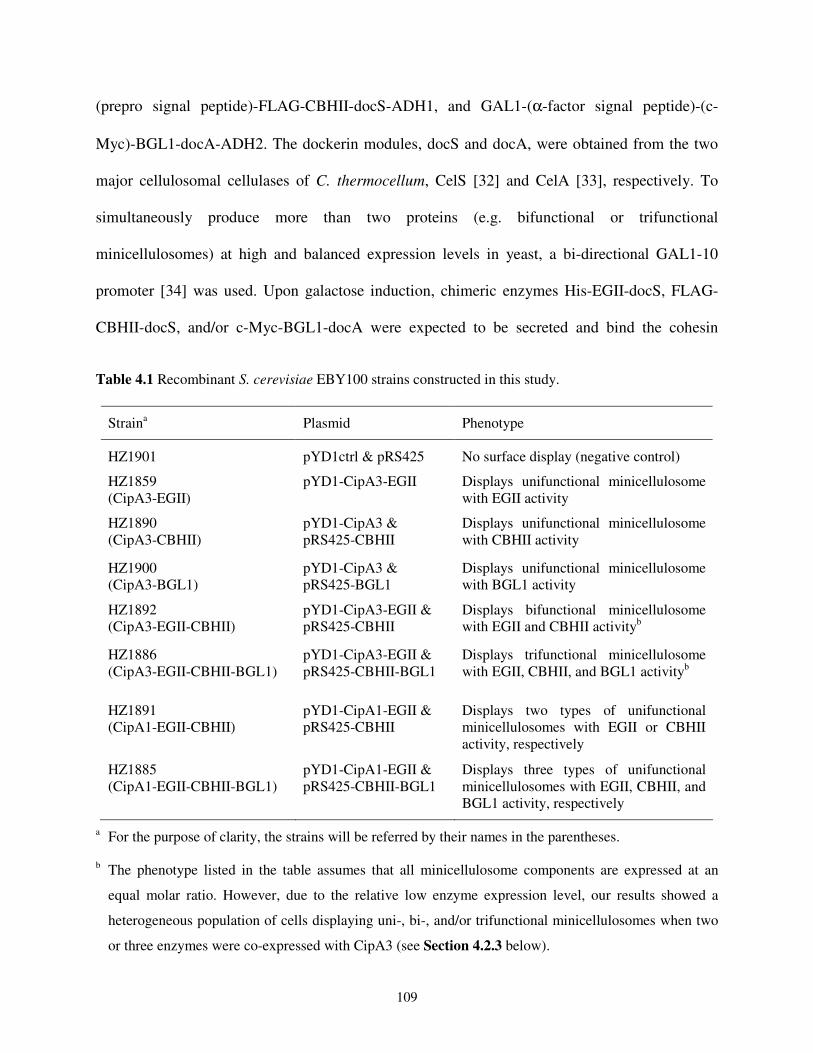
109
(prepro signal peptide)-FLAG-CBHII-docS-ADH1, and GAL1-(α-factor signal peptide)-(c-
Myc)-BGL1-docA-ADH2. The dockerin modules, docS and docA, were obtained from the two
major cellulosomal cellulases of C. thermocellum, CelS [32] and CelA [33], respectively. To
simultaneously produce more than two proteins (e.g. bifunctional or trifunctional
minicellulosomes) at high and balanced expression levels in yeast, a bi-directional GAL1-10
promoter [34] was used. Upon galactose induction, chimeric enzymes His-EGII-docS, FLAG-
CBHII-docS, and/or c-Myc-BGL1-docA were expected to be secreted and bind the cohesin
Table 4.1 Recombinant S. cerevisiae EBY100 strains constructed in this study.
Straina Plasmid Phenotype
HZ1901 pYD1ctrl & pRS425 No surface display (negative control)
HZ1859
(CipA3-EGII)
pYD1-CipA3-EGII Displays unifunctional minicellulosome
with EGII activity
HZ1890
(CipA3-CBHII)
pYD1-CipA3 &
pRS425-CBHII
Displays unifunctional minicellulosome
with CBHII activity
HZ1900
(CipA3-BGL1)
pYD1-CipA3 &
pRS425-BGL1
Displays unifunctional minicellulosome
with BGL1 activity
HZ1892
(CipA3-EGII-CBHII)
pYD1-CipA3-EGII &
pRS425-CBHII
Displays bifunctional minicellulosome
with EGII and CBHII activityb
HZ1886
(CipA3-EGII-CBHII-BGL1)
pYD1-CipA3-EGII &
pRS425-CBHII-BGL1
Displays trifunctional minicellulosome
with EGII, CBHII, and BGL1 activityb
HZ1891
(CipA1-EGII-CBHII)
pYD1-CipA1-EGII &
pRS425-CBHII
Displays two types of unifunctional
minicellulosomes with EGII or CBHII
activity, respectively
HZ1885
(CipA1-EGII-CBHII-BGL1)
pYD1-CipA1-EGII &
pRS425-CBHII-BGL1
Displays three types of unifunctional
minicellulosomes with EGII, CBHII, and
BGL1 activity, respectively
a For the purpose of clarity, the strains will be referred by their names in the parentheses.
b The phenotype listed in the table assumes that all minicellulosome components are expressed at an
equal molar ratio. However, due to the relative low enzyme expression level, our results showed a
heterogeneous population of cells displaying uni-, bi-, and/or trifunctional minicellulosomes when two
or three enzymes were co-expressed with CipA3 (see Section 4.2.3 below).

110
domains of the miniscaffoldin on the cell surface, forming a minicellulosome structure (Figure
4.1). The N-terminal epitope tags are included to allow the detection of successful assembly of
minicellulosomes using flow cytometry.
4.2.2. Yeast Surface Assembly of Unifunctional Minicellulosomes
Yeast surface display of the miniscaffoldin CipA3 is pivotal to the minicellulosome
assembly since it serves as the anchor for the secreted enzymes. To verify the surface
immobilization of CipA3, yeast cells transformed with pYD1-CipA3 were stained with
monoclonal anti-V5 antibody and analyzed by flow cytometry. As shown in Figure 4.3, a
positive staining population was detected, indicating that the CipA3 was successfully displayed
in full length on yeast cell surface. The peak observed for the strain transformed with plasmid
pYD1ctrl was the background fluorescence typical for yeast cells. By using calibration
microsphere standards coated with a known amount of fluorochrome molecules, the surface
display efficiency of CipA3 was determined to be approximately 1.8×10⁴ copies per cell.
PE-A
Count
100
101
102
103
104
0
25
50
75
100
pYD1ctrl
PE-A
Count
100
101
102
103
104
0
25
50
75
100
pYD1ctrl
PE-A
Count
100
101
102
103
104
0
25
50
75
100
pYD1-CipA3
PE-A
Count
100
101
102
103
104
0
25
50
75
100
pYD1-CipA3
Figure 4.3 Flow cytometric analysis of yeast cells displaying miniscaffoldin CipA3. The miniscaffoldins
CipA3 was successfully displayed on the yeast cell surface as indicated by V5-epitope detection. Yeast
cells transformed with empty plasmid pYD1ctrl was used as a negative control.

111
To test whether minicellulosomes with the simplest structure - unifunctional
minicellulosomes could be assembled on the yeast cell surface, plasmid pRS425 encoding one of
the three chimeric enzyme expression cassettes was transformed into yeast cells with or without
plasmid pYD1-CipA3. The surface display of each enzyme was monitored by measuring the
expression of the corresponding N-terminal epitope tag using flow cytometry. As shown in
Figure 4.4, the chimeric enzyme was detected on the cell surface only when the miniscaffoldin
CipA3 was co-expressed. In the absence of the miniscaffoldin, the enzyme expression was
PE-A
Co
un
t
100
101
102
103
104
0
25
50
75
100
PE-A
Co
un
t
100
101
102
103
104
0
25
50
75
100
PE-A
Count
100
101
102
103
104
0
25
50
75
100
PE-A
Co
un
t10
010
110
210
310
40
25
50
75
100
PE-A
Co
un
t
100
101
102
103
104
0
25
50
75
100
PE-A
Co
un
t
100
101
102
103
104
0
25
50
75
100CipA3 + EGII CipA3 + CBHII CipA3 + BGL1
EGII CBHII BGL1
Figure 4.4 Flow cytometric analysis of yeast cells displaying unifunctional minicellulosomes. Chimeric
enzyme display was dependent on the presence of the miniscaffoldin on the cell surface. With CipA3 on
the surface (top row), enzymes were detected. In contrast, without CipA3 on the surface (bottom row), no
enzymes were detected on the surface. This CipA3-dependence indicated the successful assembly of
unifunctional minicellulosomes. The results were representative of three independent experiments using
three individual clones.

112
detected in the supernatant (data not shown), but not on the cell surface, and the recombinant
yeast cells only showed background fluorescence (Figure 4.4, bottom row).
Compared to EGII or CBHII, co-expression of BGL1 did not result in a significant
fluorescence peak shift (Figure 4.4, top right panel), indicating a low surface display level of
BGL1. To exclude the possibility that the fusion of BGL1 affected the binding of docA to CipA3,
the supernatant of strain CipA3-BGL1 (Table 4.1) was analyzed by SDS-PAGE (Figure 4.5)
and Western blotting (data not shown). Even after concentrating the supernatant by ~75 fold, no
free BGL1 was detected using either method. To analyze the cell pellet fraction, ~1.5x10⁷ yeast
cells were boiled to release the surface displayed proteins. While a very faint band of CipA3 was
observed (indicated by arrows in Figure 4.5), no BGL1 was detected. Note that CipA3 was
expressed at a much higher level (~180-fold) than BGL1 (Figure 4.6). These data suggested that
1 2 3 4 5 6 7
250
15010075
50
37
2520
15
10
1 2 3 4 5 6 7
250
15010075
50
37
2520
15
10
Figure 4.5 SDS-PAGE analysis of cellulosomal component expression by strain CipA3-BGL1. The
molecular weights (KDa) of the protein standards are shown on the left. Lane 1: prestained protein
standards, lane 2(5): supernatant of the CipA3-BGL1 (negative control) induction culture concentrated by
75-fold, lane 3(6) & 4(7): cell-associated protein fraction from ~0.75×10⁷ & 1.5×10
7 CipA3-BGL1
(negative control) cells, respectively. The bands of CipA3 protein are indicated by arrows.

113
the majority, if not all, of the secreted BGL1 bound to the cell surface. Therefore, the low surface
display level of BGL1 was a result of low expression level of chimeric BGL1. Taken together,
these results indicated that unifunctional cellulosomes were successfully assembled on the yeast
cell surface through the interaction between the dockerin domain of the secreted chimeric
enzyme and the cohesin module of miniscaffoldin CipA3.
4.2.3. Yeast Surface Assembly of Bifunctional and Trifunctional Minicellulosomes
With the success of unifunctional minicellulosome assembly, the ability of yeast cells to
display more complex minicellulosomes on the surface was examined next. Two yeast strains,
CipA3-EGII-CBHII and CipA3-EGII-CBHII-BGL1, were constructed to test the assembly of
bifunctional and trifunctional minicellulosomes, respectively. As shown in Figure 4.6,
CipA3-EGII CipA3-CBHII CipA3-BGL1 CipA3-EGII-CBHII CipA3-EGII-CBHII-BGL1 negative
10
100
1000
10000
Re
lative
me
an
flu
ore
scence
units
CipA3
EGII
CBHII BGL1
Figure 4.6 Display levels of all CipA3-based minicellulosomal components on the yeast cell surface.
Refer to Table 4.1 for the phenotype of each yeast strain. The results were obtained from three
independent experiments using three individual clones, and the average and standard deviation were
plotted.

114
compared to yeast strains displaying unifunctional minicellulosomes (CipA3-EGII, CipA3-
CBHII, and CipA3-BGL1), coexpression of two chimeric enzymes in strain CipA3-EGII-CBHII
caused a noticeable but not significant decrease in the display levels of all three minicellulosomal
components. However, the expression of a third enzyme in strain CipA3-EGII-CBHII-BGL1
caused a dramatic decrease in the display level of CBHII with a more than 160-fold drop in mean
fluorescence units (MFU), which might be a result of the metabolic burden imposed on the cells
by trying to produce all four proteins simultaneously. Alternatively, it might be a result of the
“balancing function” of the bi-directional GAL1-10 promoter used for protein expression [34].
The significant lower expression levels of CBHII and BGL1 compared to CipA3 and
EGII also suggested an imbalanced molar ratio of the four minicellulosome components, which
could in theory lead to three populations of yeast cells each displaying uni-, bi-, or trifunctional
minicellulosomes within the induced CipA3-EGII-CBHII-BGL1 culture. To test this hypothesis
and measure the percentage of each population, multi-antibody-staining analysis was conducted.
Compared to single-antibody-staining, multi-antibody-staining showed a significantly lower
efficiency, resulting in a ~22-, ~85-, and ~3.5-fold reduction in the percentage of positive-
staining population for EGII (Figure 4.7, left panel), CBHII, and BGL1 (data not shown),
respectively. This reduction in antibody staining signal was expected since three enzymatic
minicellulosomal components were in close proximity to each other, creating steric hindrance for
simultaneous access of three bulky antibody-fluorochrome conjugates. Nevertheless, both
double-positive (EGII+-CBHII
+ in the lower-right quadrant and EGII
+-BGL1
+ in the upper left
quadrant of Figure 4.7, right panel, respectively) and triple-positive (EGII+-CBHII
+-BGL1
+ in
the upper right quadrant of Figure 4.7, right panel) populations were detected for strain CipA3-
EGII-CBHII-BGL1, indicating that a fraction of the cells displayed bifunctional (~0.3%) and
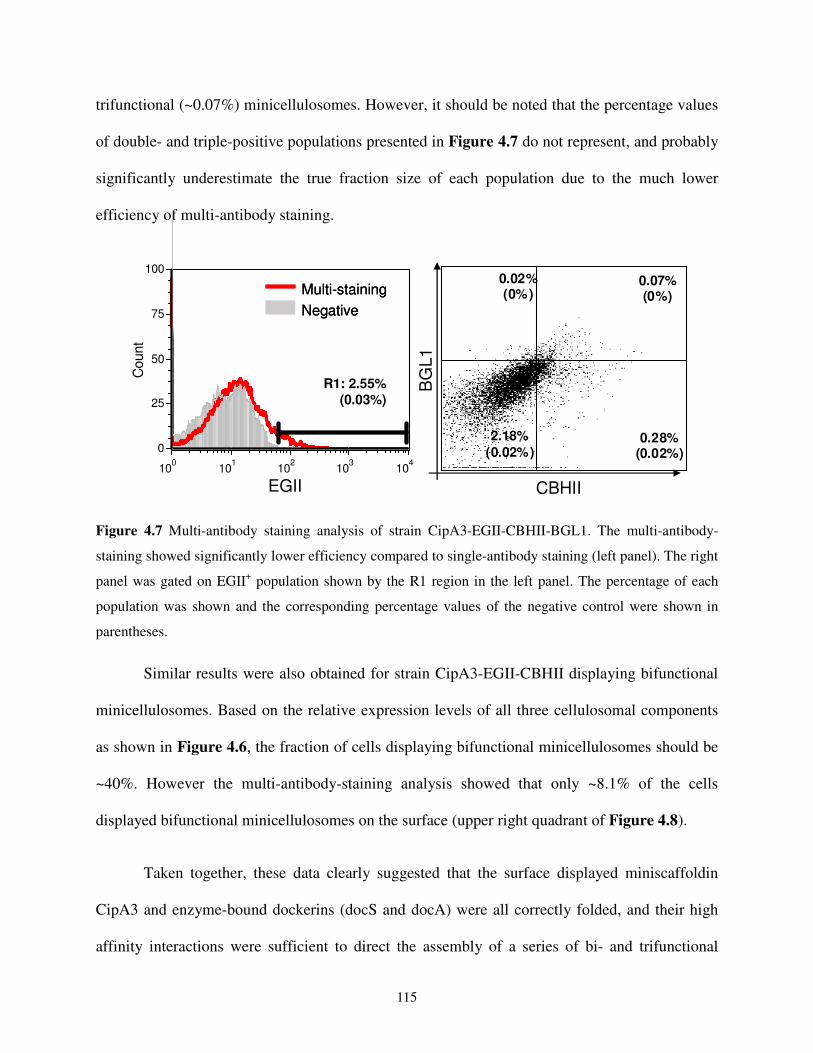
115
trifunctional (~0.07%) minicellulosomes. However, it should be noted that the percentage values
of double- and triple-positive populations presented in Figure 4.7 do not represent, and probably
significantly underestimate the true fraction size of each population due to the much lower
efficiency of multi-antibody staining.
PE-A
Count
100
101
102
103
104
0
25
50
75
100
R1
0.28%(0.02%)
0.07%(0%)
0.02%(0%)
2.18%
(0.02%)
Multi-staining
Negative
Multi-staining
Negative
R1: 2.55%(0.03%)
CBHII
BG
L1
EGII
Figure 4.7 Multi-antibody staining analysis of strain CipA3-EGII-CBHII-BGL1. The multi-antibody-
staining showed significantly lower efficiency compared to single-antibody staining (left panel). The right
panel was gated on EGII+ population shown by the R1 region in the left panel. The percentage of each
population was shown and the corresponding percentage values of the negative control were shown in
parentheses.
Similar results were also obtained for strain CipA3-EGII-CBHII displaying bifunctional
minicellulosomes. Based on the relative expression levels of all three cellulosomal components
as shown in Figure 4.6, the fraction of cells displaying bifunctional minicellulosomes should be
~40%. However the multi-antibody-staining analysis showed that only ~8.1% of the cells
displayed bifunctional minicellulosomes on the surface (upper right quadrant of Figure 4.8).
Taken together, these data clearly suggested that the surface displayed miniscaffoldin
CipA3 and enzyme-bound dockerins (docS and docA) were all correctly folded, and their high
affinity interactions were sufficient to direct the assembly of a series of bi- and trifunctional
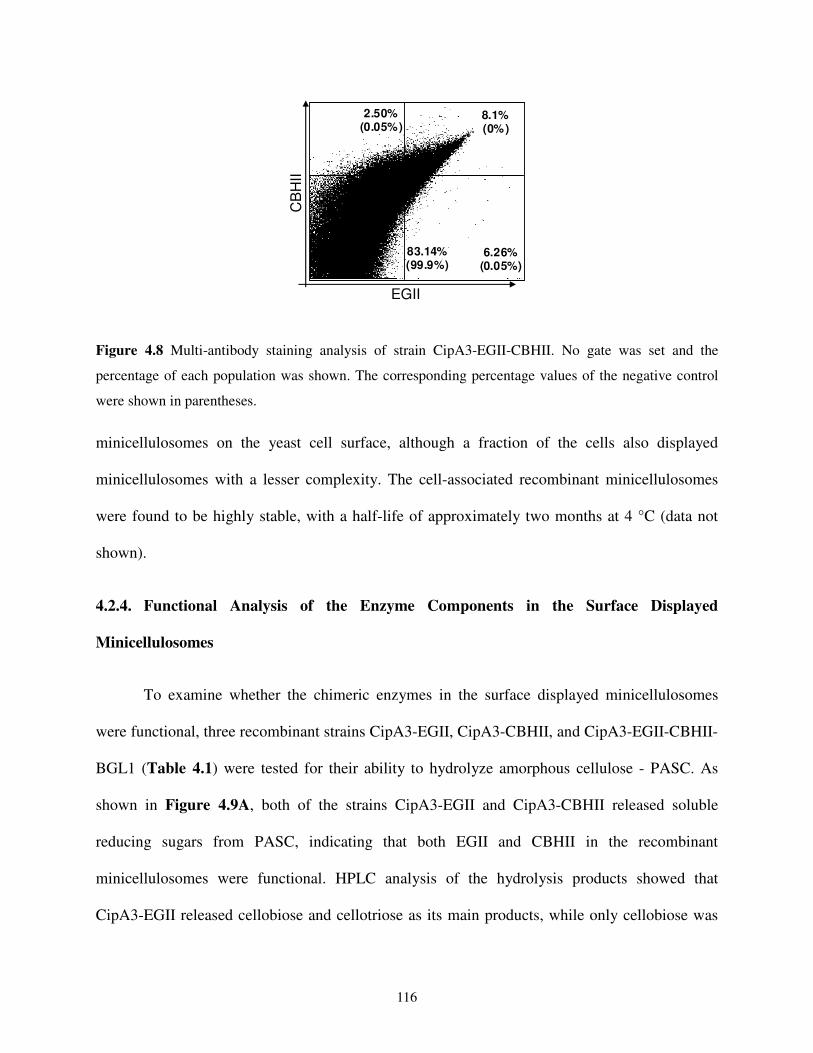
116
6.26%(0.05%)
8.1%(0%)
2.50%(0.05%)
83.14%(99.9%)
EGIIC
BH
II
Figure 4.8 Multi-antibody staining analysis of strain CipA3-EGII-CBHII. No gate was set and the
percentage of each population was shown. The corresponding percentage values of the negative control
were shown in parentheses.
minicellulosomes on the yeast cell surface, although a fraction of the cells also displayed
minicellulosomes with a lesser complexity. The cell-associated recombinant minicellulosomes
were found to be highly stable, with a half-life of approximately two months at 4 °C (data not
shown).
4.2.4. Functional Analysis of the Enzyme Components in the Surface Displayed
Minicellulosomes
To examine whether the chimeric enzymes in the surface displayed minicellulosomes
were functional, three recombinant strains CipA3-EGII, CipA3-CBHII, and CipA3-EGII-CBHII-
BGL1 (Table 4.1) were tested for their ability to hydrolyze amorphous cellulose - PASC. As
shown in Figure 4.9A, both of the strains CipA3-EGII and CipA3-CBHII released soluble
reducing sugars from PASC, indicating that both EGII and CBHII in the recombinant
minicellulosomes were functional. HPLC analysis of the hydrolysis products showed that
CipA3-EGII released cellobiose and cellotriose as its main products, while only cellobiose was

117
detected in the hydrolysis reaction mixture of strain CipA3-CBHII (data not shown). Although
no reducing sugar was detected in the hydrolysis reaction mixture of strain CipA3-EGII-CBHII-
BGL1, a significant reduction of the residual insoluble PASC was observed (Figure 4.9B),
indicating that BGL1 was active.
0 20 40 60 80 100
0.0
0.2
0.4
0.6
0.8
1.0
1.2
1.4
1.6
1.8
2.0
2.2
2.4
Re
lea
se
d r
ed
ucin
g s
uga
rs (
mM
)
Time (hr)
CipA3-EGII CipA3-CBHII negative
CipA3-EGII-CBHII CipA3-EGII-CBHII-BGL1
A
0 20 40 60 80 100
0.0
0.2
0.4
0.6
0.8
1.0
1.2
1.4 CipA3-EGII CipA3-CBHII negative
CipA3-EGII-CBHII CipA3-EGII-CBHII-BGL1
Re
sid
ua
l P
AS
C (
g/L
)
Time (hr)
B
Figure 4.9 Functional analysis of surface displayed minicellulosomes. Cells displaying different
minicellulosomes were tested for their ability to hydrolyze PASC. The concentrations of (A) released
reducing sugars and (B) residual PASC were plotted over time. All data points were obtained from
triplicate experiments, and the average and standard deviation were plotted.
The activity of BGL1 was further analyzed using cellobiose as substrate. The traditional
p-nitrophenyl-β-glucopyransoside-based BGL1 activity assay was not used because cellobiose is
the authentic substrate in the context of direct fermentation of PASC to ethanol. In addition,
efficient cellobiose utilization is a prerequisite to a successful development of a cellulolytic yeast
strain. As shown in Figure 4.10, the growth of strain CipA3-EGII-CBHII-BGL1 using
cellobiose as the sole carbon source indicated that the BGL1 was active. In addition, the inability
of strain CipA3-EGII-CBHII to grow on cellobiose excluded the possibility of yeast endogenous
BGL activity. These data clearly suggested that BGL1 was highly active, and the soluble

118
oligosaccharides were quickly hydrolyzed by BGL1 to glucose, which was then immediately
assimilated by yeast cells. Both HPLC analysis (data not shown) and phenol-sulfuric acid assay
(Figure 4.9) showed that no PASC was hydrolyzed by the negative control strain. Taken
together, these results demonstrated that all three chimeric enzymes in the minicellulosomes
were active. The continuous degradation of PASC indicated that the surface displayed
cellulosomes were also highly stable at 30 °C (Figure 4.9), and the hydrolysis reached
completion after ~6 days for strain CipA3-EGII-CBHII-BGL1 (data not shown).
0 50 100 150 200 250
0.0
0.5
1.0
1.5
2.0
2.5
3.0
OD
600
Time (hr)
CipA3-EGII-CBHII-BGL1
CipA3-EGII-CBHII
negative
Figure 4.10 Time courses of the cell growth using cellobiose as the sole carbon source. Samples were
taken at indicated time points and the optical density was measured at the wavelength of 600 nm using a
UV-Vis spectrometer. All data points were obtained from triplicate experiments, and the average and
standard deviation were plotted.
4.2.5. Enhanced Synergy of Bifunctional and Trifunctional Minicellulosomes
The recombinant yeast strains were tested for their ability to hydrolyze amorphous
cellulose PASC at 30°C. The number-average degree of polymerization of PASC and Avicel was
determined to be 190 and 192, respectively, suggesting that the phosphoric acid treatment

119
process disrupted the supramolecular structure of Avicel without any significant acid hydrolysis.
Compared to yeast displaying unifunctional minicellulosomes (i.e. CipA3-EGII, CipA3-CBHII),
strain CipA3-EGII-CBHII displaying bifunctional minicellulosomes showed an increased
hydrolysis rate towards PASC (Figure 4.9A). Despite the dramatic decrease in CBHII display
level, the addition of a third enzyme, BGL1, in strain CipA3-EGII-CBHII-BGL1 further
enhanced the hydrolysis efficiency as indicated by lesser amount of residual PASC (Figure
4.9B). The level of the observed activity enhancement reached a maximum of ~8.8 fold after ~24
hours (Figure 4.9B and Figure 4.12), then decreased to ~2 fold and remained steady until the
completion of hydrolysis after ~144 hours (data not shown).
To further examine whether the enhanced hydrolytic activity of bi- and trifunctional
minicellulosomes was simply a result of enzyme-enzyme synergy or a combination of enzyme-
enzyme synergy and enzyme proximity synergy - a characteristic feature of cellulosomes - two
more recombinant yeast strains, CipA1-EGII-CBHII and CipA1-EGII-CBHII-BGL1, were
constructed (Table 4.1). In these two strains, a different miniscaffoldin CipA1 consisting of a
CBD and a single cohesin module (CBD-Coh3) was used to enable simultaneous display of two
or three types of unifunctional minicellulosomes (Figure 4.11A). Similar to the results of CipA3,
the CipA1 miniscaffoldin protein showed a high surface display level (Figure 4.11B) with
approximately 3×10⁴ copies per cell. In addition, CipA1-dependent display of enzymes was also
observed (Figure 4.11C), indicating successful assembly of unifunctional minicellulosomes on
the yeast cell surface. Compared to the CipA3-based unifunctional minicellulosomes (Figure
4.4), the CipA1-based complexes showed slightly higher display levels (Figure 4.11C),
presumably due to a lighter metabolic burden for expressing a smaller miniscaffoldin protein.

120
PE-A
Count
100
101
102
103
104
0
25
50
75
100
pYD1-CipA1
PE-A
Count
100
101
102
103
104
0
25
50
75
100
pYD1-CipA1
Yeast cell wall
CipA1-EGII-CBHII-BGL1
Coh3
BGL1
Aga1-Aga2 CBD
Coh3
CBD
EGII
Coh3
CBD
CBHII
Yeast cell wall
CipA1-EGII-CBHII-BGL1
Coh3
BGL1
Coh3
BGL1BGL1
Aga1-Aga2 CBD
Coh3
CBD
EGIIEGII
Coh3
CBD
CBHIICBHIIA B
PE-A
Count
100
101
102
103
104
0
25
50
75
100
CipA1 + EGII
PE-A
Count
100
101
102
103
104
0
25
50
75
100
CipA1 + CBHII
PE-A
Count
100
101
102
103
104
0
25
50
75
100
CipA1 + BGL1
PE-A
Count
100
101
102
103
104
0
25
50
75
100
EGII
PE-A
Count
100
101
102
103
104
0
25
50
75
100
CBHII
PE-A
Count
100
101
102
103
104
0
25
50
75
100
BGL1
C
Figure 4.11 Characterization of CipA1-based minicellulosomes on yeast cell surface. (A) Schematic
representation of CipA1-based minicellulosome display, which enables codisplay of three unifunctional
minicellulosomes that are spatially distributed. The miniscaffoldin CipA1 (CBD-Coh3) was expressed at
a high level (B) and served as an anchor for surface assembly of unifunctional minicellulosomes (C).
Because the a-agglutinin receptor is incapable of two dimensional diffusion [35], the
unifunctional CipA1-based minicellulosomes are spatially distributed on the yeast cell surface
(Figure 4.11A) and should exhibit little, if not any, enzyme proximity synergy. As a result, the
comparison between the CipA1- and CipA3-based minicellulosomes allows us to dissect the
contributions of the two different synergisms. As shown in Figure 4.12, both strain CipA1-EGII-

121
CBHII and CipA1-EGII-CBHII-BGL1 clearly showed enzyme-enzyme synergy and resulted in a
~5.5-fold higher activity than CipA3-EGII and CipA3-CBHII after 24 hours. When the chimeric
enzymes were brought in proximity on the miniscaffoldin CipA3, strain CipA3-EGII-CBHII and
CipA3-EGII-CBHII-BGL1 showed another ~1.3- and 1.6-fold higher activity than their
corresponding CipA1-strains, respectively. These results strongly suggested that the enhanced
hydrolytic activity of the bi- and tri-functional minicellulosomes displayed on yeast cell surface
was a combined result of enzyme-enzyme synergy and enzyme proximity synergy. More
specifically, the enzyme-enzyme synergy and enzyme proximity synergy accounted for ~63%
and ~37% of the overall enhanced activity of the trifunctional minicellulosome, respectively.
0
20
40
60
80
100
24 hr 73 hr
% c
onve
rsio
n
CipA3-EGII-CBHII-BGL1 CipA3-EGII-CBHII
CipA1-EGII-CBHII-BGL1
CipA1-EGII-CBHII CipA3-EGII
CipA3-CBHII
Enzyme-enzyme synergy~5.5-fold
Enzyme proximity synergy~1.6-fold
0
20
40
60
80
100
24 hr 73 hr
% c
onve
rsio
n
CipA3-EGII-CBHII-BGL1 CipA3-EGII-CBHII
CipA1-EGII-CBHII-BGL1
CipA1-EGII-CBHII CipA3-EGII
CipA3-CBHII
Enzyme-enzyme synergy~5.5-fold
Enzyme proximity synergy~1.6-fold
Figure 4.12 Enhanced synergy of bifunctional and trifunctional minicellulosomes. The PASC conversion
percentages of six surface engineered yeast strains were compared after 24 and 73 hours. The differences
between the CipA1-based minicellulosomes and the unifunctional minicellulosomes reflect the enzyme-
enzyme synergy, while those between the CipA3- and CipA1-based minicellulosomes reflect the enzyme-
proximity synergy.

122
Notably, the synergistic effect of BGL1 was more profound when it was in close
proximity with EGII and CBHII, indicating a higher local cellobiose concentration near the
surface of the PASC reacting site that inhibited the activity of EGII and/or CBHII. As a result,
although strain CipA3-EGII-CBHII-BGL1 showed much lower CBHII display level than strain
CipA3-EGII-CBHII, the former maintained higher hydrolytic activity even after ~144 hours
(data not shown), while the opposite result was obtained for the CipA1-based strains (Figure
4.12).
4.2.6. Direct Conversion of Cellulose to Ethanol by Resting Yeast Cells Displaying
Trifunctional Minicellulosomes
Direct production of ethanol from PASC was carried out anaerobically in a serum bottle
using strain CipA3-EGII-CBHII-BGL1 displaying trifunctional minicellulosomes. Since this
strain did not show sustained growth on PASC (data not shown), cells were precultured, induced,
and then resuspended in fermentation medium to an OD600 of 50. As shown in Figure 4.13,
PASC consumption by strain CipA3-EGII-CBHII-BGL1 started without a time lag, and within
the first 6 hours of fermentation, the ethanol titer quickly reached ~1 g/L. Afterwards, the ethanol
production rate slowed down and the titer reached ~1.8 g/L after 70 hours. The decrease in the
ethanol production rate was probably due to the pH increase of the fermentation medium to ~7,
at which the enzyme activity was not optimal. The yield was 0.31 grams of ethanol produced per
gram of PASC consumed, which corresponded to ~62% of the theoretical yield. Ethanol
produced by the negative control strain was not a result of PASC but YP medium fermentation
since the same amount of ethanol was also observed using un-supplemented YP medium (Figure
4.13B and data not shown).
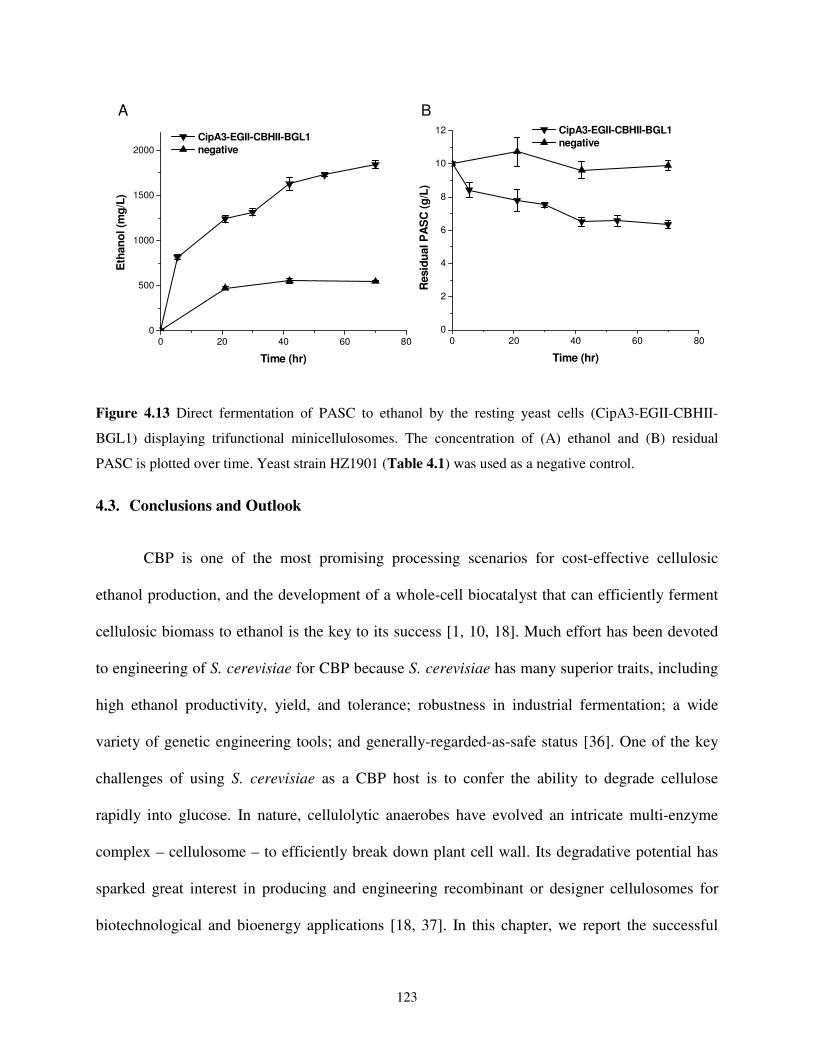
123
0 20 40 60 800
500
1000
1500
2000
CipA3-EGII-CBHII-BGL1
negative
Eth
an
ol (m
g/L
)
Time (hr)
0 20 40 60 800
2
4
6
8
10
12 CipA3-EGII-CBHII-BGL1
negative
Resid
ual P
AS
C (
g/L
)
Time (hr)
BA
Figure 4.13 Direct fermentation of PASC to ethanol by the resting yeast cells (CipA3-EGII-CBHII-
BGL1) displaying trifunctional minicellulosomes. The concentration of (A) ethanol and (B) residual
PASC is plotted over time. Yeast strain HZ1901 (Table 4.1) was used as a negative control.
4.3. Conclusions and Outlook
CBP is one of the most promising processing scenarios for cost-effective cellulosic
ethanol production, and the development of a whole-cell biocatalyst that can efficiently ferment
cellulosic biomass to ethanol is the key to its success [1, 10, 18]. Much effort has been devoted
to engineering of S. cerevisiae for CBP because S. cerevisiae has many superior traits, including
high ethanol productivity, yield, and tolerance; robustness in industrial fermentation; a wide
variety of genetic engineering tools; and generally-regarded-as-safe status [36]. One of the key
challenges of using S. cerevisiae as a CBP host is to confer the ability to degrade cellulose
rapidly into glucose. In nature, cellulolytic anaerobes have evolved an intricate multi-enzyme
complex – cellulosome – to efficiently break down plant cell wall. Its degradative potential has
sparked great interest in producing and engineering recombinant or designer cellulosomes for
biotechnological and bioenergy applications [18, 37]. In this chapter, we report the successful
124
display of two miniscaffoldins, CipA3 and CipA1, on the yeast cell surface, which served as
anchor proteins to assemble a series of uni-, bi-, and tri-functional minicellulosomes. All of the
recombinant minicellulosomes were very stable and showed hydrolytic activity towards
amorphous cellulose PASC. This study represents the first successful report of producing
functional multi-enzyme-containing minicellulosomes in vivo. More importantly, the
recombinant yeast cells displaying trifunctional minicellulosomes on the surface synergistically
hydrolyzed amorphous cellulose to glucose and directly converted it to ethanol with a titer of
~1.8 g/L. These results demonstrated the feasibility of combining designer cellulosomes and
CBP, two of the most promising technologies in future biorefinery.
A recent study has shown that synergistic hydrolysis of amorphous cellulose could be
achieved by simply codisplaying three cellulases on yeast cell surface as individual fusion
proteins with the C-terminal-half region of α-agglutinin [11]. Their experimental design
resembles the CipA1-strains created in this study, in which the enzymes are spatially distributed
on the yeast cell surface and thus no enzyme-proximity synergy could be incorporated using their
display system. In addition, the C-terminal fusion of the α-agglutinin impaired enzyme activity
since CBHII-fusion showed no activity towards PASC and no EGII activity was detected within
the first 10 hours of reaction [11]. In contrast, when CBHII or EGII were displayed on cell
surface through cohesin-dockerin interactions, both showed higher activity towards PASC
(Figure 4.9). Bringing the two enzymes in close proximity on a miniscaffoldin, CipA3 further
enhanced the activity: 1.9 mM (this study) vs. 1.3 mM [11] of reducing sugars was released from
PASC after ~72 hours. These results clearly showed the advantage of engineering cellulolytic
yeast strains through surface display of minicellulosomes to incorporate their synergistic
hydrolytic activity.
125
Another study published when the work described in this chapter [38] was under review
also successfully displayed a functional miniscaffoldin on yeast cell surface [26]. While both that
study and the work reported here showed synergistic hydrolysis and direct conversion of PASC
to ethanol, there is a significant difference between the engineered yeast strains with respect to
consolidated bioprocessing. Tsai et al. [26] did not demonstrate that the yeast cells were capable
of synthesizing functional minicellulosomes. In fact, the recombinant yeast strain in their study
was not truly cellulolytic and required in vitro loading of the enzyme components, which were
produced in E. coli, onto the scaffoldin. In contrast, we have shown that, by co-expressing a
miniscaffoldin and three types of cellulases, yeast cells could be rendered cellulolytic - a critical
requirement for using yeast cells in consolidated bioprocessing [1]. Therefore, we believe that
the yeast strain described in this study represents a better engineering platform for CBP-enabling
microorganism development. In addition, the recombinant yeast cell developed in this study
could also be a useful tool for studying and engineering the synergism of cellulosomes. The
mechanisms responsible for the enhanced activity of cellulosomes were poorly understood until
recently, when precise control of cellulosomal composition and arrangement was made possible
by constructing designer cellulosome chimeras in vitro [15, 23]. In theory, such chimeras can be
readily assembled on the yeast cell surface by replacing the miniscaffoldin CipA3 used in this
study with a chimeric scaffoldin containing divergent cohesin modules and the dockerin domains
with those of cognate specificity. Since the display method described here allows production of
all cellulosomal components in vivo, it avoids the labor-intensive protein purification step. In
addition, any of the cellulosomal components could be easily swapped with those of interest
using the DNA assembler method, which allows fast assembly of DNA fragments into a large
molecule in a single transformation step [39]. Therefore, the in vivo method described here

126
represents a convenient and robust means of producing and studying cellulosomes for
biotechnological and industrial applications. As an example, we have shown in this chapter that
the display system can be used as a simple and useful tool to dissect the contributions of enzyme-
enzyme synergy and enzyme proximity synergy to the overall enhanced hydrolytic activity of the
trifunctional minicellulosomes.
Finally, we have successfully demonstrated the direct conversion of amorphous cellulose
to ethanol using resting yeast cells displaying trifunctional minicellulosomes. However, the
direct conversion of crystalline cellulose to ethanol remains a challenging task. In theory, the
trifunctional minicellulosomes constructed in this study should meet the minimum requirement
for crystalline cellulose fermentation. Indeed, when we tested strain CipA3-EGII-CBHII-BGL1
for its ability to ferment Avicel, it did produce ethanol, but at an extremely low level with a titer
of ~0.4 g/L after about 5 days (data not shown). Such slow catalysis and low fermentation
efficiency could be potentially improved by increasing the enzyme display levels and/or activity.
Concomitantly, cellulosomes with higher levels of complexity could be assembled to further
boost synergy. Although these studies are still in progress (see Chapter 5), the results presented
in this chapter clearly underscores the potential of engineering yeast as a CBP platform organism
using the strategy of surface display of cellulosomes.
4.4. Materials and Methods
4.4.1. Strains, Media, and Reagents
S cerevisiae EBY100 (Invitrogen, Carlsbad, CA) was used for the yeast cell surface
display, and the recombinant yeast strains are summarized in Table 4.1. Escherichia coli DH5α
(Cell media facility, University of Illinois at Urbana-Champaign, Urbana, IL) was used for
127
recombinant DNA manipulation. Clostridium thermocellum (DSM1237), Trichoderma reesei
(DSM769), and Aspergillus aculeatus (DSM2344) were purchased from DSMZ (Braunschweig,
Germany). S. cerevisiae EBY100 transformants were selected and maintained on SC-Trp, SC-
Leu, or SC-Trp-Leu plates (0.167% yeast nitrogen base without amino acids and ammonium
sulfate [Difco laboratories, Detroit, MI], 0.5% ammonium sulfate, 2% glucose, 1.5% agar, and
appropriate supplements) and induced in YPG (1% yeast extract, 2% peptone, 2% galactose). E.
coli was cultured in LB medium (Fisher, Pittsburgh, PA). C. thermocellum was cultured
anaerobically in Reinforced Clostridial Medium (Difco) supplemented with 0.6% cellobiose. The
anaerobic medium was prepared by dissolving the mixed powder in anaerobic ddH2O in an
anaerobic chamber, followed by autoclave in rubber-stoppered serum bottles. T. reesei and A.
aculeatus were grown on YPAD plates (1% yeast extract, 2% peptone, 2% glucose, 0.01%
adenine hemisulphate, 1.5% agar). All restriction enzymes were obtained from New England
Biolabs (Ipswich, MA). Unless otherwise indicated, all chemicals were purchased from Sigma
(St. Louis, MO).
4.4.2. Plasmid Construction
The sequences of all PCR primers used are listed in Table 4.2. Primers were synthesized
by Integrated DNA Technologies (Coralville, IA). The PCR reaction condition used is described
in the first paragraph of Section 2.4 unless otherwise specified. Plasmid pYD1ctrl was created by
co-transforming hybridized RemoveFor/RemoveRev double-stranded DNA (dsDNA) and
XhoI/PmeI digested pYD1 (Invitrogen) to EBY100. Genes encoding miniscaffoldin CipA1 and
CipA3 were obtained by PCR using primer pairs CipA1For/CipA1Rev and CipA3For/CipA3Rev,
respectively, with C. thermocellum genomic DNA as a template. Plasmids pYD1-CipA1 and

128
pYD1-CipA3 were constructed by co-transforming the CipA1 or CipA3 PCR products and
XhoI/PmeI digested pYD1 to EBY100. See Fei Wen Notebook 6, pp. 6-8, 11.
Table 4.2 Primers used for cloning.
Name Sequence 5’→3’
RemoveFor GCAGATATCCAGCACAGTGGCGGCCGCTCGAGTCTAGAGGGCCCTTCGAATGAGT
TTAAACCCGCTGATCTGATAACAACAGTGTAGATG
RemoveRev CATCTACACTGTTGTTATCAGATCAGCGGGTTTAAACTCATTCGAAGGGCCCTCTA
GACTCGAGCGGCCGCCACTGTGCTGGATATCTGC
CipA1For CGGCCGCTCGAGAATGCAACACCGACCAAGGGAGC
CipA3Rev GCGGGTTTAAACTCACGTAGAATCGAGACCGAGGAGAGGGTTAGGGATAGGCTT
ACCTTCGAAGGGCCCATTCGAATCATCTGTCGGTGTTGTTACAGG
CipA3For CGGCCGCTCGAGGTATCGGCGGCCACAATGACAGTCGAG
egl2For2 GAGAGAAGCTCATCATCACCATCACCATGGTCAGCAGACTGTCTGGGGCCA
egl2Rev2 GTAGAGGACCCACCTCCTCCAGATCCCCATGGCTTTCTTGCGAGACACG
cbh2For GCAGAAGGCTCTTTGGACAAGAGAGAAGCTCGGCCGGATTATAAAGATGACGAT
GACAAACAAGCTTGCTCAAGCGTCTGGGGCCAATG
cbh2Rev GTAGAGGACCCACCTCCTCCAGATCCCCATGGCAGGAACGATGGGTTTGCGTTTG
TGAGAAGC
bgl1For3 GTTTTATTCGCAGCATCCTCCGCATTAGCTGCAGGTGAACAAAAACTCATCTCAG
AAGAGGATCTGGATGAACTGGCGTTCTCTCCTCCATTCTATCCC
bgl1Rev3 CGTCGCCATTTACATCACCGTAAACAACCTGAGGAGAACCTCCACCGCCACTACC
CCCGGGTTGCACCTTCGGGAGCGCTGCGTGAAGGGGC
BsaXIFor GACCACACCTCTACCGGCATGACTAGCCAGCTTTTGTTCCCT
BsaXIRevRV GGAGAGCGCACGAGGGAGCT
GAL10For CTGATTAATTACCCCAGAAATAAGGCTAAAAAACTAATCGCATTATCATC
GAL10RevRV CAAGACAATCAAAACCTTCATTTATATTGAATTTTCAAAAATTCTTACTTTTTTTTT
GG
PreproForRV CCAAAAAAAAAGTAAGAATTTTTGAAAATTCAATATAAATGAAGGTTTTGATTGT
CTTG
PreproRev CCTAGGTACGTATTTGTCATCGTCATCTTTATAATCCGGCCGAGCTTCTCTCTTGT
CC
DR1For GATTATAAAGATGACGATGACAAATACGTACCTAGGAAAGAAGAACATGTGATC
ATCCAGGCCG
DR1Rev CCATATGGGACCCACCTCCTCCAGATCCGAGCTCCTTGCTCTGTGCAGATTCAGAT
CG
C-mycFor GAGCTCGGATCTGGAGGAGGTGGGTCCCATATGGAACAAAAACTCATCTCAGAA
GAGGATCTGTGATGGACTTCTTCGCCAGAGGTTTGGTCAAGTCTC
ADH1Rev AGGGAACAAAAGCTGGCTAGTCATGCCGGTAGAGGTGTGGTC

129
Table 4.2 continued
Name Sequence 5’→3’
AGA2For GGCAGTAACCTGGCCCCACAAACCTTCAAATGAACG
pYD1Rev GTCGATTTTGTTACATCTACAC
9E-docStFor CCATGGGGATCTGGAGGAGGTGGGTCCTCTACTAAATTATACGGCGACGTC
9E-docStRev GACTTGACCAAACCTCTGGCGAAGAAGTCCATTAGTTCTTGTACGGCAATGT
G1A2For1 GCGATTAGTTTTTTAGCCTTATTTCTGGGG
G1A2Rev1 ACCTGCAGCTAATGCGGAGGATGCTGCGAATAAAACTGCAGTAAAAATTGAAGG
AAATCTCATGGTTTTTTCTCCTTGACGTTAAAGTATAGAGG
G1A2For2 CCTCAGGTTGTTTACGGTGATGTAAATGGCGACG
G1A2Rev2 GAGATCCGCTTATTTAGAAGTGTCGAATTCCTAATAAGGTAGGTGGGGTATGCTC
TTTATC
G1A2For3 GAATTCGACACTTCTAAATAAGCGGATCTC
G1A2Rev3 GTAATACGACTCACTATAGGGCGAATTGGGCTCGAGGGCATGCGAAGGAAAATG
G10A1For1 GTACAGATCCCGACCCATTTGC
G10A1Rev1 CGCTTAACTGCTCATTGCTATATTGAAGTACGGATTAGAAGCCGCCGAGCGGGTG
ACAGC
G10A1For2 GTACTTCAATATAGCAATGAGCAGTTAAGCG
G10A1Rev2 ACCATGGTGATGGTGATGATGAGCTTCTCTCTTGTCCAAAGAGCC
G10A1For3 CCATGGGGATCTGGAGGAGGTGGG
G10A1Rev3 CTAAAGGGAACAAAAGCTGGCTAGTCATGCCGGTAGAGGTGTGGTC
G10A1For4 GACCACACCTCTACCGGCATGACTAGCCAGCTTTTGTTCCCTTTAG
G10A1Rev4 CCTGGTATCTTTATAGTCCTG
BGL1-ctrl-For GGGCCCCCCCTCGAGGTCGACGGTATCGATACGGATTAGAAGCCGCCGAGCGGG
TGACAG
BGL1-ctrl-Rev CAATTAACCCTCACTAAAGGGAACAAAAGCTGGAGCTCCTCGAGGGCATGCGAA
GGAAAATGAGAAATATCG
EGII-ctrl-For GGGCCCCCCCTCGAGGTCGACGGTATCGATATCGCTTCGCTGATTAATTACCCCA
G
EGII-ctrl-Rev CAATTAACCCTCACTAAAGGGAACAAAAGCTGGAGCTCCATGCCGGTAGAGGTG
TGGTCAATAAGAGC
The construction of all other plasmids involved either the use of the DNA assembler
method as described elsewhere [39] or the conventional homologous recombination method,
which splices multiple DNA fragments into a larger molecule using PCR [40] followed by co-
transformation with a linearized vector into yeast. Both methods require preparation of several
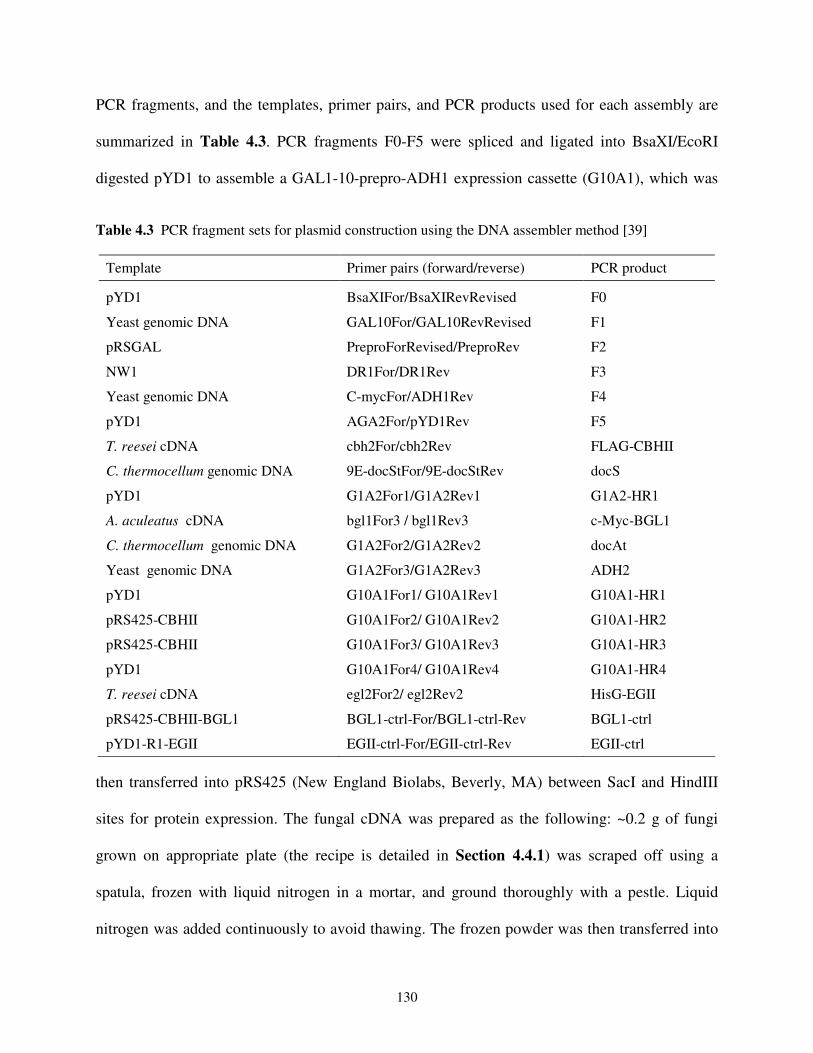
130
PCR fragments, and the templates, primer pairs, and PCR products used for each assembly are
summarized in Table 4.3. PCR fragments F0-F5 were spliced and ligated into BsaXI/EcoRI
digested pYD1 to assemble a GAL1-10-prepro-ADH1 expression cassette (G10A1), which was
Table 4.3 PCR fragment sets for plasmid construction using the DNA assembler method [39]
then transferred into pRS425 (New England Biolabs, Beverly, MA) between SacI and HindIII
sites for protein expression. The fungal cDNA was prepared as the following: ~0.2 g of fungi
grown on appropriate plate (the recipe is detailed in Section 4.4.1) was scraped off using a
spatula, frozen with liquid nitrogen in a mortar, and ground thoroughly with a pestle. Liquid
nitrogen was added continuously to avoid thawing. The frozen powder was then transferred into
Template Primer pairs (forward/reverse) PCR product
pYD1 BsaXIFor/BsaXIRevRevised F0
Yeast genomic DNA GAL10For/GAL10RevRevised F1
pRSGAL PreproForRevised/PreproRev F2
NW1 DR1For/DR1Rev F3
Yeast genomic DNA C-mycFor/ADH1Rev F4
pYD1 AGA2For/pYD1Rev F5
T. reesei cDNA cbh2For/cbh2Rev FLAG-CBHII
C. thermocellum genomic DNA 9E-docStFor/9E-docStRev docS
pYD1 G1A2For1/G1A2Rev1 G1A2-HR1
A. aculeatus cDNA bgl1For3 / bgl1Rev3 c-Myc-BGL1
C. thermocellum genomic DNA G1A2For2/G1A2Rev2 docAt
Yeast genomic DNA G1A2For3/G1A2Rev3 ADH2
pYD1 G10A1For1/ G10A1Rev1 G10A1-HR1
pRS425-CBHII G10A1For2/ G10A1Rev2 G10A1-HR2
pRS425-CBHII G10A1For3/ G10A1Rev3 G10A1-HR3
pYD1 G10A1For4/ G10A1Rev4 G10A1-HR4
T. reesei cDNA egl2For2/ egl2Rev2 HisG-EGII
pRS425-CBHII-BGL1 BGL1-ctrl-For/BGL1-ctrl-Rev BGL1-ctrl
pYD1-R1-EGII EGII-ctrl-For/EGII-ctrl-Rev EGII-ctrl

131
an eppendorf tube quickly and treated using the RNeasy plant kit (Qiagen, Valencia, CA)
following the manual for filamentous fungi. The on-column DNase digestion was performed
using the RNase-Free DNase set (Qiagen) following manufacturer's protocol. The isolated total
RNA was used as template to synthesize the cDNA library immediately using the transcriptor
first strand cDNA synthesis kit (Roche, Indianapolis, IN) with oligo (dT)18 primer. Plasmid
pRS425-CBHII was obtained by co-transforming FLAG-CBHII, docS, and EagI/NdeI digested
pRS425-G10A1 into EBY100. Plasmids pRS425-EGII and pRS425-BGL1 were obtained by co-
transforming EGII-ctrl and BGL1-ctrl, respectively, with HindIII/SacI digested pRS425 into
EBY100. Plasmid pRS425-CBHII-BGL1 was obtained by co-transforming G1A2-HR1, c-Myc-
BGL1, docAt, ADH2, and ApaI digested pRS425-CBHII. Plasmid pYD1-CipA1(3)-EGII was
obtained by co-transforming G10A1-HR1, G10A1-HR2, G10A1-HR3, G10A1-HR4, HisG-EGII,
and DrdI/NheI digested pYD1-CipA1(3) into EBY100. All plasmids were purified from S.
cerevisiae and transformed into DH5α, recovered, and confirmed by DNA sequencing. See Fei
Wen Notebook 4, pp. 37-40, and Notebook 6, pp. 4-5, 13, 19, 25.
4.4.3. Yeast Surface Display and Flow Cytometry Analysis
S. cerevisiae EBY100 clones transformed with different plasmid constructs were cultured,
induced for 48 hours or 72 hours, and analyzed using flow cytometry as described elsewhere [41]
except that only 2.5x10⁶ cells were used in each staining assay (see Section 2.4.5 for more
details). 48-hour induction was used for strains CipA3-EGII-CBHII-BGL1 and CipA1-EGII-
CBHII-BGL1 to get higher enzyme display levels, while 72-hour induction was used for all other
strains to get higher cell density. 24-hour induction was also tested, but it did not reach full level
of protein expression. Primary mouse monoclonal antibodies used in the assay were anti-V5
(Invitrogen), anti-His (Sigma), anti-FLAG (Sigma), and anti-c-Myc (Invitrogen) with a 100-fold

132
dilution rate. Quantification of the surface expression level of the miniscaffoldin was carried out
using the Quantum FITC MESF microsphere kit (Bangs Laboratories, Inc., Fishers, IN) and anti-
V5-FITC monoclonal antibody (Invitrogen) following manufacturer’s protocol. Since the clonal
variation of enzyme expression level was small (Figure 4.6), a single clone was analyzed in
triplicate in the enzyme activity assay and resting cell study. See Fei Wen Notebook 6, pp. 14,
19-20, 23.
4.4.4. Substrate Preparation and Carbohydrate Assays
PASC was generated from Avicel PH-101 crystalline cellulose as described elsewhere
[42]. Briefly, 10 g of Avicel was slowly added into 30 mL ddH2O with stirring at 4 °C, forming
a homogeneous solid white paste. A total volume of 500 mL of 85% phosphoric acid was then
added into the Avicel paste at 4 °C with the first 250 mL added very slowly. The resulting
transparent solution was left at 4 °C overnight with gentle stirring. The cellulose was precipitated
by addition of 4×500 mL of cold ddH2O with vigorous mixing between each addition, followed
by extensive wash with cold ddH2O until pH reached ~6. The residual phosphoric acid was
neutralized by washing the cellulose with 1% NaHCO3 three times and then with cold ddH2O
until pH reached ~5-7. For long-term storage, 5 mM sodium azide was added to prevent bacterial
growth. Before enzyme activity assay or resting cell study, the PASC was washed at least ten
times to remove sodium azide and/or soluble sugars.
The concentration and number-average degree of polymerization of the insoluble
substrates (PASC and Avicel) were determined using the phenol-sulfuric acid method and the
modified 2,2'-bicinchoninate (BCA) method as described elsewhere [43, 44]. The phenol-sulfuric
acid method was used to measure the total sugar concentration. Briefly, 1 mL of diluted sample

133
(0.001%-0.01% glucose equivalent) was mixed with 1 mL of 5% cold phenol, followed by
addition of 5 mL of 98% sulfuric acid. The mixture was immediately mixed by inverting the tube
three times and then cooled down to room temperature before measuring the absorbance at 490
nm. Caution is needed in this step since the mixing generates a lot of heat. The modified BCA
method was used to measure the reducing sugar concentration. Briefly, 1 mL of diluted sample
(0.0001%-0.001% glucose equivalent) was mixed with 1 mL of BCA working solution (made
fresh by mixing equal volumes of solution A containing 0.942% disodium 2,2’-bicinchoninate,
5.428% Na2CO3, and 2.42% NaHCO3, and solution B containing 1.248% CuSO4•5H2O and
1.262% L-serine). The mixture was shaken at 75 °C, 250 rpm for 30 minutes and then cooled
down to room temperature. For soluble sugars, the absorbance of the mixture was measured at
560 nm directly; for insoluble sugars, the reaction mixture was spun down and the absorbance of
the supernatant was measured at 560 nm.
When analyzing the hydrolytic activity of cell surface displayed minicellulosomes, the
Somogyi-Nelson method was used to measure the reducing sugar concentration as described
elsewhere [43]. Briefly, the Somogyi working solution was prepared fresh by mixing 800 µL of
Somogyi reagent I containing 18% Na2SO4, 1.5% Rochelle, 3% Na2CO3, and 2% NaHCO3 with
200 µL of Somogyi reagent II containing 18% Na2SO4 and 2% CuSO4•5H2O. 1 mL of diluted
sample (0.001%-0.01% glucose equivalent) was then mixed with 1 mL of Somogy working
solution, boiled for 15 minutes, cooled down to room temperature, and 1 mL of Nelson reagent
(5% ammonium molybdate, 4.2% H2SO4, and 0.6% sodium arsenate) was added and mixed
vigorously by vortexing. Caution is needed in this step since the mixing generates a lot of gas,
and the assay should be carried out in a 15 mL tube. The BCA assay should not be used when
there are cells in the reaction even with SDS precipitation and ethanol washing. The
134
dinitrosalicylic (DNS) colorimetric assay did not work well for reducing sugar measurement,
giving non-linear and irreproducible standard curves. See Fei Wen Notebook 6, pp. 16, 29-30,
32-33.
4.4.5. Enzyme Activity Assays
Yeast transformants displaying different minicellulosomes on the cell surface were
analyzed for their ability to hydrolyze PASC and Avicel. After induction in YPG, cells were
washed twice with hydrolysis buffer (50 mM sodium acetate, pH 5.0) to prevent media carry
over and then resuspended in hydrolysis buffer supplemented with 0.1% PASC or Avicel to
OD600~10. The induced cells could be stored at 4 °C for up to two weeks without significant loss
of hydrolytic activity. Hydrolysis reactions were carried out in serum bottles at 30 °C with 100
rpm agitation and 2 mL of reaction sample was drawn at time intervals as indicated. The amount
of reducing sugar released from the insoluble substrates was measured using the Somogyi-
Nelson method, and the concentrations of total sugar, total soluble sugar, and cell derived sugar
were quantified using the phenol-sulfuric acid method. The concentration of residual insoluble
sugar was obtained by subtracting total soluble sugar and cell derived sugar from total sugar. All
sugar concentrations were determined as glucose equivalent. The supernatant was analyzed for
the hydrolysis products using high performance liquid chromatography (HPLC) equipped with a
low temperature evaporative light scattering detector (Shimadzu, Columbia, MD). Separation
was carried out using a Prevail carbohydrate ES column (Alltech Associates, Inc., Deerfield, IL)
at 32 °C using a gradient mobile phase (80-65% acetonitrile in water in 50 min, v/v) at a flow
rate of 1 mL/min.

135
The activity of BGL1 was analyzed by cell growth using cellobiose as the only carbon
source. Induced yeast trains (CipA3-EGII-CBHII-BGL1, CipA3-EGII-CBHII, and negative
control) were washed twice with corresponding synthetic drop-out media supplemented with 1%
of cellobiose and then resuspended to OD600~0.1. Samples were drawn at time intervals as
indicated and the cell density was plotted over time. The cell growth on PASC was also
examined. The induced yeast cells were washed twice with YPA medium and the PASC was
washed extensively (at least 5-10 times) with YPA (1% yeast extract, 2% peptone, 2% glucose,
0.01% adenine hemisulphate) to remove sodium azide and soluble sugars. Then the cells and
PASC were combined and resuspended in YPA to final OD600~1 and 0.5%, respectively. The
cell density was determined using a hemacytometer (Hausser Scientific, Horsham, PA). See Fei
Wen Notebook 6, pp. 18-19, 27, 31-37.
4.4.6. Ethanol Production from PASC Using Resting Cells
After induction in YPG, yeast strain CipA3-EGII-CBHII-BGL1 was washed twice with
YP medium (1% yeast extract, 2% peptone) and resuspended to OD600~50 in YP medium
supplemented with 0.001% ergosterol, 0.042% Tween 80, and 1% PASC/Avicel. All reagents
were prepared anaerobically and the experiment was carried out in an anaerobic chamber.
Ergosterol was prepared as a 500× stock solution in dimethylformamide. The yeast strain
HZ1901 was used as a negative control and analyzed the same way as strain CipA3-EGII-
CBHII-BGL1. The fermentation was carried out anaerobically in serum bottles at 30 °C with 250
rpm agitation and 1 mL of sample was taken at time intervals as indicated. Residual total sugar
concentration was determined by subtracting cell derived sugar from total sugar. Ethanol
concentration was determined by gas chromatography using an Agilent 7890A (Agilent Inc.,
Palo Alto, CA) equipped with an Agilent 5975C mass selective detector and an HP-INNOWAX

136
column (Agilent Inc.) with helium as the carrier gas (1 mL/min flow rate). 1-propanol was used
as the internal standard. The temperature program used for compound separation was 80 °C for 2
min, 5 °C/min to 150 °C, 25 °C/min to 260 °C for 2 min. See Fei Wen Notebook 6, pp. 33, 36-37.
4.5. References
1. Lynd, L.R., et al., Microbial cellulose utilization: fundamentals and biotechnology.
Microbiol Mol Biol Rev, 2002. 66(3): p. 506-77.
2. Lynd, L.R., et al., How biotech can transform biofuels. Nat Biotechnol, 2008. 26(2): p. 169-
72.
3. Wen, F., N.U. Nair, and H. Zhao, Protein engineering in designing tailored enzymes and
microorganisms for biofuels production. Curr Opin Biotechnol, 2009. 20(4): p. 412-9.
4. US Department of Energy Office of Science and Office of Energy Efficiency and Renewable
Energy, Breaking the biological barriers to cellulosic ethanol: a joint research Agenda,
DOE/SC-0095. www.doegenomestolife.org/biofuels/. 2006.
5. Wyman, C.E., What is (and is not) vital to advancing cellulosic ethanol. Trends Biotechnol,
2007. 25(4): p. 153-7.
6. Demain, A.L., M. Newcomb, and J.H. Wu, Cellulase, clostridia, and ethanol. Microbiol Mol
Biol Rev, 2005. 69(1): p. 124-54.
7. Himmel, M.E., et al., Biomass recalcitrance: engineering plants and enzymes for biofuels
production. Science, 2007. 315(5813): p. 804-7.
8. Rubin, E.M., Genomics of cellulosic biofuels. Nature, 2008. 454(7206): p. 841-5.
9. Cosgrove, D.J., Growth of the plant cell wall. Nat Rev Mol Cell Biol, 2005. 6(11): p. 850-61.
10. Lynd, L.R., et al., Consolidated bioprocessing of cellulosic biomass: an update. Curr Opin
Biotechnol, 2005. 16(5): p. 577-83.
137
11. Fujita, Y., et al., Synergistic saccharification, and direct fermentation to ethanol, of
amorphous cellulose by use of an engineered yeast strain codisplaying three types of
cellulolytic enzyme. Appl Environ Microbiol, 2004. 70(2): p. 1207-12.
12. Fujita, Y., et al., Direct and efficient production of ethanol from cellulosic material with a
yeast strain displaying cellulolytic enzymes. Appl Environ Microbiol, 2002. 68(10): p. 5136-
41.
13. Den Haan, R., et al., Hydrolysis and fermentation of amorphous cellulose by recombinant
Saccharomyces cerevisiae. Metab Eng, 2007. 9(1): p. 87-94.
14. Lu, Y., Y.H. Zhang, and L.R. Lynd, Enzyme-microbe synergy during cellulose hydrolysis by
Clostridium thermocellum. Proc Natl Acad Sci U S A, 2006. 103(44): p. 16165-9.
15. Fierobe, H.P., et al., Degradation of cellulose substrates by cellulosome chimeras. Substrate
targeting versus proximity of enzyme components. J Biol Chem, 2002. 277(51): p. 49621-30.
16. Doi, R.H., Cellulases of mesophilic microorganisms: cellulosome and noncellulosome
producers. Ann N Y Acad Sci, 2008. 1125: p. 267-79.
17. Bayer, E.A., et al., The cellulosomes: multienzyme machines for degradation of plant cell
wall polysaccharides. Annu Rev Microbiol, 2004. 58: p. 521-54.
18. Bayer, E.A., R. Lamed, and M.E. Himmel, The potential of cellulases and cellulosomes for
cellulosic waste management. Curr Opin Biotechnol, 2007. 18(3): p. 237-45.
19. Percival Zhang, Y.H., M.E. Himmel, and J.R. Mielenz, Outlook for cellulase improvement:
screening and selection strategies. Biotechnol Adv, 2006. 24(5): p. 452-81.
20. Cho, H.Y., et al., Production of minicellulosomes from Clostridium cellulovorans in Bacillus
subtilis WB800. Appl Environ Microbiol, 2004. 70(9): p. 5704-7.
21. Mingardon, F., et al., Heterologous production, assembly, and secretion of a minicellulosome
by Clostridium acetobutylicum ATCC 824. Appl Environ Microbiol, 2005. 71(3): p. 1215-22.
22. Arai, T., et al., Synthesis of Clostridium cellulovorans minicellulosomes by intercellular
complementation. Proc Natl Acad Sci U S A, 2007. 104(5): p. 1456-60.

138
23. Fierobe, H.P., et al., Action of designer cellulosomes on homogeneous versus complex
substrates: controlled incorporation of three distinct enzymes into a defined trifunctional
scaffoldin. J Biol Chem, 2005. 280(16): p. 16325-34.
24. Caspi, J., et al., Conversion of Thermobifida fusca free exoglucanases into cellulosomal
components: comparative impact on cellulose-degrading activity. J Biotechnol, 2008. 135(4):
p. 351-7.
25. Mingardon, F., et al., Incorporation of fungal cellulases in bacterial minicellulosomes yields
viable, synergistically acting cellulolytic complexes. Appl Environ Microbiol, 2007. 73(12):
p. 3822-32.
26. Tsai, S.L., et al., Functional assembly of minicellulosomes on the Saccharomyces cerevisiae
cell surface for cellulose hydrolysis and ethanol production. Appl Environ Microbiol, 2009.
75(19): p. 6087-93.
27. Pages, S., et al., Species-specificity of the cohesin-dockerin interaction between Clostridium
thermocellum and Clostridium cellulolyticum: prediction of specificity determinants of the
dockerin domain. Proteins, 1997. 29(4): p. 517-27.
28. Gerngross, U.T., et al., Sequencing of a Clostridium thermocellum gene (cipA) encoding the
cellulosomal SL-protein reveals an unusual degree of internal homology. Mol Microbiol,
1993. 8(2): p. 325-34.
29. Boder, E.T. and K.D. Wittrup, Yeast surface display for screening combinatorial polypeptide
libraries. Nat Biotechnol, 1997. 15(6): p. 553-7.
30. Clements, J.M., et al., Secretion of human epidermal growth factor from Saccharomyces
cerevisiae using synthetic leader sequences. Gene, 1991. 106(2): p. 267-71.
31. Parekh, R., K. Forrester, and D. Wittrup, Multicopy overexpression of bovine pancreatic
trypsin inhibitor saturates the protein folding and secretory capacity of Saccharomyces
cerevisiae. Protein Expr Purif, 1995. 6(4): p. 537-45.
32. Wang, W.K., K. Kruus, and J.H. Wu, Cloning and DNA sequence of the gene coding for
Clostridium thermocellum cellulase Ss (CelS), a major cellulosome component. J Bacteriol,
1993. 175(5): p. 1293-302.

139
33. Beguin, P., P. Cornet, and J.P. Aubert, Sequence of a cellulase gene of the thermophilic
bacterium Clostridium thermocellum. J Bacteriol, 1985. 162(1): p. 102-5.
34. Miller, C.A., 3rd, M.A. Martinat, and L.E. Hyman, Assessment of aryl hydrocarbon receptor
complex interactions using pBEVY plasmids: expressionvectors with bi-directional
promoters for use in Saccharomyces cerevisiae. Nucleic Acids Res, 1998. 26(15): p. 3577-83.
35. Boder, E.T., et al., Yeast surface display of a noncovalent MHC class II heterodimer
complexed with antigenic peptide. Biotechnol Bioeng, 2005. 92(4): p. 485-91.
36. van Zyl, W.H., et al., Consolidated bioprocessing for bioethanol production using
Saccharomyces cerevisiae. Adv Biochem Eng Biotechnol, 2007. 108: p. 205-35.
37. Nordon, R.E., S.J. Craig, and F.C. Foong, Molecular engineering of the cellulosome complex
for affinity and bioenergy applications. Biotechnol Lett, 2009. 31(4): p. 465-76.
38. Wen, F., J. Sun, and H. Zhao, Yeast surface display of trifunctional minicellulosomes for
simultaneous saccharification and fermentation of cellulose to ethanol. Appl Environ
Microbiol, 2010. 76(4): p. 1251-60.
39. Shao, Z., H. Zhao, and H. Zhao, DNA assembler, an in vivo genetic method for rapid
construction of biochemical pathways. Nucleic Acids Res, 2009. 37(2): p. e16.
40. Horton, R.M., et al., Gene splicing by overlap extension: tailor-made genes using the
polymerase chain reaction. Biotechniques, 1990. 8(5): p. 528-35.
41. Wen, F., O. Esteban, and H. Zhao, Rapid identification of CD4+ T-cell epitopes using yeast
displaying pathogen-derived peptide library. J Immunol Methods, 2008. 336(1): p. 37-44.
42. Zhang, Y.H., et al., A transition from cellulose swelling to cellulose dissolution by o-
phosphoric acid: evidence from enzymatic hydrolysis and supramolecular structure.
Biomacromolecules, 2006. 7(2): p. 644-8.
43. Wood, T. and K. Bhat, Methods for Measuring Cellulase Activities. Methods Enzymol, 1988.
160: p. 87-112.

140
44. Zhang, Y.H. and L.R. Lynd, Determination of the number-average degree of polymerization
of cellodextrins and cellulose with application to enzymatic hydrolysis. Biomacromolecules,
2005. 6(3): p. 1510-5.

141
Chapter 5. Simultaneous Hydrolysis and Fermentation of Cellulose
to Ethanol by Recombinant Saccharomyces cerevisiae
5.1. Introduction
As stated in Chapter 4, consolidated bioprocessing (CBP), which features cellulase
production, cellulose hydrolysis, and hydrolysate fermentation in a single step, has a great
potential to significantly lower the cost of cellulosic ethanol production than other process
configurations [1-5]. The key challenge in realizing such potential is to develop a recombinant
microorganism that is capable of efficiently hydrolyzing cellulose and fermenting the
hydrolysate (glucose) into ethanol. In an effort to develop a CBP-enabling microorganism, we
have engineered a cellulolytic yeast strain by displaying trifunctional minicellulosomes on the
cell surface ([6] and Chapter 4). The trifunctional minicellulosome was assembled by co-
expressing a mini-scaffoldin derived from Clostridium thermocellum and three types of
cellulases − an endoglucanase and a cellobiohydrolase isolated from Trichoderma reesei, and a
β-glucosidase isolated from Aspergillus aculeatus. It showed both enzyme-enzyme synergy and
enzyme proximity synergy, and was stable at 4 °C for at least two months. The yeast strain
displaying the trifunctional minicellulosome was able to directly ferment amorphous phosphoric
acid swollen cellulose (PASC) to ethanol, demonstrating the feasibility of engineering yeast
Saccharomyces cerevisiae as a platform microorganism for CBP.
Although the results were promising, the cellulose degradation capability of the yeast
strain reported in Chapter 4 was still limited and it was unable to grow using PASC as the sole
carbon source. As a result, yeast cells had to be pregrown in glucose and resuspended at a high
cell density (OD600~50) before PASC conversion to ethanol was possible, introducing additional

142
steps into a cellulosic ethanol production process. In addition, even at such a high cell density,
the surface engineered yeast strain could not efficiently hydrolyze and ferment crystalline
cellulose Avicel to ethanol. Therefore, the goal of this project is to improve the cellulose
hydrolytic efficiency of yeast S. cerevisiae to enable its growth on cellulose and one-step
conversion of cellulose to ethanol.
In this chapter, we report the preliminary results of engineering the minicellulosome
yeast display system for improved cellulolytic efficiency. Various strategies have been attempted,
including (1) improving the cellulosomal enzyme display level through optimizing the protein
induction conditions, reducing the cell metabolic burden, expressing alternative endoglucanases
and exoglucanases, and in vitro cellulase loading, and (2) developing a constitutive yeast display
system. Among these strategies, cell growth was only observed when cellulases were loaded in
vitro onto the miniscaffoldin, indicating that the enzyme expression level was the limiting step.
Future work will focus on improving the cellulase expression level with concomitant enzymatic
activity engineering using the constitutive yeast display system. The following experiments were
designed by Fei Wen and carried out by Fei Wen with Jie Sun’s assistance.
5.2. Results and Discussion
5.2.1. Optimizing the Protein Induction Conditions
As shown in Figure 4.6, the surface display level of CBHII dropped significantly in
strain CipA3-EGII-CBHII-BGL1 compared to other strains. Since the protein induction
condition (20 °C in 3 mL of induction medium for 48 hours) used for minicellulosome surface
display was designed based on that optimized for MHC display, it may not be optimal for
minicellulosome expression. To improve the cellulosomal component display level, the protein
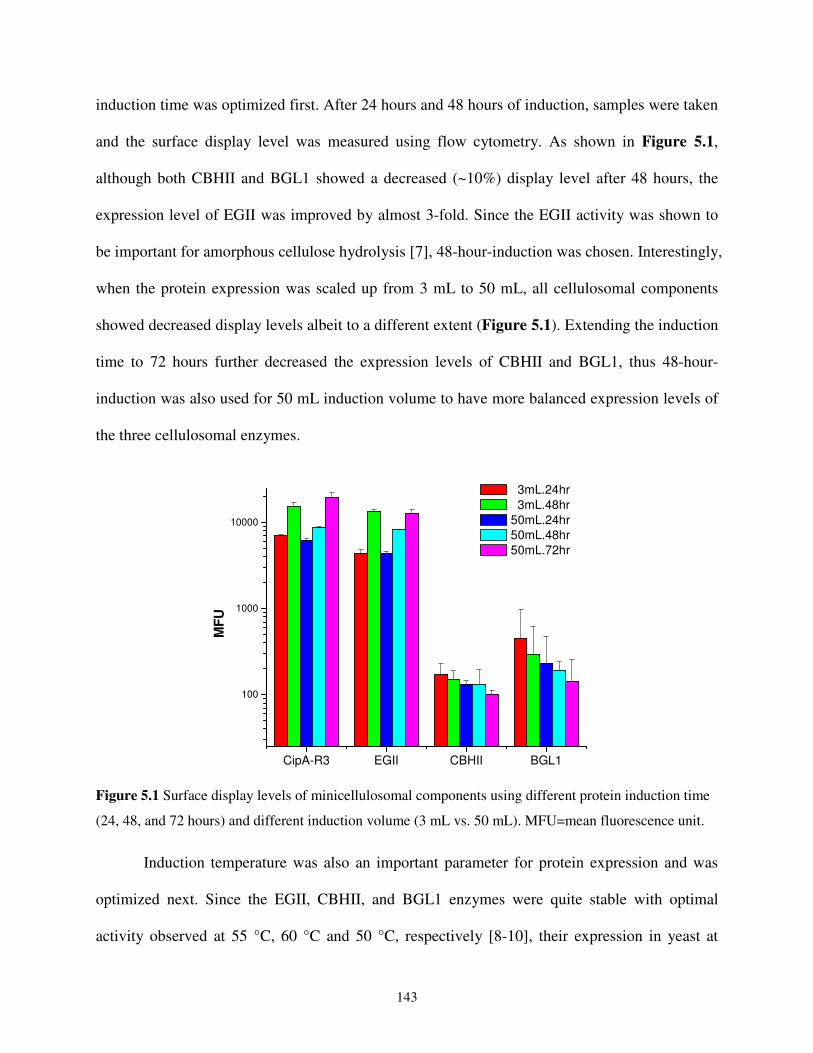
143
induction time was optimized first. After 24 hours and 48 hours of induction, samples were taken
and the surface display level was measured using flow cytometry. As shown in Figure 5.1,
although both CBHII and BGL1 showed a decreased (~10%) display level after 48 hours, the
expression level of EGII was improved by almost 3-fold. Since the EGII activity was shown to
be important for amorphous cellulose hydrolysis [7], 48-hour-induction was chosen. Interestingly,
when the protein expression was scaled up from 3 mL to 50 mL, all cellulosomal components
showed decreased display levels albeit to a different extent (Figure 5.1). Extending the induction
time to 72 hours further decreased the expression levels of CBHII and BGL1, thus 48-hour-
induction was also used for 50 mL induction volume to have more balanced expression levels of
the three cellulosomal enzymes.
CipA-R3 EGII CBHII BGL1
100
1000
10000
3mL.24hr
3mL.48hr
50mL.24hr 50mL.48hr
50mL.72hr
MF
U
Figure 5.1 Surface display levels of minicellulosomal components using different protein induction time
(24, 48, and 72 hours) and different induction volume (3 mL vs. 50 mL). MFU=mean fluorescence unit.
Induction temperature was also an important parameter for protein expression and was
optimized next. Since the EGII, CBHII, and BGL1 enzymes were quite stable with optimal
activity observed at 55 °C, 60 °C and 50 °C, respectively [8-10], their expression in yeast at
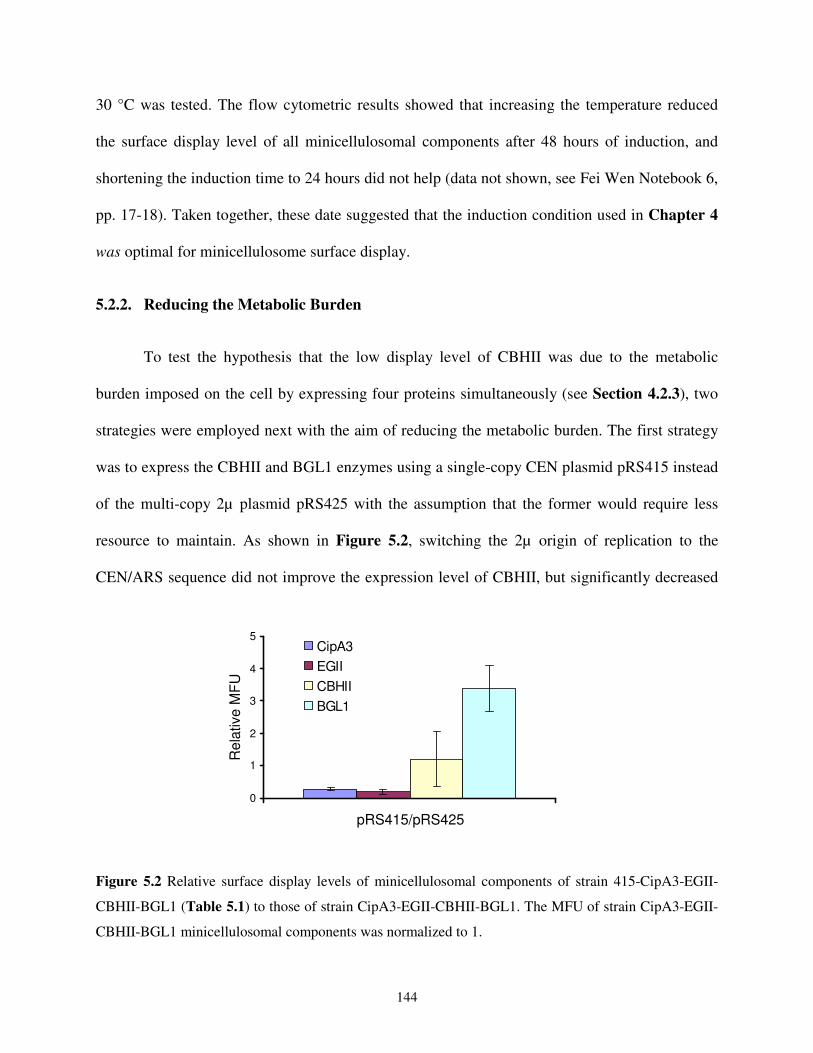
144
30 °C was tested. The flow cytometric results showed that increasing the temperature reduced
the surface display level of all minicellulosomal components after 48 hours of induction, and
shortening the induction time to 24 hours did not help (data not shown, see Fei Wen Notebook 6,
pp. 17-18). Taken together, these date suggested that the induction condition used in Chapter 4
was optimal for minicellulosome surface display.
5.2.2. Reducing the Metabolic Burden
To test the hypothesis that the low display level of CBHII was due to the metabolic
burden imposed on the cell by expressing four proteins simultaneously (see Section 4.2.3), two
strategies were employed next with the aim of reducing the metabolic burden. The first strategy
was to express the CBHII and BGL1 enzymes using a single-copy CEN plasmid pRS415 instead
of the multi-copy 2µ plasmid pRS425 with the assumption that the former would require less
resource to maintain. As shown in Figure 5.2, switching the 2µ origin of replication to the
CEN/ARS sequence did not improve the expression level of CBHII, but significantly decreased
0
1
2
3
4
5
pRS415/pRS425
Rela
tive M
FU
CipA3
EGII
CBHII
BGL1
Figure 5.2 Relative surface display levels of minicellulosomal components of strain 415-CipA3-EGII-
CBHII-BGL1 (Table 5.1) to those of strain CipA3-EGII-CBHII-BGL1. The MFU of strain CipA3-EGII-
CBHII-BGL1 minicellulosomal components was normalized to 1.

145
the expression level of both CipA3 and EGII, hence the total protein expression level, since
CipA3 and EGII expressed at a level of >100-fold higher than CBHII and BGL1. The reason
why replacing pRS425-CBHII-BGL1 with pRS415-CBHII-BGL1 did not affect the expression
of CBHII or BGL1 as much as that of CipA3 and EGII, both of which were encoded in a
different plasmid, was unknown. These data indicated that reducing the plasmid copy number
did not seem to reduce the metabolic burden of cells, and on the contrary, it resulted in a reduced
total protein expression level.
Table 5.1 Recombinant S. cerevisiae EBY100 yeast strains constructed in this study.
Strain namea Database number Plasmid
CipA3-EGII-BGL1 HZ1883b + HZ1896
b pYD1-CipA3-EGII & pRS425-BGL1
CipA3-CBHII-BGL1 HZ1845b + HZ1868
b pYD1-CipA3 & pRS425-CBHII-BGL1
415-CipA3-EGII-CBHII-
BGL1
HZ1911 pYD1-CipA3-EGII & pRS415-CBHII-BGL1
CipA1-CelG-CelF-BGL1 HZ1854b + HZ1867
b pYD1-CipA1-CelG & pRS425-CelF-BGL1
CipA3-CelG-CelE-BGL1 HZ1857b + HZ1893
b pYD1-CipA3-CelG & pRS425-CelE-BGL1
CipA3-CelC-CelF-BGL1 HZ1866b + HZ1867
b pYD1-CipA3-CelC & pRS425-CelF-BGL1
CipA3-CelC-CelE-BGL1 HZ1866b + HZ1893
b pYD1-CipA3-CelC & pRS425-CelE-BGL1
CipA3-EGII-CelF-BGL1 HZ1888 pYD1-CipA3-EGII & pRS425-CelF-BGL1
CipA3-EGII-CelE-BGL1 HZ1883b + HZ1893
b pYD1-CipA3-EGII & pRS425-CelE-BGL1
CBHII-ctrl HZ1849b pRS425-CBHII
BGL1-ctrl HZ1896 pRS425-BGL1
a For the purpose of clarity, the strains in this chapter are referred by the names listed in the first column.
b The plasmid needs to be minipreped from the numbered DH5α strain and (co)transformed into yeast
strain EBY100.
Of note, with a ~3-fold improvement in the BGL1 display level, strain 415-CipA3-EGII-
CBHII-BGL1 grew much faster and to a much higher saturation density than strain CipA3-EGII-
CBHII-BGL1 using cellobiose as the sole carbon source (Figure 5.3). In addition, it showed an
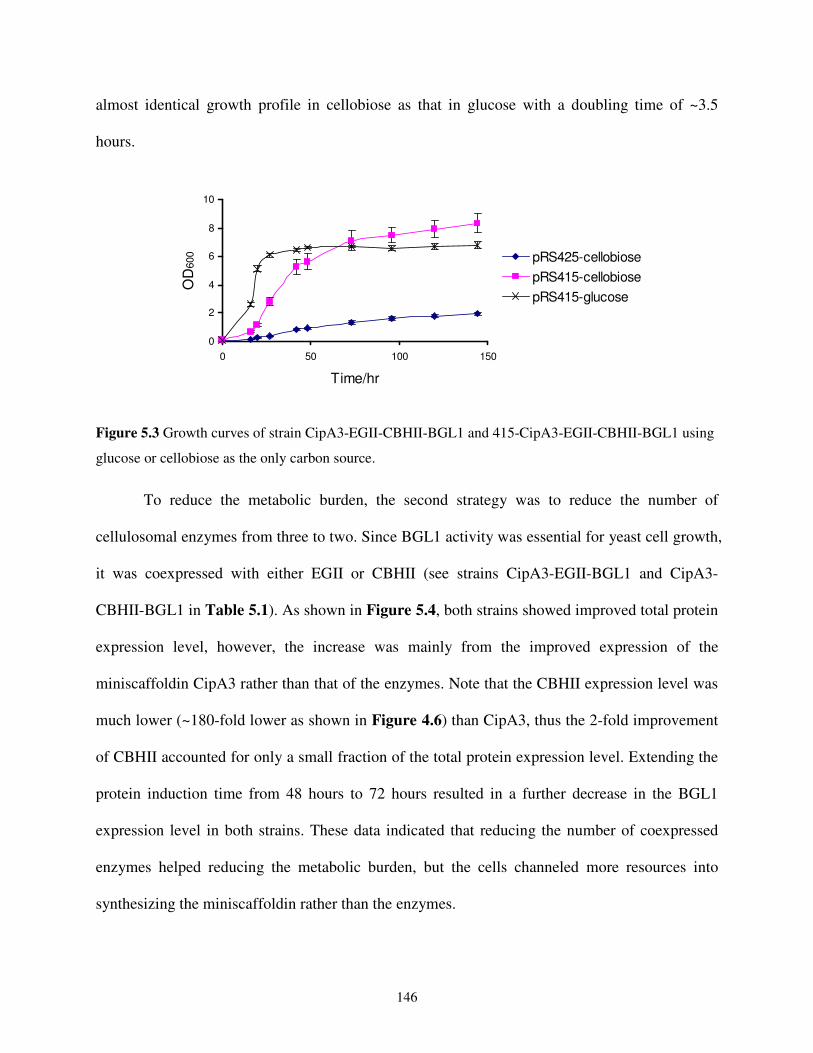
146
almost identical growth profile in cellobiose as that in glucose with a doubling time of ~3.5
hours.
0
2
4
6
8
10
0 50 100 150
Time/hr
OD
600 pRS425-cellobiose
pRS415-cellobiose
pRS415-glucose
Figure 5.3 Growth curves of strain CipA3-EGII-CBHII-BGL1 and 415-CipA3-EGII-CBHII-BGL1 using
glucose or cellobiose as the only carbon source.
To reduce the metabolic burden, the second strategy was to reduce the number of
cellulosomal enzymes from three to two. Since BGL1 activity was essential for yeast cell growth,
it was coexpressed with either EGII or CBHII (see strains CipA3-EGII-BGL1 and CipA3-
CBHII-BGL1 in Table 5.1). As shown in Figure 5.4, both strains showed improved total protein
expression level, however, the increase was mainly from the improved expression of the
miniscaffoldin CipA3 rather than that of the enzymes. Note that the CBHII expression level was
much lower (~180-fold lower as shown in Figure 4.6) than CipA3, thus the 2-fold improvement
of CBHII accounted for only a small fraction of the total protein expression level. Extending the
protein induction time from 48 hours to 72 hours resulted in a further decrease in the BGL1
expression level in both strains. These data indicated that reducing the number of coexpressed
enzymes helped reducing the metabolic burden, but the cells channeled more resources into
synthesizing the miniscaffoldin rather than the enzymes.
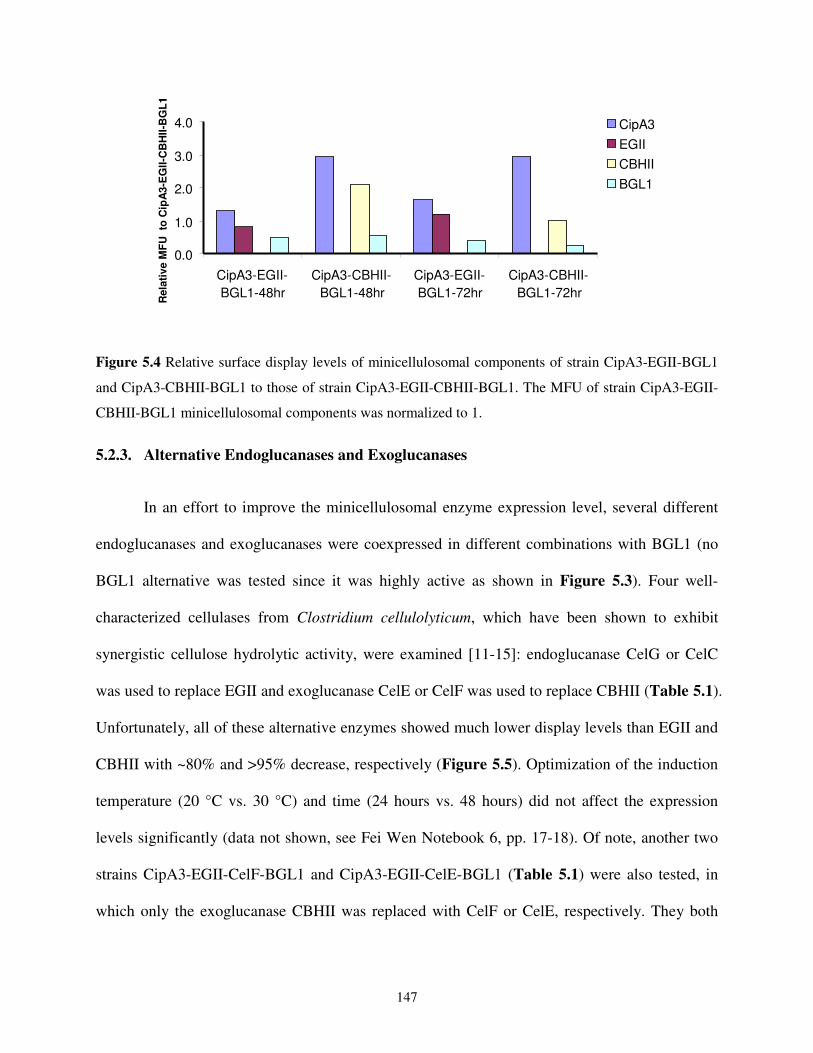
147
0.0
1.0
2.0
3.0
4.0
CipA3-EGII-
BGL1-48hr
CipA3-CBHII-
BGL1-48hr
CipA3-EGII-
BGL1-72hr
CipA3-CBHII-
BGL1-72hr
Rela
tive M
FU
to
Cip
A3-E
GII
-CB
HII
-BG
L1
CipA3
EGII
CBHII
BGL1
0.0
1.0
2.0
3.0
4.0
CipA3-EGII-
BGL1-48hr
CipA3-CBHII-
BGL1-48hr
CipA3-EGII-
BGL1-72hr
CipA3-CBHII-
BGL1-72hr
Rela
tive M
FU
to
Cip
A3-E
GII
-CB
HII
-BG
L1
CipA3
EGII
CBHII
BGL1
Figure 5.4 Relative surface display levels of minicellulosomal components of strain CipA3-EGII-BGL1
and CipA3-CBHII-BGL1 to those of strain CipA3-EGII-CBHII-BGL1. The MFU of strain CipA3-EGII-
CBHII-BGL1 minicellulosomal components was normalized to 1.
5.2.3. Alternative Endoglucanases and Exoglucanases
In an effort to improve the minicellulosomal enzyme expression level, several different
endoglucanases and exoglucanases were coexpressed in different combinations with BGL1 (no
BGL1 alternative was tested since it was highly active as shown in Figure 5.3). Four well-
characterized cellulases from Clostridium cellulolyticum, which have been shown to exhibit
synergistic cellulose hydrolytic activity, were examined [11-15]: endoglucanase CelG or CelC
was used to replace EGII and exoglucanase CelE or CelF was used to replace CBHII (Table 5.1).
Unfortunately, all of these alternative enzymes showed much lower display levels than EGII and
CBHII with ~80% and >95% decrease, respectively (Figure 5.5). Optimization of the induction
temperature (20 °C vs. 30 °C) and time (24 hours vs. 48 hours) did not affect the expression
levels significantly (data not shown, see Fei Wen Notebook 6, pp. 17-18). Of note, another two
strains CipA3-EGII-CelF-BGL1 and CipA3-EGII-CelE-BGL1 (Table 5.1) were also tested, in
which only the exoglucanase CBHII was replaced with CelF or CelE, respectively. They both

148
showed similar results (data not shown, see Fei Wen Notebook 6, pp. 26). Therefore, these four
cellulases could not be used as alternatives to improve the enzyme display levels.
0
1
2
3
4
5
CipA3 Endo Exo BGL1
Rela
tive M
FU CipA1-CelG-CelF-BGL1
CipA3-CelG-CelE-BGL1
CipA3-CelC-CelF-BGL1
CipA3-CelC-CelE-BGL1
Figure 5.5 Relative surface display levels of minicellulosomal components of strain CipA1-CelG-CelF-
BGL1, CipA3-CelG-CelE-BGL1, CipA3-CelC-CelF-BGL1, and CipA3-CelC-CelE-BGL1 to those of
strain CipA3-EGII-CBHII-BGL1. The MFU of strain CipA3-EGII-CBHII-BGL1 minicellulosomal
components was normalized to 1. Endo=endoglucanase EGII, CelG, or CelC, Exo=exoglucanase CBHII,
CelE, or CelF.
5.2.4. In vitro Enzyme Loading onto the Yeast Surface Displayed Miniscaffoldin
Since all of the attempts to improve the cellulosomal enzyme display levels through in
vivo expression optimization failed, in vitro loading of free enzymes onto the miniscaffoldin
displayed on yeast cell surface was tested next. Secretion strains CBHII-ctrl and BGL1-ctrl were
constructed to obtain free soluble enzymes. The supernatant was concentrated by ~25-fold and
mixed with CipA3-EGII-CBHII-BGL1 cells induced in 50 mL of YPG for 72 hours. After
incubation at 4 °C overnight, the surface display levels of all four minicellulosomal components
were measured by flow cytometry. As shown in Figure 5.6, the free CBHII enzyme was
immobilized on yeast cell surface through cohesin-dockerin interaction and its display level was
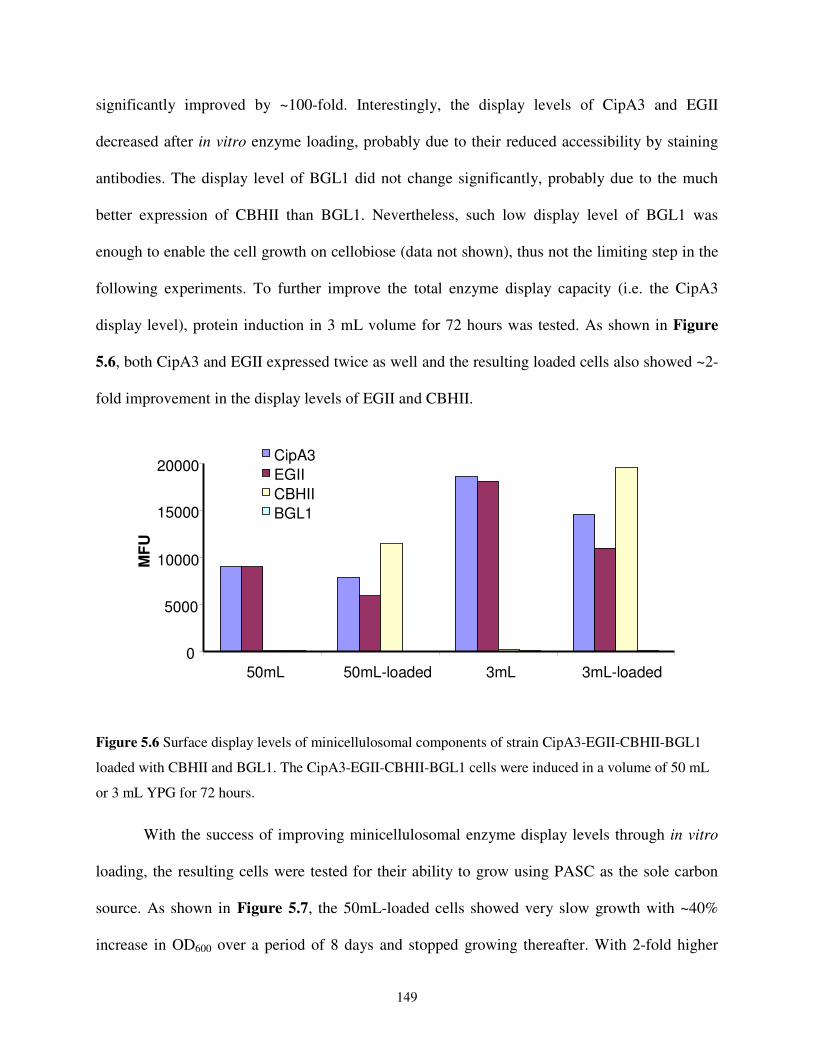
149
significantly improved by ~100-fold. Interestingly, the display levels of CipA3 and EGII
decreased after in vitro enzyme loading, probably due to their reduced accessibility by staining
antibodies. The display level of BGL1 did not change significantly, probably due to the much
better expression of CBHII than BGL1. Nevertheless, such low display level of BGL1 was
enough to enable the cell growth on cellobiose (data not shown), thus not the limiting step in the
following experiments. To further improve the total enzyme display capacity (i.e. the CipA3
display level), protein induction in 3 mL volume for 72 hours was tested. As shown in Figure
5.6, both CipA3 and EGII expressed twice as well and the resulting loaded cells also showed ~2-
fold improvement in the display levels of EGII and CBHII.
0
5000
10000
15000
20000
50mL 50mL-loaded 3mL 3mL-loaded
MF
U
CipA3
EGII
CBHII
BGL1
0
5000
10000
15000
20000
50mL 50mL-loaded 3mL 3mL-loaded
MF
U
CipA3
EGII
CBHII
BGL1
Figure 5.6 Surface display levels of minicellulosomal components of strain CipA3-EGII-CBHII-BGL1
loaded with CBHII and BGL1. The CipA3-EGII-CBHII-BGL1 cells were induced in a volume of 50 mL
or 3 mL YPG for 72 hours.
With the success of improving minicellulosomal enzyme display levels through in vitro
loading, the resulting cells were tested for their ability to grow using PASC as the sole carbon
source. As shown in Figure 5.7, the 50mL-loaded cells showed very slow growth with ~40%
increase in OD600 over a period of 8 days and stopped growing thereafter. With 2-fold higher
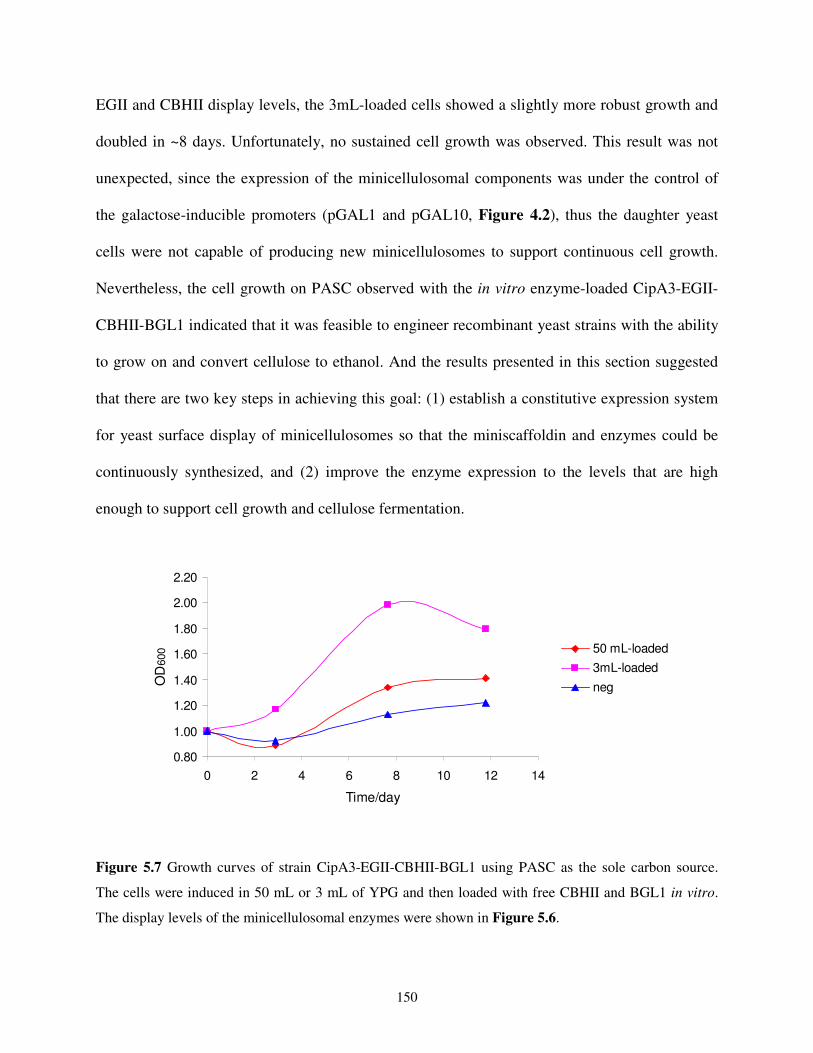
150
EGII and CBHII display levels, the 3mL-loaded cells showed a slightly more robust growth and
doubled in ~8 days. Unfortunately, no sustained cell growth was observed. This result was not
unexpected, since the expression of the minicellulosomal components was under the control of
the galactose-inducible promoters (pGAL1 and pGAL10, Figure 4.2), thus the daughter yeast
cells were not capable of producing new minicellulosomes to support continuous cell growth.
Nevertheless, the cell growth on PASC observed with the in vitro enzyme-loaded CipA3-EGII-
CBHII-BGL1 indicated that it was feasible to engineer recombinant yeast strains with the ability
to grow on and convert cellulose to ethanol. And the results presented in this section suggested
that there are two key steps in achieving this goal: (1) establish a constitutive expression system
for yeast surface display of minicellulosomes so that the miniscaffoldin and enzymes could be
continuously synthesized, and (2) improve the enzyme expression to the levels that are high
enough to support cell growth and cellulose fermentation.
0.80
1.00
1.20
1.40
1.60
1.80
2.00
2.20
0 2 4 6 8 10 12 14
Time/day
OD
600 50 mL-loaded
3mL-loaded
neg
Figure 5.7 Growth curves of strain CipA3-EGII-CBHII-BGL1 using PASC as the sole carbon source.
The cells were induced in 50 mL or 3 mL of YPG and then loaded with free CBHII and BGL1 in vitro.
The display levels of the minicellulosomal enzymes were shown in Figure 5.6.

151
5.2.5. Development of a Constitutive Yeast Surface Display System
To develop a constitutive yeast surface display system, the initial strategy was to knock
out galactokinase (Gal1p), the first enzyme of the Leloir pathway that catalyzes the formation of
galactose-1-phosphate from galactose and ATP [16]. Studies have shown that the ∆gal1 strain
cannot use galactose as a carbon source but only as a gratuitous inducer of pGAL in the presence
of low glucose concentrations [17-19]. Given the low levels of glucose observed during cellulose
hydrolysis (see Figure 4.9), such ∆gal1 strain should be able to utilize cellulose as the carbon
source and galactose as the gratuitous inducer for continuous minicellulosome synthesis without
glucose repression. Using a loxP–kanMX–loxP deletion cassette [20], a galactokinase null strain
EBY100∆gal1 was created. Unfortunately, the EBY100∆gal1 strain did not show any
miniscaffoldin display with three different carbon sources tested – glucose, ethanol, and glycerol
(data not shown, see Fei Wen Notebook 6, pp. 45-46).
The second strategy tested was to replace the galactose-inducible pGAL1 and pGAL10 to
constitutive pTEF1 and pTEF2, respectively. To enable a constitutive display using yeast a-
agglutinin receptor, the pAGA1 in the genome of BJ5465, from which the EBY100 was created
[21], was replaced with pTEF1 using the loxP–kanMX–loxP deletion cassette (this experiment
was carried out by Jing Liang). The resulting strain BJ5465 pAGA1::kanMX-pTEF1 showed a
very strong tendency to aggregate, maybe due to the constitutive expression of the mating
receptor, the function of which was to promote cellular agglutination [22].
Finally, the α-agglutinin receptor was employed to construct the constitutive
minicellulosome display system. As shown in Figure 5.8, the DNA encoding the C-terminal 320
amino acids of the α-agglutinin gene was fused to the end of the CipA3-encoding gene, and the

152
resulting chimeric protein was expressed under the control of pTEF1. The expression cassettes
for the three cellulases were identical to those described in Figure 4.2 except that the pGAL1
and pGAL10 were replaced with pTEF1 and pTEF2, respectively (Figure 5.8).
CpRS425-EGII-BGL1
TEF1 TEF2
ss1 EGIIHisc-MycBGL1 ss2docA docS
TADH1TADH2
CpRS425-EGII-BGL1
TEF1 TEF2
ss1 EGIIHisc-MycBGL1 ss2docA docS
TADH1TADH2
CpRS414-CipA3-CBHII
TEF2 TEF1
ss2 CααααFLAGCBHII ss1docS V5
TADH1
CipA3
Tαααα
CpRS414-CipA3-CBHII
TEF2 TEF1
ss2 CααααFLAGCBHII ss1docS V5
TADH1
CipA3
Tαααα
Figure 5.8 Plasmids used for constructing strain cCipA3-C2E2B1 (Table 5.2) constitutively expressing
trifunctional minicellulosome CipA3-CBHII-EGII-BGL1. ss1 = synthetic prepro signal peptide [23], ss2
= α-factor signal peptide with AG dipeptide spacer [24], Cα = C-terminal 320 amino acids of α-
agglutinin gene, T = terminator, Tα = terminator of α-agglutinin gene.
To validate this constitutive display system, plasmid cpRS414-CipA3-CBHII was
transformed into BJ5465 to obtain strain cCipA3-C2 (Table 5.2), which was then grew up using
glucose as the sole carbon source and subjected to flow cytometry analysis. Of note, no
transformants could be obtained when w303a was used as the host strain and no expression
difference but only a slower cell growth rate was observed when EBY100 was used as the host
strain. Therefore, the discussion hereafter focused on BJ5465 strain.
Table 5.2 Recombinant S. cerevisiae BJ5465 yeast strains constructed in this study.
Strain namea Database number Plasmid
cdbØ HZ663b + HZ668
b pRS414 & pRS425
cCipA3-C2 HZ1925b cpRS414-CipA3-CBHII
cCipA3-C2E2B1 HZ1925b + HZ1929
b cpRS414-CipA3-CBHII & cpRS425-EGII-BGL1
cCipA3-C2-pRS425 HZ1925b + HZ668
b cpRS414-CipA3-CBHII & pRS425
a For the purpose of clarity, the strains in this chapter are referred by the names listed in the first column.
b The plasmid needs to be minipreped from the numbered DH5α strain and (co)transformed into yeast
strain BJ5465.

153
As shown in Figure 5.9a, both CipA3 and CBHII were detected on the surface of strain
cCipA3-C2, indicating a successful constitutive expression and assembly of the unifunctional
minicellulosome CipA3-CBHII. Unfortunately but not unexpected, the use of constitutive
promoters significantly reduced the expression levels of both CipA3 and CBHII by ~13- and ~6-
fold, respectively. And coexpression of additional two cellulases EGII and BGL1 further reduced
the total enzyme display level on strain cCipA3-C2E2B1 (Figure 5.9b). Interestingly,
maintaining an additional empty plasmid pRS425 also caused another ~9-fold decrease in the
CBHII display level (compare cCipA3-C2 and cCipA3-C2-pRS425 in Figure 5.9b).
Nevertheless, these data clearly suggested that a constitutive yeast display system has been
successfully developed for surface assembly of trifunctional minicellulosomes. Although the
resulting cCipA3-C2E2B1 strain did not show any growth on PASC due to the low expression
levels of cellulases (data not shown), such constitutive expression system would be a useful
platform for engineering cellulases with improved expression as stated in Section 5.2.4.
0
5000
10000
15000
galactose-inducible constitive
MF
U
CipA3
CBHII
10
100
1000
10000
100000
cCipA3-C2 cCipA3-
C2E2B1
cCipA3-C2-
pRS425
cdbØ
MF
U
CipA3
CBHII
EGII
BGL1
a b
galacotose-inducibleCipA3-EGII-CBHII-BGL1
constitutive cCipA3-C2
Figure 5.9 Display levels of the minicellulosomal components expressed under the control of constitutive
promoters on yeast cell surface. (a) Compared to strain CipA3-CBHII (Table 4.1) that expressed the
proteins under galactose-inducible promoters, strain cCipA3-C2 with the proteins expressed under
constitutive promoters showed much lower display levels of both CipA3 and CBHII. (b) Evaluation of the
constitutive system for yeast surface display of minicellulosomes. Note that the MFU in (a) is not
comparable to that in (b), since the laser voltage settings used were different.
154
5.3. Conclusions and Outlook
A cellulolytic yeast S. cerevisiae strain CipA3-EGII-CBHII-BGL1 has been created
previously by displaying trifunctional minicellulosomes on the surface, however, its cellulose
degradation capability was too low to support cell growth on PASC ([6] and Chapter 4). In an
effort to improve the cellulolytic efficiency of this strain, various strategies have been employed
with a focus of improving the minicellulosomal enzyme display levels. All of the attempts to
improve the in vivo protein expression failed, including optimization of the protein induction
conditions, reduction of the plasmid copy number, expression of fewer enzymes, and different
combinations of alternative endoglucanases (CelG and CelC) and exoglucanases (CelE and
CelF) isolated from C. cellulolyticum.
In contrast, in vitro loading of cellulases onto the miniscaffoldin displayed on the yeast
cell surface enabled a cell doubling over a period of ~8 days, confirming that the low enzyme
expression level was the limiting step. This result also suggested that the minicellulosomes
should be continuously synthesized to support a sustained cell culture for consolidated
bioprocessing. By using the C-terminal half of the α-agglutinin as the cell anchor and pTEF1/2
promoters, a yeast display system was developed to enable constitutive minicellulosome
synthesis and assembly on the cell surface. Compared to the inducible system described in
Chapter 4, the constitutive expression levels of all the minicellulosomal components
significantly reduced, presenting us an even more challenging task to improve the enzyme
expression to the desired level, which was estimated to be ~20 mg/L (data provided by Jing
Liang). Nevertheless, these results clearly suggested the feasibility of engineering yeast cells
with the ability to grow on and ferment cellulose to ethanol.
155
In a continuing effort to improve the minicellulosomal enzyme display level, the
constitutive expression cassettes of EGII or CBHII are being integrated individually and in
combination into the δ-sites of yeast genome using a modified δ-integration vector [25].
Approximately 60-120 copies of the expression cassette are expected to be integrated per cell
and increase the expression of EGII and/or CBHII to the level high enough to support cell
growth on PASC. If not successful, directed evolution could be carried out to select EGII and/or
CBHII mutants with improved expression. Specifically, an EP-PCR library could be created and
displayed on yeast cell surface using C-terminal half of the α-agglutinin as the anchor protein.
The mutants with improved expression could then be selected in a high throughput manner using
FACS and an antibody specific for a protein expression tag, such as V5, His, or FLAG. Once
such mutants are identified, they could be integrated into the δ-sites to create a stable yeast strain
capable of expressing enzymes at a high level in non-selective rich medium. If successful, the
resulting strain could be used as a host for protein and metabolic engineering in a high
throughput manner with aims to (1) further improve the expression of cellulases, (2) improve the
cellulase hydrolytic activity, (3) select mutant yeast strains through adapted evolution, (4)
improve the enzyme-enzyme synergy of different cellulases, and (5) create a cellulolytic and
hemi-cellulolytic yeast strain that is capable of utilizing both cellulose and hemicellulose, which
account for more than two-third of the lignocellulosic biomass [26].
With regard to #4, another cellobiohydrolase CBHI from T. reesei has been successfully
cloned and displayed on yeast cell surface (Figure 5.10). CBHI is the most abundant cellulase
produced in T. reesei, representing >60% of the total extracellular protein [27]. The
incorporation of CBHI into the minicellulosome is essential for crystalline cellulose utilization,
since it prefers the reducing ends of cellulose chains and exhibits synergy with CBHII that

156
prefers the non-reducing ends [3]. With regard to #5, three hemicellulases have been successfully
displayed on yeast cell surface in the form of minixylanosomal enzymes (Figure 5.10): α-L-
arabinofuranosidase B (ABFB) and β-xylosidase D (XLND) from Aspergillus niger, and
xylanase II (XYNII) from T. reesei [28, 29]. All three surface displayed unifunctional
minixylanosomes showed activity toward their respective substrates: XYNII was active on water
soluble arabinoxylan, XLND was active on xylobiose, xylotriose, and xylotetraose, and ABFB
was active on 4-nitrophenyl α-L-arabinofuranoside (data not shown, the activity assays were
carried out by Tong Si, Jie Sun, and Fei Wen). In summary, the results presented in this chapter
have identified the key limiting step in realizing the potential of engineering yeast as a CBP
platform organism, and the research progress has laid a solid foundation for future engineering
work.
10
100
1000
10000
100000
CBHI XYN2 XLND ABFB neg
MF
U
CipA3
Enzyme
Figure 5.10 Yeast surface display of cellulase CBHI and hemicellulases XYNII, XLND, and ABFB as
minicellulosomal and minixylanosomal enzymes, respectively.
5.4. Materials and Methods
5.4.1. Strains, Media, and Reagents
S cerevisiae EBY100 (Invitrogen, Carlsbad, CA) and BJ5465 (American Type Culture
Collection, Manassas, VA) were used for the yeast cell surface display, and the recombinant

157
yeast strains were summarized in Table 5.1 and Table 5.2. Escherichia coli DH5α (Cell media
facility, University of Illinois at Urbana-Champaign, Urbana, IL) was used for recombinant
DNA manipulation. Clostridium cellulolyticum (DSM5812) was purchased from DSMZ
(Braunschweig, Germany). S. cerevisiae transformants were selected and maintained on SC-Leu
or SC-Trp-Leu plates (0.167% yeast nitrogen base without amino acids and ammonium sulfate
[Difco laboratories, Detroit, MI], 0.5% ammonium sulfate, 2% glucose, 1.5% agar, and
appropriate supplements) and induced in YPG (1% yeast extract, 2% peptone, 2% galactose). E.
coli was cultured in LB medium (Fisher, Pittsburgh, PA). C. cellulolyticum was cultured
anaerobically in Reinforced Clostridial Medium (Difco) supplemented with 0.6% cellobiose. T
reesei was grown on YPAD plates (1% yeast extract, 2% peptone, 2% glucose, 0.01% adenine
hemisulphate, 1.5% agar). The anaerobic medium was prepared by dissolving the mixed powder
in anaerobic ddH2O in an anaerobic chamber, followed by autoclave in rubber-stoppered serum
bottles. All restriction enzymes were obtained from New England Biolabs (Ipswich, MA).
Unless otherwise indicated, all chemicals were purchased from Sigma (St. Louis, MO).
5.4.2. Plasmid Construction
The sequences of all PCR primers used are listed in Table 5.3. Primers were synthesized
by Integrated DNA Technologies (Coralville, IA). The PCR reaction condition used is described
in the first paragraph of Section 2.4 unless otherwise specified. All plasmids were constructed
using the DNA assembler method as described elsewhere [30]. Briefly, several DNA fragments
with homologous ends were prepared by PCR and cotransformed with a linearized vector into
yeast cells, generating an episomal plasmid through homologous recombination. The templates,
primer pairs, and PCR products used for each plasmid assembly were summarized in Table 5.4.

158
Table 5.3 Primers used for cloning.
Name Sequence 5’→3’
AmpFor CAGAAGTAAGTTGGCCGC
LEU2Rev AGTTAAGAAAATCCTTGC
9E-docStFor CCATGGGGATCTGGAGGAGGTGGGTCCTCTACTAAATTATACGGCGACGTC
9E-docStRev GACTTGACCAAACCTCTGGCGAAGAAGTCCATTAGTTCTTGTACGGCAATGTA
48CelFFor2 GCAGAAGGCTCTTTGGACAAGAGAGAAGCTCGGCCGGATTATAAAGATGACG
ATGACAAAGCTTCAAGTCCTGCAAACAAGGTGTACC
48CelFRev2 GTAGAGGACCCACCTCCTCCAGATCCCCATGGACCTTGATCTGGGAAGAGTAT
TGCATAAAC
9CelEFor2 GCAGAAGGCTCTTTGGACAAGAGAGAAGCTCGGCCGGATTATAAAGATGACG
ATGACAAATTTGCCCTTGTTGGGGCAGGAGATTTGATTCG
9CelERev2 GTAGAGGACCCACCTCCTCCAGATCCCCATGGAGTCACTGACCCACCAATCTC
TGGCCCCTTTTC
G1A2For1 GCGATTAGTTTTTTAGCCTTATTTCTGGGG
G1A2Rev1 ACCTGCAGCTAATGCGGAGGATGCTGCGAATAAAACTGCAGTAAAAATTGAA
GGAAATCTCATGGTTTTTTCTCCTTGACGTTAAAGTATAGAGG
G1A2For2 CCTCAGGTTGTTTACGGTGATGTAAATGGCGACG
G1A2Rev2 GAGATCCGCTTATTTAGAAGTGTCGAATTCCTAATAAGGTAGGTGGGGTATGC
TCTTTATC
G1A2For3 GAATTCGACACTTCTAAATAAGCGGATCTC
G1A2Rev3 GTAATACGACTCACTATAGGGCGAATTGGGCTCGAGGGCATGCGAAGGAAAA
TG
BGL1For3 GTTTTATTCGCAGCATCCTCCGCATTAGCTGCAGGTGAACAAAAACTCATCTCA
GAAGAGGATCTGGATGAACTGGCGTTCTCTCCTCCATTCTATCCC
BGL1Rev3 CGTCGCCATTTACATCACCGTAAACAACCTGAGGAGAACCTCCACCGCCACTA
CCCCCGGGTTGCACCTTCGGGAGCGCTGCGTGAAGGGGC
GACFor1 GTACAGATCCCGACCCATTTGC
GACRev1 CGCTTAACTGCTCATTGCTATATTGAAGTACGGATTAGAAGCCGCCGAGCGGG
TGACAGC
GACFor2 GTACTTCAATATAGCAATGAGCAGTTAAGCG
GACRev2 ACCATGGTGATGGTGATGATGAGCTTCTCTCTTGTCCAAAGAGCC
GACFor3 CCATGGGGATCTGGAGGAGGTGGG
GACRev3 CTAAAGGGAACAAAAGCTGGCTAGTCATGCCGGTAGAGGTGTGGTC
GACFor4 GACCACACCTCTACCGGCATGACTAGCCAGCTTTTGTTCCCTTTAG
GACRev4 CCTGGTATCTTTATAGTCCTG
RS-TEF2For GTTGCTCATATGGCATGCCCCGGGGCTAGCGGGGCCGTATACTTACATATAGT
AGATGTC
RS-TEF2Rev CAAGACAATCAAAACCTTCATGTTTAGTTAATTATAGTTCG

159
Table 5.3 continued
Name Sequence 5’→3’
9CelGFor GAGAGAAGCTCATCATCACCATCACCATGGTGCAGGAACATATAACTATGGAG
AAGC
9CelGRev GTAGAGGACCCACCTCCTCCAGATCCCCATGGATCAGGGTTTTCCGATCCACCT
GCGGG
8CelCFor GAGAGAAGCTCATCATCACCATCACCATGGTGCTGATCAAATTCCTTTCCCATA
TGACGC
8CelCRev GTAGAGGACCCACCTCCTCCAGATCCCCATGGGTTAAGCAGTTTAACTTTTAGC
TGAGC
RS-TEF1For GCTAGCCCCGGGGCATGCCATATGAGCAACAGGCGCGTTGGACTTTTAATTTT
CG
RS-TEF1Rev GCAGTAAAAATTGAAGGAAATCTCATTTTGTAATTAAAACTTAGATTAGATTG
CTATGC
C-CipA3-HR2Rev CCGAGGAGAGGGTTAGGGATAGGCTTACCACCTGCAGCTAATGCGGAGGATG
CTGCGAATAAAACTGCAGTAAAAATTGAAGGAAATCTCATTTTG
C-CipA3-HR3For GGTAAGCCTATCCCTAACCCTCTCCTCGGTCTCGATTCTACGGTATCGGCGGCC
ACAATGACAGTCGAG
C-CipA3-HR3Rev GGCGCTAGAACCTCCACCGCCACTACCGCCTCCACCATTCGAATCATCTGTCGG
TGTTG
C-CipA3-HR4For CGAATGGTGGAGGCGGTAGTGGCGGTGGAGGTTCTAGCGCCAAAAGCTCTTTT
ATCTCAACC
C-CipA3-HR4Rev GGGAACAAAAGCTGGAGCTCCACCGCGGTGGCGGCCGCTATCTTCAGGCAAAT
GATGACG
C-CBH2-HR6For CGAACTATAATTAACTAAACATGAAGGTTTTGATTGTCTTG
C-CBH2-HR6Rev CGACTCACTATAGGGCGAATTGGGTACCGGGCCCCCCCATGCCGGTAGAGGTG
TGGTCAATAAG
C-BGL1-HR1FL CTCCCGAGTCCGAGTTGACG
C-BGL1-HR1Rev GCAATCTAATCTAAGTTTTAATTACAAAATGAGATTTCCTTCAATTTTTACTGC
C-TEF1-HR2For CATTTTGTAATTAAAACTTAGATTAGATTGC
C-TEF2-HR3Rev CCAACAAGACAATCAAAACCTTCATGTTTAGTTAATTATAGTTCG
C-EGII-HR4For CTAAACATGAAGGTTTTGATTGTCTTGTTGG
C-EGII-HR4Rev CGAGCATAATTGTGGATGTCG
Plasmid pRS415-CBHII-BGL1 was obtained by cotransforming CEN-ARS-HR and XbaI
digested pRS425-CBHII-BGL1 into EBY100. The genomic DNA of C. cellulolyticum was
isolated using the Wizard genomic DNA purification kit (Promega, Madison, WI) following the
manufacturer’s protocol for Gram positive bacteria. PCR products FLAG-CelF(E) and docS
were cotransformed with EagI/NdeI digested pRS425-NL-CelS, yielding plasmids pRS425-
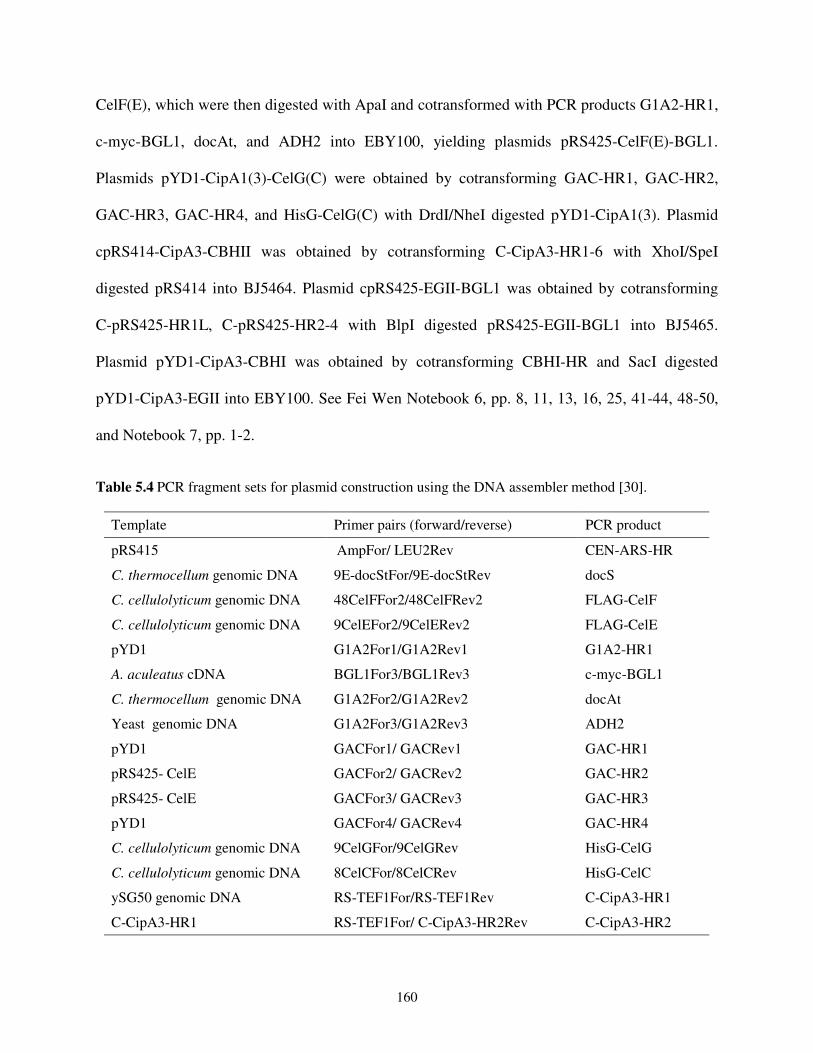
160
CelF(E), which were then digested with ApaI and cotransformed with PCR products G1A2-HR1,
c-myc-BGL1, docAt, and ADH2 into EBY100, yielding plasmids pRS425-CelF(E)-BGL1.
Plasmids pYD1-CipA1(3)-CelG(C) were obtained by cotransforming GAC-HR1, GAC-HR2,
GAC-HR3, GAC-HR4, and HisG-CelG(C) with DrdI/NheI digested pYD1-CipA1(3). Plasmid
cpRS414-CipA3-CBHII was obtained by cotransforming C-CipA3-HR1-6 with XhoI/SpeI
digested pRS414 into BJ5464. Plasmid cpRS425-EGII-BGL1 was obtained by cotransforming
C-pRS425-HR1L, C-pRS425-HR2-4 with BlpI digested pRS425-EGII-BGL1 into BJ5465.
Plasmid pYD1-CipA3-CBHI was obtained by cotransforming CBHI-HR and SacI digested
pYD1-CipA3-EGII into EBY100. See Fei Wen Notebook 6, pp. 8, 11, 13, 16, 25, 41-44, 48-50,
and Notebook 7, pp. 1-2.
Table 5.4 PCR fragment sets for plasmid construction using the DNA assembler method [30].
Template Primer pairs (forward/reverse) PCR product
pRS415 AmpFor/ LEU2Rev CEN-ARS-HR
C. thermocellum genomic DNA 9E-docStFor/9E-docStRev docS
C. cellulolyticum genomic DNA 48CelFFor2/48CelFRev2 FLAG-CelF
C. cellulolyticum genomic DNA 9CelEFor2/9CelERev2 FLAG-CelE
pYD1 G1A2For1/G1A2Rev1 G1A2-HR1
A. aculeatus cDNA BGL1For3/BGL1Rev3 c-myc-BGL1
C. thermocellum genomic DNA G1A2For2/G1A2Rev2 docAt
Yeast genomic DNA G1A2For3/G1A2Rev3 ADH2
pYD1 GACFor1/ GACRev1 GAC-HR1
pRS425- CelE GACFor2/ GACRev2 GAC-HR2
pRS425- CelE GACFor3/ GACRev3 GAC-HR3
pYD1 GACFor4/ GACRev4 GAC-HR4
C. cellulolyticum genomic DNA 9CelGFor/9CelGRev HisG-CelG
C. cellulolyticum genomic DNA 8CelCFor/8CelCRev HisG-CelC
ySG50 genomic DNA RS-TEF1For/RS-TEF1Rev C-CipA3-HR1
C-CipA3-HR1 RS-TEF1For/ C-CipA3-HR2Rev C-CipA3-HR2

161
5.4.3. In vitro Loading of Cellulases
Strains CBHII-ctrl and BGL1-ctrl were grown up in SC-Leu medium overnight to
OD600~5. The cells were then washed twice with YPG, resuspended in 50 mL of YPG to a final
OD600~1 in a 250 mL flask, and shaken 250 rpm, 20 °C for 72 hours. The induced cells were
spun down at 4000 rpm for 10 minutes and the supernatant was concentrated to ~2 mL using the
Amicon Ultra-15 centrifugal filter unit (Millipore, Billerica, MA) at 4 °C. ~5×10⁷ induced
CipA3-EGII-CBHII-BGL1 cells were resuspended in 2 mL of the resulting concentrate mix (1
mL from CBHII-ctrl and 1 mL from BGL1-ctrl) and incubated at 4 °C overnight. The loaded
cells were subjected to flow cytometry analysis and growth assay using PASC as the sole carbon
source. See Fei Wen Notebook 6, pp. 26.
5.4.4. Cell Growth Analysis on PASC
Cells displaying the minicellulosomes were washed three times with appropriate SC
dropout media to prevent glucose/galactose carry-over. In the mean time, PASC was washed
extensively (at least ten times) with the same SC dropout media to remove sodium azide and/or
Table 5.4 continued
Template Primer pairs (forward/reverse) PCR product
pYD1-CipA3 C-CipA3-HR3For/ C-CipA3-HR3Rev C-CipA3-HR3
ySG50 genomic DNA C-CipA3-HR4For/ C-CipA3-HR4Rev C-CipA3-HR4
ySG50 genomic DNA RS-TEF2For/ RS-TEF2Rev C-CipA3-HR5
pYD1-CipA3-CBH2 C-CBH2-HR6For/ C-CBH2-HR6Rev C-CipA3-HR6
pRS425-EGII-BGL1 C-BGL1-HR1FL/ C-BGL1-HR1Rev C-pRS425-HR1L
ySG50 gDNA C-TEF1-HR2For/RS-TEF1For C-pRS425-HR2
ySG50 gDNA RS-TEF2For/C-TEF2-HR3Rev C-pRS425-HR3
pRS425-EGII-BGL1 C-EGII-HR4For/C-EGII-HR4Rev C-pRS425-HR4
T. reesei cDNA CBHIFor/CBHIRev CBHI-HR
162
soluble sugars. And then the cells and PASC were combined to desired OD600 (e.g. 0.2, 0.5, or 1)
and sugar concentration (e.g. 0.1%, 0.5%, or 1%) in a glass culture tube. 200 µL of sample was
drawn every 24 hours and the cell density was counted using a haemocytometer (Hausser
Scientific , Horsham, PA).
5.4.5. Other Assays
Please refer to Section 2.4.2 for yeast transformation, Section 2.4.3 for DNA sequencing,
Section 4.4.3 for yeast surface display and flow cytometry analysis, and Section 4.4.4 for sugar
analysis.
5.5. References
1. US Department of Energy Office of Science and Office of Energy Efficiency and Renewable
Energy, Breaking the biological barriers to cellulosic ethanol: a joint research Agenda,
DOE/SC-0095. www.doegenomestolife.org/biofuels/. 2006.
2. Lynd, L.R., et al., Consolidated bioprocessing of cellulosic biomass: an update. Curr Opin
Biotechnol, 2005. 16(5): p. 577-83.
3. Lynd, L.R., et al., Microbial cellulose utilization: fundamentals and biotechnology.
Microbiol Mol Biol Rev, 2002. 66(3): p. 506-77.
4. Bayer, E.A., R. Lamed, and M.E. Himmel, The potential of cellulases and cellulosomes for
cellulosic waste management. Curr Opin Biotechnol, 2007. 18(3): p. 237-45.
5. Wen, F., N.U. Nair, and H. Zhao, Protein engineering in designing tailored enzymes and
microorganisms for biofuels production. Curr Opin Biotechnol, 2009. 20(4): p. 412-9.
6. Wen, F., J. Sun, and H. Zhao, Yeast surface display of trifunctional minicellulosomes for
simultaneous saccharification and fermentation of cellulose to ethanol. Appl Environ
Microbiol, 2010. 76(4): p. 1251-60.

163
7. Den Haan, R., et al., Hydrolysis and fermentation of amorphous cellulose by recombinant
Saccharomyces cerevisiae. Metab Eng, 2007. 9(1): p. 87-94.
8. Zhou, L., et al., Expression of Trichoderma reesei endo-beta-glucanase II in silkworm,
Bombyx mori L. by using BmNPV/Bac-to-Bac expression system and its bioactivity assay.
Biotechnol Lett. 32(1): p. 67-72.
9. Okada, H., et al., Efficient secretion of Trichoderma reesei cellobiohydrolase II in
Schizosaccharomyces pombe and characterization of its products. Appl Microbiol
Biotechnol, 1998. 49(3): p. 301-8.
10. Takada, G., et al., Expression of Aspergillus aculeatus No. F-50 cellobiohydrolase I (cbhI)
and beta-glucosidase 1 (bgl1) genes by Saccharomyces cerevisiae. Biosci Biotechnol
Biochem, 1998. 62(8): p. 1615-8.
11. Gal, L., et al., CelG from Clostridium cellulolyticum: a multidomain endoglucanase acting
efficiently on crystalline cellulose. J Bacteriol, 1997. 179(21): p. 6595-601.
12. Fierobe, H.P., et al., Purification and characterization of endoglucanase C from Clostridium
cellulolyticum. Catalytic comparison with endoglucanase A. Eur J Biochem, 1993. 217(2): p.
557-65.
13. Gaudin, C., et al., CelE, a multidomain cellulase from Clostridium cellulolyticum: a key
enzyme in the cellulosome? J Bacteriol, 2000. 182(7): p. 1910-5.
14. Reverbel-Leroy, C., et al., The processive endocellulase CelF, a major component of the
Clostridium cellulolyticum cellulosome: purification and characterization of the recombinant
form. J Bacteriol, 1997. 179(1): p. 46-52.
15. Fierobe, H.P., et al., Degradation of cellulose substrates by cellulosome chimeras. Substrate
targeting versus proximity of enzyme components. J Biol Chem, 2002. 277(51): p. 49621-30.
16. Johnston, M., A model fungal gene regulatory mechanism: the GAL genes of Saccharomyces
cerevisiae. Microbiol Rev, 1987. 51(4): p. 458-76.
17. Napp, S.J. and N.A. Da Silva, Enhanced productivity through gratuitous induction in
recombinant yeast fermentations. Biotechnol Prog, 1994. 10(1): p. 125-8.
164
18. Kim, M.D., et al., Production of antithrombotic hirudin in GAL1-disrupted Saccharomyces
cerevisiae. Appl Microbiol Biotechnol, 2004. 65(3): p. 259-62.
19. Carlson, M., Glucose repression in yeast. Curr Opin Microbiol, 1999. 2(2): p. 202-7.
20. Guldener, U., et al., A new efficient gene disruption cassette for repeated use in budding
yeast. Nucleic Acids Res, 1996. 24(13): p. 2519-24.
21. Boder, E.T. and K.D. Wittrup, Yeast surface display for screening combinatorial polypeptide
libraries. Nat Biotechnol, 1997. 15(6): p. 553-7.
22. Cappellaro, C., et al., Mating type-specific cell-cell recognition of Saccharomyces cerevisiae:
cell wall attachment and active sites of a- and alpha-agglutinin. EMBO J, 1994. 13(20): p.
4737-44.
23. Clements, J.M., et al., Secretion of human epidermal growth factor from Saccharomyces
cerevisiae using synthetic leader sequences. Gene, 1991. 106(2): p. 267-71.
24. Parekh, R., K. Forrester, and D. Wittrup, Multicopy overexpression of bovine pancreatic
trypsin inhibitor saturates the protein folding and secretory capacity of Saccharomyces
cerevisiae. Protein Expr Purif, 1995. 6(4): p. 537-45.
25. Lee, F.W. and N.A. Da Silva, Improved efficiency and stability of multiple cloned gene
insertions at the delta sequences of Saccharomyces cerevisiae. Appl Microbiol Biotechnol,
1997. 48(3): p. 339-45.
26. Ragauskas, A.J., et al., The path forward for biofuels and biomaterials. Science, 2006.
311(5760): p. 484-9.
27. Shoemaker, S., et al., Molecular cloning of exo–cellobiohydrolase I derived from
Trichoderma reesei strain L27. Nat Biotechnol, 1983. 1: p. 691-6.
28. Crous, J.M., I.S. Pretorius, and W.H. van Zyl, Cloning and expression of the alpha-L-
arabinofuranosidase gene (ABF2) of Aspergillus niger in Saccharomyces cerevisiae. Appl
Microbiol Biotechnol, 1996. 46(3): p. 256-60.

165
29. La Grange, D.C., et al., Degradation of xylan to D-xylose by recombinant Saccharomyces
cerevisiae coexpressing the Aspergillus niger beta-xylosidase (xlnD) and the Trichoderma
reesei xylanase II (xyn2) genes. Appl Environ Microbiol, 2001. 67(12): p. 5512-9.
30. Shao, Z., H. Zhao, and H. Zhao, DNA assembler, an in vivo genetic method for rapid
construction of biochemical pathways. Nucleic Acids Res, 2009. 37(2): p. e16.