Embed Size (px)
Citation preview

© 2008 IBM Corporation
The New Landscape
Innovation in a Networked World
Francesco AngeleriVice-President IBM ItalyRome, 25th November 2008

© 2008 IBM Corporation2
Corporate Strategy
Innovation in a networked world November 2008
Corporate headquarters: Armonk, NY
387,000 employees
Serving clients in 170 countries worldwide
More than 60 percent of revenue generated outside the United States
8 research laboratories and 24 development laboratories worldwide
Year end 2007, IBM reported:
- $98.4 billion in revenue
- $10.4 billion in net income
IBM Corporation
Percent of IBM’sTotal Revenue in 2007
Services
Software
Other
Hardware
Financing

© 2008 IBM Corporation3
Corporate Strategy
Innovation in a networked world November 2008
IBM Research
Haifa
Almaden Yorktown Heights
Delhi
ZurichBeijing
TokyoAustin
8 research laboratories, over 3,200 scientists and engineers 5 Nobel Prizes Contributes to IBM’s 15 years of patent leadership, yielding more than
37,000 U.S. patents R&D expenses in 2007: $6 billion

© 2008 IBM Corporation4
Corporate Strategy
Innovation in a networked world November 2008
Industry Sectors
Large enterprises Financial services Distribution Manufacturing Communications and
media Public Sector
Small and medium business
IBM operating model
Business Units
HardwareServersStorage
Software Services and solutions
Business Infrastructure
Technology Financing
Geographies
America Europe, Middle East,
Africa Asia Pacific

© 2008 IBM Corporation5
Corporate Strategy
Innovation in a networked world November 2008
Established in 1927
Headquarter in Segrate (Milan), 24 sites in Italy
About 10.000 employees *, over 3,500 business partners
Software Development Laboratory in Rome (500 employees)
Innovation Centers working on leading edge solutions in Naples, Cagliari, Bari, Catania
E-Government Open Solution Center in Rome
IBM Italy Foundation since 1991 operating in social and cultural fields
2007 revenue: € 2.370 million *
IBM in Italy
New IBM Italy Headquarter in Segrate
* figures related to IBM Italy Group

© 2008 IBM Corporation6
Corporate Strategy
Innovation in a networked world November 2008
Bari: Java Technology /Learning Services Technology - Web mission critical applications - Life sciences application - e-learning solutions, knowledge factory
Cagliari: e-Infrastructure Technology - Infrastructure security and performances optimization
Naples: Portal Technology - Web portals development
Catania: Mobile Technology - Wireless e-business solutions
IBM Italy Innovation Centers

© 2008 IBM Corporation7
Corporate Strategy
Innovation in a networked world November 2008
Small & Medium Business Sector WorldWide
Small & Medium Business Worldwide is IBM’s fastest growing IT market opportunity:
- representing the 40% of the total IT Market in 2007
- growing 6% YTY, from $304B to $322B
- generating more than 20% of the IBM revenue

© 2008 IBM Corporation8
Corporate Strategy
Innovation in a networked world November 2008
An overall sales force of 300 people spread over the Italian geography
IBM presence distributed over 7 territories with a complete coverage of our country
An ecosystem of 1900 Business Partner with a working force of 20000
people
3500 IBM specialists working on small & medium business
Small & Medium Business Sector Italy

© 2008 IBM Corporation9
Corporate Strategy
Innovation in a networked world November 2008
In a connected, IT-enabled world, work moves to where it can best be
performed. New market opportunities are opening around the globe.
Chapter 1 Global Backdrop

© 2008 IBM Corporation10
Corporate Strategy
Innovation in a networked world November 2008
Over one billion individuals are using the internet
~17% of global population
Internet Connectedness as of 2006
Source: Computer Industry Almanac http://www.c-i-a.com/pr0899.htm
# of
Inte
rnet
Use
rs (M
)
North America
Western Europe
Asia-Pacific
South Central America
Eastern Europe
Middle East/Africa
0
100
200
300
400
500
600
700
800
1995 2000 2005
Deployment Installation Crash
Worldwide Internet Usage by Region
Source: http://www.internetworldstats.com/stats.htm
Region 1995 2005
North America 69% 30%
Western Europe 20% 28%
Asia-Pacific 8% 25%
South Central America
1% 7%
Eastern Europe 1% 6%
Middle East / Africa
1% 4%
Regional Share
30%
28%
25%
CAGR 30%

© 2008 IBM Corporation11
Corporate Strategy
Innovation in a networked world November 2008
Trade Regulations
Internet and Wireless Communications
Enterprise Resource Planning
Global centers of excellence
Best in class partnerships
Flexible sourcing capabilities
Global marketplaces
Global resource optimization
Streamlined infrastructure
Internal and external collaboration
Open Standards …Enable Global Componentization…
…With Seamless Integration
Open Business Environments:Work flows to the places where it can best be done

© 2008 IBM Corporation12
Corporate Strategy
Innovation in a networked world November 2008
Outsourcing today involves a broad spectrum of talent
Position Type Supply (K)
Support Staff 5,000
Generalist Young Prof. 3,245
Finance/ Accounting 2,184
Analyst Young Prof. 1,799
Nurses 1,089
Engineering Young Prof. 946
Doctors 742
Life Science Young Prof. 333
Full Time EquivalentsYoung Prof. – Young Professional, less than or equal to 7 years of work experienceAssumes constant suitability rates from 2003 to 2008, aggregated low-wage supply from 28 CompaniesSource: McKinsey “Emerging Global Labor Market” 2005
Likely Low-Wage Suitable Labor Supply (2008)
Dental Care Eye Care Heart Care Heart Surgery Cosmetic Treatment Nephrology Psychiatry Urology
India Medical Packages

© 2008 IBM Corporation13
Corporate Strategy
Innovation in a networked world November 2008
Across the globe, a full two-thirds of all CEOs plan to be engaged in some form of business model innovation over the next 3 years
Business Model Innovation Focus
Source: IBM Global CEO Study 2008; n = 1106 * See appendix for list of emerging economy countries
29%
2%
69%
Limited/NoBMI Focus
ModerateBMI Focus
Strong BMIFocus
“When the business model is innovative, operations and the product will follow automatically.”Ronald de Jong, CEO, Philips Germany
29%
69%
1%
30%
69%
2%
Limited/NoBMI Focus
Moderate BMIFocus
Strong BMIFocus
Established Economy
Emerging Economy*
© 2008 IBM Corporation14
Corporate Strategy
Innovation in a networked world November 2008
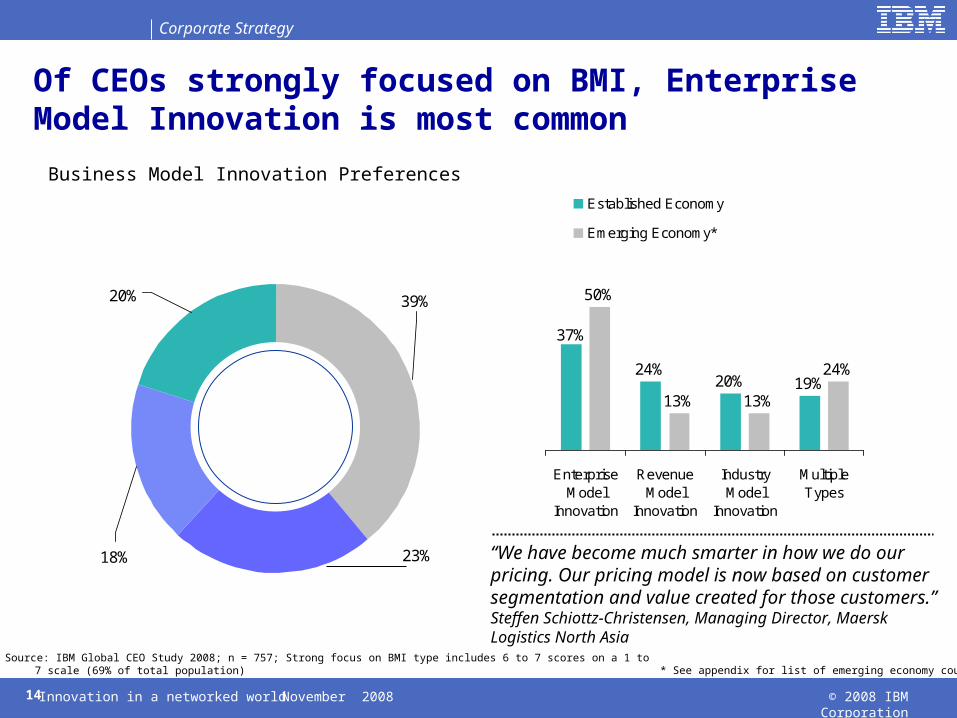
24%20% 19%
50%
13% 13%
24%
37%
EnterpriseModel
Innovation
RevenueModel
Innovation
IndustryModel
Innovation
MultipleTypes
Established Economy
Emerging Economy*
Of CEOs strongly focused on BMI, Enterprise Model Innovation is most common
Business Model Innovation Preferences
Source: IBM Global CEO Study 2008; n = 757; Strong focus on BMI type includes 6 to 7 scores on a 1 to 7 scale (69% of total population)
18%
39%
23%
20%
* See appendix for list of emerging economy countries
“We have become much smarter in how we do our pricing. Our pricing model is now based on customer segmentation and value created for those customers.”Steffen Schiottz-Christensen, Managing Director, Maersk Logistics North Asia

© 2008 IBM Corporation15
Corporate Strategy
Innovation in a networked world November 2008
56%
91%
New Pricing/TaxationStructures and Models
ReconfigureProduct/Service/Value
Mix
n = 234 n = 203
Source: IBM Global CEO Study 2008
38%
57%
71%
Work WithinOrganization
Focus onDifferentiating
Activities
IntenseCollaborationwith External
Partners
Enterprise Model Innovation Focus
n = 369
Revenue Model Innovation Focus
36% 36%
73%
Create EntirelyNew Industries
Move Into NewIndustries
RedefineExisting Markets
Industry Model Innovation Focus
Collaboration is instrumental to drive Enterprise Model Innovation
Revenue Model innovators shift the value mix
Industry Model Innovation remains rare
Within the various business models, CEOs plan to implement distinct initiatives

© 2008 IBM Corporation16
Corporate Strategy
Innovation in a networked world November 2008
Conventional Thinking Required Thinking
Rethinking Intellectual Property Practices
Innovation will dry up without patent protection
IP should be approached secretively and patented defensively
IP sharing and collaboration with other companies has the potential to undermine a company’s distinctiveness and hence, in the long run, its profitability.
IP protection is important, but it can also kill innovation
Tap the larger pool of innovators that don’t work for your firm
Leverage external innovation with a thoughtful portfolio approach to IP Some “shared”, some “proprietary”
and some from public domain
Note: “Flat World” paradigm is adapted from Friedman, T.L., “The World Is Flat”, 2005

© 2008 IBM Corporation17
Corporate Strategy
Innovation in a networked world November 2008
The financial crisis has pushed advanced economies close to recession, with emerging markets now driving global growth
012
34567
89
10
199719
9819
9920
0020
0120
0220
0320
0420
0520
0620
0720
0820
0920
1020
1120
1220
13
Advanced economiesEmerging markets
0%
50%
100% Rest ofthe worldChina
OtherAdvancedUnitedStates
Real Economic Growth by Market Type, 1997-2013f % IMF Projections of Global GDP Growth,
2006-2012 %
Source of Global Growth, 1990-2009f
Source: IMF World Economic Outlook, April 2008, October 2008Note: ‘Advanced economies’ and ‘emerging markets’ broadly correspond to IBM’s major markets and growth markets categories, but with some exceptions
0246
2006
2007
2008
2009
2010
2011
2012
Downward revision, dueto crisisGlobal GDP growth
1990
1994
1995
1999
2000
2004
2005
2009

© 2008 IBM Corporation18
Corporate Strategy
Innovation in a networked world November 2008
The financial crisis is proving what was widely known – that the world has become smaller and flatter
The deep global impact of the ongoing financial crisis confirms that current globalization has made the world both smaller and flatter than before
A smaller and flatter world has meant that the latest information or sentiment from one economy now travels around the world instantly
With more than 60% of world output now traded internationally, a recession in one region has greater consequences globally- 2008 stock exchange
performances from around the world confirm this
Degree of Correlation Between Selected Stock MarketsJanuary 1 - October 22 2008
City New York Tokyo Shanghai Frankfurt Average
New York \\ 87% 69% 92% 83%
Tokyo 87% \\ 55% 92% 78%
Shanghai 69% 55% \\ 75% 66%
Frankfurt 92% 92% 75% \\ 87%

© 2008 IBM Corporation19
Corporate Strategy
Innovation in a networked world November 2008
A Globally Integrated Enterprise addresses key globalization questions with a suite of six capabilities
How do we deliver unique value in an open,
collaborative ecosystem?
How do we tap the power
of globalization?
How do we forge a strategy
for specialization?Leverage
GlobalAssets
Serve Distinct Global
Markets
Build a Specialized Enterprise
Enable Collaboration
Manage Value in an
Ecosystem of Increasingly Specialized
Entities
Address Shared Risk and Control
Globally Integrated Enterprise
© 2008 IBM Corporation20
Corporate Strategy
Innovation in a networked world November 2008
The traditional IT industry is mature – growth has slowedInnovative firms will adopt modular business designs, an open IT infrastructure with SOA, IOD, CBM, etc.IT investments pay off when they are coupled with changes to workflowDramatic opportunity has opened in business services
Broadened IBM opportunityChapter 2

© 2008 IBM Corporation21
Corporate Strategy
Innovation in a networked world November 2008
The traditional IT industry is maturing and will experience a slower rate of growth
-5
0
5
10
15
20
'95 '96 '97 '98 '99 '00 '01 '02 '03 '04 '05 '06 '07 '08 '09 '10
InstallationInstallation DeploymentDeployment
Source: IBM Market Intelligence analysis, using GMV2H06 and BPV2H06
Traditional ITTraditional IT
Crash
Real GDPReal GDP
% CAGR Growth

© 2008 IBM Corporation22
Corporate Strategy
Innovation in a networked world November 2008
Today’s Enterprise Realities
E01-EDI
Data Warehouse(Interfaces to and from theData Warehouse are not
displayed on this diagram)
Application Diagram V4
G02 - GeneralLedger
A05 - AP
S01 - SalesCorrections
I01 POReceiving
I03 Return toVendor
I06 WarehouseManagement
M a inframe apps - B luePC/NT apps - G reenUnix apps - Y ellow3rd party interface - Orange
Lines: Colors have no special meaning.They are to help make the diagram easier to
read.For More Information: See the databasecontaining information about each
application: Application V4.mdb
S06 - Credit App
P15 EES EmployeeChange Notice
OTHER APPS - PCAP - Collections/Credit
TM - Credit Card DB
ACCTS REC APPS - PC990CORBad Debt
Benefical FeesBeneficial Reconcil
JEAXFJEBFAJEBKAJEDVAJESOAJEVSAJEVSFNSF
TeleCredit Fees
INVENTORY CONTROL APPS - PCCode Alarm
Debit ReceivingsDevo Sales
Display InventoryIn HomeJunkouts
Merchandise WithdrawlPromo CreditsRTV Accrual
ShrinkAP Research - Inv CntrlAP Research-Addl Rpts
Book to Perpetual InventoryClose Out Reporting
Computer Intelligence DataCount Corrections
Cross Ref for VCB DnldsDamage Write OffDebit Receivings
DFI Vendor DatabaseDisplay Inventory ReconcilDisplay Inventory Reporting
INVENTORY CONTROL APPS - PCDPI/CPI
IC BatchingInventory Adj/Count CorrectInventory Control Reports
Inventory LevelsInventory Roll
Merchandise WithdrawlOpen ReceivingsPI Count Results
PI Time Results from InvPrice Protection
Sales Flash ReportingShrink Reporting
SKU Gross MarginSKU Shrink Level Detail
USMVCB Downloads
Journal Entry Tool Kit
Scorecard - HR
L02-ResourceScheduling(Campbell)
P09 - P17Cyborg
M02 - Millennium
M03 - Millennuim 3.0
Banks - ACH and Pos toPay
Cobra
B01 - StockStatus
S03-Polling
P14 On-line NewHire Entry
CTS
Plan Administrators(401K, PCS, Life,
Unicare, SolomonSmith Barney)
D01 Post LoadBilling
I04 HomeDeliveries
I02 -Transfers
Arthur Planning
I07 PurchaseOrder
I12 EntertainmentSoftware
I05Inventory Info
E13E3 Interface
S04 - Sales Posting
V01-Price ManagementSystem
I10 Cycle PhysicalInventory
I55 SKUInformation
K02Customer Repair
TrackingI35 Early Warning
System
B02 MerchandiseAnalysis
I13- AutoReplenishment
U18 - CTO
Intercept
I09 Cycle Counts
E02-EmployeePurchase
Texlon 3.5
ACH
Stock Options
I17 Customer PerceivedIn-Stock
U16-Texlon
SiteSeer
C02 - CapitalProjects
F06 - FixedAssets
US Bank ReconFile
Star Repair
EDICoordinator
Mesa Data
NEW SoundscanNPD Group
AIG Warranty Guard
Resumix
Optika
Store BudgetReporting
P16 - Tally Sheet
Cash Receipts/Credit
S05 - HouseCharges
Ad Expense
L01-PromoAnalysis
V02-PriceMarketingSupport
BMP - Busperformance Mngt
StoreScorecard
I11 PriceTesting
Valley Media
P09Bonus/HR
I15 Hand ScanApps
Roadshow
POS
S08 - VertexSalesTax
A04 - CustRefund Chks
Equifax
ICMS Credit
CellularRollover
S09 - DigitalSatelliteSystem
NPD,SoundScan
Sterling VANMailbox (Value)
I18SKU Rep
X92-X96Host to AS400
Communication
S02 -Layaways
Washington,RGIS,
Ntl Bus Systems
V04-SignSystem
I14 Count CorrectionsNARM
P01-EmployeeMasterfile
I06 - CustomerOrder
FrickCo
UAR - Universal AccountReconcilliation
DepositoryBanks
S07 - CellPhones
S11 - ISPTracking
AAS
Fringe PO
Cash Over/Short
L60 MDFCoop
SKU SelectionTool
SKUPerformance
SupplierCompliance
1
I35 - CEI
ASIS
Misc Accounting/Finance Apps - PC/NTCOBA (Corp office Budget Assistant)
PCBS(Profit Center Budget System)Merchandising Budget
AIMSMerch Mngr Approval
Batch ForcastingAd Measurement
AIMS Admin
AIMSReportingAd
Launcher
V03- MktReactions
SpecSource
CTO2.Bestbuy.com
RebateTransfer
SignSystem
CopyWriter'sWorkspace
ELTPowerSuite
StoreMonitor
AIS Calendar
Stores & Mrkts
Due Dates
Smart Plus
InsertionsOrders
BudgetAnalysis Tool
Print CostingInvoice App
AIS Reports
BroadcastFilter
Smart PlusLauncher
GeneralMaintenance
Printer PO
PrinterMaintenance
VendorMaintenance
Vendor Setup
Connect 3
Connect 3Reports
Connect 3PDF Transfe
Spec SourceSKU Tracking
S20-SalesPolling
Prodigy
PSP
In-HomeRepair
WarrantyBillingSystem
Process Servers(Imaging)
Prepared by Michelle Mills
Page 1 of 2
Source: IBM client engagement experience

© 2008 IBM Corporation23
Corporate Strategy
Innovation in a networked world November 2008
A Component View of a Business Supports Modular Designs: The IBM Component Business Methodology
A Business Component is a part of an enterprise that has the potential to operate independently, in the extreme as part of another company.
Columns are Business Competencies, defined as large business areas with characteristic skills and capabilities, for example, product development or supply chain.
An Accountability Level characterizes the scope and intent of activity and decision-making. The three levels used in CBM are Directing, Controlling and Executing.
Directing is about strategy, overall direction and policy.
Controlling is about monitoring, managing exceptions and tactical decision making
Executing is about doing the work

© 2008 IBM Corporation24
Corporate Strategy
Innovation in a networked world November 2008
We use evaluation criteria to compare components and we use the comparison to select and prioritise improvement projects. A ‘heat map’ can be used to show the results.
Business Administration
New Business Development
Relationship Management
Servicing and Sales
Product Fulfillment
Financial Control and Accounting
DirectingBusiness Planning
Sector Planning
Account Planning
Sales Planning
Fulfillment Planning
Portfolio Planning
Controlling
Business Unit Tracking
Sector Management
Relationship Management
Sales Management
Fulfillment Planning
Compliance
ReconciliationStaff Appraisals
Product Management
Credit Assessment
Executing
Staff Administration
Product Directory
Credit Administration
SalesProduct Fulfillment
Customer Accounts
Product Administration
Marketing Campaigns
Customer Dialog
Document Managem’n
t
General Ledger
Contact Routing
M L Differentiated
Competitive
Target Competency
Base
Revenue / Cost
RevenueCost
(H, M, or L)
“Hot” Component
M L
L L
M L
M L
M L
L L
M L
M L
M L
M L M L
M L
H L
M L
M L
M L
L H
M L
M L
L M
L M
M L
Revenue/Profit improvement opportunity
L M
Cost control opportunity

© 2008 IBM Corporation25
Corporate Strategy
Innovation in a networked world November 2008
SOA is at the core of Business Process Management. SOA improves how you design, manage, and optimize your business processes by enabling:
Solution building efficiencyReuse of existing assetsFlexibility in change
SOA allows you to create a set of related and integrated “services” – i.e. repeatable business tasks – that support a business process.
Service-Oriented Architecture Enables Critical Business Restructuring
© 2008 IBM Corporation26
Corporate Strategy
Innovation in a networked world November 2008
The IT role: from technological enabler to
generator of solutions that make the “difference” on the
market

© 2008 IBM Corporation27
Corporate Strategy
Innovation in a networked world November 2008
Source: Gartner 2008
IT Strategies
IT Role
The payoff comes from making use of IT to bring new valued ideas to market

© 2008 IBM Corporation28
Corporate Strategy
Innovation in a networked world November 2008
Managing value in an ecosystem of increasingly specialized entities requires a new paradigm
R&D MfgClients
Dist Sales Sup-port
Value Chain Model
R&D
Shared Services
Client
Centric Model
Globally Integrated Enterprise Value Model
Front OfficeBack Office
Traditional frame for understanding value creation
Not sufficient to explore value in the New Landscape
Practical systems view of the value-creating ecosystem – back office and front office
Emphasis is placed on fulfilling client demands
Provides the basis to view and understand value-creating elements
Highlights inter-relationships of front and back office functions

© 2008 IBM Corporation29
Corporate Strategy
Innovation in a networked world November 2008
Source: IBM Market Intelligence and Corporate Strategy analysis, using GMV2H06 and BPV2H06
2000 20102005
1480
1932
Revenue (B$)
2385
1736
1317
Value Migration in an Expanding Opportunity SpaceOperating Profit (B$)
230 13%
16%
9%
23% 5%
8%
20%
25%
6%
20102000
289
95
1736
’05-’10CGR%
7%
’00-’05CGR%
19%
’05-’10CGR%
5%
2005
’00-’05CGR%
6%
2005 OpProf %
Business Value
Infrastructure Value
Component Value
IT Services
MW and Op Sys SW
HW-Not Served
Business Consulting
Application Software
HW-Served
Transaction Processing Services
Business Process Outsourcing

© 2008 IBM Corporation30
Corporate Strategy
Innovation in a networked world November 2008
2006 YTY@ CC
Long Term Revenue Growth Model
Services Revenue Growth Model
Strategic Outsourcing 4% - 6% 3%
Integrated Tech Services 5% - 7% -2%
Maintenance (2%) - 0% 2%
Business Transformation Outsourcing
10% - 15% 17%
Global Business Services 6% - 8% 1%
Acquisitions 2 pts --
Total Services 6% - 8% 2%
Services37%
Software
IBM Pre-Tax Income Mix2006
Hardware &
Financing

© 2008 IBM Corporation31
Corporate Strategy
Innovation in a networked world November 2008
IBM’s strategy is focused on clients that value innovation and is designed to leverage global trends.The IBM Values are foundational to our strategy and well aligned to the realities of the new landscape
IBM StrategyChapter 3

© 2008 IBM Corporation32
Corporate Strategy
Innovation in a networked world November 2008
Your products?Your services?Your financial strengths?Your customer base?Your supply chain?Your management systems?Your business model?Your history?Your brand?Your expertise?
Whatever it is that makes you unique… infuse it with the new enablers of innovation, and you can earn higher profits, penetrate new markets, drive productivity – in a word, differentiate yourself from the competition.
What makes you special?
Focus on Enterprises that Value Integration & Innovation
Pre 1900 1900s 1910s 1920s 1930s 1940s 1950s 1960s 1970s 1980s 1990s 2000s
IBM through the years

© 2008 IBM Corporation33
Corporate Strategy
Innovation in a networked world November 2008
Changes
in world
markets:
The rising tide
of globalization
Changes in
Information
Technology:
A new computing
architecture
Changes
in client
needs:
Integration and
innovation
Several years ago, we saw change coming

© 2008 IBM Corporation34
Corporate Strategy
Innovation in a networked world November 2008
I. To become the premier Globally Integrated Enterprise
II. To focus on open technologies and high-value solutions
III. To deliver integration and innovation to clients
We made important strategic decisions, and got to work

© 2008 IBM Corporation35
Corporate Strategy
Innovation in a networked world November 2008
Strong Geographic Growth 2007 Revenue byGeographic Region(excludes OEM)
21% Asia Pacific
36%Europe, Middle East and Africa
43%Americas
Countries with IBM revenue growth greater than 10 percent in local currency in 2007
We globally integrated IBM in order to participate in the world’s growth markets and improve our productivity

© 2008 IBM Corporation36
Corporate Strategy
Innovation in a networked world November 2008
SegmentPretaxIncome
Mix
SegmentPretaxIncome
Mix
2007
IBM pretax income $14.5 billionIBM pretax margin 14.7%
2003
IBM pretax income $9.4 billionIBM pretax margin 10.6%
We remixed our businesses in order to move to the emerging higher-value spaces

© 2008 IBM Corporation37
Corporate Strategy
Innovation in a networked world November 2008
policy andsociety
innovation
productinnovation
managementand culture
of innovation
servicesinnovation
business modelinnovation
businessprocessinnovation
We focused on integration and innovation in order to enable our clients’ success
Placing
a Premium
on
Innovation

© 2008 IBM Corporation38
Corporate Strategy
Innovation in a networked world November 2008
Record Cash PerformanceNet Cash from Operations,Excluding Global Financing Receivables ($ in billions)
Record Earnings Per ShareEarnings Per Share (From continuing operations)
Record Revenue($ in billions)
Record Income($ in billions)
As a result, today IBM is a higher-performing enterprise than it was a decade ago

© 2008 IBM Corporation39
Corporate Strategy
Innovation in a networked world November 2008
Primary Uses of Cash overthe Past Five Years
More than $83 billion since 2003
…while continuing to invest in R&D – more than $29 billion over the past five years
That has enabled us to invest in future sources of growth and provide record return to investors…

© 2008 IBM Corporation40
Corporate Strategy
Innovation in a networked world November 2008
Major Growth Opportunities
Area Opportunity
Emerging Markets China, India and Brazil
Small & Medium Business Services, Software
Business Services BPO, Mortgage, Engineering
Information on Demand 3rd Generation BI, Paper Based, Archive and Discovery
Service Oriented Architecture
Solution Flexibility, S&A
Security DVS, Appliances
Services Products Power Management, ISS
Server Consolidation Technology Leadership, Z Growth

© 2008 IBM Corporation41
Corporate Strategy
Innovation in a networked world November 2008
IBM Values
Dedication to every client’s success
Innovation that matters – for our company and for the world
Trust and personal responsibility in all relationships