Embed Size (px)
Citation preview
© 2005 Worth Publishers Slide 7-1
CHAPTER 7Making Decisions
PowerPoint® Slides by Can Erbil and Gustavo Indart
© 2005 Worth Publishers, all rights reserved
© 2005 Worth Publishers Slide 7-2
What You Will Learn in this Chapter: How economists model decision making by individuals and firms
The importance of implicit as well as explicit costs in decision making
The difference between accounting profit and economic profit, and why economic profit is the correct basis for decisions
The difference between “either–or” and “how much” decisions
The principle of marginal analysis
What sunk costs are and why they should be ignored
How to make decisions in cases where time is a factor
© 2005 Worth Publishers Slide 7-3
Opportunity Cost and Decisions
An explicit cost is a cost that involves actually laying out money.
An implicit cost does not require an outlay of money; it is measured by the value, in dollar terms, of the benefits that are forgone.

© 2005 Worth Publishers Slide 7-4
Opportunity Cost of an Additional Year of School
© 2005 Worth Publishers Slide 7-5
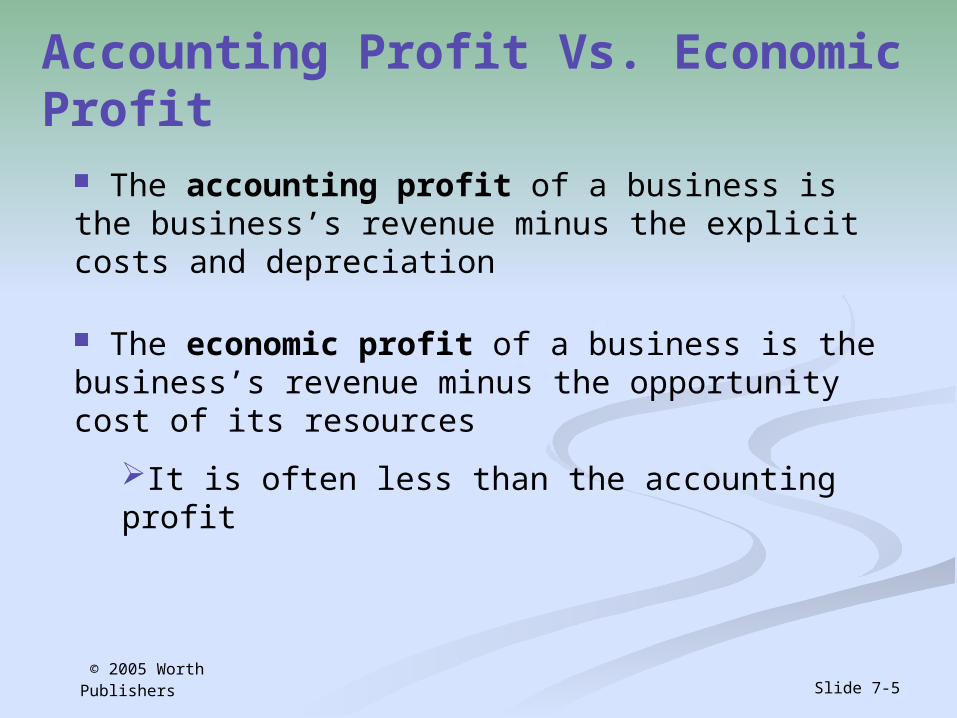
Accounting Profit Vs. Economic Profit
The accounting profit of a business is the business’s revenue minus the explicit costs and depreciation
The economic profit of a business is the business’s revenue minus the opportunity cost of its resources
It is often less than the accounting profit
© 2005 Worth Publishers Slide 7-6
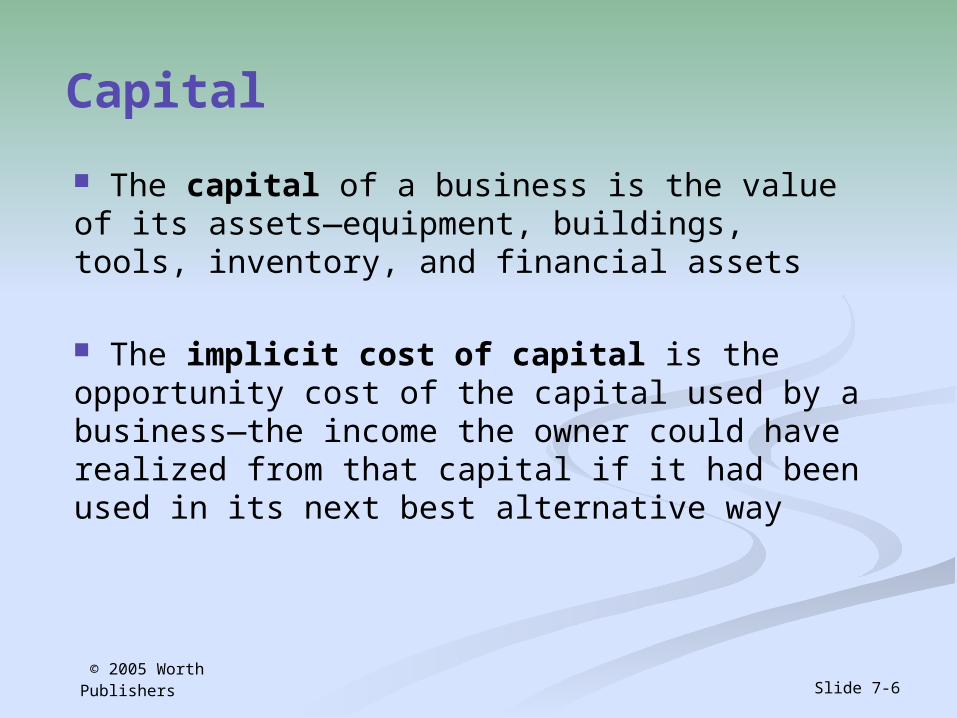
Capital
The capital of a business is the value of its assets—equipment, buildings, tools, inventory, and financial assets
The implicit cost of capital is the opportunity cost of the capital used by a business—the income the owner could have realized from that capital if it had been used in its next best alternative way
© 2005 Worth Publishers Slide 7-7
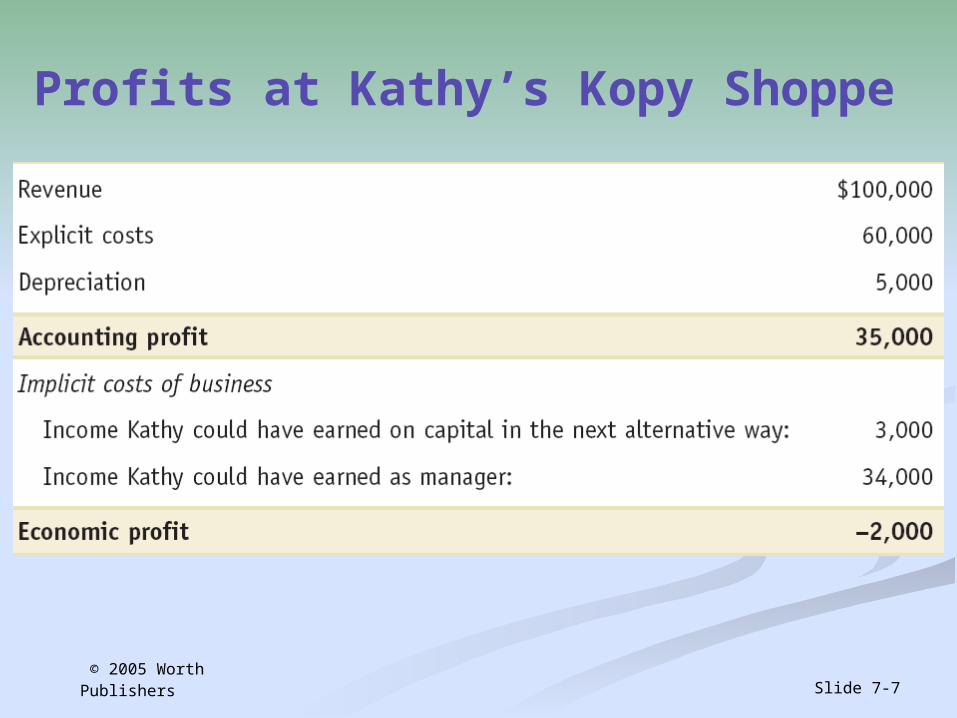
Profits at Kathy’s Kopy Shoppe
© 2005 Worth Publishers Slide 7-8
“How Much” Versus “Either–Or” Decisions
“How much” decisions:How many days before you do your laundry? How many miles do you go before an oil change in your car? How many jalapenos on your nachos? How many hours of sleep before the midterm exam?
“Either–or” decisions:An order of nachos or a sandwich?Buy a car or not? Go out or study for the midterm exam? Invade at Calais or at Normandy? Run your own business or work for someone else?
© 2005 Worth Publishers Slide 7-9
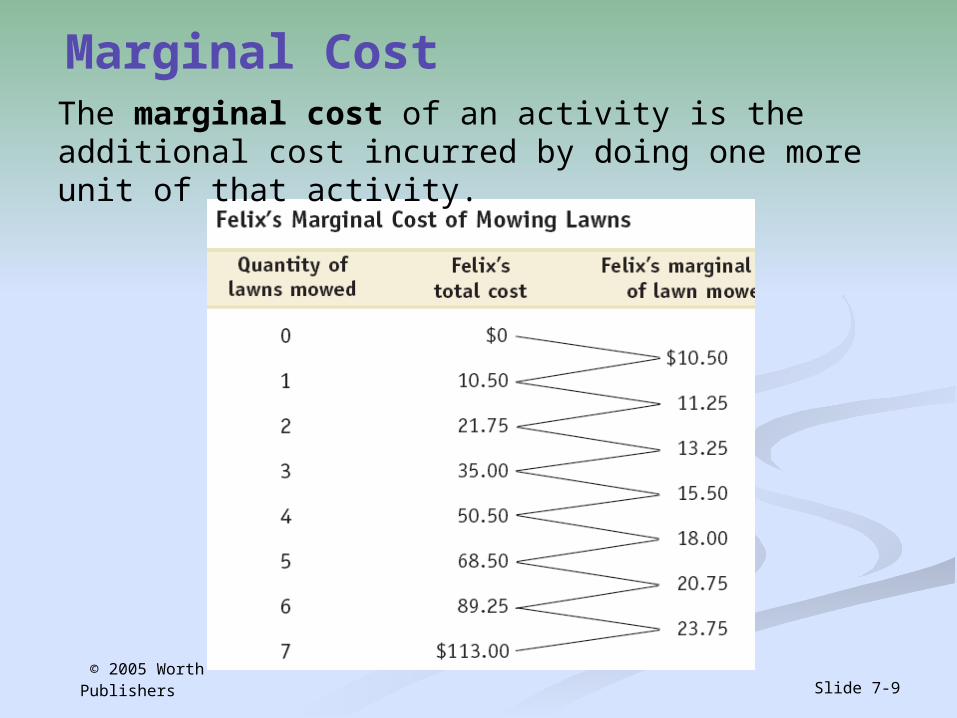
Marginal CostThe marginal cost of an activity is the additional cost incurred by doing one more unit of that activity.
© 2005 Worth Publishers Slide 7-10
Increasing Marginal Cost
Felix’s marginal cost is greater the more lawns he has already mowed
that is, each time he mows a lawn, the additional cost of doing yet another lawn goes up
There is increasing marginal cost from an activity when each additional unit of the activity costs more than the previous unit
© 2005 Worth Publishers Slide 7-11
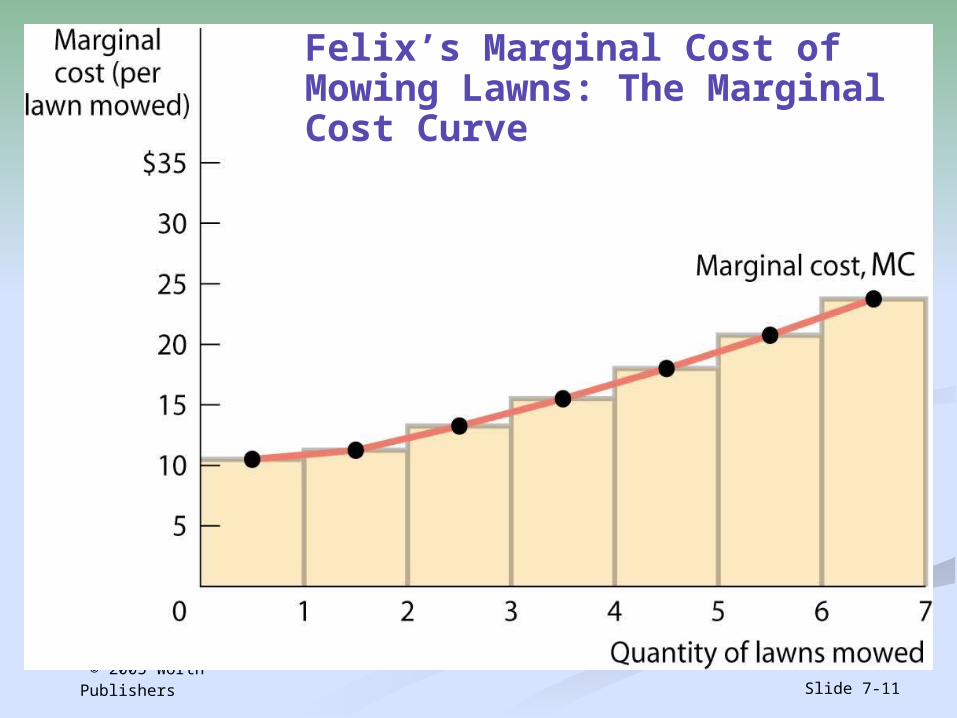
Felix’s Marginal Cost of Mowing Lawns: The Marginal Cost Curve
© 2005 Worth Publishers Slide 7-12
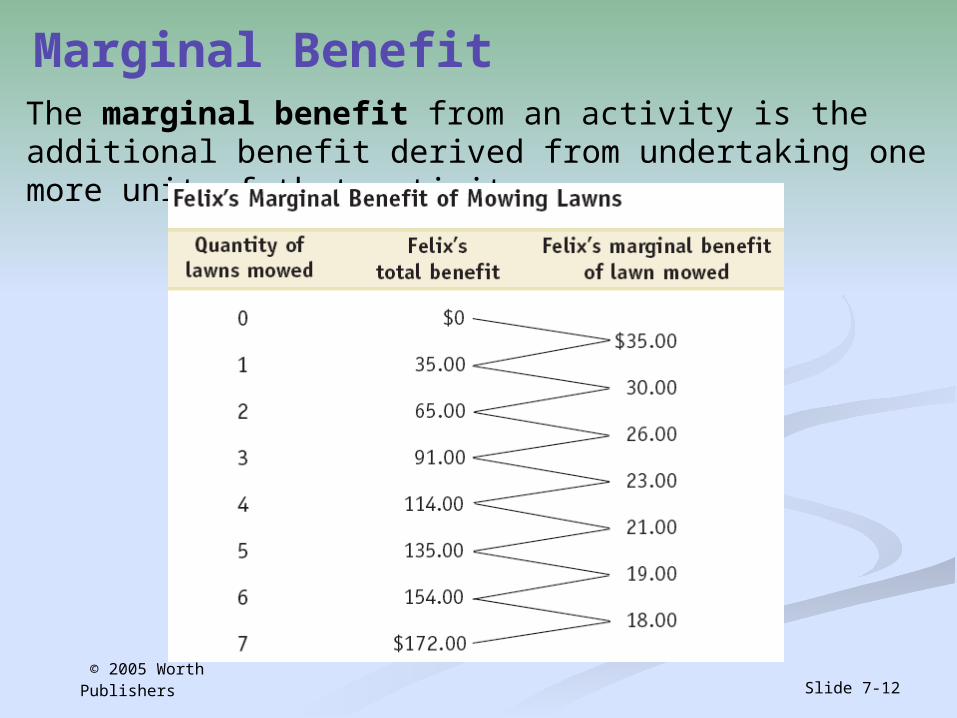
Marginal BenefitThe marginal benefit from an activity is the additional benefit derived from undertaking one more unit of that activity.
© 2005 Worth Publishers Slide 7-13
Decreasing Marginal Benefit
Each additional lawn mowed produces less benefit than the previous lawn with decreasing marginal benefit, each additional unit produces less benefit than the unit before
There is decreasing marginal benefit from an activity when each additional unit of the activity produces less benefit than the previous unit
© 2005 Worth Publishers Slide 7-14
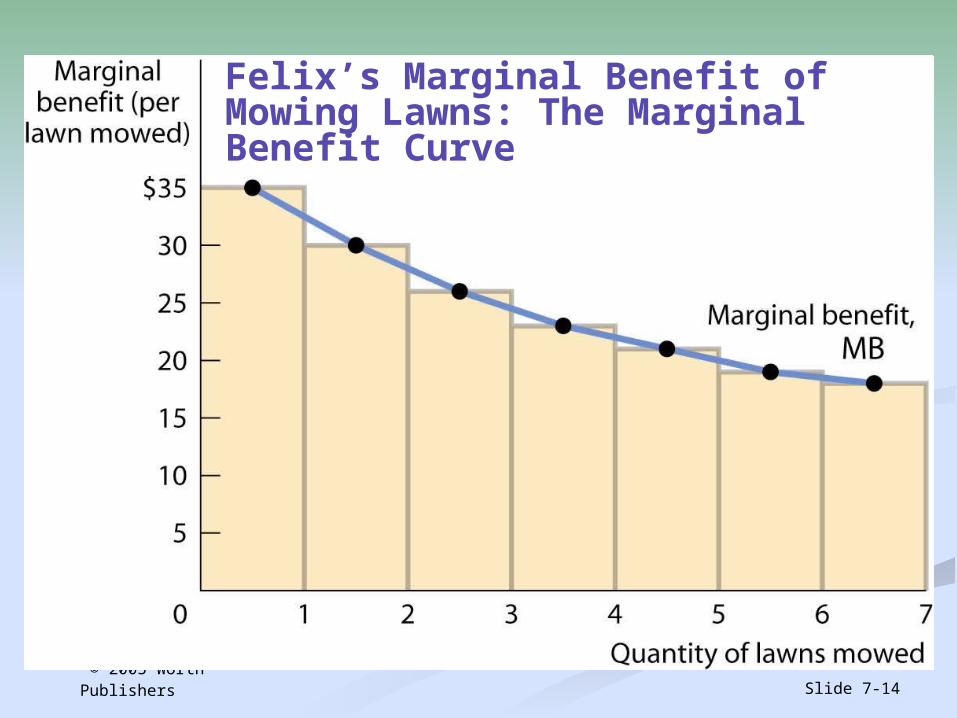
Felix’s Marginal Benefit of Mowing Lawns: The Marginal Benefit Curve
© 2005 Worth Publishers Slide 7-15
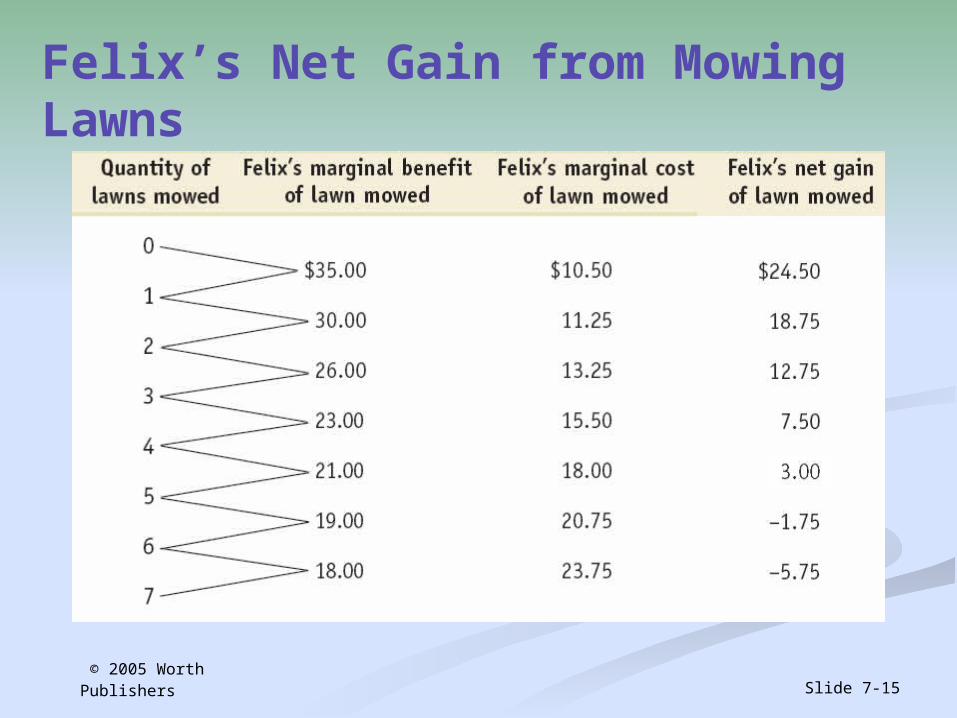
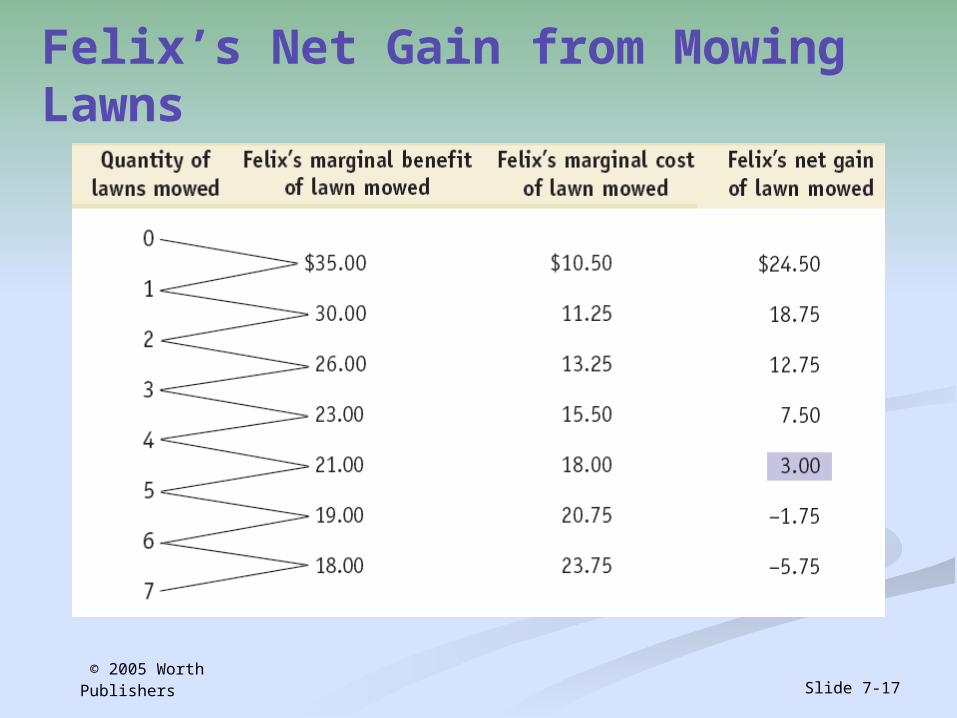
Felix’s Net Gain from Mowing Lawns
© 2005 Worth Publishers Slide 7-16
Marginal Analysis
The optimal quantity of an activity is the level that generates the maximum possible total net gain.
The principle of marginal analysis says that the optimal quantity of an activity is the quantity at which marginal benefit is equal to marginal cost.
© 2005 Worth Publishers Slide 7-17
Felix’s Net Gain from Mowing Lawns
© 2005 Worth Publishers Slide 7-18
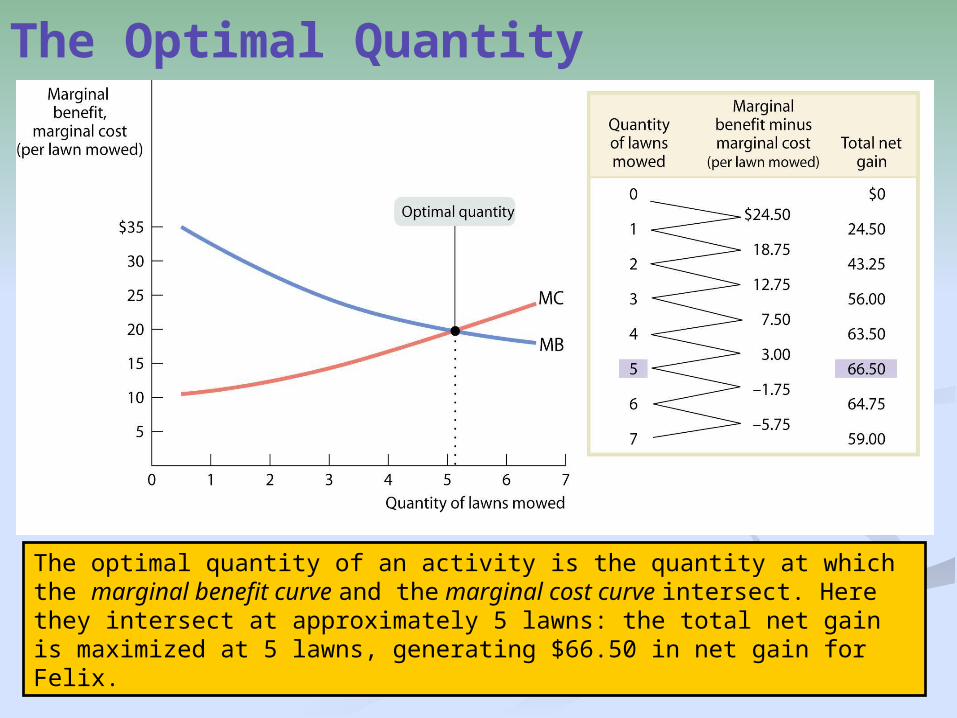
The Optimal Quantity
The optimal quantity of an activity is the quantity at which the marginal benefit curve and the marginal cost curve intersect. Here they intersect at approximately 5 lawns: the total net gain is maximized at 5 lawns, generating $66.50 in net gain for Felix.
© 2005 Worth Publishers Slide 7-19
Sunk Cost
A sunk cost is a cost that has already been incurred and is nonrecoverable. A sunk cost should be ignored in decisions about future actions
Sunk costs should be ignored in making decisions about future actions because they have no influence on their costs and benefits
“There’s no use crying over spilled milk”
© 2005 Worth Publishers Slide 7-20
The Concept of Present Value When someone borrows money for a year, the interest rate is the price, calculated as a percentage of the amount borrowed, charged by the lender
The interest rate can be used to compare the value of a dollar realized today with the value of a dollar realized later, because it correctly measures the cost of delaying a dollar of benefit (and the benefit of delaying a dollar of cost)
The present value of $1 realized one year from now is equal to $1/(1 + r): the amount of money you must lend out today in order to have $1 in one year
It is the value to you today of $1 realized one year from now
© 2005 Worth Publishers Slide 7-21
Present Value (continued)
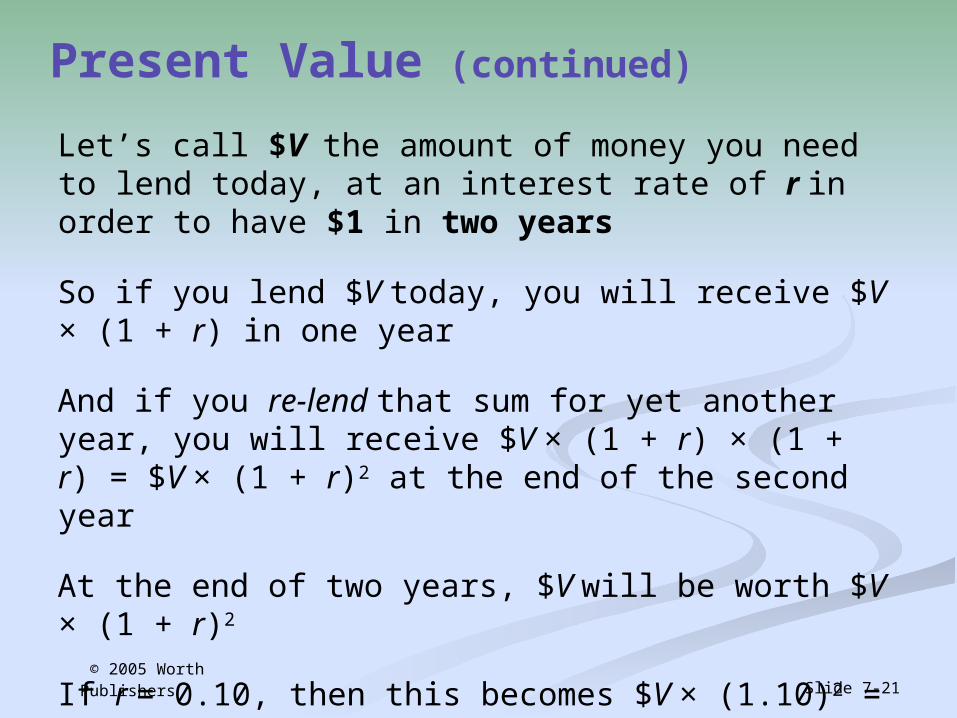
Let’s call $V the amount of money you need to lend today, at an interest rate of r in order to have $1 in two years
So if you lend $V today, you will receive $V × (1 + r) in one year
And if you re-lend that sum for yet another year, you will receive $V × (1 + r) × (1 + r) = $V × (1 + r)2 at the end of the second year
At the end of two years, $V will be worth $V × (1 + r)2
If r = 0.10, then this becomes $V × (1.10)2 = $V × (1.21)
© 2005 Worth Publishers Slide 7-22
Present Value (continued)
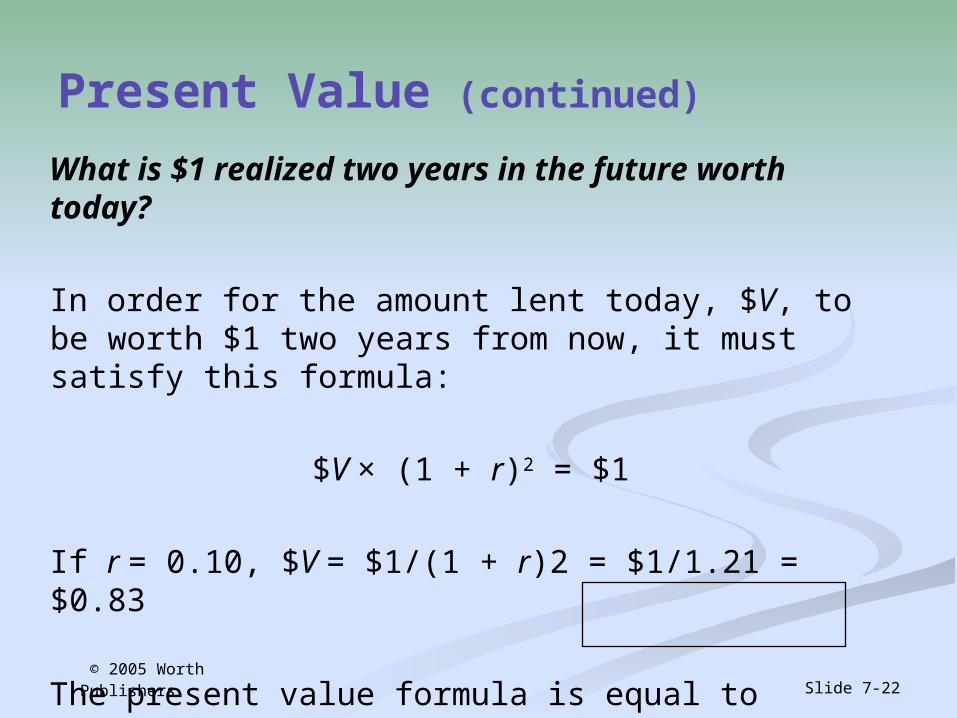
What is $1 realized two years in the future worth today?
In order for the amount lent today, $V, to be worth $1 two years from now, it must satisfy this formula:
$V × (1 + r)2 = $1
If r = 0.10, $V = $1/(1 + r)2 = $1/1.21 = $0.83
The present value formula is equal to $1/(1 + r)N
© 2005 Worth Publishers Slide 7-23
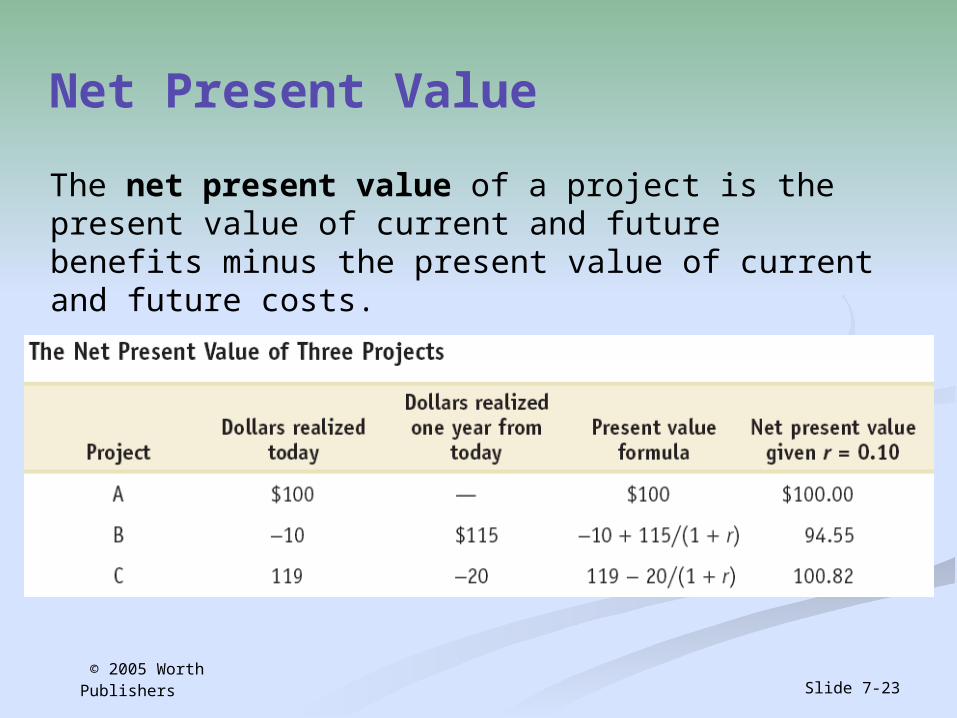
Net Present Value
The net present value of a project is the present value of current and future benefits minus the present value of current and future costs.
© 2005 Worth Publishers Slide 7-24
The End of Chapter 7
Coming Attraction:Chapter 8:
Behind the Supply Curve: Inputs and
Costs