Embed Size (px)
Citation preview
© 2004 Prentice-Hall, Inc. Chap 12-1
Basic Business Statistics(9th Edition)
Chapter 12Tests for Two or More
Samples with Categorical Data
© 2004 Prentice-Hall, Inc. Chap 12-2
Chapter Topics
Z Test for Differences in Two Proportions(Independent Samples)
2 Test for Differences in Two Proportions(Independent Samples)
2 Test for Differences in More than Two Proportions (Independent Samples)
Marascuilo Procedure 2 Test of Independence
© 2004 Prentice-Hall, Inc. Chap 12-3
Z Test for Differences in Two Proportions
What is It Used For? To determine whether there is a difference
between 2 population proportions or whether one is larger than the other
Assumptions: Independent samples Population follows binomial distribution Sample size large enough: np 5 and n(1-p)
5 for each population
© 2004 Prentice-Hall, Inc. Chap 12-4
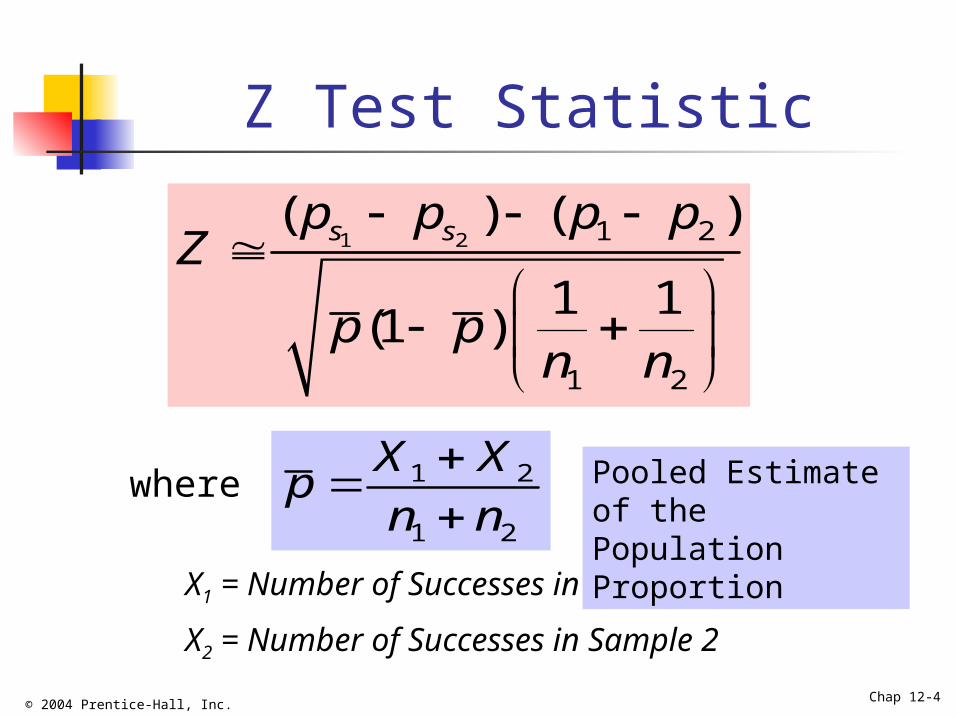
Z Test Statistic
1 2 1 2
1 2
( ) ( )
1 1(1 )
s sp p p pZ
p pn n
1 2
1 2
X Xp
n n
where
X1 = Number of Successes in Sample 1
X2 = Number of Successes in Sample 2
Pooled Estimate of the Population Proportion
© 2004 Prentice-Hall, Inc. Chap 12-5
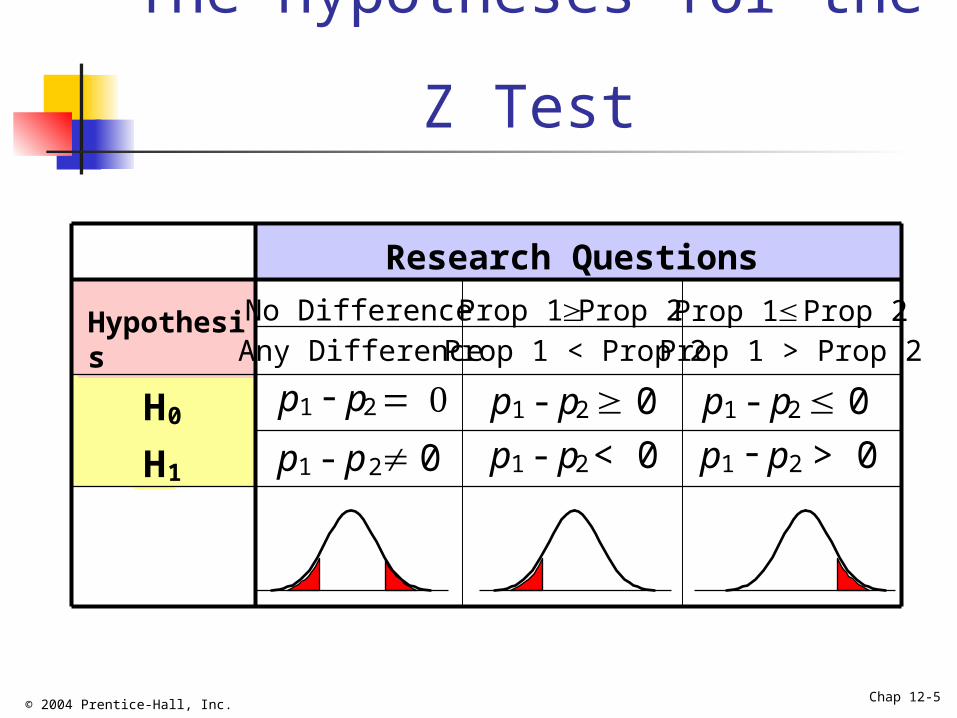
The Hypotheses for the Z Test
Research Questions
Hypothesis No DifferenceAny Difference
Prop 1 Prop 2Prop 1 < Prop 2
Prop 1 Prop 2Prop 1 > Prop 2
H0 p1 - p2 p1 - p2 0 p1 - p2 0
H1 p1 - p2 0 p1 - p2 < 0 p1 - p2 > 0
© 2004 Prentice-Hall, Inc. Chap 12-6
1
2
1
2
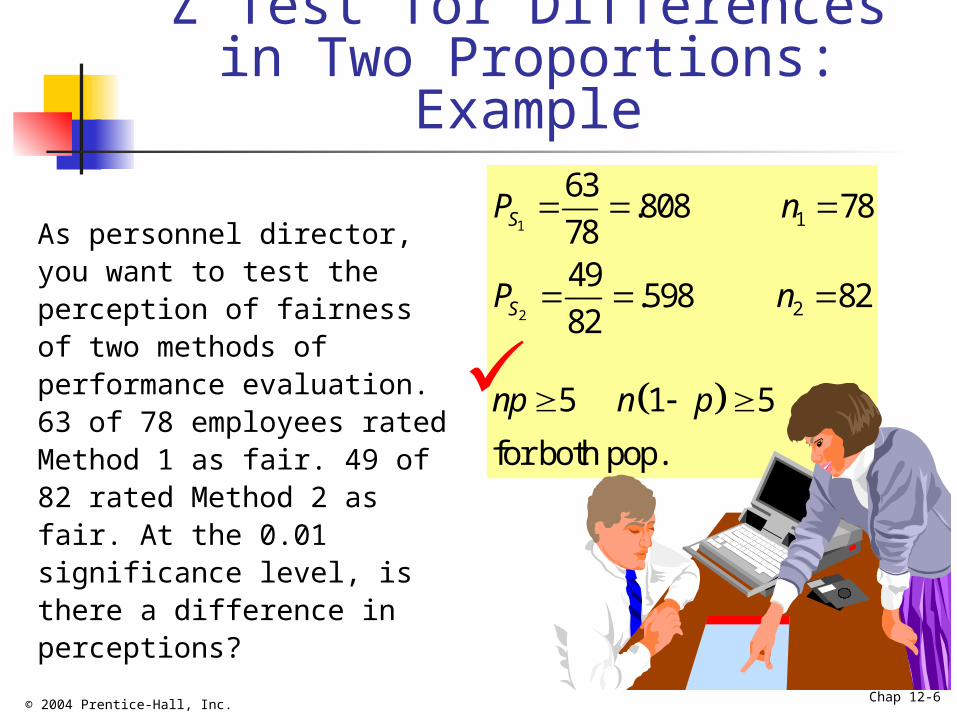
63.808 78
7849
.598 8282
5 1 5
for both pop.
S
S
P n
P n
np n p
Z Test for Differences in Two Proportions: Example
As personnel director, you want to test the perception of fairness of two methods of performance evaluation. 63 of 78 employees rated Method 1 as fair. 49 of 82 rated Method 2 as fair. At the 0.01 significance level, is there a difference in perceptions?
© 2004 Prentice-Hall, Inc. Chap 12-7
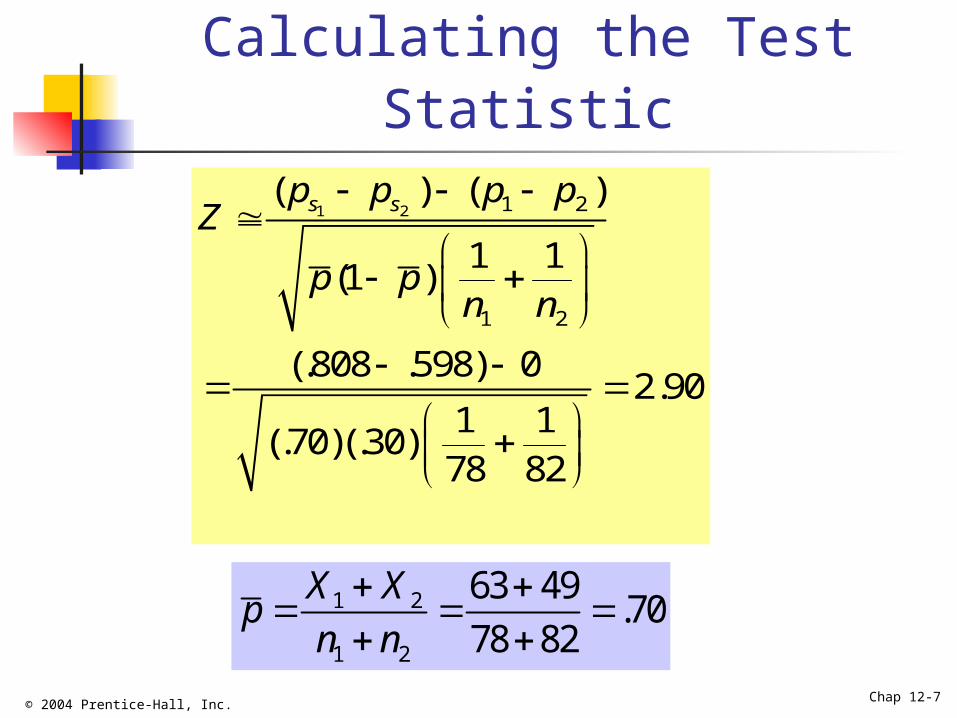
Calculating the Test Statistic
1 2 1 2
1 2
( ) ( )
1 1(1 )
(.808 .598) 02.90
1 1(.70)(.30)
78 82
s sp p p pZ
p pn n
1 2
1 2
63 49.70
78 82
X Xp
n n

© 2004 Prentice-Hall, Inc. Chap 12-8
Z Test for Differences in Two Proportions: Solution
H0: p1 - p2 = 0
H1: p1 - p2 0
= 0.01n1 = 78 n2 = 82
Critical Value(s):
Test Statistic:
Decision:
Conclusion:
Reject at = 0.01.
There is evidence of a difference in proportions.
Z 290.
Z0 2.58-2.58
.005
Reject H0 Reject H0
.005
© 2004 Prentice-Hall, Inc. Chap 12-9
Z Test for Differences in Two Proportions in PHStat
PHStat | Two-Sample Tests | Z Test for Differences in Two Proportions …
Example Solution in Excel Spreadsheet
Microsoft Excel Worksheet
© 2004 Prentice-Hall, Inc. Chap 12-10
Confidence Interval for Differences in Two
Proportions
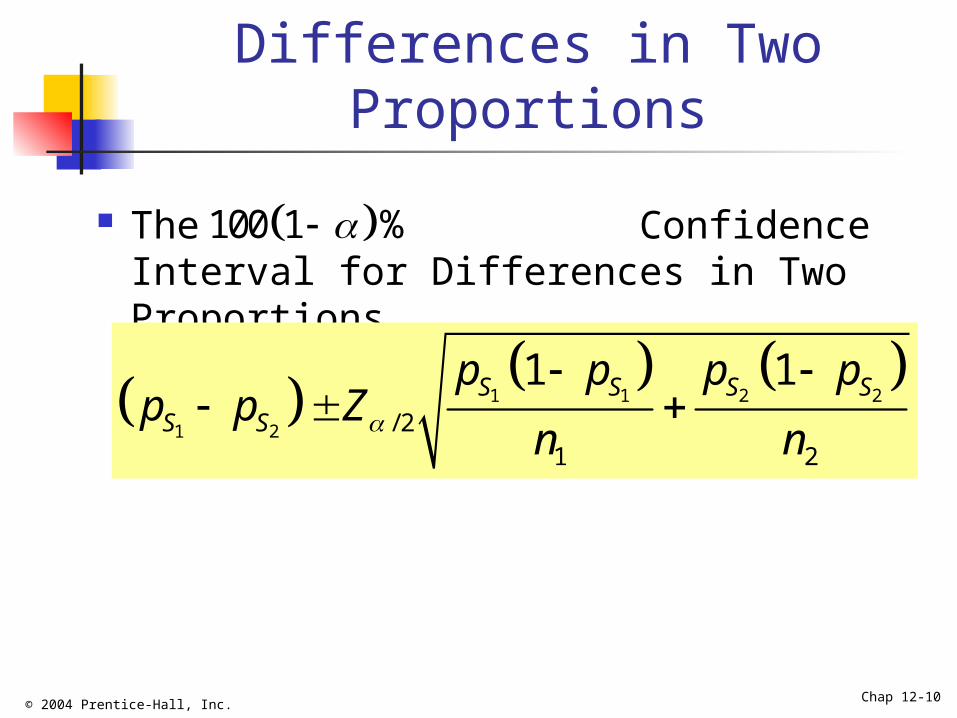
The Confidence Interval for Differences in Two Proportions
100 1 %
1 1 2 2
1 2 / 21 2
1 1S S S S
S S
p p p pp p Z
n n
© 2004 Prentice-Hall, Inc. Chap 12-11
1
2
1
2
63.808 78
7849
.598 8282
5 1 5
for both pop.
S
S
P n
P n
np n p
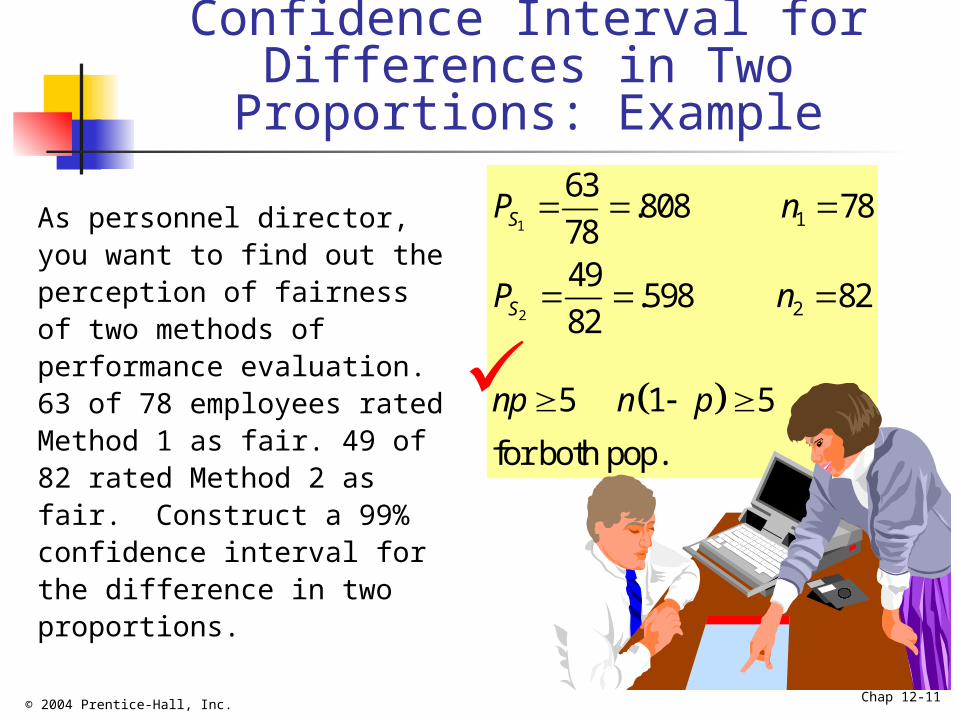
Confidence Interval for Differences in Two Proportions:
Example
As personnel director, you want to find out the perception of fairness of two methods of performance evaluation. 63 of 78 employees rated Method 1 as fair. 49 of 82 rated Method 2 as fair. Construct a 99% confidence interval for the difference in two proportions.
© 2004 Prentice-Hall, Inc. Chap 12-12
Confidence Interval for Differences in Two Proportions:
Solution
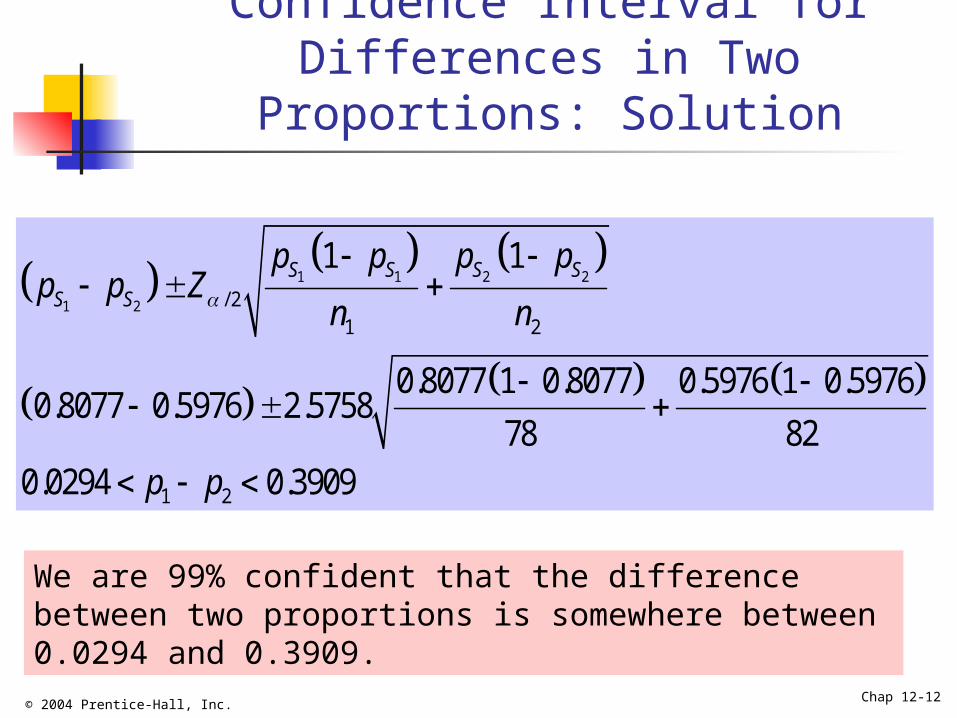
1 1 2 2
1 2 / 21 2
1 2
1 1
0.8077 1 0.8077 0.5976 1 0.59760.8077 0.5976 2.5758
78 820.0294 0.3909
S S S S
S S
p p p pp p Z
n n
p p
We are 99% confident that the difference between two proportions is somewhere between 0.0294 and 0.3909.
© 2004 Prentice-Hall, Inc. Chap 12-13
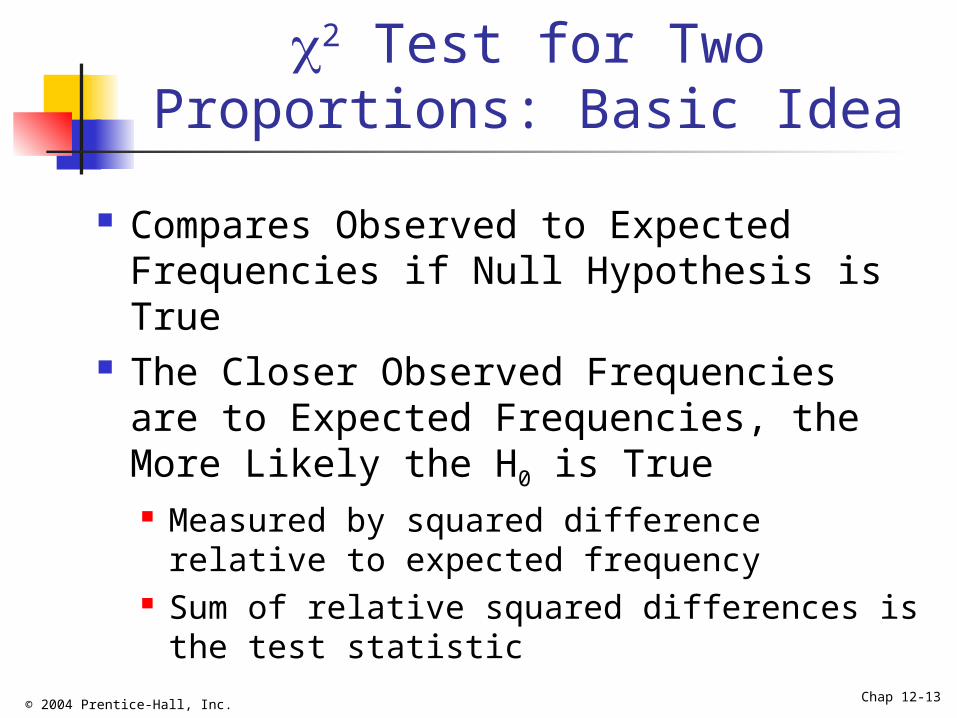
2 Test for Two Proportions: Basic Idea
Compares Observed to Expected Frequencies if Null Hypothesis is True
The Closer Observed Frequencies are to Expected Frequencies, the More Likely the H0 is True Measured by squared difference relative to
expected frequency Sum of relative squared differences is the
test statistic
© 2004 Prentice-Hall, Inc. Chap 12-14
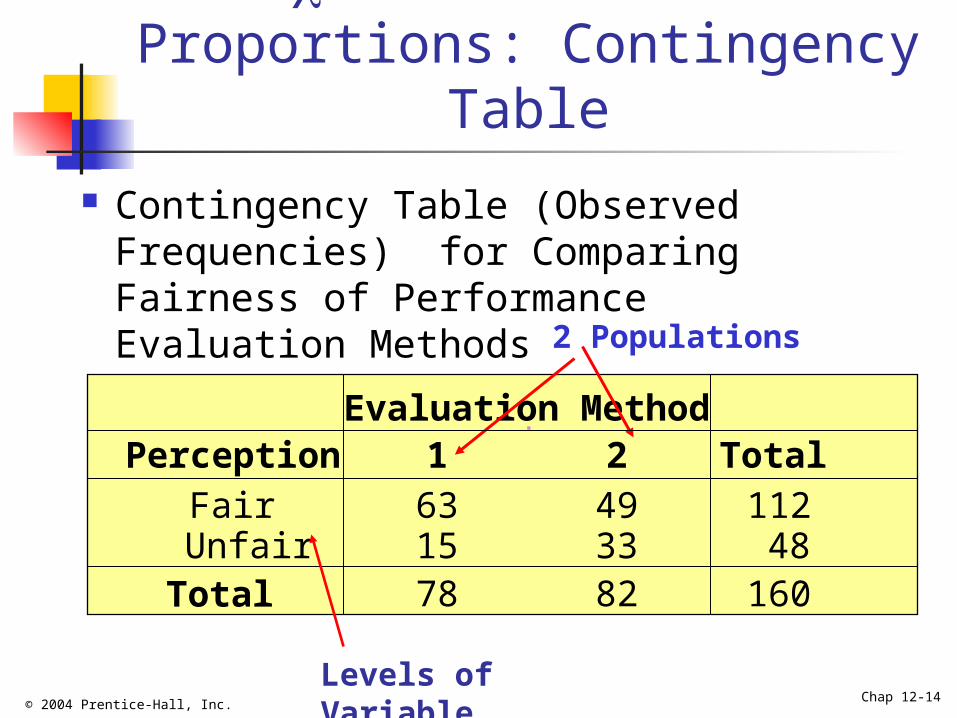
2 Test for Two Proportions: Contingency Table
Evaluation MethodPerception 1 2 Total
Fair 63 49 112Unfair 15 33 48
Total 78 82 160
Contingency Table (Observed Frequencies) for Comparing Fairness of Performance Evaluation Methods
2 Populations
Levels of Variable
© 2004 Prentice-Hall, Inc. Chap 12-15
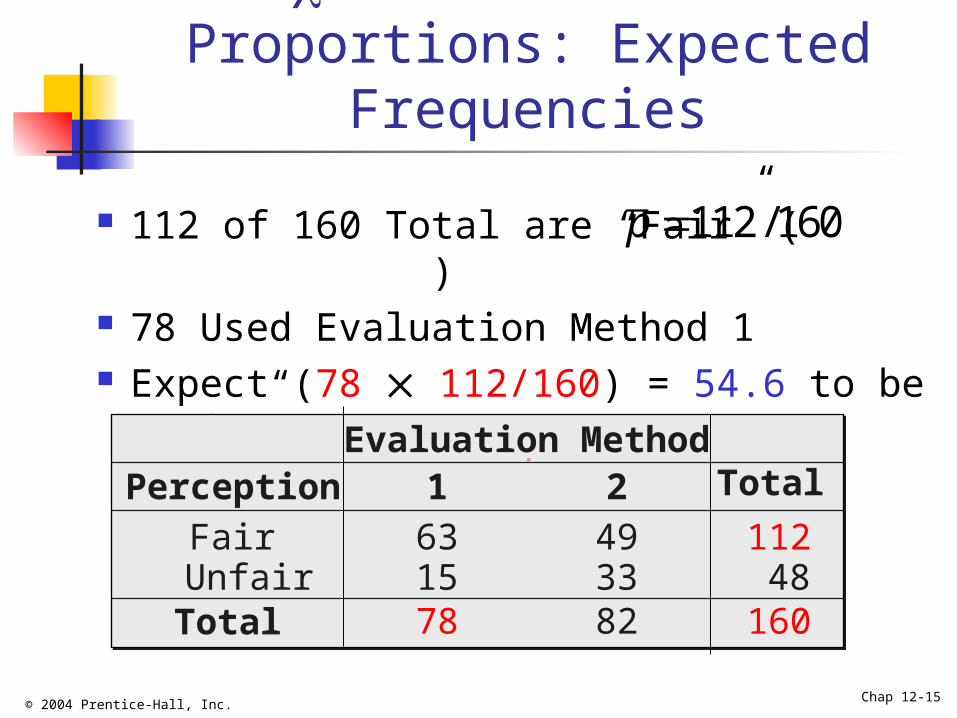
2 Test for Two Proportions: Expected Frequencies
112 of 160 Total are “Fair” ( ) 78 Used Evaluation Method 1 Expect (78 112/160) = 54.6 to be
“Fair”
112 /160p
Evaluation MethodPerception 1 2 Total
Fair 63 49 112Unfair 15 33 48
Total 78 82 160
© 2004 Prentice-Hall, Inc. Chap 12-16
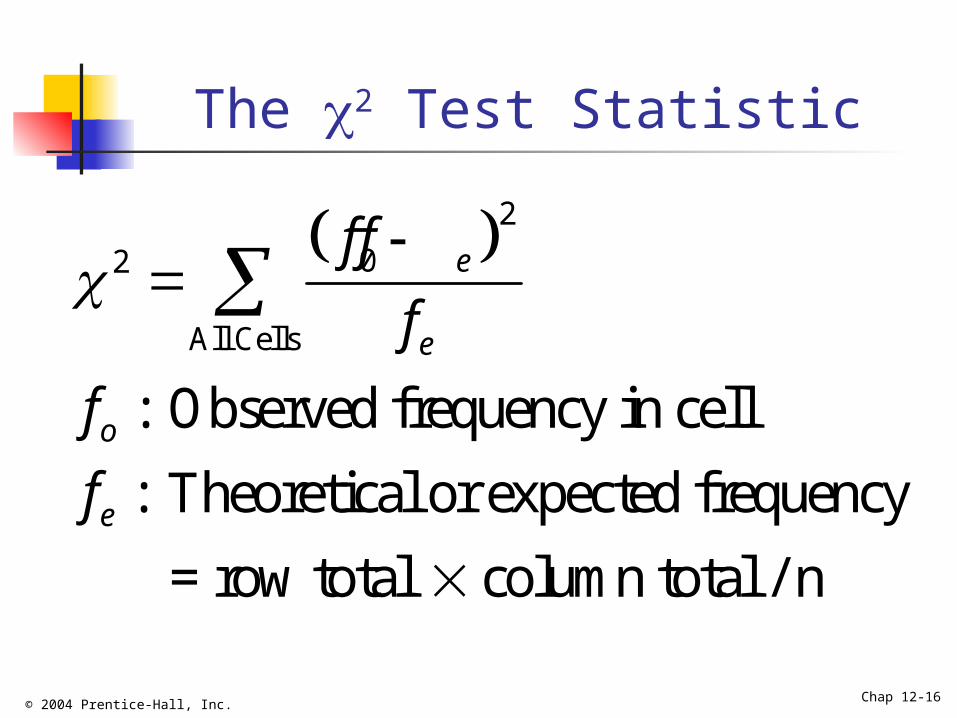
The 2 Test Statistic
2
02
All Cells
: Observed frequency in cell
: Theoretical or expected frequency
= row total column total / n
e
e
o
e
f f
f
f
f
© 2004 Prentice-Hall, Inc. Chap 12-17
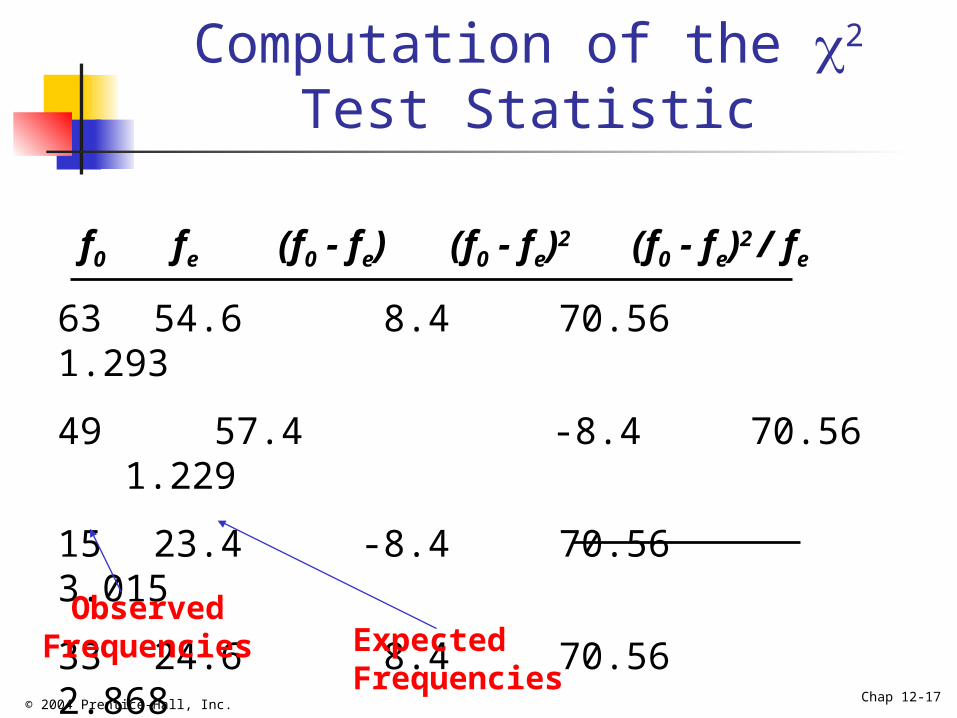
Computation of the 2
Test Statistic
f0 fe (f0 - fe) (f0 - fe)2 (f0 - fe)2 / fe
63 54.6 8.4 70.56 1.293
49 57.4 -8.4 70.56 1.229
15 23.4 -8.4 70.56 3.015
33 24.6 8.4 70.56 2.868
Sum = 8.405Observed Frequencies Expected Frequencies
© 2004 Prentice-Hall, Inc. Chap 12-18
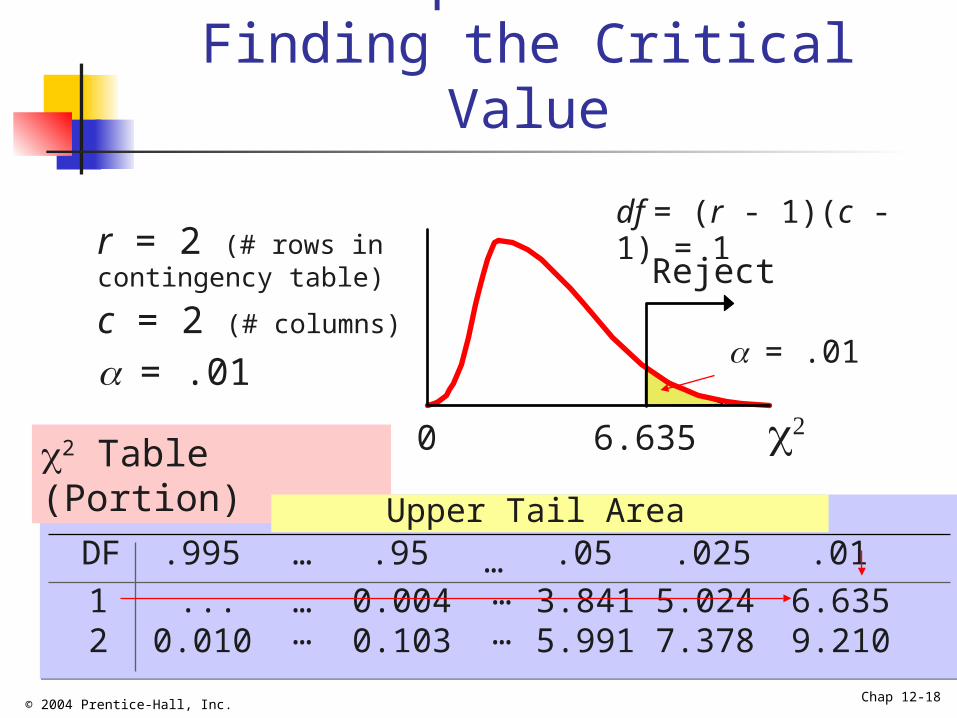
2 Test for Two Proportions:Finding the Critical Value
0 6.635
Rejectr = 2 (# rows in contingency table)
c = 2 (# columns)
= .01= .01
df = (r - 1)(c - 1) = 1
2 Table (Portion)
Upper Tail AreaDF .995 ….95
…
.051 ... …0.004 3.8412 0.010 0.103 5.991
.025 .015.0247.378
6.6359.210…
……
© 2004 Prentice-Hall, Inc. Chap 12-19
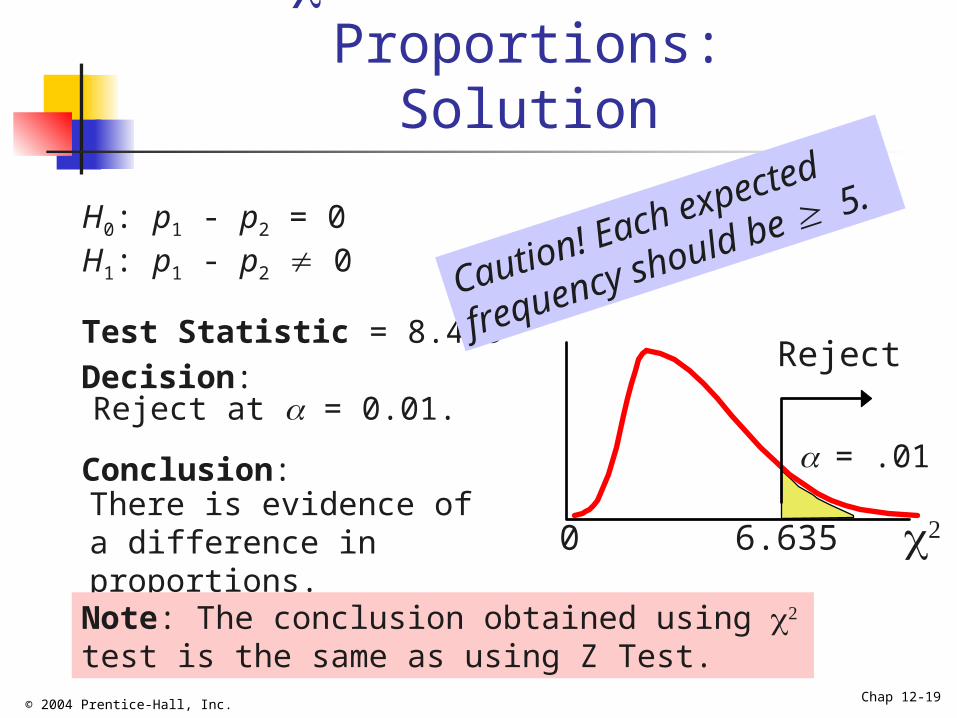
2 Test for Two Proportions:Solution
H0: p1 - p2 = 0 H1: p1 - p2 0
Test Statistic = 8.405Decision:
Conclusion:
6.635 0
Reject
= .01
Reject at = 0.01.
There is evidence of a difference in proportions.Note: The conclusion obtained using test is the same as using Z Test.
Caution! Each
expected frequency
should be 5.
© 2004 Prentice-Hall, Inc. Chap 12-20
2 Test for Two Proportionsin PHStat
PHStat | Two-Sample Tests | Chi-Square Test for Differences in Two Proportions …
Example Solution in Excel Spreadsheet
Microsoft Excel Worksheet
© 2004 Prentice-Hall, Inc. Chap 12-21
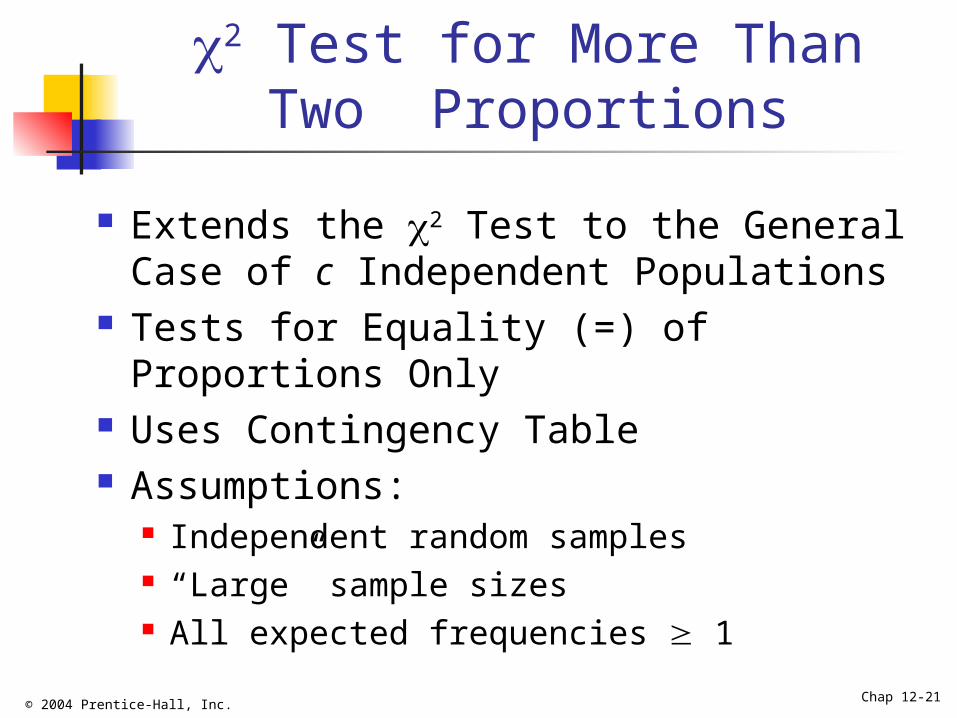
2 Test for More Than Two Proportions
Extends the 2 Test to the General Case of c Independent Populations
Tests for Equality (=) of Proportions Only
Uses Contingency Table Assumptions:
Independent random samples “Large” sample sizes All expected frequencies 1
© 2004 Prentice-Hall, Inc. Chap 12-22
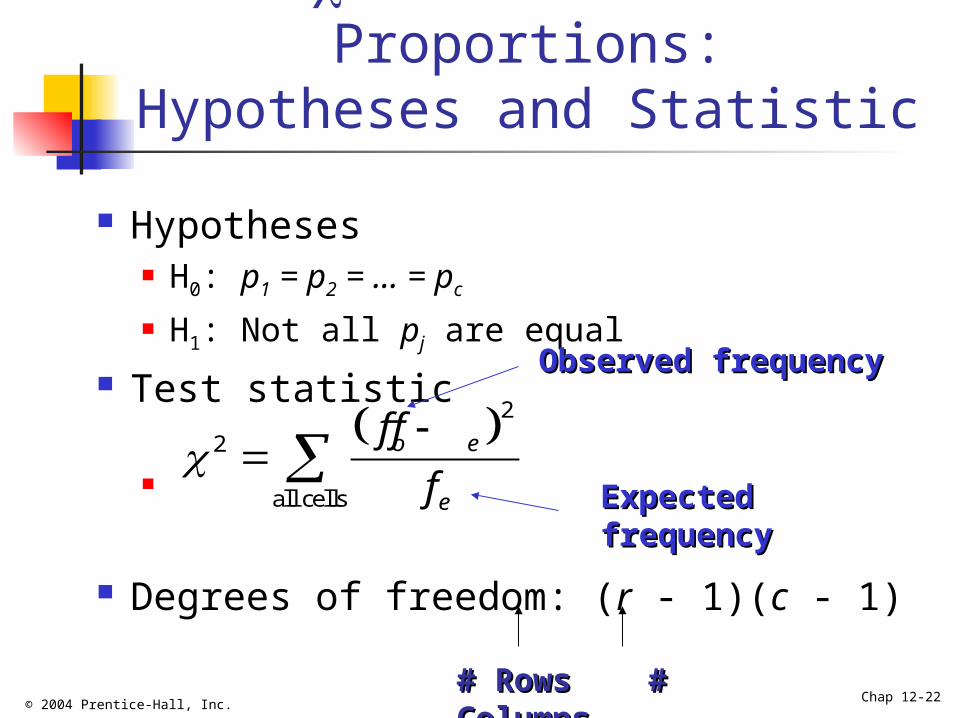
2 Test for c Proportions:Hypotheses and Statistic
Hypotheses H0: p1 = p2 = ... = pc H1: Not all pj are equal
Test statistic
Degrees of freedom: (r - 1)(c - 1)
2
2
all cells
o e
e
f f
f
Observed frequencyObserved frequency
Expected frequencyExpected frequency
# Rows # Columns# Rows # Columns
© 2004 Prentice-Hall, Inc. Chap 12-23
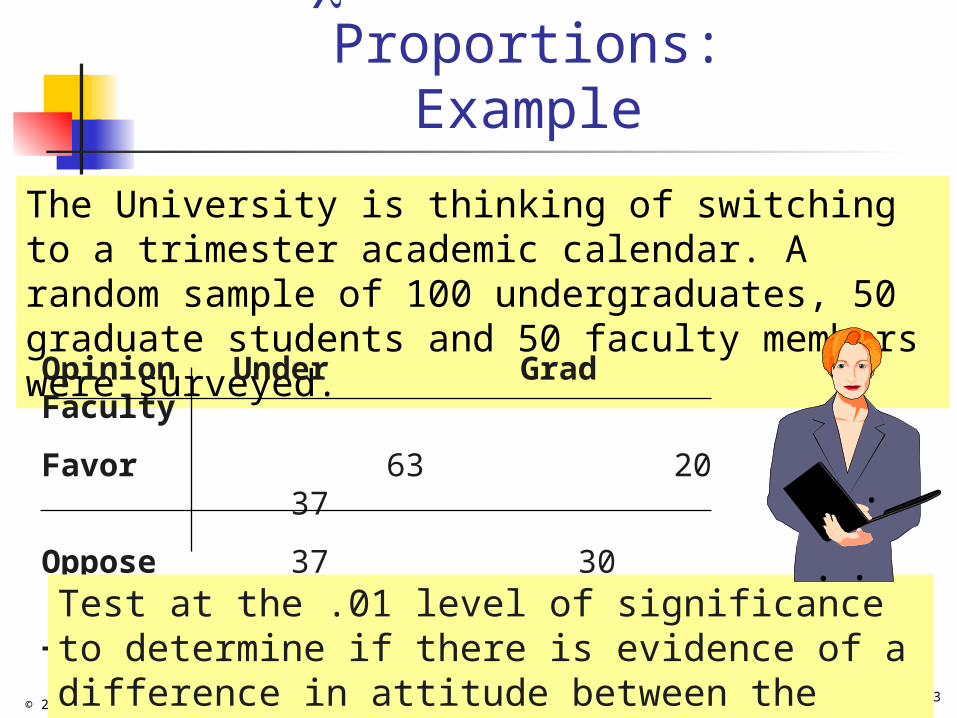
2 Test for c Proportions:Example
The University is thinking of switching to a trimester academic calendar. A random sample of 100 undergraduates, 50 graduate students and 50 faculty members were surveyed.
Opinion Under Grad Faculty
Favor 63 20 37
Oppose 37 30 13
Totals 100 50 50
Test at the .01 level of significance to determine if there is evidence of a difference in attitude between the groups.
© 2004 Prentice-Hall, Inc. Chap 12-24
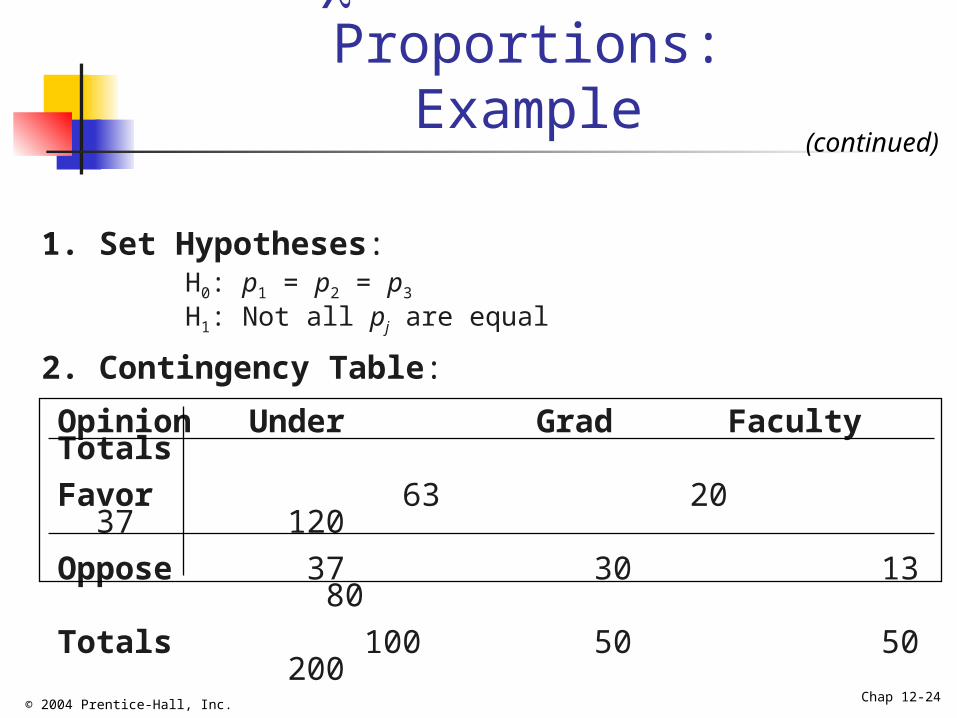
2 Test for c Proportions:Example
(continued)
1. Set Hypotheses:H0: p1 = p2 = p3 H1: Not all pj are equal
2. Contingency Table:
Opinion Under Grad Faculty Totals
Favor 63 20 37 120
Oppose 37 30 13 80
Totals 100 50 50 200

© 2004 Prentice-Hall, Inc. Chap 12-25
2 Test for c Proportions:Example
(continued)
Opinion Under Grad Faculty Totals
Favor 60 30 30 120
Oppose 40 20 20 80
Totals 100 50 50 200
3. Compute Expected Frequencies
(100)(120)/200=60(50)(80)/200=20
All expected frequencies are large.
© 2004 Prentice-Hall, Inc. Chap 12-26
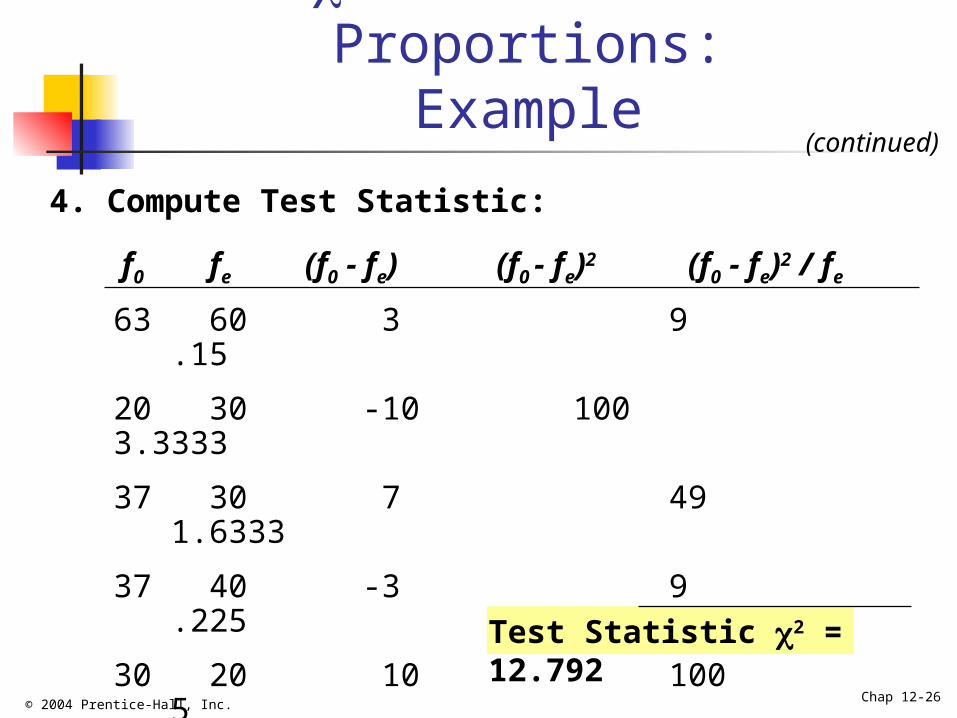
2 Test for c Proportions:Example
(continued)
4. Compute Test Statistic:
f0 fe (f0 - fe) (f0 - fe)2 (f0 - fe)2 / fe
63 60 3 9 .15
20 30 -10 100 3.3333
37 30 7 49 1.6333
37 40 -3 9 .225
30 20 10 100 5
13 20 -7 49 2.45Test Statistic 2 = 12.792
© 2004 Prentice-Hall, Inc. Chap 12-27
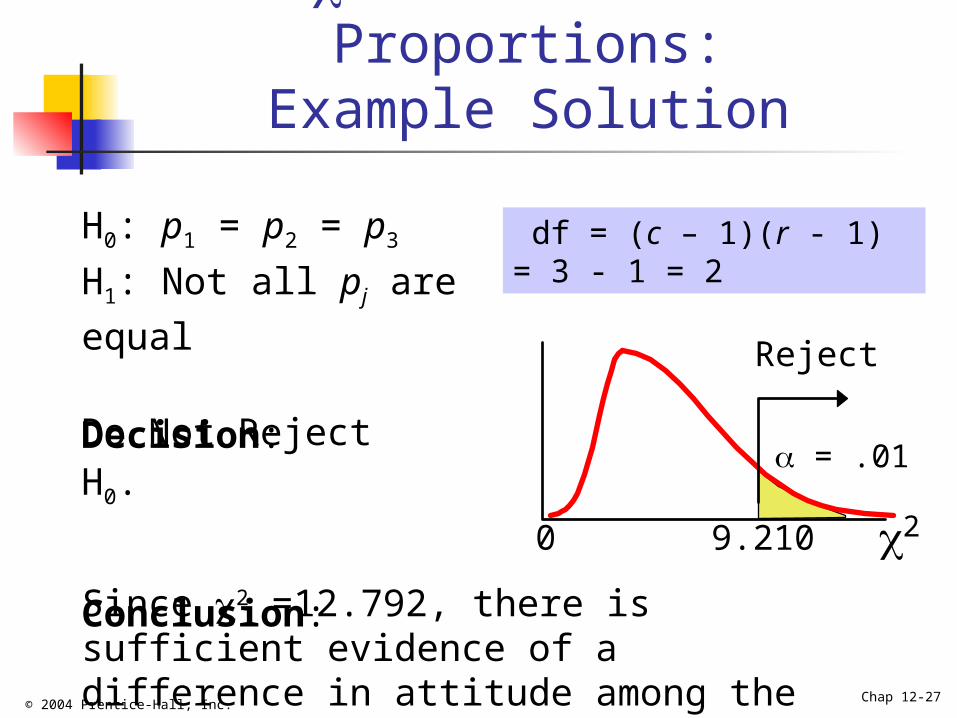
2 Test for c Proportions:Example Solution
H0: p1 = p2 = p3
H1: Not all pj are equal
Decision:
Conclusion:
df = (c – 1)(r - 1) = 3 - 1 = 2
Reject
= .01
20 9.210
Do Not Reject H0.
Since 2 =12.792, there is sufficient evidence of a difference in attitude among the groups.
© 2004 Prentice-Hall, Inc. Chap 12-28
2 Test for c Proportionsin PHStat
PHStat | c-Sample Tests | Chi-Square Test …
Example Solution in Excel Spreadsheet
Microsoft Excel Worksheet
© 2004 Prentice-Hall, Inc. Chap 12-29
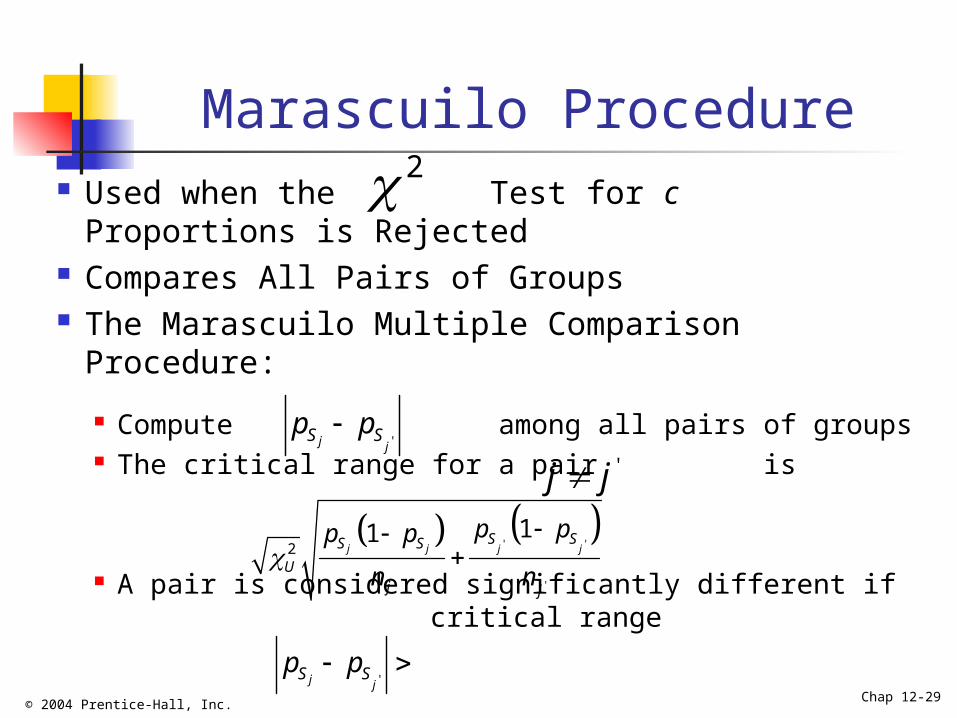
Marascuilo Procedure Used when the Test for c Proportions is
Rejected Compares All Pairs of Groups The Marascuilo Multiple Comparison
Procedure:
Compute among all pairs of groups The critical range for a pair is
A pair is considered significantly different if critical range
'j jS Sp p
'j j
' '
'
211
j j j jS SS S
Uj j
p pp p
n n
'j jS Sp p
2

© 2004 Prentice-Hall, Inc. Chap 12-30
Marascuilo Procedure :Example
The University is thinking of switching to a trimester academic calendar. A random sample of 100 undergraduates, 50 graduate students and 50 faculty members were surveyed.
Opinion Under Grad Faculty
Favor 63 20 37
Oppose 37 30 13
Totals 100 50 50
Using a 1% level of significance, which groups have a different attitude?
© 2004 Prentice-Hall, Inc. Chap 12-31
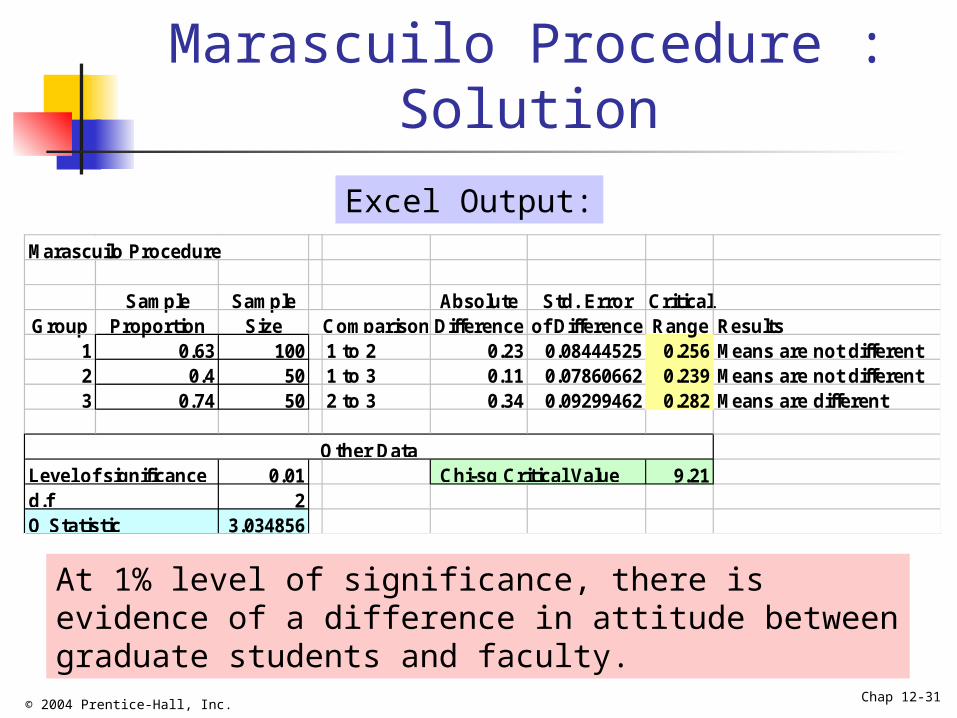
Marascuilo Procedure :Solution
Marascuilo Procedure
Sample Sample Absolute Std. Error CriticalGroup Proportion Size Comparison Difference of Difference Range Results
1 0.63 100 1 to 2 0.23 0.08444525 0.256 Means are not different2 0.4 50 1 to 3 0.11 0.07860662 0.239 Means are not different3 0.74 50 2 to 3 0.34 0.09299462 0.282 Means are different
0.01 9.212
3.034856
Chi-sq Critical ValueOther Data
d.fQ Statistic
Level of significance
At 1% level of significance, there is evidence of a difference in attitude between graduate students and faculty.
Excel Output:

© 2004 Prentice-Hall, Inc. Chap 12-32
2 Test of Independence
Shows If a Relationship Exists between 2 Factors of Interest One sample drawn Each factor has 2 or more levels of responses Does not show nature of relationship Does not show causality
Similar to Testing p1 = p2 = … = pc
Used Widely in Marketing Uses Contingency Table
© 2004 Prentice-Hall, Inc. Chap 12-33
2 Test of Independence:Example
A survey was conducted to determine whether there is a relationship between architectural style (Split-Level or Ranch) and geographical location (Urban or Rural).
Given the survey data, test at the = .01 level to determine whether there is a relationship between location and architectural style.
© 2004 Prentice-Hall, Inc. Chap 12-34
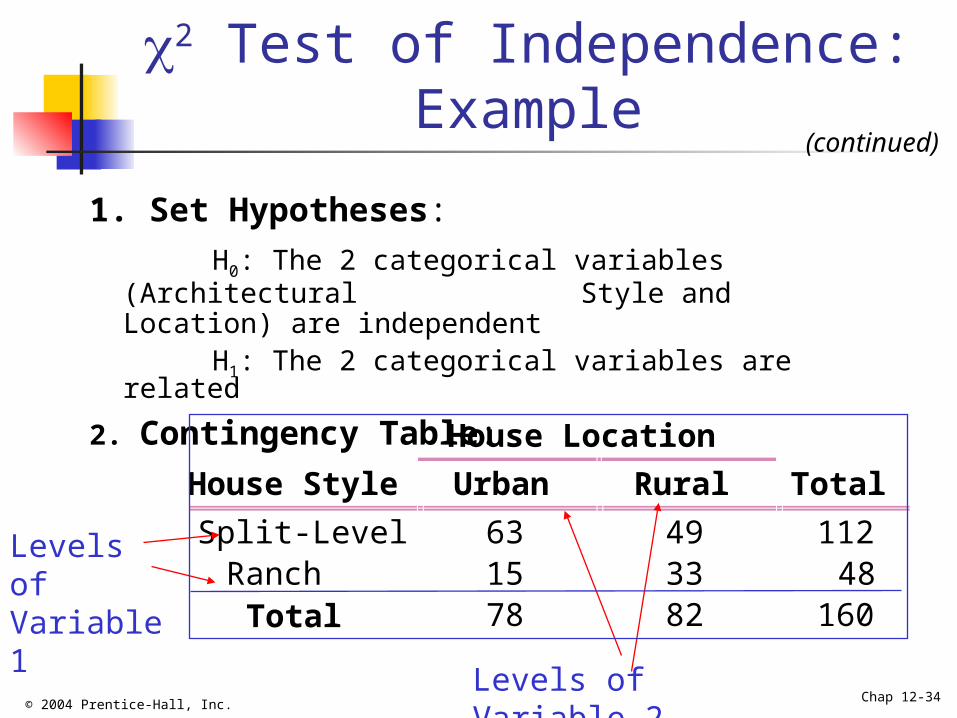
House Location
House Style Urban Rural Total
Split-Level 63 49 112Ranch 15 33 48
Total 78 82 160
2 Test of Independence:Example
1. Set Hypotheses:
H0: The 2 categorical variables (Architectural Style and Location) are independent
H1: The 2 categorical variables are related
2. Contingency Table:
Levels of Variable 2
Levels of Variable 1
(continued)
© 2004 Prentice-Hall, Inc. Chap 12-35
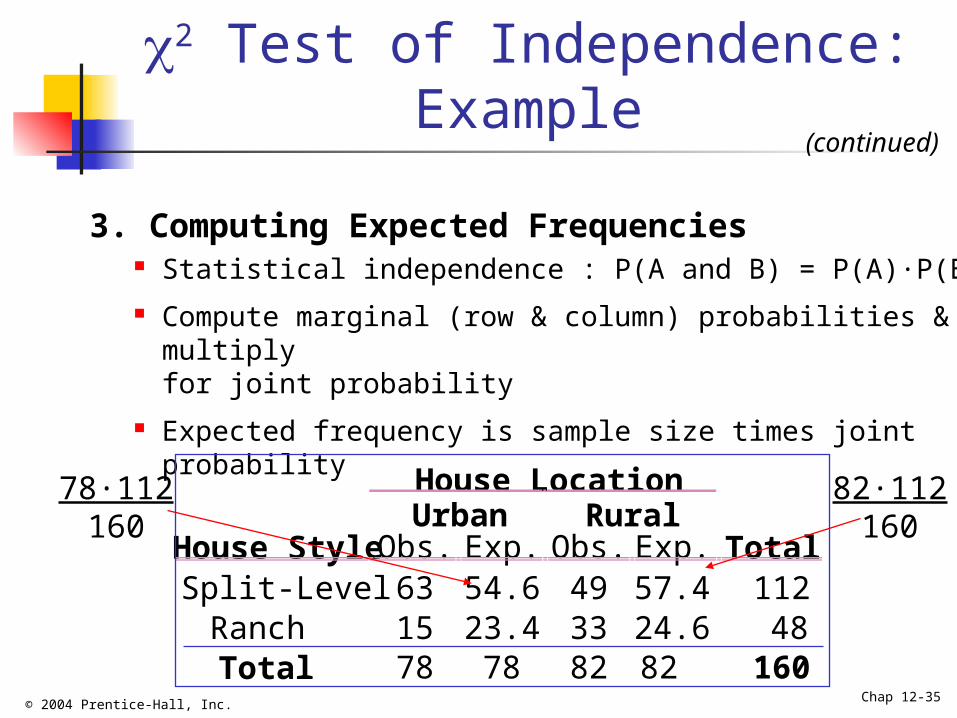
2 Test of Independence:Example
(continued)
3. Computing Expected Frequencies Statistical independence : P(A and B) = P(A)·P(B) Compute marginal (row & column) probabilities & multiply
for joint probability Expected frequency is sample size times joint probability
House LocationUrban Rural
House Style Obs. Exp. Obs. Exp. TotalSplit-Level 63 54.6 49 57.4 112Ranch 15 23.4 33 24.6 48
Total 78 78 82 82 160
78·112160
82·112160
© 2004 Prentice-Hall, Inc. Chap 12-36
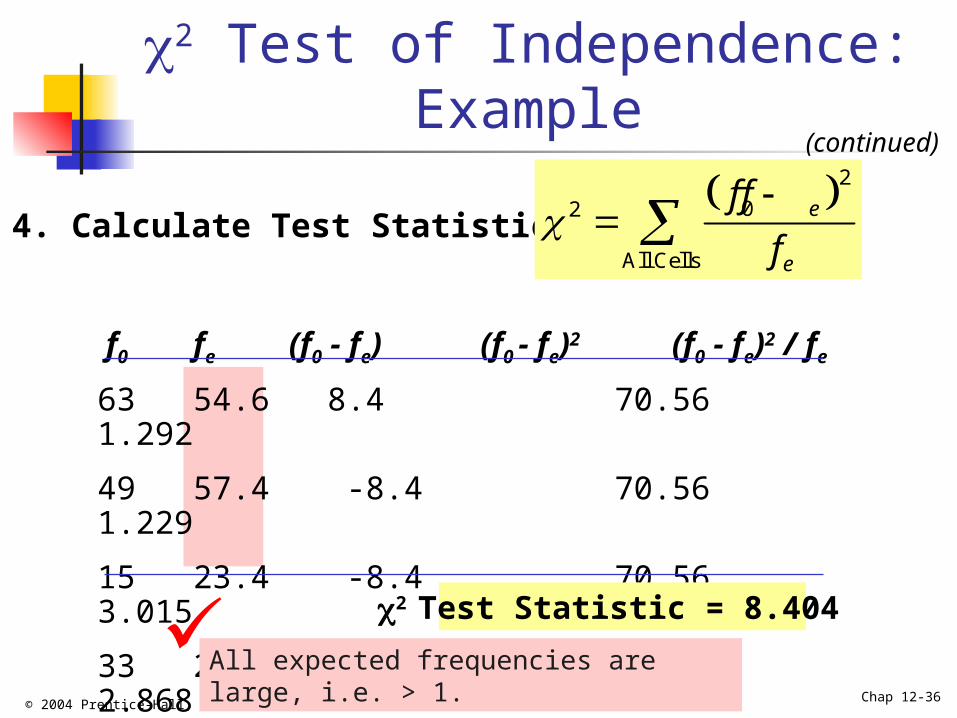
f0 fe (f0 - fe) (f0 - fe)2 (f0 - fe)2 / fe
63 54.6 8.4 70.56 1.292
49 57.4 -8.4 70.56 1.229
15 23.4 -8.4 70.56 3.015
33 24.6 8.4 70.56 2.868
8.404
2 Test of Independence:Example
(continued)
4. Calculate Test Statistic: 2
02
All Cells
e
e
f f
f
2 Test Statistic = 8.404 All expected frequencies are large, i.e. > 1.
© 2004 Prentice-Hall, Inc. Chap 12-37
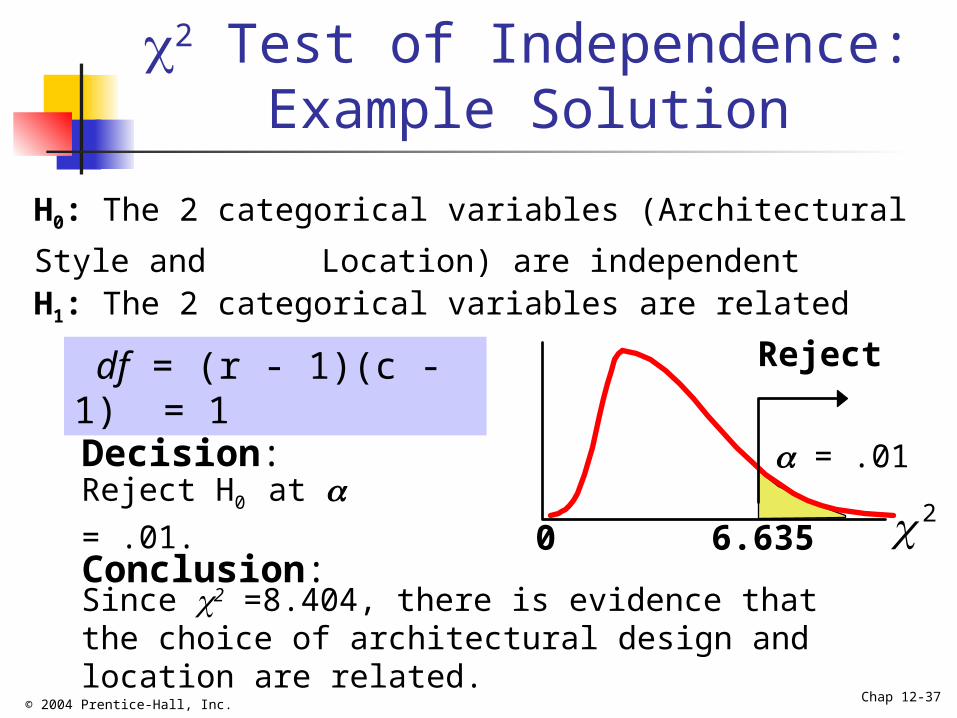
2 Test of Independence:Example Solution
H0: The 2 categorical variables (Architectural Style and
Location) are independent H1: The 2 categorical variables are related
Decision:
Conclusion:
df = (r - 1)(c - 1) = 1 Reject
= .01
0 6.635
Reject H0 at = .01.
Since 2 =8.404, there is evidence that the choice of architectural design and location are related.
2
© 2004 Prentice-Hall, Inc. Chap 12-38
2 Test of Independencein PHStat
PHStat | c-Sample Tests | Chi-Square Test …
Example Solution in Excel Spreadsheet
Microsoft Excel Worksheet
© 2004 Prentice-Hall, Inc. Chap 12-39
Chapter Summary
Performed Z Test for Differences in Two Proportions (Independent Samples)
Discussed Test for Differences in Two Proportions (Independent Samples)
Addressed 2 Test for Differences in More Than Two Proportions (Independent Samples)
Illustrated Marascuilo Procedure Described 2 Test of Independence