Embed Size (px)
Citation preview
SHAREHOLDERSDEAR
1
Pogo’s first quarter was, in many ways, the most productive and rewarding
in its 34-year history. Pogo produced more crude oil and natural gas than in
any previous calendar quarter. In so doing, Pogo generated more free cash to
pay for the new projects underway and on the drawing board, and retired
a significant portion of its outstanding debt as well.
Pogo’s recent drilling success has caused it to stand out from its peers.
Without any meaningful 2002 property acquisitions, Pogo’s equivalent oil
and gas production rates jumped 38%. First quarter 2003 production levels
are up another 20% from the full year of 2002, and 30% from the
comparable 2002 first quarter.
Pogo’s first quarter 2003 liquids production, including crude oil, condensate
and plant products, topped 60,000 barrels per day for the first time ever,
totaling 67,602 barrels per day. That number is up from the 2002 average of
51,840 barrels per day.
Natural gas production last year averaged 279 million cubic feet per day
(mmcf/d). First quarter 2003 natural gas production surpassed 300 mmcf/d
for the first time ever, totaling 304.8 mmcf/d. When measured on an energy
equivalent basis, Pogo produced 118,394 equivalent barrels per day in the
quarter just ended.
Pogo is off to a very good start in 2003. Our production targets were reached
at Main Pass Blocks 61/62 field a bit ahead of schedule. Stabilized production
from our fine Mississippi Canyon Blocks 661/705 field also arrived early.
2
POG
O P
RO
DU
CIN
G C
OM
PAN
Y
3
Pogo’s biggest first quarter production jump, however, came in the
Gulf of Thailand. We must always allow for regular mechanical downtime on
those large offshore facilities; however, during the first quarter, downtime
simply did not occur. Moreover, natural gas nominations by the Petroleum
Authority of Thailand (PTT) were unusually high. Higher gas deliveries, in
turn, resulted in higher production of associated liquid hydrocarbons.
High companywide production combined with lofty energy prices yielded a
very good first quarter. Pogo reported net income of over $88 million, or $1.45
per share, on revenues of over $310 million. Those numbers reflect large
increases compared to the first quarter of last year when Pogo recorded just
over $9 million of net income, or $0.17 per share, on revenues of just under
$143 million. Pogo’s free cash flow allowed us to continue to fund an active
drilling program and still retire a very significant amount of outstanding debt.
Pogo’s gross debt at year-end 2002 stood at $725 million. It was reduced
during the last 90 days by $135 million, to end the first quarter at $590 million.
Pogo’s net debt is another $150 million lower yet.
THAILAND
Pogo scored ten out of ten in first quarter wells drilled in the Gulf of
Thailand. During much of the quarter, only the GlobalSantaFe
"Compact Driller" rig was busy on our license, but the "Ensco 50" has now
returned, setting up a two rig second quarter. Nine of the ten first quarter
Thailand wells were developmental in nature, expanding the capacity of
Tantawan platforms "A" and "B." Remember, those platforms began producing
back in 1997. Yet, based on reservoir pressures, untapped pay sands were
encountered in each of the nine wells. The lone Thailand exploration well
drilled during the quarter was the Benchamas No. 27, and it was a good one,
discovering a structure containing 210 feet of net oil and gas pay, enough
to justify locating a future Benchamas field production platform in that
vicinity. When ordered, built and placed, that new Benchamas platform would
be placed very near Jarmjuree field’s northern boundary.
At least 16 development wells, all in Benchamas field and six exploration
wildcats located all across Block B8/32 are planned for second quarter
drilling. Meanwhile, the next eight platforms are already in the works,
promising continued future growth in the Gulf of Thailand.
THE GULF OF MEXICO
In the Gulf of Mexico, Pogo and its partners drilled an exploratory discovery
well at Chandeleur Sound Block 69, No. 1, encountering 40 feet of new natural
gas pay. It will be followed shortly by another exploration well, the
Chandeleur Sound Block 70, No. 1. Chandeleur Sound should begin producing
in the third quarter and the natural gas will be transported to Pogo’s nearby
facilities at Main Pass Block 10.
Pogo’s 100%-owned Main Pass Blocks 61/62 field well B-5 was a fine first
quarter success, expanding the uphole BA4AA sand lobe in the southern part
of Block 62. The new well is already on stream and is producing at a rate of
3,000 barrels per day.
ONSHORE OPERATIONS
In the Permian Basin, 28 wells were drilled, with 27 of them completed as
producers in the first quarter, and another 13 wells were being drilled as
the quarter ended. Drilling included 17 lower ownership Aldwell Spraberry

4
POG
O P
RO
DU
CIN
G C
OM
PAN
Y
5
to be on track. We are moving along smoothly in bidding and selecting drillers
and service providers for each of the planned wells. Our geoscientists are
refining their locations for the first six prospects. We will keep you posted as
we begin drilling.
Pogo had a very fine first quarter, busy with good results, and the second
quarter promises to be busier still.
Faithfully,
PAUL G. VAN WAGENEN
Chairman, President and
Chief Executive Officer
field wells. Among the larger-interest first quarter Permian Basin wells,
several were notable including the Pecos 33 Federal, No. 2, in Eddy County,
New Mexico. Pogo owns two-thirds of it. It tested at over 10 mmcf/d from the
Morrow, but we have decided to be safe, not greedy, and produce it at a
steady 5 mmcf/d. That success has set up two or three other wells, including
the Pecos 32 State, No. 1.
Our most recent Neff field well, the Livingston Ridge 19, No. 1, which is
100%-owned by Pogo, was drilled in the first quarter and is now producing
430 barrels and .3 mmcf/d. Two other wells have been drilled in this same
trend, and are awaiting completion units.
In the Gulf Coast onshore region, Pogo was eight out of eight with four wells
still drilling as the quarter ended. Four of the natural gas successes were in
Pogo’s 67%-owned Los Mogotes field. The other four include a 100%-owned
South Hundido field well, the Benevides Trust, No. 2, which is producing at
2.6 mmcf/d. Also notable, was the 65%-owned Mujeres Creek Winch No. 20
well, now producing 3.5 mmcf/d.
At Madden field in the Wind River Basin of central Wyoming, where Pogo
owns about 11%, the five mile deep Bighorn 9-4 well finished drilling in March
and is now being completed. It logged 240 feet of natural gas pay. Elsewhere
at Madden field, seven shallow Lower Fort Union formation wells were
successfully drilled during the first quarter.
EUROPEAN OPERATIONS
In Hungary, we are seeing nothing but green lights ahead relative to a third
quarter start for our drilling program.The regulatory compliance process seems
6
POG
O P
RO
DU
CIN
G C
OM
PAN
Y
7
Revenues:Oil and gas
Other
Total
Operating Costs and Expenses:Lease operating
General and administrative
Exploration
Dry hole and impairment
Depreciation, depletion and amortization
Production and other taxes
Accretion and other
Total
Operating Income
Interest:Charges
Income
Capitalized
Minority Interest:Dividends and costs associated with preferred securities of a subsidiary trust
Foreign Currency Transaction GainIncome Before Taxes and Cumulative Effect of Change in
Accounting PrincipleIncome Tax ExpenseIncome Before Cumulative Effect of Change in Accounting PrincipleCumulative Effect of Change in Accounting PrincipleNet Income
Earnings Per Common ShareBasic
Income before cumulative effect of change in accounting principleCumulative effect of change in accounting principleNet income
Diluted
Income before cumulative effect of change in accounting principle
Cumulative effect of change in accounting principle
Net income
Dividends Per Common Share
Weighted Average Number of Common Sharesand Potential Common Shares Outstanding:
Basic
Diluted
See accompanying notes to consolidated financial statements.
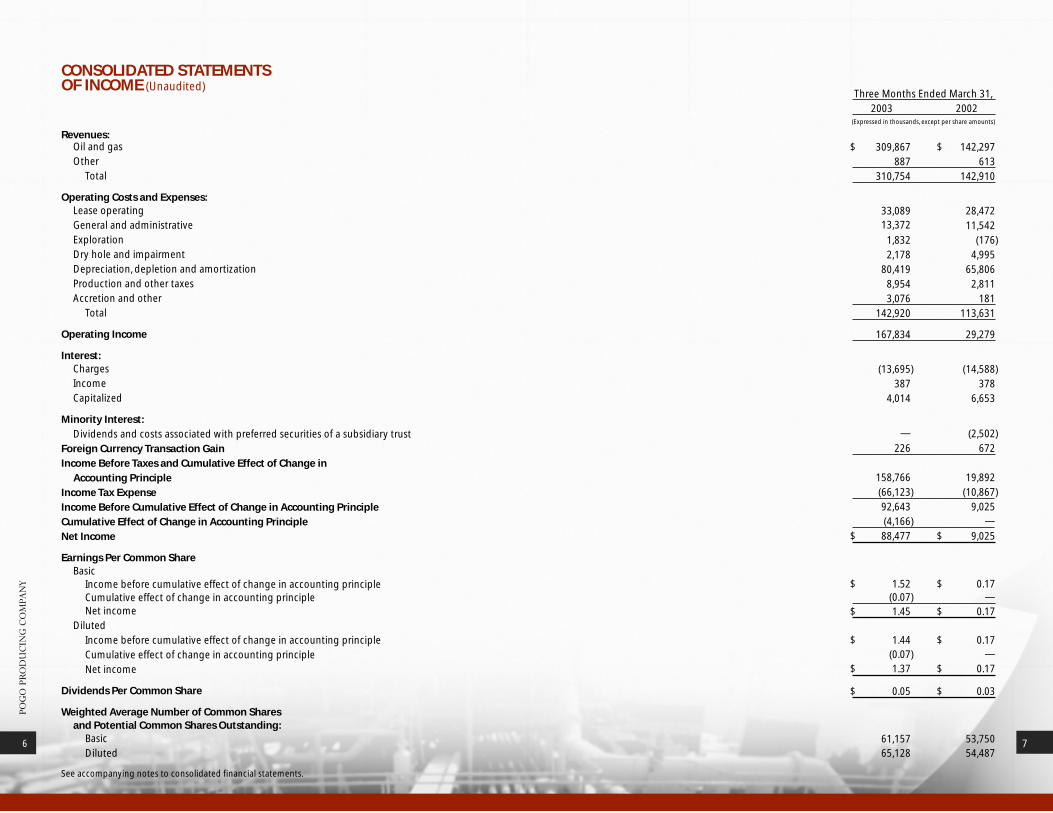
Three Months Ended March 31,
2003 2002(Expressed in thousands, except per share amounts)
$ 309,867 $ 142,297
887 613
310,754 142,910
33,089 28,472 13,372 11,542
1,832 (176)
2,178 4,995
80,419 65,806
8,954 2,811
3,076 181
142,920 113,631
167,834 29,279
(13,695) (14,588)
387 378
4,014 6,653
— (2,502)
226 672
158,766 19,892
(66,123) (10,867)
92,643 9,025
(4,166) —
$ 88,477 $ 9,025
$ 1.52 $ 0.17(0.07) —
$ 1.45 $ 0.17
$ 1.44 $ 0.17 (0.07) —
$ 1.37 $ 0.17
$ 0.05 $ 0.03
61,157 53,75065,128 54,487
CONSOLIDATED STATEMENTS OF INCOME (Unaudited)
8
POG
O P
RO
DU
CIN
G C
OM
PAN
Y
9
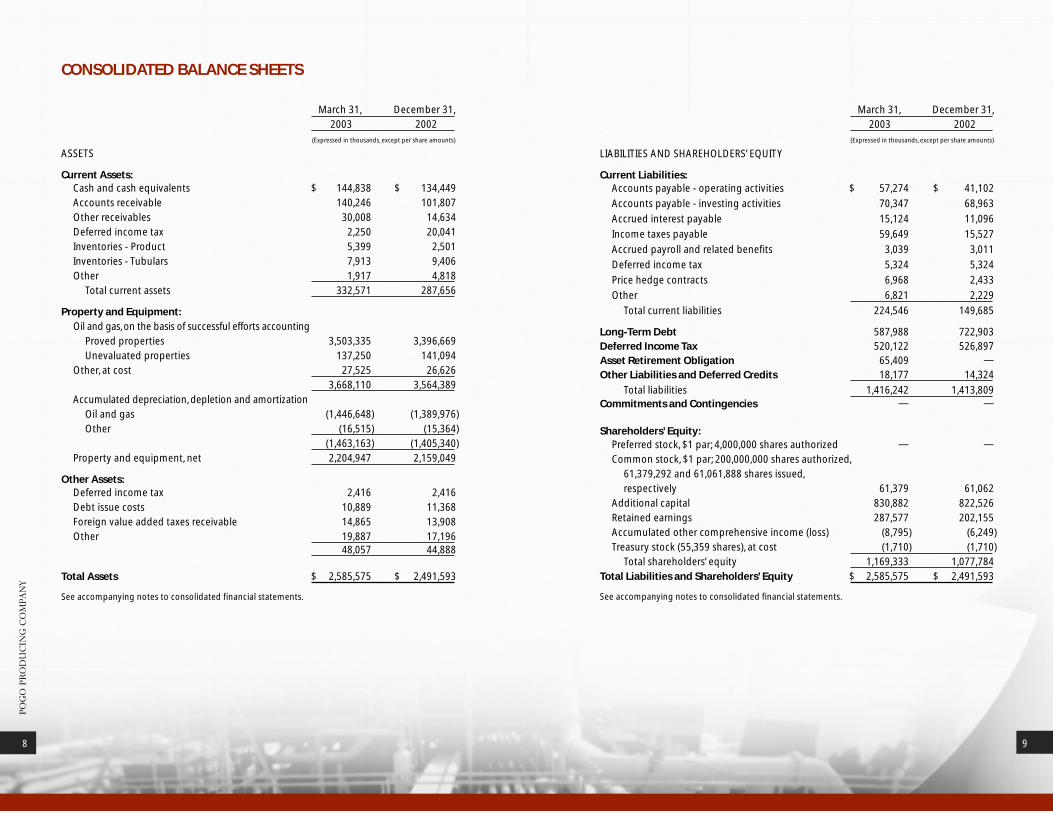
CONSOLIDATED BALANCE SHEETS
March 31, December 31,
2003 2002
(Expressed in thousands, except per share amounts)
ASSETS
Current Assets:Cash and cash equivalents $ 144,838 $ 134,449
Accounts receivable 140,246 101,807
Other receivables 30,008 14,634
Deferred income tax 2,250 20,041
Inventories - Product 5,399 2,501
Inventories - Tubulars 7,913 9,406
Other 1,917 4,818
Total current assets 332,571 287,656
Property and Equipment:Oil and gas, on the basis of successful efforts accounting
Proved properties 3,503,335 3,396,669
Unevaluated properties 137,250 141,094
Other, at cost 27,525 26,626
3,668,110 3,564,389
Accumulated depreciation, depletion and amortization
Oil and gas (1,446,648) (1,389,976)
Other (16,515) (15,364)
(1,463,163) (1,405,340)
Property and equipment, net 2,204,947 2,159,049
Other Assets:Deferred income tax 2,416 2,416
Debt issue costs 10,889 11,368
Foreign value added taxes receivable 14,865 13,908
Other 19,887 17,196 48,057 44,888
Total Assets $ 2,585,575 $ 2,491,593
See accompanying notes to consolidated financial statements.
March 31, December 31,
2003 2002
(Expressed in thousands, except per share amounts)
LIABILITIES AND SHAREHOLDERS’ EQUITY
Current Liabilities:Accounts payable - operating activities $ 57,274 $ 41,102
Accounts payable - investing activities 70,347 68,963
Accrued interest payable 15,124 11,096
Income taxes payable 59,649 15,527
Accrued payroll and related benefits 3,039 3,011
Deferred income tax 5,324 5,324
Price hedge contracts 6,968 2,433
Other 6,821 2,229
Total current liabilities 224,546 149,685
Long-Term Debt 587,988 722,903 Deferred Income Tax 520,122 526,897 Asset Retirement Obligation 65,409 —
Other Liabilities and Deferred Credits 18,177 14,324
Total liabilities 1,416,242 1,413,809 Commitments and Contingencies — —
Shareholders’ Equity:Preferred stock, $1 par; 4,000,000 shares authorized — —
Common stock, $1 par; 200,000,000 shares authorized,
61,379,292 and 61,061,888 shares issued,
respectively 61,379 61,062
Additional capital 830,882 822,526
Retained earnings 287,577 202,155
Accumulated other comprehensive income (loss) (8,795) (6,249)
Treasury stock (55,359 shares), at cost (1,710) (1,710)
Total shareholders’ equity 1,169,333 1,077,784
Total Liabilities and Shareholders’ Equity $ 2,585,575 $ 2,491,593
See accompanying notes to consolidated financial statements.
10
POG
O P
RO
DU
CIN
G C
OM
PAN
Y
11
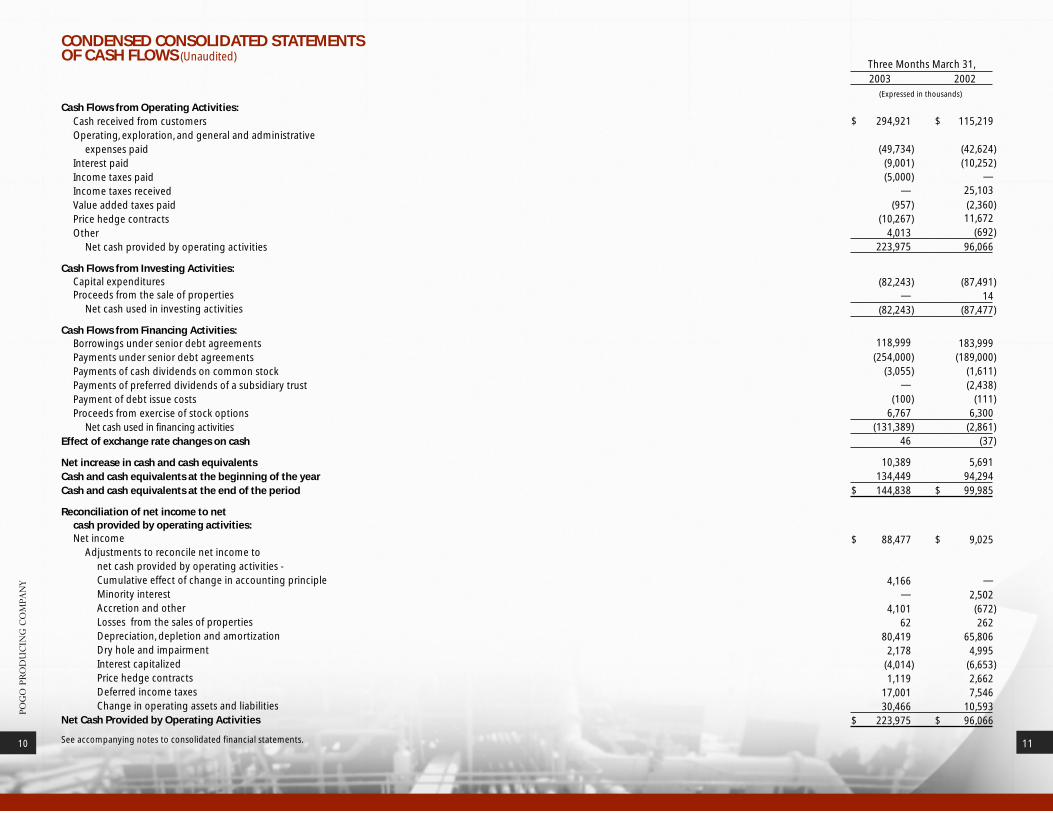
CONDENSED CONSOLIDATED STATEMENTS OF CASH FLOWS (Unaudited)
Cash Flows from Operating Activities:Cash received from customers Operating, exploration, and general and administrative
expenses paidInterest paidIncome taxes paidIncome taxes receivedValue added taxes paidPrice hedge contractsOther
Net cash provided by operating activities
Cash Flows from Investing Activities:Capital expendituresProceeds from the sale of properties
Net cash used in investing activities
Cash Flows from Financing Activities:Borrowings under senior debt agreementsPayments under senior debt agreementsPayments of cash dividends on common stockPayments of preferred dividends of a subsidiary trustPayment of debt issue costs Proceeds from exercise of stock options
Net cash used in financing activitiesEffect of exchange rate changes on cash
Net increase in cash and cash equivalentsCash and cash equivalents at the beginning of the yearCash and cash equivalents at the end of the period
Reconciliation of net income to net cash provided by operating activities:Net income
Adjustments to reconcile net income to net cash provided by operating activities - Cumulative effect of change in accounting principle Minority interestAccretion and other Losses from the sales of propertiesDepreciation, depletion and amortizationDry hole and impairment Interest capitalizedPrice hedge contractsDeferred income taxesChange in operating assets and liabilities
Net Cash Provided by Operating Activities
See accompanying notes to consolidated financial statements.
Three Months March 31,
2003 2002(Expressed in thousands)
$ 294,921 $ 115,219
(49,734) (42,624)(9,001) (10,252)(5,000) —
— 25,103
(957) (2,360) (10,267) 11,672
4,013 (692)
223,975 96,066
(82,243) (87,491)— 14
(82,243) (87,477)
118,999 183,999 (254,000) (189,000)
(3,055) (1,611)— (2,438)
(100) (111)6,767 6,300
(131,389) (2,861)46 (37)
10,389 5,691 134,449 94,294
$ 144,838 $ 99,985
$ 88,477 $ 9,025
4,166 —— 2,502
4,101 (672)62 262
80,419 65,806 2,178 4,995
(4,014) (6,653) 1,119 2,662
17,001 7,546 30,466 10,593
$ 223,975 $ 96,066
12
POG
O P
RO
DU
CIN
G C
OM
PAN
Y
CORPORATE ADDRESS
Pogo Producing Company
5 Greenway Plaza, Suite 2700
P.O. Box 2504
Houston, Texas 77252-2504
(713) 297-5000
www.pogoproducing.com
WESTERN DIVISION
300 North Marienfeld, Suite 600
P.O. Box 10340
Midland, Texas 79702-7340
(915) 685-8100
THAIPO LIMITED
8th Floor, M. Thai Tower
All Seasons Place
87 Wireless Road
Khwaeng Lumpini, Khet Patumwam
Bangkok 10330, Thailand
011-662-654-0686
POGO HUNGARY LTD.
1054 Budapest
Kalman Imre U. 1.
Hungary
011-361-475-1390

P.O. Box 2504Houston, Texas 77252-2504www.pogoproducing.com
22656 CVR 6/9/03 11:45 AM Page 1


![Analyst Day Consolidated Book - RRD.ppt [Read-Only]media.corporate-ir.net/media_files/irol/19/196053/AnalystDay_TDG.pdfCDA InterCorp. Avtech ADS ... Organizational Philosophy Corporate](https://img.pdfslide.us/doc/110x75/5b093fcd7f8b9a51508d07f8/analyst-day-consolidated-book-rrdppt-read-onlymediacorporate-irnetmediafilesirol19196053analystdaytdgpdfcda.jpg)