Embed Size (px)
Citation preview
© 2003 McGraw-Hill Ryerson Limited
55Chapt
er
Chapt
er Operating and Financial
LeverageOperating and Financial
Leverage
McGraw-Hill Ryerson ©2003 McGraw-Hill Ryerson Limited
Prepared by:
Terry FegartySeneca College
Revised ByP Chua
© 2003 McGraw-Hill Ryerson Limited
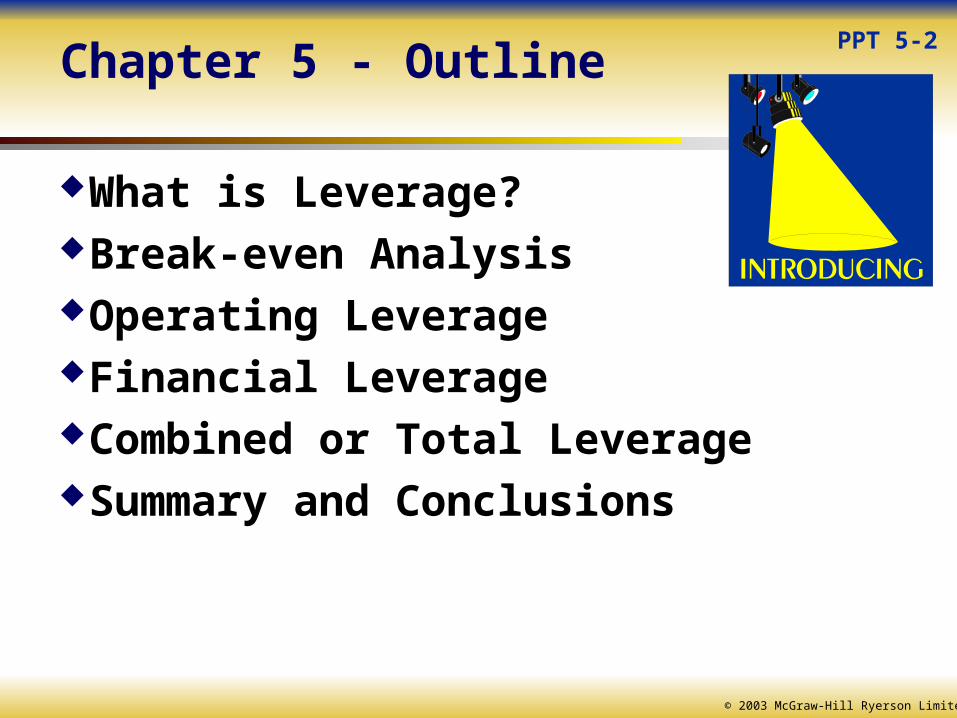
Chapter 5 - Outline
What is Leverage?Break-even AnalysisOperating LeverageFinancial LeverageCombined or Total LeverageSummary and Conclusions
PPT 5-2

© 2003 McGraw-Hill Ryerson Limited
What is Leverage?
In general terms, leverage means the use of force and effects to produce a more than normal results from a given action
In other words, leverage is the advantage generated by using a lever
Example, using a jack to lift a car
In Finance, leverage is the use of fixed costs to magnify the potential return to a firm
2 types of fixed costs: fixed operating costs = rent, salaries, etc. fixed financial costs = interest costs from debt
PPT 5-3
© 2003 McGraw-Hill Ryerson Limited
What is Leverage?
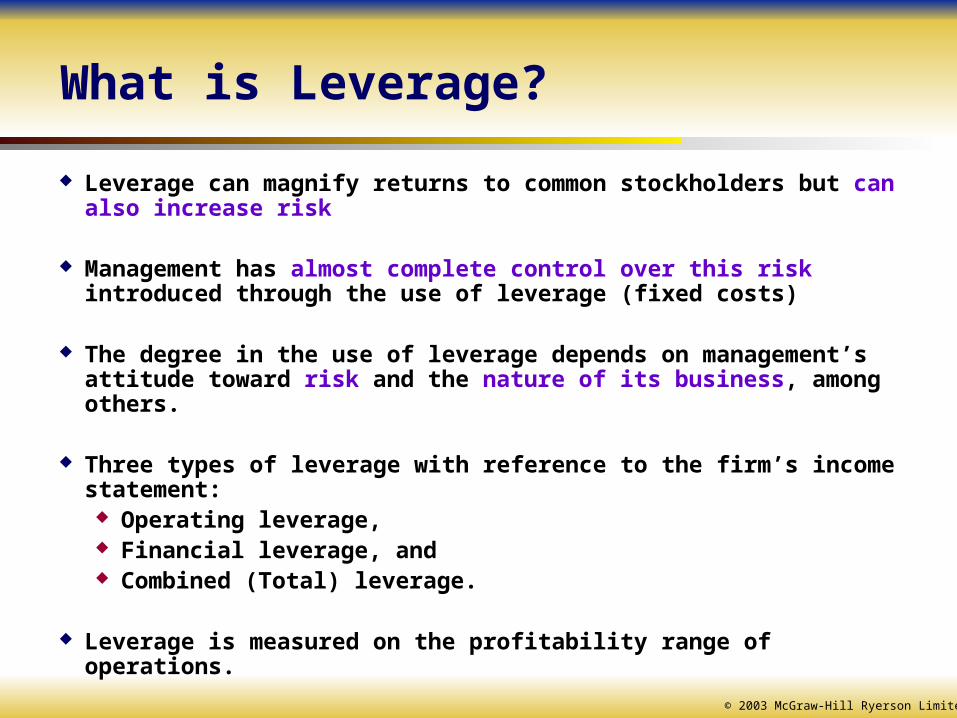
Leverage can magnify returns to common stockholders but can also increase risk
Management has almost complete control over this risk introduced through the use of leverage (fixed costs)
The degree in the use of leverage depends on management’s attitude toward risk and the nature of its business, among others.
Three types of leverage with reference to the firm’s income statement: Operating leverage, Financial leverage, and Combined (Total) leverage.
Leverage is measured on the profitability range of operations.
© 2003 McGraw-Hill Ryerson Limited
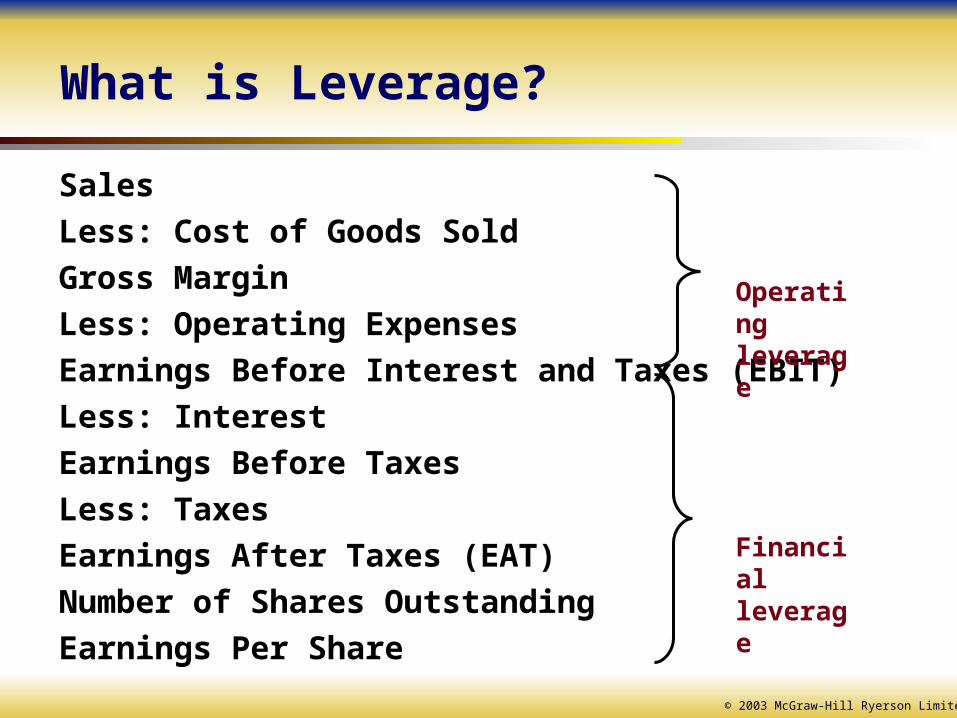
What is Leverage?
Sales
Less: Cost of Goods Sold
Gross Margin
Less: Operating Expenses
Earnings Before Interest and Taxes (EBIT)
Less: Interest
Earnings Before Taxes
Less: Taxes
Earnings After Taxes (EAT)
Number of Shares Outstanding
Earnings Per Share
Operatingleverage
Financialleverage
© 2003 McGraw-Hill Ryerson Limited
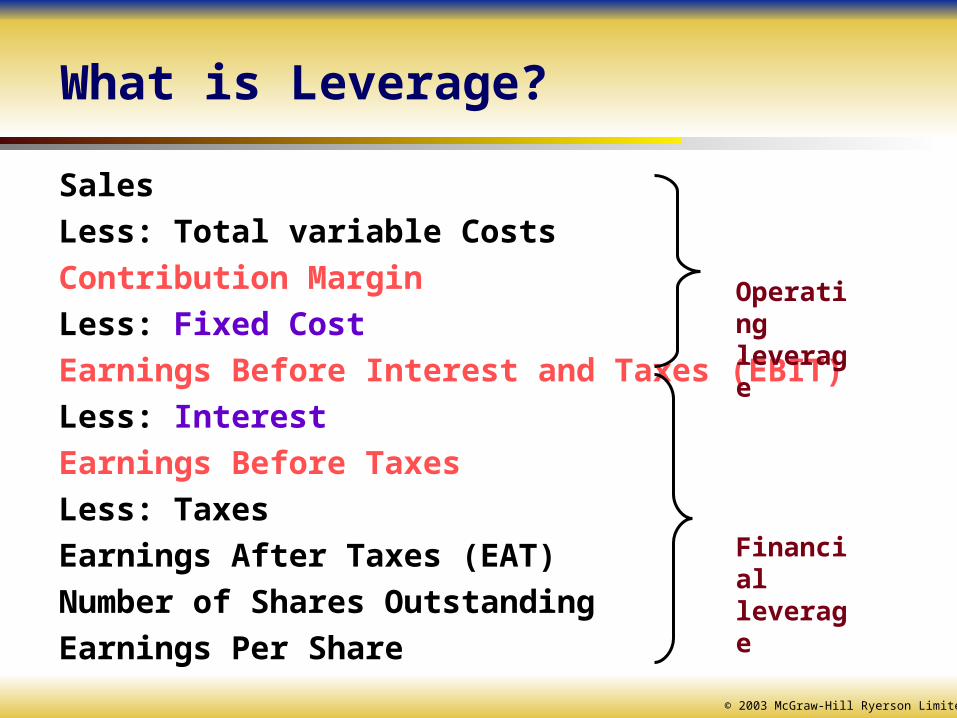
What is Leverage?
Sales
Less: Total variable Costs
Contribution Margin
Less: Fixed Cost
Earnings Before Interest and Taxes (EBIT)
Less: Interest
Earnings Before Taxes
Less: Taxes
Earnings After Taxes (EAT)
Number of Shares Outstanding
Earnings Per Share
Operatingleverage
Financialleverage
© 2003 McGraw-Hill Ryerson Limited
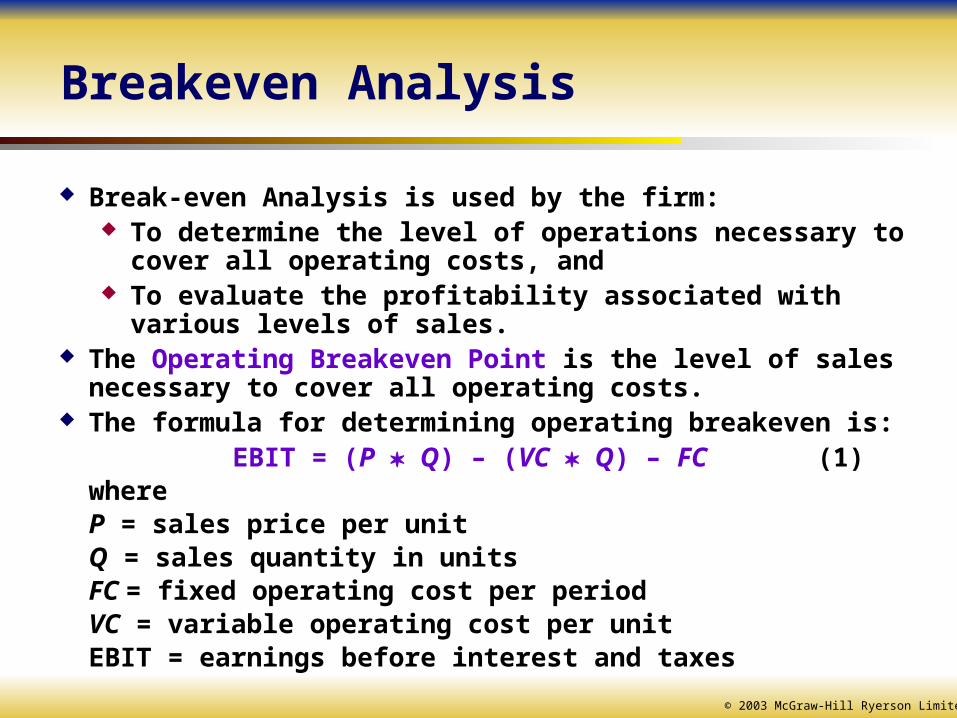
Breakeven Analysis
Break-even Analysis is used by the firm: To determine the level of operations necessary to cover all operating
costs, and To evaluate the profitability associated with various levels of sales.
The Operating Breakeven Point is the level of sales necessary to cover all operating costs.
The formula for determining operating breakeven is: EBIT = (P Q) – (VC Q) – FC (1)
whereP = sales price per unitQ = sales quantity in unitsFC = fixed operating cost per periodVC = variable operating cost per unitEBIT = earnings before interest and taxes
© 2003 McGraw-Hill Ryerson Limited
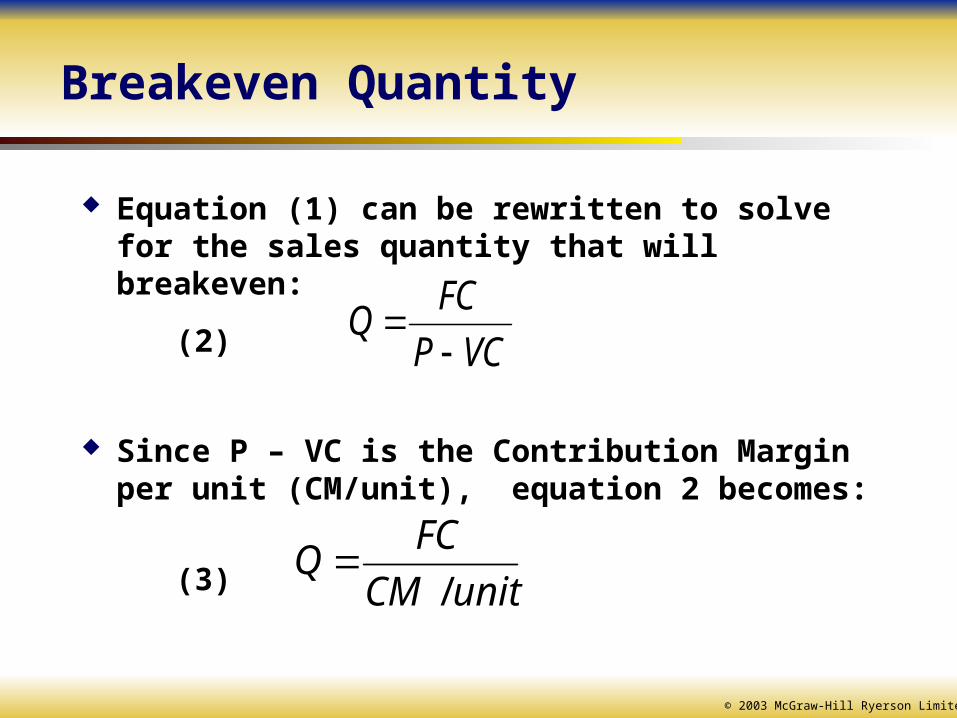
Breakeven Quantity
Equation (1) can be rewritten to solve for the sales quantity that will breakeven:
(2)
Since P – VC is the Contribution Margin per unit (CM/unit), equation 2 becomes:
(3)
VCP
FCQ
unitCM
FCQ
/
© 2003 McGraw-Hill Ryerson Limited
Breakeven Analysis
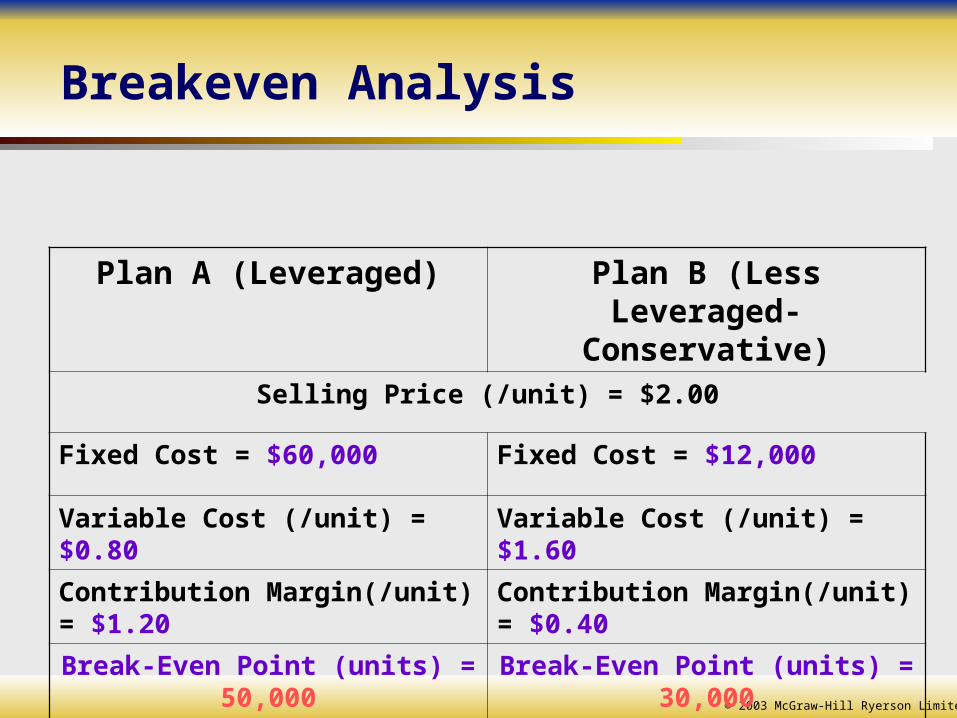
Plan A (Leveraged) Plan B (Less Leveraged-Conservative)
Selling Price (/unit) = $2.00
Fixed Cost = $60,000 Fixed Cost = $12,000
Variable Cost (/unit) = $0.80 Variable Cost (/unit) = $1.60
Contribution Margin(/unit) = $1.20 Contribution Margin(/unit) = $0.40
Break-Even Point (units) = 50,000 Break-Even Point (units) = 30,000
© 2003 McGraw-Hill Ryerson Limited
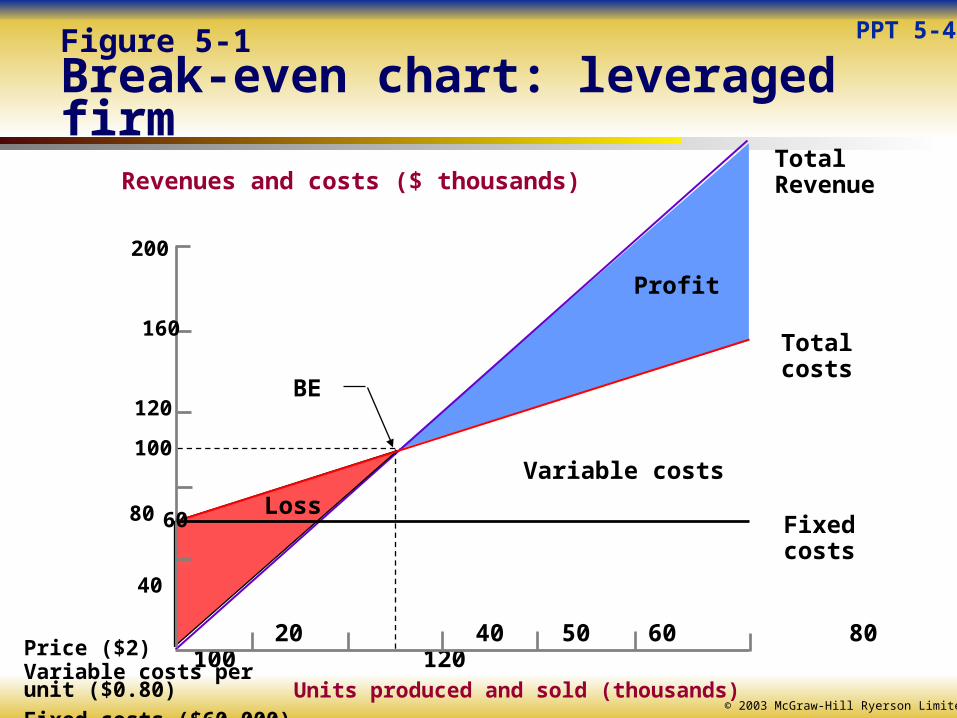
PPT 5-4Figure 5-1Break-even chart: leveraged firm
Revenues and costs ($ thousands)
20 40 50 60 80 100 120
TotalRevenue
Totalcosts
Variable costs
Fixedcosts
Profit
BE
Loss
Units produced and sold (thousands)
200
160
120
100
80
60
40
Price ($2)Variable costs per unit ($0.80)
Fixed costs ($60,000)
© 2003 McGraw-Hill Ryerson Limited
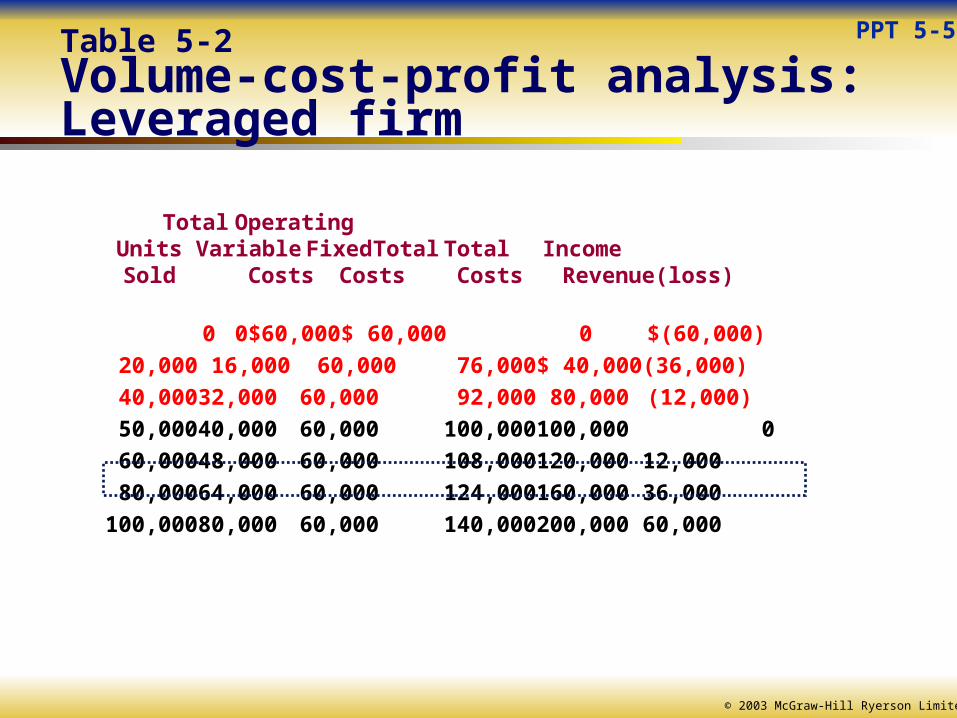
Table 5-2Volume-cost-profit analysis: Leveraged firm
Total OperatingUnits Variable Fixed Total Total IncomeSold Costs Costs Costs Revenue (loss)
0 0 $60,000 $ 60,000 0 $(60,000)
20,000 16,000 60,000 76,000 $ 40,000 (36,000)
40,000 32,000 60,000 92,000 80,000 (12,000)
50,000 40,000 60,000 100,000 100,000 0
60,000 48,000 60,000 108,000 120,000 12,000
80,000 64,000 60,000 124,000 160,000 36,000
100,000 80,000 60,000 140,000 200,000 60,000
PPT 5-5
© 2003 McGraw-Hill Ryerson Limited
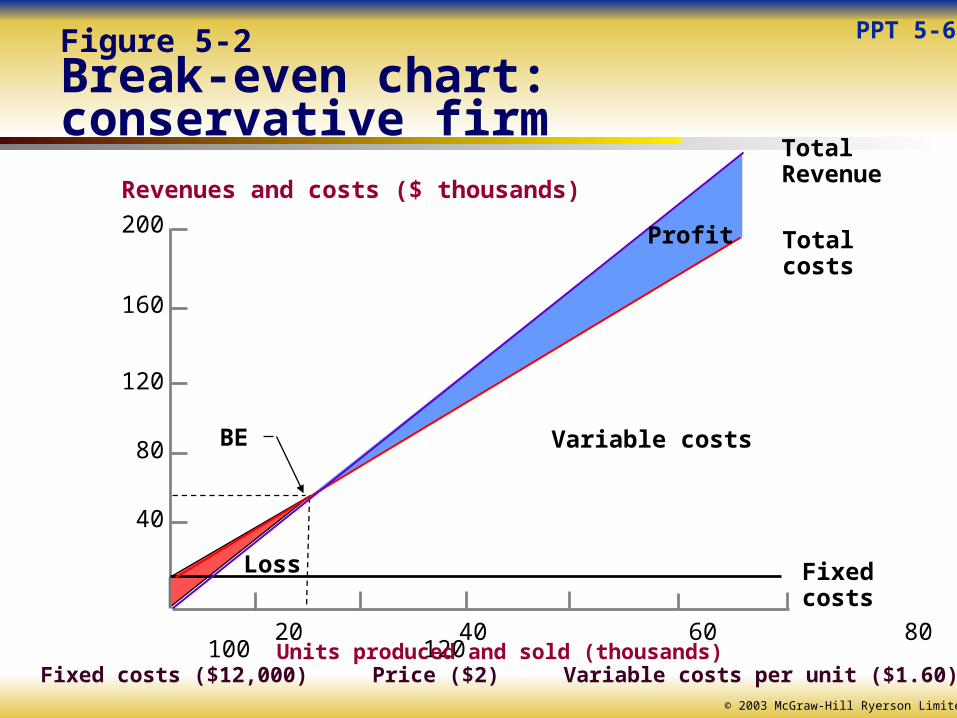
PPT 5-6Figure 5-2Break-even chart: conservative firm
Revenues and costs ($ thousands)
200
160
120
80
40
20 40 60 80 100 120
TotalRevenue
Totalcosts
Variable costs
Fixedcosts
Profit
BE
Loss
Units produced and sold (thousands)Fixed costs ($12,000) Price ($2) Variable costs per unit ($1.60)
© 2003 McGraw-Hill Ryerson Limited
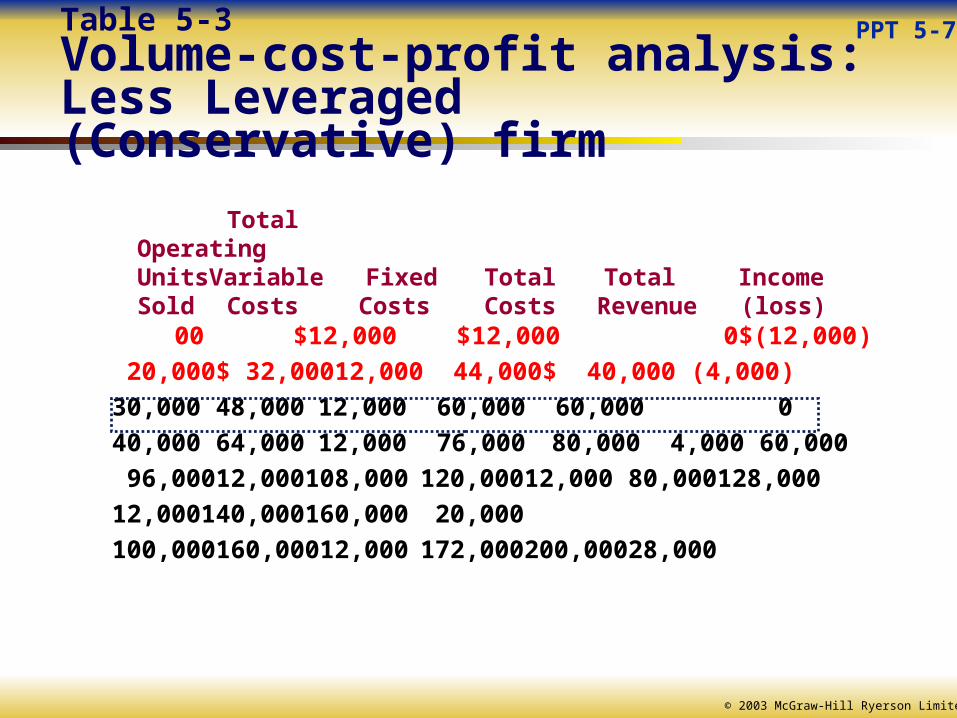
Table 5-3Volume-cost-profit analysis: Less Leveraged (Conservative) firm
0 0 $12,000 $ 12,000 0 $(12,000.)
20,000 $ 32,000 12,000 44,000 $ 40,000 (4,000.)
30,000 48,00012,000 60,000 60,000 0 40,000
64,00012,000 76,000 80,000 4,000 60,000 96,000
12,000108,000120,00012,000 80,000 128,000 12,000
140,000 160,000 20,000
100,000 160,000 12,000 172,000 200,000 28,000
Total OperatingUnits Variable Fixed Total Total IncomeSold Costs Costs Costs Revenue (loss)
PPT 5-7
© 2003 McGraw-Hill Ryerson Limited
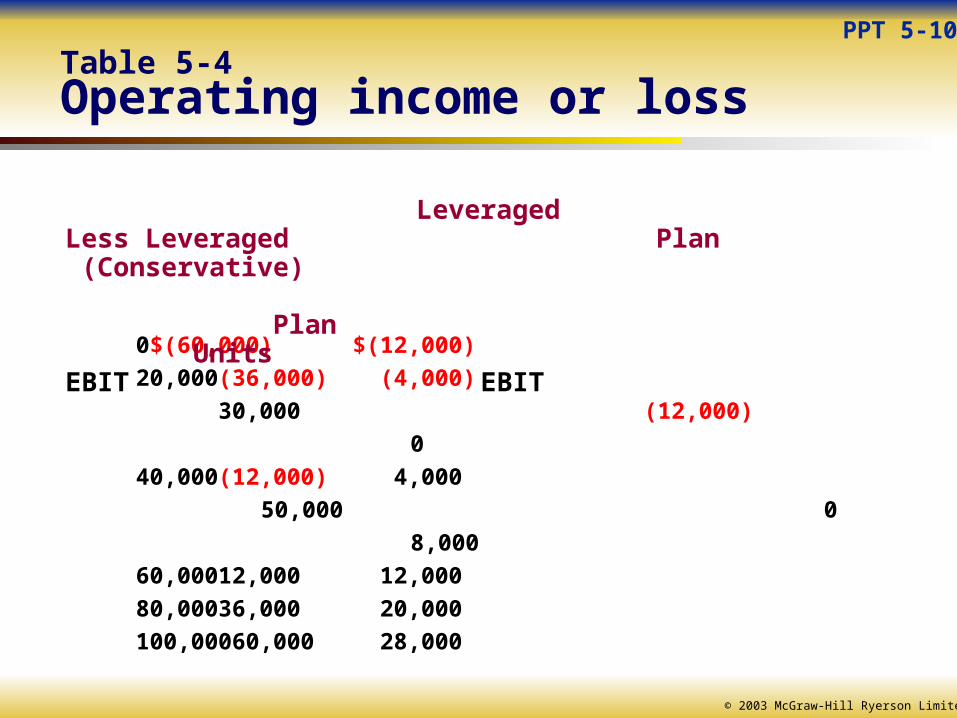
0 $(60,000) $(12,000)
20,000 (36,000) (4,000)
30,000 (12,000) 0
40,000 (12,000) 4,000
50,000 0 8,000
60,000 12,000 12,000
80,000 36,000 20,000
100,000 60,000 28,000
Leveraged Less Leveraged Plan (Conservative) Plan
Units EBIT EBIT
PPT 5-10
Table 5-4Operating income or loss
© 2003 McGraw-Hill Ryerson Limited
Leverage Means Risk
Leverage is a double-edged sword
It magnifies losses as well as profits
An aggressive or highly leveraged firm has a relatively high break-even point (and high fixed costs)
A conservative or less-leveraged firm has a relatively low break-even point (and low fixed costs)
PPT 5-8
© 2003 McGraw-Hill Ryerson Limited
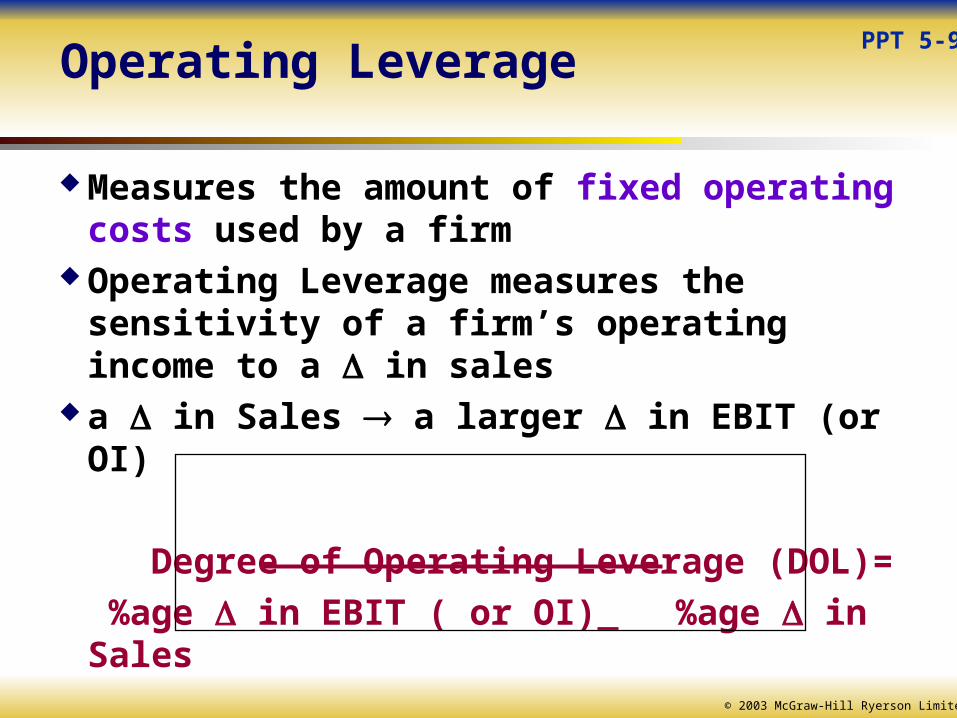
Operating Leverage
Measures the amount of fixed operating costs used by a firm
Operating Leverage measures the sensitivity of a firm’s operating income to a in sales
a in Sales a larger in EBIT (or OI)
Degree of Operating Leverage (DOL)=
%age in EBIT ( or OI) %age in Sales
PPT 5-9
© 2003 McGraw-Hill Ryerson Limited
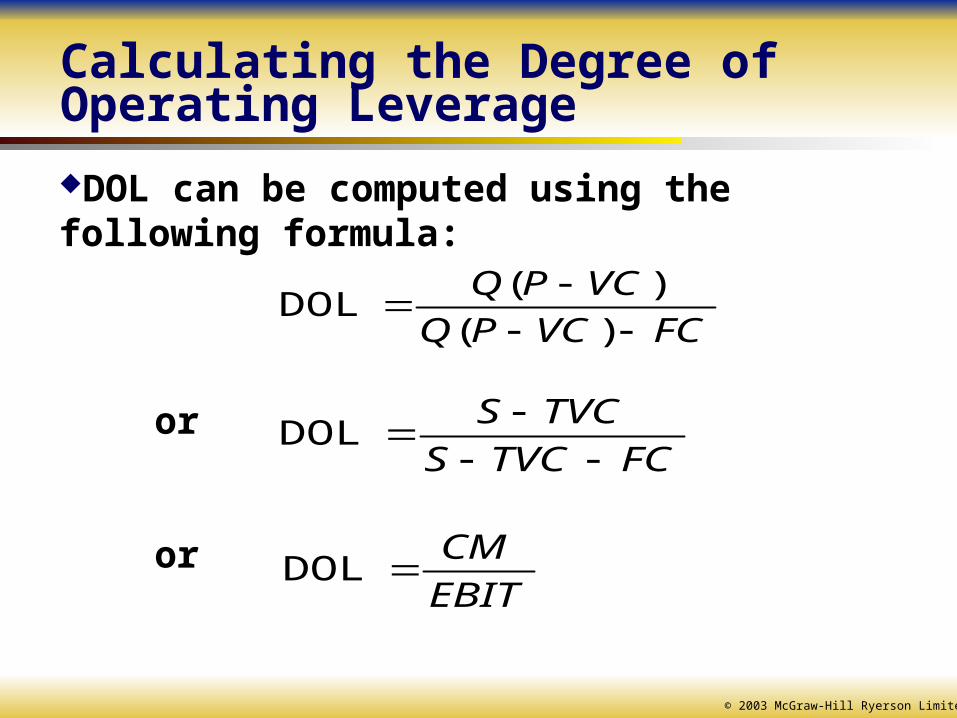
Calculating the Degree of Operating Leverage
DOL can be computed using the following formula:
or
or
FCVCPQ
VCPQ
)(
)( DOL
FCTVCS
TVCS
DOL
EBIT
CM DOL
© 2003 McGraw-Hill Ryerson Limited
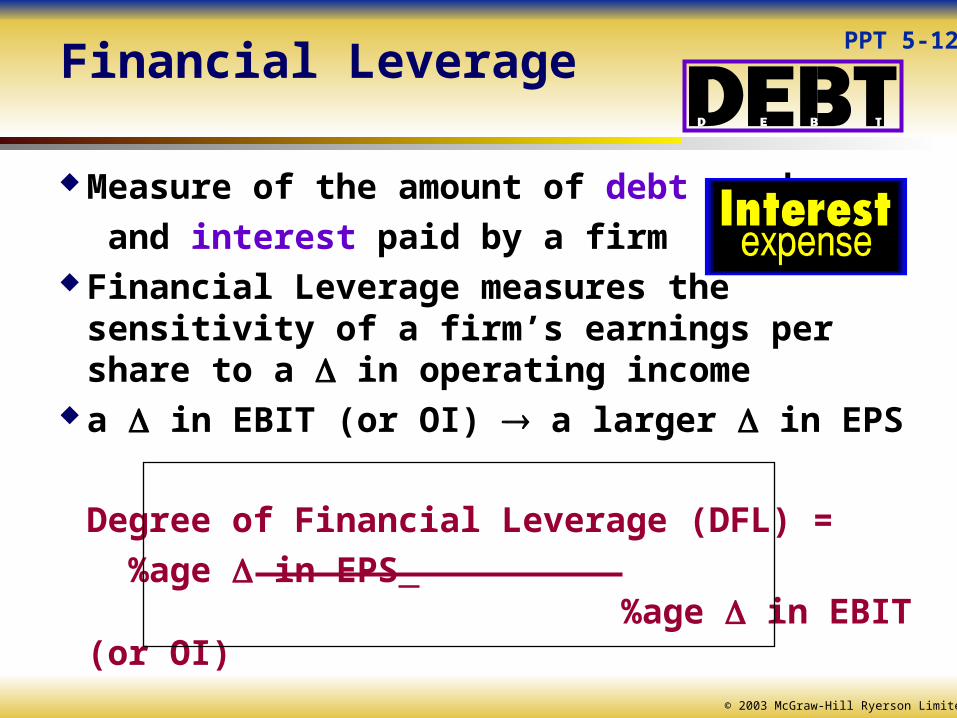
Financial Leverage
Measure of the amount of debt used
and interest paid by a firm Financial Leverage measures the sensitivity of a
firm’s earnings per share to a in operating income a in EBIT (or OI) a larger in EPS
Degree of Financial Leverage (DFL) =
%age in EPS %age in EBIT (or OI)
PPT 5-12
© 2003 McGraw-Hill Ryerson Limited
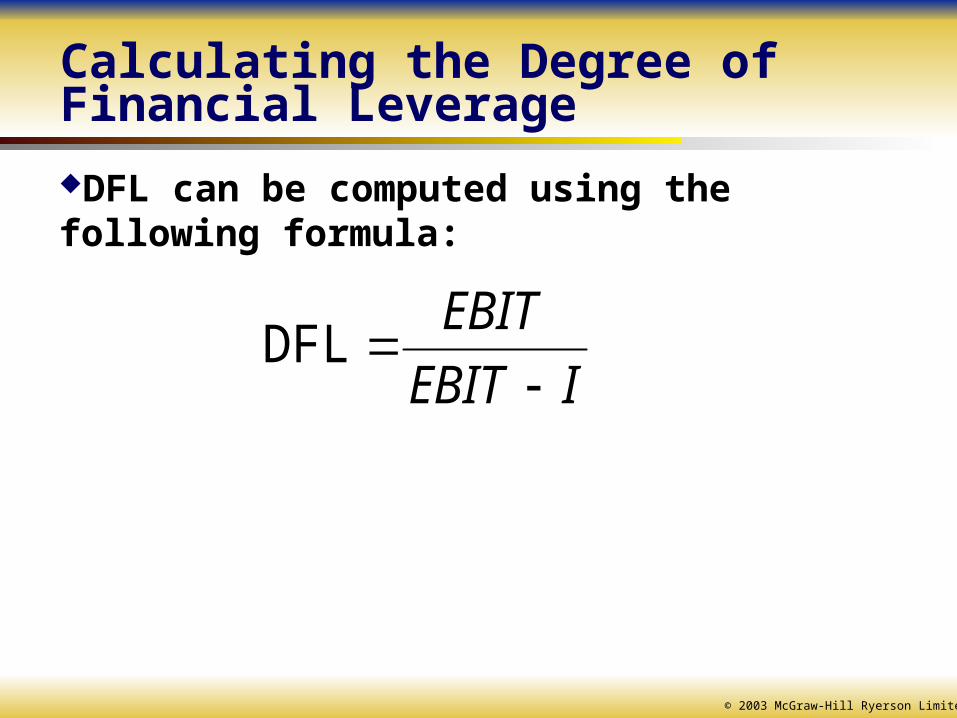
Calculating the Degree of Financial Leverage
DFL can be computed using the following formula:
IEBIT
EBIT
DFL
© 2003 McGraw-Hill Ryerson Limited
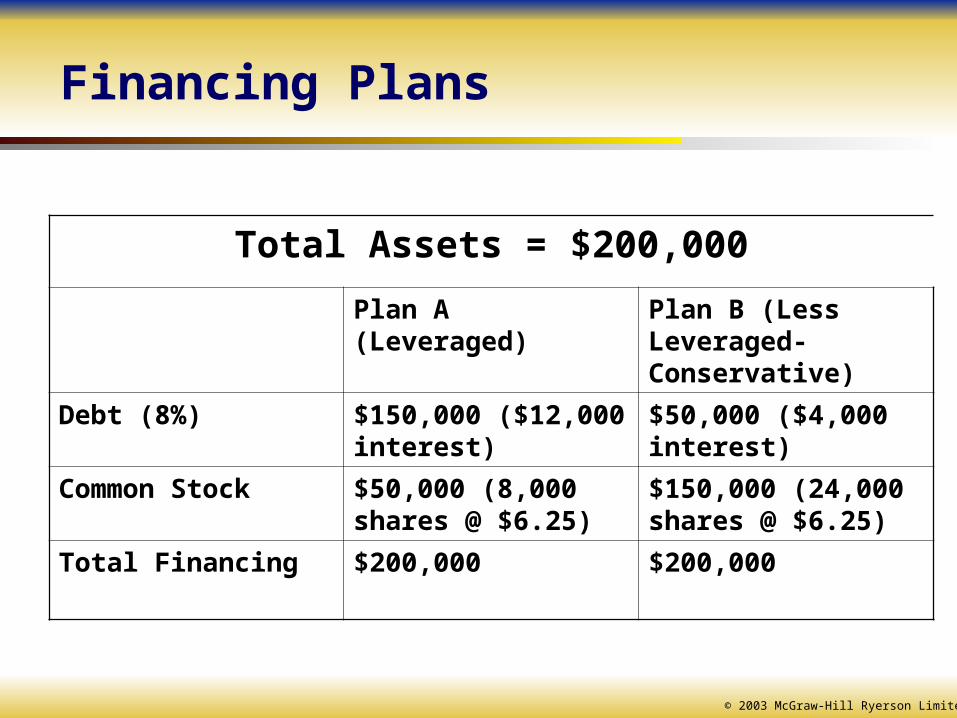
Financing Plans
Total Assets = $200,000
Plan A (Leveraged) Plan B (Less Leveraged-Conservative)
Debt (8%) $150,000 ($12,000 interest)
$50,000 ($4,000 interest)
Common Stock $50,000 (8,000 shares @ $6.25)
$150,000 (24,000 shares @ $6.25)
Total Financing $200,000 $200,000
© 2003 McGraw-Hill Ryerson Limited
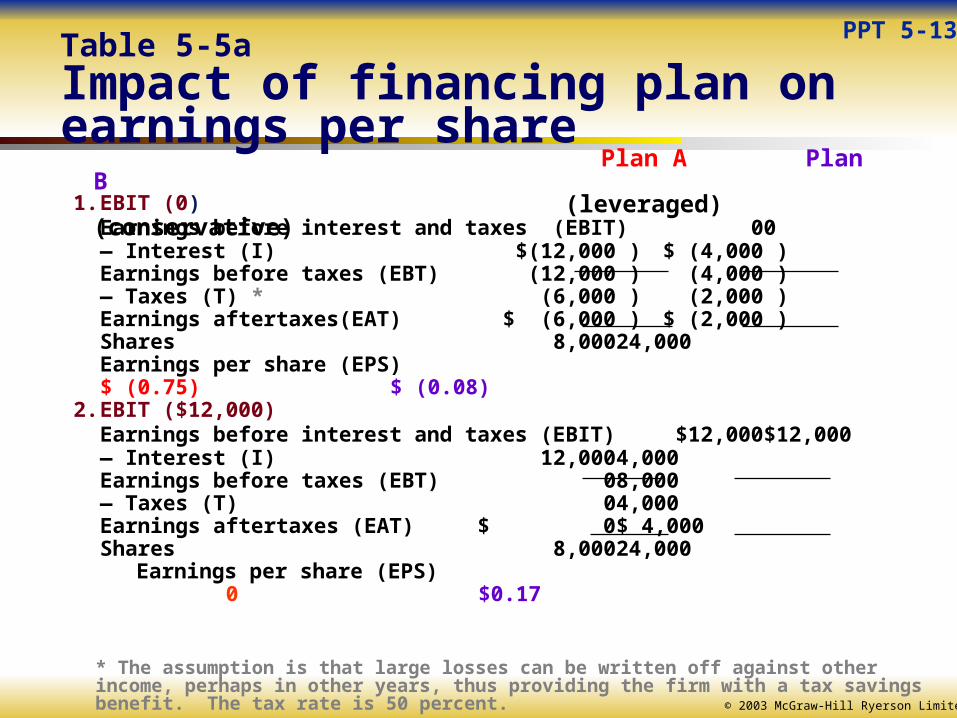
1. EBIT (0)Earnings before interest and taxes (EBIT) 0 0— Interest (I) $(12,000.) $ (4,000.)Earnings before taxes (EBT) (12,000.) (4,000.)— Taxes (T) * (6,000.) (2,000.)Earnings aftertaxes(EAT) $ (6,000.) $ (2,000.)Shares 8,000 24,000Earnings per share (EPS) $ (0.75) $ (0.08)
2. EBIT ($12,000)Earnings before interest and taxes (EBIT) $12,000 $12,000— Interest (I) 12,000 4,000Earnings before taxes (EBT) 0 8,000— Taxes (T) 0 4,000Earnings aftertaxes (EAT) $ 0 $ 4,000Shares 8,000 24,000
Earnings per share (EPS) 0 $0.17
Plan A Plan B(leveraged)
(conservative)
* The assumption is that large losses can be written off against other income, perhaps in other years, thus providing the firm with a tax savings benefit. The tax rate is 50 percent.
PPT 5-13Table 5-5a Impact of financing plan on earnings per share
© 2003 McGraw-Hill Ryerson Limited
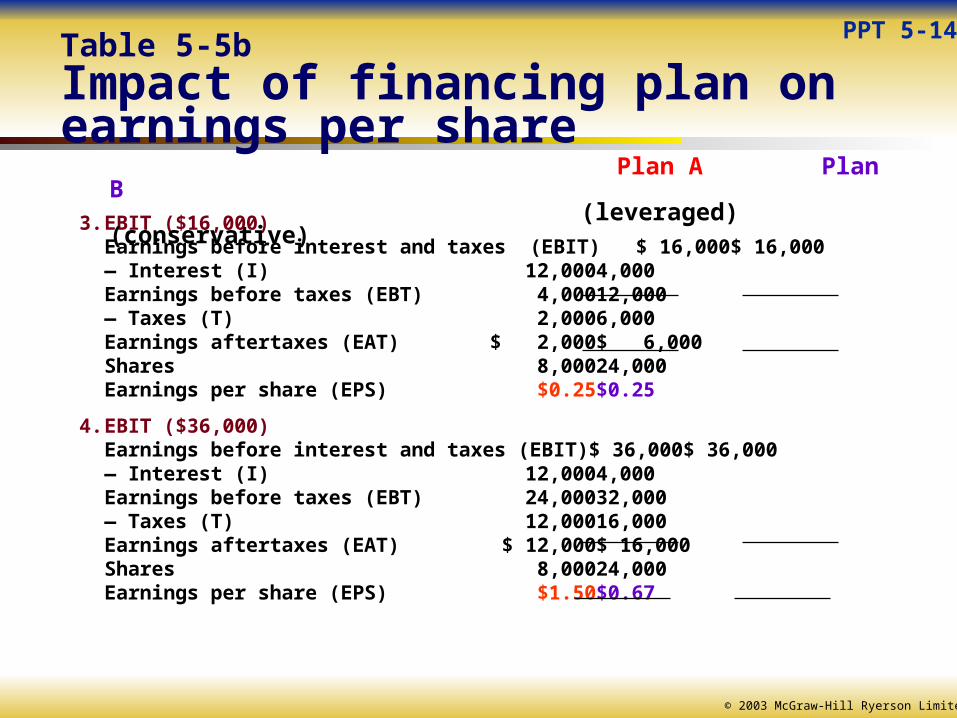
3. EBIT ($16,000)Earnings before interest and taxes (EBIT) $ 16,000 $ 16,000— Interest (I) 12,000 4,000Earnings before taxes (EBT) 4,000 12,000— Taxes (T) 2,000 6,000Earnings aftertaxes (EAT) $ 2,000 $ 6,000Shares 8,000 24,000Earnings per share (EPS) $0.25 $0.25
4. EBIT ($36,000)Earnings before interest and taxes (EBIT) $ 36,000 $ 36,000— Interest (I) 12,000 4,000Earnings before taxes (EBT) 24,000 32,000— Taxes (T) 12,000 16,000Earnings aftertaxes (EAT) $ 12,000 $ 16,000Shares 8,000 24,000Earnings per share (EPS) $1.50 $0.67
Plan A Plan B(leveraged)
(conservative)
PPT 5-14Table 5-5b Impact of financing plan on earnings per share
© 2003 McGraw-Hill Ryerson Limited
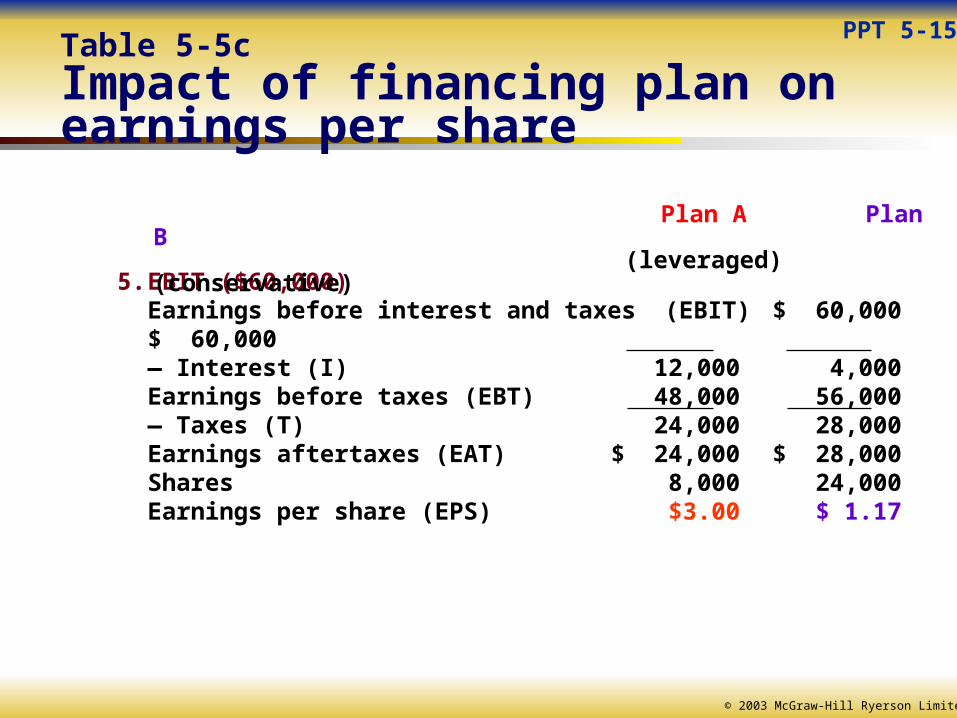
5. EBIT ($60,000)Earnings before interest and taxes (EBIT) $ 60,000 $ 60,000— Interest (I) 12,000 4,000Earnings before taxes (EBT) 48,000 56,000— Taxes (T) 24,000 28,000Earnings aftertaxes (EAT) $ 24,000 $ 28,000Shares 8,000 24,000Earnings per share (EPS) $3.00 $ 1.17
Plan A Plan B(leveraged)
(conservative)
PPT 5-15Table 5-5c Impact of financing plan on earnings per share
© 2003 McGraw-Hill Ryerson Limited
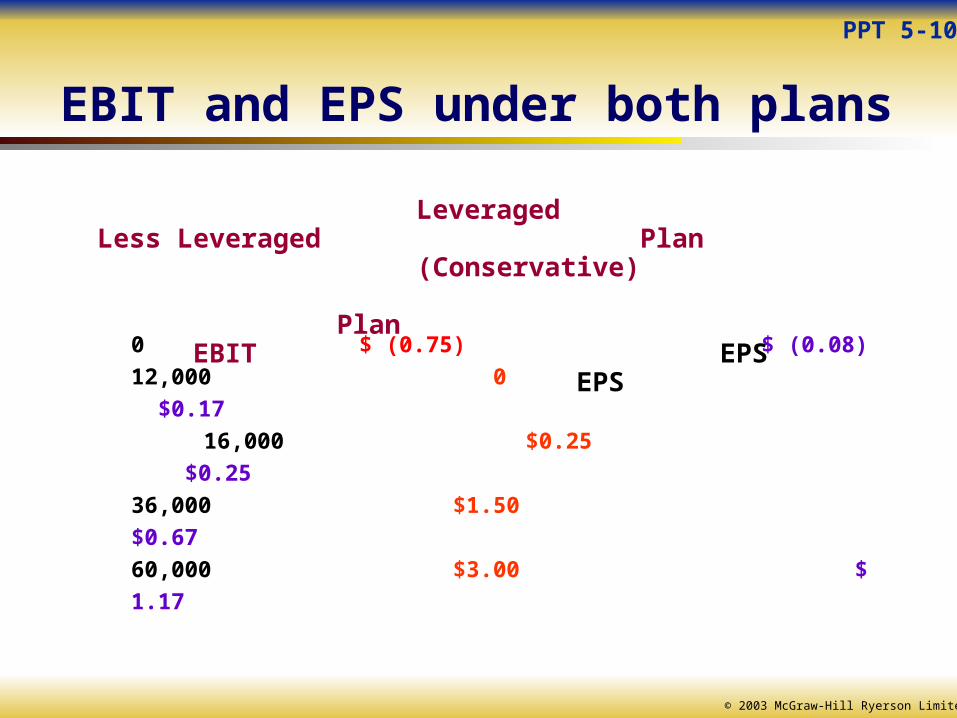
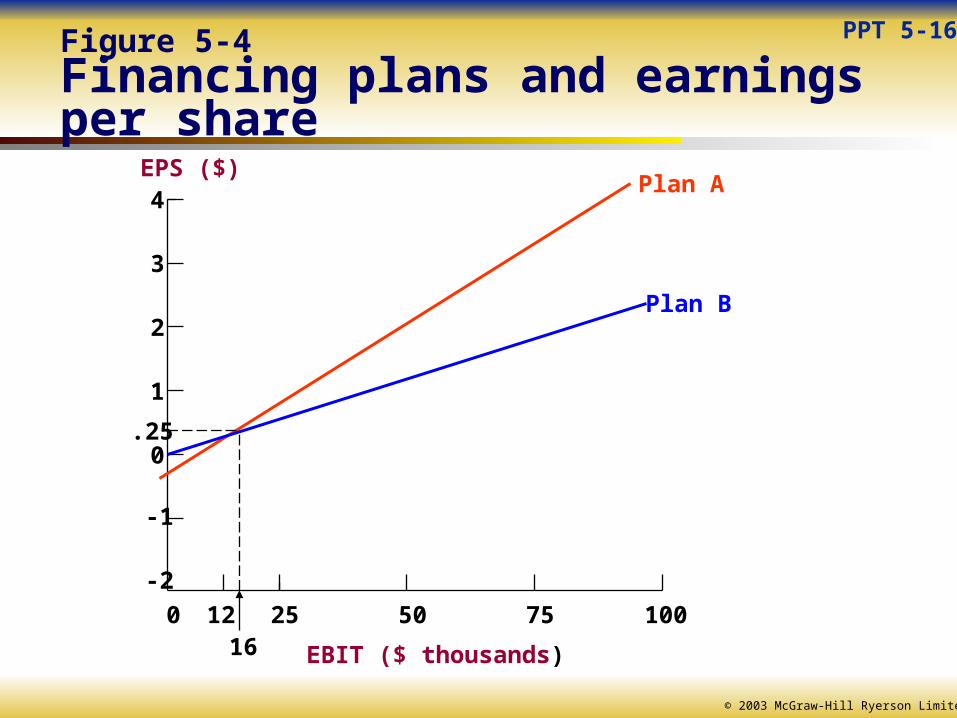
0 $ (0.75) $ (0.08)
12,000 0 $0.17
16,000 $0.25 $0.25
36,000 $1.50 $0.67
60,000 $3.00 $ 1.17
Leveraged Less Leveraged Plan (Conservative) Plan
EBIT EPS EPS
PPT 5-10
EBIT and EPS under both plans
© 2003 McGraw-Hill Ryerson Limited
PPT 5-16Figure 5-4Financing plans and earnings per share
4
3
2
1
0
-1
-2
120 25 50 75 100
EBIT ($ thousands)
EPS ($)
16
.25
Plan A
Plan B
© 2003 McGraw-Hill Ryerson Limited
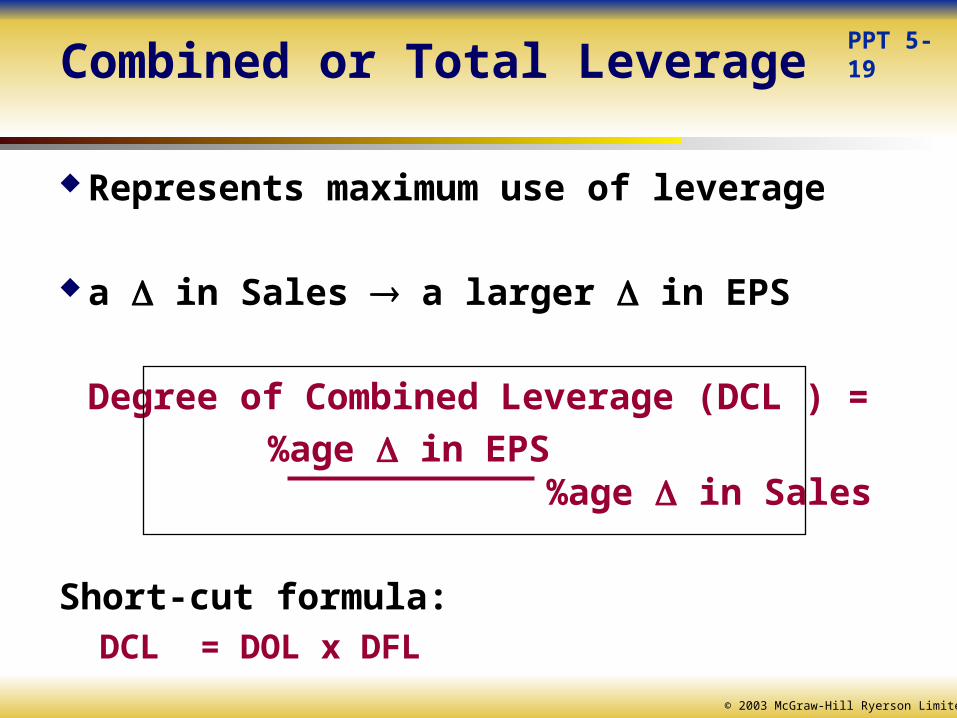
Combined or Total Leverage
Represents maximum use of leverage
a in Sales a larger in EPS
Degree of Combined Leverage (DCL ) =
%age in EPS %age in Sales
Short-cut formula:DCL = DOL x DFL
PPT 5-19
© 2003 McGraw-Hill Ryerson Limited
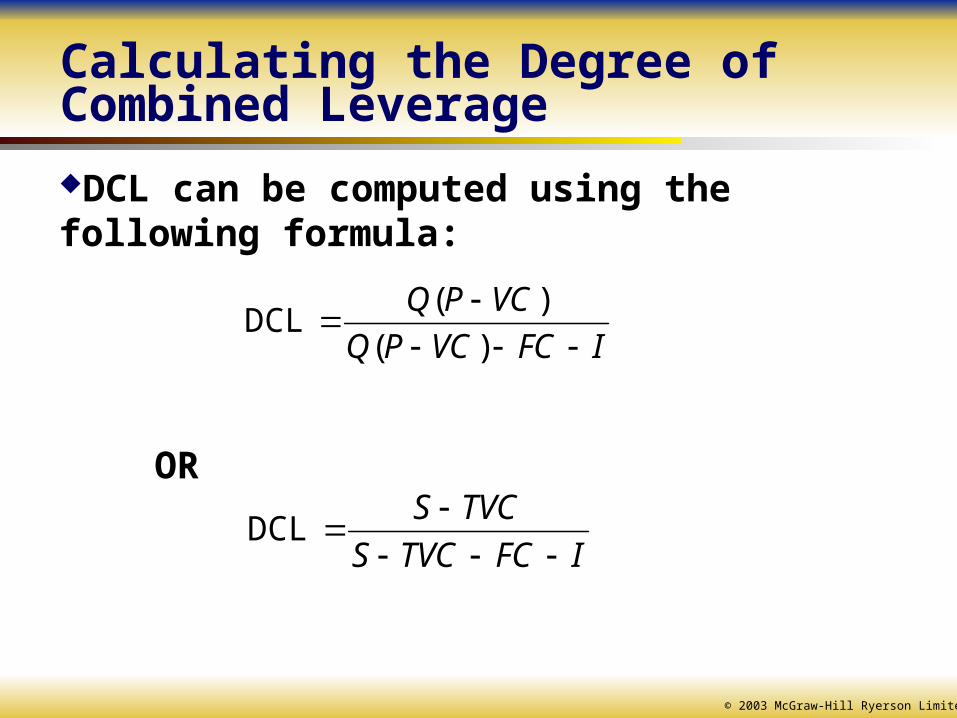
Calculating the Degree of Combined Leverage
DCL can be computed using the following formula:
OR
IFCVCPQ
VCPQ
)(
)( DCL
IFCTVCS
TVCS
DCL
© 2003 McGraw-Hill Ryerson Limited
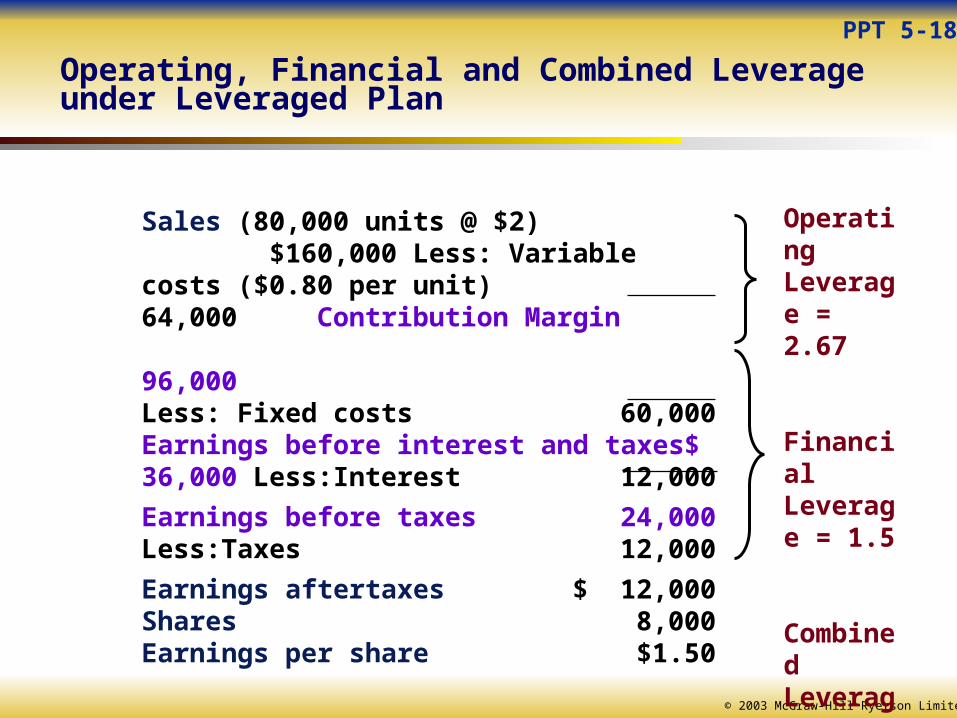
Sales (80,000 units @ $2) $160,000 Less: Variable costs ($0.80 per unit) 64,000 Contribution Margin 96,000Less: Fixed costs 60,000Earnings before interest and taxes$ 36,000 Less:Interest 12,000
Earnings before taxes 24,000Less:Taxes 12,000
Earnings aftertaxes $ 12,000Shares 8,000Earnings per share $1.50
OperatingLeverage = 2.67
FinancialLeverage = 1.5
Combined Leverage=4
PPT 5-18
Operating, Financial and Combined Leverage under Leveraged Plan

© 2003 McGraw-Hill Ryerson Limited
Sales (80,000 units @ $2) $160,000 Less: Variable costs ($1.60 per unit) 128,000 Contribution Margin 32,000Less: Fixed costs 12,000Earnings before interest and taxes$ 20,000 Less:Interest 4,000
Earnings before taxes 16,000Less:Taxes 8,000
Earnings aftertaxes $ 8,000Shares 24,000Earnings per share $0.33
OperatingLeverage = 1.6
FinancialLeverage = 1.25
Combined Leverage=2
PPT 5-18
Operating, Financial and Combined Leverage under Less Leveraged (Conservative) Plan
© 2003 McGraw-Hill Ryerson Limited
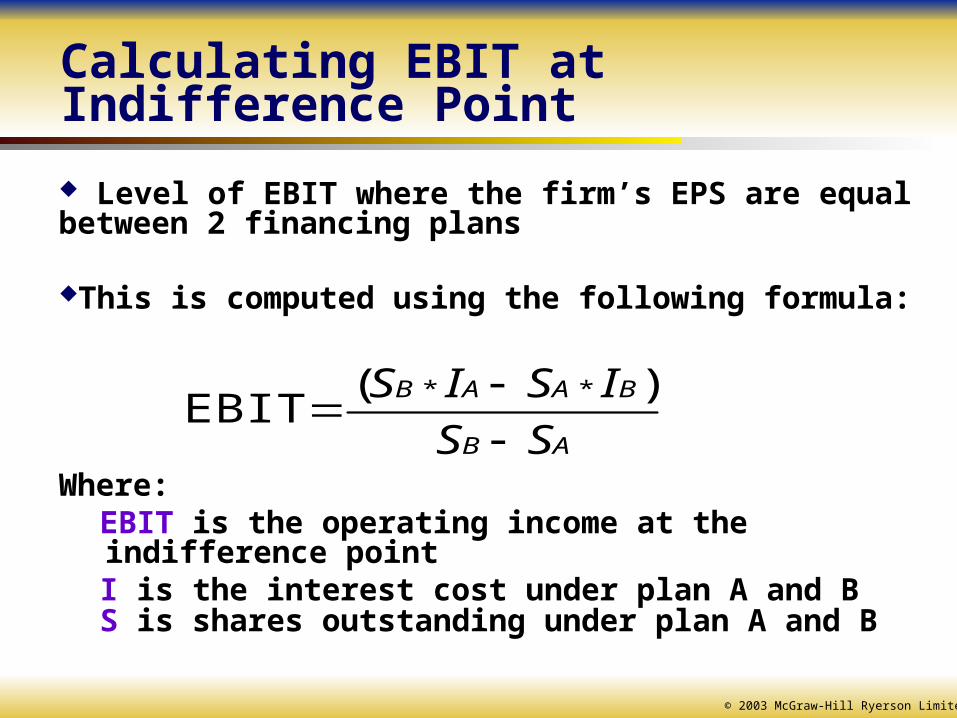
Calculating EBIT at Indifference Point
Level of EBIT where the firm’s EPS are equal between 2 financing plans
This is computed using the following formula:
Where:EBIT is the operating income at the indifference pointI is the interest cost under plan A and BS is shares outstanding under plan A and B
AB
BAAB
SS
ISIS
)(
EBIT**
© 2003 McGraw-Hill Ryerson Limited
Summary and Conclusions
Leverage uses fixed costs to magnify the profits (or losses) of a business
Operating leverage refers to fixed operating costs, such as lease or amortization expense
The degree of operating leverage (DOL) measures the %age change in operating income from a %age change in sales
Financial leverage refers to interest expense on debt The degree of financial leverage (DFL) measures the %age
change in earnings from a %age change in operating income The higher the level of fixed costs, the greater the effect on
net income of an increase in sales revenue (This is the degree of combined leverage (DCL))
PPT 5-22