Embed Size (px)
Citation preview

RuddReport
January 2019
Increasing disparities in unhealthy food advertising targeted to Hispanic and Black youth
UCONNRUDDCENTER.ORG

2 Return to contents >
AUTHORS
Rudd Center for Food Policy & Obesity University of Connecticut
Jennifer L. Harris, PhD, MBA Director of Marketing Initiatives Associate Professor, Allied Health Sciences
Willie Frazier III, MPH Research Assistant
Council on Black Health Drexel University
Shiriki Kumanyika, PhD, MPH Research Professor, Department of Community Health and PreventionDana and David Dornsife School of Public HealthFounder and Chair, Council on Black Health
Salud America! University of Texas Health Science Center at San Antonio
Amelie G. Ramirez, DrPH, MPH Director, Institute for Health Promotion Research Professor, Department of Epidemiology and Biostatistics
ACKNOWLEDGEMENTS
We would like to thank our colleagues at the Rudd Center, Council on Black Health, and Salud America! for their assistance with data collection and report preparation, with special thanks to Kristopher Butler, Frances Fleming-Milici, Haley Gershman, Whitney Hubbard, Abby Katz, Sally Mancini, Kristin Messina, and Yoon-Young Choi.
This work was supported by a grant from the Robert Wood Johnson Foundation, Princeton, NJ. The views expressed here do not necessarily reflect the views of the Foundation.
3 Return to contents >
EXECUTIVE SUMMARY
BACKGROUND
RESULTS
• CHANGES IN FOOD-RELATED ADVERTISING: 2013 TO 2017
• TARGETED ADVERTISING BY COMPANY
• TARGETED ADVERTISING BY HIGHLY ADVERTISED BRANDS
• TARGETED ADVERTISING BY PRODUCT CATEGORY
DISCUSSION
REFERENCES
APPENDIX A. METHODS
APPENDIX B. COMPANY PROFILES
APPENDIX C. SUPPLEMENTAL TABLES
1. TARGETED ADVERTISING BY COMPANY
2. BRANDS TARGETED TO HISPANIC CONSUMERS
3. BRANDS TARGETED TO BLACK CONSUMERS
4. ALL OTHER BRANDS
4
10
15
42
47
50
55
123
TABLE OF CONTENTS

4 Return to contents >
As documented in our previous
report published in 2015,
restaurants, food, and beverage
(i.e., food-related) companies
often target Black and Hispanic
consumers with marketing for
their least nutritious products,
primarily fast-food, candy,
sugary drinks, and snacks.
Unhealthy food marketing aimed at youth under age 18 is a significant contributor to poor diets and diet-related diseases. Therefore, greater exposure to this marketing by Hispanic and Black children and teens, both in the media and in their communities, likely contributes to diet-related health disparities affecting communities of color, including obesity, diabetes, and heart disease.
Since our previous targeted marketing report was published, the 10 companies with the most targeted advertising spending have launched or expanded corporate responsibility initiatives to promote nutrition and/or health and wellness, such as introducing new healthier products, reformulating existing products, and launching nutrition and healthy lifestyles education campaigns. Therefore, it is important to evaluate whether companies have made changes in their targeted advertising to also support nutrition, health and wellness among consumers of color.
Executive Summary
METHODS
In this report, we apply the same methods and definitions used in our previous report to identify food-related TV advertising targeted to Black and Hispanic consumers in 2017, and exposure to those ads by Hispanic and Black youth, including children (2-11 years) and teens (ages 12-17 years). We use Nielsen syndicated market research data to measure TV advertising spending in total, as well as spending on targeted media (Spanish-language and Black-targeted TV networksa). We also use Nielsen data to measure the number of food-related advertisements viewed by Hispanic children and teens on Spanish-language TV, and advertisements viewed by Black and White children and teens on all TV programming. In addition, we collected and reviewed companies’ public statements about their targeted marketing for mentions of programs designed to reach and/or appeal to specific racial and/or ethnic segments of the population.
For each level of analysis (company, brand, and product category), we report advertising expenditures on Spanish-language and Black-targeted TV programming to identify advertising targeted to Hispanic and Black consumers overall, as well as disproportionately high allocations of TV advertising budgets to targeted TV programming. To measure advertising targeted to Hispanic children and teens, we examine food-related TV ads viewed by Hispanic youth on Spanish-language TV. To identify advertising targeted to Black children and teens, we also compare ads viewed by Black youth to ads viewed by White youth to assess disproportionate exposure on all types of TV programming (i.e., additional ads viewed by Black youth, not explained by differences in TV viewing times). We discuss changes by company and brand from 2013 to 2017 when notable.
KEY FINDINGS
We first present overall trends in food-related advertising and time spent watching TV from 2013 to 2017 to provide context for targeted advertising results. We then present analyses at the company level to demonstrate corporate investments in targeted advertising by the 32 companies examined. As nearly all targeted marketing occurs at the brand level, and targeting strategies differ widely between brands even within the same company, we also present brand-level analyses for the most highly
a TV networks where more than 50% of viewers self-identify as Black, such as BET and VH1.

5 Return to contents >
advertised brands from these companies. Finally, we consolidate the brand-level data into totals by product category to assess systematic differences in the types of products targeted to Hispanic and Black consumers overall, and exposure to these ads by Hispanic and Black children and teens specifically.
Trends in food-related advertising
From 2013 to 2017, the total amount that companies spent to advertise restaurants, food, and beverages on all types of TV programming declined by just 4% (from $11.4 billion to $10.9 billion). However, greatly reduced TV viewing by children and teens resulted in large reductions in exposure to food-related TV ads: -28% for children and -43% for teens overall. Despite this decline, on average children and teens continued to view approximately 10 food-related TV ads per day in 2017.
Total food-related advertising spending on Spanish-language TV also declined by 4% over the past five years (from $817 million in 2013 to $787 million in 2017), and reductions in TV viewing and food-related ads viewed by Hispanic youth mirrored declines for all youth.
In contrast, total food-related advertising spending on Black-targeted TV increased by more than 50% from 2013 to 2017 ($217 million to $333 million). Disparities between Black and White youth in exposure to all food-related TV ads also increased. In 2013, Black children and teens viewed 70% more food ads than their White peers viewed. In 2017, these disparities grew to 86% more ads viewed by Black children compared to White children and 119% more ads viewed by Black teens than by White teens. On average in 2017, Black children and teens saw 16.4 and 17.1 food-related TV ads-per- day, respectively.
This increased disparity in ads viewed resulted from increased food-related spending on Black-targeted TV advertising, as well as two additional trends. First, differences in time spent watching TV increased.
In 2017, Black children and teens watched 61% and 84% more TV, respectively, than White children and teens watched. These differences were higher in 2017 than in 2013 as there was a greater decline in time spent watching TV for White youth than for Black youth.
In addition, the types of TV programming that Black youth watch also featured more food advertising in 2017 than in 2013. After accounting for differences in TV viewing, targeted indicesb of food-related ads viewed by Black versus White children increased from 141 in 2013 to 160 in 2017, and indices for Black versus White teens increased from 105 to 119. Since these indices are higher than 100, food companies have placed their ads during TV programming where Black youth make up a disproportionately high percentage of the audience. In addition, from 2013 to 2017 there was an increase in total food-related advertising during programming watched more often by Black youth than by White youth (including Black-targeted TV programming).
Targeted advertising by company
In this section, we detail targeted advertising by the 32 companies that spent $100 million or more in total advertising in 2017 (n=27) and/or participated in the Children’s Food and Beverage Advertising Initiative (CFBAI) industry self-regulatory program to reduce unhealthy advertising to children under age 12 as of December 2017 (n=17).
These 32 companies included 14 restaurants (primarily fast-food restaurants, n=12) and 18 packaged food and beverage companies. The majority of packaged food companies (n=15), but just two of the 14 restaurants, participated in the CFBAI. In addition to the 26 companies examined in the previous report, five new fast-food restaurants and one packaged food company (The Wonderful Company) spent more than $100 million in advertising in 2017 and were included in this report.
These 32 companies were responsible for 69% of all food-related advertising spending in 2017, including 88% of advertising spending on Spanish-language TV and 59% of advertising spending on Black-targeted TV. On average, they devoted 8.8% of their TV advertising budgets to Spanish-language TV and 2.5% to Black-targeted TV. From 2013 to 2017, total Spanish-language advertising spending by these companies declined by 8%, whereas spending on Black-targeted TV increased by 7%.
Executive Summary
b The targeted index was computed by dividing the ratio of ads viewed by Black vs. White children and teens by the ratio of time spent watching TV for Black vs. White children and
teens. Therefore, an index of 100 would indicate that differences in ads viewed equaled differences in time spent watching TV.

6 Return to contents >
In their public statements, many of these companies discussed the business opportunity for targeting marketing to “multicultural” consumers in general (without defining multicultural) or Hispanic consumers specifically, as well as their efforts to offer culturally relevant products. Only Mars mentioned targeting Black consumers specifically. A few companies described efforts to attract young multicultural consumers (e.g., millennials, Gen Z), including Coca-Cola, General Mills, Nestle, PepsiCo, Popeyes, and Wendy’s.
Many of these companies also discussed sponsorships and scholarships supporting Black and Hispanic youth as part of their corporate responsibility initiatives. Despite separate corporate nutrition, health and wellness initiatives by many of these companies, Nestle was the only company to indicate that a health and wellness campaign (DrinkUp to promote water consumption) was intended for consumers of color.
Advertising expenditure data show that food-related advertising targeted to Hispanic and/or Black consumers was concentrated among a smaller number of companies.
Mars, McDonald’s, Nestle, Coca-Cola, and Subway each spent more than $45 million in Spanish-language advertising (ranging from 10% of its total TV advertising budget for McDonald’s to 26% for Mars). Mars, Nestle, and Post Consumer Brands all allocated approximately one-quarter of their budgets to Spanish-language TV. Despite the small decline in total food-related spending on Spanish-language TV from 2013 to 2017, Coca-Cola and Nestle more than doubled their Spanish-language advertising spending during this time.
The five companies contributing the most ads viewed by Hispanic children and teens on Spanish-language TV included Yum! Brands and General Mills, as well as Mars, Nestle, and McDonald’s. From 2013 to 2017, despite declines in total food ads viewed on Spanish-language TV, Hispanic youth exposure to ads for Nestle products more than doubled.
On the other hand, some companies in our analysis had little or no spending on Spanish-language TV, including Berkshire Hathaway (Dairy Queen), Campbell, Conagra, Dannon, Ferrero, Tyson, and Wonderful. Both Campbell and Conagra reduced their Spanish-language advertising since 2013.
On Black-targeted TV, PepsiCo, Yum! Brands, and Hershey each spent more than $19 million in advertising. Hershey, PepsiCo, and Domino’s allocated the highest proportion of their TV advertising budgets (approximately 4%) to Black-targeted TV.
In contrast to Spanish-language advertising, nearly all companies in this analysis increased their spending on Black-targeted TV from 2013 to 2017, including increases of more than 30% for PepsiCo, Yum! Brands, and Domino’s, and a ten-fold increase by Roark Capital Group (owner of Arby’s and other fast-food restaurant chains). Hershey was the only large advertiser to reduce Black-targeted spending.
Despite declines in TV viewing times and overall declines in exposure to food-related TV ads for Black children and teens, Black youth exposure to ads for some companies increased. Black children saw more ads for Kraft Heinz, PepsiCo, and Yum! Brands in 2017 than they saw in 2013, while Black teens saw more ads for Kraft Heinz. After controlling for differences in TV viewing times, the differences in ads viewed by Black compared to White teens increased for all companies. Hershey and PepsiCo had the highest disparities in ads viewed by Black youth. In 2017, Black children and teens viewed 30% to 40% more ads from these companies than White children and teens viewed, in excess of differences due to greater time spent watching TV.
As in Spanish-language TV advertising, Dannon, Campbell, Conagra, and Wonderful spent the least to advertise on Black-targeted TV in 2017. It is notable that two of the companies with the least advertising on Spanish-language and Black-targeted TV (Dannon and Wonderful) offer primarily healthy products, including yogurt, fruit, and nut brands.
Executive Summary
7 Return to contents >
Top targeted brands
The 32 companies in our analysis offered 236 highly advertised brands.c In this section, we identify brands targeted to Hispanicd and/or Blacke consumers. In addition, we identify youth-targeted brands with a high rate of exposure to TV advertising for all children and/or teens relative to adultsf, and the intersection between youth-targeted and Hispanic- and/or Black- targeted brands.
Approximately two-thirds of highly advertised brands targeted Black and/or Hispanic consumers: 58% (n=136) qualified as Black-targeted, 36% (n=85) qualified as Hispanic-targeted, and 28% (n=66) targeted both audiences. Approximately one-third (n=81) did not appear to target either Hispanic or Black consumers. Restaurants had the most targeted brands; just two of the 22 restaurant brands (9%) did not target Hispanic and/or Black consumers. Although just 14% (n=33) of all highly advertised brands appeared to target youth (i.e., children and/or teens) with their advertising, there was high overlap between youth-targeted and Hispanic- and Black-targeted brands: 85% of youth-targeted brands also targeted Black and/or Hispanic consumers.
Due to their generally higher total advertising budgets, fast-food restaurant brands ranked at the top in targeted advertising spending: McDonald’s, Subway, Wendy’s, and Taco Bell on Spanish-language TV, and Taco Bell, Domino’s, Burger King, Wendy’s, and Arby’s on Black-targeted TV.
However, one packaged food brand – Coca-Cola Classic – ranked number three in brand advertising spending on Spanish-language TV. Additional packaged food and drink brands with the highest spending on Spanish-language TV included M&Ms and Big G Cereals: each spent more than $20 million. Brands that invested 40%
or more of their advertising budgets on Spanish-language TV included Big G Cereals, Pop Tarts, Extra gum, Special K cereal, and Lean Cuisine Marketplace Frozen Entrees.
On Black-targeted TV, Lipton Iced Tea spent more than any other packaged food brand ($4 million), followed by Lay’s Potato Chips, Sprite, and Doritos (each spent >$2 million). Brands that invested more than 10% of their TV advertising budgets to Black-targeted programming included Lipton Iced Tea (20%), Jolly Rancher candy (16%), Lay’s Poppable Potato Chips (12%), and Lay’s Potato Chips (10%).
Youth-targeted brands that also targeted Hispanic and/or Black audiences included eight child-directed brands from CFBAI companies (Campbell, General Mills, Kellogg, Kraft Heinz, PepsiCo, and McDonald’s). In addition, seven sugary drink brands (from Coca-Cola, PepsiCo, and Dr. Pepper Snapple Group), three candy brands (Mars and Mondelez), four additional fast-food brands (Subway and three Roark Capital brands), and one sweet snack brand (Kellogg) targeted teens as well as Hispanic and/or Black consumers.
Targeted advertising by product category
In this section, we combine results for highly advertised brands by product category to assess targeting at the category level.
As in 2013, four product categories dominated food-related advertising in 2017. Restaurants (primarily fast-food) represented 52% of all food-related advertising spending in 2017 (totaling almost $4 billion), 49% of spending on Spanish-language TV, and 50% of Black-targeted TV advertising spending. Three additional categories – candy (including gum and mints), sugary drinks, and savory and sweet snacks (including desserts) – represented another 28% of all food-related advertising spending in 2017 (totaling more than $2 billion). These three categories contributed an even higher proportion of Spanish-language and Black-targeted TV advertising spending, at 33% and 36%, respectively.
Brands in these four categories also were significantly more likely to target Hispanic and Black consumers compared to brands in other categories, including approximately 90% of restaurant and candy brands, and more
Executive Summary
c Highly advertised brands are defined as brands that spent $4.5 million or more in total advertising and $500,000 or more in TV advertising in 2017.d Hispanic-targeted brands are defined as brands that spent $100,000 or more in advertising on Spanish-language TV in 2017.e Black-targeted brands are defined as brands that spent $500,000 or more on Black-targeted TV channels or that spent $100,000 or more on Black-targeted TV and had a
disproportionately high ratio of ad exposure for Black teens relative to White teens.f Child-targeted brands had targeted ratios of 0.85 or higher for children versus adults and teen-targeted brands had targeted ratios of 0.60 or higher for teens versus adults in 2017.
These ratios are significantly higher than differences in TV viewing times for children or teens versus adults.

8 Return to contents >
than 70% of sugary drink and snack brands. Highly advertised brands in these categories also represented more than 80% of food-related ads viewed by Hispanic children and teens on Spanish-language TV, as well as approximately 71% of ads viewed by Black children and 76% of ads viewed by Black teens on all TV programming. These categories represented somewhat lower proportions of ads viewed by White children and teens (67% and 74%, respectively)
Trends in some of these categories also raise concerns. In contrast to overall declines in food-related ads viewed from 2013 to 2017, Hispanic children’s exposure to restaurant ads on Spanish-language TV increased by 8%, while restaurant ads viewed by Black children on all TV increased by 30%.
Candy also represented a high proportion of ads viewed by Hispanic and Black youth. Approximately 20% of food-related TV ads viewed by Hispanic children and teens on Spanish-language TV were for candy. Black children and teens saw over 40% more candy ads than White children and teens saw after accounting for differences in TV viewing times. Black youth also saw a disproportionately high number of TV ads for snacks, over 30% more than White youth saw.
On the other hand, brands in some categories were less likely to target Hispanic or Black consumers. Brands in the healthiest product categories (juice, water, nuts, and fruit) combined spent just $195 million in total TV advertising in 2017 (3% of all food-related advertising expenditures). They were even less likely to advertise on Black-targeted TV (representing 1% of advertising spending), and they did not advertise at all on Spanish-language TV. Five of the highly advertised juice brands targeted Black consumers, and one yogurt brand targeted Hispanic consumers. However, no water, fruit, or nut brands targeted either Hispanic or Black consumers.
As a result, Hispanic children and teens saw no ads for juice, water, nuts, or fruit on Spanish-language TV. In addition, 5% or less of all food-related ads viewed by
Black children and teens promoted these healthier categories; and targeted indices for ads viewed by Black versus White youth for these categories were less than 100. Nuts and fruit had the lowest targeted indices for both children and teens (91 and 79, respectively), indicating that Black youth saw even fewer ads for these products than would be expected given differences in TV viewing times.
DISCUSSION
Targeted marketing designed to appeal specifically to Hispanic and Black consumers recognizes their value as customers and provides a significant business opportunity for companies. Although targeted marketing is not problematic in and of itself, the targeting presented in this report continues to raise significant issues for public health.
Food-related companies almost exclusively target advertising for nutritionally poor products to Hispanic and Black consumers, and Hispanic and Black children and teens view large numbers of these ads. The most highly targeted categories – fast-food, candy, sugary drinks, and snacks – consist of products that are high in sugar, fat, sodium, and calories; represent the majority of empty calories in young peoples’ diets; and directly contribute to diet-related diseases, including diabetes, heart disease, and obesity. These same diseases disproportionately affect communities of color. In 2017 as in 2013, food-related marketing continues to disproportionately target youth of color with harmful products and contributes to health disparities affecting their communities.
It is not clear why candy, sugary drink, and fast-food companies – but not companies that primarily sell healthier products such as yogurt, fruit, and nuts – target large amounts of advertising to Hispanic and Black consumers. Similarly, it is unclear why companies with diverse portfolios of healthy and unhealthy brands in multiple categories almost exclusively target Hispanic and Black consumers with ads for their unhealthy brands.
The companies with the most advertising for fast food, sugary drinks, candy, and unhealthy snacks targeted to Hispanic and Black youth publicize their corporate responsibility initiatives to promote nutrition and/or health and wellness. Many of these companies also promote sponsorships and scholarships aimed at communities of color as corporate responsibility initiatives. However, just one company publicly mentioned a health and wellness initiative aimed at Black and/or Hispanic consumers (Nestle promotion of the DrinkUp water campaign). Yet none of Nestle’s water brands had enough advertising spending to qualify as a highly advertised brand.
Executive Summary

9 Return to contents >
Limitations
This research provides an extensive but not exhaustive evaluation of food advertising targeted to Hispanic and Black youth. We examined 32 companies that were responsible for the majority of food-related advertising in 2017, but we did not analyze the hundreds of additional companies with lower levels of advertising spending. In particular, some of these smaller companies appear to advertise extensively on Black-targeted TV, as the companies in our analysis contributed a relatively low proportion of spending on this medium (59%). Furthermore, we analyzed TV advertising only, which represents 72% of food companies’ advertising expenditures. We did not systematically examine targeting that occurred in other forms of marketing, such as digital media, sponsorships, and retail promotions. Finally, we did not conduct a nutritional analysis of products sold by targeted brands. However, previous research has demonstrated the poor nutritional quality of the majority of products in the highly targeted categories, including fast-food, sugary drinks, and snacks.
Recommendations
Since our last report was published in 2015, a growing number of obesity prevention actions at the local and state level have been implemented to counteract unhealthy food and beverage marketing to youth. For example, taxes on sugary drinks, eliminating unhealthy food marketing from schools, and requiring restaurants kids’ meals to include healthier beverages such as milk and water as standard options. These policies are all aimed, at least in part, at offsetting the harmful effects of promoting unhealthy products to youth. If effective, they would benefit all children and teens, including Hispanic and Black youth. However, these measures do not address the unhealthy food marketing directly targeted to youth of color identified in this report.
Executive Summary
Furthermore, key stakeholders within industry, including food and beverage manufacturers, restaurants, grocery retailers, and media companies, must take action to reduce unhealthy marketing that targets and disproportionately impacts Hispanic and Black youth. Despite recent health and wellness initiatives from many of the companies examined, our analyses show that targeted advertising of unhealthy products to Hispanic youth remains high and that advertising to Black youth has disproportionately increased in the past few years. Furthermore, just 3% of all TV food-related advertising spending promoted brands in the healthiest categories (juice, water, nuts, and fruit), and these brands were even less likely to advertise on Spanish-language and Black-targeted TV.
Therefore, we continue to call on food manufacturers to market healthy products to Black and Hispanic consumers and for fast-food, candy, sugary drink, and unhealthy snack food brands to stop disproportionately targeting their advertising in Spanish-language and Black-targeted media. Companies that participate in the CFBAI must address loopholes that allow them to continue to target marketing of unhealthy products to children, including raising the age of children covered by pledges to at least 14 years old and implementing other recommendations from public health experts. These improvements would also have the greatest benefits for Black and Hispanic youth. The CFBAI should also specifically limit targeted marketing of unhealthy products directly to Black and Hispanic children. In addition, media companies should establish nutrition standards for products advertised to youth on their Black- and Hispanic-targeted programming that align with the Dietary Guidelines for Americans.
Public health advocacy campaigns should also focus on improving marketing practices of companies that disproportionately target Hispanic and Black youth, and explore opportunities to engage youth of color in campaigns to address targeted food marketing as a social justice issue.
CONCLUSION
All the companies in our analysis with the highest levels of targeted advertising also have highly publicized corporate responsibility initiatives to promote nutrition, health, and wellness. Companies have not indicated for whom these initiatives are intended, but it does not appear that their corporate investments in health and wellness extend to consumers of color. It is important to ask why. Companies that view advertising of nutritionally poor brands to multicultural consumers as a business opportunity, should weigh that opportunity against the resulting costs to these communities.

10 Return to contents >
In the United States, food
companies almost exclusively
target Black and Hispanic
consumers with marketing for
nutritionally poor products,
including fast food, candy,
sugary drinks, and snacks.1
These product categories also represent the majority of TV food advertisements viewed by Hispanic and Black youth.2, 3 Unhealthy food marketing aimed at children and teens is a significant contributor to poor diets and diet-related diseases worldwide.4, 5 Therefore, greater exposure to this marketing, both in the media and in their communities, likely contributes to or exacerbates diet-related health disparities affecting communities of color, including obesity, diabetes, and heart disease.7, 8
Targeted marketing is defined as the practice of designing marketing programs that appeal specifically to a group of consumers whom a company has identified as especially attractive for its business.8 Companies often refer to “multicultural” marketing, which is designed to appeal to individuals of different racial and/or ethnic
Background
groups (including Black and Hispanic, and more recently Asian consumers).9 Marketing targeted to Black and Hispanic consumers uses culturally relevant themes, depicts people of color purchasing and/or consuming advertised products, and/or is placed in media, programming and other venues that are disproportionately frequented by individuals of color.10 Targeted marketing recognizes the value of these individuals as consumers and aims to attract growing segments of the population, thus presenting a significant business opportunity for corporations.11, 12 Targeted marketing can benefit both consumers and businesses.
However, extensive marketing of products high in sugar, fat, salt, and calories targeted directly to Black and Hispanic consumer, including children and teens, raises significant public health concerns. Targeted marketing that depicts “someone like me” can be more effective with any consumer segment.13-16 In addition, marketing designed to appeal directly to Black and Hispanic consumers may be even more effective as it recognizes the importance of consumers whom advertisers have traditionally ignored.17 Food-related targeted marketing is problematic because it promotes products that can be detrimental to health, and effectively aims this advertising directly to young people and communities of color.
Our previous report extensively documented the companies, brands, and product categories with the most advertising targeted to Hispanic and Black consumers, and measured exposure to these ads by children (2-11 years) and teens (12-17 years). In 2013, a small number of food, beverage, and restaurant companies spent approximately $1 billion to target advertising, almost exclusively for unhealthy products, directly to youth of color. At the time, we called on key industry stakeholders, including food and beverage manufacturers, restaurants, grocery retailers, and media companies, to reduce unhealthy food marketing that targets and disproportionately impacts Hispanic and Black youth.

11 Return to contents >
Background
Spanish-language TV advertising
• All but four of the 26 companies advertised on Spanish-language TV, and they allocated on average 8% of their TV advertising budgets to the medium.
• McDonald’s, Yum! Brands, Kraft Foods, Kellogg, Mars, and Hershey ranked among the top-six food-related advertisers on Spanish-language TV. Mars allocated 24% of its TV advertising budget to Spanish-language TV – more than any other company in this analysis.
Black-targeted TV advertising
• All except one company in the analysis advertised on Black-targeted TV, but most devoted a small proportion of their TV advertising budgets to this medium (2% on average).
• The top-six food companies advertising on Black-targeted TV also included Yum! Brands, Kellogg, Mars, and Hershey, as well as PepsiCo and Wendy’s. Of these top-spending companies, Hershey, Mars, and Wendy’s devoted the highest proportion of their TV advertising spending to this medium.
Targeted brands and categories
• In examining the categories of food-related brands advertising on Spanish-language and Black-targeted TV, restaurants (primarily fast-food), candy, soda and
other sugary drinks, savory snacks, diet soda and drink mixes, and gum and mints were significantly more likely to advertise in targeted media than in other types of TV programming.
• On the other hand, prepared meals, yogurt and other dairy, juice and water, and fruit brands were less likely to advertise in targeted TV programming.
• As a result, fast-food and other restaurants, candy, gum, snack foods, and sugary drinks represented two-thirds of food-related ads viewed by Hispanic youth on Spanish-language TV and two-thirds of all TV ads viewed by Black youth.
• By comparison, just 3% of ads viewed promoted yogurt, other dairy, juice, water, or fruit (i.e., healthier categories).
Youth exposure to TV advertising
• Black children and teens saw 70% more food ads overall compared to White children and teens, including more than twice as many ads for candy and gum and 90% more ads for snacks and sugary drinks.
• Companies with the most brands targeted to youth and to Black and/or Hispanic consumers included Mars (7 candy and gum brands), PepsiCo (5 snack and sugary drink brands), and Coca-Cola (4 sugary drink, diet soda, and drink mix brands).
• In their public statements about targeted marketing, companies often discussed their marketing strategy to appeal to Hispanic consumers, whereas only three companies publicized marketing aimed at Black consumers (Coca-Cola, General Mills, and McDonald’s).
FINDINGS FROM THE PREVIOUS TARGETED MARKETING REPORT
“Food advertising targeted to Hispanic and Black youth: Contributing to health disparities”18 – published by researchers at the UConn Rudd Center, Salud America! and AACORN in 2015 – examined advertising by 26 companies that spent $100 million or more to advertise in all media and/or belonged to the Children’s Food and Beverage Advertising Initiative (CFBAI) in 2013. In total, these companies represented 80% of food-related advertising spending in all media.
These findings confirmed public health concerns about food and beverage marketing targeted to Black and Hispanic consumers, especially children and teens.
12 Return to contents >
Background
Since the first report was published in 2015, all of the companies we identified that spent the most to advertise unhealthy products targeted to Hispanic and Black consumers have publicly announced corporate responsibility initiatives to promote nutrition and/or health and wellness, including Coca-Cola,19 General Mills,20 Hershey,21 Kellogg,22 Kraft Heinz,23 Mars,24 McDonald’s,25 Nestle,26 PepsiCo,27 and Yum! Brands.28 These initiatives often include introducing healthier products to company portfolios, reformulating existing products to reduce sodium or sugar and/or increase whole food content and natural ingredients; and education campaigns to promote calorie balance, active lifestyles, and/or healthier lives.
The majority of these companies also participate in the Children’s Food and Beverage Advertising Initiative (CFBAI) and pledge to advertise only healthier choices in child-directed media. A few companies have made additional pledges to improve children’s health through better nutrition. In February 2018, McDonald’s announced its commitment to support families by improving the nutritional quality of Happy Meals globally. In May 2018, Nestle announced a global commitment to “helping parents provide the right nutrition to their children” by developing healthier products and advice for families on nutrition and exercise through its Nestle for Healthier Kids initiative.29
However, recent company commitments to promote nutrition, health and wellness, and children’s health do not mention improving the nutritional quality of products marketed to communities of color. Therefore, it is important to document the current status of food-related advertising targeted to Hispanic and Black consumers and youth exposure to advertisements, and to examine changes in targeted advertising over the past five years.
This report
We apply the same methods and definitions used in our previous report to identify food-related advertising targeted to Hispanic and Black consumers in 2017, including children (2-11 years) and teens (12-17 years) (see Appendix A for detailed methods). We document food, beverage and restaurant companies that spent more than $100 million in advertising in 2017 and/or participated in the CFBAI food industry self-regulatory program. We also examine changes from 2013, the year examined in our previous report.
Companies do not often publicize their marketing strategies. Therefore, we utilized publicly available information to assess targeted marketing. We use Nielsen syndicated market research data to identify the companies, brands, and product categories with the most advertising spending in targeted media (Spanish-language and Black targeted TV programming), and those investing a high proportion of their TV advertising budgets to targeted TV programming.
We also report exposure to TV advertising by Hispanic and Black youth at the company, brand, and product category levels. We assess targeted advertising to Hispanic children and teens using Nielsen data to measure the number of TV ads viewed on Spanish-language TV. To identify marketing targeted to Black children and teens, we measure relative exposure to advertisements on all TV programming for Black youth compared to White youth, controlling for differences in TV viewing times.
Finally, we collected and reviewed companies’ public statements about their targeted marketing for mentions of programs designed to reach and/or appeal to specific racial and/or ethnic segments of the population.
13 Return to contents >
Background
DEFINITIONS OF TARGETED MARKETING INDICATORS
The analyses in this report utilized Nielsen syndicated data to identify advertising targeted to Hispanic and/or Black consumers, as well as youth-targeted advertising. Analyses were conducted at the company, brand, and/or product category levels.
Targeted marketing data and indicators Definition
Food-related advertising Any paid announcement or persuasive message placed in the mass media by a restaurant, food, or beverage company.30
Children’s Food and Beverage Advertising Initiative (CFBAI)
The voluntary food industry self-regulatory program through which participating companies pledge to only advertise healthier dietary choices in media primarily directed to children under age 12.32
Advertising spendingTotal spending on advertising in 17 different media, including national (network, cable, and syndicated) and local (spot) TV, Spanish- language TV, internet, radio, magazines, newspapers, free standing insert coupons (FSIs), and outdoor advertising, measured by Nielsen.
TV advertising spendingSpending on national (network, cable, and syndicated) and local (spot) TV, and Spanish-language advertising on Spanish cable and broadcast networks.
TV viewing timeAverage time spent watching national and local TV by individuals in a specific age group, including TV programming on broadcast, cable, syndicated and spot TV. Viewing time does not include time spent watching streaming services (e.g., Netflix, Hulu).
Spanish-language TVTV programming presented on Spanish cable and broadcast networks (e.g., Univision, Telemundo). Exposure for Spanish-language TV advertising is calculated based on the number of persons living in Hispanic households as projected by Nielsen.
Black-targeted TV TV networks with an audience consisting of 50% or more black viewers, including BET, VH1, TV1, and BET Her, measured by Nielsen.
Hispanic youth advertising exposureThe average number of TV advertisements viewed by Hispanic children (2-11 years) or teens (12-17 years) on Spanish-language TV programming, measured by Nielsen.
Black youth advertising exposureThe average number of TV advertisements viewed by Black children (2-11 years) or teens (12-17 years) on all TV programming, measured by Nielsen. Advertising exposure for White youth was assessed for comparison.
Criteria used to identify companies and brands for analysis
Food-related companies Companies that spent $100 million or more in total advertising spending in 2017 and/or participated in the CFBAI industry self-regulatory program as of December 2017 were included.
Highly advertised brands Brands from these companies that spent $4.5 million or more in total advertising and $500,000 or more in TV advertising in 2017.
CONTINUES ON PAGE 14

14 Return to contents >
Criteria used to identify targeted advertising
Spanish-language TV advertising allocationA measure of Spanish-language TV advertising spending relative to total TV advertising for a company or brand, calculated by dividing a company/brand’s Spanish-language TV advertising spending by its total TV advertising spending.
Hispanic-targeted brands Highly advertised brands that spent $100,000 or more in advertising on Spanish-language TV.
Black-targeted TV advertising allocationA measure of Black-targeted TV advertising spending relative to total TV advertising for a company or brand, calculated by dividing a company/brand’s Black-targeted TV advertising spending by its total TV advertising spending.
Black to White child/teen targeted index
A measure of disproportionate exposure to TV advertising for Black versus White children or teens, calculated by dividing the ratio of TV ad exposure for Black vs. White children/teens, by the ratio of TV viewing times, multiplied by 100. A targeted index greater than 100 indicates that Black children/teens were more likely to see TV ads for a particular brand/product category compared to White children/teens after accounting for differences in TV viewing (e.g., a targeted index of 150 means that Black children/teens viewed 50% more TV ads compared to White children/teens).
Black-targeted brandsHighly advertised brands that a) spent $500,000 or more to advertise on Black-targeted TV channels or b) spent $100,000 or more on Black-targeted TV and had a disproportionately high targeted index for Black teens relative to White teens (117 or higher) during all TV programming.
Child/teen to adult targeted index
A measure of disproportionate exposure to TV advertising for children or teens versus adults, calculated by dividing the ratio of TV ad exposure for children/teens vs. adults, by the ratio of TV viewing times, multiplied by 100. A targeted index greater than 100 indicates that children/teens were more likely to see TV ads for a particular company/brand compared to adults after accounting for differences in TV viewing (e.g., a targeted index of 150 means children/teens viewed 50% more TV ads compared to adults).
Youth-targeted brandsYouth-targeted brands had a high targeted index of TV ad exposure for children and/or teens relative to adults (after accounting for their lower TV viewing times). Child-targeted brands had targeted indices of 106 or higher for children versus adults. Teen-targeted brands had targeted indices of 111 or higher for teens versus adults.
Background
15 Return to contents >
Results
We present the results for food-
related advertising targeted to
Black and Hispanic consumers
overall in 2017, including
advertising exposure by Black and
Hispanic youth, in four sections:
Changes in food-related advertising: 2013 to 2017 discusses targeted advertising in context of overall changes in advertising by food, beverage, and restaurant companies (i.e., food-related advertising) and TV viewing by youth.
Targeted advertising by company presents individual results for all companies examined to demonstrate corporate investments in targeted advertising. In this section, we also summarize companies’ public statements about targeted marketing.
Targeted advertising for highly advertised brands provides brand-level results for individual highly advertised brands from these same companies. Nearly all targeted marketing occurs at the brand level, and targeting strategies differ widely between brands even within the same company.
Targeted advertising by product category totals the data for highly advertised brands by product category to assess systematic differences in the types of products targeted to Hispanic and Black consumer overall, and to Hispanic and Black youth specifically.
CHANGES IN FOOD-RELATED ADVERTISING: 2013 TO 2017
Total food-related advertising expenditures showed few changes in the past five years. However, exposure to food-related advertising on TV has declined dramatically due to sharp reductions in TV viewing, especially by young people.
Advertising spending
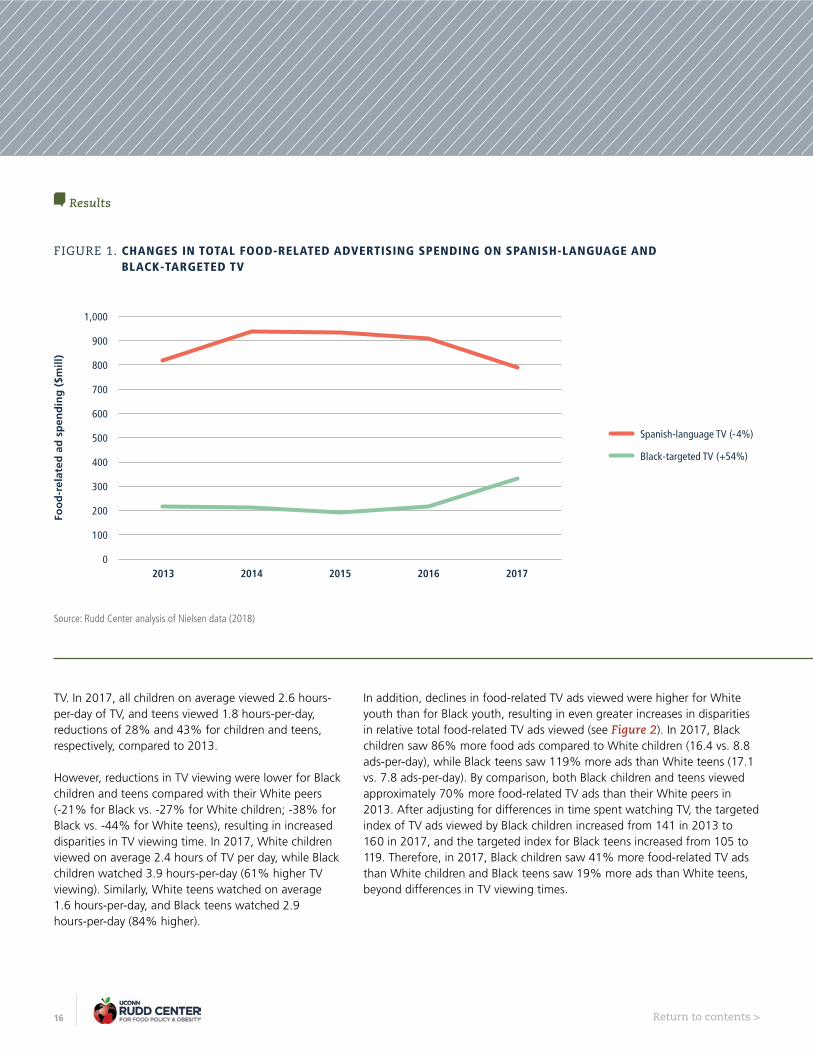
In total, food-related companies spent $13.4 billion to advertise across all media in 2017, a reduction of 7% compared to the $14.4 billion spent in 2013. Food companies continued to devote the majority of this spending to TV advertising. In 2017, food-related companies spent $10.9 billion on TV advertising compared to $11.4 billion in 2013, showing a slight decline (-4%). TV represented a somewhat higher proportion of total advertising spending in 2017 than in 2013 (81% in 2017 vs. 79% in 2013). However, examination of Black- and Hispanic-targeted advertising demonstrates greater changes during this time (see Figure 1). Food companies spent $787 million to advertise on Spanish-language TV (7% of TV advertising spending) and $333 million to advertise on Black-targeted TV (3% of TV ad spending) in 2017. Compared to 2013, ad spending on Spanish-language TV declined slightly, after an increase from 2013 to 2014. On the other hand, ad spending on Black-targeted TV increased by more than 50% from 2013 to 2017 due to a sharp rise in spending from 2016 to 2017 (+57%). In total, targeted TV advertising (Black- and Spanish-language TV combined) increased by 8% from 2013 to 2017, and represented 10% of TV advertising spending in 2017 versus 9% in 2013.
Youth exposure to TV advertising
Despite comparable levels of total food-related TV advertising spending from 2013 to 2017, exposure to food-related TV ads by children and teens changed substantially during the past five years. In 2017, all children (2-11 years) and teens (12-17 years) viewed on average 10.0 and 9.4 food-related TV ads per day, compared to 13.1 and 16.5 ads viewed in 2013 (declines of 23% and 43%, respectively). This reduced exposure to food-related TV ads can be primarily attributed to substantial declines in time spent watching
16 Return to contents >
Source: Rudd Center analysis of Nielsen data (2018)
TV. In 2017, all children on average viewed 2.6 hours-per-day of TV, and teens viewed 1.8 hours-per-day, reductions of 28% and 43% for children and teens, respectively, compared to 2013.
However, reductions in TV viewing were lower for Black children and teens compared with their White peers (-21% for Black vs. -27% for White children; -38% for Black vs. -44% for White teens), resulting in increased disparities in TV viewing time. In 2017, White children viewed on average 2.4 hours of TV per day, while Black children watched 3.9 hours-per-day (61% higher TV viewing). Similarly, White teens watched on average 1.6 hours-per-day, and Black teens watched 2.9 hours-per-day (84% higher).
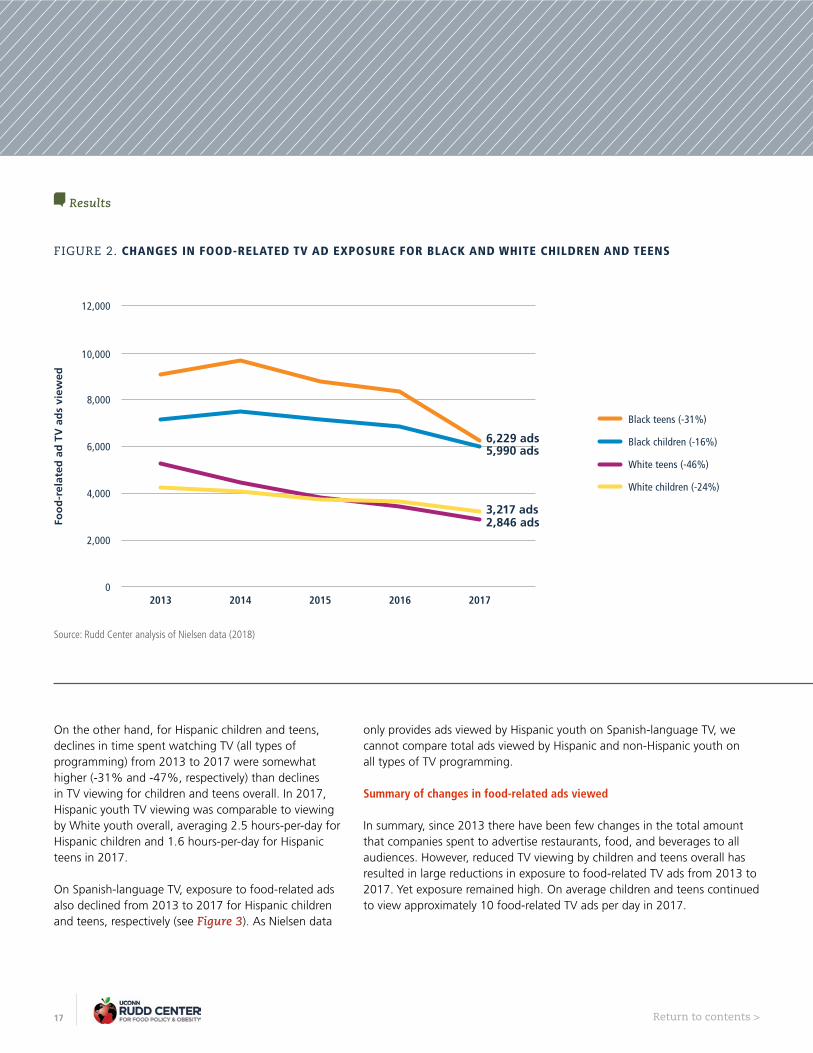
In addition, declines in food-related TV ads viewed were higher for White youth than for Black youth, resulting in even greater increases in disparities in relative total food-related TV ads viewed (see Figure 2). In 2017, Black children saw 86% more food ads compared to White children (16.4 vs. 8.8 ads-per-day), while Black teens saw 119% more ads than White teens (17.1 vs. 7.8 ads-per-day). By comparison, both Black children and teens viewed approximately 70% more food-related TV ads than their White peers in 2013. After adjusting for differences in time spent watching TV, the targeted index of TV ads viewed by Black children increased from 141 in 2013 to 160 in 2017, and the targeted index for Black teens increased from 105 to 119. Therefore, in 2017, Black children saw 41% more food-related TV ads than White children and Black teens saw 19% more ads than White teens, beyond differences in TV viewing times.
FIGURE 1. CHANGES IN TOTAL FOOD-RELATED ADVERTISING SPENDING ON SPANISH-LANGUAGE AND BLACK-TARGETED TV
Foo
d-r
elat
ed a
d s
pen
din
g (
$mill
)
2013 2014 2015 2016 2017
1,000
900
800
700
600
500
400
300
200
100
0
Black-targeted TV (+54%)
Spanish-language TV (-4%)
Results
17 Return to contents >
FIGURE 2. CHANGES IN FOOD-RELATED TV AD EXPOSURE FOR BLACK AND WHITE CHILDREN AND TEENS
Source: Rudd Center analysis of Nielsen data (2018)
On the other hand, for Hispanic children and teens, declines in time spent watching TV (all types of programming) from 2013 to 2017 were somewhat higher (-31% and -47%, respectively) than declines in TV viewing for children and teens overall. In 2017, Hispanic youth TV viewing was comparable to viewing by White youth overall, averaging 2.5 hours-per-day for Hispanic children and 1.6 hours-per-day for Hispanic teens in 2017.
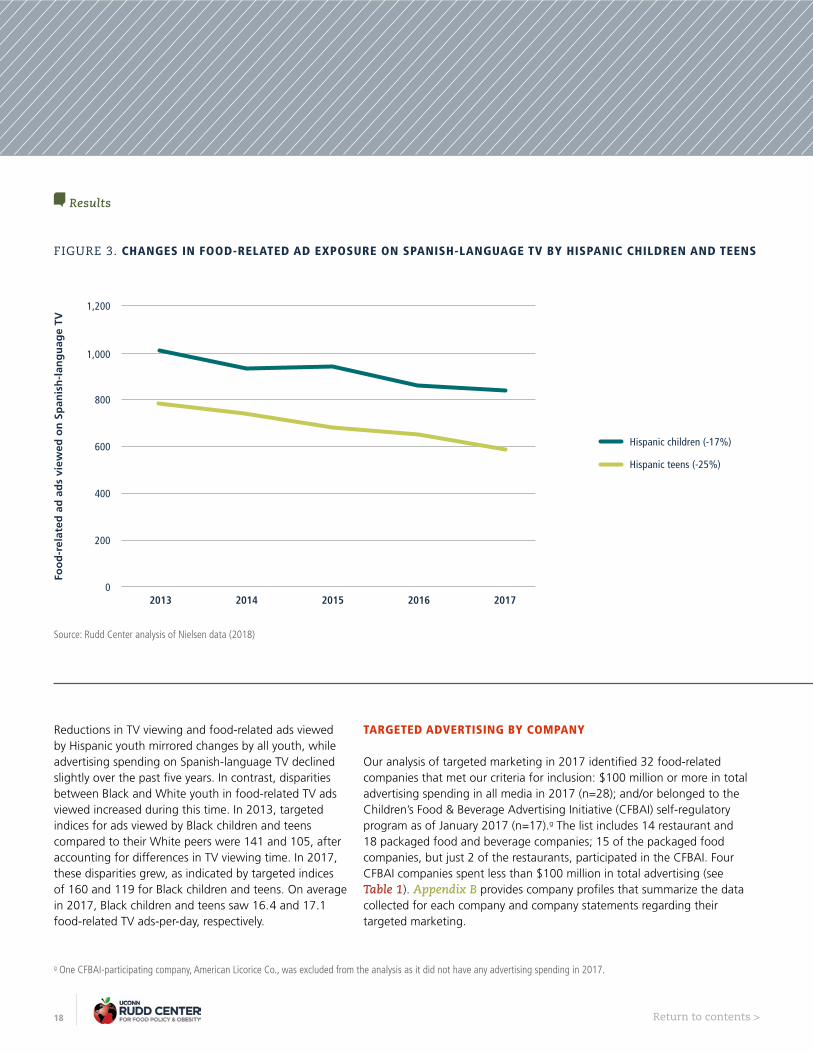
On Spanish-language TV, exposure to food-related ads also declined from 2013 to 2017 for Hispanic children and teens, respectively (see Figure 3). As Nielsen data
only provides ads viewed by Hispanic youth on Spanish-language TV, we cannot compare total ads viewed by Hispanic and non-Hispanic youth on all types of TV programming.
Summary of changes in food-related ads viewed
In summary, since 2013 there have been few changes in the total amount that companies spent to advertise restaurants, food, and beverages to all audiences. However, reduced TV viewing by children and teens overall has resulted in large reductions in exposure to food-related TV ads from 2013 to 2017. Yet exposure remained high. On average children and teens continued to view approximately 10 food-related TV ads per day in 2017.
Results
White teens (-46%)
White children (-24%)
Black teens (-31%)
Black children (-16%)
Foo
d-r
elat
ed a
d T
V a
ds
view
ed
2013 2014 2015 2016
12,000
10,000
8,000
6,000
4,000
2,000
02017
6,229 ads5,990 ads
3,217 ads2,846 ads
18 Return to contents >
Hispanic children (-17%)
Hispanic teens (-25%)
Source: Rudd Center analysis of Nielsen data (2018)
Reductions in TV viewing and food-related ads viewed by Hispanic youth mirrored changes by all youth, while advertising spending on Spanish-language TV declined slightly over the past five years. In contrast, disparities between Black and White youth in food-related TV ads viewed increased during this time. In 2013, targeted indices for ads viewed by Black children and teens compared to their White peers were 141 and 105, after accounting for differences in TV viewing time. In 2017, these disparities grew, as indicated by targeted indices of 160 and 119 for Black children and teens. On average in 2017, Black children and teens saw 16.4 and 17.1 food-related TV ads-per-day, respectively.
TARGETED ADVERTISING BY COMPANY
Our analysis of targeted marketing in 2017 identified 32 food-related companies that met our criteria for inclusion: $100 million or more in total advertising spending in all media in 2017 (n=28); and/or belonged to the Children’s Food & Beverage Advertising Initiative (CFBAI) self-regulatory program as of January 2017 (n=17).g The list includes 14 restaurant and 18 packaged food and beverage companies; 15 of the packaged food companies, but just 2 of the restaurants, participated in the CFBAI. Four CFBAI companies spent less than $100 million in total advertising (see Table 1). Appendix B provides company profiles that summarize the data collected for each company and company statements regarding their targeted marketing.
g One CFBAI-participating company, American Licorice Co., was excluded from the analysis as it did not have any advertising spending in 2017.
FIGURE 3. CHANGES IN FOOD-RELATED AD EXPOSURE ON SPANISH-LANGUAGE TV BY HISPANIC CHILDREN AND TEENS
Results
Foo
d-r
elat
ed a
d a
ds
view
ed o
n S
pan
ish
-lan
gu
age
TV
2013 2014 2015 2016
1,200
1,000
800
600
400
200
02017

19 Return to contents >
The business case for targeted marketing
Companies are responsible to their investors to grow sales and profits. To do so, leading companies appeal to an increasingly diverse base of consumers through their marketing. Marketing experts encourage businesses to invest in “multicultural” marketing to take advantage of demographic trends in the United States.23, 33 For example, Asian and Hispanic populations are the fastest growing racial groups, while the non-Hispanic White population is projected to become the minority by 2045.34 As a result, the buying power of Asian- and Hispanic-Americans is also growing at faster rates. Moreover, the costs of ethnic media are more efficient than general market media. Furthermore, marketers view African-Americans as trendsetters who younger consumers want to emulate.35
Companies’ statements regarding targeted marketing commonly focused on targeted marketing as good for business. Several companies highlighted their interest in attracting multicultural consumers, including McDonald’s, Coca-Cola, Nestle, Wendy’s, Campbell, and Popeyes. These companies typically mentioned Hispanic and Black consumers in their discussion of multicultural consumers, while Coca-Cola and Campbell also specified Asian consumers. Both Wendy’s and Popeyes also discussed appealing to younger multicultural consumers. In addition, many companies described marketing specifically to Hispanic consumers, including fast-food and other restaurants (Domino’s, Dine Brands, Darden, Papa John’s and Popeyes), candy companies (Hershey and Nestle), and packaged goods companies (Unilever and Post) and Wonderful (fruit and nuts). Hershey specifically mentioned Latina millennials and young moms as a target audience, while Nestle noted a focus on bicultural Hispanic households. On the other hand, only Mars mentioned targeting Black consumers as a business opportunity. McDonald’s and Nestle also noted the importance of diversity and inclusion for their workforce.
* Companies that participate in the CFBAI pledge to advertise only healthier dietary choices in child-
directed media.
Source: Rudd Center analysis of Nielsen data (2018)
TABLE 1. COMPANIES IN OUR ANALYSIS
Results
Company
Total advertising spending in 2017 ($mill)
CFBAI participant*
Included in 2013 report
Restaurants
Yum! Brands (Taco Bell, KFC, Pizza Hut) $765.9 p
McDonald's $744.4 p p
Doctor's Associates (Subway) $387.4 p
Roark Capital Group (Arby's, Carl's Jr., Hardee's, Jimmy John's, Wingstop)
$352.9 p
3G Capital (Burger King) $320.6 p p
Domino's Pizza $319.3
Wendy's $260.4 p
Sonic $232.2 p
Dine Brands (Applebee's Neighborhood Bar & Grill, IHOP) $208.9 p
Darden (Olive Garden) $173.7 p
Little Caesars Enterprises $166.3
Papa John's Pizza $155.4
Popeyes Louisiana Kitchen $139.1
Berkshire Hathaway (Dairy Queen, DQ Grill & Chill) $113.9
Food and beverage companies
PepsiCo $718.4 p p
Coca-Cola $561.7 p p
Kraft Heinz $514.7 p p
General Mills $468.8 p p
Hershey $468.4 p p
Mars $421.1 p p
Kellogg $345.5 p p
Nestle $270.2 p p
Unilever $230.5 p p
Dr. Pepper Snapple Group $209.7 p
Campbell $157.1 p p
Mondelez International $144.0 p p
Tyson Foods $117.0 p
The Wonderful Company $107.2
Ferrero USA $64.3 p p
ConAgra Brands $62.0 p p
Dannon $49.6 p p
Post Consumer Brands $49.1 p p
20 Return to contents >
Company statements often focused on culturally relevant marketing as a way to appeal to multicultural consumers. Examples include targeted websites and sponsorships. McDonald’s maintains websites for Hispanic, Asian, and Black consumers, while Unilever and Papa John’s both discussed their Hispanic-targeted websites. Pepsi described using its National Basketball Association (NBA) sponsorship to appeal to multicultural consumers, while Coca-Cola mentioned sponsorships aimed at Black consumers. However, the most common instances of culturally relevant targeting focused on developing “bold” and “ethnic” product flavors, cited by ten of the companies in our analysis. For example, PepsiCo, Coca-Cola, and Nestle discussed new product flavors to appeal to multicultural youth; Dr. Pepper Snapple Group described colorful, fun, and festive flavors to appeal to Hispanic consumers; and General Mills announced new bold and ethnic flavors for Gen Z.
Company statements also described their corporate responsibility initiatives to benefit Hispanic and Black populations. McDonald’s, Coca-Cola, General Mills, Kellogg, and Tyson all offered scholarships to Hispanic and/or Black youth. In addition, McDonald’s, PepsiCo, Hershey, Coca-Cola, and Papa John’s supported Hispanic and/or Black cultural or community events. We only identified two mentions of food-related corporate responsibility initiatives aimed at low-income and/or communities of color, including Nestle’s support of the Drink Up campaign to promote water consumption by low-income youth of color and Tyson’s support of food banks. New this year were several statements about diversity and inclusion in marketing efforts. For example, Mars pledged that it would not promote stereotypes or ridicule in its advertising; Burger King promised customer diversity and inclusion in its advertising; and Nestle promised no discriminatory or offensive content in its ads.
Advertising spending by company
The 32 companies in our analysis spent $9.3 billion in total advertising and $7.9 billion in TV advertising in 2017. These companies spent $693 million in Spanish-language TV advertising and $198 million on Black-targeted TV advertising, totaling approximately 11% of their TV advertising budgets. All companies that met the criteria for inclusion in 2013 also met the criteria in 2017. In addition, five restaurant companies and one packaged food company spent more than $100 million in total advertising in 2017 that had not met the cut-off in 2013. Appendix Table C1 presents detailed advertising spending and exposure numbers for the companies analyzed.
On average in 2017, the 32 companies in this analysis devoted 8.8% of their TV ad spending budgets to Spanish-language TV, which was considerably higher than the 5.8% allocated to Spanish-language TV by all food-related companies. On the other hand, the companies in our analysis allocated on average 2.5% of their TV advertising budget to Black-targeted TV, which was somewhat lower than the 3.1% allocation for all food-related companies. These companies were responsible for 69% of all food-related advertising spending and 72% of TV advertising spending in 2017, but a lower proportion of black-targeted TV spending (59%) and a much higher proportion of Spanish-language TV ad spending (88%).
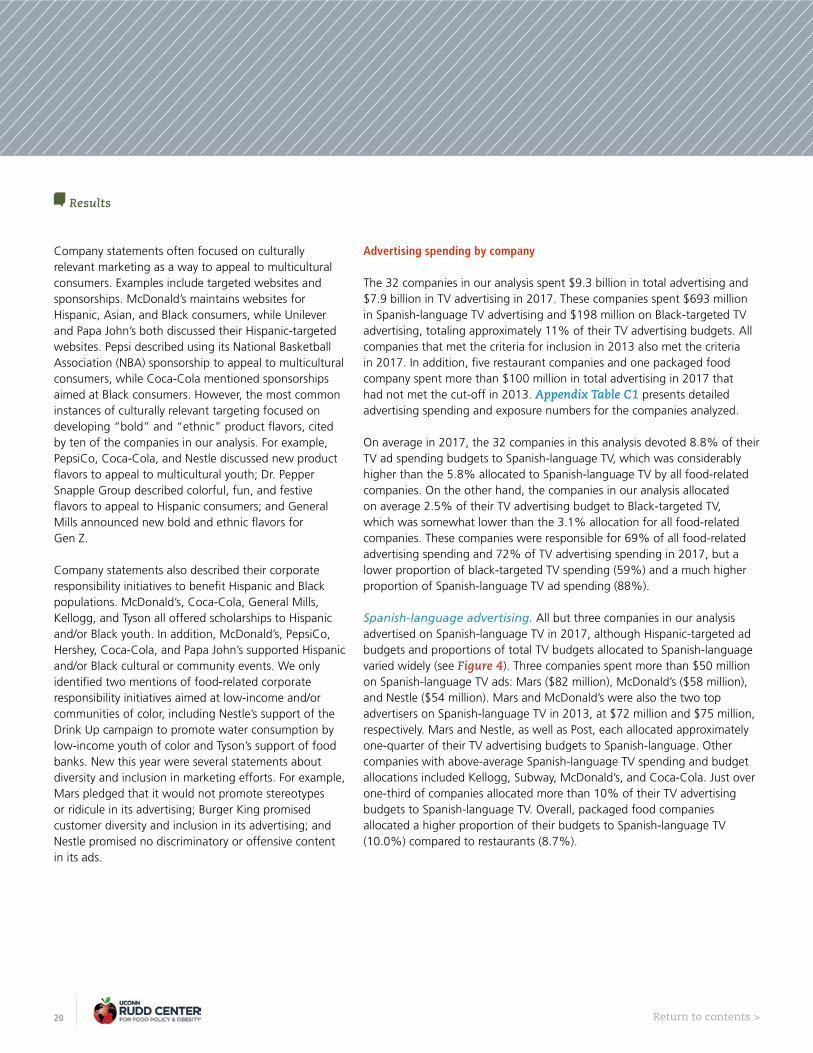
Spanish-language advertising. All but three companies in our analysis advertised on Spanish-language TV in 2017, although Hispanic-targeted ad budgets and proportions of total TV budgets allocated to Spanish-language varied widely (see Figure 4). Three companies spent more than $50 million on Spanish-language TV ads: Mars ($82 million), McDonald’s ($58 million), and Nestle ($54 million). Mars and McDonald’s were also the two top advertisers on Spanish-language TV in 2013, at $72 million and $75 million, respectively. Mars and Nestle, as well as Post, each allocated approximately one-quarter of their TV advertising budgets to Spanish-language. Other companies with above-average Spanish-language TV spending and budget allocations included Kellogg, Subway, McDonald’s, and Coca-Cola. Just over one-third of companies allocated more than 10% of their TV advertising budgets to Spanish-language TV. Overall, packaged food companies allocated a higher proportion of their budgets to Spanish-language TV (10.0%) compared to restaurants (8.7%).
Results
21 Return to contents >
As with total food-related Spanish-language advertising spending, spending by the 32 companies in our analysis declined slightly from 2013 to 2017 (-8%). However, changes in Spanish-language advertising varied greatly by company (see Figure 5). Spending increased for four
of the five top Spanish-language advertisers: Coca-Cola and Nestle more than doubled their Spanish-language advertising spending, and spending by Subway and Mars also increased. Spanish-language advertising spending declined for all other packaged food companies and for McDonald’s, while spending by all other fast-food restaurants combined increased by 25%.
Results
FIGURE 4. COMPANY INVESTMENTS IN SPANISH-LANGUAGE ADVERTISING
% o
f to
tal T
V a
d s
pen
din
g
Spanish-language TV ad spending
Source: Rudd Center analysis of Nielsen data (2018)

22 Return to contents >
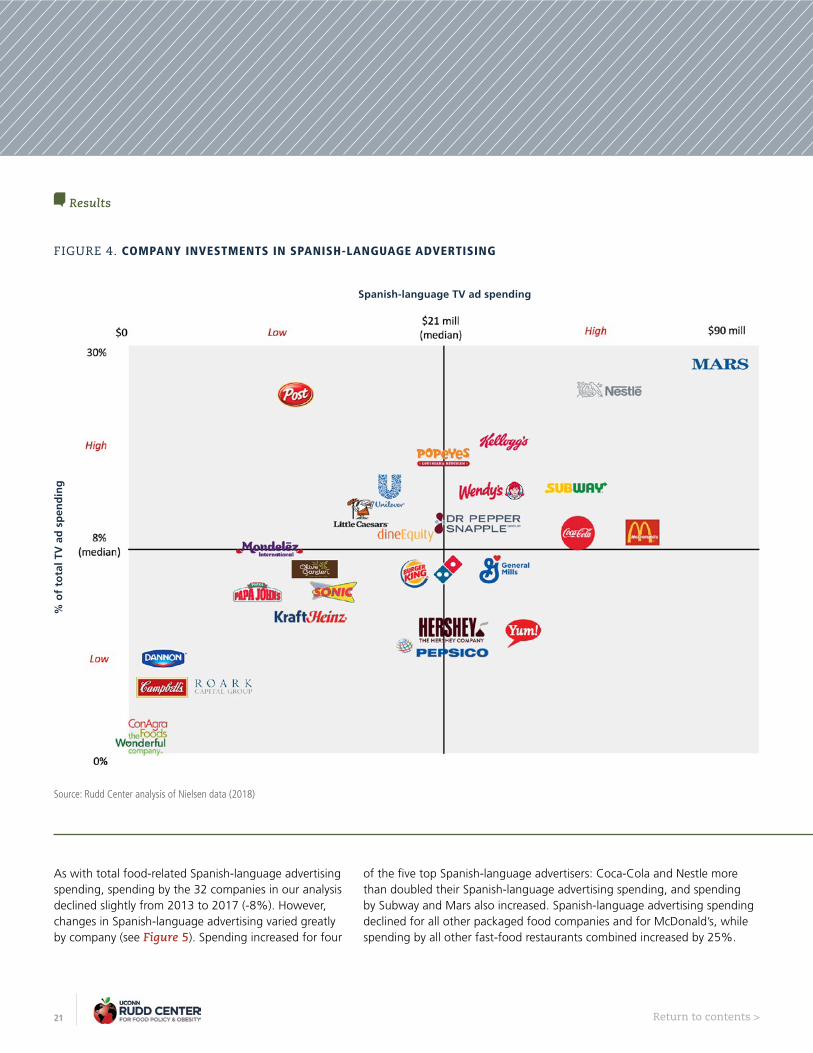
Black-targeted TV advertising. All companies analyzed had some advertising on Black-targeted TV (see Figure 6). As in 2013, PepsiCo and Yum! Brands remained top advertisers on Black-targeted TV at $23 million and $21 million, respectively, followed by Hershey at $19 million. Although Black-targeted TV ad budgets tended to be relatively low, three companies spent more to advertise on Black-targeted TV than on Spanish-language TV: PepsiCo, Roark Capital Group (fast-food chains), and
ConAgra Brands. There was wide variability in the amount of advertising spending on Black-targeted TV, but less variability in the proportions of TV ad budgets devoted to the medium. Almost one-third of companies (n=11) devoted more than 3% of their ad budgets to Black-targeted TV, led by Hershey (4.2%), Domino’s Pizza (3.9%), and PepsiCo (3.9%). Mars, Wendy’s, Burger King, and Unilever also had above-average Black-targeted TV spending and budget allocations. Overall, the restaurant and packaged goods companies allocated a similar proportion of their total advertising budgets to Black-targeted TV (2.4% and 2.2%, respectively).
FIGURE 5. CHANGE IN TOTAL FOOD-RELATED AD SPENDING ON SPANISH-LANGUAGE TV
Results
Span
ish
-lan
gu
age
TV s
pen
din
g (
$mill
)
900
0
800
700
600
500
400
300
200
100
2013 2017
-40%
+25%
+17%
-23%
+110%
+126%
+56%
Subway
Coca-Cola
Nestle
McDonald’s
Mars
All other packaged food companies
All other restaurants
Source: Rudd Center analysis of Nielsen data (2018)
23 Return to contents >
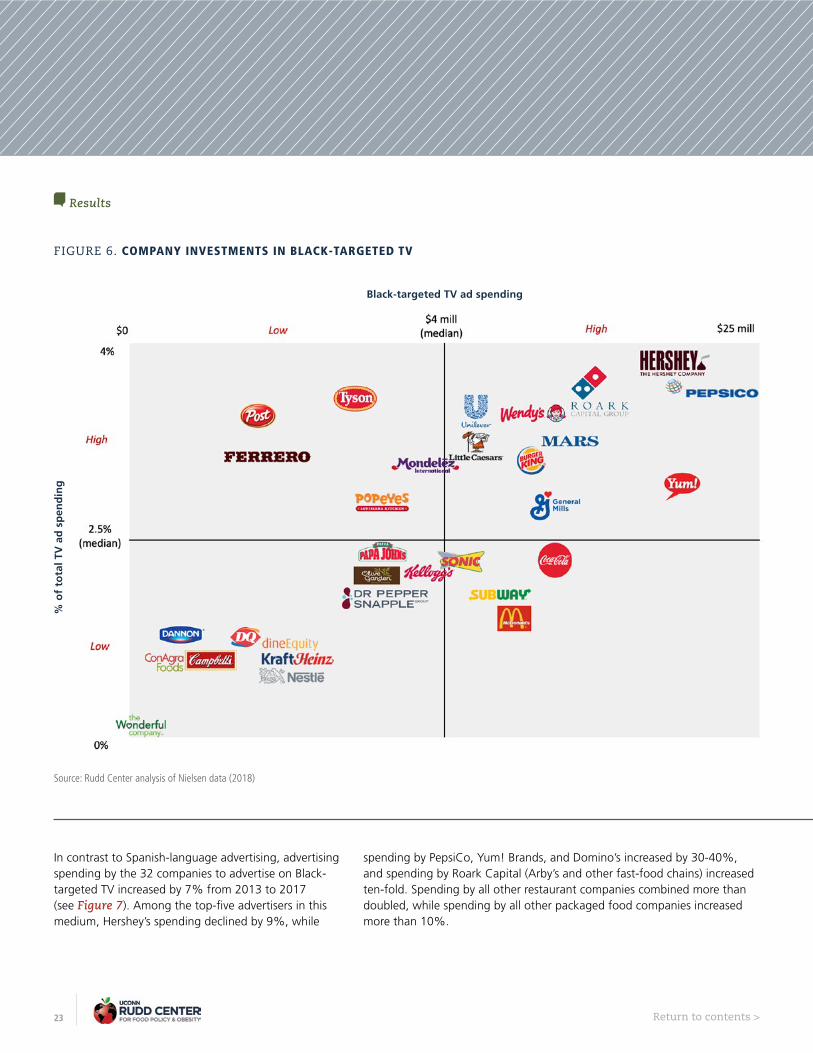
In contrast to Spanish-language advertising, advertising spending by the 32 companies to advertise on Black-targeted TV increased by 7% from 2013 to 2017 (see Figure 7). Among the top-five advertisers in this medium, Hershey’s spending declined by 9%, while
spending by PepsiCo, Yum! Brands, and Domino’s increased by 30-40%, and spending by Roark Capital (Arby’s and other fast-food chains) increased ten-fold. Spending by all other restaurant companies combined more than doubled, while spending by all other packaged food companies increased more than 10%.
FIGURE 6. COMPANY INVESTMENTS IN BLACK-TARGETED TV
% o
f to
tal T
V a
d s
pen
din
g
Black-targeted TV ad spending
Results
Source: Rudd Center analysis of Nielsen data (2018)
24 Return to contents >
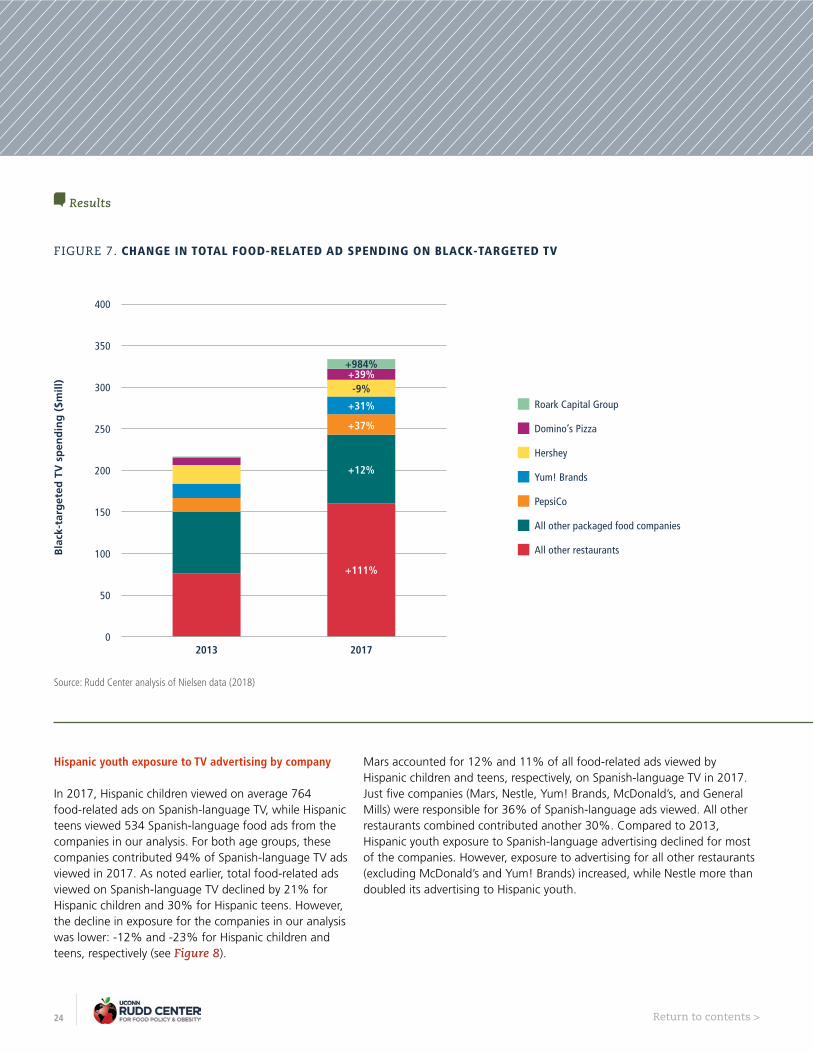
FIGURE 7. CHANGE IN TOTAL FOOD-RELATED AD SPENDING ON BLACK-TARGETED TV
Results
Roark Capital Group
Domino’s Pizza
Hershey
Yum! Brands
PepsiCo
All other packaged food companies
All other restaurantsBla
ck-t
arg
eted
TV
sp
end
ing
($m
ill)
0
400
350
300
250
200
150
100
50
2013 2017
+12%
+111%
+37%
+31%
-9%+39%
+984%
Source: Rudd Center analysis of Nielsen data (2018)
Hispanic youth exposure to TV advertising by company
In 2017, Hispanic children viewed on average 764 food-related ads on Spanish-language TV, while Hispanic teens viewed 534 Spanish-language food ads from the companies in our analysis. For both age groups, these companies contributed 94% of Spanish-language TV ads viewed in 2017. As noted earlier, total food-related ads viewed on Spanish-language TV declined by 21% for Hispanic children and 30% for Hispanic teens. However, the decline in exposure for the companies in our analysis was lower: -12% and -23% for Hispanic children and teens, respectively (see Figure 8).
Mars accounted for 12% and 11% of all food-related ads viewed by Hispanic children and teens, respectively, on Spanish-language TV in 2017. Just five companies (Mars, Nestle, Yum! Brands, McDonald’s, and General Mills) were responsible for 36% of Spanish-language ads viewed. All other restaurants combined contributed another 30%. Compared to 2013, Hispanic youth exposure to Spanish-language advertising declined for most of the companies. However, exposure to advertising for all other restaurants (excluding McDonald’s and Yum! Brands) increased, while Nestle more than doubled its advertising to Hispanic youth.

25 Return to contents >
FIGURE 8. CHANGES IN HISPANIC YOUTH EXPOSURE TO ADVERTISING ON SPANISH-LANGUAGE TV BY COMPANY
Results
All other restaurants
All other packaged food companies
General Mills
McDonald’s
Yum! Brands
Nestle
Mars
All other sugary drink, candy and snack food companies
Ad
s vi
ewed
on
Sp
anis
h-l
ang
uag
e TV
0
800
700
600
500
400
300
200
100
1,000
900
2013 20132017
-9%
+30%
-41%
-61%-36%
-13%
+150%
-24%
2017
-23%
+15%
-48%
-62%-43%-23%
+145%
-39%
Hispanic children (2-11 years) Hispanic teens (12-17 years)
Source: Rudd Center analysis of Nielsen data (2018)
Black youth exposure to TV advertising by company
Across all TV programming in 2017, Black children viewed on average 12.3 ads per day from the companies in this analysis, representing 75% of all food ads viewed. Black teens viewed 13.6 ads daily (79%) from the companies in our analysis. These numbers were approximately double the 6.4 and 6.1 food-related ads viewed per day for White children and teens, respectively, from these same companies. Resulting
targeted indices of ads viewed by Black youth versus White youth (after controlling for differences in TV viewing times) averaged 118 for children and 120 for teens for the companies in this analysis.
Figures 9 and 10 illustrate the disparities in ads viewed by Black compared with White youth in 2017 by company and changes in ads viewed in 2017 versus 2013. Five companies (Kraft Heinz, General Mills, Hershey, PepsiCo, and Yum! Brands) were responsible for 31% of all food-related TV ads viewed by Black children and 32% of ads viewed by Black teens in 2017 from the companies in this analysis.
872 ads
764 ads (-12%)
695 ads
534 ads (-23%)

26 Return to contents >
FIGURE 9. BLACK AND WHITE CHILDREN’S EXPOSURE TO ADVERTISING ON ALL TV PROGRAMMING BY COMPANY
Results
Ad
s vi
ewed
on
all
TV
0
6,000
5,000
4,000
3,000
2,000
1,000
Black children (2-11 years)
Black children (2-11 years)
White children (2-11 years)
2013 2017
-70%-29%+34%+5%
-25%
+38%
-10% 124
118
111
124137143
106
106
134
117
109
122139142
104
102
All other restaurants
All other packaged food companies
Yum! Brands
PepsiCo
Hershey
General Mills
Kraft Heinz
All other sugary drink, candy and snack food companies
* Targeted indices are listed in the callout boxes. A targeted index greater than 100 indicates that Black children were more likely to see TV ads for a specific company/product
category compared to White children controlling for differences in TV viewing.
Source: Rudd Center analysis of Nielsen data (2018)
5,225 ads
Compared to White children, Black children saw more than twice as many ads for more than one-third of the companies in this analysis (n=12) and had disproportionately high targeted indices for many companies, including Mars (targeted index =155), Hershey (143), PepsiCo and Unilever (137), and Ferrero, Mondelez, Wendy’s, Roark Capital, and Papa John’s (130). Among teens, Mars also had the highest targeted index (174), followed by Hershey and PepsiCo (136). For teens, McDonald’s also had a high targeted index (136), while Unilever, Kellogg, and Mondelez had targeted indices of 130 for Black versus White teens. These high targeted indices indicate that Black youth were
disproportionately more likely to view ads for these companies’ products than White youth, after controlling for differences in TV viewing times.
On the other hand, Kraft Heinz and General Mills had average or below average targeted indices for Black children and teens, indicating that differences in TV viewing times explained the majority of the differences in ads for their products viewed by Black versus White youth.
Despite the overall decline in ads viewed by Black children and teens from 2013 to 2017, a few companies increased their advertising to Black youth during this time. Exposure to ads for Kraft Heinz, PepisCo, and Yum! Brands increased for Black children, while Black teens saw additional ads for Kraft Heinz. Disparities in ad exposure between Black and White teens
2,348 ads
4,494 ads (-14%)
+72%

27 Return to contents >
Results
FIGURE 10. BLACK AND WHITE TEENS’ EXPOSURE TO ADVERTISING ON ALL TV PROGRAMMING BY COMPANY
All other restaurants
All other packaged food companies
Yum! Brands
PepsiCo
Hershey
General Mills
Kraft Heinz
All other sugary drink, candy and snack food companies
Ad
s vi
ewed
on
all
TV
0
6,000
5,000
4,000
3,000
2,000
1,000
Black teens (12-17 years)
Black teens (12-17 years)
White teens (12-17 years)
2013 2017
-61%
-46%
-5%
-29%
-38%
+1%
-30% 120
114
120
114
136
136
114120
113
100
102
102
114
111
102
95
7,000
8,000
* Targeted indices are listed in the callout boxes. A targeted index greater than 100 indicates that Black teens were more likely to see TV ads for a specific company/product
category compared to White teens controlling for differences in TV viewing.
Source: Rudd Center analysis of Nielsen data (2018)
also widened during this time. Black teens viewed 25% more ads each for Kraft Heinz and Hershey, and 22% more ads for PepsiCo, compared to White teens (after accounting for differences in TV viewing).
Summary of targeted advertising by company
As in 2013, food-related advertising was highly concentrated among a few companies. The 32
companies in our analysis spent almost $8 billion in TV advertising in 2017, which represented 72% of all food advertising. Their budgets included almost $900 million in targeted advertising on Spanish-language and Black-targeted TV. On average, these companies allocated 9% of their TV advertising budgets to Spanish-language TV and 2.5% to Black-targeted TV.
A few companies were notable for high spending on targeted TV programs and/or allocating a high proportion of their budgets to targeted TV. On Spanish-language TV, Mars, McDonald’s, Nestle, Coca-Cola, and Subway
6,821 ads
2,243 ads
4,947 ads (-27%)
+9%

28 Return to contents >
Results
each spent more than $45 million in advertising, while Mars and Nestle allocated approximately one-quarter of their budgets to Spanish-language TV. Furthermore, despite the 4% decline in spending on Spanish-language TV from 2013 to 2017, Coca-Cola and Nestle more than doubled their spending during this time.
As in 2013, Mars, Nestle, and McDonald’s ranked in the top-five companies with the most ads viewed by Hispanic children and teens on Spanish-language TV, while Yum! Brands and General Mills replaced Coca-Cola and Subway in 2017. From 2013 to 2017, despite declines in total food ads viewed on Spanish-language TV, Hispanic youth exposure to Nestle products more than doubled, and advertising for restaurants in total also increased.
On Black-targeted TV, PepsiCo, Yum! Brands, and Hershey each spent more than $19 million. Hershey, PepsiCo, and Domino’s allocated the highest proportion (approximately 4%) of their TV advertising budgets to Black-targeted TV. Nearly all companies in this analysis increased their spending on Black-targeted TV from 2013 to 2017, including increases of more than 30% for PepsiCo, Yum! Brands, and Domino’s, and a ten-fold increase by Roark Capital Group (owner of Arby’s and other fast-food restaurant chains). Hershey was the only large advertiser to decrease its Black-targeted spending.
Despite an overall decline in exposure to food-related TV ads for Black children and teens, Black youth exposure to ads for some companies increased. Black children saw more ads for Kraft Heinz, PepsiCo, Yum! Brands, and other restaurants (combined) in 2017 than they saw in 2013, while Black teens saw more ads for Kraft Heinz and other restaurants.
Furthermore, disparities in ads viewed by Black versus White youth after controlling for differences in TV viewing times also increased. Black and teen targeted indices were highest for Hershey, PepsiCo, and Yum! Brands, indicating that Black youth were disproportionately more likely to view ads for these
companies than White youth, after controlling for differences in TV viewing times. On the other hand, Kraft Heinz and General Mills had average or below average targeted indices for Black children and teens, indicating that differences in TV viewing times explained the majority of the differences in ads for their products viewed by Black versus White youth.
TARGETED ADVERTISING BY HIGHLY ADVERTISED BRANDS
The company-level analyses demonstrate wide-ranging levels of corporate investment in advertising targeted to Hispanic and Black consumers. However, nearly all targeted marketing occurs at the brand level, and targeting strategies differ widely between brands, even within the same company. As in 2013, the fast-food and other restaurants in our analysis targeted most of their brands to both Hispanic and Black consumers, while packaged food and drink companies appeared to target just a subset of their brands to Hispanic and/or Black consumers. In addition, most companies aimed their advertising for different brands at different age groups (children, teens, and parents or adults).
The 32 companies in this analysis owned 236 different brands with at least $4.5 million in total advertising spending and at least $500,000 in TV advertising in 2017 (i.e., highly advertised brands). Of these brands, 58% qualified as Black-targeted (n=136); 36% qualified as Hispanic-targeted (n=85); and 28% (n=66) targeted both audiences; while 34% (n=81) did not appear to target either Black or Hispanic audiences. Appendix Tables C2-4 provide detailed information about Black-targeted, Hispanic-targeted, and all other brands.
Youth-targeted brands
Just 33 of the highly advertised brands (14%) appeared to target children or teens with their TV advertising as evidenced by disproportionately high numbers of ads viewed by youth compared with adults. However, there was high overlap between youth-targeted, Hispanic-targeted, and Black-targeted brands (see Figure 11).
Consistent with findings from 2013, youth-targeted brands also were more likely to target Black consumers: 55% of youth-targeted brands compared with 26% of other brands. An additional 30% of youth-targeted brands targeted both Black and Hispanic audiences, but none of these brands only targeted Hispanic consumers. Just 15% of youth-targeted brands did not target either Black or Hispanic audiences, compared to 37% of other brands. About one-third of youth-targeted brands (36%; n=12) offered
29 Return to contents >
Results
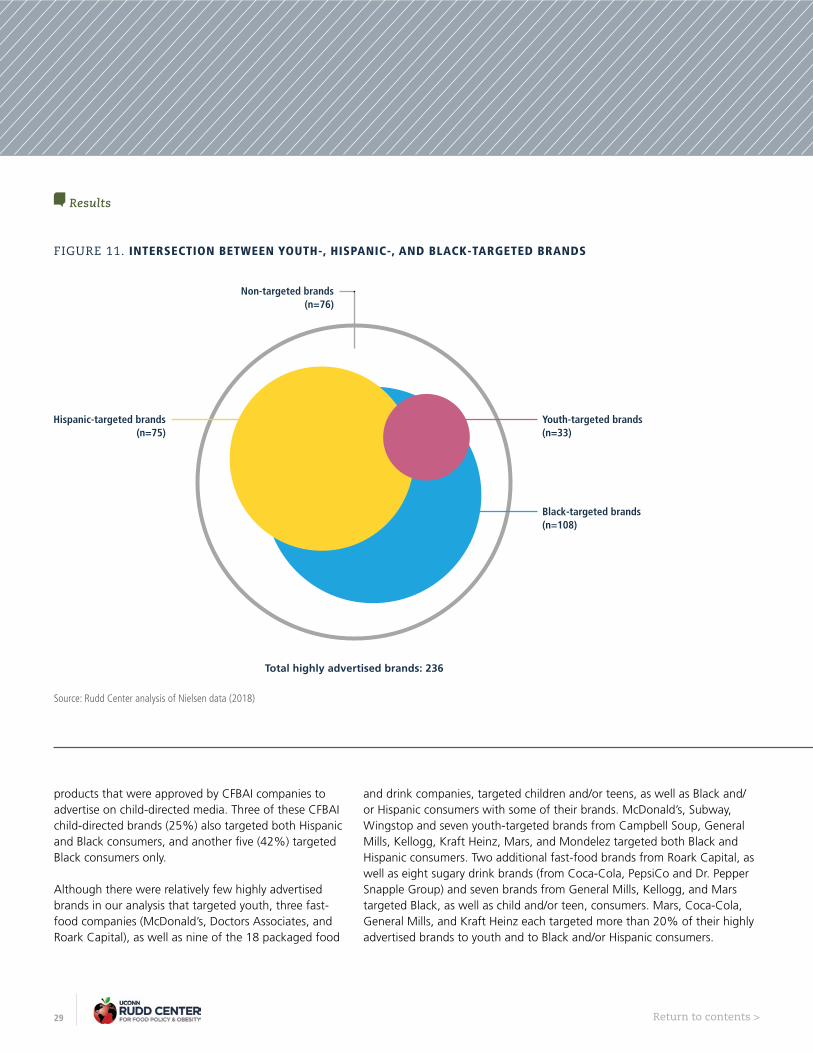
FIGURE 11. INTERSECTION BETWEEN YOUTH-, HISPANIC-, AND BLACK-TARGETED BRANDS
Total highly advertised brands: 236
Non-targeted brands (n=76)
Youth-targeted brands (n=33)
Black-targeted brands (n=108)
Hispanic-targeted brands (n=75)
Source: Rudd Center analysis of Nielsen data (2018)
products that were approved by CFBAI companies to advertise on child-directed media. Three of these CFBAI child-directed brands (25%) also targeted both Hispanic and Black consumers, and another five (42%) targeted Black consumers only.
Although there were relatively few highly advertised brands in our analysis that targeted youth, three fast-food companies (McDonald’s, Doctors Associates, and Roark Capital), as well as nine of the 18 packaged food
and drink companies, targeted children and/or teens, as well as Black and/or Hispanic consumers with some of their brands. McDonald’s, Subway, Wingstop and seven youth-targeted brands from Campbell Soup, General Mills, Kellogg, Kraft Heinz, Mars, and Mondelez targeted both Black and Hispanic consumers. Two additional fast-food brands from Roark Capital, as well as eight sugary drink brands (from Coca-Cola, PepsiCo and Dr. Pepper Snapple Group) and seven brands from General Mills, Kellogg, and Mars targeted Black, as well as child and/or teen, consumers. Mars, Coca-Cola, General Mills, and Kraft Heinz each targeted more than 20% of their highly advertised brands to youth and to Black and/or Hispanic consumers.

30 Return to contents >
Results
YOUTH-TARGETED BRANDS BY COMPANY
Nine packaged food and drink companies and three restaurants had brands that targeted children and/or teens as well as Hispanic and/or Black consumers. All child-directed brands were offered by CFBAI participating companies that pledged to only advertise healthier dietary choices in child-directed media.
Brands targeting Hispanic and/or Black consumers Brands targeting children and/or teens
Company Total # of brands
(% targeted)
Hispanic-targeted brands # (% of
total)*
Black-targeted brands # (% of
total)*
Brands targeting both # (% of total)*
Youth- targeted brands #
(% of total
Youth-targeted brands also targeting Hispanic (H) and/or Black (B) consumers
Campbell 7 (20%) 0 0 1 (14%) 1 (14%)Pepperidge Farm Goldfish Crackers (H,B)
Coca-Cola 16 (63%) 2 (13%) 6 (38%) 2 (13%) 4 (25%)
Glaceau Vitaminwater (B)Powerade Ion4 (B) Sprite (B)Sprite Cranberry (B)
Doctor’s Associates 1 (100%) 0 0 1 (100%) 1 (100%) Subway (H, B)
Dr. Pepper Snapple Group 6 (67%) 1 (17%) 3 (50%) 0 1 (17%) Snapple Iced Tea (B)
General Mills 23 (57%) 1 (4%) 10 (43%) 2 (9%) 5 (22%)
Big G Cereals (H,B)Cinnamon Toast Crunch (B)Lucky Charms (B)Totino’s Pizza Rolls (B)Yoplait Go-Gurt (B)
Kellogg 12 (42%) 3 (25%) 1 (8%) 1 (8%) 2 (17%)Frosted Flakes (B)Pop-Tarts (H,B)
Kraft Heinz 24 (8%) 1 (4%) 0 (0%) 1 (4%) 5 (21%) Capri Sun fruit drinks (H,B)
Mars 14 (100%) 0 6 (43%) 8 (57%) 4 (29%)
5 Chewing Gum (B)Starburst (B)Skittles (H,B)Wrigley’s Juicy Fruit (H,B)
McDonald’s 1 (100%) 0 1 (100%) 1 (100%) McDonald’s (H,B)
Mondelez International 9 (78%) 0 2 (22%) 5 (56%) 1 (11%) Sour Patch Kids (H,B)
PepsiCo 30 (73%) 0 22 (73%) 4 (13%) 5 (17%)
Gatorade Flow (B)Mountain Dew Diet (B)Mountain Dew Kickstart (B)Quaker Oats Oatmeal (B)
Roark Capital Group 5 (80%) 1 (20%) 2 (40%) 1 (20%) 3 (60%)Arby’s (B)Jimmy John’s (B) Wingstop (H,B)
*Mutually exclusive categories
Bold: child-targeted brand
Source: Rudd Center analysis of Nielsen data (2018)

31 Return to contents >
Results
Targeted brands by company
Brand targeting strategies differed between restaurant and packaged food and drink companies in our analysis (see Figure 12). Approximately three-quarters of the 22 highly advertised restaurant brands targeted both Hispanic and Black consumers, and another 18% targeted just one of these segments. Fewer than 10% of restaurant brands did not target either Hispanic or Black consumers.
In contrast, 37% of highly advertised packaged food and drink brands did not target either Black or Hispanic
consumers. Approximately one-third (31%) of packaged food and drink brands targeted Black, but not Hispanic consumers, 24% targeted both Hispanic and Black consumers, and 8% targeted Hispanic consumers only.
In comparing the number of targeted brands offered by different packaged good companies, 100% of highly advertised brands from two candy companies (Mars and Hershey’s) and Unilever targeted Black and/or Hispanic consumers, as well as 86% of PepsiCo brands and 78% of Mondelez brands. Wonderful was the only company in our analysis that did not have any Black- or Hispanic-targeted brands. Other companies with a low proportion of targeted brands included Kraft Heinz (2 out of 24 brands) and ConAgra Brands (1 out of 4 brands).
40%
80%
70%
60%
50%
30%
20%
10%
100%
90%
FIGURE 12. PROPORTION OF HIGHLY ADVERTISED BRANDS TARGETED TO BLACK AND/OR HISPANIC CONSUMERS
Not targeted
Targeted to both
Hispanic-targeted
Black-targeted
Source: Rudd Center analysis of Nielsen data (2018)
% o
f b
ran
ds
0%Restaurant
brandsYouth-targeted
brandsPackaged food
and drink brandsOther brands
n=3
n=17
n=1
n=66
n=18
n=52
n=19
n=56
n=76
n=10
n=49
n=80
n=18
n=5
n=1
32 Return to contents >
Results
Summary of targeted brands
Overall, seven companies stood out as having the most targeted brands with more than 10 brands per company: PepsiCo (n=26), Hershey (n=20), Mars (n=14), General Mills (n=13), Unilever (n=11), Coca-Cola (n=10), and Nestle (n=10). Notably, out of the 32 companies in this analysis, Nestle targeted the most brands to Hispanic consumers only (n=7), PepsiCo targeted the most brands to Black consumers only (n=22), and Hershey targeted the most brands to both Black and Hispanic consumers (n=17).
Brands with the highest spending on Spanish-language TV included three fast-food brands: McDonald’s ($58 million, 10% of TV spending), Subway ($47 million, 13%), and Wendy’s ($30 million, 13%); as well as Coca-Cola Classic ($38 million, 20%). Four of the top brands devoted 40% or more of their TV ad budgets to Spanish-language: General Mills’ Big G Cereals (46%), Kellogg’s Pop Tarts (43%), Extra Gum (42%), and Kellogg’s Special K (40%). Two of the top Hispanic-targeted fast-food brands (McDonald’s and Subway) and three of the top packaged food brands (Big G Cereals, Pop Tarts, and Skittles) also targeted children and/or teens with their advertising.
Three fast-food restaurant brands – Taco Bell, Domino’s, and Burger King – spent the most to advertise on Black-targeted TV, ranging from $10 million to $13 million. Lipton Iced Tea, Reese’s Peanut Butter Cups, and Lay’s Potato Chips were the top-three advertisers among packaged food and beverage brands, with spending ranging from $3 million to $4 million. Four of the top brands allocated 10% or more of their TV advertising budget to Black-targeted TV, including Lipton Iced Tea (topping the list at 20%), Jolly Ranchers candy, Lay’s Potato Chips, and Sprite.
Black children saw the most ads for McDonald’s and Burger King on all types of TV programming, while Black teens saw the most ads for Burger King and Taco Bell. However, packaged food and drink brands ranked among the top-10 brands with the highest relative exposure to ads for Black versus White youth. Six brands had targeted indices higher than 160: Jolly Ranchers (201), Lay’s Potato Chips and Lay’s Poppables (185), Sprite (185), Ice Breakers (174), and Starburst (168). Therefore, Black teens saw significantly more ads for these products than can be explained by their differences in TV viewing compared to White teens, meaning companies placed these ads during TV programming with a higher proportion of Black teens in the audience. Four of the top Black-targeted restaurant brands and three of the top packaged food and drink brands also targeted children and/or teens with their advertising.
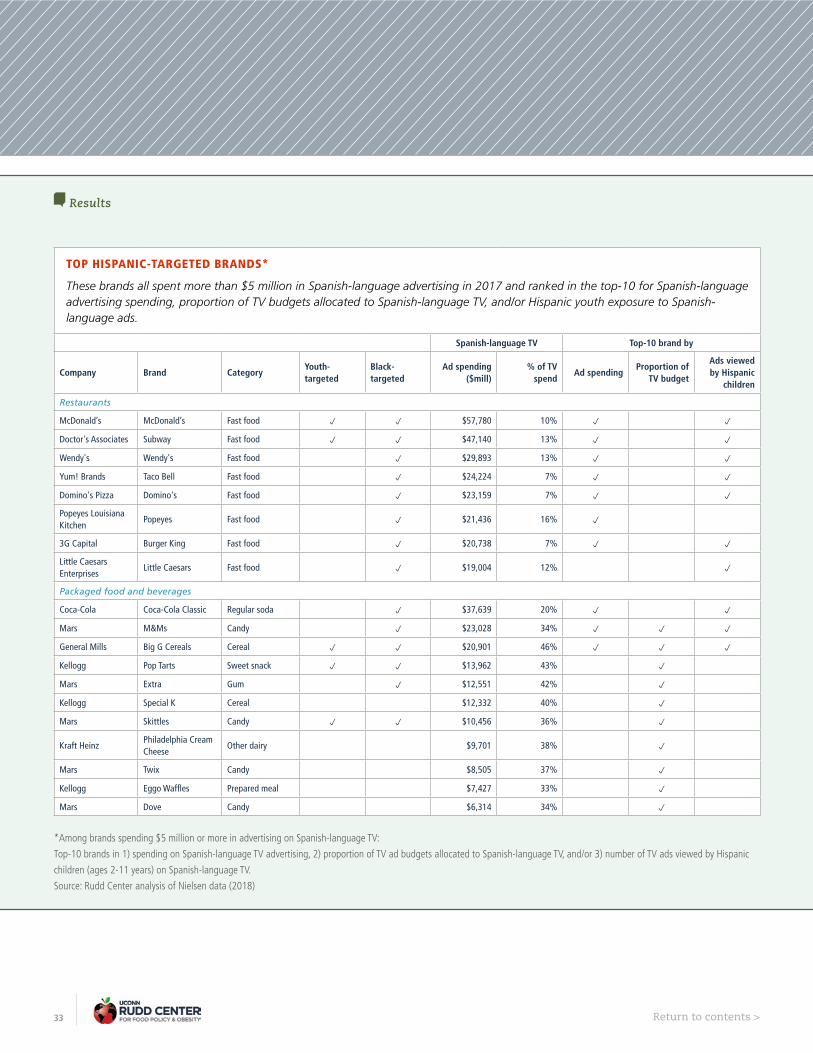
33 Return to contents >
Results
*Among brands spending $5 million or more in advertising on Spanish-language TV:
Top-10 brands in 1) spending on Spanish-language TV advertising, 2) proportion of TV ad budgets allocated to Spanish-language TV, and/or 3) number of TV ads viewed by Hispanic
children (ages 2-11 years) on Spanish-language TV.
Source: Rudd Center analysis of Nielsen data (2018)
TOP HISPANIC-TARGETED BRANDS*
These brands all spent more than $5 million in Spanish-language advertising in 2017 and ranked in the top-10 for Spanish-language advertising spending, proportion of TV budgets allocated to Spanish-language TV, and/or Hispanic youth exposure to Spanish-language ads.
Spanish-language TV Top-10 brand by
Company Brand CategoryYouth-targeted
Black-targeted
Ad spending ($mill)
% of TV spend
Ad spendingProportion of
TV budget
Ads viewed by Hispanic
children
Restaurants
McDonald’s McDonald’s Fast food p p $57,780 10% p p
Doctor's Associates Subway Fast food p p $47,140 13% p p
Wendy's Wendy's Fast food p $29,893 13% p p
Yum! Brands Taco Bell Fast food p $24,224 7% p p
Domino's Pizza Domino's Fast food p $23,159 7% p p
Popeyes Louisiana Kitchen
Popeyes Fast food p $21,436 16% p
3G Capital Burger King Fast food p $20,738 7% p p
Little Caesars Enterprises
Little Caesars Fast food p $19,004 12% p
Packaged food and beverages
Coca-Cola Coca-Cola Classic Regular soda p $37,639 20% p p
Mars M&Ms Candy p $23,028 34% p p p
General Mills Big G Cereals Cereal p p $20,901 46% p p p
Kellogg Pop Tarts Sweet snack p p $13,962 43% p
Mars Extra Gum p $12,551 42% p
Kellogg Special K Cereal $12,332 40% p
Mars Skittles Candy p p $10,456 36% p
Kraft Heinz Philadelphia Cream Cheese
Other dairy $9,701 38% p
Mars Twix Candy $8,505 37% p
Kellogg Eggo Waffles Prepared meal $7,427 33% p
Mars Dove Candy $6,314 34% p

34 Return to contents >
Results
TOP BLACK-TARGETED BRANDS**
These brands all spent more than $1 million in Black-targeted TV advertising in 2017 and ranked in the top-10 for Black-targeted TV spending, proportion of TV budgets allocated to Black-targeted TV, and/or targeted ratios of Black versus White youth exposure to their ads.
Black-targeted TV Top-10 brand by
Company Brand CategoryYouth-targeted
Hispanic-targeted
Ad spending ($mill)
% of TV spend
Black:White teen ratio
Ad spending
Proportion of TV
budget
Black: White teen
ratio
Restaurants
Yum! Brands Taco Bell Fast food p $12,835 4% 2.24 p
Domino's Pizza Domino's Fast food p $12,027 4% 2.22 p
3G Capital Burger King Fast food p $9,564 3% 2.17 p
Wendy's Wendy's Fast food p $8,426 4% 2.20 p
Roark Capital Group Arby's Fast food p $8,004 5% 2.28 p
McDonald’s McDonald’s Fast food p p $7,421 1% 2.47 p
Yum! Brands Pizza Hut Fast food p $5,421 3% 1.99 p
Little Caesars Enterprises
Little Caesars Fast food p $5,147 3% 1.94 p
Doctor's Associates Subway Fast food p p $5,145 1% 2.27 p
Sonic Sonic Fast food p $4,520 2% 2.12 p
Yum! Brands KFC Fast food p $3,083 2% 1.90
Roark Capital Group Wingstop Fast food p p $1,555 8% 2.34 p
Packaged food and beverages
Unilever Lipton Iced Tea Sugary drink $4,004 20% 2.32 p
PepsiCo Lay's Potato Chips Savory snack p $2,768 11% 3.39 p p
Coca-Cola Sprite Regular soda p $2,109 10% 3.40 p p
PepsiCo Doritos Savory snack $2,102 7% 2.90 p
Hershey Jolly Rancher Candy p $1,562 16% 3.70 p p
Hershey Ice Breakers Breath Mints Mints p $1,411 9% 3.23 p
PepsiCo Cheetos Savory snack p $1,381 5% 2.60 p
PepsiCo Lay's Poppables Potato Chips Savory snack $1,379 12% 3.38 p p
Unilever Pure Leaf Iced Tea Sugary drink $1,274 9% 2.69 p p
Mars Skittles Candy p p $1,107 4% 2.96 p
Mars Starburst Candy p $1,088 9% 3.05 p p
PepsiCo Tostitos Scoops! Tortilla Chips Savory snack $1,014 8% 2.88 p p
**Among brands spending $1.0 million or more in advertising on Black-targeted TV:
Top-10 brands in spending on advertising on Black-targeted TV channels, proportion of TV advertising budgets allocated to Black-targeted TV, and/or greater relative exposure to
TV ads by Black versus White teens (ages 12-17 years).
Source: Rudd Center analysis of Nielsen data (2018)

35 Return to contents >
Results
TARGETED ADVERTISING BY PRODUCT CATEGORY
Our final section provides an overview of the categories of products disproportionately advertised to Black and Hispanic consumers. For this analysis, we assigned the highly advertised brands to product categories (see Table 2). Due to low numbers of brands and ease of discussion, we combined some individual product categories into broader categories. We then conducted analyses of advertising spending and Black and Hispanic youth exposure to TV advertising by category.
As noted earlier, two-thirds of highly advertised brands (66%) targeted TV advertising to Black and/or Hispanic consumers. However, as in 2013, there continued to be wide variation in the proportion of targeted brands by product category. Categories that were significantly more likely to target Black and/or Hispanic audiences included the least nutritious product categories (restaurants, candy, savory snacks, sweet snacks and desserts, and sugary drinks), as well as diet soda and gum and mints (see Figure 13). Three-quarters or more of restaurant and gum/mint brands targeted both Hispanic and Black consumers, while 67% of candy brands targeted both groups.
On the other hand, six categories were significantly less likely to target Hispanic and/or Black audiences, including the healthiest product categories (see Figure 14). Approximately one-half of prepared meals, cereal, and yogurt and other dairy brands did not target these audiences. In addition, 6 of 10 juice and water brands were not targeted, and there were no brands of nuts or fruit targeted to Hispanic or Black consumers.
Advertising spending by category
Total TV advertising spending also varied widely by category. Of the $7.6 billion in total TV advertising spending by highly advertised brands, restaurants represented 52% at $4 billion (see Figure 15). Candy, gum and mints, and sugary drinks each represented 10% of total TV spending. Cereal and healthier categories (nuts, juice, water, fruit, and yogurt and other dairy) were advertised the least, representing
TABLE 2. HIGHLY ADVERTISED BRANDS* BY PRODUCT CATEGORY
Combined category Category# of highly advertised
brands*
Fast-food and other restaurants Fast-food restaurants 19
Other restaurants 3
Candy, gum and mintsCandy 27
Gum and mints 8
Cereal Cereal 15
SnacksSavory snacks 18
Sweet snacks and desserts 23
Sugary drinksRegular soda 10
Other sugary drinks 18
Diet soda Diet soda 5
Prepared meals Prepared meals 29
Yogurt and other dairyYogurt 7
Other dairy 4
Healthier products
Juice and water 12
Fruit** 2
Nuts 2
Condiments and other
Condiments and food preparation 20
Other (coffee, processed meat, poultry, baby food)
14
*Brands with >$4.5 million in total advertising spending and >$500,000 in TV advertising in 2017
**There were no highly advertised vegetable brands
5% or less of total TV advertising spending. In 2017, sugary drinks became the second most highly advertised food-related product category.
Proportions of spending on Spanish-language and Black-targeted TV advertising by category were similar to total TV advertising, with some exceptions. As on TV in total, restaurants (primarily fast-food) represented about one-half of spending on Spanish-language and Black-targeted TV ads. Sugary drinks also represented 10% of spending in total and on both Spanish-language and Black-targeted TV. Candy, gum, and mints was the second most advertised category on Spanish-language and Black-targeted TV (consistent with total TV advertising), but the category accounted for a larger percentage of targeted TV spending – 17% of Spanish-language TV and 15% of Black-targeted TV (vs. 10% of TV overall).
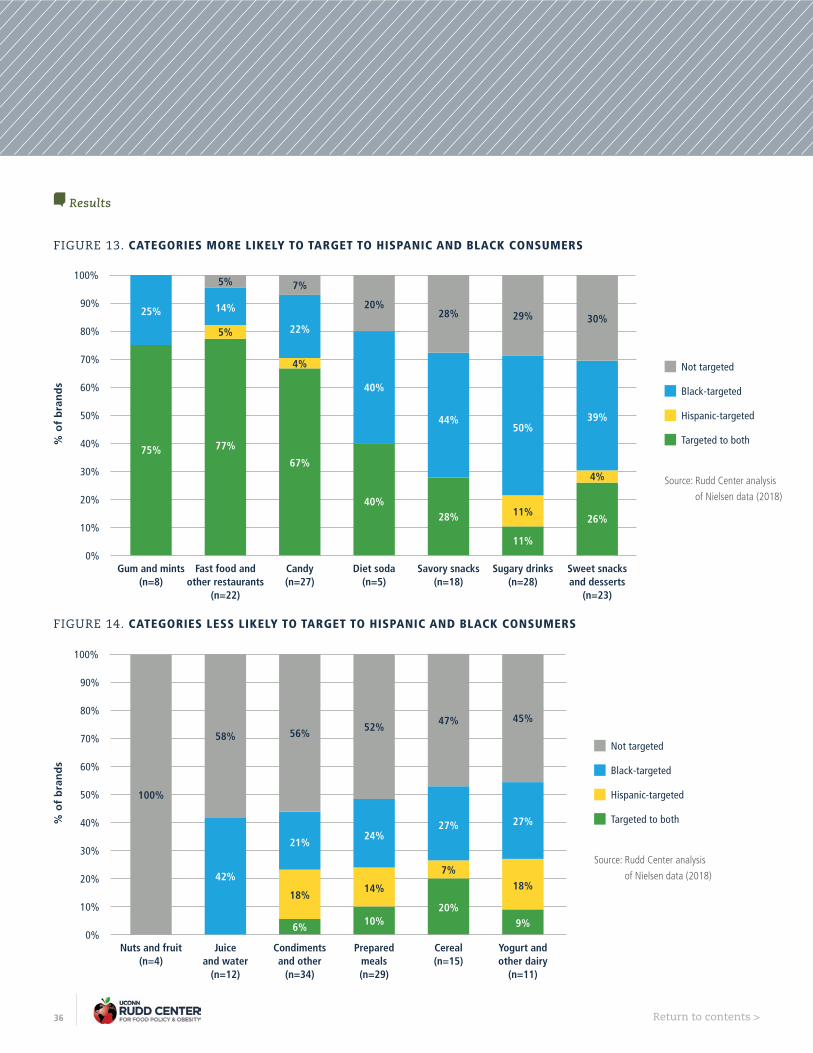
36 Return to contents >
Results
Not targeted
Black-targeted
Hispanic-targeted
Targeted to both
Source: Rudd Center analysis
of Nielsen data (2018)
FIGURE 13. CATEGORIES MORE LIKELY TO TARGET TO HISPANIC AND BLACK CONSUMERS
% o
f b
ran
ds
0%
80%
70%
60%
50%
40%
30%
20%
10%
100%
90%
Gum and mints (n=8)
25%
Fast food and other restaurants
(n=22)
Candy (n=27)
Diet soda (n=5)
Savory snacks (n=18)
Sugary drinks (n=28)
Sweet snacks and desserts
(n=23)
75%
5%
14%
77%
7%
22%
67%
20%
40%
40%
28%
44%
28%
29%
50%
11%
30%
39%
26%
5%
4%
11%
4%
% o
f b
ran
ds
0%
80%
70%
60%
50%
40%
30%
20%
10%
100%
90%
Nuts and fruit (n=4)
Juice and water
(n=12)
Condiments and other
(n=34)
Prepared meals (n=29)
Cereal (n=15)
Yogurt and other dairy
(n=11)
100%
58% 56%
21%
18%
52%
14%
10%
45%
27%
9%
24%
18%
20%
7%
27%
47%
42%
FIGURE 14. CATEGORIES LESS LIKELY TO TARGET TO HISPANIC AND BLACK CONSUMERS
Not targeted
Black-targeted
Hispanic-targeted
Targeted to both
Source: Rudd Center analysis
of Nielsen data (2018)
6%

37 Return to contents >
Results
FIGURE 15. PROPORTION OF TV ADVERTISING SPENDING BY CATEGORY*
Source: Rudd Center analysis of Nielsen data (2018)* Analysis of advertising spending by the 236 highly advertised brands included in this analysis
Advertising spending on Black-targeted TV: $195 million
Fast food & other restaurants
50%
Snacks 11%
Soda & other sugary drinks
10%
Candy/gum/mints 15%
All Other 6%
Prepared meals 3%
Cereal 4%
Nuts/juice/water/fruit 1%
Yogurt/other dairy 1%
Diet soda 1%
Food prep/condiments
3%
All other 1%
Advertising spending on Spanish-language TV: $644 million
All other <1%
Yogurt/other dairy 3%
Fast food & other restaurants
49%
Soda & other sugary drinks
10%
Snacks 6%
Candy/gum/mints 17%
All Other 7%
Cereal 7%
Prepared meals 4%
Nuts/juice/water/fruit <1%
Diet soda 1%
Food prep/condiments
3%
Total TV advertising spending: $7.6 billion
Prepared meals 5%
Fast food & other restaurants
52%
Soda & other sugary drinks
10%
Cereal 5%
Candy/gum/mints 10%
All Other 8%
Nuts/juice/water/fruit 3%
Yogurt/other dairy 2%
Diet soda 2%
Food prep/condiments
3%
All other 1%
Snacks 7%

38 Return to contents >
Cereal advertising accounted for a somewhat higher proportion of advertising spending on Spanish-language TV (7% vs. 5% on total TV), while snack foods represented a higher proportion of spending on Black-targeted TV (11% vs. 7% on total TV).
Although healthier product categories contributed 5% of all TV advertising spending, some represented an even lower proportion of Spanish-language and Black-targeted TV ad spending. Yogurt and other dairy represented 3% of Spanish-language TV spending, 2% of total spending, and 1% of Black-targeted spending. Advertising for nuts, fruit, juice, and water combined represented 3% of total TV spending, 1% of Black-targeted, and less than 1% of Spanish-language spending.
Results
From 2013 to 2017, there were few changes in the top food-related categories with targeted advertising. On Spanish-language and Black-targeted TV, restaurants and candy, gum, and mints were advertised the most both years, while snacks and sugary drinks ranked third or fourth. However, on Spanish-language TV, spending on sugary drinks exceeded spending on snacks in 2017, but not in 2013.
Hispanic and Black youth exposure to targeted TV advertising by product category
Similar to advertising spending on Spanish-language TV, Hispanic youth continued to view Spanish-language TV ads for primarily nutritionally poor food. In 2017, almost one-half of ads viewed by Hispanic children and teens on Spanish-language TV from the highly advertised brands in this analysis promoted restaurants, while an additional 35% promoted candy, gum and mints, snacks, and sugary drinks (see Figure 16). In contrast, only 3% of ads viewed promoted more nutritious categories, including nuts, yogurt, other dairy, juice, water, or fruit.
FIGURE 16. HISPANIC YOUTH EXPOSURE TO ADS ON SPANISH-LANGUAGE TV BY CATEGORY
Fast-food and other restaurants
Candy, gum, and mints
Snacks and sugary drinks
Prepared meals, condiments, and other
Cereal
Nuts, fruit, juice, water, yogurt, and other dairy
All other
Source: Rudd Center analysis of Nielsen data (2018)
Ad
s vi
ewed
on
Sp
anis
h-l
ang
uag
e TV
in 2
017
0
800
700
600
500
400
300
200
100
Hispanic children (2-11 years) Hispanic teens (12-17 years)
319
126
15
53
51
223
85
80
3734
238
166
694 ads (-20%)
481 ads (-31%)
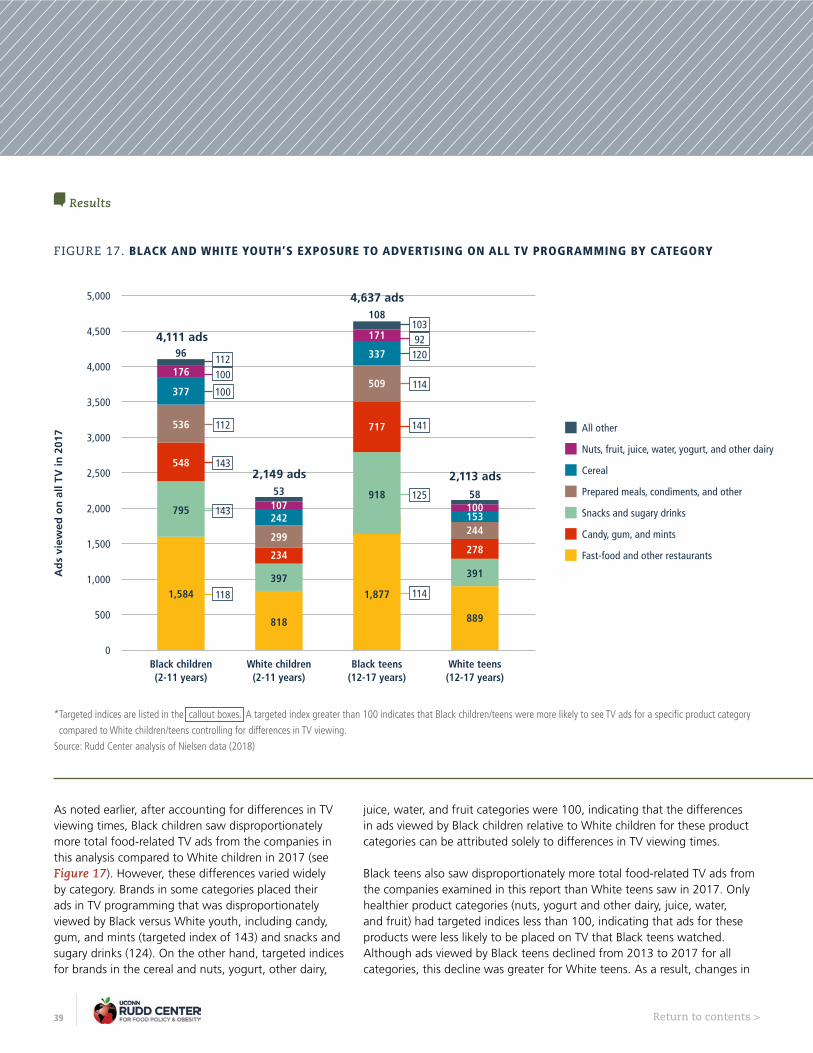
39 Return to contents >
Results
FIGURE 17. BLACK AND WHITE YOUTH’S EXPOSURE TO ADVERTISING ON ALL TV PROGRAMMING BY CATEGORY
* Targeted indices are listed in the callout boxes. A targeted index greater than 100 indicates that Black children/teens were more likely to see TV ads for a specific product category
compared to White children/teens controlling for differences in TV viewing.
Source: Rudd Center analysis of Nielsen data (2018)
As noted earlier, after accounting for differences in TV viewing times, Black children saw disproportionately more total food-related TV ads from the companies in this analysis compared to White children in 2017 (see Figure 17). However, these differences varied widely by category. Brands in some categories placed their ads in TV programming that was disproportionately viewed by Black versus White youth, including candy, gum, and mints (targeted index of 143) and snacks and sugary drinks (124). On the other hand, targeted indices for brands in the cereal and nuts, yogurt, other dairy,
juice, water, and fruit categories were 100, indicating that the differences in ads viewed by Black children relative to White children for these product categories can be attributed solely to differences in TV viewing times.
Black teens also saw disproportionately more total food-related TV ads from the companies examined in this report than White teens saw in 2017. Only healthier product categories (nuts, yogurt and other dairy, juice, water, and fruit) had targeted indices less than 100, indicating that ads for these products were less likely to be placed on TV that Black teens watched. Although ads viewed by Black teens declined from 2013 to 2017 for all categories, this decline was greater for White teens. As a result, changes in
Fast-food and other restaurants
Candy, gum, and mints
Snacks and sugary drinks
Prepared meals, condiments, and other
Cereal
Nuts, fruit, juice, water, yogurt, and other dairy
All other
Ad
s vi
ewed
on
all
TV in
201
7
4,000
3,500
3,000
2,500
2,000
1,500
1,000
500
Black children (2-11 years)
1,584
4,500
5,000
White children (2-11 years)
Black teens (12-17 years)
White teens (12-17 years)
143
118
143
112
100
100112
125
114
141
114
12092103
795
548
536
377
176
818
397
234
299
242
1,877
918
717
509
337
171
889
391
278
244153
96
10753
108
10058
4,111 ads
4,637 ads
2,149 ads 2,113 ads
0
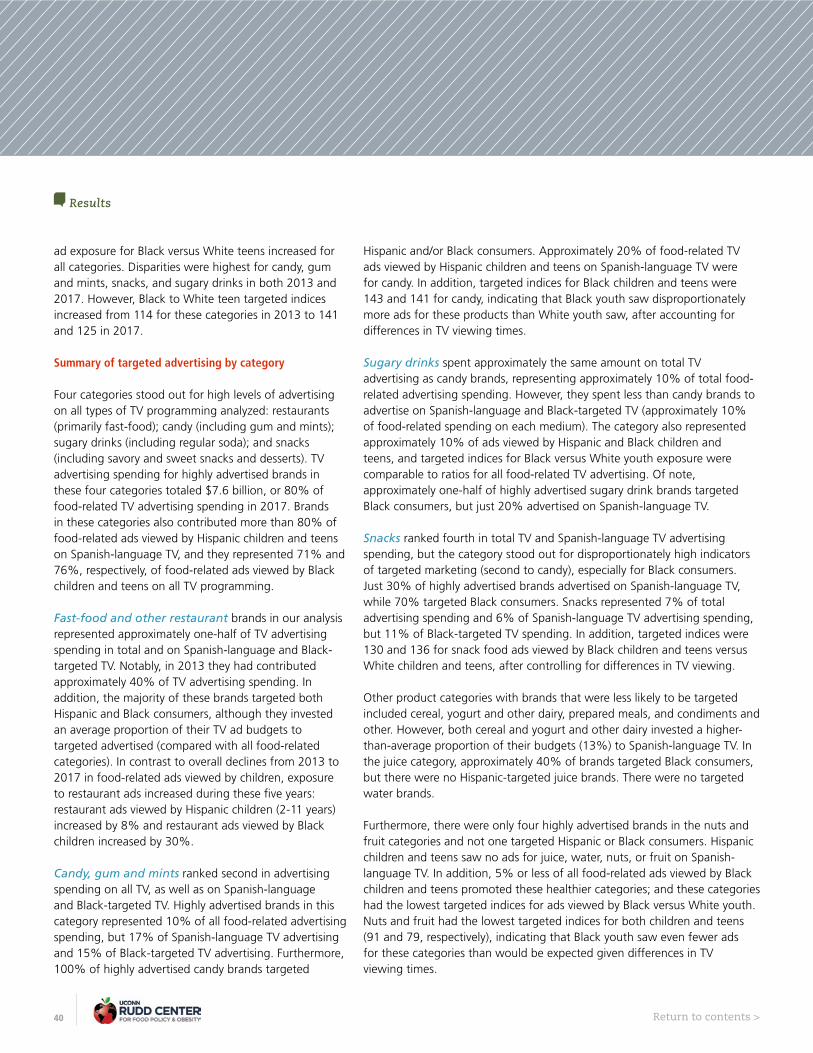
40 Return to contents >
ad exposure for Black versus White teens increased for all categories. Disparities were highest for candy, gum and mints, snacks, and sugary drinks in both 2013 and 2017. However, Black to White teen targeted indices increased from 114 for these categories in 2013 to 141 and 125 in 2017.
Summary of targeted advertising by category
Four categories stood out for high levels of advertising on all types of TV programming analyzed: restaurants (primarily fast-food); candy (including gum and mints); sugary drinks (including regular soda); and snacks (including savory and sweet snacks and desserts). TV advertising spending for highly advertised brands in these four categories totaled $7.6 billion, or 80% of food-related TV advertising spending in 2017. Brands in these categories also contributed more than 80% of food-related ads viewed by Hispanic children and teens on Spanish-language TV, and they represented 71% and 76%, respectively, of food-related ads viewed by Black children and teens on all TV programming.
Fast-food and other restaurant brands in our analysis represented approximately one-half of TV advertising spending in total and on Spanish-language and Black-targeted TV. Notably, in 2013 they had contributed approximately 40% of TV advertising spending. In addition, the majority of these brands targeted both Hispanic and Black consumers, although they invested an average proportion of their TV ad budgets to targeted advertised (compared with all food-related categories). In contrast to overall declines from 2013 to 2017 in food-related ads viewed by children, exposure to restaurant ads increased during these five years: restaurant ads viewed by Hispanic children (2-11 years) increased by 8% and restaurant ads viewed by Black children increased by 30%.
Candy, gum and mints ranked second in advertising spending on all TV, as well as on Spanish-language and Black-targeted TV. Highly advertised brands in this category represented 10% of all food-related advertising spending, but 17% of Spanish-language TV advertising and 15% of Black-targeted TV advertising. Furthermore, 100% of highly advertised candy brands targeted
Hispanic and/or Black consumers. Approximately 20% of food-related TV ads viewed by Hispanic children and teens on Spanish-language TV were for candy. In addition, targeted indices for Black children and teens were 143 and 141 for candy, indicating that Black youth saw disproportionately more ads for these products than White youth saw, after accounting for differences in TV viewing times.
Sugary drinks spent approximately the same amount on total TV advertising as candy brands, representing approximately 10% of total food-related advertising spending. However, they spent less than candy brands to advertise on Spanish-language and Black-targeted TV (approximately 10% of food-related spending on each medium). The category also represented approximately 10% of ads viewed by Hispanic and Black children and teens, and targeted indices for Black versus White youth exposure were comparable to ratios for all food-related TV advertising. Of note, approximately one-half of highly advertised sugary drink brands targeted Black consumers, but just 20% advertised on Spanish-language TV.
Snacks ranked fourth in total TV and Spanish-language TV advertising spending, but the category stood out for disproportionately high indicators of targeted marketing (second to candy), especially for Black consumers. Just 30% of highly advertised brands advertised on Spanish-language TV, while 70% targeted Black consumers. Snacks represented 7% of total advertising spending and 6% of Spanish-language TV advertising spending, but 11% of Black-targeted TV spending. In addition, targeted indices were 130 and 136 for snack food ads viewed by Black children and teens versus White children and teens, after controlling for differences in TV viewing.
Other product categories with brands that were less likely to be targeted included cereal, yogurt and other dairy, prepared meals, and condiments and other. However, both cereal and yogurt and other dairy invested a higher-than-average proportion of their budgets (13%) to Spanish-language TV. In the juice category, approximately 40% of brands targeted Black consumers, but there were no Hispanic-targeted juice brands. There were no targeted water brands.
Furthermore, there were only four highly advertised brands in the nuts and fruit categories and not one targeted Hispanic or Black consumers. Hispanic children and teens saw no ads for juice, water, nuts, or fruit on Spanish-language TV. In addition, 5% or less of all food-related ads viewed by Black children and teens promoted these healthier categories; and these categories had the lowest targeted indices for ads viewed by Black versus White youth. Nuts and fruit had the lowest targeted indices for both children and teens (91 and 79, respectively), indicating that Black youth saw even fewer ads for these categories than would be expected given differences in TV viewing times.
Results

41 Return to contents >
Results
SUMMARY OF TARGETED ADVERTISING BY PRODUCT CATEGORY
The majority of highly advertised food-related brands with advertising targeted to Hispanic and/or Black consumers in 2017 belonged to four product categories: restaurants (primarily fast food), candy (including gum and mints), sugary drinks (including regular soda), and savory and sweet snacks (including desserts).
Category Spanish-language TV Black-targeted TV
# of brands
Ad spending ($ mill)
(% of TV ad budget)
Top brands (ad spending; % of TV budget)
# of brands
Ad spending ($ mill)
(% of TV ad budget)
Top brands (ad spending; % of TV budget)
Highly targeted categories
Fast-food and other restaurants: $3,975 mill (n=22 brands)
18 (82%)
$317.8 (8.0%)
McDonald’s ($57.8; 10%) Subway ($47.1; 13%)Wendy’s ($29.9; 13%)
20 (91%)
$97.2 (2.4%)
Taco Bell ($13; 4%)Domino’s ($12; 4%)Burger King ($9.6; 3%)
Candy, gum and mints: $771.1 mill (n=35)
25 (71%)
$107.3 (13.9%)
M&Ms ($23.0; 34%)Snickers ($14.7; 25%)Extra ($12.6; 42%)
32 (91%)
$29.4 (3.8%)
Reese’s Peanut Butter Cups ($3.6; 5%)Hershey’s Candy Bar ($1.8; 4%)Kit Kat ($1.6; 4%)Jolly Rancher ($1.6; 16%)
Sugary drinks: $759.0 mill (n=28)
6 (21%)
$62.5 (8.2%)
Coca-Cola ($42.4; 20%)Dr. Pepper ($11.2; 16%)Pepsi ($7.1; 6%)
15 (54%)
$20.1 (2.6%)
Lipton Iced Tea ($4.0; 20%)Sprite ($2.1; 10%)Coca-Cola Classic ($2.0; 1%)
Snacks: $564.1 mill (n=41)
12 (29%)
$41.6 (7.4%)
Pop Tarts ($14.0; 43%)Cheetos ($7.6; 26%)Magnum Ice Cream ($3.1; 19%)
30 (73%)
$21.2 (3.8%)
Lay’s Potato Chips ($2.8; 11%)Doritos ($2.1; 7%)Cheetos ($1.4; 5%)Lay’s Poppables ($1.4; 12%)
Less targeted categories
Cereal: $356.8 mill (n=15)
4 (27%)
$45.6 (21%)
Big G Cereals ($20.9; 46%)Special K ($12.3; 40%)Honey Bunches of Oats ($6.8; 23%)
7 (47%)
$6.8 (2%)
Cheerios ($1.9; 2%)Honey Bunches of Oats ($0.9; 3%)Big G Cereals ($0.7; 1%)
Prepared meals: $342.8 mill (n=29)
7 (24%)
$23.6 (4%)
Stouffers Frozen Entrees ($4.3; 19%)Lean Cuisine Marketplace ($3.7; 40%)Hot Pockets ($3.1; 19%)
10 (34%)
$6.4 (3%)
Totino’s Pizza Rolls ($1.1; 7%)Jimmy Dean Frozen Entrees ($0.9; 4%)Hot Pockets ($0.6; 4%)
Condiments and other: $356.6 mill (n=34)
8 (24%)
$18.2 (3%)
Coffee Mate ($6.0; 22%)Helmann’s Mayonnaise ($5.2; 23%)Country Crock Margarine ($2.6; 9%)
9 (26%)
$5.6 (3%)
Country Crock Margarine ($0.9; 3%)Tostitos Salsa ($0.8; 8%)Pillsbury Grands! Dough ($0.7; 2%)
Yogurt and other dairy: $139.1 mill (n=11)
3 (27%)
$18.2 (13.1%)Philadelphia Cream Cheese ($9.7; 38%)Yoplait Yogurt ($6.8; 32%)Dannon Activia ($1.6; 11%)
3 (27%)
$1.7 (1.2%)
Yoplait Yogurt ($0.3; 1%)Philadelphia Cream Cheese ($0.3; 1%)Dannon Activia ($0.2; 2%)
Juice and water: $134.2 mill (n=12)
0 (0%)
<$0.01 (0%)
None5
(42%)$2.7
(2.0%)
Tropicana Trop50 ($0.7; 6%)Minute Maid Premium Fruit Juice ($0.6; 9%)Tropicana Essential Fruit Juices ($0.6; 5%)
Nuts and fruit: $60.8 mill (n=4)
0 (0%)
<$0.01 (0%)
None0
(0%)$0.1
(0.2%)None
Total for all highly advertised brands: $7,604.6 mill (n=236)
136 (58%)
$643.9 (8.5%)85
(36%)$194.7 (2.5%)
Source: Rudd Center analysis of Nielsen data (2018)
42 Return to contents >
Targeted marketing designed to
appeal specifically to Hispanic
and Black consumers recognizes
their value as customers and
provides a significant business
opportunity for companies.
Targeted marketing is not
problematic in and of itself,
but the targeting presented
in this report continues to
raise significant public
health concerns.
Food-related companies almost exclusively target Hispanic and Black consumers with advertising for their least nutritious products, led by fast-food, candy, sugary drink, and unhealthy snack brands. These products are high in sugar, fat, sodium, and calories; represent the majority of empty calories in young people’s diets; and directly contribute to lifelong diet-related diseases, including diabetes, heart disease, and obesity. These same diseases disproportionately affect communities of color. Furthermore, disparities in Black youth exposure to these ads compare to White youth have substantially increased over the past five years.
Continued disparities in unhealthy food advertising targeted to communities of color
As in 2013, four product categories dominated food-related advertising in 2017. Among the companies and brands in our analysis, restaurants (primarily fast-food) represented 52% of food-related advertising spending in 2017 (totaling almost $4 billion), 49% of spending on Spanish-language TV, and 50% of Black-targeted TV advertising spending. Three additional categories – candy, sugary drinks, and snacks – represented another 28% of all food-related TV advertising expenditures (totaling more than $2 billion). These three categories contributed an even higher proportion of Spanish-language and Black-targeted TV advertising spending, at 33% and 36%, respectively. Brands in healthier product categories – juice, water, fruit, and nuts combined – spent just $195 million in total TV advertising in 2017 (3% of all food-related advertising expenditures). Furthermore, brands in these categories did not advertise at all on Spanish-language TV, and they represented just 1% of advertising on Black-targeted TV.
Yet advertising targeted to Hispanic and Black youth was highly concentrated among a small number of companies.
Among fast-food restaurants, McDonald’s and Subway spent more than $45 million to advertise on Spanish-language TV, while Popeyes spent the highest proportion of its TV ad budget on Spanish-language programming (16%). On Black-targeted TV, Yum! Brands, Domino’s Pizza, and Roark Capital Group ranked in the top-five food-related advertisers (spending $10 to $21 million). Domino’s also allocated a high proportion of its advertising dollars to Black-targeted TV (4%).
Three packaged food companies (Mars, Nestle, and Coca-Cola) ranked among the top-five advertisers on Spanish-language TV, while Mars, Nestle, and Post allocated approximately one-quarter of their TV advertising budgets to Spanish-language TV. PepsiCo and Hershey ranked number one and three in advertising spending on Black-targeted TV, and number one and two in proportion of their advertising budgets spent on this medium.
Discussion

43 Return to contents >
Despite declines in time spent watching TV by all youth and resulting reductions in total food-related TV ads viewed from 2013 to 2017, children and teens continued to view thousands of TV ads per year, on average approximately 10 food-related ads per day in 2017 overall. Hispanic children viewed on average more than two Spanish-language food ads per day (in addition to ads viewed on English-language TV). In addition, Black children and teens viewed on average more than 16 food-related TV ads-per-day in 2017, compared to 8.8 ads-per-day for White children and 7.8 ads for White teens.
Furthermore, exposure to ads for some product categories and companies increased from 2013 to 2017. The number of fast-food ads viewed by Black children increased by 30% over these five years, and fast-food ads viewed by Hispanic children on Spanish-language TV increased by 8%. Hispanic youth exposure to Nestle brands more than doubled during this time (led by Breyers Ice Cream, Carnation Breakfast, and DiGiorno Pizza). In addition, Black children and teens saw more ads for Kraft Heinz in 2017 than they saw in 2013, and Black children’s exposure to PepsiCo ads also increased.
Restaurants, candy, sugary drink, and snack brands represented 81% of food-related ads viewed by Hispanic children and Hispanic teens on Spanish-language TV. These categories also represented approximately three-quarters of ads viewed by Black children and teens on all TV programming.
Food-related brands targeted to children and/or teens also were more likely to target Hispanic and/or Black consumers, primarily sugary drinks, candy, fast-food, and unhealthy snacks. McDonald’s and the top packaged food advertisers on targeted TV programming all belong to the CFBAI food industry self-regulatory program. Companies did comply with their pledges to advertise only healthier dietary choices in child-directed media. However, programming on Spanish-language and Black-targeted TV does not meet CFBAI definitions of child-targeted media, so these ads are not covered by their pledges.
Finally, disparities in food-related advertisements viewed by Black youth compared to White youth have increased since 2013. In contrast to reductions in total food-related advertising spending from 2013 to 2017, advertising spending on Black-targeted TV increased by more than 50% during this time. In addition, Black children saw 1.9 food ads for every 10 ad viewed by White children in 2017, and Black teens saw 2.2 ads for every ad viewed by White teens. These differences increased versus the 70% additional ads viewed by Black children and teens in 2013.
Disparities were even higher for candy and snack brands, which Black youth seeing 2 to 2.5 times as many ads compared to White youth. After controlling for differences in TV viewing times, Black youth saw 30% to 40% more ads for these products compared to White youth. Therefore, more than brands in other categories, candy and snack brands placed their ads in TV programming where they were more likely to be seen by Black children and teens than by White children and teens.
Five of the highly advertised juice brands targeted Black consumers, and one yogurt brand targeted Hispanic consumers. However, no water, fruit, or nut brands targeted either Hispanic or Black consumers. In addition, brands in these healthier product categories placed their ads in TV programming where they were less likely to be seen by Black children and teens.
The same companies that spent the most on targeted advertising for unhealthy products also publicized their corporate responsibility initiatives to promote nutrition and/or health and wellness. Many of these companies also promote sponsorships and scholarships aimed at communities of color as corporate responsibility initiatives. However, just one company publicly mentioned a health and wellness initiative aimed at Black and/or Hispanic consumers (Nestle promotion of the DrinkUp water campaign). Yet none of Nestle’s water brands (e.g., Poland Spring, Arrowhead, Deer Park) had enough advertising spending in 2017 to qualify as a highly advertised brand.
Therefore, in 2017 as in 2013, marketing of fast food and unhealthy foods and beverages continues to target youth of color. This advertising contributes to health disparities affecting their communities, and raises numerous questions about companies’ commitments to the health and wellness of these segments of their consumers.
Discussion
44 Return to contents >
Limitations
This analysis provides a comprehensive picture of advertising expenditures for all media and TV advertising expenditure and exposure data available from Nielsen, the most widely used industry source for data to analyze companies’ media plans. However, we did not have access to food industry proprietary documents, such as privately commissioned market research, media and marketing plans, and other strategic documents. Therefore, we do not attempt to interpret companies’ goals or objectives for their targeted marketing.
We did not include every restaurant, food and beverage company that advertised in 2017, but the 32 companies in our analysis represented 69% of all food-related advertising spending. They represented an even higher proportion of food-related expenditures on Spanish-language TV (88%) and more than 90% of food ads viewed by Hispanic children and teens on Spanish-language TV. Although these 32 companies represented a somewhat lower proportion of food-related advertising spending on Black-targeted TV (59%), they contributed approximately three-quarters of all food-related TV ads viewed by Black children and teens. Therefore, the companies in our analysis were responsible for the majority of food-related advertising, including targeted advertising, in 2017.
A related limitation is that we only analyzed targeted TV advertising. TV represents 72% of food-related companies’ advertising expenditures, but children and teens are watching less TV and increasing their use of other types of media, such as streaming video and mobile devices.36 In addition, food companies frequently target youth with other types of marketing, including sponsorships, social media, and retail promotions.37 We provide examples of other types of targeted marketing in public statements made by company spokespeople (see Appendix B for company profiles). Furthermore, we have compiled examples of targeted advertising campaigns from companies in our analysis that are posted on the Rudd Center website (see www.uconnruddcenter.org/targetedmarketing/campaigns).
It is interesting to note that many of these campaigns incorporate social media and various types of promotion, but most focus on TV commercials as the centerpiece of their campaigns. Even though children and teens are watching less commercial TV than in previous years, TV advertising remains the most reliable way for brands to reach the majority of young people with their marketing messages.
Finally, we did not conduct a nutrition analysis of products offered by targeted brands. However, previous analyses of the most highly advertised product categories have demonstrated the poor nutritional quality of the majority of advertised products in the fast food38 and snacks39 categories. Further, nutrition experts consistently counsel against overconsumption of sugary drinks and candy. Yogurt and juice were the only generally healthy categories with any brands targeted to Hispanic and/or Black consumers, although all brands in these categories were less likely to advertise on Spanish-language or Black-targeted TV than on other types of TV programming.
Recommendations
This report highlights the need for extensive action to reduce targeted marketing to Hispanic and Black youth, especially marketing of fast-food, sugary drinks, candy, and unhealthy snacks.
Since our previous report was published in 2015, advocates have proposed and policymakers have implemented many obesity prevention actions at the local and state level that will begin to counteract unhealthy food and beverage marketing to youth40. For example,
• Municipalities, including Albany, Oakland, and San Francisco, CA;Philadelphia, PA; and Seattle, WA have enacted excise taxes on sugarydrinks, which offsets manufacturers’ and retailers’ ability to set lowprices for these products, a key marketing strategy that can be usedto appeal to more price-sensitive youth.
• Municipalities in California and Colorado, as well as Baltimore, MD,have enacted legislation to remove sugary soda from kids’ mealsat restaurants.
• California passed a law to further restrict marketing of unhealthyproducts in schools (going beyond the USDA requirements) and localschool districts have implemented stricter requirements through theirlocal wellness policies.
Discussion

45 Return to contents >
These policies will benefit all children and teens, including Hispanic and Black youth. However, these measures do not address the unhealthy food marketing directly targeted to youth of color identified in this report.
This report also highlights the extent to which targeted marketing may undermine these public health efforts and increase health disparities affecting communities of color.
Key stakeholders within industry, including food and beverage manufacturers, restaurants, grocery retailers, and media companies must also take responsibility for reducing unhealthy marketing that targets and disproportionately impacts Hispanic and Black youth. Although few of the food brands that were highly advertised to all audiences are nutritious products that youth should be encouraged to consume, the contrast between product categories targeted and not targeted to these audiences is striking.
It is not clear why candy, sugary drink, and fast-food companies, but not companies that primarily sell yogurt, fruit, and nuts, have chosen to target Hispanic and Black consumers with the majority of their brands. Similarly, it is unclear why companies with diverse portfolios of both healthy and unhealthy brands in multiple categories have chosen to almost exclusively target Hispanic and Black consumers with ads for their unhealthy brands.
In our last report, we identified several actions that industry stakeholders could take to address marketing that contributes to disparities in obesity and other diet-related diseases in Hispanic and Black communities, especially among youth. To our knowledge, none of these actions have been taken, but we reiterate our recommendations.
First, food and beverage manufacturers and restaurants that have pledged to reduce unhealthy food advertising to children must address the negative impact of their advertising on Hispanic and Black children. The majority of packaged food and drink companies in this analysis belong to the CFBAI industry self-regulatory program. Public health experts have recommended many improvements in the program to address documented loopholes that allow participating companies to continue to advertise nutritionally poor foods to children.41-44 For example, CFBAI should strengthen the definition of “healthier dietary choices” that can be advertised to children, address advertising to children up to at least age 14, and expand the definition of “child-directed marketing” to include the broad range of marketing aimed at children.45 Due to greater exposure to media and unhealthy food marketing, these improvements would also have the greatest benefit for Black and Hispanic youth. However, the CFBAI should also specifically limit unhealthy food advertising targeted to youth of color.
Companies must also directly address their current multicultural targeted marketing for almost exclusively unhealthy products. Although the practices identified in this report likely benefit individual food and beverage, restaurant, and media companies in the short-term, they also contribute to the enormous social and financial costs of diet-related diseases.46
Companies should support public health efforts by taking action to make healthier choices the easiest, most affordable, and most socially acceptable options. Potential changes to targeted marketing practices that would improve the food marketing environment for Black and Hispanic youth include:
• Sugary drink, candy, and nutritionally poor snack food brands andfast-food restaurants – food and beverage categories that have beenshown to directly contribute to obesity and other diet-related diseasesamong youth – should stop targeting advertising to all young peopleunder 18, including multicultural youth. Initiatives such as McDonald’scommitment to improve the nutritional quality of its Happy Mealsare a welcome first step,47 but initiatives to reduce children’s totalconsumption of these products are also required;
• Corporate responsibility initiatives to promote nutrition and/or healthand wellness should also address targeted marketing of unhealthyproducts to communities of colors and commit to discontinuingpractices that contribute to diet-related diseases in these communities.
Discussion
46 Return to contents >
Discussion
• Industry commitments to increase sales andmarketing of healthier products – such as theHealthy Weight Commitment Foundation,48
Partnership for a Healthier America,49 AmericanBeverage Association’s Balance Calories Initiative,50
and the National Restaurant Association’s KidsLiveWell Program51 – should address marketing ofnutritionally poor products in Black- and Hispanic-targeted media and in communities of color;
• Media companies that own programming with largeaudiences of Hispanic and/or Black youth shouldtake action to improve the nutritional quality offoods advertised during targeted programming. Forexample, companies could establish standards forthe amount of healthy versus unhealthy foodsadvertised or provide lower rates to advertise thehealthiest products that do not currently advertisethere (e.g., plain water, fruits, and vegetables). Thereis a precedent for media companies to take action.The Walt Disney Company has nutrition standardsfor products that can be advertised on its child-targeted media that are stricter than the CFBAIfood-industry program standards.52
• Companies should use nutrition standards that alignwith the 2015-2020 Dietary Guidelines forAmericans (DGAs) to identify healthier products thatshould be advertised to youth, as recommended bya scientific advisory committee convened by HealthyEating Research.53
Framing targeted marketing of unhealthy products as a social justice issue could also increase concerns about this practice among youth of color.55
Conclusion
All of the companies in our analysis with the highest levels of targeted advertising also have highly publicized corporate responsibility initiatives to promote nutrition, health, and wellness. Companies have not indicated for whom these initiatives are intended, but it does not appear that their corporate investments in health and wellness extend to consumers of color. It is important to ask why. Companies that view advertising of nutritionally poor brands to multicultural consumers as a business opportunity, should weigh that opportunity against the resulting costs to these communities.
Furthermore, Hispanic and Black consumers could demand that companies improve the quality of foods marketed to their children and in their communities. Public health advocacy campaigns should highlight marketing practices of the small number of companies that disproportionately advertise their least healthy products to Black and Hispanic youth, as well as publicly support companies that begin to target marketing for more nutritious products to these communities. Previous advocacy campaigns that have highlighted the best and worst marketing practices aimed at children and teens have been successful at encouraging industry to do the right thing for all children’s health.54
47 Return to contents >
References
1 Harris JL, Shehan C, Gross R, et al. (2015). Food
advertising targeted to Hispanic and Black
youth: Contributing to health disparities. www.
uconnruddcenter.org/files/Pdfs/272-7%20%20
Rudd_Targeted%20Marketing%20Report_
Release_081115%5B1%5D.pdf
2 Fleming-Milici F, Harris JL (2018). Television
food advertising viewed by preschoolers,
children and adolescents: contributors to
differences in exposure for black and white
youth in the United States. Pediatric Obesity,
13, 103-110.
3 Fleming-Milici F, Harris JL, Sarda V, Schwartz MB
(2013). Amount of Hispanic youth exposure to
food and beverage advertising on Spanish- and
English-language television JAMA Pediatrics,
167(8), 723-730.
4 Institute of Medicine (IOM) (2006). Food
Marketing to Children and Youth: Threat or
Opportunity? Washington, DC: The National
Academies Press.
5 World Health Organization (WHO) (2012).
A framework for implementing the set of
recommendations on the marketing of foods
and non-alcoholic beverages to children.
http://www.who.int/dietphysicalactivity/
MarketingFramework2012.pdf
6 Grier SA, Kumanyika S (2008). The context for
choice: health implications of targeted food
and beverage marketing to African Americans.
American Journal of Public Health, 98(9),
1616-1629.
7 Ramirez, A. G., Gallion, K., & Adeigbe,
R. (2013). Latino Youth and Obesity:
Communication/Media Influence on Marketing.
Advances in Communication Research to
Reduce Childhood Obesity (pp. 367-387):
Springer.
8 Grier S, Kumanyika S (2010). Targeted
marketing and public health. Annual Review of
Public Health. 31 (1):349-369.
9 Boykiv J (2016, May 16). Multicultural
marketing: No longer an option, but a necessity.
Inc. www.inc.com/yuriy-boykiv/multicultural-
marketing-no-longer-an-option-but-a-necessity.
html
10 Grier, Kumanyika (2010).
11 Nielsen (2017). Hispanic Consumers Continue
to Drive U.S. FMCG dollars. https://www.
nielsen.com/us/en/insights/news/2017/
hispanic-consumers-continue-to-drive-us-
fmcg-dollars.html
12 Nielsen (2018). [Redirect] Black Dollars Matter:
The Sales Impact of Black Consumers. https://
www.nielsen.com/us/en/insights/news/2018/
black-dollars-matter-the-sales-impact-of-black-
consumers.print.html
13 Aaker JL, Brumbaugh AM, Grier SA (2000).
Nontarget markets and viewer distinctiveness:
The impact of target marketing on advertising
attitudes. Journal of Consumer Psychology, 9,
127-140.
14 Grier SA, Brumbaugh AM (1999). Noticing
cultural differences: Ad meanings created by
target and non-target markets. Journal of
Advertising, 28, 79.
15 Isselmann-DiSantis K, Kumanyika S, Carter-
Edwards L, Rohm-Young D, Grier SA, Lassiter
V (2017). Sensitizing black adult and youth
consumers to targeted food marketing tactics
in their environments. International journal
of environmental research and public health,
14(11), 1316.
16 Sierra JJ, Hyman MM, Torres IM (2009). Using
a model's apparent ethnicity to influence
viewer responses to print ads: A social identity
theory perspective. Journal of Current Issues
and Research in Advertising, 31(2), 41-66.
17 DiSantis K, Kumanyika S, Carter-Edwards
L., Rohm Young D (2017). Sensitizing Black
Adult and Youth Consumers to Targeted
Food Marketing Tactics in Their Environments.
International Journal of Environmental
Research and Public Health, 14 (11), 1316.
18 Harris, Shehan, Gross et al. (2015).
19 Coca-Cola 2017 Annual Review
20 General Mills (2018). Global Responsibility.
https://globalresponsibility.generalmills.
com/HTML1/general_mills-global_
responsibility_2018_0011.html
21 Hershey (2018). Our Shared Goodness Promise.
https://www.thehersheycompany.com/en_us/
shared-goodness.html
48 Return to contents >
References
22 Kellogg (2018). Supporting Health and Well-
being. http://crreport.kelloggcompany.com.
supporting-health
23 Kraft Heinz (2017). Growing a Better
World at Kraft Heinz: 2017 Corporate
Social Responsibility Report. http://www.
kraftheinzcompany.com/pdf/KHC_CSR_2017_
Overview.pdf
24 Mars (2018). Responsible Marketing. https://
www.mars.com/global/sustainable-in-a-
generation/nourishing-wellbeing/responsible-
marketing
25 Alliance for a Healthier Generation (2018).
McDonald’s announces global commitment to
support families with increased focus on Happy
Meals. www.healthiergeneration.org/articles/
mcdonalds-announces-global-commitment-
to-support-families-with-increased-focus-on-
happy
26 Nestle (2018). Nestle Launches Global
Initiative to Help Children Lead Healthier Lives.
https://www.nestle.com/media/pressreleases/
allpressreleases/nestle-for-healthier-kids
27 PepsiCo (2018). Performance with Purpose.
http://www.pepsico.com/sustainability/
Performance-with-Purpose
28 Yum! Brands (2017). Our Recipe for Good.
http://citizenship.yum.com/
29 Nestle (2018).
30 American Marketing Association. Common
language marketing dictionary.
31 CFBAI. About CFBAI. https://bbbprograms.org/
programs/CFBAI/cfbai-about-us/
32 Carrasco M (2018, August 2). Why
a multicultural mindset is a must for
agencies. Forbes. https://www.forbes.com/
sites/forbesagencycouncil/2018/08/02/
why-a-multicultural-mindset-is-a-must-for-
agencies/#e6fd5442965b
33 Boykiv (2016).
34 William FH (2018). The US will become
‘minority white’ in 2045, Census projects –
Youthful minorities are the engine of future
growth https://www.brookings.edu/blog/
the-avenue/2018/03/14/the-us-will-become-
minority-white-in-2045-census-projects/
35 Harris, Shehan, Gross et al. (2015).
36 Twenge JM, Martin GN, Spitzberg BH (2018).
Trends in US Adolescents’ media use, 1976-
2016: The rise of digital media, the decline of
TV, and the (near) demise of print. Psychology
of Popular Media Culture
37 Federal Trade Commission (FTC) (2012).
A review of food marketing to children
and adolescents: Follow-Up report.
https://www.ftc.gov/sites/default/files/
documents/reports/review-food-marketing-
children-and-adolescents-follow-
report/121221foodmarketingreport.pdf
38 Harris JL, Schwartz MB, Munsell CR, et al.
(2013). Fast Food FACTS 2013: Measuring
Progress in Nutrition and Marketing
to Children and Teens. http://www.
fastfoodmarketing.org/media/FastFoodFACTS_
Report.pdf
39 Harris JL, Schwartz MB, Shehan C, et al.
(2015). Snack FACTS 2015: Evaluating Snack
Food Nutrition and Marketing to Youth.
http://www.uconnruddcenter.org/files/Pdfs/
SnackFACTS_2015_Fulldraft03.pdf
40 Mancini S, Harris JL (2018). Policy changes
to reduce unhealthy food and beverage
marketing to children in 2016 and 2017.
http://www.uconnruddcenter.org/files/Pdfs/
Food%20marketing%20policy%20brief_Final.
41 Kunkel DL, Castonguay JS, Filer CR (2015).
Evaluating industry self-regulation of food
marketing to children. American Journal of
Preventive Medicine, 49(2), 181-187.
42 Healthy Eating Research (2015).
Recommendations for Responsible
Food Marketing to Children. http://
healthyeatingresearch.org/research/
recommendations-for-responsible-food-
marketing-to-children/
43 Federal Trade Commission (2011). Interagency
Working Group seeks input on proposed
voluntary principles for marketing food to
children. www.ftc.gov/news-events/press-
releases/2011/04/interagency-working-group-
seeks-input-proposed-voluntary
44 World Health Organization (2015). Interim
Report of the Commission on Ending
Childhood Obesity. Commission-ending-
childhood-obesity-interim-report.pdf
45 Healthy Eating Research (2015).
46 McKinsey Global Institute (2014). Overcoming
obesity: An initial economic analysis. www.
mckinsey.com/insights/economic_studies/
how_the_world_could_better_fight_obesity
47 Partnership for a Healthier America (2015).
2014 Annual Progress Report. progressreports.
ahealthieramerica.org/2014/
48 Healthy Weight Commitment Foundation
(2015). www.healthyweightcommit.org/

49 Return to contents >
References
49 Partnership for a Healthier America (2015).
2014 Annual Progress Report. progressreports.
ahealthieramerica.org/2014/
50 American Beverage Association (2015).
Balance Calories. www.ameribev.org/nutrition-
science/balance-calories-initiative/
51 National Restaurant Association (2015).
Kids LiveWell Program. www.restaurant.org/
Industry-Impact/Food-Healthy-Living/Kids-
LiveWell-Program
52 The Walt Disney Company (2015).
Nutrition Guidelines. https://www.
thewaltdisneycompany.com/wp-content/
uploads/Nutrition-Guidelines.pdf
53 Healthy Eating Research (2018). Better
for your foods: A guide to evaluating the
quality of nutrition standards. https://
healthyeatingresearch.org/wp-content/
uploads/2018/11/her_NutritionStandards_
final.pdf
54 Harris JL, LoDolce M, Schwartz MB (2015).
Encouraging Big Food to do the right thing
for children’s health: A case study in using
research to improve marketing of sugary
cereals. Critical Public Health, 25(3), 320-332.
55 DiSantis et al., 2017
50 Return to contents >
Targeted marketing is the practice of designing
marketing programs that appeal specifically to a group
of consumers whom a company has identified as
particularly attractive for their business,1 also known
as “culturally-specific” content or marketing. Methods
developed by consumer behavior researchers to identify
targeted marketing include measuring differences in the
concentration of ad placements across different types
of media (e.g., Spanish-language or Black-targeted
media) and differences in exposure by viewers in
different demographic groups, as well as identification
of customized advertising content (e.g., cultural themes,
actors).2
In this report, we detail marketing by restaurant and
food and beverage companies targeted to Black and
Hispanic consumers, focusing on advertising viewed by
children (2-11 years) and teens (12-17 years). We include
an examination of company statements about their
targeted marketing practices and analyses of syndicated
market research data from Nielsen.
SCOPE OF ANALYSES
We conducted the research at the company and
brand level, analyzing restaurant, food, and beverage
companies that spent $100 million or more on
advertising in 2017 (n=28) as well as members of the
Children’s Food and Beverage Advertising Initiative
(CFBAI)3 that did not meet this spending threshold
(n=4). We identified brands from the above companies
that spent $4.5 million or more on advertising in 2017
(n=269) for further analysis. We then excluded brands
that spent less than $500,000 on television advertising in 2017 (n=30) and
brands marketed solely on local spot market television (n=3), providing a final
list of 236 brands.
We assigned all brands to one of the following categories: 1) food products
(baby food, candy, cereal, food preparation/condiments, fruits and vegetables,
gum/mints, nuts, prepared meals, savory snacks, sweet snacks, yogurt, other
dairy products, and other); 2) beverages (diet soda, juice/water, other sugary
drinks, and regular soda); and 3) restaurants (fast-food and other).
COMPANY STATEMENTS ABOUT TARGETED MARKETING
Company statements were coded according to three primary reasons given
for their targeted marketing strategies: 1) Business opportunity includes
company statements or publications about Black, Hispanic, or minority
consumers that discuss targeted marketing as a business growth opportunity.
These statements may also include information about the consumer group’s
purchasing behavior. 2) Cultural relevance includes references to unique
product offerings or marketing campaigns that aim to reach Black or Hispanic
consumers by connecting to their cultures (e.g., through recipes and ethnic
product flavors, sports, music). 3) Corporate responsibility discusses
companies’ commitment to diversity and inclusion, and philanthropic efforts
to provide support (usually financial) to Black or Hispanic communities (e.g.,
educational resources, scholarships, food assistance). Examples of promotional
campaigns that appeared to target minority consumers evidenced by the
presence of Black or Hispanic actors/ spokespersons and/or use of ethnic cues
(cultural symbols and vernacular, support of cultural institutions). These were
coded as targeted campaigns.4
ANALYSES OF SYNDICATED MARKET RESEARCH DATA
As companies rarely disclose their marketing strategies publicly, we also
utilized methods developed by consumer behavior researchers to identify
Appendix A. Methods

51 Return to contents >
targeted marketing using syndicated market research
data from Nielsen. Targeted marketing can be identified
by the amount of advertising placed in targeted
media (e.g., Spanish-language TV, Black-targeted TV
programming) and differences in the concentration of ad
placements across different types of media and viewers.
MEASURES
The Nielsen data quantified media spending by company
and brand, including amount spent to advertise on
targeted TV networks (i.e., Spanish-language and Black-
targeted TV). Nielsen data also provided the number
of TV advertisements viewed (i.e., exposure) by Black,
White, and all children and adolescents and exposure to
advertising on Spanish-language TV by Hispanic children
and adolescents. All data were collected for advertising
in 2017.
Targeted television networks
All advertising on Spanish-language TV was
considered to be targeted to Hispanic audiences.
Spanish-language TV distributors included Azteca,
Discovery en Español, Disovery Familia, ESPN
Deportes, Estrella TV, FOX Deportes, Galavisión,
GOL TV, Universo, MundoFox, MTV tr3s, Telemundo,
UniMás, Univisión, and Univisión Deportes.
Networks were categorized as Black-targeted
TV if more than 50% of a network’s audience
self-identified as Black according to Nielsen
MarketBreaks. Black-targeted TV distributors
included Badami Productions, BET, BET Her, Central
City Entertainment, NBA TV, TV One, and VH1.
Advertising spending
Nielsen tracks amount spent to purchase advertising in 17 different media.
These data provide a measure of advertising spending. We licensed
advertising spending data for all food, beverage, and restaurant
categories for 2017 and report these numbers by brand, company, and
category.
We report the following advertising spending measures:
• Total ad spending includes the amount spent on all 17 media tracked by
Nielsen including TV (including Spanish-language TV), Internet, radio,
magazines, newspaper, free-standing insert coupons, and outdoor
advertising.
• Total TV ad spending includes advertising expenditures on network, cable,
syndicated, and spot (local) TV.
• Spanish-language TV spending includes advertising expenditures on all
Spanish-language TV networks.
• Black-targeted TV spending includes advertising expenditures on all Black-
targeted TV networks (i.e., those with an audience comprised of more
than 50% Black viewers).
In addition, we calculated the percentage of total TV advertising spending
devoted to Spanish-language and Black-targeted TV programming for
companies and brands.
• Spanish-language % of TV spending was calculated by dividing Spanish-
language TV spending by total TV spending.
• Black-targeted % of TV spending was calculated by dividing Black-
targeted TV spending by total TV spending.
Appendix A. Methods

52 Return to contents >
TV viewing times
We licensed TV viewing data from Nielsen Market Breaks
to calculate average TV viewing times for children
(ages 2-11), teens (ages 12-17), and adults (ages 18-49).
This measure provides the average hours of TV viewed
by individuals in each age group, which includes TV
programming viewed on broadcast, cable, syndicated,
and spot networks. We used TV viewing time data to
measure relative TV viewing for youth age groups versus
adults and between Black and White youth in the same
age group. These numbers were calculated by dividing
TV viewing time for children (2-11 years) or teens (12-17
years) by TV viewing time for adults (18-49 years); and by
dividing TV viewing times for Black children and teens by
TV viewing times for White children and teens.
TV advertising exposure
To measure exposure to TV advertising, we also licensed
gross rating points (GRP) data from Nielsen for the
same period and companies. GRPs measure the total
audience delivered by a company or brand’s media
schedule. It is expressed as a percent of the population
that was exposed to each commercial over a specified
period of time across all types of TV programming. It
is the advertising industry’s standard measure to assess
audience exposure to advertising campaigns, and Nielsen
Media Research is the most widely used source for these
data.5 GRPs, therefore, provide an objective assessment
of advertising exposure.
In addition, GRPs can be used to measure advertisements
delivered to a specific audience, such as an age or other
demographic group (also known as target rating points
or TRPs), and provide a per capita measure to examine relative exposure
between groups. For example, if a brand had 2,000 GRPs in 2017 for 2- to
11-year-olds and 1,000 GRPs for 18- to 49-year-olds, then we can conclude
that children saw twice as many ads for that brand in 2017 compared to
adults.
In the exposure analyses, we obtained 2017 GRP data by age group and
race. We first obtained total GRPs for the following age groups: children
(2-11 years), teens (12-17 years), and adults (18-49 years). These data
provide total exposure to national (network, cable, and syndicated) and
local (spot market) TV combined. We also obtained GRPs for advertising
viewed by Black and White youth in the same age groups on national TV
only, as Nielsen does not provide spot market GRPs by race and age group.
To assess exposure by Hispanic youth to Spanish-language advertising, we
provide GRP data for advertising that occurred on Spanish-language TV.
Nielsen calculates GRPs as the sum of all advertising exposures for all
individuals within a demographic group, including multiple exposures for
individuals (i.e., gross impressions), divided by the size of the population,
and multiplied by 100. GRPs can be difficult to interpret. Therefore, we also
use GRP data to calculate the following TV advertising measures:
Average ads viewed is calculated by dividing total GRPs for a
demographic group during a specific time period by 100. It provides a
measure of the average number of ads viewed by all individuals in that
demographic group during the time period measured. For example, if
Nielsen reports 2,000 GRPs for 2- to 11-year-olds for a brand in 2017, we
can conclude that on average all 2- to 11-year-olds viewed 20 ads for that
brand in 2017.
We report average number of ads viewed in 2017 for the following groups:
• Children (2-5, 6-11, and 2-11 years) and teens (12-17 years) for all viewers
in those age groups (combined national and spot TV)
Appendix A. Methods

53 Return to contents >
• Black children (2-5, 6-11, and 2-11 years) and teens
(12-17 years) for Black viewers in those age groups
(national cable, network, and syndicated TV)
• Hispanic children (2-5, 6-11, and 2-11 years) and teens
(12-17 years) for Hispanic viewers in those age groups
on Spanish-language networks.
Relative advertising exposure
As GRPs provide a per capita measure of advertising
exposure for specific demographic groups, we also
used GRPs and TV viewing time to measure relative
exposure to advertising between different age groups
and between Black and White youth within the same
age group.
We first calculated targeted GRP ratios as follows:
• Child:adult targeted ratio = GRPs for children (2-11) /
GRPs for adults (18-49)
• Teen:adult targeted ratio = GRPs for teens (12-17) /
GRPs for adults (18-49)
• Black:White child targeted ratio = GRPs for Black
children (2-11) /GRPs for White children (2-11). This
measure only uses national GRPs.
• Black:White teen targeted ratio = GRPs for Black teens
(12- 17) / GRPs for White teens (12-17). This measure
only uses national GRPs.
A targeted ratio greater than 1.0 indicates that on
average persons in the group of interest (i.e., children
in the child:adult ratio) viewed more advertisements
than persons in the comparison group (i.e., adults). A
targeted ratio of less than 1.0 indicates that the person
in the group of interest viewed fewer ads. For example,
a child:adult targeted ratio of 2.0 indicates that children
viewed twice as many ads as adults viewed.
We then compared these targeted ratios to differences in TV viewing times
for the two groups. The resulting targeted indices provide a measure of
disproportionate exposure to TV advertising between the two groups, after
controlling for TV viewing time.
We report the following targeted indices:
• Child:adult targeted index = [GRPs for all children (2-11) / GRPs for all
adults (18-49)] / [TV viewing time for children / TV viewing time for
adults] * 100
• Teen:adult targeted index = [GRPs for all teens (12-17) / GRPs for all
adults (18-49)] / [TV viewing time for teens / TV viewing time for adults]
* 100
• Black:White child targeted index = [GRPs for Black children (2-11) /
GRPs for White children (2-11)] / [TV viewing time for Black children / TV
viewing time for White children] * 100
• Black:White teen targeted index = [GRPs for Teens (12-17) / GRPs for
adults (18-49)] / [TV viewing time for teens / TV viewing time for adults]
* 100
A targeted index greater than 100 indicates that on average persons in the
group of interest (i.e., children in the child:adult targeted index) viewed
more advertisements than persons in the comparison group (i.e., adults)
after accounting for differences in TV viewing. A targeted index of less than
100 indicates that the person in the group of interest viewed fewer ads
after accounting for differences in TV viewing. For example, a child:adult
targeted index of 150 indicates that children viewed 50% more TV ads
than adults viewed, after controlling for differences in TV viewing times.
If this index is greater than 100, we can conclude that the advertiser likely
designed a media plan to reach persons in the group of interest more often
than would occur naturally.
Appendix A. Methods

54 Return to contents >
Identifying targeted brands
We identified targeted brands as brands that spent a
significant amount to advertise on targeted television
programming, as well as those with advertising that
reached disproportionately more of the target audience.
The following criteria identified brands with TV
advertising targeted to Black and Hispanic consumers:
• Brands that spent $100,000 or more to advertise on
Spanish-language TV were considered to be Hispanic-
targeted.
• Brands that spent $500,000 or more to advertise
on Black-targeted TV were considered to be Black-
targeted.
• Brands that spent $100,000 or more to advertise on Black-targeted TV
and had a targeted ratio of 2.1 or greater (i.e., a targeted indexa of 117
or higher) for Black versus White teens also were considered to be Black-
targeted.
We also identified brands that appeared to target their advertising to
children and teens:
• Brands with a child:adult targeted ratio of .85 or greater (i.e., a targeted
indexb of 106 or higher) were considered to be child-targeted.
• Brands with a teen:adult targeted ratio of .60 or greater (i.e., a targeted
indexc of 11 or higher) were considered to be teen-targeted.
Appendix A. Methods
REFERENCES:
1 Grier SA, Kumanyika S (2010). Targeted marketing and public health. Annual Review of Public Health. 31 (1):349-369.2 Ibid3 Kolish ED, Enright M, Oberrdorff B. (2014). The Children’s Food & Beverage Advertising Initiative in Action. www.bbb.org/globalassets/local-bbbs/coun-cil-113/media/cfbai/cfbai-2013-progress-report-dec-2014.pdf4 Grier SA (2009). African American and Hispanic youth vulnerability to target marketing: implications for understanding the effects of digital marketing. In BMSG Meeting on Digital Media and Marketing to Children (pp. 29-30).5 Nielsen (2018). How we measure. http://www.nielsen.com/us/en/solutions/measurement.html
a On average, in 2017, Black children watched 61% more television compared with White children and Black teens watched 84% more television than White teens. b In 2017, children watched 20% less television than adults watched. C In 2017, teens watched 46% less television than adults watched.

55 Return to contents >
Appendix B.
Company Targeted Marketing Profiles
3G CAPITAL 56
BERKSHIRE HATHAWAY 58
CAMPBELL 59
COCA-COLA 61
CONAGRA BRANDS 65
DANNON 66
DARDEN 68
DINE BRANDS 70
DOCTOR’S ASSOCIATES 72
DOMINO’S PIZZA 74
DR PEPPER SNAPPLE GROUP 76
FERRERO USA 78
GENERAL MILLS 79
HERSHEY 82
KELLOGG 85
KRAFT HEINZ 87
LITTLE CAESARS ENTERPRISES 89
MARS 90
MCDONALD’S 92
MONDELEZ INTERNATIONAL 95
NESTLE 97
PAPA JOHN’S PIZZA 100
PEPSICO 102
POPEYES LOUISIANA KITCHEN 106
POST CONSUMER BRANDS 108
ROARK CAPITAL GROUP 110
SONIC 112
TYSON FOODS 113
UNILEVER 115
WENDY’S 117
THE WONDERFUL COMPANY 119
YUM! BRANDS 121
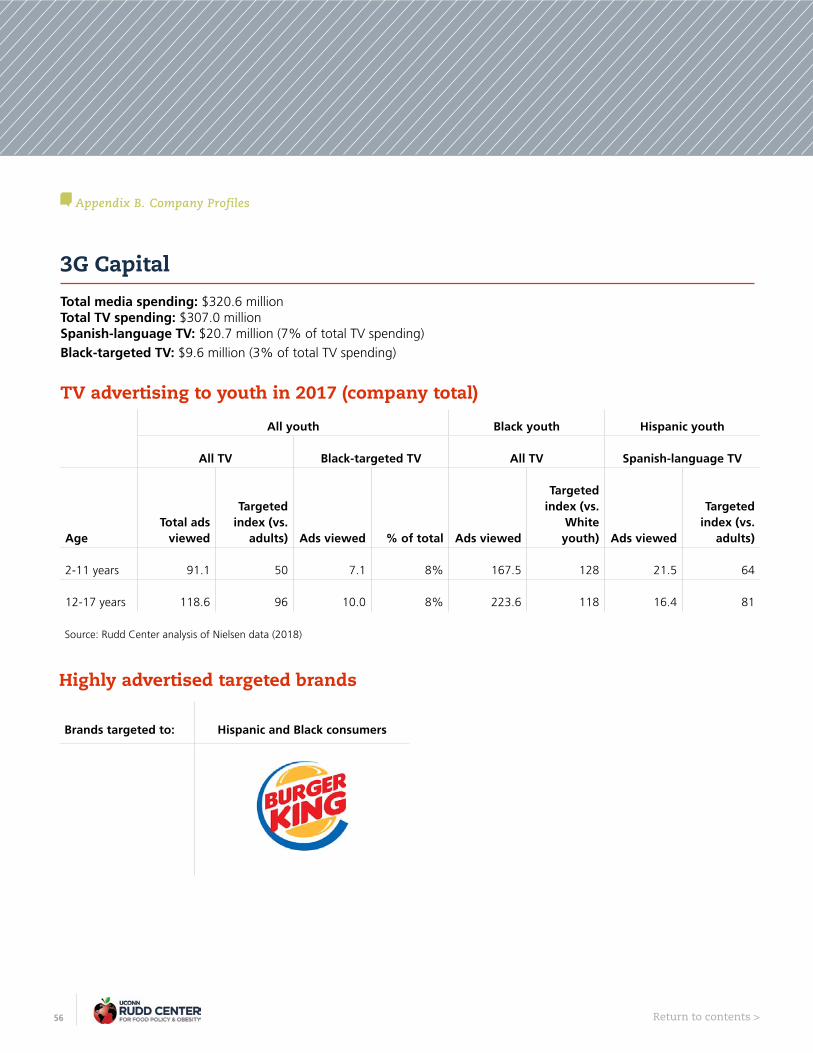
56 Return to contents >
Appendix B. Company Profiles
3G CapitalTotal media spending: $320.6 millionTotal TV spending: $307.0 million Spanish-language TV: $20.7 million (7% of total TV spending)
Black-targeted TV: $9.6 million (3% of total TV spending)
TV advertising to youth in 2017 (company total)
All youth Black youth Hispanic youth
All TV Black-targeted TV All TV Spanish-language TV
AgeTotal ads
viewed
Targeted index (vs.
adults) Ads viewed % of total Ads viewed
Targeted index (vs.
White youth) Ads viewed
Targeted index (vs.
adults)
2-11 years 91.1 50 7.1 8% 167.5 128 21.5 64
12-17 years 118.6 96 10.0 8% 223.6 118 16.4 81
Source: Rudd Center analysis of Nielsen data (2018)
Highly advertised targeted brands
Brands targeted to: Hispanic and Black consumers

57 Return to contents >
Appendix B. Company Profiles
3G Capital (continued)
Public statements about targeted marketing
Corporate responsibility
• Burger King’s Diversity and Inclusion statement mentions welcoming diverse consumers, “Our global brand positioning is focused on authenticity, which means we work to be a place where our guests can come and be themselves, regardless of their background.”1
• The Burger King McLamore Foundation is focused on providing opportunities for education globally.2 In 2016, the BURGER KING Scholars program awarded $3 million in scholarships to 2,800 students in the U.S. with the following ethnic/racial distribution: White/Caucasian (47%), Hispanic/Latino (19%), Black/African American (16%), Asian (9%), all other (9%).3
1 Burger King (2018). Diversity. Retrieved from https://www.bk.com/diversity2 Burger King McLamore Foundation (2017). About the Foundation. Retrieved from https://bkmclamorefoundation.org/3 Burger King McLamore Foundation (2016). 2016 Annual Report. Retrieved from https://bkmclamorefoundation.org/wp-content/uploads/2017/05/2017-Annual-Report-LoRes-Website.pdf

58 Return to contents >
Appendix B. Company Profiles
Berkshire HathawayTotal media spending: $113.9 millionTotal TV spending: $112.1 million Spanish-language TV: $0 million (0% of total TV spending)
Black-targeted TV: $1.2 million (1% of total TV spending)
TV advertising to youth in 2017 (company total)
All youth Black youth
All TV Black-targeted TV All TV
AgeTotal ads
viewed
Targeted index (vs.
adults) Ads viewed % of total Ads viewed
Targeted index (vs.
White youth)
2-11 years 32.6 54 0.8 2% 47.9 89
12-17 years 36 87 1.2 3% 54.6 83
Source: Rudd Center analysis of Nielsen data (2018)
2 highly advertised brands; 50% targeted to Black and/or Hispanic consumers
Highly advertised targeted brands
Brands targeted to: Black consumers
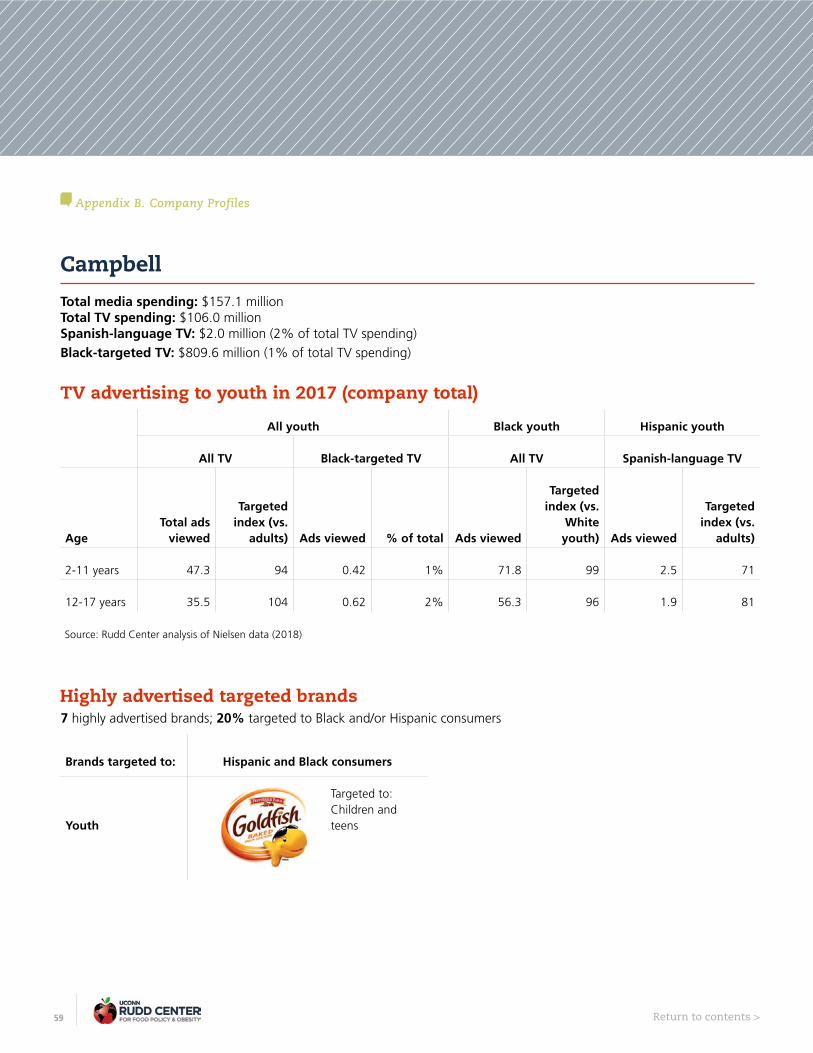
59 Return to contents >
Appendix B. Company Profiles
CampbellTotal media spending: $157.1 millionTotal TV spending: $106.0 million Spanish-language TV: $2.0 million (2% of total TV spending)
Black-targeted TV: $809.6 million (1% of total TV spending)
TV advertising to youth in 2017 (company total)
All youth Black youth Hispanic youth
All TV Black-targeted TV All TV Spanish-language TV
AgeTotal ads
viewed
Targeted index (vs.
adults) Ads viewed % of total Ads viewed
Targeted index (vs.
White youth) Ads viewed
Targeted index (vs.
adults)
2-11 years 47.3 94 0.42 1% 71.8 99 2.5 71
12-17 years 35.5 104 0.62 2% 56.3 96 1.9 81
Source: Rudd Center analysis of Nielsen data (2018)
7 highly advertised brands; 20% targeted to Black and/or Hispanic consumers
Highly advertised targeted brands
Brands targeted to: Hispanic and Black consumers
Youth
Targeted to: Children and teens
60 Return to contents >
Appendix B. Company Profiles
Campbell (continued)
Public statements about targeted marketing
Business opportunity
• Carlos Barroso, Senior Vice President, Global Research and Development, talks about an employee network, “The Hispanic Network is a business opportunity driven by the explosion of Hispanic households in the US … It helps us tap into our own Hispanic employees to attract, engage and develop Hispanic talent and better connect to this growing consumer base.”1
• In 2017, Andres Romero, Marketing Manager and Brand Activation also highlighted the Latino population as a growth opportunity domestically and abroad.2
1 May, B. (2015). Campbell’s Key Ingredient for Global Market Expansion. Retrieved from https://hispanicexecutive.com/2015/campbell/ 2 Beech, A. (2017). The diversity of Latino business. Retrieved from http://aldianews.com/articles/local/diversity-latino-business/49296 3 Nunes, K. (2015). The Campbell Soup Co.’s new family portrait. Retrieved from https://www.foodbusinessnews.net/articles/5983-the-campbell-soup-co-s-new-family-portrait
Cultural relevance
• In 2015, Denise Morrison, president and CEO, described the types of households Campbell is focused on: Latino, African-American, and Asian consumers. Morrison also highlighted new products, Latin-inspired cooking sauces, and Swanson flavor infused broths meant to appeal to multicultural consumers.3

61 Return to contents >
Appendix B. Company Profiles
Coca-ColaTotal media spending: $561.7 millionTotal TV spending: $446.1 million Spanish-language TV: $47.1 million (11% of total TV spending)
Black-targeted TV: $9.4 million (2% of total TV spending)
TV advertising to youth in 2017 (company total)
All youth Black youth Hispanic youth
All TV Black-targeted TV All TV Spanish-language TV
AgeTotal ads
viewed
Targeted index (vs.
adults) Ads viewed % of total Ads viewed
Targeted index (vs.
White youth) Ads viewed
Targeted index (vs.
adults)
2-11 years 73.4 54 4.9 7% 127.9 118 30.6 73
12-17 years 89.1 96 6.8 8% 158.5 109 22.3 83
Source: Rudd Center analysis of Nielsen data (2018)
16 highly advertised brands; 63% targeted to Black and/or Hispanic consumers
Highly advertised targeted brands
Brands targeted to: Hispanic consumers Black consumers Hispanic and Black consumers
Youth
Targeted to: Teens
Teens
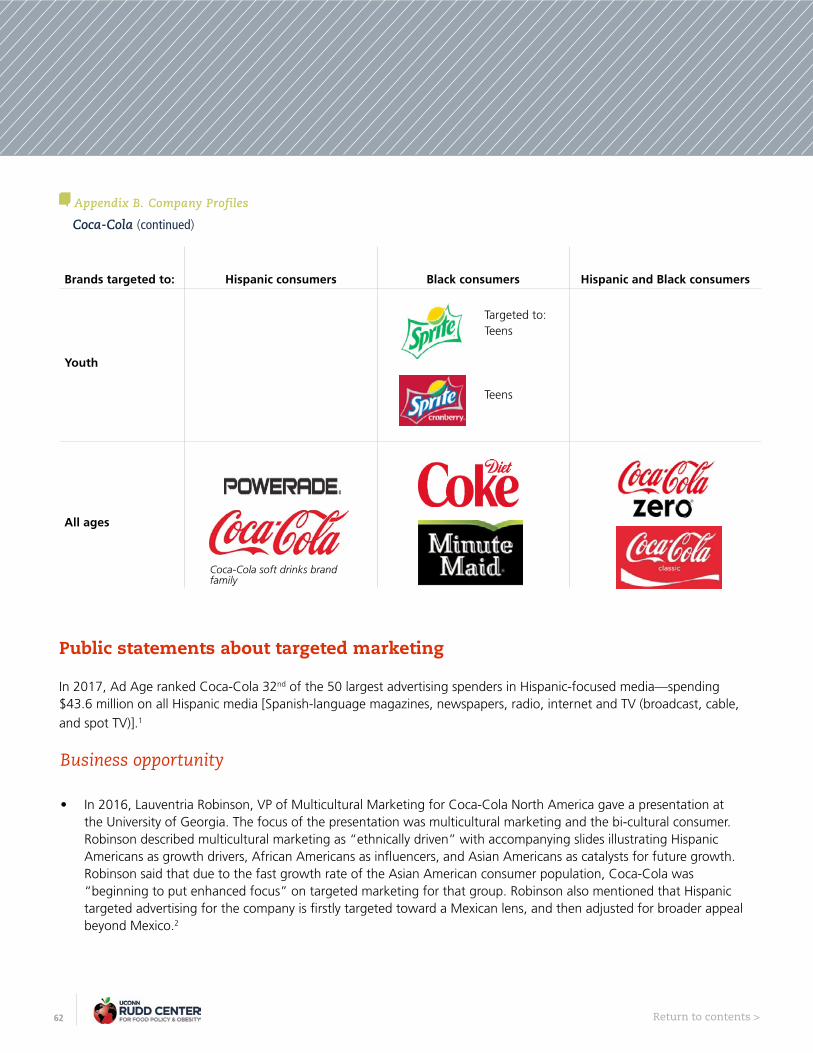
62 Return to contents >
Appendix B. Company Profiles
Coca-Cola (continued)
Coca-Cola soft drinks brand family
Brands targeted to: Hispanic consumers Black consumers Hispanic and Black consumers
Youth
Targeted to: Teens
Teens
All ages
Public statements about targeted marketing
In 2017, Ad Age ranked Coca-Cola 32nd of the 50 largest advertising spenders in Hispanic-focused media—spending $43.6 million on all Hispanic media [Spanish-language magazines, newspapers, radio, internet and TV (broadcast, cable,
and spot TV)].1
Business opportunity
• In 2016, Lauventria Robinson, VP of Multicultural Marketing for Coca-Cola North America gave a presentation at the University of Georgia. The focus of the presentation was multicultural marketing and the bi-cultural consumer. Robinson described multicultural marketing as “ethnically driven” with accompanying slides illustrating Hispanic Americans as growth drivers, African Americans as influencers, and Asian Americans as catalysts for future growth. Robinson said that due to the fast growth rate of the Asian American consumer population, Coca-Cola was “beginning to put enhanced focus” on targeted marketing for that group. Robinson also mentioned that Hispanic targeted advertising for the company is firstly targeted toward a Mexican lens, and then adjusted for broader appeal beyond Mexico.2
63 Return to contents >
Appendix B. Company Profiles
Coca-Cola (continued)
Corporate responsibility
• Since 1981, Coca Cola has partnered with the Hispanic Scholarship Fund. Alba Adamo, Group Director of Hispanic Marketing, said, “Coca-Cola is committed to paying it forward and empowering Hispanic youth with the help needed to go to college and achieve their dreams. Supporting the educational advancement of youth is vital, and we are proud to partner with the Hispanic Scholarship Fund to create scholarship opportunities and help build the next generation of leaders.”9,10
• In 2017, Coca Cola presented the POWERADE® Sueño Alianza tryouts, a partnership with Alianza de Futbol Hispano, an organization that provides opportunities for Hispanic soccer communities.11,12
• In 2015, Coca-Cola and Steve Harvey partnered for Coca-Cola Pay it Forward Academy. A news release from the company stated “The Coca-Cola Pay It Forward program returns with a stronger focus on African American moms and their impact on the academic success of their teens.”13
Cultural relevance
• In 2015, Coca-Cola was a presenting sponsor of the Black Entertainment Network, BET Experience at L.A. LIVE.3
• Coca-Cola was a key sponsor for Telemundo’s Spanish-language coverage of the 2018 World Cup in Russia.4
• In 2018, Diet Coke launched 4 new flavors with new packaging. Rafael Acevedo, Coca-Cola North America/Diet Coke said, “Eighty percent of Diet Coke consumption is Anglo…We believe that to recruit a new generation, we have to appeal to them, and millennials are 40% multicultural.” The new marketing will be “more authentic…and is a lot more gender neutral and diverse,” according to Acevedo.5,6
• The Coke Solutions website currently lists its multicultural youth-targeted products. Coca-Cola Cherry is described as, “the great taste of Coca-Cola® with sweet, smooth cherry flavor that reminds multicultural youth to experience the variety that is the spice of life.” Fanta Zero’s target audience is multicultural families and the product is described as having, “broad appeal across African American, Hispanic and Anglo American ethnic groups.7
• In an informational slideshow about fundraising with Coca-Cola, the company mentions a variety of multicultural targeted products. The consumer target for Sprite and Sprite Zero is “multicultural youth 13-24.” For Powerade ION4, the consumer target is “Teen, multicultural males with goal oriented mindset. Strong focus on Hispanic American and African American consumers.” The consumer target for Fuze Iced Tea is listed as, “Skews male, multicultural and millennial variety seekers.” Vitaminwater is “popular with youths ages 15-24, and [has] a strong appeal to multicultural consumers.” The slides also mention that Dasani Drops over-index with multicultural consumers.8
64 Return to contents >
Appendix B. Company Profiles
Coca-Cola (continued)
1 Ad Age. Hispanic Fact Pack 2018. https://adage.com/trend-reports/report.php?id=1392 Mitchell, B. (2016). Coca-Cola Bi-Cultural Hispanic Consumers - Lauventria Robinson - VP of Multicultural Marketing, Coca-Cola. Retrieved from https://kaltura.uga.edu/media/t/1_g46aj36b/318681613 Viacom (2015). Coca-Cola® Named Presenting Sponsor of the BET Experience at L.A. LIVE June 25-28. Retrieved from http://ir.viacom.com/static-files/07bd425d-dbdc-4b88-9c4e-a69fb466f6684 Lafayette, J. (2018). Coca-Cola, Sprint, VW Sponsoring Telemundo’s World Cup Coverage. Retrieved from https://www.multichannel.com/news/coca-cola-sprint-vw-sponsoring-telemundo-s-world-cup-coverage-4185505 Wong, V. (2018). What The Hell Just Happened To Diet Coke? 2018 Edition. Retrieved from https://www.buzzfeednews.com/article/venessawong/diet-coke-just-got-an-insane-candy-colored-makeover-to#.yfJm82ejJ 6 Schultz, E. (2018). DIET COKE GETS A NEW LOOK, ADDS FLAVORS IN MOVE TO OVERCOME SLUMP. Retrieved from http://adage.com/article/cmo-strategy/diet-coke-new-look-adds-flavors/311906/ 7 Coke Solutions (2018). Products. Retrieved from https://www.cokesolutions.com/products?BrandsCategoriesList=%7B%22target%22:%22brandList%22%7D8 White Settlement Independent School District (2018). Coke Presentation. Retrieved from https://www.wsisd.com/ourpages/users/dcoyle/Fundraising/Coke%20Presentation.pdf 9 Hispanic Scholarship Fund. (2018). Coca-Cola. Retrieved from https://www.hsf.net/sponsors/the-coca-cola-company10 Business Wire (2015). The Coca-Cola Company and the Hispanic Scholarship Fund Partner to Help Hispanics Achieve College Dreams. Retrieved from https://www.businesswire.com/news/home/20150708006174/en/Coca-Cola-Company-Hispanic-Scholarship-Fund-Partner-Hispanics11 Business Wire (2017). POWERADE® Sueño Alianza Tryouts Offer Budding Soccer Stars the Chance to Power Through. Retrieved from https://www.businesswire.com/news/home/20170517005730/en/12 Coca-Cola Company (2017). Watch a New Spot From Soccer-Focused POWERADE Campaign. Retrieved from https://www.coca-colacompany.com/stories/watch-a-new-spot-from-soccer-focused-powerade-campaign 13 Coca-Cola Company (2015). COCA-COLA AND STEVE HARVEY PARTNER TO MOTIVATE MOMS AND TEENS THROUGH THE NEWCOCA-COLA PAY IT FORWARD ACADEMY. Retrieved from http://www.ohiobeverage.com/wp-content/uploads/2015/01/RELEASE-2015-Coca-Cola-Pay-It-Forward-With-Steve-Harvey-22Jan15.pdf
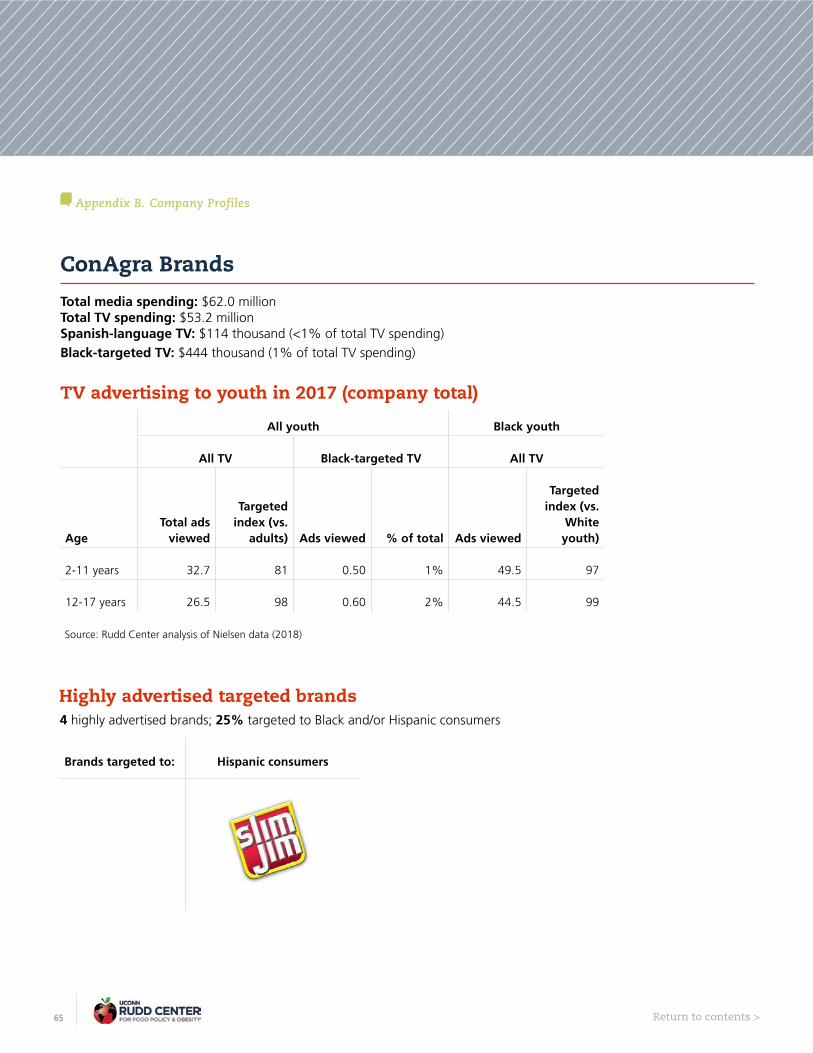
65 Return to contents >
Appendix B. Company Profiles
ConAgra BrandsTotal media spending: $62.0 millionTotal TV spending: $53.2 million Spanish-language TV: $114 thousand (<1% of total TV spending)
Black-targeted TV: $444 thousand (1% of total TV spending)
TV advertising to youth in 2017 (company total)
All youth Black youth
All TV Black-targeted TV All TV
AgeTotal ads
viewed
Targeted index (vs.
adults) Ads viewed % of total Ads viewed
Targeted index (vs.
White youth)
2-11 years 32.7 81 0.50 1% 49.5 97
12-17 years 26.5 98 0.60 2% 44.5 99
Source: Rudd Center analysis of Nielsen data (2018)
4 highly advertised brands; 25% targeted to Black and/or Hispanic consumers
Highly advertised targeted brands
Brands targeted to: Hispanic consumers

66 Return to contents >
Appendix B. Company Profiles
DannonTotal media spending: $49.6 millionTotal TV spending: $48.0 million Spanish-language TV: $1.6 million (3% of total TV spending)
Black-targeted TV: $559 thousand (1% of total TV spending)
TV advertising to youth in 2017 (company total)
All youth Black youth Hispanic youth
All TV Black-targeted TV All TV Spanish-language TV
AgeTotal ads
viewed
Targeted index (vs.
adults) Ads viewed % of total Ads viewed
Targeted index (vs.
White youth) Ads viewed
Targeted index (vs.
adults)
2-11 years 33.3 95 0.34 1% 57.3 110 2.7 78
12-17 years 22.6 96 0.51 2% 44.9 124 2.0 90
Source: Rudd Center analysis of Nielsen data (2018)
3 highly advertised brands; 66% targeted to Black and/or Hispanic consumers
Highly advertised targeted brands
Brands targeted to: Black consumers Hispanic and Black consumers
67 Return to contents >
Appendix B. Company Profiles
Dannon (continued)
Cultural relevance
• In 2014, Danimals was used to cross-promote The Lego Movie. Freddy Mino, a shopping market manager at Dannon, said, “With Danimals Greek Yogurt, it is geared towards kids, so the Lego Movie was a great fit for reaching that demographic. This is a promotion that was geared towards Hispanics, and it’s over indexed with mobile devices and text messages, so by enabling them to enter to win movie tickets we were able to convert in all of those metrics in terms of engaging with them on a mobile device, providing value and we know that all of our properties are engaged with Hispanics.”1
1 Borison, R. (2018). Dannon drives shelf engagement via Lego Movie-themed SMS sweepstakes. Retrieved from https://www.mobilemarketer.com/ex/mobilemarketer/cms/news/messaging/17220.html
Public statements about targeted marketing
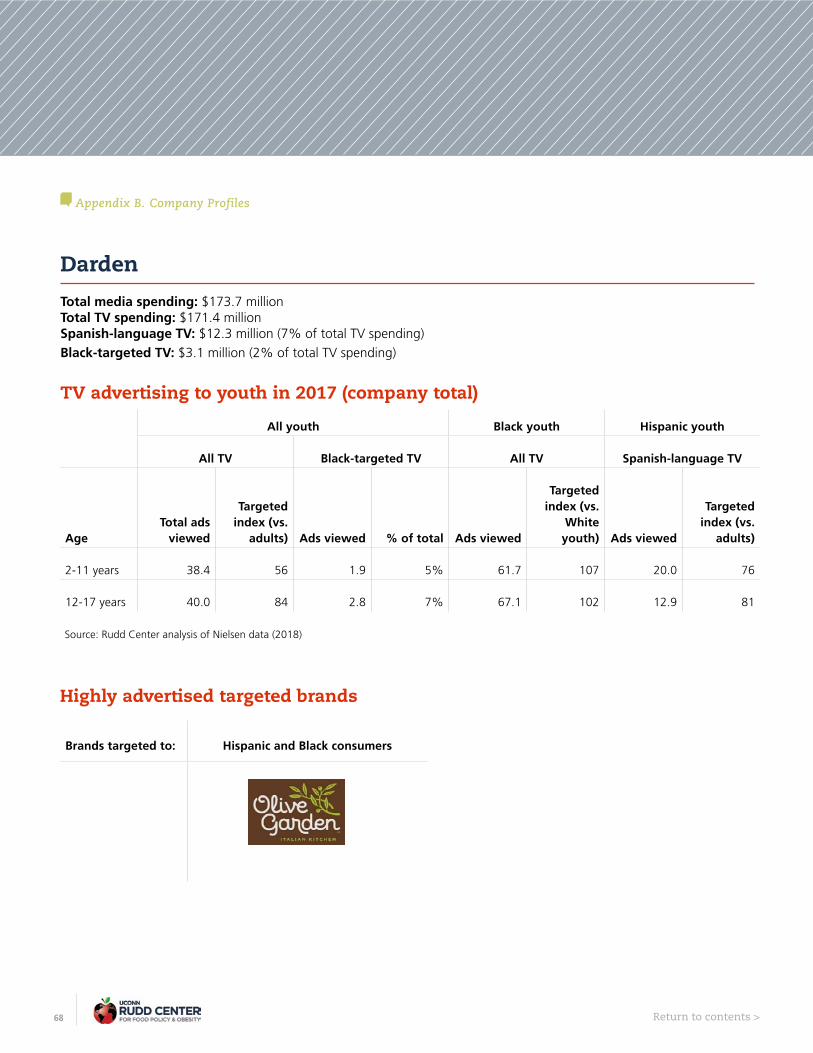
68 Return to contents >
Appendix B. Company Profiles
DardenTotal media spending: $173.7 millionTotal TV spending: $171.4 million Spanish-language TV: $12.3 million (7% of total TV spending)
Black-targeted TV: $3.1 million (2% of total TV spending)
TV advertising to youth in 2017 (company total)
All youth Black youth Hispanic youth
All TV Black-targeted TV All TV Spanish-language TV
AgeTotal ads
viewed
Targeted index (vs.
adults) Ads viewed % of total Ads viewed
Targeted index (vs.
White youth) Ads viewed
Targeted index (vs.
adults)
2-11 years 38.4 56 1.9 5% 61.7 107 20.0 76
12-17 years 40.0 84 2.8 7% 67.1 102 12.9 81
Source: Rudd Center analysis of Nielsen data (2018)
Highly advertised targeted brands
Brands targeted to: Hispanic and Black consumers
69 Return to contents >
Appendix B. Company Profiles
Darden (continued)
Business opportunity
• “In fiscal 2017, Olive Garden continued to leverage Spanish language advertising to increase awareness and visits from Hispanic consumers.”1
1 Darden Restaurants Inc. (2017). Annual Report. Retrieved from https://seekingalpha.com/filing/3631730
Public statements about targeted marketing

70 Return to contents >
Appendix B. Company Profiles
Dine BrandsTotal media spending: $208.9 millionTotal TV spending: $202.4 million Spanish-language TV: $20.8 million (10% of total TV spending)
Black-targeted TV: $2.0 million (1% of total TV spending)
TV advertising to youth in 2017 (company total)
All youth Black youth Hispanic youth
All TV Black-targeted TV All TV Spanish-language TV
AgeTotal ads
viewed
Targeted index (vs.
adults) Ads viewed % of total Ads viewed
Targeted index (vs.
White youth) Ads viewed
Targeted index (vs.
adults)
2-11 years 41.9 51 1.3 3% 71.9 112 24.2 73
12-17 years 45.3 81 1.8 4% 77.3 98 18.2 84
Source: Rudd Center analysis of Nielsen data (2018)
Highly advertised targeted brands
Brands targeted to: Hispanic and Black consumers
2 highly advertised brands; 100% targeted to Black and/or Hispanic consumers

71 Return to contents >
Appendix B. Company Profiles
Dine Brands (continued)
Business opportunity
• Univision Communications named Applebee’s the 2016 Newcomer of the Year. Julia Stewart, CEO of DineEquity, described the reason for targeting Hispanics through Spanish language as “good business.” She went on to say, “I think there is a huge opportunity…The Hispanic segment is incredibly loyal. And once they like a brand, they’re drawn to it often. It’s a notion of togetherness and family.”1
• In 2018, Stephen P. Joyce, CEO of Dine Brands, said “By the end of the year Dine Brands aims to identify its first acquisition, which will probably be a healthful, ethnic, fast-casual restaurant with a regional presence that the
company can grow to be a national brand.”2
1 Filiaci, P. (2016). DineEquity Chairman and CEO Julia Stewart: Targeting Hispanics is “Just Good Business”. Retrieved from https://corporate.univision.com/blog/restaurants/2016/06/14/dineequity-chairman-and-ceo-julia-stewart-targeting-hispanics-is-just-good-business/ 2 Reyes-Velarde, A. (2018). Applebee’s and IHOP’s new recipe for success: technology, takeout and takeovers. Retrieved from https://phys.org/news/2018-02-applebee-ihop-recipe-success-technology.html
Public statements about targeted marketing

72 Return to contents >
Appendix B. Company Profiles
Doctor’s AssociatesTotal media spending: $387.4 millionTotal TV spending: $364.1 million Spanish-language TV: $47.1 million (13% of total TV spending)
Black-targeted TV: $5.1 million (1% of total TV spending)
TV advertising to youth in 2017 (company total)
All youth Black youth Hispanic youth
All TV Black-targeted TV All TV Spanish-language TV
AgeTotal ads
viewed
Targeted index (vs.
adults) Ads viewed % of total Ads viewed
Targeted index (vs.
White youth) Ads viewed
Targeted index (vs.
adults)
2-11 years 60.2 74 3.6 6% 102.7 120 37.7 79
12-17 years 63.6 115 5.0 8% 121.6 123 27.0 83
Source: Rudd Center analysis of Nielsen data (2018)
Highly advertised targeted brands
Brands targeted to: Hispanic and Black consumers
Youth Targeted to: Teens

73 Return to contents >
Appendix B. Company Profiles
Doctor’s Associates (continued)
In 2017, Ad Age ranked Subway 38th of the 50 largest advertising spenders in Hispanic-focused media—spending $36.8 million on all Hispanic media [Spanish-language magazines, newspapers, radio, internet and TV (broadcast, cable, and
spot TV)].1
1 Ad Age. Hispanic Fact Pack 2018. https://adage.com/trend-reports/report.php?id=139
Public statements about targeted marketing

74 Return to contents >
Appendix B. Company Profiles
Domino’s PizzaTotal media spending: $319.3 millionTotal TV spending: $312.4 million Spanish-language TV: $23.2 million (7% of total TV spending)
Black-targeted TV: $12.0 million (4% of total TV spending)
TV advertising to youth in 2017 (company total)
All youth Black youth Hispanic youth
All TV Black-targeted TV All TV Spanish-language TV
AgeTotal ads
viewed
Targeted index (vs.
adults) Ads viewed % of total Ads viewed
Targeted index (vs.
White youth) Ads viewed
Targeted index (vs.
adults)
2-11 years 82.1 59 6.1 7% 145.3 129 30.1 78
12-17 years 91.3 98 8.1 9% 168.8 121 21.1 84
Source: Rudd Center analysis of Nielsen data (2018)
Highly advertised targeted brands
Brands targeted to: Hispanic and Black consumers
75 Return to contents >
Appendix B. Company Profiles
Domino’s Pizza (continued)
1 Portada (2018). Domino’s Has Appointed The Community as its U.S. Hispanic Agency of Record. Retrieved from https://www.portada-online.com/2018/01/29/dominos-has-appointed-the-community-as-its-u-s-hispanic-agency-of-record/ 2 Stardem (2017). Domino’s holding fundraiser for multicultural center. Retrieved from https://www.stardem.com/domino-s-holding-fundraiser-for-multicultural-center/article_51a86cdb-021f-595c-af1f-a5ba489af701.html
Public statements about targeted marketing
Business opportunity
• In 2018, Domino’s selected “The community” as their U.S. Hispanic agency of record (AOR) to launch a multimedia advertising campaign for the Hispanic market. “We sought a collaborative creative partner that would help us
continue to elevate our brand with the influential Hispanic community,” said Karen Kaiser, VP of Advertising.1
Corporate responsibility
• In 2017, a Domino’s Pizza in Easton, Maryland hosted a fundraiser for Chesapeake Multicultural Resource Center (ChesMRC) in honor of Hispanic Heritage Month. However, Domino’s is comprised of many franchises, which means
this action may not reflect Domino’s Pizza as a whole.2

76 Return to contents >
Appendix B. Company Profiles
Dr Pepper Snapple GroupTotal media spending: $209.7 millionTotal TV spending: $189.6 million Spanish-language TV: $22.1 million (12% of total TV spending)
Black-targeted TV: $3.1 million (2% of total TV spending)
TV advertising to youth in 2017 (company total)
All youth Black youth Hispanic youth
All TV Black-targeted TV All TV Spanish-language TV
AgeTotal ads
viewed
Targeted index (vs.
adults) Ads viewed % of total Ads viewed
Targeted index (vs.
White youth) Ads viewed
Targeted index (vs.
adults)
2-11 years 30.0 53 1.5 5% 47.1 104 23.0 80
12-17 years 36.3 94 2.1 6% 58.8 95 15.7 83
Source: Rudd Center analysis of Nielsen data (2018)
6 highly advertised brands; 67% targeted to Black and/or Hispanic consumers
Highly advertised targeted brands
Brands targeted to: Hispanic consumers Black consumers
Youth
Targeted to: Teens
77 Return to contents >
Appendix B. Company Profiles
Dr Pepper Snapple Group (continued)
Brands targeted to: Hispanic consumers Black consumers
All ages
Public statements about targeted marketing
Cultural relevance
• “When you look at Hispanic culture—whether it’s Puerto Rico, Mexico, or anywhere in Latin America—it’s all very colorful, fun, and festive, and that’s what all our flavors are about.” -Hispanic sales VP Pablo Guzman of Dr Pepper Snapple Group.1
1 Davila, R. (2016). Dr Pepper Snapple Group Pops the Lid on Hispanic Market Potential. Retrieved from https://hispanicexecutive.com/2016/dps/
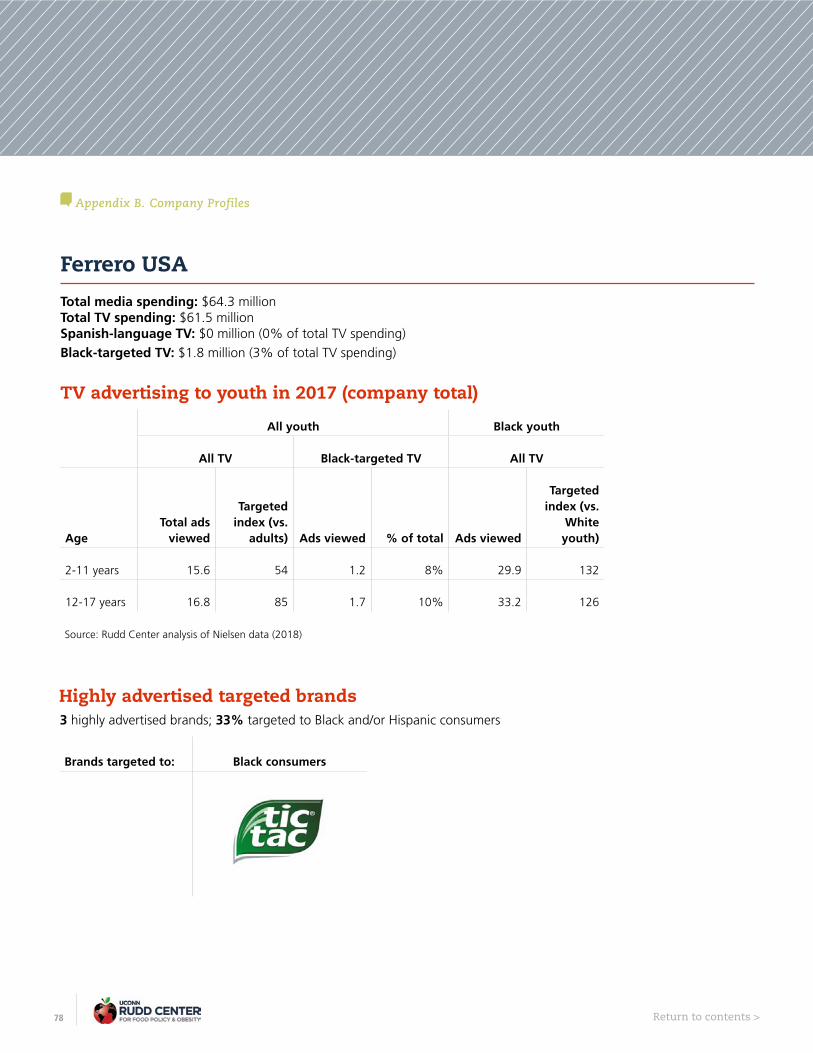
78 Return to contents >
Appendix B. Company Profiles
Ferrero USATotal media spending: $64.3 millionTotal TV spending: $61.5 million Spanish-language TV: $0 million (0% of total TV spending)
Black-targeted TV: $1.8 million (3% of total TV spending)
TV advertising to youth in 2017 (company total)
All youth Black youth
All TV Black-targeted TV All TV
AgeTotal ads
viewed
Targeted index (vs.
adults) Ads viewed % of total Ads viewed
Targeted index (vs.
White youth)
2-11 years 15.6 54 1.2 8% 29.9 132
12-17 years 16.8 85 1.7 10% 33.2 126
Source: Rudd Center analysis of Nielsen data (2018)
3 highly advertised brands; 33% targeted to Black and/or Hispanic consumers
Highly advertised targeted brands
Brands targeted to: Black consumers
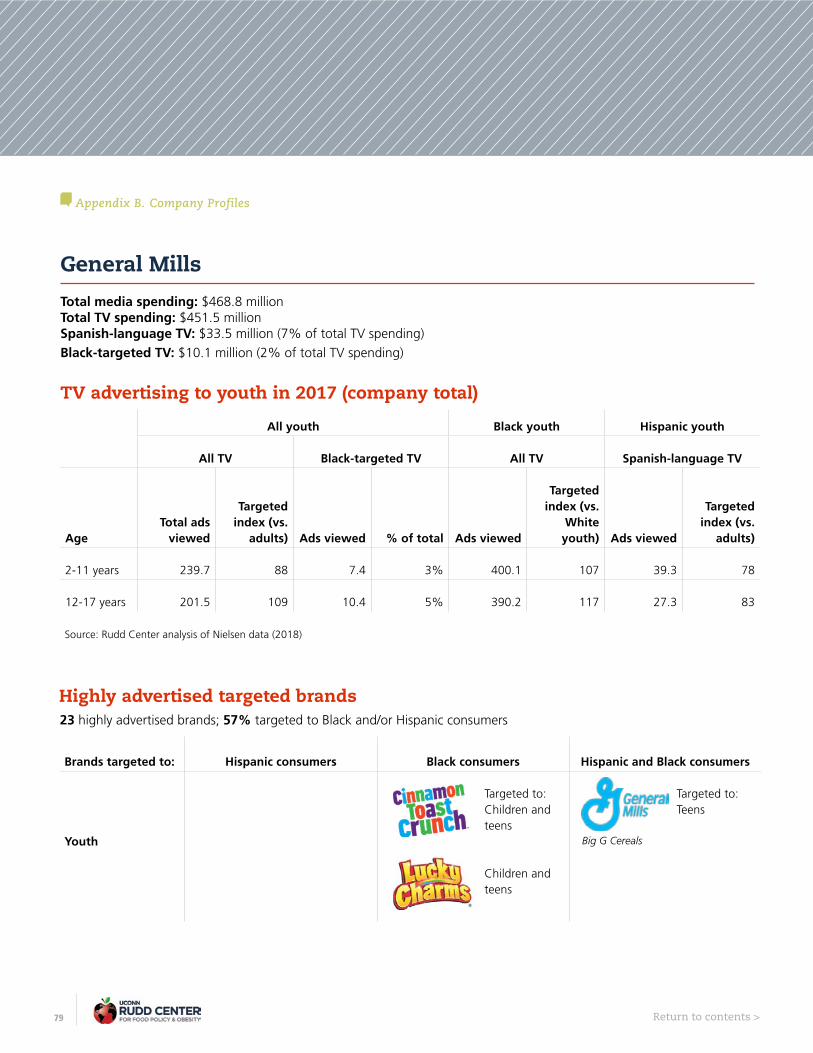
79 Return to contents >
Appendix B. Company Profiles
General Mills
Big G Cereals
Total media spending: $468.8 millionTotal TV spending: $451.5 million Spanish-language TV: $33.5 million (7% of total TV spending)
Black-targeted TV: $10.1 million (2% of total TV spending)
TV advertising to youth in 2017 (company total)
All youth Black youth Hispanic youth
All TV Black-targeted TV All TV Spanish-language TV
AgeTotal ads
viewed
Targeted index (vs.
adults) Ads viewed % of total Ads viewed
Targeted index (vs.
White youth) Ads viewed
Targeted index (vs.
adults)
2-11 years 239.7 88 7.4 3% 400.1 107 39.3 78
12-17 years 201.5 109 10.4 5% 390.2 117 27.3 83
Source: Rudd Center analysis of Nielsen data (2018)
23 highly advertised brands; 57% targeted to Black and/or Hispanic consumers
Highly advertised targeted brands
Brands targeted to: Hispanic consumers Black consumers Hispanic and Black consumers
Youth
Targeted to: Children and teens
Targeted to: Teens
Children and teens

80 Return to contents >
Appendix B. Company Profiles
†
‡
General Mills (continued)
All varieties
Brands targeted to: Hispanic consumers Black consumers Hispanic and Black consumers
Youth
Targeted to: Children and teens
Teens
All ages
‡ Two varieties: Progresso Soup and Progresso Traditional Soup
Public statements about targeted marketing
In 2017, Ad Age ranked General Mills 45th of the 50 largest advertising spenders in Hispanic-focused media—spending $31.4 million on all Hispanic media [Spanish-language magazines, newspapers, radio, internet and TV (broadcast, cable,
and spot TV)].1
† Two varieties: Nature Valley Snack Bar and Nature Valley Sweet & Salty Nut Snack Bar

81 Return to contents >
Appendix B. Company Profiles
General Mills (continued)
Cultural relevance
• Bill Trovinger, consumer insights senior associate at General Mills Convenience & Food Service, suggested that implementing “more bold flavors and ethnic foods” will prove successful for recruiting Generation Z.2
• In 2016, Totino’s launched Stuffed Nachos with “Mexican” flavors.3
Corporate responsibility
• Since 1991, General Mills has partnered annually with the United Negro College Fund (UNCF) for a Martin Luther King, Jr. honorary holiday breakfast. UNCF is a minority education organization, currently located in Washington, D.C. In 2017, a local UNCF chapter benefitted from funds raised at the breakfast event.4
1 Ad Age. Hispanic Fact Pack 2018. https://adage.com/trend-reports/report.php?id=1392 General Mills (2018). Five tips for serving the needs of Generation Z. Retrieved from https://www.generalmillscf.com/industries/k12/support-tool-categories/increasing-participation/five-tips-for-serving-the-needs-of-generation-z3 Totino’s (2016). Totino’s™ New Products Give Millennials More Convenient Snack Options. Retrieved from https://www.prnewswire.com/news-releases/totinos-new-products-give-millennials-more-convenient-snack-options-300309942.html4 General Mills (2017). Civil rights activist, author Myrlie Evers-Williams to be keynote Speaker at MLK Holiday Breakfast. Retrieved from http://www.generalmills.com/en/News/NewsReleases/Library/2017/January/mlk-breakfast
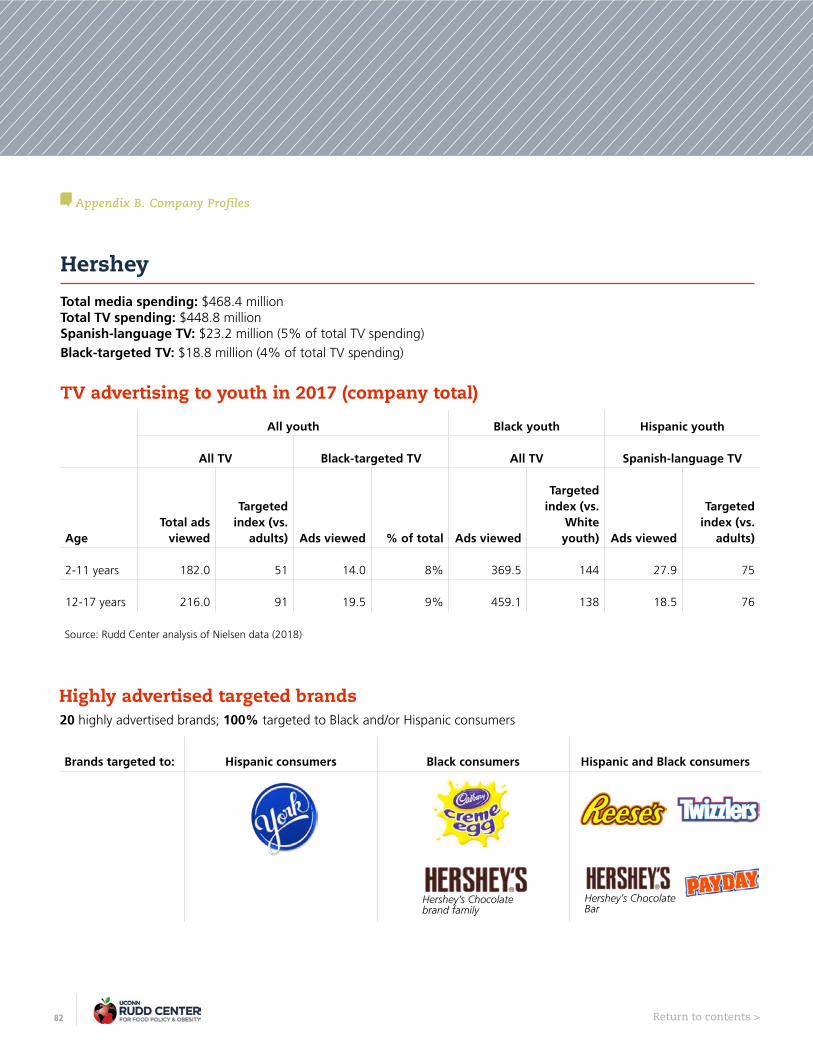
82 Return to contents >
Appendix B. Company Profiles
Hershey
Hershey’s Chocolate brand family
Hershey’s Chocolate Bar
Total media spending: $468.4 millionTotal TV spending: $448.8 million Spanish-language TV: $23.2 million (5% of total TV spending)
Black-targeted TV: $18.8 million (4% of total TV spending)
TV advertising to youth in 2017 (company total)
All youth Black youth Hispanic youth
All TV Black-targeted TV All TV Spanish-language TV
AgeTotal ads
viewed
Targeted index (vs.
adults) Ads viewed % of total Ads viewed
Targeted index (vs.
White youth) Ads viewed
Targeted index (vs.
adults)
2-11 years 182.0 51 14.0 8% 369.5 144 27.9 75
12-17 years 216.0 91 19.5 9% 459.1 138 18.5 76
Source: Rudd Center analysis of Nielsen data (2018)
20 highly advertised brands; 100% targeted to Black and/or Hispanic consumers
Highly advertised targeted brands
Brands targeted to: Hispanic consumers Black consumers Hispanic and Black consumers
83 Return to contents >
Appendix B. Company Profiles
†
‡
Hershey (continued)
Brands targeted to: Hispanic consumers Black consumers Hispanic and Black consumers
‡ Two varieties: Ice Breakers Breath Mints and Ice Breakers Ice Cubes† Two varieties: Kit Kat and Big Kit Kat
Business opportunity
• In an interview with Portada, Yussef Kuri, New Emerging Consumers Marketing Manager at The Hershey Co., said “Marketing to Latina Millennials is a core component of our overall Hispanic Marketing strategy, especially talking about young moms who are, usually, head of households. For the Hispanic culture, women are the key decision-makers in selecting what products and brands are brought into the household, especially in the food and beverage category. They are equally, or even more important, in building traditions and habits among their family members. Having identified this, we saw a huge opportunity in targeting Latina moms to drive the business for some of our most important brands…”1
Public statements about targeted marketing
84 Return to contents >
Appendix B. Company Profiles
Hershey (continued)
Cultural relevance
• Yussef Kuri also explains a situation when Hispanic-targeted marketing is more important than a total market approach. He offers Hershey’s Milk Chocolate as an example because it is under-indexed with Hispanic consumers. In this case, the company promoted Hershey’s S’mores. “Hershey’s S’mores provided the perfect opportunity to drive trial through a usage occasion that fit with U.S. Hispanic consumers in terms of flavors/palate and one of the core Hispanic values that is ‘sharing good times with the family’,” said Kuri.2
1 Portada (2015). Hershey’s Yussef Kuri – “To Reach Millennials Succesfully it’s Crucial to Let Go of Paradigms and be Open to Learn and Experiment.”. Retrieved from https://www.portada-online.com/2015/09/09/marketer-interview-hershey-co-s-yussef-kuri-to-reach-millennials-succesfully-its-crucial-to-let-go-of-paradigms-and-be-open-to-learn-and-experiment/ 2 Ibid3 The Hershey Company (2015). The Hershey Company Presents The Prestigious Vision Award To Robert Rodriguez At The 28th Hispanic Heritage Awards. Retrieved from https://www.thehersheycompany.com/content/corporate/en_us/news-center/news-detail.html?2089200
Corporate responsibility
• Hershey was a Medallion Sponsor of the Hispanic Heritage Foundation in 2015. The foundation is focused on honoring Latinos across sectors and nations. Javier Idrovo, Vice President and Chief Accounting Officer says, “Hershey is dedicated to the Latino community and providing great career opportunities for Latinos.”3

85 Return to contents >
Appendix B. Company Profiles
KelloggTotal media spending: $345.5 millionTotal TV spending: $202.4 million Spanish-language TV: $35.1 million (17% of total TV spending)
Black-targeted TV: $3.9 million (2% of total TV spending)
TV advertising to youth in 2017 (company total)
All youth Black youth Hispanic youth
All TV Black-targeted TV All TV Spanish-language TV
AgeTotal ads
viewed
Targeted index (vs.
adults) Ads viewed % of total Ads viewed
Targeted index (vs.
White youth) Ads viewed
Targeted index (vs.
adults)
2-11 years 163.7 120 2.8 2% 276.8 111 36.1 76
12-17 years 127.0 137 4.1 3% 261.1 131 24.9 81
Source: Rudd Center analysis of Nielsen data (2018)
12 highly advertised brands; 42% targeted to Black and/or Hispanic consumers
Highly advertised targeted brands
Brands targeted to: Hispanic consumers Black consumers Hispanic and Black consumers
Youth
Targeted to: Children and teens
Targeted to: Teens

86 Return to contents >
Appendix B. Company Profiles
Kellogg (continued)
Brands targeted to: Hispanic consumers Black consumers Hispanic and Black consumers
All ages
Public statements about targeted marketing
Cultural relevance
• In 2017, Kellogg introduced Pringles LOUD, a line of five bold Spanish and Italian inspired flavored chips. The following quotation from a press release elaborates on one flavor, Salsa Fiesta, “In Spanish, ‘salsa’ means ‘sauce’, and ‘fiesta’ means ‘feast’ – which traditionally involves a celebration. So, these corn-based Pringles are a saucy celebration in your mouth.”2
Corporate responsibility
• In the 2015 Kellogg Corporate Responsibility Report, there is mention of a cookbook developed to encourage healthier eating. The report includes a suggestion to pair Corn Flakes with Latin or Caribbean flavors.3
• Kellogg’s Corporate Citizenship Fund has funded the NAACP Law Fellow Program since 2003. This program gives students the opportunity to get work experience at the NAACP headquarters in Baltimore. In 2016, the program was expanded to expose students to “K Values and our commitment to civil rights within the organization and the communities where we live and work,” according to a press release.4,5
1 Ad Age. Hispanic Fact Pack 2018. https://adage.com/trend-reports/report.php?id=1392 Kellogg Company (2017). Pringles® Gets Loud With New, Bold Line-Up. Retrieved from https://www.prnewswire.com/news-releases/pringles-gets-loud-with-new-bold-line-up-300386584.html 3 Kellogg Company (2015). Nourishing Families so They Can Flourish and Thrive. Retrieved from file:///C:/Users/kkb15102/Downloads/Kelloggs_CRR_2015+FINAL.pdf4 NAACP (2017). 2018 Law Fellow Program. Retrieved from https://www.naacp.org/employment/2018-law-fellow-program/ 5 NAACP Columbus (2018). AWARDS AND FELLOWSHIP. Retrieved from http://www.naacpcolumbus.org/awards--fellowship.html
In 2017, Kellogg ranked 47th of the 50 largest advertising spenders in Hispanic-focused media- spending $30.0 million on
all Hispanic media [Spanish-language magazines, newspapers, radio, internet and TV (broadcast, cable, and spot TV)].1

87 Return to contents >
Appendix B. Company Profiles
Kraft HeinzTotal media spending: $514.7 millionTotal TV spending: $213.1 million Spanish-language TV: $10.8 million (5% of total TV spending)
Black-targeted TV: $2.0 million (1% of total TV spending)
TV advertising to youth in 2017 (company total)
All youth Black youth Hispanic youth
All TV Black-targted TV All TV Spanish-language TV
AgeTotal ads
viewed
Targeted index (vs.
adults) Ads viewed % of total Ads viewed
Targeted index (vs.
White youth) Ads viewed
Targeted index (vs.
adults)
2-11 years 268.0 165 1.3 0% 418.1 102 14.5 80
12-17 years 162.0 148 1.8 1% 306.5 117 10.1 84
Source: Rudd Center analysis of Nielsen data (2018)
24 highly advertised brands; 8% targeted to Black and/or Hispanic consumers
Highly advertised targeted brands
Brands targeted to: Hispanic consumers Hispanic and Black consumers
YouthTargeted to: Children and teens
All ages

88 Return to contents >
Appendix B. Company Profiles
Kraft Heinz (continued)
Public statements about targeted marketing
Business opportunity
• In 2018, Kraft Heinz presented a slide show with a post integration business update. When acknowledging the diverse portfolio the company offers to consumers, Kraft Heinz mentions Spanish language consumers and Spanish language mobile visitors as “engagers”. The presentation also notes evolution in the market, stating that five years ago, “ethnic cohorts [were] driving most of population growth” and the industry adaptation was “bolder flavor profiles.”1
1 Kraft Heinz (2018). Post-Integration Business Update. Retrieved from http://ir.kraftheinzcompany.com/static-files/cccb3d02-11b6-4577-b45e-7e8f9d994d43

89 Return to contents >
Appendix B. Company Profiles
Little Caesars EnterprisesTotal media spending: $166.3 millionTotal TV spending: $161.4 million Spanish-language TV: $19.0 million (12% of total TV spending)
Black-targeted TV: $5.1 million (3% of total TV spending)
TV advertising to youth in 2017 (company total)
All youth Black youth Hispanic youth
All TV Black-targeted TV All TV Spanish-language TV
AgeTotal ads
viewed
Targeted index (vs.
adults) Ads viewed % of total Ads viewed
Targeted index (vs.
White youth) Ads viewed
Targeted index (vs.
adults)
2-11 years 49.2 53 2.9 6% 84.6 115 21.1 71
12-17 years 57.6 91 4.0 7% 100.8 105 13.6 69
Source: Rudd Center analysis of Nielsen data (2018)
Highly advertised targeted brands
Brands targeted to: Hispanic and Black consumers
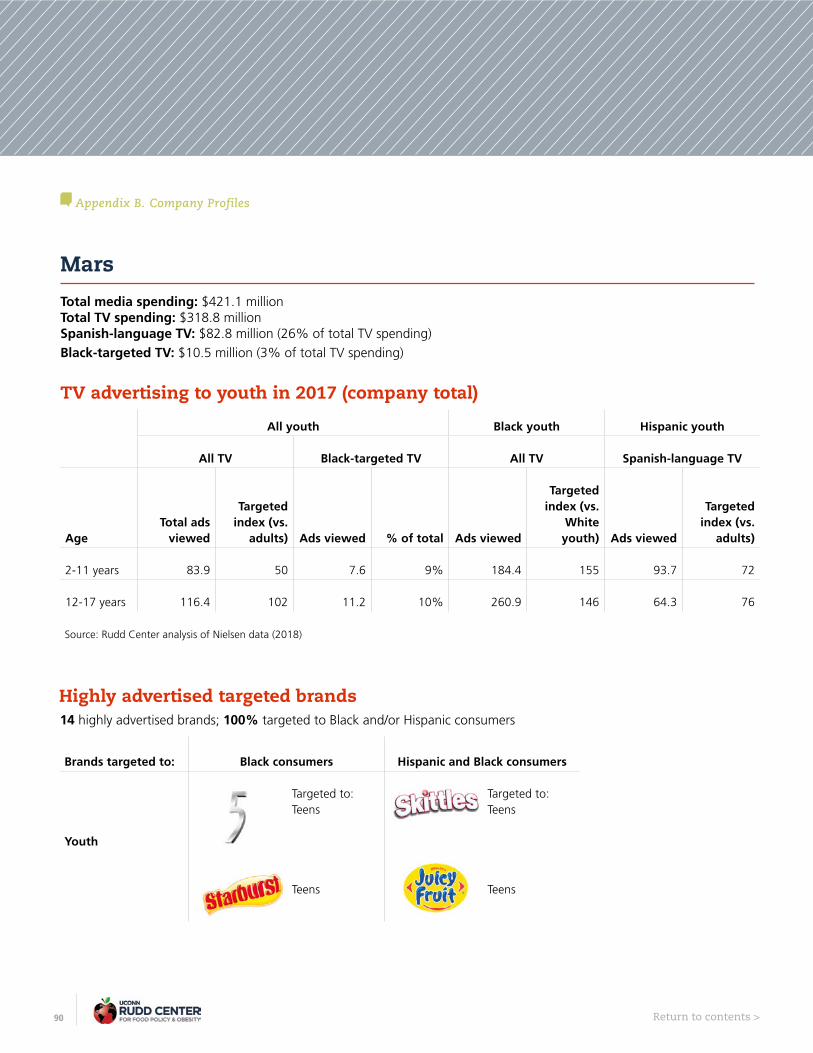
90 Return to contents >
Appendix B. Company Profiles
MarsTotal media spending: $421.1 millionTotal TV spending: $318.8 million Spanish-language TV: $82.8 million (26% of total TV spending)
Black-targeted TV: $10.5 million (3% of total TV spending)
TV advertising to youth in 2017 (company total)
All youth Black youth Hispanic youth
All TV Black-targeted TV All TV Spanish-language TV
AgeTotal ads
viewed
Targeted index (vs.
adults) Ads viewed % of total Ads viewed
Targeted index (vs.
White youth) Ads viewed
Targeted index (vs.
adults)
2-11 years 83.9 50 7.6 9% 184.4 155 93.7 72
12-17 years 116.4 102 11.2 10% 260.9 146 64.3 76
Source: Rudd Center analysis of Nielsen data (2018)
14 highly advertised brands; 100% targeted to Black and/or Hispanic consumers
Highly advertised targeted brands
Brands targeted to: Black consumers Hispanic and Black consumers
Youth
Targeted to: Teens
Targeted to: Teens
Teens Teens
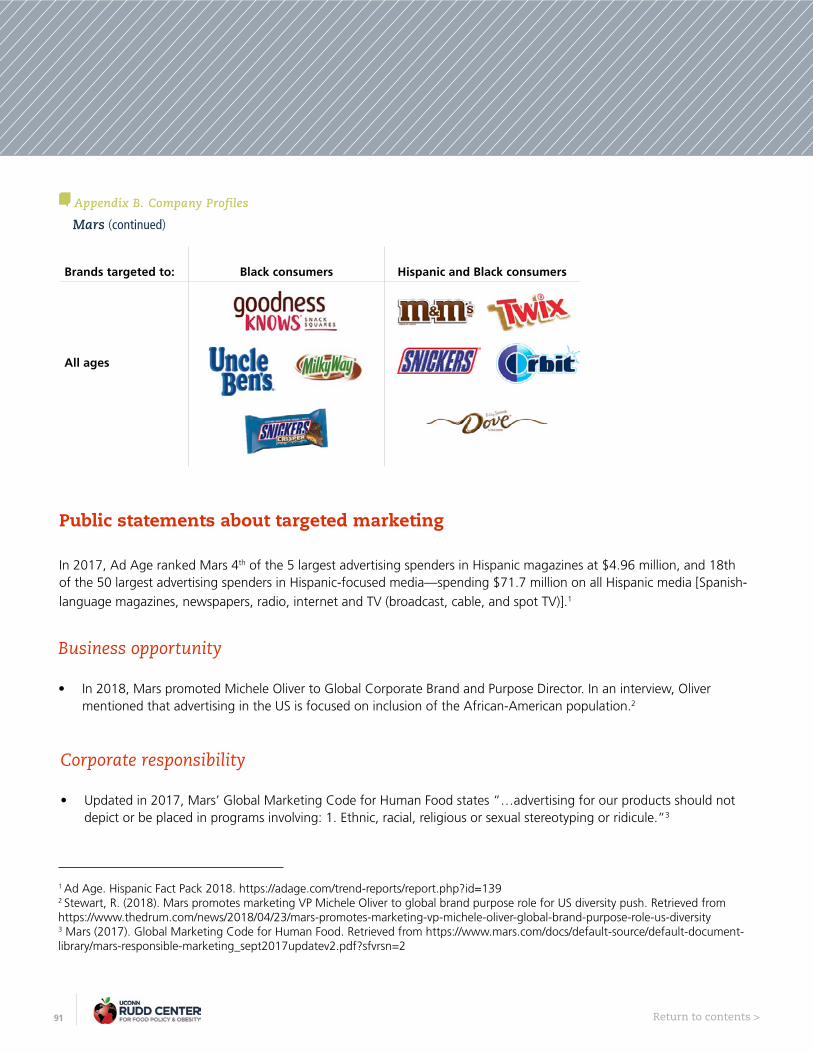
91 Return to contents >
Appendix B. Company Profiles
Mars (continued)
Brands targeted to: Black consumers Hispanic and Black consumers
All ages
Public statements about targeted marketing
In 2017, Ad Age ranked Mars 4th of the 5 largest advertising spenders in Hispanic magazines at $4.96 million, and 18th of the 50 largest advertising spenders in Hispanic-focused media—spending $71.7 million on all Hispanic media [Spanish-
language magazines, newspapers, radio, internet and TV (broadcast, cable, and spot TV)].1
Business opportunity
• In 2018, Mars promoted Michele Oliver to Global Corporate Brand and Purpose Director. In an interview, Oliver mentioned that advertising in the US is focused on inclusion of the African-American population.2
Corporate responsibility
• Updated in 2017, Mars’ Global Marketing Code for Human Food states “…advertising for our products should not depict or be placed in programs involving: 1. Ethnic, racial, religious or sexual stereotyping or ridicule.”3
1 Ad Age. Hispanic Fact Pack 2018. https://adage.com/trend-reports/report.php?id=1392 Stewart, R. (2018). Mars promotes marketing VP Michele Oliver to global brand purpose role for US diversity push. Retrieved from https://www.thedrum.com/news/2018/04/23/mars-promotes-marketing-vp-michele-oliver-global-brand-purpose-role-us-diversity3 Mars (2017). Global Marketing Code for Human Food. Retrieved from https://www.mars.com/docs/default-source/default-document-library/mars-responsible-marketing_sept2017updatev2.pdf?sfvrsn=2

92 Return to contents >
Appendix B. Company Profiles
McDonald’sTotal media spending: $744.4 millionTotal TV spending: $597.3 million Spanish-language TV: $57.8 million (10% of total TV spending)
Black-targeted TV: $7.4 million (1% of total TV spending)
TV advertising to youth in 2017 (company total)
All youth Black youth Hispanic youth
All TV Black-targeted TV All TV Spanish-language TV
AgeTotal ads
viewed
Targeted index (vs.
adults) Ads viewed % of total Ads viewed
Targeted index (vs.
White youth) Ads viewed
Targeted index (vs.
adults)
2-11 years 144.6 140 4.1 3% 247.0 114 43.6 72
12-17 years 97.7 141 5.8 6% 202.3 134 31.4 79
Source: Rudd Center analysis of Nielsen data (2018)
Highly advertised targeted brands
Brands targeted to: Hispanic and Black consumers
Youth Targeted to: Children and teens

93 Return to contents >
Appendix B. Company Profiles
McDonald’s (continued)
Business opportunity
• David Fairhurst, Executive Vice President and Chief People Officer, says newly appointed Vice President and Global Chief Diversity Officer, Wendy Lewis, will use McDonald’s legacy of diversity and inclusion to help grow the company.2
Cultural relevance
• McDonald’s developed a role, Head of Cultural Engagement, to help establish brand loyalty among multicultural consumers. Lizette Williams is the first person to be tasked to this role.3
• McDonald’s maintains three targeted websites: 365 Black, McDonald’s APA (Asian Pacific Americans), and McDonald’s HACER (Hispanic American Commitment to Education Resources).4,5,6
Public statements about targeted marketing
In 2017, Ad Age ranked McDonald’s 5th of the 5 largest advertising spenders in Spanish-language radio at $6.9 million, and 22nd of the 50 largest advertising spenders in Hispanic-focused media—spending $69.3 million on all Hispanic media
[Spanish-language magazines, newspapers, radio, internet and TV (broadcast, cable, and spot TV)].1
Corporate responsibility
• In 2015, Ronald McDonald House Charities (RMHC) and the Hispanic American Commitment to Education Resources (HACER) National Scholarship changed the scholarship to include a monetary gift and membership in a mentorship program.7
• In 2016, McDonald’s in collaboration with the American Black Film Festival, hosted a video competition called “My Community”. The submissions were required to embody the McDonald’s 365Black mantra, ‘Deeply Rooted in Your Community’. The grand prize included $2,500 in film equipment and a feature on the McDonald’s 365 Black
website.8

94 Return to contents >
Appendix B. Company Profiles
McDonald’s (continued)
1 Ad Age. Hispanic Fact Pack 2018. https://adage.com/trend-reports/report.php?id=1392 McDonald’s (2016). McDonald’s Names MLB’s Wendy Lewis as Global Chief Diversity Officer. Retrieved from http://news.mcdonalds.com/stories/company-news-details/mcdonalds-names-mlbs-wendy-lewis-global-chief-diversity-officer3 Rittenhouse, L. (2018). McDonald’s Taps New Leaders to Oversee Brand Content and Cultural Engagement. Retrieved from https://www.adweek.com/agencies/mcdonalds-taps-new-leaders-to-oversee-brand-content-and-cultural-engagement/4 McDonald’s (2018). McDonald’s 365 Black. Retrieved from https://www.mcdonalds.com/us/en-us/365black.html5 McDonald’s (2018). McDonald’s APA. Retrieved from https://www.mcdonalds.com/us/en-us/asian-pacific-americans/en.html6 McDonald’s (2018). HACER® Scholarships for Hispanic Students | McDonald’s. Retrieved from https://www.mcdonalds.com/us/en-us/community/hacer.html7 McDonald’s (2016). McDonald’s Donates $500,000 in Hispanic Student Scholarships. Retrieved from http://news.mcdonalds.com/stories/company-news-details/mcdonalds-donates-500000-hispanic-student-scholarships8 American Black Film Festival (2016). McDonald’s and American Black Film Festival Return with National Video Competition for Rising Filmmakers. Retrieved from http://www.abff.com/mcdonalds-and-american-black-film-festival-return-with-national-video-competition-for-rising-filmmakers/.
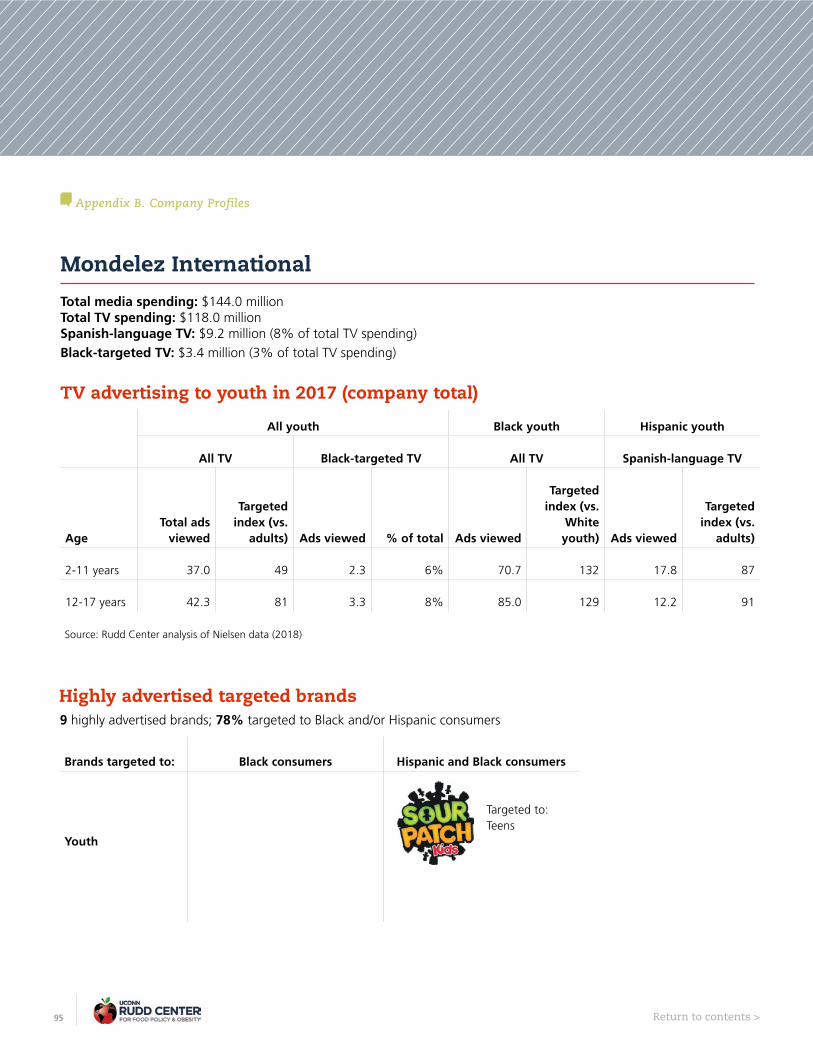
95 Return to contents >
Appendix B. Company Profiles
Mondelez InternationalTotal media spending: $144.0 millionTotal TV spending: $118.0 million Spanish-language TV: $9.2 million (8% of total TV spending)
Black-targeted TV: $3.4 million (3% of total TV spending)
TV advertising to youth in 2017 (company total)
All youth Black youth Hispanic youth
All TV Black-targeted TV All TV Spanish-language TV
AgeTotal ads
viewed
Targeted index (vs.
adults) Ads viewed % of total Ads viewed
Targeted index (vs.
White youth) Ads viewed
Targeted index (vs.
adults)
2-11 years 37.0 49 2.3 6% 70.7 132 17.8 87
12-17 years 42.3 81 3.3 8% 85.0 129 12.2 91
Source: Rudd Center analysis of Nielsen data (2018)
9 highly advertised brands; 78% targeted to Black and/or Hispanic consumers
Highly advertised targeted brands
Brands targeted to: Black consumers Hispanic and Black consumers
Youth
Targeted to: Teens

96 Return to contents >
Appendix B. Company Profiles
Mondelez International (continued)
†
Brands targeted to: Black consumers Hispanic and Black consumers
All ages
Public statements about targeted marketing
Cultural relevance
• At the 2015 Leading the Change conference, belVita was offered as a case study in growth. Gary Osifchin, Portfolio Lead, Biscuits North America explains, “We knew we could leverage the existing campaign … which was resonating. But we needed to do it with a Latino point of view in order to figure out the right tone of voice, and the scenarios that made more sense to the Hispanic audience.” Osifchin goes on to say, “Creating a campaign that will appeal to target consumer by exhibiting cultural nuance always goes a long way with Hispanics. This is not an exercise in translating creative from English to Spanish.”1
• The Mondelez International Foodservice website listed 10 Snack & Dessert Trends for 2016 states,“…consumers also are gravitating toward spicy-salty-savory ethnic snacks, opting for such selections as hummus variations, flavored popcorn, chili-citrus potato chips, and mango-chili-lime chips.”2
1 Sanderson, L. (2015). A Breakfast Breakthrough: How a Mondelez Brand Grew Hispanic Dollar Sales 38%. Retrieved from https://corporate.univision.com/blog/cpg/2015/12/10/breakfast-breakthrough-mondelez-grew-hispanic-sales/2 Mondelez International Foodservice (2015). 10 SNACK & DESSERT TRENDS FOR 2016. Retrieved from https://www.foodservice-snacks-desserts.com/productsandbrands/industrynews/tensnackdesserttrendsfor2016
† Two varieties: Nabisco Ritz Crackers and Ritz Snacks

97 Return to contents >
Appendix B. Company Profiles
NestleTotal media spending: $270.2 millionTotal TV spending: $223.7 million Spanish-language TV: $54.1 million (24% of total TV spending)
Black-targeted TV: $2.0 million (1% of total TV spending)
TV advertising to youth in 2017 (company total)
All youth Black youth Hispanic youth
All TV Black-targeted TV All TV Spanish-language TV
AgeTotal ads
viewed
Targeted index (vs.
adults) Ads viewed % of total Ads viewed
Targeted index (vs.
White youth) Ads viewed
Targeted index (vs.
adults)
2-11 years 83.7 51 1.5 2% 145.0 114 64.7 80
12-17 years 92.2 85 1.9 2% 168.8 110 45.0 84
Source: Rudd Center analysis of Nielsen data (2018)
16 highly advertised brands; 63% targeted to Black and/or Hispanic consumers
Highly advertised targeted brands
Brands targeted to: Hispanic consumers Black consumers Hispanic and Black consumers

98 Return to contents >
Appendix B. Company Profiles
Nestle (continued)
Business opportunity
• Margie Bravo, Multicultural Marketing Manager, talked about trends in bicultural Hispanic growth in a 2017 presentation and interview. Bravo said most of the growth can be attributed to U.S. born Hispanics as compared to immigration. She acknowledges that the average age of the 2nd generation is 19 (millennial age) and describes the current U.S. market as “…people who are bicultural by nature” and says, “People are becoming a lot more aware of that multicultural consumer.”2
• In a 2017 Portada interview, Margie Bravo talks about multicultural marketing best practices. Discussing Hispanic consumers, Bravo says: “They also have larger households with multigenerational family members, and are having more kids, which opens consumption for a great number of categories.”3 She also discusses the importance of focusing on who will be buying the products in the future, “Consumers of tomorrow,” rather than just who is buying the products now.
Cultural relevance
• The Nestle Professional website discussed food trends in 2017, specifically emphasizing how fast casual restaurants might adjust to the preferences of millennials and Generation Z through incorporating “ethnic flavors”. The website states, “Millennials are more likely than their older counterparts to consider ethnic cuisines as simply cuisine. And the multicultural Generation Z, now approaching adulthood, also embraces ethnic cuisine, often preferring it to regional American flavors.”4
• In 2017, new Asian and Italian-inspired flavors were introduced to Lean Cuisine Marketplace. A 2017 press release states, “The entire Lean Cuisine Marketplace line offers modern options to explore flavors inspired by cuisines from around the world. Shoppers are increasingly looking for global flavors, with 38 percent of U.S. adults reporting that they eat foods containing multicultural flavors one or more times per week. With the new recipes, the Lean Cuisine culinary team delivers on emerging consumer trends featuring thoughtfully paired ingredients and sought-after flavors.”5
Public statements about targeted marketing
In 2017, Ad Age ranked Nestle 26th of the 50 largest advertising spenders in Hispanic focused media- spending $57.7 million on all Hispanic media [Spanish-language magazines, newspapers, radio, internet and TV (broadcast, cable, and spot TV)].1

99 Return to contents >
Appendix B. Company Profiles
Nestle (continued)
1 Ad Age. Hispanic Fact Pack 2018. https://adage.com/trend-reports/report.php?id=1392 National Public Radio. (2017). How DiGiorno Set It Sights on the Latino Market. Retrieved from https://www.npr.org/2017/10/06/554566335/how-digiorno-set-it-sights-on-the-latino-market3 Gardner, G. (2017). How Nestle Is Preparing Itself for a Multicultural World. Retrieved from https://www.portada-online.com/2017/10/16/how-nestle-is-preparing-itself-for-a-multicultural-world/4 Nestle (2017). Regional and Ethnic Flavor Boosts for Fast Casual Restaurants. Retrieved from https://www.nestleprofessional.us/trends/regional-and-ethnic-flavor-boosts-fast-casual-restaurants5 Nestle (2017). Lean Cuisine Keeps it Fresh in the Freezer with New Chef-Inspired Modern Flavors. Retrieved from https://www.nestleusa.com/media/pressreleases/lean-cuisine-expanding-chef-inspired-modern-flavors6 Nestle (2011). Nestlé Consumer Communication Principles. Retrieved from http://www.nestle.com/asset-library/documents/library/documents/about_us/communication-principles.pdf7 Nestle (2015). NESTLÉ® PURE LIFE® Kicks off The Ripple Effect Movement to Encourage Healthy Hydration Habits Among Kids. Retrieved from https://www.prnewswire.com/news-releases/nestle-pure-life-kicks-off-the-ripple-effect-movement-to-encourage-healthy-hydration-habits-among-kids-300143584.html8 Nestle Waters (2016). Facts & Figures 2016. Retrieved from https://www.nestle-waters.com/aboutus/key-figures/documents/factsfigures2016.pdf
• The Nestle Consumer Communication Principles from 2011 state “Advertising content must not depict attitudes that are discriminatory or offensive to religious, ethnic, political, cultural or social groups.”6
• Nestle partnered with Michelle Obama’s Drink Up campaign and After School All Stars (ASAS) to encourage healthy hydration habits among kids through a program called The Ripple Effect. ASAS serves predominantly low-income youth of color, with 91% of current participants being youth of color and 86% qualifying for the Federal Free and Reduced Lunch Program.7,8
Corporate responsibility
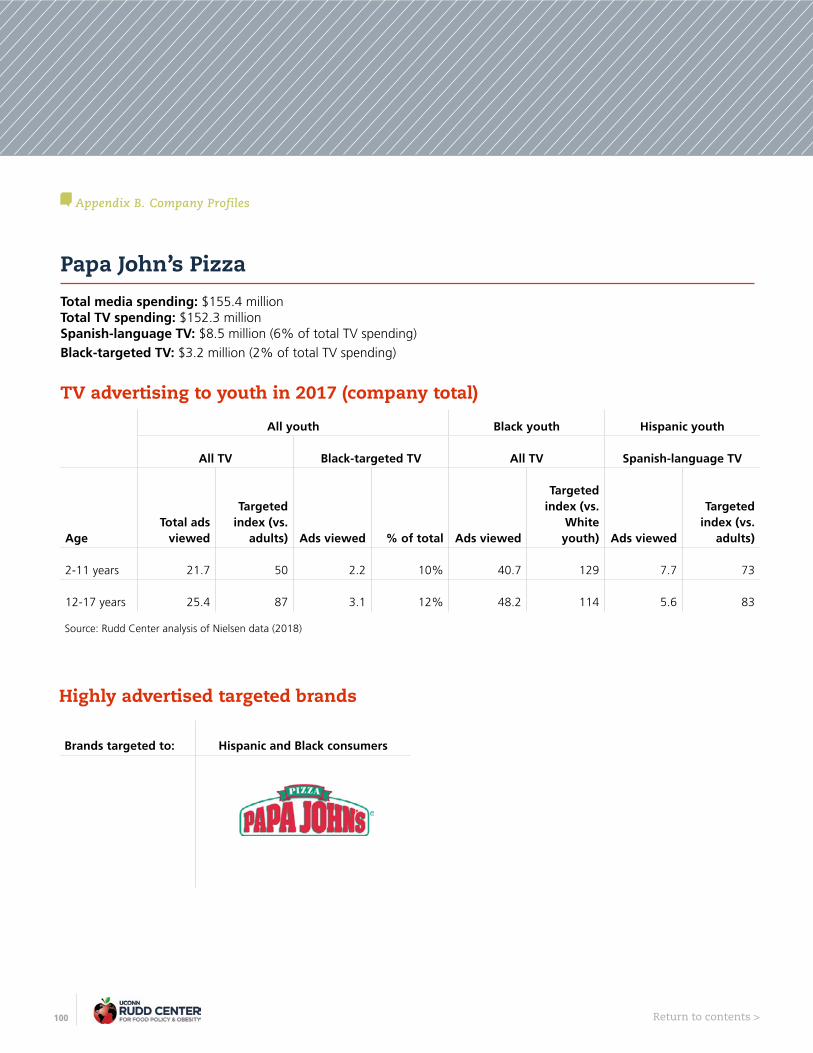
100 Return to contents >
Appendix B. Company Profiles
Papa John’s PizzaTotal media spending: $155.4 millionTotal TV spending: $152.3 million Spanish-language TV: $8.5 million (6% of total TV spending)
Black-targeted TV: $3.2 million (2% of total TV spending)
TV advertising to youth in 2017 (company total)
All youth Black youth Hispanic youth
All TV Black-targeted TV All TV Spanish-language TV
AgeTotal ads
viewed
Targeted index (vs.
adults) Ads viewed % of total Ads viewed
Targeted index (vs.
White youth) Ads viewed
Targeted index (vs.
adults)
2-11 years 21.7 50 2.2 10% 40.7 129 7.7 73
12-17 years 25.4 87 3.1 12% 48.2 114 5.6 83
Source: Rudd Center analysis of Nielsen data (2018)
Highly advertised targeted brands
Brands targeted to: Hispanic and Black consumers
101 Return to contents >
Appendix B. Company Profiles
Papa John’s Pizza (continued)
Business opportunity
• In 2014, Papa John’s was named Univision’s Trailblazers Newcomer of the year. CEO, John Schnatter, noted increases in Hispanic spending through dollar sales, check totals and items per customer. Schnatter also highlighted steps taken to continue to appeal to the Hispanic market, “We’d been doing really well in Latin America – Chile, Peru, Panama, Costa Rica – so I felt for some time that we could do well with this demographic in the states. We hired a Director of Hispanic Marketing, North & Latin America and worked with the franchisees across the country to show that this is a
demographic on the move and needed to put some money out there to get it rolling.”1
Cultural relevance
• In a 2017 interview, Daniel Rosas, Senior Director Multi-Cultural Marketing at Papa John’s talked about rebranding the company. “In our research efforts to develop the new brand platform, we looked at general market and multicultural audiences’ trends. Regarding the US Hispanic market specifically, we understand it is diverse. Yet, we discovered they share one thing in common: love for family. We believe our brand messaging can resonate with the Hispanic consumer given our campaign is all about family and celebrating the people who work at Papa John’s.”2
• The company has also had a Spanish-language version of their website since 2006 where visitors can read about new products and order in Spanish (www.espanol.papajohns.com).3
Public statements about targeted marketing
• Papa John’s hosted an inaugural Youth Baseball Invitational in 2015 in partnership with the city of Hialeah, FL. Hialeah Parks and Recreation Director Joe Dziedzic said, “Papa John’s is looking to reach out to the Hispanic community and this provided a wonderful opportunity to kids who may not be these kinds of opportunities ever again.”4
Corporate responsibility
1 Filiaci, P. (2015). Papa John’s Founder and CEO John Schnatter on Focus and his Hispanic Play. Retrieved from https://corporate.univision.com/blog/2015/04/13/papa-johns-founder-and-ceo-john-schnatter-on-focus-and-his-hispanic-play/2 Portada (2017). Papa John’s Daniel Rosas: “Super Bowl is our #1 Sales and Delivery Day of the Year.” Retrieved from https://www.portada-online.com/2017/02/06/papa-johns-daniel-rosas-super-bowl-is-our-1-sales-and-delivery-day-of-the-year/3 Papa Johns (2006). SE HABLA ESPANOL -- PAPA JOHN’S INTRODUCES ONLINE ORDERING IN SPANISH. Retrieved from https://ir.papajohns.com/news-releases/news-release-details/se-habla-espanol-papa-johns-introduces-online-ordering-spanish4 Hidalgo, D. (2015). Papa John’s, Hialeah inaugurate Youth Baseball Invitational Tournament. Retrieved from https://www.miamiherald.com/sports/youth-sports/article24890506.html

102 Return to contents >
Appendix B. Company Profiles
PepsiCoTotal media spending: $718.4 millionTotal TV spending: $602.5 million Spanish-language TV: $23.0 million (4% of total TV spending)
Black-targeted TV: $23.4 million (4% of total TV spending)
TV advertising to youth in 2017 (company total)
All youth Black youth Hispanic youth
All TV Black-targeted TV All TV Spanish-language TV
AgeTotal ads
viewed
Targeted index (vs.
adults) Ads viewed % of total Ads viewed
Targeted index (vs.
White youth) Ads viewed
Targeted index (vs.
adults)
2-11 years 175.2 53 14.6 8% 348.3 139 31.3 75
12-17 years 214.4 94 20.1 9% 446.0 134 22.5 83
Source: Rudd Center analysis of Nielsen data (2018)
30 highly advertised brands; 73% targeted to Black and/or Hispanic consumers
Highly advertised targeted brands
Brands targeted to: Black consumers Hispanic and Black consumers
Youth
Targeted to: Teens
Teens
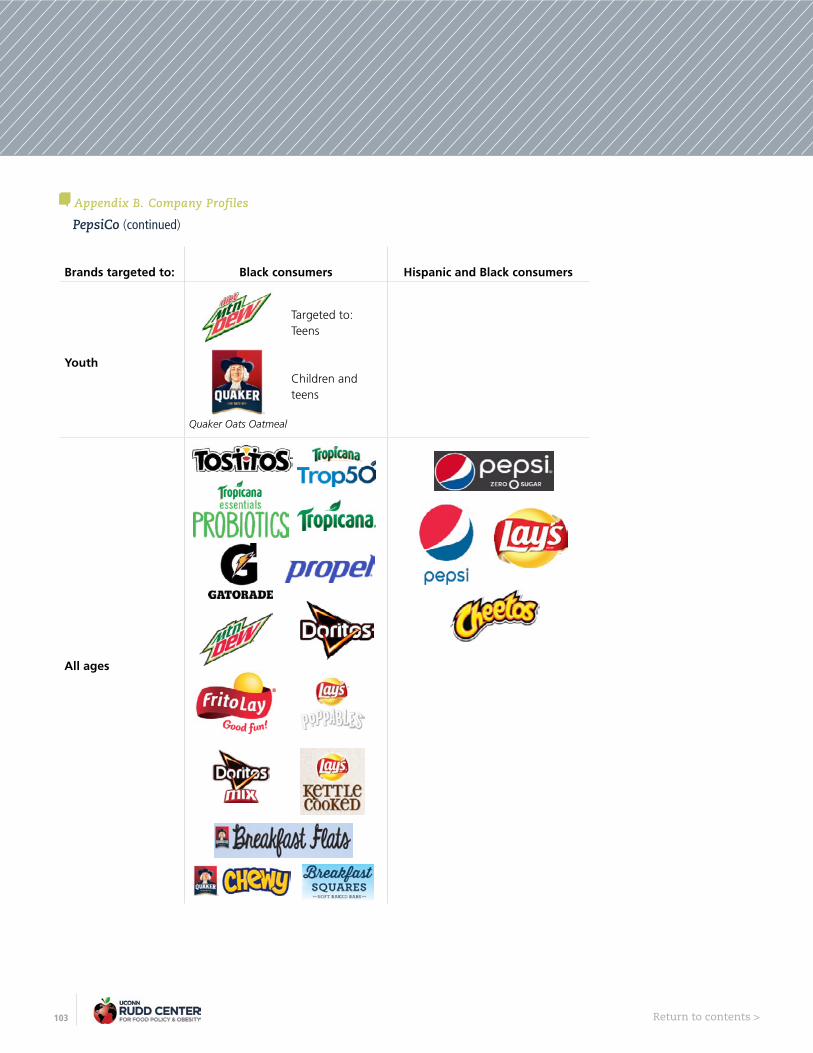
103 Return to contents >
Appendix B. Company Profiles
PepsiCo (continued)
Quaker Oats Oatmeal
Brands targeted to: Black consumers Hispanic and Black consumers
Youth
Targeted to: Teens
Children and teens
All ages

104 Return to contents >
Appendix B. Company Profiles
PepsiCo (continued)
Cultural relevance
• With reference to MTN DEW ICE, a lemon-lime soda with caffeine launched in 2018, Roberto Rios, PepsiCo North America Beverages’ senior vice president of marketing for carbonated soft drinks said, “The lemon-lime category has two core consumer groups – parents who buy the drink at the supermarket for their family and multicultural Millennials looking for a refreshing beverage.”1
• Pepsi Limon, a recipe with 2% real lime juice and added sugar, was developed in 2015. This idea was spearheaded by Adelante, PepsiCo’s internal Latino/Hispanic employee group. PepsiCo said Pepsi Limon, “captures the tart, refreshing taste that Hispanics love to enjoy with their meals and in their beverages.” Melissa Miranda, senior manager of cultural and commercial strategy said, “Pepsi knows the importance of authentic flavor... Pepsi’s roots have long showcased the brand’s connection and affinity with Hispanic consumers and Pepsi Limón was created with those consumer preferences in mind.”2,3,4
• In July of 2015, PepsiCo and the NBA established a 5 year partnership. This partnership highlights the following snack and beverage brands: Mountain Dew, Aquafina, Brisk, Doritos, and Ruffles. A Pepsi marketer said, “The fit is a natural one and we see it as a perfect way to target male multicultural millennials.” They also alluded to the potential for future global growth for the company following this U.S. based partnership, “…don’t discount the value of this in the China market, where the NBA is red hot.”5,6
Public statements about targeted marketing
• In 2017, PepsiCo’s Mountain Dew presented the Miami Heat 12th annual Hispanic Heritage Month Celebration with support from Florida Blue, FOX Sports Sun and Verizon. Luis Lopez del Castillo, Marketing Manager PepsiCo, SE Region, was in attendance.7
• Tostitos, in partnership with the Cesar Chavez Foundation, offered financial assistance for the 2017-2018 academic year to students of Latino descent through the Tostitos Cesar Chavez Latino Scholarship fund.8
Corporate responsibility

105 Return to contents >
Appendix B. Company Profiles
PepsiCo (continued)
1 Meyer, Z. (2018). Mountain Dew’s new lemon-lime flavor takes aim at Sprite, 7up. Retrieved from https://www.usatoday.com/story/money/2018/01/09/mountain-dews-new-lemon-lime-flavor-takes-aim-sprite-7-up/1013756001/2 FoodBev Media (2015). PepsiCo targets Hispanic market with launch of lime-flavoured Pepsi Limón. Retrieved from https://www.foodbev.com/news/pepsico-targets-hispanic-market-with-launch-of-lime-flavoured-pepsi-limon/ 3 Wu, A. (2015). Pepsi Thinks Its New Cola Formula Is the Magical Mix for the Hispanic Market. Retrieved fromhttps://www.theepochtimes.com/pepsi-thinks-its-new-cola-formula-is-the-magical-mix-for-the-hispanic-market_1333092.html 4 Schultz, E. (2015). Coming Soon: Pepsi ‘Limon’ With Real Lime Juice. Retrieved from http://adage.com/article/cmo-strategy/coming-pepsi-limon-real-lime-juice/298184/ 5 Lefton, T. (2015). Pepsi takes over as NBA sponsor in new deal. Retrieved fromhttps://www.sportsbusinessdaily.com/Journal/Issues/2015/04/13/Marketing-and-Sponsorship/Pepsi-NBA.aspx 6 Cheng, A. (2015). Mountain Dew is the all-star in PepsiCo’s NBA deal. Retrieved from https://www.marketwatch.com/story/mountain-dew-is-the-all-star-in-pepsicos-nba-deal-2015-04-147 NBA (2017). 12th Annual Hispanic Heritage Celebration Recap. Retrieved from https://www.nba.com/heat/community/12th-annual-hispanic-heritage-celebration-recap8 Cesar Chavez Foundation (2018). Education Fund. Retrieved from https://chavezfoundation.org/education-fund/

106 Return to contents >
Appendix B. Company Profiles
Popeyes Louisiana KitchenTotal media spending: $139.1 millionTotal TV spending: $135.6 million Spanish-language TV: $21.4 million (16% of total TV spending)
Black-targeted TV: $3.1 million (2% of total TV spending)
TV advertising to youth in 2017 (company total)
All youth Black youth Hispanic youth
All TV Black-targeted TV All TV Spanish-language TV
AgeTotal ads
viewed
Targeted index (vs.
adults) Ads viewed % of total Ads viewed
Targeted index (vs.
White youth) Ads viewed
Targeted index (vs.
adults)
2-11 years 31.8 63 1.8 6% 51.8 120 20.0 78
12-17 years 36.2 106 2.3 6% 60.2 107 15.4 91
Source: Rudd Center analysis of Nielsen data (2018)
Highly advertised targeted brands
Brands targeted to: Hispanic and Black consumers

107 Return to contents >
Appendix B. Company Profiles
Popeyes Louisiana Kitchen (continued)
Business opportunity
• “The ability to effectively reach out to our Hispanic audience is key to our plan to continue to grow Popeyes. Our Louisiana-style cooking has appeal wherever we take it, and we know that having a great partner [Sibling media agency] that understands both our audience and our brand will help us bring Popeyes to our Hispanic guests and extend our reach.” Hector Muñoz, Chief Marketing Officer of Popeyes Louisiana Kitchen.1
• “We believe we have an opportunity to become even more relevant with this very fast-growing segment in the U.S.,” Hector Munoz, chief marketing officer at Popeyes Louisiana Kitchen.2
Public statements about targeted marketing
1 GSD&M (2015). Leadership from LatinWorks and GSD&M Create Sibling. Retrieved from https://www.prnewswire.com/news-releases/leadership-from-latinworks-and-gsdm-create-sibling-300076475.html2 Ruggless, R. (20115). Study: U.S. Hispanics increase restaurant use. Retrieved from https://www.nrn.com/consumer-trends/study-us-hispanics-increase-restaurant-use

108 Return to contents >
Appendix B. Company Profiles
Post Consumer BrandsTotal media spending: $49.1 millionTotal TV spending: $48.4 million Spanish-language TV: $11.0 million (23% of total TV spending)
Black-targeted TV: $1.6 million (3% of total TV spending)
TV advertising to youth in 2017 (company total)
All youth Black youth Hispanic youth
All TV Black-targeted TV All TV Spanish-language TV
AgeTotal ads
viewed
Targeted index (vs.
adults) Ads viewed % of total Ads viewed
Targeted index (vs.
White youth) Ads viewed
Targeted index (vs.
adults)
2-11 years 50.7 156 1.1 2% 80.5 108 16.0 76
12-17 years 32.5 148 1.5 5% 61.9 123 10.1 80
Source: Rudd Center analysis of Nielsen data (2018)
Highly advertised targeted brands
Brands targeted to: Hispanic and Black consumers
2 highly advertised brands; 50% targeted to Black and/or Hispanic consumers

109 Return to contents >
Appendix B. Company Profiles
Post Consumer Brands (continued)
Cultural relevance
• In 2016, Post Consumer Brands named LatinWorks its Hispanic Agency of Record. The first two targeted products were to be Honey Bunches of Oats and PEBBLES. Melissa Saldana-Chase, Sr. Associate Marketing Manager, Multicultural, said, “We are incredibly proud that Honey Bunches of Oats® is the #1 ready-to-eat cereal brand among Hispanics in the United States, and are continuing our commitment to support and engage with this growing audience through culturally-relevant content and meaningful experiences.” An executive from LatinWorks , Christy Kranik, said, “Post Consumer Brands has been a leader in Hispanic marketing for many years so we were excited when the opportunity to share our thinking and join this award-winning team presented itself.”1
Public statements about targeted marketing
1 Hispanic Market Work (2016). Advertising World Braces for Uncertainty and, Changes Under Trump. Retrieved from http://www.hispanicmarketworks.org/category/newsletter/focusonadvertising/

110 Return to contents >
Appendix B. Company Profiles
Roark Capital GroupTotal media spending: $352.9 millionTotal TV spending: $321.5 million Spanish-language TV: $6.5 million (2% of total TV spending)
Black-targeted TV: $11.5 million (4% of total TV spending)
TV advertising to youth in 2017 (company total)
All youth Black youth Hispanic youth
All TV Black-targeted TV All TV Spanish-language TV
AgeTotal ads
viewed
Targeted index (vs.
adults) Ads viewed % of total Ads viewed
Targeted index (vs.
White youth) Ads viewed
Targeted index (vs.
adults)
2-11 years 69.2 55 6.0 9% 124.7 131 7.1 66
12-17 years 89.7 104 8.3 9% 166.6 119 4.6 67
Source: Rudd Center analysis of Nielsen data (2018)
6 highly advertised brands; 67% targeted to Black and/or Hispanic consumers
Highly advertised targeted brands
Brands targeted to: Hispanic consumers Black consumers Hispanic and Black consumers
Youth
Targeted to: Teens
Targeted to: Teens
Teens

111 Return to contents >
Appendix B. Company Profiles
Roark Capital Group (continued)
Brands targeted to: Hispanic consumers Black consumers Hispanic and Black consumers
All ages
Public statements about targeted marketing
Cultural relevance
• In 2018, Jim Taylor, CMO for Arby’s Restaurant Group Inc., said Arby’s is looking to add ethnic items to their menu.1
1 Smith, T. (2018). Arby’s Still Going Big with Beef. Retrieved from https://www.angus.org/Media/News/FullArticle.aspx?aiID=936&asTitle=Arbys-Still-Going-Big-with-Beef
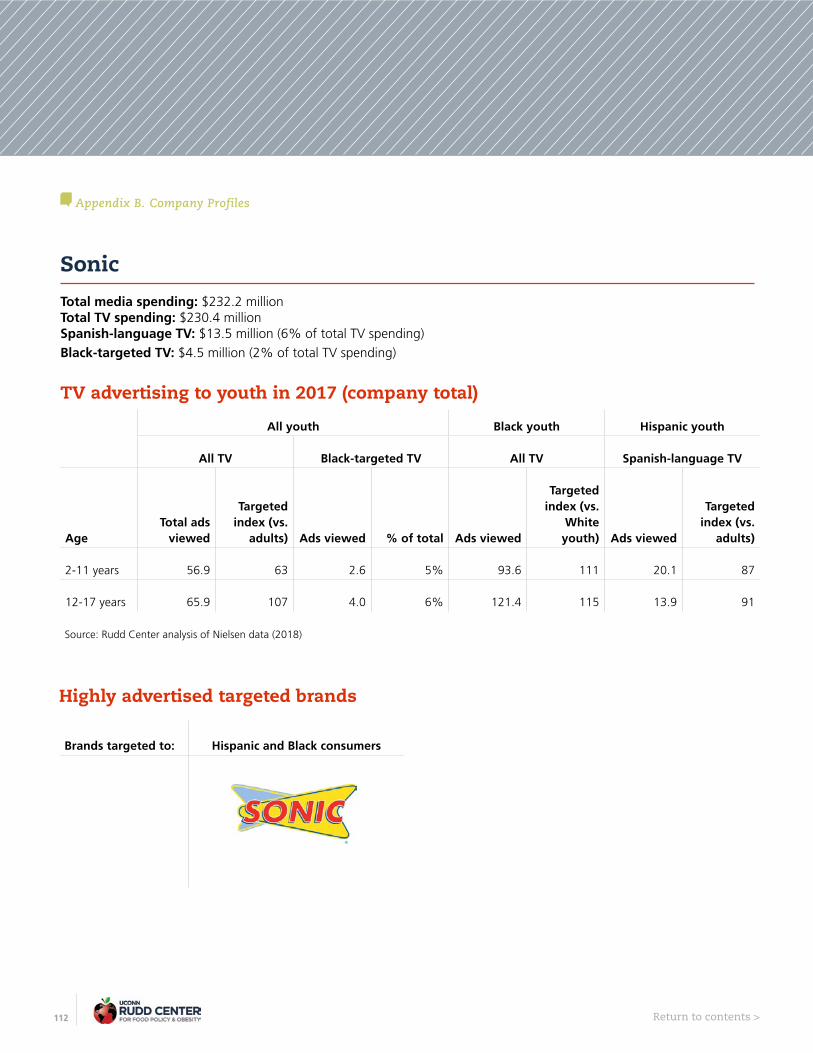
112 Return to contents >
Appendix B. Company Profiles
SonicTotal media spending: $232.2 millionTotal TV spending: $230.4 million Spanish-language TV: $13.5 million (6% of total TV spending)
Black-targeted TV: $4.5 million (2% of total TV spending)
TV advertising to youth in 2017 (company total)
All youth Black youth Hispanic youth
All TV Black-targeted TV All TV Spanish-language TV
AgeTotal ads
viewed
Targeted index (vs.
adults) Ads viewed % of total Ads viewed
Targeted index (vs.
White youth) Ads viewed
Targeted index (vs.
adults)
2-11 years 56.9 63 2.6 5% 93.6 111 20.1 87
12-17 years 65.9 107 4.0 6% 121.4 115 13.9 91
Source: Rudd Center analysis of Nielsen data (2018)
Highly advertised targeted brands
Brands targeted to: Hispanic and Black consumers
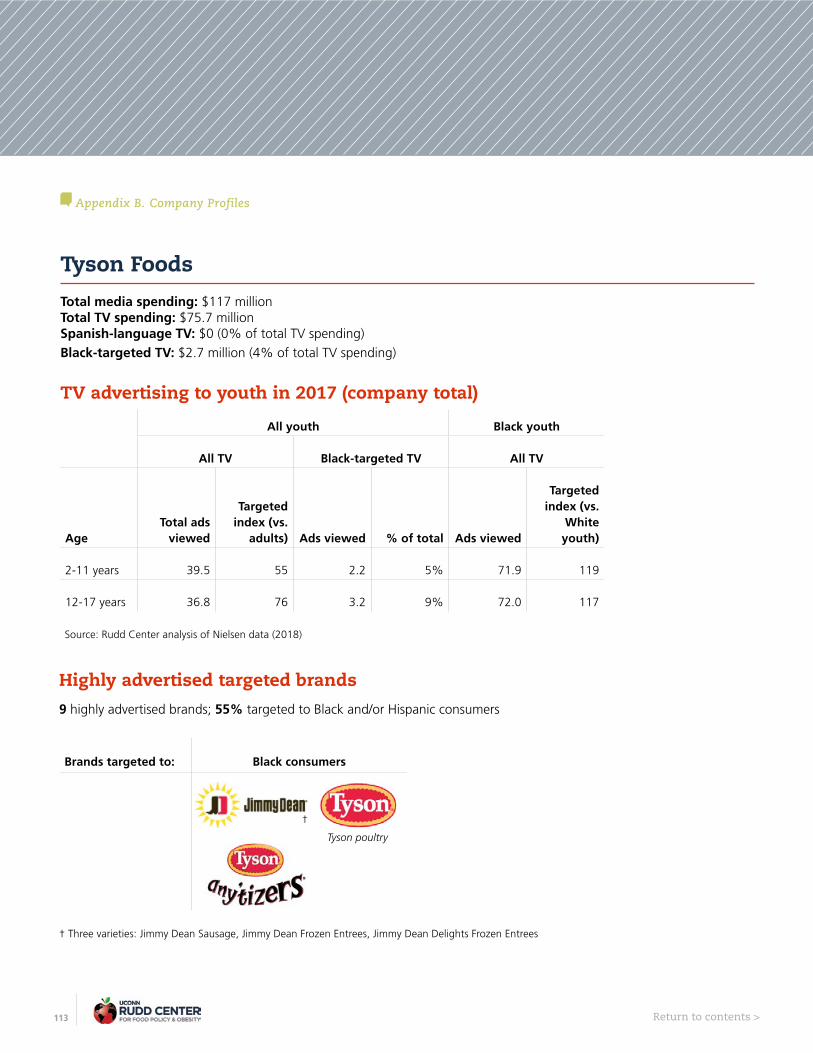
113 Return to contents >
Appendix B. Company Profiles
Tyson Foods
†
Tyson poultry
Total media spending: $117 millionTotal TV spending: $75.7 million Spanish-language TV: $0 (0% of total TV spending)
Black-targeted TV: $2.7 million (4% of total TV spending)
TV advertising to youth in 2017 (company total)
All youth Black youth
All TV Black-targeted TV All TV
AgeTotal ads
viewed
Targeted index (vs.
adults) Ads viewed % of total Ads viewed
Targeted index (vs.
White youth)
2-11 years 39.5 55 2.2 5% 71.9 119
12-17 years 36.8 76 3.2 9% 72.0 117
Source: Rudd Center analysis of Nielsen data (2018)
Highly advertised targeted brands
Brands targeted to: Black consumers
9 highly advertised brands; 55% targeted to Black and/or Hispanic consumers
† Three varieties: Jimmy Dean Sausage, Jimmy Dean Frozen Entrees, Jimmy Dean Delights Frozen Entrees
114 Return to contents >
Appendix B. Company Profiles
Tyson Foods (continued)
Corporate responsibility
• In 2015, the League of United Latin American Citizens (LULAC) and Tyson Foods collectively donated 33,000 lbs of protein to the Capital Area Food Banks in Washington D.C.1
• In 2015, the League of United Latin American Citizens (LULAC), Tyson & Roadrunner Food Bank donated food to residents of New Mexico.2
• The Chicago Foods Scholar Intern Program, supported by Congressional Hispanic Caucus Institute (CHCI) and Tyson, offers a scholarship and a paid internship at Tyson Foods’ office in Chicago. The program offers a scholarship in addition to a paid internship at Tyson Foods office in Chicago.3
• The Spanish American Civic Association (SACA) received a $50,000 gift from Tyson Foods for a meal program.4,5
• Tyson donated 16,800 lbs of chicken to Liberty’s Kitchen for a National Fried Chicken Festival in 2017. This event is a fundraiser for Liberty’s Kitchen which “creates pathways for New Orleans youth to create and achieve their vision of success through workforce training, leadership development and support of health lifestyles,” according to their website.6
Public statements about targeted marketing
1 Hispanic PR Blog (2017). LULAC and Tyson Foods Donate 33,000 Pounds of Protein to Capital Area Food Bank in Washington, D.C.. Retrieved from http://www.hispanicprblog.com/lulac-and-tyson-foods-donate-33000-pounds-of-protein-to-capital-area-food-bank-in-washington-d-c/.2 League of United Latin American Citizens (2015). LULAC National Women’s Commission, Tyson Foods and The Roadrunner Food Bank Provide a Truckload of Protein to New Mexicans. Retrieved from https://lulac.org/news/pr/national-womens-commission-tyson-foods-donation/3 El Restaurante (2016). CHCI and Tyson Foods Announce Chicago Foods Scholar Intern Program. Retrieved from http://elrestaurante.com/blogs/sample-blog/chci-and-tyson-foods-announce-chicago-foods-scholar-intern-p/4 Tyson (2015). Tyson Foods Gives $50,000 Boost to Spanish American Civic Association for Meal Program. Retrieved from https://www.tysonfoods.com/news/news-releases/2015/5/tyson-foods-gives-50000-boost-spanish-american-civic-association-meal5 Nephin, D. (2015). Spanish American Civic Association seeks $25K for meals program. Retrieved from https://lancasteronline.com/news/local/spanish-american-civic-association-seeks-k-for-meals-program/article_54c3b618-0df7-11e5-af88-c7ef24323638.html6 Biz New Orleans (2017). Tyson Foods, Inc. Donates 16,800 Lbs. Of Chicken To Liberty’s Kitchen For This Weekend’s National Fried Chicken Festival. Retrieved from http://www.bizneworleans.com/September-2017/Tyson-Foods-Inc-Donates-16800-Lbs-Of-Chicken-To-Libertys-Kitchen-For-This-Weekends-National-Fried-Chicken-Festival/

115 Return to contents >
Appendix B. Company Profiles
Unilever
†
Total media spending: $230.5 millionTotal TV spending: $153.2 million Spanish-language TV: $19.3 million (13% of total TV spending)
Black-targeted TV: $5.7 million (4% of total TV spending)
TV advertising to youth in 2017 (company total)
All youth Black youth Hispanic youth
All TV Black-targeted TV All TV Spanish-language TV
AgeTotal ads
viewed
Targeted index (vs.
adults) Ads viewed % of total Ads viewed
Targeted index (vs.
White youth) Ads viewed
Targeted index (vs.
adults)
2-11 years 45.3 58 3.8 8% 86.5 134 26.1 74
12-17 years 45.5 85 5.2 11% 92.8 131 17.6 78
Source: Rudd Center analysis of Nielsen data (2018)
11 highly advertised brands; 100% targeted to Black and/or Hispanic consumers
Highly advertised targeted brands
Brands targeted to: Hispanic consumers Black consumers Hispanic and Black consumers
† Two varieties: I Can’t Believe It’s Not Butter Margarine, I Can’t Believe It’s Not Butter Vegan Margarine

116 Return to contents >
Appendix B. Company Profiles
Unilever (continued)
In 2017, Ad Age ranked Unilever 23rd of the 50 largest advertising spenders in Hispanic-focused media—spending $65.9 million on all Hispanic media [Spanish-language magazines, newspapers, radio, internet and TV (broadcast, cable, and spot TV)].1
1 Ad Age. Hispanic Fact Pack 2018. https://adage.com/trend-reports/report.php?id=139
Public statements about targeted marketing

117 Return to contents >
Appendix B. Company Profiles
Wendy’sTotal media spending: $260.4 millionTotal TV spending: $235.8 million Spanish-language TV: $29.9 million (13% of total TV spending)
Black-targeted TV: $8.4 million (4% of total TV spending)
TV advertising to youth in 2017 (company total)
All youth Black youth Hispanic youth
All TV Black-targeted TV All TV Spanish-language TV
AgeTotal ads
viewed
Targeted index (vs.
adults) Ads viewed % of total Ads viewed
Targeted index (vs.
White youth) Ads viewed
Targeted index (vs.
adults)
2-11 years 45.8 51 5.0 11% 85.7 132 34.4 73
12-17 years 59.2 96 7.0 12% 112.4 120 23.4 76
Source: Rudd Center analysis of Nielsen data (2018)
Highly advertised targeted brands
Brands targeted to: Hispanic and Black consumers

118 Return to contents >
Appendix B. Company Profiles
Wendy’s (continued)
Business opportunity
• Kurt Kane, CMO, identified value perception through deals like Wendy’s 4 for $4 launched in 2016, as draws for younger consumers and African American and Hispanic consumers.1
Public statements about targeted marketing
1 Eaton, D. (2017). What’s the Wendy’s test kitchen cooking up now? Columbus Business First.https://www.bizjournals.com/columbus/news/2017/02/17/whats-the-wendys-test-kitchen-cooking-up-now-check.html2 Ungerleider, N. (2016). How Wendy’s Is Making Ghost Peppers Safe For Middle America. Retrieved from https://www.fastcompany.com/3058010/how-wendys-is-making-ghost-peppers-safe-for-middle-america
Cultural relevance
• Referencing the introduction of ghost peppers to the Wendy’s menu in 2016, Lori Estrada, Senior VP of Research and Development said, “Consumer tastes evolve over time, and they get more used to spice. There is more diversity as well, and tolerance for spice has changed over time…”2

119 Return to contents >
Appendix B. Company Profiles
The Wonderful CompanyTotal media spending: $107.2 millionTotal TV spending: $78.4 million Spanish-language TV: $25 thousand (0% of total TV spending)
Black-targeted TV: $19 thousand (0% of total TV spending)
TV advertising to youth in 2017 (company total)
All youth Black youth
All TV Black-targeted TV All TV
AgeTotal ads
viewed
Targeted index (vs.
adults) Ads viewed % of total Ads viewed
Targeted index (vs.
White youth)
2-11 years 24.8 58 0.0 0% 30.5 80
12-17 years 23.7 81 0.0 0% 27.9 67
Source: Rudd Center analysis of Nielsen data (2018)
Highly advertised targeted brands
4 highly advertised brands; 0% targeted to Black and/or Hispanic consumers
Public statements about targeted marketing
Cultural relevance
• Adam Cooper, VP of Marketing for Wonderful Citrus, Pistachios, and Almonds, discussed The Wonderful Company’s marketing strategy for Hispanic consumers in 2016. “Our outreach to the Hispanic population is based on leveraging key consumer passion points, including food and sports, specifically soccer. We also work on crafting authentic messaging that is delivered through relatable sources, such as third party experts.” Cooper went on to say, “We also leverage Hispanic specific creative at targeted retailers in order to be more relevant to the consumer.”1
120 Return to contents >
Appendix B. Company Profiles
The Wonderful Company (continued)
• Also in 2016, Cooper discussed the initiation of a partnership between The Wonderful Company and Havas Formulatin, a Hispanic media agency. The program “…aims to improve the brand’s awareness and penetration among [Hispanics],” according to Cooper. This partnership was The Wonderful Company’s first establishment of an Agency of Record for Hispanics.2
1 Portada (2016). Wonderful Pistachios’ Adam Cooper on the Launch of the Get Crackin’ Campaign, Healthy Snacking and More… Retrieved from https://www.portada-online.com/2016/10/10/wonderful-pistachios-adam-cooper-on-the-launch-of-the-get-crackin-campaign-healthy-snacking-and-more/2 Okumura, J. (2016). Wonderful Pistachios & Almonds VP Adam Cooper Discusses Tapping Into the Hispanic Market. Retrieved from https://www.andnowuknow.com/headlines/wonderful-pistachios-almonds-vp-adam-cooper-discusses-tapping-hispanic/jordan-okumura/48423

121 Return to contents >
Appendix B. Company Profiles
Yum! BrandsTotal media spending: $765.9 millionTotal TV spending: $733.4 million Spanish-language TV: $37.1 million (5% of total TV spending)
Black-targeted TV: $21.3 million (3% of total TV spending)
TV advertising to youth in 2017 (company total)
All youth Black youth Hispanic youth
All TV Black-targeted TV All TV Spanish-language TV
AgeTotal ads
viewed
Targeted index (vs.
adults) Ads viewed % of total Ads viewed
Targeted index (vs.
White youth) Ads viewed
Targeted index (vs.
adults)
2-11 years 168.6 53 14.3 8% 302.8 127 50.7 74
12-17 years 218.2 102 19.7 9% 394.3 114 36.0 81
Source: Rudd Center analysis of Nielsen data (2018)
Highly advertised targeted brands
Brands targeted to: Hispanic and Black consumers
3 highly advertised brands; 100% targeted to Black and/or Hispanic consumers
122 Return to contents >
Appendix B. Company Profiles
Yum! Brands (continued)
In 2017, Ad Age ranked Yum! Brands 43rd of the 50 largest advertising spenders in Hispanic-focused media—spending $32.6 million on all Hispanic media [Spanish-language magazines, newspapers, radio, internet and TV (broadcast, cable, and spot TV)].1
1 Ad Age. Hispanic Fact Pack 2018. https://adage.com/trend-reports/report.php?id=1392 Yum! Brands (2017). Citizenship & Sustainability. Retrieved from http://www.yum.com/citizenship-sustainability/3 Fund for Hearts (2018). Yum! Family Series. Retrieved from https://fundforthearts.org/yum-family-series/
Public statements about targeted marketing
Corporate responsibility
• Yum! Brands Foundation sponsors the Yum! Family Series—a program which helps make the arts more accessible to underserved populations. According to their website, Yum! Family Series “focuses on enhancing cultural, economic,
racial, and age diversity of audiences.”2,3
123 Return to contents >
Appendix C.
Supplemental Tables
TABLE 1. TARGETED ADVERTISING BY COMPANY
TABLE 2. BRANDS TARGETED TO HISPANIC CONSUMERS
TABLE 3. BRANDS TARGETED TO BLACK CONSUMERS
TABLE 4. ALL OTHER BRANDS
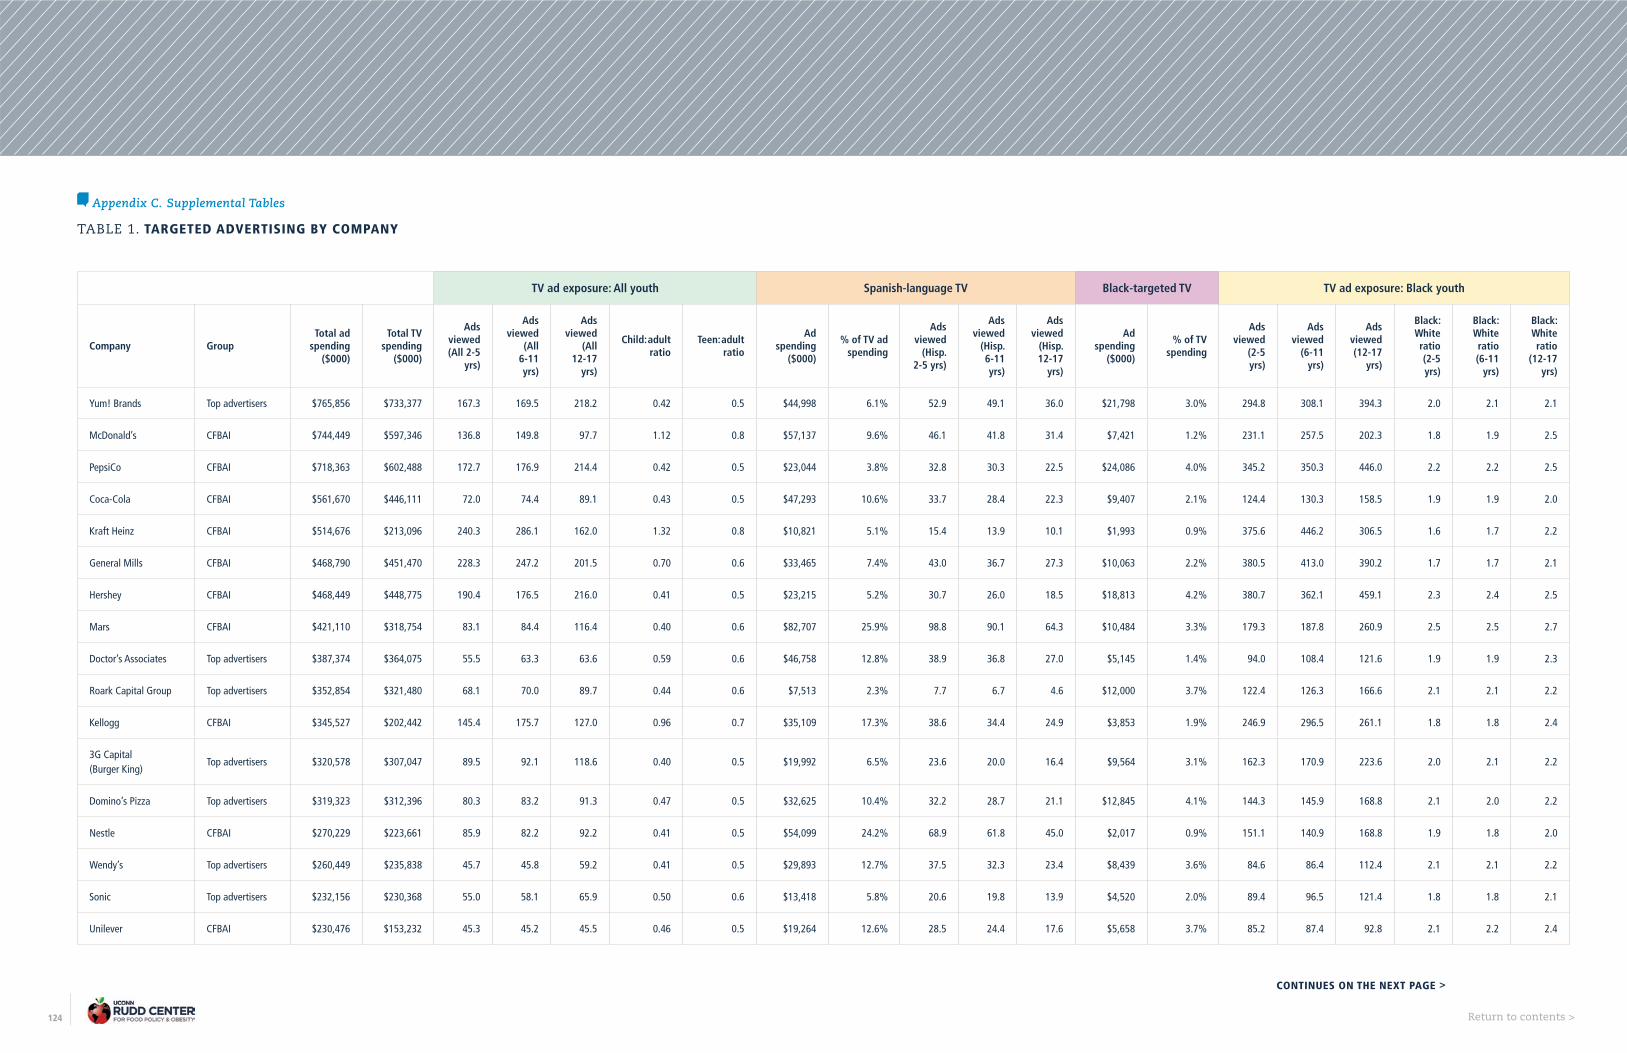
124 Return to contents >
TV ad exposure: All youth Spanish-language TV Black-targeted TV TV ad exposure: Black youth
Company GroupTotal ad
spending ($000)
Total TV spending
($000)
Ads viewed (All 2-5
yrs)
Ads viewed
(All 6-11 yrs)
Ads viewed
(All 12-17
yrs)
Child:adult ratio
Teen:adult ratio
Ad spending
($000)
% of TV ad spending
Ads viewed
(Hisp. 2-5 yrs)
Ads viewed
(Hisp. 6-11 yrs)
Ads viewed
(Hisp. 12-17
yrs)
Adspending
($000)
% of TV spending
Ads viewed
(2-5 yrs)
Ads viewed
(6-11 yrs)
Ads viewed (12-17
yrs)
Black: White ratio (2-5 yrs)
Black: White ratio (6-11
yrs)
Black: White ratio
(12-17 yrs)
Yum! Brands Top advertisers $765,856 $733,377 167.3 169.5 218.2 0.42 0.5 $44,998 6.1% 52.9 49.1 36.0 $21,798 3.0% 294.8 308.1 394.3 2.0 2.1 2.1
McDonald’s CFBAI $744,449 $597,346 136.8 149.8 97.7 1.12 0.8 $57,137 9.6% 46.1 41.8 31.4 $7,421 1.2% 231.1 257.5 202.3 1.8 1.9 2.5
PepsiCo CFBAI $718,363 $602,488 172.7 176.9 214.4 0.42 0.5 $23,044 3.8% 32.8 30.3 22.5 $24,086 4.0% 345.2 350.3 446.0 2.2 2.2 2.5
Coca-Cola CFBAI $561,670 $446,111 72.0 74.4 89.1 0.43 0.5 $47,293 10.6% 33.7 28.4 22.3 $9,407 2.1% 124.4 130.3 158.5 1.9 1.9 2.0
Kraft Heinz CFBAI $514,676 $213,096 240.3 286.1 162.0 1.32 0.8 $10,821 5.1% 15.4 13.9 10.1 $1,993 0.9% 375.6 446.2 306.5 1.6 1.7 2.2
General Mills CFBAI $468,790 $451,470 228.3 247.2 201.5 0.70 0.6 $33,465 7.4% 43.0 36.7 27.3 $10,063 2.2% 380.5 413.0 390.2 1.7 1.7 2.1
Hershey CFBAI $468,449 $448,775 190.4 176.5 216.0 0.41 0.5 $23,215 5.2% 30.7 26.0 18.5 $18,813 4.2% 380.7 362.1 459.1 2.3 2.4 2.5
Mars CFBAI $421,110 $318,754 83.1 84.4 116.4 0.40 0.6 $82,707 25.9% 98.8 90.1 64.3 $10,484 3.3% 179.3 187.8 260.9 2.5 2.5 2.7
Doctor’s Associates Top advertisers $387,374 $364,075 55.5 63.3 63.6 0.59 0.6 $46,758 12.8% 38.9 36.8 27.0 $5,145 1.4% 94.0 108.4 121.6 1.9 1.9 2.3
Roark Capital Group Top advertisers $352,854 $321,480 68.1 70.0 89.7 0.44 0.6 $7,513 2.3% 7.7 6.7 4.6 $12,000 3.7% 122.4 126.3 166.6 2.1 2.1 2.2
Kellogg CFBAI $345,527 $202,442 145.4 175.7 127.0 0.96 0.7 $35,109 17.3% 38.6 34.4 24.9 $3,853 1.9% 246.9 296.5 261.1 1.8 1.8 2.4
3G Capital (Burger King)
Top advertisers $320,578 $307,047 89.5 92.1 118.6 0.40 0.5 $19,992 6.5% 23.6 20.0 16.4 $9,564 3.1% 162.3 170.9 223.6 2.0 2.1 2.2
Domino’s Pizza Top advertisers $319,323 $312,396 80.3 83.2 91.3 0.47 0.5 $32,625 10.4% 32.2 28.7 21.1 $12,845 4.1% 144.3 145.9 168.8 2.1 2.0 2.2
Nestle CFBAI $270,229 $223,661 85.9 82.2 92.2 0.41 0.5 $54,099 24.2% 68.9 61.8 45.0 $2,017 0.9% 151.1 140.9 168.8 1.9 1.8 2.0
Wendy’s Top advertisers $260,449 $235,838 45.7 45.8 59.2 0.41 0.5 $29,893 12.7% 37.5 32.3 23.4 $8,439 3.6% 84.6 86.4 112.4 2.1 2.1 2.2
Sonic Top advertisers $232,156 $230,368 55.0 58.1 65.9 0.50 0.6 $13,418 5.8% 20.6 19.8 13.9 $4,520 2.0% 89.4 96.5 121.4 1.8 1.8 2.1
Unilever CFBAI $230,476 $153,232 45.3 45.2 45.5 0.46 0.5 $19,264 12.6% 28.5 24.4 17.6 $5,658 3.7% 85.2 87.4 92.8 2.1 2.2 2.4
TABLE 1. TARGETED ADVERTISING BY COMPANY
Appendix C. Supplemental Tables
CONTINUES ON THE NEXT PAGE >
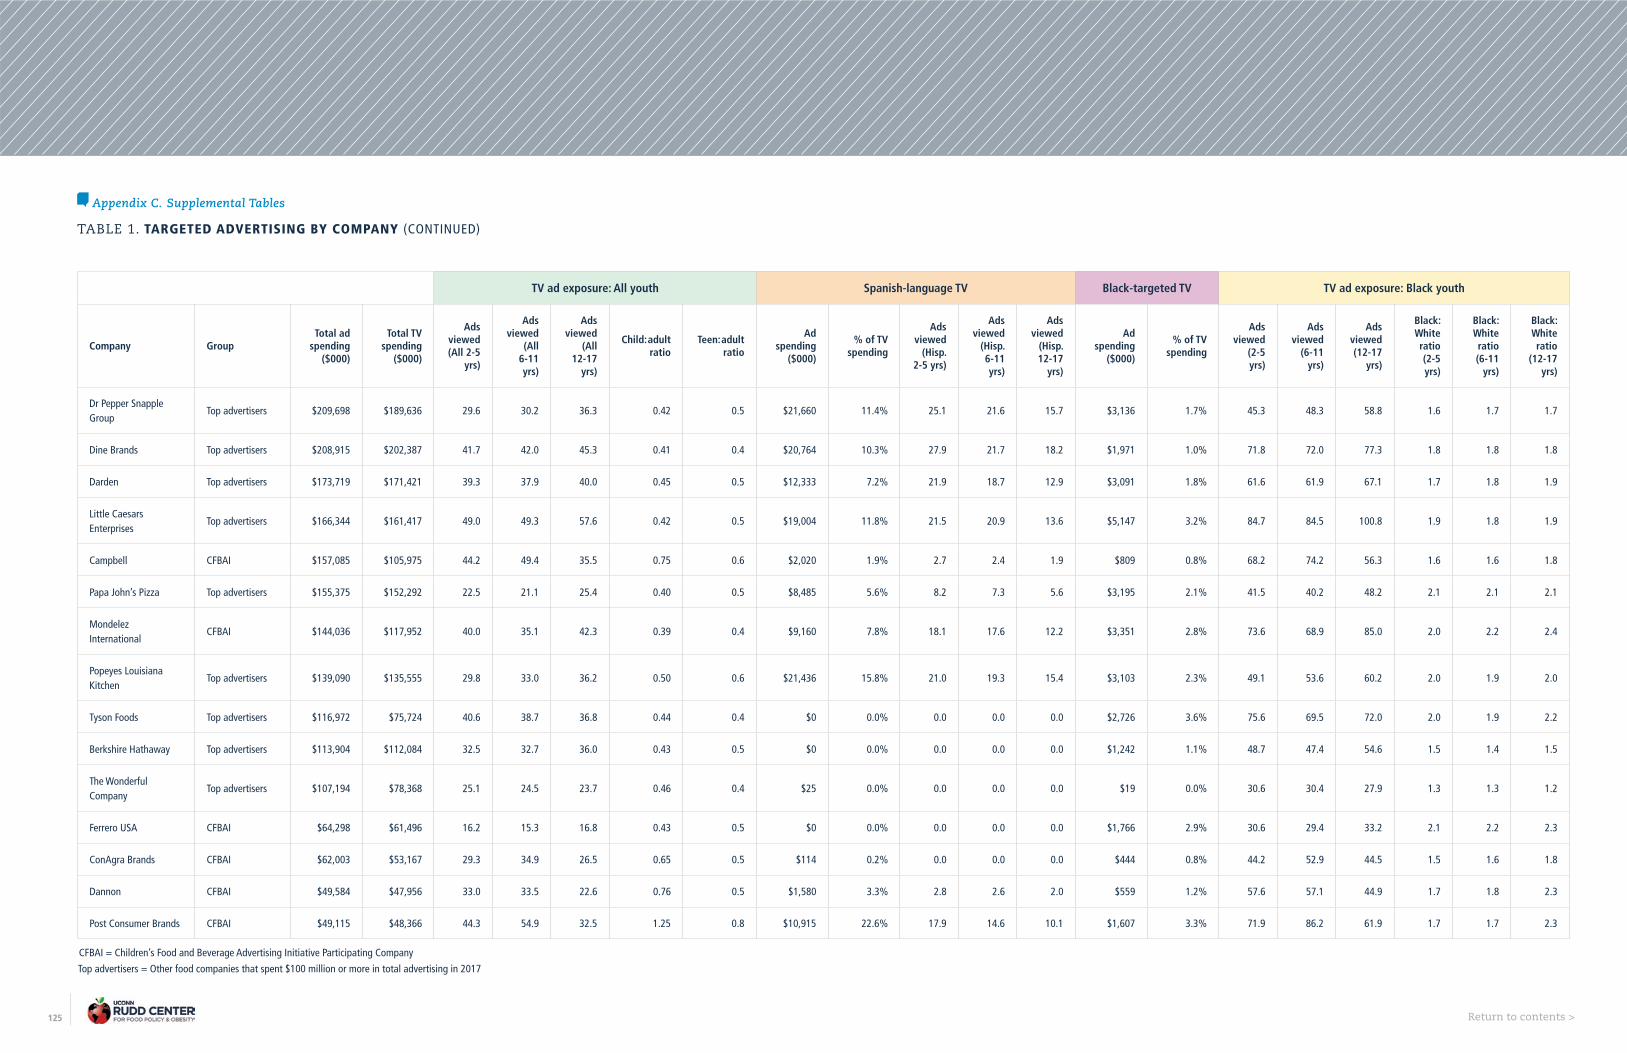
125 Return to contents >
TV ad exposure: All youth Spanish-language TV Black-targeted TV TV ad exposure: Black youth
Company GroupTotal ad
spending ($000)
Total TV spending
($000)
Ads viewed (All 2-5
yrs)
Ads viewed
(All 6-11 yrs)
Ads viewed
(All 12-17
yrs)
Child:adult ratio
Teen:adult ratio
Adspending
($000)
% of TV spending
Ads viewed
(Hisp. 2-5 yrs)
Ads viewed
(Hisp. 6-11 yrs)
Ads viewed
(Hisp. 12-17
yrs)
Ad spending
($000)
% of TV spending
Ads viewed
(2-5 yrs)
Ads viewed
(6-11 yrs)
Ads viewed (12-17
yrs)
Black: White ratio (2-5 yrs)
Black: White ratio (6-11
yrs)
Black: White ratio
(12-17 yrs)
Dr Pepper Snapple Group
Top advertisers $209,698 $189,636 29.6 30.2 36.3 0.42 0.5 $21,660 11.4% 25.1 21.6 15.7 $3,136 1.7% 45.3 48.3 58.8 1.6 1.7 1.7
Dine Brands Top advertisers $208,915 $202,387 41.7 42.0 45.3 0.41 0.4 $20,764 10.3% 27.9 21.7 18.2 $1,971 1.0% 71.8 72.0 77.3 1.8 1.8 1.8
Darden Top advertisers $173,719 $171,421 39.3 37.9 40.0 0.45 0.5 $12,333 7.2% 21.9 18.7 12.9 $3,091 1.8% 61.6 61.9 67.1 1.7 1.8 1.9
Little Caesars Enterprises
Top advertisers $166,344 $161,417 49.0 49.3 57.6 0.42 0.5 $19,004 11.8% 21.5 20.9 13.6 $5,147 3.2% 84.7 84.5 100.8 1.9 1.8 1.9
Campbell CFBAI $157,085 $105,975 44.2 49.4 35.5 0.75 0.6 $2,020 1.9% 2.7 2.4 1.9 $809 0.8% 68.2 74.2 56.3 1.6 1.6 1.8
Papa John’s Pizza Top advertisers $155,375 $152,292 22.5 21.1 25.4 0.40 0.5 $8,485 5.6% 8.2 7.3 5.6 $3,195 2.1% 41.5 40.2 48.2 2.1 2.1 2.1
Mondelez International
CFBAI $144,036 $117,952 40.0 35.1 42.3 0.39 0.4 $9,160 7.8% 18.1 17.6 12.2 $3,351 2.8% 73.6 68.9 85.0 2.0 2.2 2.4
Popeyes Louisiana Kitchen
Top advertisers $139,090 $135,555 29.8 33.0 36.2 0.50 0.6 $21,436 15.8% 21.0 19.3 15.4 $3,103 2.3% 49.1 53.6 60.2 2.0 1.9 2.0
Tyson Foods Top advertisers $116,972 $75,724 40.6 38.7 36.8 0.44 0.4 $0 0.0% 0.0 0.0 0.0 $2,726 3.6% 75.6 69.5 72.0 2.0 1.9 2.2
Berkshire Hathaway Top advertisers $113,904 $112,084 32.5 32.7 36.0 0.43 0.5 $0 0.0% 0.0 0.0 0.0 $1,242 1.1% 48.7 47.4 54.6 1.5 1.4 1.5
The Wonderful Company
Top advertisers $107,194 $78,368 25.1 24.5 23.7 0.46 0.4 $25 0.0% 0.0 0.0 0.0 $19 0.0% 30.6 30.4 27.9 1.3 1.3 1.2
Ferrero USA CFBAI $64,298 $61,496 16.2 15.3 16.8 0.43 0.5 $0 0.0% 0.0 0.0 0.0 $1,766 2.9% 30.6 29.4 33.2 2.1 2.2 2.3
ConAgra Brands CFBAI $62,003 $53,167 29.3 34.9 26.5 0.65 0.5 $114 0.2% 0.0 0.0 0.0 $444 0.8% 44.2 52.9 44.5 1.5 1.6 1.8
Dannon CFBAI $49,584 $47,956 33.0 33.5 22.6 0.76 0.5 $1,580 3.3% 2.8 2.6 2.0 $559 1.2% 57.6 57.1 44.9 1.7 1.8 2.3
Post Consumer Brands CFBAI $49,115 $48,366 44.3 54.9 32.5 1.25 0.8 $10,915 22.6% 17.9 14.6 10.1 $1,607 3.3% 71.9 86.2 61.9 1.7 1.7 2.3
TABLE 1. TARGETED ADVERTISING BY COMPANY (CONTINUED)
Appendix C. Supplemental Tables
CFBAI = Children’s Food and Beverage Advertising Initiative Participating Company
Top advertisers = Other food companies that spent $100 million or more in total advertising in 2017

126 Return to contents >
TABLE 2. BRANDS TARGETED TO HISPANIC CONSUMERS
TV ad exposure: All youth Spanish-language TV
Company Brand CategoryChild/teen targeted
Black targeted
Total ad spending
($000)
Total TV spending
($000)
Ads viewed (All 2-5 yrs)
Ads viewed (All 6-11
yrs)
Ads viewed (All 12-17
yrs)
Child:adult ratio
Teen:adult ratio
Adspending
($000)
% of TV spending
Ads viewed (Hisp. 2-5
yrs)
Ads viewed (Hisp. 6-11
yrs)
Ads viewed (Hisp. 12-
17 yrs)
McDonald’s McDonald’s Fast food p p $744,449 $597,346 136.8 149.8 97.7 1.16 0.76 $57,780 10% 46.1 41.8 31.4
Doctor’s Associates Subway Fast food p p $387,372 $364,075 55.4 63.3 63.6 0.62 0.62 $47,140 13% 38.9 36.8 27.0
Coca-Cola Coca-Cola Classic Regular soda p $220,458 $186,116 16.0 16.8 20.9 0.46 0.57 $37,639 20% 27.4 23.0 18.3
Wendy’s Wendy’s Fast food p $259,549 $234,938 45.7 45.8 59.2 0.41 0.52 $29,893 13% 37.5 32.3 23.4
Yum! Brands Taco Bell Fast food p $381,992 $362,077 79.1 79.9 108.8 0.40 0.55 $24,224 7% 22.2 20.3 15.2
Domino’s Pizza Domino’s Pizza Fast food p $319,323 $312,396 73.7 76.8 84.1 0.48 0.53 $23,159 7% 21.8 19.4 14.3
Mars M&Ms Candy Candy p $87,791 $68,466 11.4 11.8 15.9 0.41 0.56 $23,028 34% 22.8 20.9 15.3
Popeyes Louisiana Kitchen
Popeyes Fast food p $139,090 $135,555 29.8 33.0 36.2 0.52 0.57 $21,436 16% 21.0 19.3 15.4
General Mills Big G Cereals Cereal p p $47,037 $45,828 16.1 17.2 13.2 0.79 0.60 $20,901 46% 27.2 23.3 17.1
3G Capital Burger King Fast food p $308,251 $298,148 89.5 92.1 118.6 0.40 0.52 $20,738 7% 23.6 20.0 16.4
Little Caesars Enter-prises
Little Caesars Fast food p $166,344 $161,417 49.0 49.3 57.6 0.42 0.49 $19,004 12% 21.5 20.9 13.6
Dine Brands IHOP Other restaurants p $88,857 $85,940 14.4 13.4 14.0 0.36 0.38 $16,452 19% 21.7 17.2 14.4
Mars Snickers Candy p $62,893 $58,102 8.7 8.6 11.2 0.39 0.51 $14,707 25% 16.7 15.2 11.4
Kellogg’s Pop TartsSweet snacks and desserts
p p $32,372 $32,200 18.8 24.0 28.4 0.72 0.85 $13,962 43% 19.1 16.7 11.9
Sonic Sonic Fast food p $232,156 $230,368 55.0 58.1 65.9 0.51 0.58 $13,418 6% 20.6 19.8 13.9
Mars Extra Gum and mints p $37,903 $29,989 7.2 7.2 9.2 0.39 0.51 $12,551 42% 16.6 15.0 10.1
Darden Olive Garden Other restaurants p $134,041 $133,760 39.3 37.9 40.0 0.44 0.47 $12,333 9% 21.9 18.7 12.9
CONTINUES ON THE NEXT PAGE >
Appendix C. Supplemental Tables

127 Return to contents >
TABLE 2. BRANDS TARGETED TO HISPANIC CONSUMERS (CONTINUED)
TV ad exposure: All youth Spanish-language TV
Company Brand CategoryChild/teen targeted
Black targeted
Total ad spending
($000)
Total TV spending
($000)
Ads viewed (All 2-5 yrs)
Ads viewed (All 6-11
yrs)
Ads viewed (All 12-17
yrs)
Child:adult ratio
Teen:adult ratio
Adspending
($000)
% of TV spending
Ads viewed (Hisp. 2-5
yrs)
Ads viewed (Hisp. 6-11
yrs)
Ads viewed (Hisp. 12-
17 yrs)
Kellogg Special K Cereal $48,193 $30,919 5.7 5.3 5.5 0.39 0.41 $12,332 40% 9.9 8.8 6.4
Dr Pepper Snapple Group
Dr Pepper Regular soda $74,181 $70,500 5.7 5.7 7.5 0.42 0.56 $11,248 16% 17.1 14.4 10.4
Mars Skittles Candy p p $38,469 $29,214 7.0 7.2 10.3 0.42 0.61 $10,456 36% 12.9 11.6 8.0
HersheyHershey’s Cookie Layer Crunch
Candy p $42,357 $42,275 12.6 12.2 15.4 0.40 0.50 $10,445 25% 16.7 14.4 10.9
Kraft HeinzPhiladelphia Cream Cheese
Other dairy $37,162 $25,691 7.1 6.1 6.7 0.37 0.40 $9,701 38% 13.0 11.9 8.7
Yum! Brands KFC Fast food p $201,010 $193,500 39.7 39.7 49.9 0.41 0.51 $9,149 5% 14.0 12.8 8.9
Mars Twix Candy p $24,380 $23,048 6.1 6.3 8.8 0.39 0.55 $8,505 37% 11.0 9.8 7.2
Papa John’s Pizza Papa John’s Fast food p $155,375 $152,292 22.5 21.1 25.4 0.39 0.47 $8,485 6% 8.2 7.3 5.6
PepsiCo Cheetos Savory snacks p $29,587 $29,587 10.6 11.5 14.5 0.44 0.56 $7,614 26% 10.3 9.5 7.7
Kellogg Eggo Waffles Prepared meals $31,864 $22,631 4.9 4.7 5.1 0.40 0.42 $7,427 33% 7.8 7.2 5.4
PepsiCo Pepsi Regular soda p $123,045 $111,942 18.5 18.8 22.6 0.43 0.52 $7,131 6% 14.4 12.9 8.9
General Mills Yoplait Yogurt Yogurt $21,994 $21,729 4.1 4.2 4.5 0.49 0.53 $6,876 32% 8.1 6.9 5.4
Post Consumer BrandsHoney Bunches Of Oats
Cereal p $28,923 $28,832 8.4 8.3 9.7 0.42 0.49 $6,773 23% 10.0 8.3 5.8
Mars Dove Candy p $21,053 $18,624 5.2 4.7 5.6 0.36 0.44 $6,314 34% 9.5 8.7 6.0
NestleNestle Coffee-Mate Non-Dairy Creamer
Condiments and food preparation
$27,367 $27,367 10.6 10.0 10.9 0.40 0.43 $6,028 22% 8.8 8.5 6.2
Mars Orbit Gum and mints p $33,671 $22,847 7.1 7.4 10.6 0.40 0.58 $5,618 25% 7.2 6.7 4.8
CONTINUES ON THE NEXT PAGE >
Appendix C. Supplemental Tables
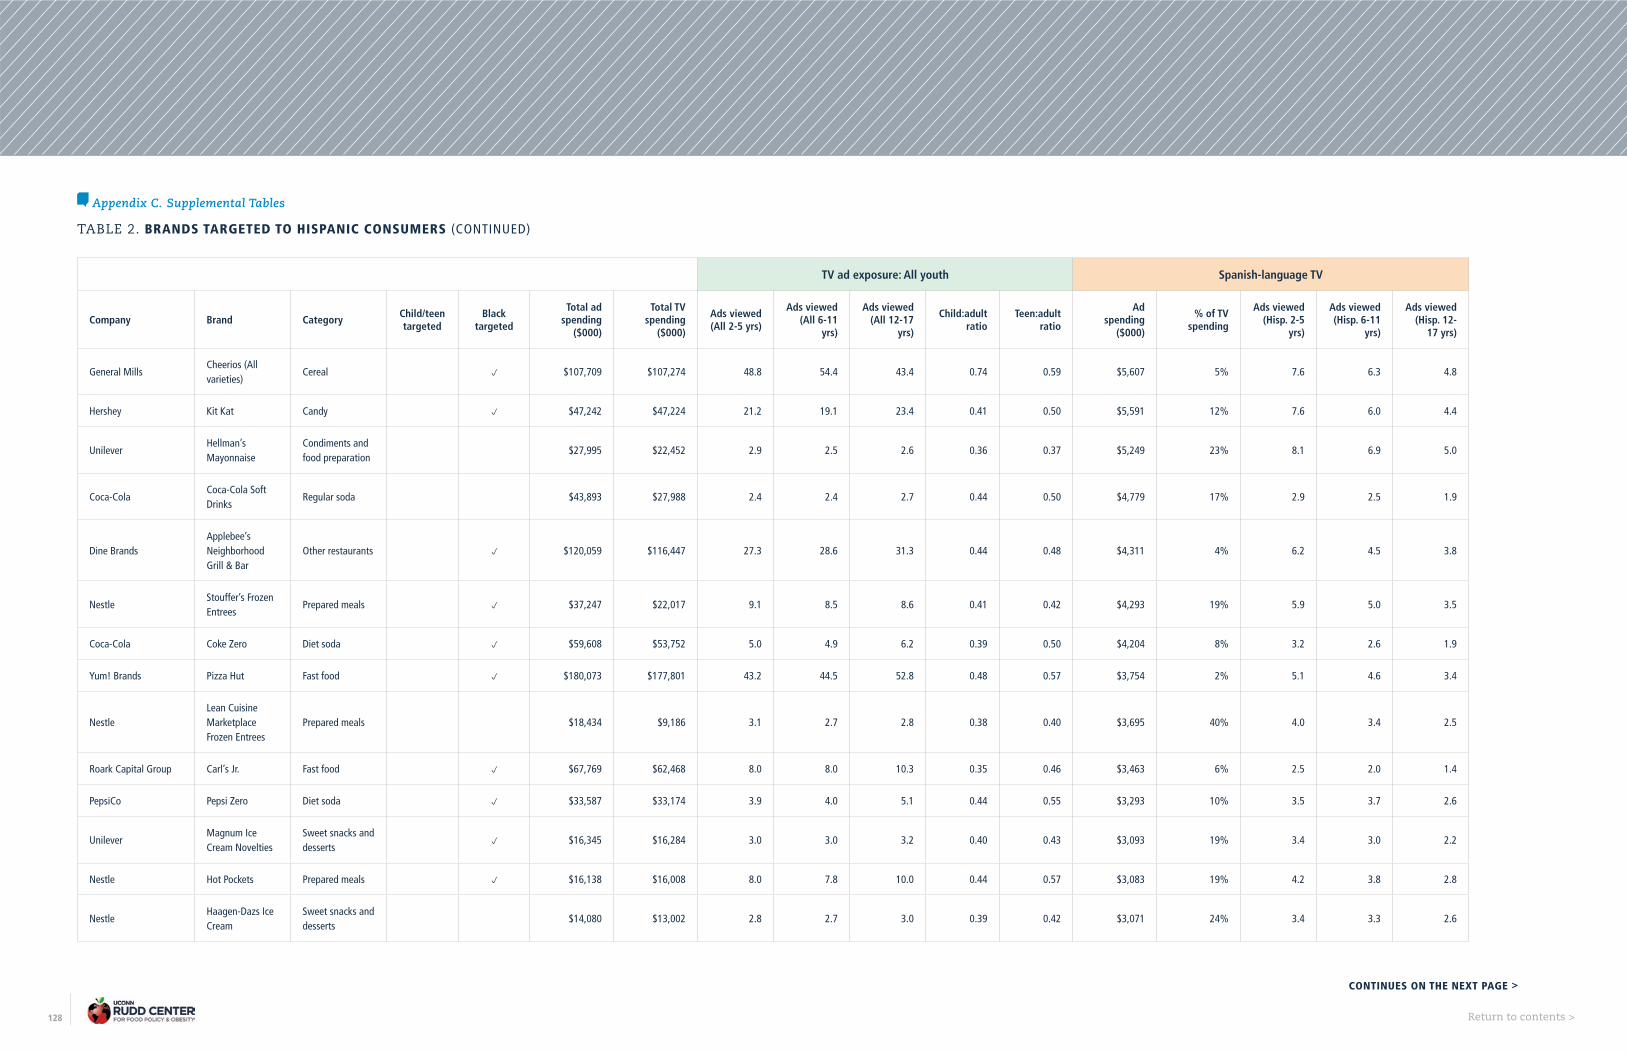
128 Return to contents >
TABLE 2. BRANDS TARGETED TO HISPANIC CONSUMERS (CONTINUED)
TV ad exposure: All youth Spanish-language TV
Company Brand CategoryChild/teen targeted
Black targeted
Total ad spending
($000)
Total TV spending
($000)
Ads viewed (All 2-5 yrs)
Ads viewed (All 6-11
yrs)
Ads viewed (All 12-17
yrs)
Child:adult ratio
Teen:adult ratio
Ad spending
($000)
% of TV spending
Ads viewed (Hisp. 2-5
yrs)
Ads viewed (Hisp. 6-11
yrs)
Ads viewed (Hisp. 12-
17 yrs)
General MillsCheerios (All varieties)
Cereal p $107,709 $107,274 48.8 54.4 43.4 0.74 0.59 $5,607 5% 7.6 6.3 4.8
Hershey Kit Kat Candy p $47,242 $47,224 21.2 19.1 23.4 0.41 0.50 $5,591 12% 7.6 6.0 4.4
UnileverHellman’s Mayonnaise
Condiments and food preparation
$27,995 $22,452 2.9 2.5 2.6 0.36 0.37 $5,249 23% 8.1 6.9 5.0
Coca-ColaCoca-Cola Soft Drinks
Regular soda $43,893 $27,988 2.4 2.4 2.7 0.44 0.50 $4,779 17% 2.9 2.5 1.9
Dine BrandsApplebee’s Neighborhood Grill & Bar
Other restaurants p $120,059 $116,447 27.3 28.6 31.3 0.44 0.48 $4,311 4% 6.2 4.5 3.8
NestleStouffer’s Frozen Entrees
Prepared meals p $37,247 $22,017 9.1 8.5 8.6 0.41 0.42 $4,293 19% 5.9 5.0 3.5
Coca-Cola Coke Zero Diet soda p $59,608 $53,752 5.0 4.9 6.2 0.39 0.50 $4,204 8% 3.2 2.6 1.9
Yum! Brands Pizza Hut Fast food p $180,073 $177,801 43.2 44.5 52.8 0.48 0.57 $3,754 2% 5.1 4.6 3.4
NestleLean Cuisine Marketplace Frozen Entrees
Prepared meals $18,434 $9,186 3.1 2.7 2.8 0.38 0.40 $3,695 40% 4.0 3.4 2.5
Roark Capital Group Carl’s Jr. Fast food p $67,769 $62,468 8.0 8.0 10.3 0.35 0.46 $3,463 6% 2.5 2.0 1.4
PepsiCo Pepsi Zero Diet soda p $33,587 $33,174 3.9 4.0 5.1 0.44 0.55 $3,293 10% 3.5 3.7 2.6
UnileverMagnum Ice Cream Novelties
Sweet snacks and desserts
p $16,345 $16,284 3.0 3.0 3.2 0.40 0.43 $3,093 19% 3.4 3.0 2.2
Nestle Hot Pockets Prepared meals p $16,138 $16,008 8.0 7.8 10.0 0.44 0.57 $3,083 19% 4.2 3.8 2.8
NestleHaagen-Dazs Ice Cream
Sweet snacks and desserts
$14,080 $13,002 2.8 2.7 3.0 0.39 0.42 $3,071 24% 3.4 3.3 2.6
CONTINUES ON THE NEXT PAGE >
Appendix C. Supplemental Tables
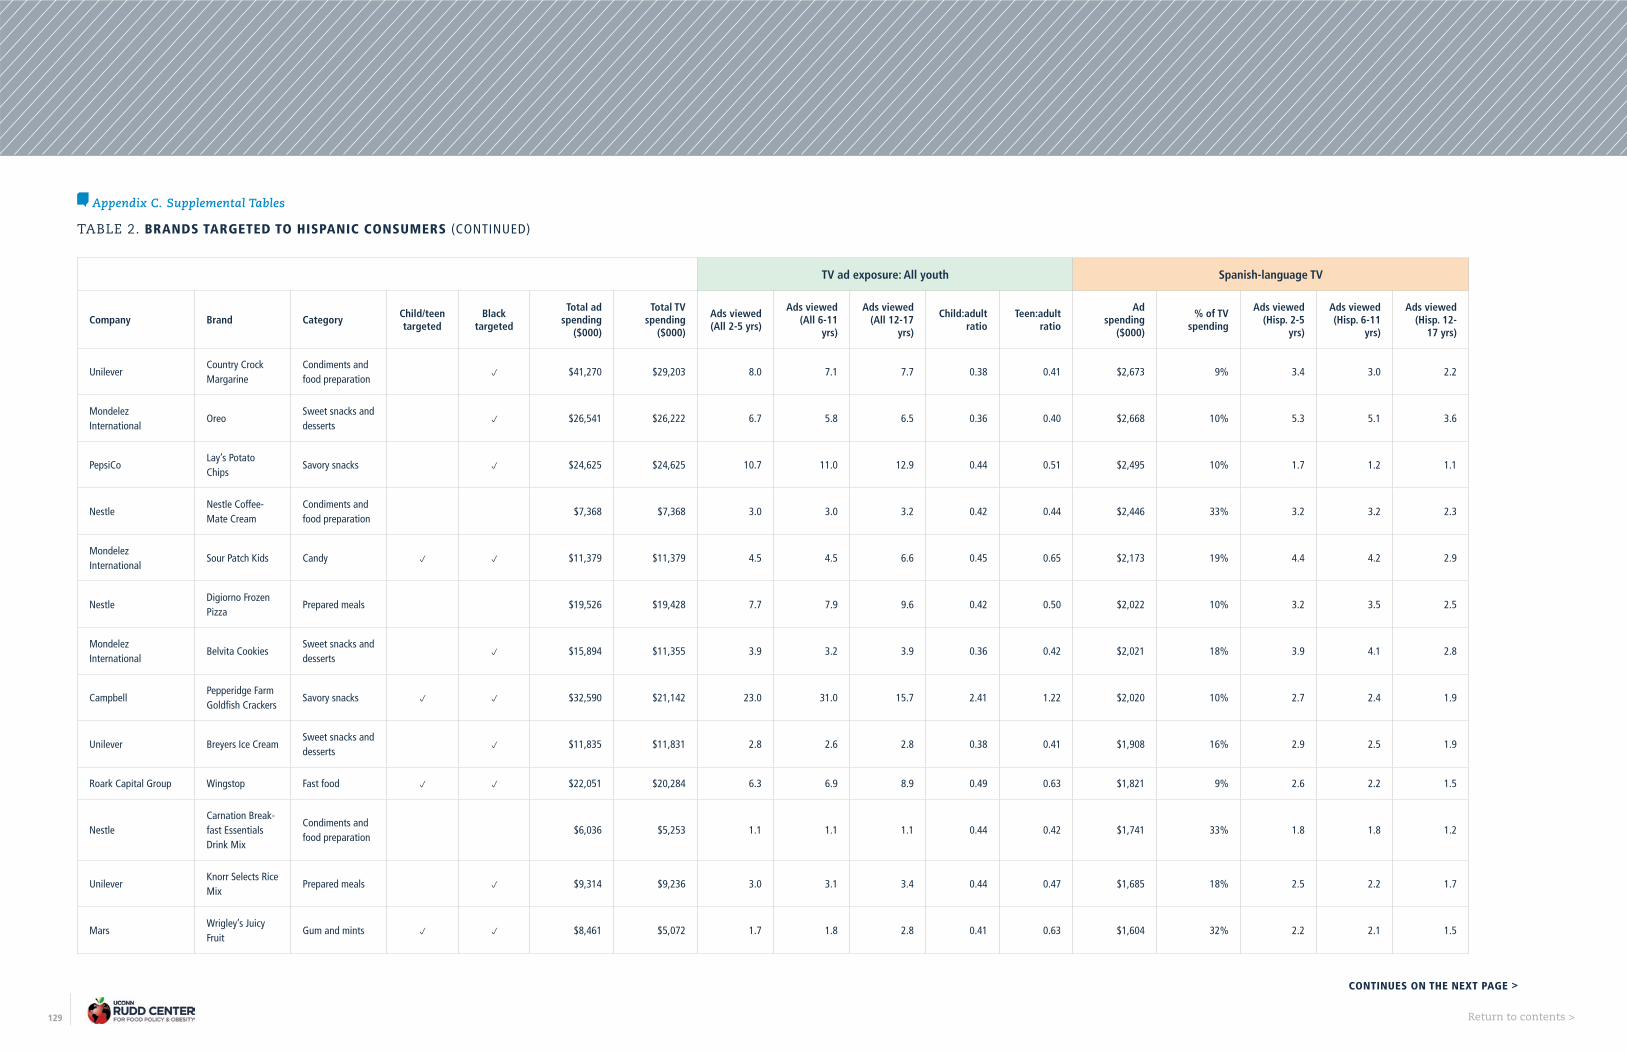
129 Return to contents >
TABLE 2. BRANDS TARGETED TO HISPANIC CONSUMERS (CONTINUED)
TV ad exposure: All youth Spanish-language TV
Company Brand CategoryChild/teen targeted
Black targeted
Total ad spending
($000)
Total TV spending
($000)
Ads viewed (All 2-5 yrs)
Ads viewed (All 6-11
yrs)
Ads viewed (All 12-17
yrs)
Child:adult ratio
Teen:adult ratio
Adspending
($000)
% of TV spending
Ads viewed (Hisp. 2-5
yrs)
Ads viewed (Hisp. 6-11
yrs)
Ads viewed (Hisp. 12-
17 yrs)
UnileverCountry Crock Margarine
Condiments and food preparation
p $41,270 $29,203 8.0 7.1 7.7 0.38 0.41 $2,673 9% 3.4 3.0 2.2
Mondelez International
OreoSweet snacks and desserts
p $26,541 $26,222 6.7 5.8 6.5 0.36 0.40 $2,668 10% 5.3 5.1 3.6
PepsiCoLay’s Potato Chips
Savory snacks p $24,625 $24,625 10.7 11.0 12.9 0.44 0.51 $2,495 10% 1.7 1.2 1.1
NestleNestle Coffee-Mate Cream
Condiments and food preparation
$7,368 $7,368 3.0 3.0 3.2 0.42 0.44 $2,446 33% 3.2 3.2 2.3
Mondelez International
Sour Patch Kids Candy p p $11,379 $11,379 4.5 4.5 6.6 0.45 0.65 $2,173 19% 4.4 4.2 2.9
NestleDigiorno Frozen Pizza
Prepared meals $19,526 $19,428 7.7 7.9 9.6 0.42 0.50 $2,022 10% 3.2 3.5 2.5
Mondelez International
Belvita CookiesSweet snacks and desserts
p $15,894 $11,355 3.9 3.2 3.9 0.36 0.42 $2,021 18% 3.9 4.1 2.8
CampbellPepperidge Farm Goldfish Crackers
Savory snacks p p $32,590 $21,142 23.0 31.0 15.7 2.41 1.22 $2,020 10% 2.7 2.4 1.9
Unilever Breyers Ice CreamSweet snacks and desserts
p $11,835 $11,831 2.8 2.6 2.8 0.38 0.41 $1,908 16% 2.9 2.5 1.9
Roark Capital Group Wingstop Fast food p p $22,051 $20,284 6.3 6.9 8.9 0.49 0.63 $1,821 9% 2.6 2.2 1.5
NestleCarnation Break-fast Essentials Drink Mix
Condiments and food preparation
$6,036 $5,253 1.1 1.1 1.1 0.44 0.42 $1,741 33% 1.8 1.8 1.2
UnileverKnorr Selects Rice Mix
Prepared meals p $9,314 $9,236 3.0 3.1 3.4 0.44 0.47 $1,685 18% 2.5 2.2 1.7
MarsWrigley’s Juicy Fruit
Gum and mints p p $8,461 $5,072 1.7 1.8 2.8 0.41 0.63 $1,604 32% 2.2 2.1 1.5
CONTINUES ON THE NEXT PAGE >
Appendix C. Supplemental Tables

130 Return to contents >
TABLE 2. BRANDS TARGETED TO HISPANIC CONSUMERS (CONTINUED)
TV ad exposure: All youth Spanish-language TV
Company Brand CategoryChild/teen targeted
Black targeted
Total ad spending
($000)
Total TV spending
($000)
Ads viewed (All 2-5 yrs)
Ads viewed (All 6-11
yrs)
Ads viewed (All 12-17
yrs)
Child:adult ratio
Teen:adult ratio
Ad spending
($000)
% of TV spending
Ads viewed (Hisp. 2-5
yrs)
Ads viewed (Hisp. 6-11
yrs)
Ads viewed (Hisp. 12-
17 yrs)
DannonDannon Activia Yogurt
Yogurt p $14,970 $14,854 5.1 4.0 3.8 0.35 0.33 $1,579 11% 2.8 2.6 2.0
NestleDigiorno Crispy Pan Frozen Pizza
Prepared meals $11,261 $8,686 2.9 2.8 3.2 0.40 0.45 $1,429 16% 2.0 1.9 1.4
HersheyReese’s Peanut Butter Cups
Candy p $80,227 $80,227 31.8 31.0 41.2 0.41 0.55 $1,414 2% 0.9 0.8 0.5
KelloggSpecial K Food Products
Other $14,804 $14,804 2.3 2.4 2.5 0.42 0.44 $1,388 9% 1.8 1.7 1.2
Mondelez International
Nabisco Ritz Crackers
Savory snacks p $12,856 $10,625 3.6 3.0 3.2 0.34 0.36 $1,246 12% 2.4 2.2 1.6
Roark Capital Group Hardee’s Fast food $54,851 $50,926 6.9 7.4 10.4 0.38 0.54 $1,218 2% 1.1 1.2 0.8
Kraft HeinzCapri Sun Fruit Drinks
Other sugary drinks
p p $13,422 $7,558 9.3 10.5 6.1 1.30 0.76 $1,119 15% 2.4 2.0 1.4
Mondelez International
Ritz Snacks Savory snacks p $14,188 $8,780 1.8 1.6 1.8 0.36 0.40 $1,054 12% 2.0 1.9 1.3
HersheyIce Breakers Ice Cubes
Gum and mints p $7,989 $7,989 4.5 4.5 6.1 0.42 0.57 $631 8% 0.5 0.5 0.2
HersheyHershey’s Candy Bar
Candy p $50,044 $49,820 23.5 20.7 23.9 0.40 0.45 $563 1% 0.5 0.4 0.3
HersheyIce Breakers Breath Mints
Gum and mints p $16,042 $16,042 9.1 9.0 12.5 0.40 0.56 $557 3% 0.6 0.5 0.3
Coca-Cola PoweradeOther sugary drinks
$11,861 $11,419 0.4 0.4 0.5 0.42 0.56 $506 4% 0.1 0.1 0.1
Hershey Jolly Rancher Candy p $9,890 $9,890 6.7 6.4 9.3 0.39 0.56 $490 5% 0.5 0.4 0.2
CONTINUES ON THE NEXT PAGE >
Appendix C. Supplemental Tables

131 Return to contents >
TABLE 2. BRANDS TARGETED TO HISPANIC CONSUMERS (CONTINUED)
TV ad exposure: All youth Spanish-language TV
Company Brand CategoryChild/teen targeted
Black targeted
Total ad spending
($000)
Total TV spending
($000)
Ads viewed (All 2-5 yrs)
Ads viewed (All 6-11
yrs)
Ads viewed (All 12-17
yrs)
Child:adult ratio
Teen:adult ratio
Adspending
($000)
% of TV spending
Ads viewed (Hisp. 2-5
yrs)
Ads viewed (Hisp. 6-11
yrs)
Ads viewed (Hisp. 12-
17 yrs)
Hershey Hershey’s Kisses Candy p $26,322 $26,282 8.6 7.4 7.8 0.39 0.41 $449 2% 0.4 0.3 0.2
HersheyHershey’s Snack Mix
Sweet snacks and desserts
p $25,658 $25,658 12.7 11.4 13.3 0.41 0.48 $445 2% 0.6 0.6 0.3
HersheyReese’s Crunchers Candy
Candy p $10,791 $10,791 4.4 4.1 4.4 0.40 0.43 $383 4% 0.3 0.2 0.1
Hershey Twizzlers Candy p $26,969 $26,860 13.2 12.1 13.7 0.40 0.45 $370 1% 0.2 0.2 0.1
HersheyBreath Savers Protect Breath Mints
Gum and mints p $13,300 $13,241 5.2 4.9 5.6 0.38 0.44 $341 3% 0.2 0.2 0.1
Hershey Brookside Candy Candy p $21,985 $21,985 7.8 7.3 8.3 0.40 0.46 $310 1% 0.3 0.3 0.2
Hershey Kit Kat Big Kat Candy p $9,506 $9,506 4.8 4.0 4.5 0.41 0.46 $243 3% 0.2 0.2 0.1
Hershey Krave Snacks Other p $8,410 $3,112 1.8 1.7 2.0 0.43 0.50 $189 6% 0.1 0.1 0.1
HersheyYork Peppermint Pattie Candy
Candy $7,511 $7,511 3.9 3.6 3.9 0.39 0.42 $175 2% 0.2 0.1 0.1
Hershey Payday Candy p $15,865 $15,865 6.0 5.9 6.9 0.39 0.45 $155 1% 0.1 0.1 0.1
HersheyReese’s Peanut Butter Egg Candy
Candy p $14,924 $14,924 4.5 4.3 5.8 0.38 0.52 $137 1% 0.1 0.2 0.1
ConAgra Brands Slim Jim Snacks Other $4,786 $4,786 1.4 1.4 2.2 0.33 0.52 $114 2% 0.0 0.0 0.0
Appendix C. Supplemental Tables
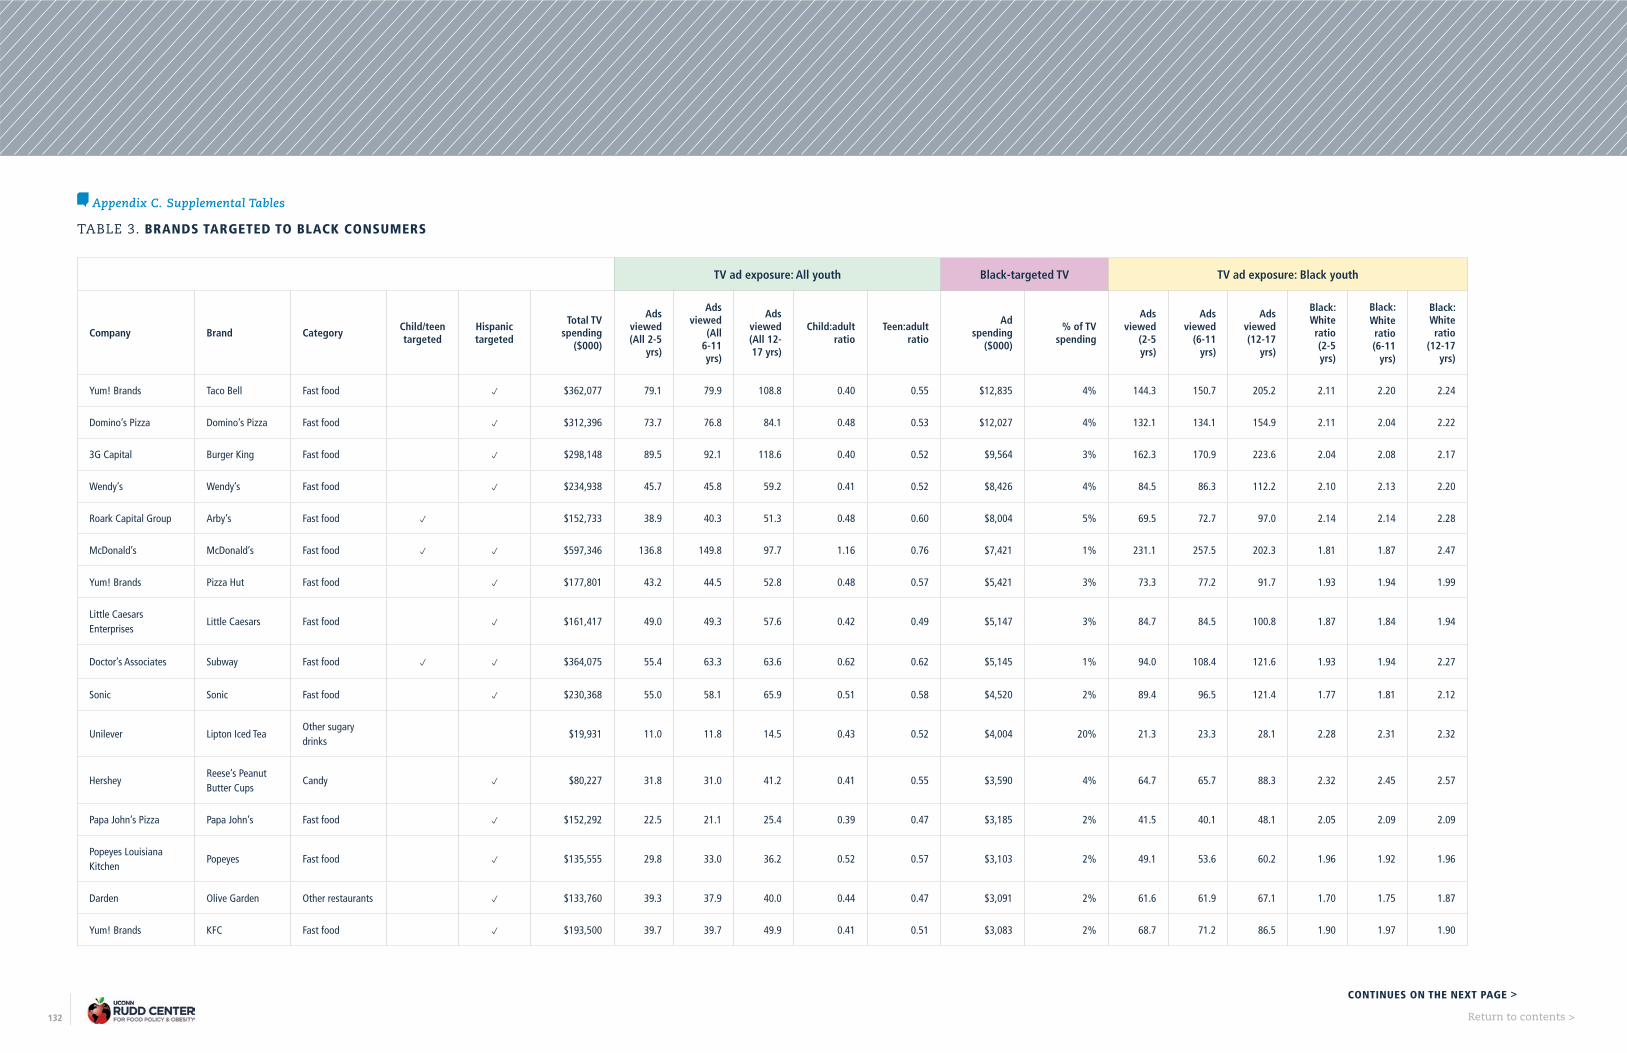
132 Return to contents >
TABLE 3. BRANDS TARGETED TO BLACK CONSUMERS
TV ad exposure: All youth Black-targeted TV TV ad exposure: Black youth
Company Brand CategoryChild/teen targeted
Hispanic targeted
Total TV spending
($000)
Ads viewed (All 2-5
yrs)
Ads viewed
(All 6-11 yrs)
Ads viewed (All 12-17 yrs)
Child:adult ratio
Teen:adult ratio
Adspending
($000)
% of TV spending
Ads viewed
(2-5 yrs)
Ads viewed
(6-11 yrs)
Ads viewed (12-17
yrs)
Black: White ratio (2-5 yrs)
Black: White ratio (6-11
yrs)
Black: White ratio
(12-17 yrs)
Yum! Brands Taco Bell Fast food p $362,077 79.1 79.9 108.8 0.40 0.55 $12,835 4% 144.3 150.7 205.2 2.11 2.20 2.24
Domino’s Pizza Domino’s Pizza Fast food p $312,396 73.7 76.8 84.1 0.48 0.53 $12,027 4% 132.1 134.1 154.9 2.11 2.04 2.22
3G Capital Burger King Fast food p $298,148 89.5 92.1 118.6 0.40 0.52 $9,564 3% 162.3 170.9 223.6 2.04 2.08 2.17
Wendy’s Wendy’s Fast food p $234,938 45.7 45.8 59.2 0.41 0.52 $8,426 4% 84.5 86.3 112.2 2.10 2.13 2.20
Roark Capital Group Arby’s Fast food p $152,733 38.9 40.3 51.3 0.48 0.60 $8,004 5% 69.5 72.7 97.0 2.14 2.14 2.28
McDonald’s McDonald’s Fast food p p $597,346 136.8 149.8 97.7 1.16 0.76 $7,421 1% 231.1 257.5 202.3 1.81 1.87 2.47
Yum! Brands Pizza Hut Fast food p $177,801 43.2 44.5 52.8 0.48 0.57 $5,421 3% 73.3 77.2 91.7 1.93 1.94 1.99
Little Caesars Enterprises
Little Caesars Fast food p $161,417 49.0 49.3 57.6 0.42 0.49 $5,147 3% 84.7 84.5 100.8 1.87 1.84 1.94
Doctor’s Associates Subway Fast food p p $364,075 55.4 63.3 63.6 0.62 0.62 $5,145 1% 94.0 108.4 121.6 1.93 1.94 2.27
Sonic Sonic Fast food p $230,368 55.0 58.1 65.9 0.51 0.58 $4,520 2% 89.4 96.5 121.4 1.77 1.81 2.12
Unilever Lipton Iced TeaOther sugary drinks
$19,931 11.0 11.8 14.5 0.43 0.52 $4,004 20% 21.3 23.3 28.1 2.28 2.31 2.32
HersheyReese’s Peanut Butter Cups
Candy p $80,227 31.8 31.0 41.2 0.41 0.55 $3,590 4% 64.7 65.7 88.3 2.32 2.45 2.57
Papa John’s Pizza Papa John’s Fast food p $152,292 22.5 21.1 25.4 0.39 0.47 $3,185 2% 41.5 40.1 48.1 2.05 2.09 2.09
Popeyes Louisiana Kitchen
Popeyes Fast food p $135,555 29.8 33.0 36.2 0.52 0.57 $3,103 2% 49.1 53.6 60.2 1.96 1.92 1.96
Darden Olive Garden Other restaurants p $133,760 39.3 37.9 40.0 0.44 0.47 $3,091 2% 61.6 61.9 67.1 1.70 1.75 1.87
Yum! Brands KFC Fast food p $193,500 39.7 39.7 49.9 0.41 0.51 $3,083 2% 68.7 71.2 86.5 1.90 1.97 1.90
CONTINUES ON THE NEXT PAGE >
Appendix C. Supplemental Tables

133 Return to contents >
TABLE 3. BRANDS TARGETED TO BLACK CONSUMERS (CONTINUED)
TV ad exposure: All youth Black-targeted TV TV ad exposure: Black youth
Company Brand CategoryChild/teen targeted
Hispanic targeted
Total TV spending
($000)
Ads viewed (All 2-5
yrs)
Ads viewed
(All 6-11 yrs)
Ads viewed (All 12-17 yrs)
Child:adult ratio
Teen:adult ratio
Adspending
($000)
% of TV spending
Ads viewed
(2-5 yrs)
Ads viewed
(6-11 yrs)
Ads viewed (12-17
yrs)
Black:White ratio (2-5 yrs)
Black:White ratio (6-11
yrs)
Black:White ratio
(12-17 yrs)
PepsiCoLay’s Potato Chips
Savory snacks p $24,625 10.7 11.0 12.9 0.44 0.51 $2,768 11% 24.9 25.3 33.1 2.75 2.72 3.39
Coca-Cola Sprite Regular soda p $20,484 4.9 5.2 7.3 0.46 0.65 $2,109 10% 11.1 12.3 18.1 2.98 3.11 3.40
PepsiCo Doritos Savory snacks $29,474 11.0 11.6 16.1 0.40 0.55 $2,102 7% 24.1 25.3 36.9 2.59 2.62 2.90
Coca-Cola Coca-Cola Classic Regular soda p $186,116 16.0 16.8 20.9 0.46 0.57 $1,964 1% 28.5 29.5 36.7 1.94 1.94 2.00
General MillsCheerios (All varieties)
Cereal p $107,274 48.8 54.4 43.4 0.74 0.59 $1,867 2% 80.2 89.5 82.3 1.64 1.71 2.10
HersheyHershey’s Candy Bar
Candy p $49,820 23.5 20.7 23.9 0.40 0.45 $1,822 4% 46.7 42.0 50.8 2.22 2.32 2.54
PepsiCo GatoradeOther sugary drinks
$47,256 8.7 9.1 12.1 0.44 0.59 $1,639 3% 17.4 17.8 24.0 2.37 2.29 2.35
Hershey Kit Kat Candy p $47,224 21.2 19.1 23.4 0.41 0.50 $1,636 3% 42.5 39.5 48.5 2.26 2.39 2.45
Hershey Jolly Rancher Candy p $9,890 6.7 6.4 9.3 0.39 0.56 $1,562 16% 16.0 16.5 25.6 2.85 3.22 3.70
Roark Capital Group Wingstop Fast food p p $20,284 6.3 6.9 8.9 0.49 0.63 $1,555 8% 11.2 12.2 16.7 2.31 2.29 2.34
Mars M&Ms Candy Candy p $68,466 11.4 11.8 15.9 0.41 0.56 $1,535 2% 23.7 25.0 34.3 2.34 2.37 2.50
HersheyIce Breakers Breath Mints
Gum and mints p $16,042 9.1 9.0 12.5 0.40 0.56 $1,411 9% 20.3 21.2 31.7 2.50 2.73 3.23
PepsiCo Cheetos Savory snacks p $29,587 10.6 11.5 14.5 0.44 0.56 $1,381 5% 22.0 23.6 31.1 2.35 2.32 2.60
PepsiCoLay’s Poppables Potato Chips
Savory snacks $11,953 5.3 5.6 6.4 0.46 0.53 $1,379 12% 12.1 12.5 16.2 2.72 2.71 3.38
Dine BrandsApplebee’s Neighborhood Grill & Bar
Other restaurants p $116,447 27.3 28.6 31.3 0.44 0.48 $1,326 1% 45.4 47.4 53.0 1.74 1.73 1.77
CONTINUES ON THE NEXT PAGE >
Appendix C. Supplemental Tables

134 Return to contents >
TABLE 3. BRANDS TARGETED TO BLACK CONSUMERS (CONTINUED)
TV ad exposure: All youth Black-targeted TV TV ad exposure: Black youth
Company Brand CategoryChild/teen targeted
Hispanic targeted
Total TV spending
($000)
Ads viewed (All 2-5
yrs)
Ads viewed
(All 6-11 yrs)
Ads viewed (All 12-17 yrs)
Child:adult ratio
Teen:adult ratio
Adspending
($000)
% of TV spending
Ads viewed
(2-5 yrs)
Ads viewed
(6-11 yrs)
Ads viewed (12-17
yrs)
Black:White ratio (2-5 yrs)
Black:White ratio (6-11
yrs)
Black:White ratio
(12-17 yrs)
Unilever Pure Leaf Iced TeaOther sugary drinks
$14,642 6.4 6.7 7.3 0.45 0.50 $1,274 9% 13.1 13.1 16.4 2.22 2.15 2.69
PepsiCo Mountain Dew Regular soda $45,214 10.5 10.9 15.1 0.40 0.56 $1,177 3% 21.1 21.8 30.2 2.31 2.30 2.35
PepsiCo Pepsi Regular soda p $111,942 18.5 18.8 22.6 0.43 0.52 $1,130 1% 34.3 34.1 41.9 2.03 1.97 2.08
General MillsTotino’s Pizza Rolls
Prepared meals p $16,032 10.4 10.6 13.8 0.47 0.61 $1,112 7% 19.0 20.8 29.5 2.01 2.15 2.47
Mars Skittles Candy p p $29,214 7.0 7.2 10.3 0.42 0.61 $1,107 4% 16.1 17.0 24.8 2.70 2.76 2.96
Mars Starburst Candy p $12,261 7.5 7.9 11.9 0.42 0.63 $1,088 9% 17.8 19.5 29.4 2.72 2.81 3.05
HersheyHershey’s Snack Mix
Sweet snacks and desserts
p $25,658 12.7 11.4 13.3 0.41 0.48 $1,080 4% 26.2 23.7 28.2 2.35 2.43 2.49
Berkshire Hathaway Dairy Queen Fast food $102,418 28.2 28.2 31.1 0.42 0.47 $1,077 1% 42.2 40.6 46.9 1.48 1.40 1.53
General MillsNature Valley Snack Bar
Sweet snacks and desserts
$32,965 11.3 11.2 12.4 0.46 0.51 $1,029 3% 18.9 19.2 23.8 1.76 1.82 2.10
PepsiCoTostitos Scoops! Tortilla Chips
Savory snacks $12,910 5.1 5.4 7.0 0.40 0.52 $1,014 8% 11.3 11.9 16.3 2.55 2.54 2.88
Mars Snickers Candy p $58,102 8.7 8.6 11.2 0.39 0.51 $960 2% 17.6 17.5 22.6 2.26 2.29 2.30
Hershey Twizzlers Candy p $26,860 13.2 12.1 13.7 0.40 0.45 $952 4% 25.3 23.1 26.3 2.15 2.18 2.24
UnileverCountry Crock Margarine
Condiments and food preparation
p $29,203 8.0 7.1 7.7 0.38 0.41 $945 3% 15.3 14.2 15.5 2.12 2.28 2.34
Coca-ColaGlaceau Vitaminwater
Other sugary drinks
p $6,180 2.8 3.4 4.9 0.56 0.80 $924 15% 6.0 7.1 10.8 2.82 2.65 2.84
Mars Orbit Gum and mints p $22,847 7.1 7.4 10.6 0.40 0.58 $923 4% 15.0 16.2 23.3 2.34 2.40 2.56
CONTINUES ON THE NEXT PAGE >
Appendix C. Supplemental Tables
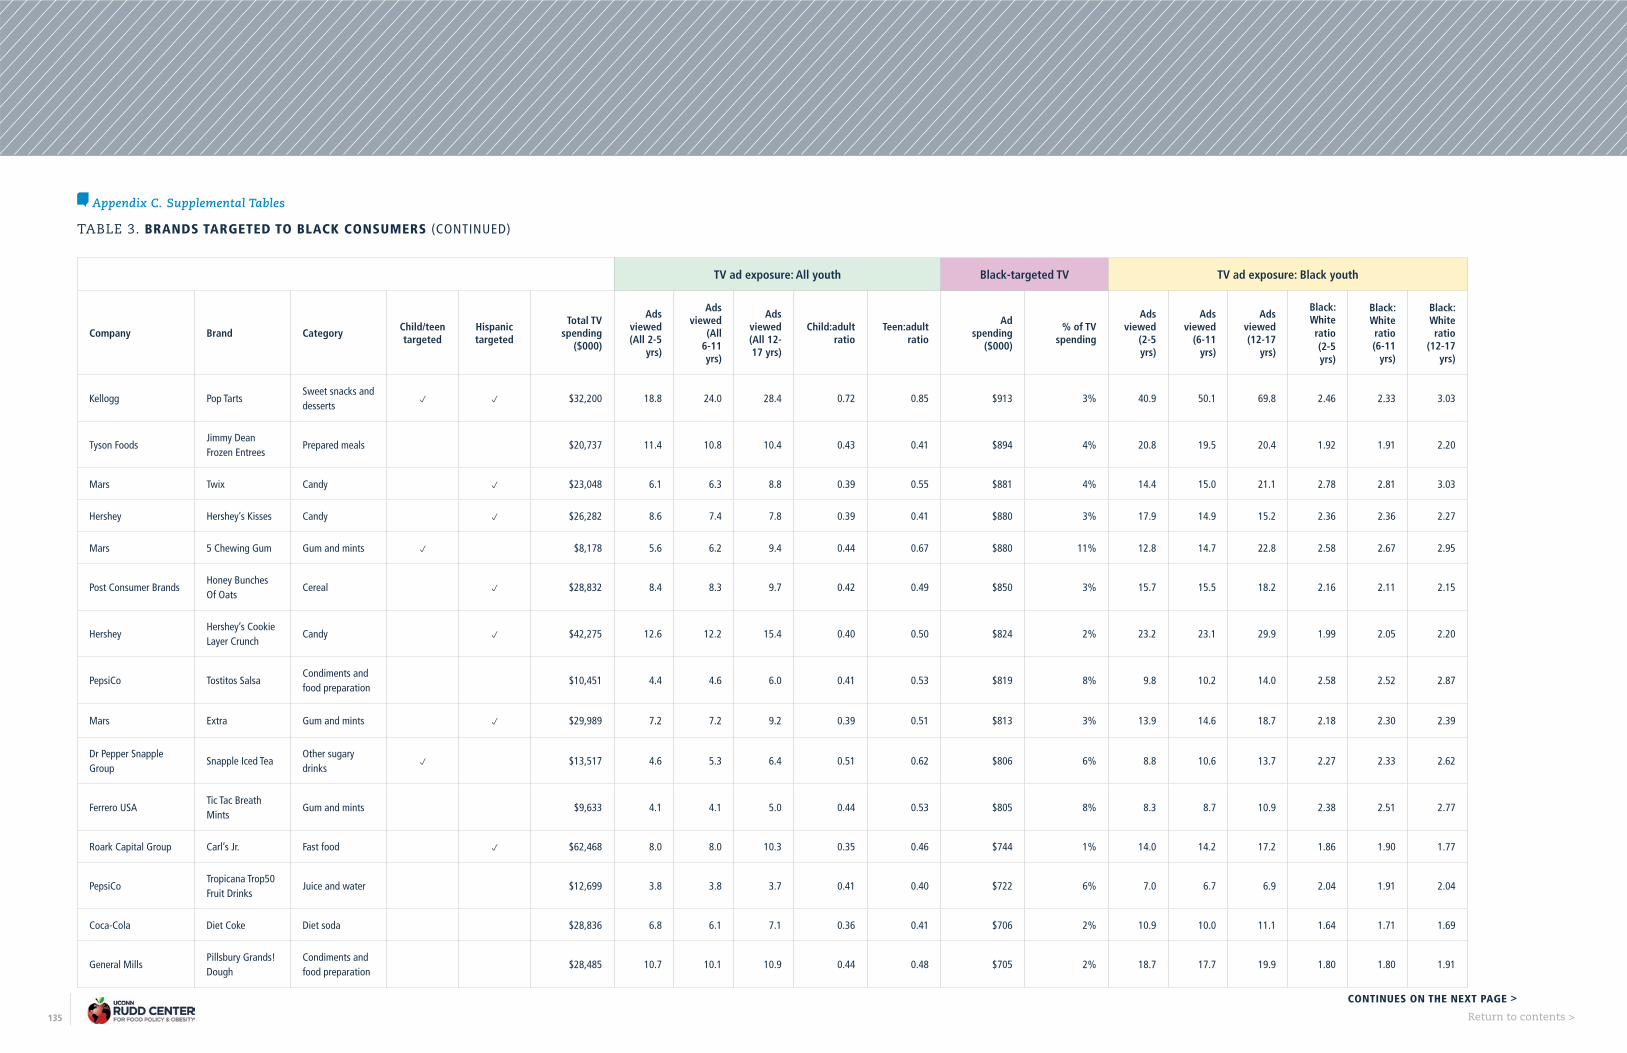
135 Return to contents >
TABLE 3. BRANDS TARGETED TO BLACK CONSUMERS (CONTINUED)
TV ad exposure: All youth Black-targeted TV TV ad exposure: Black youth
Company Brand CategoryChild/teen targeted
Hispanic targeted
Total TV spending
($000)
Ads viewed (All 2-5
yrs)
Ads viewed
(All 6-11 yrs)
Ads viewed (All 12-17 yrs)
Child:adult ratio
Teen:adult ratio
Adspending
($000)
% of TV spending
Ads viewed
(2-5 yrs)
Ads viewed
(6-11 yrs)
Ads viewed (12-17
yrs)
Black:White ratio (2-5 yrs)
Black:White ratio (6-11
yrs)
Black:White ratio
(12-17 yrs)
Kellogg Pop TartsSweet snacks and desserts
p p $32,200 18.8 24.0 28.4 0.72 0.85 $913 3% 40.9 50.1 69.8 2.46 2.33 3.03
Tyson FoodsJimmy Dean Frozen Entrees
Prepared meals $20,737 11.4 10.8 10.4 0.43 0.41 $894 4% 20.8 19.5 20.4 1.92 1.91 2.20
Mars Twix Candy p $23,048 6.1 6.3 8.8 0.39 0.55 $881 4% 14.4 15.0 21.1 2.78 2.81 3.03
Hershey Hershey’s Kisses Candy p $26,282 8.6 7.4 7.8 0.39 0.41 $880 3% 17.9 14.9 15.2 2.36 2.36 2.27
Mars 5 Chewing Gum Gum and mints p $8,178 5.6 6.2 9.4 0.44 0.67 $880 11% 12.8 14.7 22.8 2.58 2.67 2.95
Post Consumer BrandsHoney Bunches Of Oats
Cereal p $28,832 8.4 8.3 9.7 0.42 0.49 $850 3% 15.7 15.5 18.2 2.16 2.11 2.15
HersheyHershey’s Cookie Layer Crunch
Candy p $42,275 12.6 12.2 15.4 0.40 0.50 $824 2% 23.2 23.1 29.9 1.99 2.05 2.20
PepsiCo Tostitos SalsaCondiments and food preparation
$10,451 4.4 4.6 6.0 0.41 0.53 $819 8% 9.8 10.2 14.0 2.58 2.52 2.87
Mars Extra Gum and mints p $29,989 7.2 7.2 9.2 0.39 0.51 $813 3% 13.9 14.6 18.7 2.18 2.30 2.39
Dr Pepper Snapple Group
Snapple Iced TeaOther sugary drinks
p $13,517 4.6 5.3 6.4 0.51 0.62 $806 6% 8.8 10.6 13.7 2.27 2.33 2.62
Ferrero USATic Tac Breath Mints
Gum and mints $9,633 4.1 4.1 5.0 0.44 0.53 $805 8% 8.3 8.7 10.9 2.38 2.51 2.77
Roark Capital Group Carl’s Jr. Fast food p $62,468 8.0 8.0 10.3 0.35 0.46 $744 1% 14.0 14.2 17.2 1.86 1.90 1.77
PepsiCoTropicana Trop50 Fruit Drinks
Juice and water $12,699 3.8 3.8 3.7 0.41 0.40 $722 6% 7.0 6.7 6.9 2.04 1.91 2.04
Coca-Cola Diet Coke Diet soda $28,836 6.8 6.1 7.1 0.36 0.41 $706 2% 10.9 10.0 11.1 1.64 1.71 1.69
General MillsPillsbury Grands! Dough
Condiments and food preparation
$28,485 10.7 10.1 10.9 0.44 0.48 $705 2% 18.7 17.7 19.9 1.80 1.80 1.91
CONTINUES ON THE NEXT PAGE >
Appendix C. Supplemental Tables

136 Return to contents >
TABLE 3. BRANDS TARGETED TO BLACK CONSUMERS (CONTINUED)
TV ad exposure: All youth Black-targeted TV TV ad exposure: Black youth
Company Brand CategoryChild/teen targeted
Hispanic targeted
Total TV spending
($000)
Ads viewed (All 2-5
yrs)
Ads viewed
(All 6-11 yrs)
Ads viewed (All 12-17 yrs)
Child:adult ratio
Teen:adult ratio
Ad spending
($000)
% of TV spending
Ads viewed
(2-5 yrs)
Ads viewed
(6-11 yrs)
Ads viewed (12-17
yrs)
Black:White ratio (2-5 yrs)
Black:White ratio (6-11
yrs)
Black:White ratio
(12-17 yrs)
PepsiCoDoritos Mix Tortilla Chips
Savory snacks $8,902 3.6 3.8 5.4 0.39 0.55 $704 8% 8.4 8.7 12.5 2.82 2.83 3.02
HersheyIce Breakers Ice Cubes
Gum and mints p $7,989 4.5 4.5 6.1 0.42 0.57 $700 9% 10.8 10.8 15.1 2.80 2.99 3.19
PepsiCo Frito-Lay Snacks Savory snacks $17,271 6.5 6.6 6.7 0.42 0.43 $699 4% 11.5 11.7 12.6 1.95 1.94 2.12
General Mills Big G Cereals Cereal p p $45,828 16.1 17.2 13.2 0.79 0.60 $658 1% 26.7 29.1 25.7 1.72 1.77 2.18
Dr Pepper Snapple Group
Canada Dry Ginger Ale
Regular soda $27,370 6.8 6.4 6.9 0.40 0.43 $653 2% 9.7 9.5 10.2 1.46 1.49 1.51
Mars Dove Candy p $18,624 5.2 4.7 5.6 0.36 0.44 $649 3% 11.2 10.5 12.4 2.49 2.64 2.72
Dine Brands IHOP Other restaurants p $85,940 14.4 13.4 14.0 0.36 0.38 $644 1% 26.4 24.6 24.3 1.94 1.96 1.87
Mondelez International
Milka Oreo Candy Bar
Candy $17,112 7.1 6.3 7.6 0.38 0.46 $639 4% 12.9 12.0 14.3 1.94 2.01 2.10
Coca-ColaMinute Maid Premium Fruit Juices
Juice and water $7,514 3.1 3.4 3.5 0.53 0.55 $637 8% 5.6 6.4 7.1 2.07 2.13 2.32
Nestle Hot Pockets Prepared meals p $16,008 8.0 7.8 10.0 0.44 0.57 $636 4% 17.3 17.0 23.8 2.58 2.53 2.92
Hershey Payday Candy p $15,865 6.0 5.9 6.9 0.39 0.45 $621 4% 12.0 11.9 13.9 2.21 2.24 2.31
UnileverI Can’t Believe Its Not Butter Vegan Margarine
Condiments and food preparation
$12,205 4.0 4.0 4.5 0.42 0.46 $608 5% 8.0 8.0 8.8 2.40 2.41 2.40
MondelezInternational
OreoSweet snacks and desserts
p $26,222 6.7 5.8 6.5 0.36 0.40 $605 2% 12.4 11.2 12.7 2.00 2.14 2.27
PepsiCoQuaker Oats Oatmeal
Cereal p $28,566 11.0 9.8 10.0 0.99 1.00 $604 2% 0.8 19.2 17.1 0.02 1.76 1.80
CONTINUES ON THE NEXT PAGE >
Appendix C. Supplemental Tables

137 Return to contents >
TABLE 3. BRANDS TARGETED TO BLACK CONSUMERS (CONTINUED)
TV ad exposure: All youth Black-targeted TV TV ad exposure: Black youth
Company Brand CategoryChild/teen targeted
Hispanic targeted
Total TV spending
($000)
Ads viewed (All 2-5
yrs)
Ads viewed
(All 6-11 yrs)
Ads viewed (All 12-17 yrs)
Child:adult ratio
Teen:adult ratio
Adspending
($000)
% of TV spending
Ads viewed
(2-5 yrs)
Ads viewed
(6-11 yrs)
Ads viewed (12-17
yrs)
Black:White ratio (2-5 yrs)
Black:White ratio (6-11
yrs)
Black:White ratio
(12-17 yrs)
HersheyBreath Savers Protect Breath Mints
Gum and mints p $13,241 5.2 4.9 5.6 0.38 0.44 $603 5% 9.8 10.1 12.6 2.10 2.39 2.72
PepsiCo Gatorade FlowOther sugary drinks
p $20,787 3.5 3.8 5.5 0.44 0.65 $600 3% 7.0 8.0 12.2 2.28 2.45 2.63
PepsiCoTostitos Tortilla Chips
Savory snacks $18,647 4.4 4.6 5.7 0.42 0.52 $593 3% 9.3 9.7 12.7 2.43 2.35 2.65
General Mills Progresso Soup Prepared meals $19,714 8.0 7.8 8.7 0.44 0.48 $592 3% 14.6 13.9 16.4 1.94 1.84 2.00
Coca-Cola Coke Zero Diet soda p $53,752 5.0 4.9 6.2 0.39 0.50 $591 1% 10.0 9.5 10.9 2.25 2.09 1.88
CampbellPepperidge Farm Goldfish Crackers
Savory snacks p p $21,142 23.0 31.0 15.7 2.41 1.22 $585 3% 36.3 47.8 31.3 1.64 1.69 2.49
Mars Milky Way Candy $9,917 4.7 4.8 6.9 0.41 0.58 $581 6% 11.0 11.6 16.4 2.83 2.83 2.92
PepsiCoTropicana Essentials Fruit Juices
Juice and water $10,672 4.0 4.1 4.3 0.43 0.45 $580 5% 6.7 6.6 7.5 1.75 1.70 1.93
Coca-Cola Sprite Cranberry Regular soda p $5,520 1.4 1.4 1.8 0.51 0.64 $578 10% 3.1 3.3 4.1 2.90 3.02 3.04
PepsiCoMountain Dew Kickstart
Regular soda p $14,280 4.3 4.7 6.7 0.42 0.60 $577 4% 9.6 10.5 15.2 2.61 2.63 2.86
UnileverMagnum Ice Cream Novelties
Sweet snacks and desserts
p $16,284 3.0 3.0 3.2 0.40 0.43 $560 3% 6.2 6.2 6.7 2.47 2.46 2.57
Roark Capital Group Jimmy John’s Fast food p $20,029 1.3 1.4 2.2 0.40 0.62 $559 3% 2.5 2.7 4.0 2.22 2.25 1.99
PepsiCoPropel Bottled Water
Other sugary drinks
$10,192 3.1 3.2 4.2 0.36 0.47 $540 5% 4.9 5.5 7.2 1.60 1.81 1.92
HersheyReese’s Crunchers Candy
Candy p $10,791 4.4 4.1 4.4 0.40 0.43 $534 5% 8.0 7.1 8.6 2.09 1.98 2.25
CONTINUES ON THE NEXT PAGE >
Appendix C. Supplemental Tables

138 Return to contents >
TABLE 3. BRANDS TARGETED TO BLACK CONSUMERS (CONTINUED)
TV ad exposure: All youth Black-targeted TV TV ad exposure: Black youth
Company Brand CategoryChild/teen targeted
Hispanic targeted
Total TV spending
($000)
Ads viewed (All 2-5
yrs)
Ads viewed
(All 6-11 yrs)
Ads viewed (All 12-17 yrs)
Child:adult ratio
Teen:adult ratio
Adspending
($000)
% of TV spending
Ads viewed
(2-5 yrs)
Ads viewed
(6-11 yrs)
Ads viewed (12-17
yrs)
Black:White ratio (2-5 yrs)
Black:White ratio (6-11
yrs)
Black:White ratio
(12-17 yrs)
Dr Pepper Snapple Group
7 Up Regular soda $17,700 2.6 2.6 3.2 0.35 0.44 $517 3% 4.5 4.6 5.4 1.79 1.93 1.73
PepsiCoQuaker Breakfast Flats Snack Bar
Sweet snacks and desserts
$13,906 5.6 5.3 5.4 0.41 0.42 $504 4% 10.6 9.8 10.4 2.03 1.98 2.20
General MillsCinnamon Toast Crunch
Cereal p $31,344 41.0 49.9 26.3 1.73 0.91 $498 2% 66.2 79.5 53.5 1.55 1.65 2.34
HersheyReese’s Peanut Butter Egg Candy
Candy p $14,924 4.5 4.3 5.8 0.38 0.52 $489 3% 8.7 8.7 12.4 2.21 2.41 2.60
MarsGoodnessKNOWS Snack Bar
Sweet snacks and desserts
$15,202 5.6 5.8 8.2 0.40 0.56 $465 3% 12.0 12.4 17.4 2.44 2.44 2.52
PepsiCoQuaker Chewy Snack Bar
Sweet snacks and desserts
$11,379 3.7 3.6 3.7 0.41 0.43 $460 4% 7.0 6.3 7.0 2.02 1.86 2.16
Hershey Brookside Candy Candy p $21,985 7.8 7.3 8.3 0.40 0.46 $454 2% 13.0 12.2 15.1 1.96 1.95 2.16
Tyson FoodsJimmy Dean Delights Frozen Entrees
Prepared meals $13,145 7.5 7.0 6.6 0.43 0.41 $454 3% 14.0 12.7 13.4 2.00 1.96 2.29
PepsiCoTropicana Fruit Juices
Juice and water $7,605 2.1 1.9 2.3 0.34 0.41 $427 6% 4.2 3.9 4.9 2.12 2.16 2.41
UnileverKnorr Selects Rice Mix
Prepared meals p $9,236 3.0 3.1 3.4 0.44 0.47 $423 5% 6.7 7.3 7.8 2.58 2.72 2.68
Hershey Kit Kat Big Kat Candy p $9,506 4.8 4.0 4.5 0.41 0.46 $416 4% 9.8 8.2 9.6 2.33 2.34 2.40
Unilever Breyers Ice CreamSweet snacks and desserts
p $11,831 2.8 2.6 2.8 0.38 0.41 $404 3% 5.8 5.9 6.2 2.24 2.55 2.56
Mondelez International
Sour Patch Kids Candy p p $11,379 4.5 4.5 6.6 0.45 0.65 $399 4% 8.6 9.4 15.6 2.25 2.48 3.17
CONTINUES ON THE NEXT PAGE >
Appendix C. Supplemental Tables

139 Return to contents >
TABLE 3. BRANDS TARGETED TO BLACK CONSUMERS (CONTINUED)
TV ad exposure: All youth Black-targeted TV TV ad exposure: Black youth
Company Brand CategoryChild/teen targeted
Hispanic targeted
Total TV spending
($000)
Ads viewed (All 2-5
yrs)
Ads viewed
(All 6-11 yrs)
Ads viewed (All 12-17 yrs)
Child:adult ratio
Teen:adult ratio
Adspending
($000)
% of TV spending
Ads viewed
(2-5 yrs)
Ads viewed
(6-11 yrs)
Ads viewed (12-17
yrs)
Black:White ratio (2-5 yrs)
Black:White ratio (6-11
yrs)
Black:White ratio
(12-17 yrs)
PepsiCoLay’s Kettle Cooked Potato Chips
Savory snacks $3,330 1.0 0.9 1.0 0.42 0.45 $335 10% 2.2 2.2 2.7 2.66 2.74 3.31
Coca-Cola Powerade Ion4Other sugary drinks
p $7,095 1.8 1.9 3.2 0.44 0.74 $329 5% 4.6 4.9 7.3 3.30 3.30 3.01
Mondelez International
Belvita CookiesSweet snacks and desserts
p $11,355 3.9 3.2 3.9 0.36 0.42 $328 3% 6.9 6.3 7.1 2.01 2.13 2.17
Mondelez International
Nabisco Ritz Crackers
Savory snacks p $10,625 3.6 3.0 3.2 0.34 0.36 $316 3% 6.5 5.8 6.1 1.99 2.18 2.18
PepsiCoMountain Dew Diet
Diet soda p $4,594 1.9 2.3 3.3 0.47 0.66 $312 7% 4.4 5.4 7.4 2.78 2.88 3.01
PepsiCo Pepsi Zero Diet soda p $33,174 3.9 4.0 5.1 0.44 0.55 $311 1% 6.8 7.0 9.3 1.91 1.90 2.12
Hershey Hershey’s Candy Candy $4,763 1.9 1.5 1.7 0.32 0.37 $300 6% 4.0 3.6 4.3 2.31 2.60 2.80
Mondelez International
Triscuit Crackers Savory snacks $8,330 3.6 3.0 3.3 0.37 0.40 $286 3% 7.1 6.3 6.8 2.35 2.58 2.53
Roark Capital GroupAtkins Harvest Trail Snack Bar
Sweet snacks and desserts
$7,127 2.1 1.7 1.8 0.37 0.38 $267 4% 4.5 3.8 4.3 2.35 2.34 2.83
UnileverI Can’t Believe It’s Not Butter Margarine
Condiments and food preparation
$7,160 2.2 2.2 2.4 0.39 0.44 $266 4% 4.0 4.1 4.5 2.02 2.03 2.11
Kellogg Frosted Flakes Cereal p $18,070 42.0 55.3 30.1 2.33 1.27 $262 1% 70.9 91.4 67.4 1.75 1.77 2.77
UnileverKlondike Ice Cream Novelties
Sweet snacks and desserts
$8,563 3.4 3.5 4.4 0.39 0.49 $257 3% 6.2 6.6 8.4 2.11 2.19 2.22
NestleStouffer’s Frozen Entrees
Prepared meals p $22,017 9.1 8.5 8.6 0.41 0.42 $248 1% 18.0 16.0 16.4 2.15 2.07 2.18
CONTINUES ON THE NEXT PAGE >
Appendix C. Supplemental Tables

140 Return to contents >
TABLE 3. BRANDS TARGETED TO BLACK CONSUMERS (CONTINUED)
TV ad exposure: All youth Black-targeted TV TV ad exposure: Black youth
Company Brand CategoryChild/teen targeted
Hispanic targeted
Total TV spending
($000)
Ads viewed (All 2-5
yrs)
Ads viewed
(All 6-11 yrs)
Ads viewed (All 12-17 yrs)
Child:adult ratio
Teen:adult ratio
Adspending
($000)
% of TV spending
Ads viewed
(2-5 yrs)
Ads viewed
(6-11 yrs)
Ads viewed (12-17
yrs)
Black:White ratio (2-5 yrs)
Black:White ratio (6-11
yrs)
Black:White ratio
(12-17 yrs)
PepsiCoQuaker Breakfast Squares Snack Bar
Sweet snacks and desserts
$6,749 3.1 2.9 2.9 0.41 0.41 $247 4% 5.7 5.5 6.0 1.99 1.99 2.46
UnileverBreyer’s Gelato Indulgences Frozen Dessert
Sweet snacks and desserts
$8,668 2.0 1.9 2.0 0.36 0.38 $247 3% 3.9 3.8 4.1 2.19 2.42 2.60
Mars Uncle Ben’s Rice Prepared meals $7,571 2.4 2.2 2.4 0.35 0.39 $237 3% 4.7 4.3 4.9 2.14 2.17 2.37
MarsWrigley’s Juicy Fruit
Gum and mints p p $5,072 1.7 1.8 2.8 0.41 0.63 $234 5% 3.9 4.3 6.8 2.49 2.66 3.01
HersheyCadbury Eggs Candy
Candy $8,653 3.5 3.0 3.5 0.36 0.42 $221 3% 6.9 6.0 7.1 2.16 2.35 2.48
DannonDannon Activia Yogurt
Yogurt p $14,854 5.1 4.0 3.8 0.35 0.33 $220 1% 11.3 9.4 8.8 2.54 2.62 2.61
General Mills Yoplait Go-Gurt Yogurt p $10,872 9.5 11.5 6.3 1.46 0.80 $219 2% 14.8 17.5 12.7 1.61 1.57 2.28
General MillsYoplait Greek Yogurt
Yogurt $7,775 2.6 2.6 3.2 0.44 0.53 $211 3% 4.8 5.0 6.6 1.96 2.11 2.40
General MillsProgresso Traditional Soup
Prepared meals $5,390 1.7 1.5 1.7 0.39 0.44 $211 4% 3.2 3.0 3.5 2.08 2.06 2.27
Tyson FoodsTyson Anytizers Frozen Entrees
Prepared meals $4,291 2.1 2.0 2.1 0.41 0.43 $197 5% 4.1 3.9 4.2 1.91 1.91 2.15
General MillsNature Valley Sweet & Salty Nut Snack Bar
Sweet snacks and desserts
$6,717 3.0 2.8 3.3 0.41 0.48 $186 3% 5.3 5.1 6.5 1.89 1.96 2.17
NestleNestle Toll House Cookie Dough
Condiments and food preparation
$10,500 5.0 4.3 5.0 0.37 0.43 $185 2% 9.0 7.9 9.7 1.90 1.91 2.19
Hershey Krave Snacks Other p $3,112 1.8 1.7 2.0 0.43 0.50 $168 5% 3.1 2.9 3.7 2.10 2.04 2.23
CONTINUES ON THE NEXT PAGE >
Appendix C. Supplemental Tables
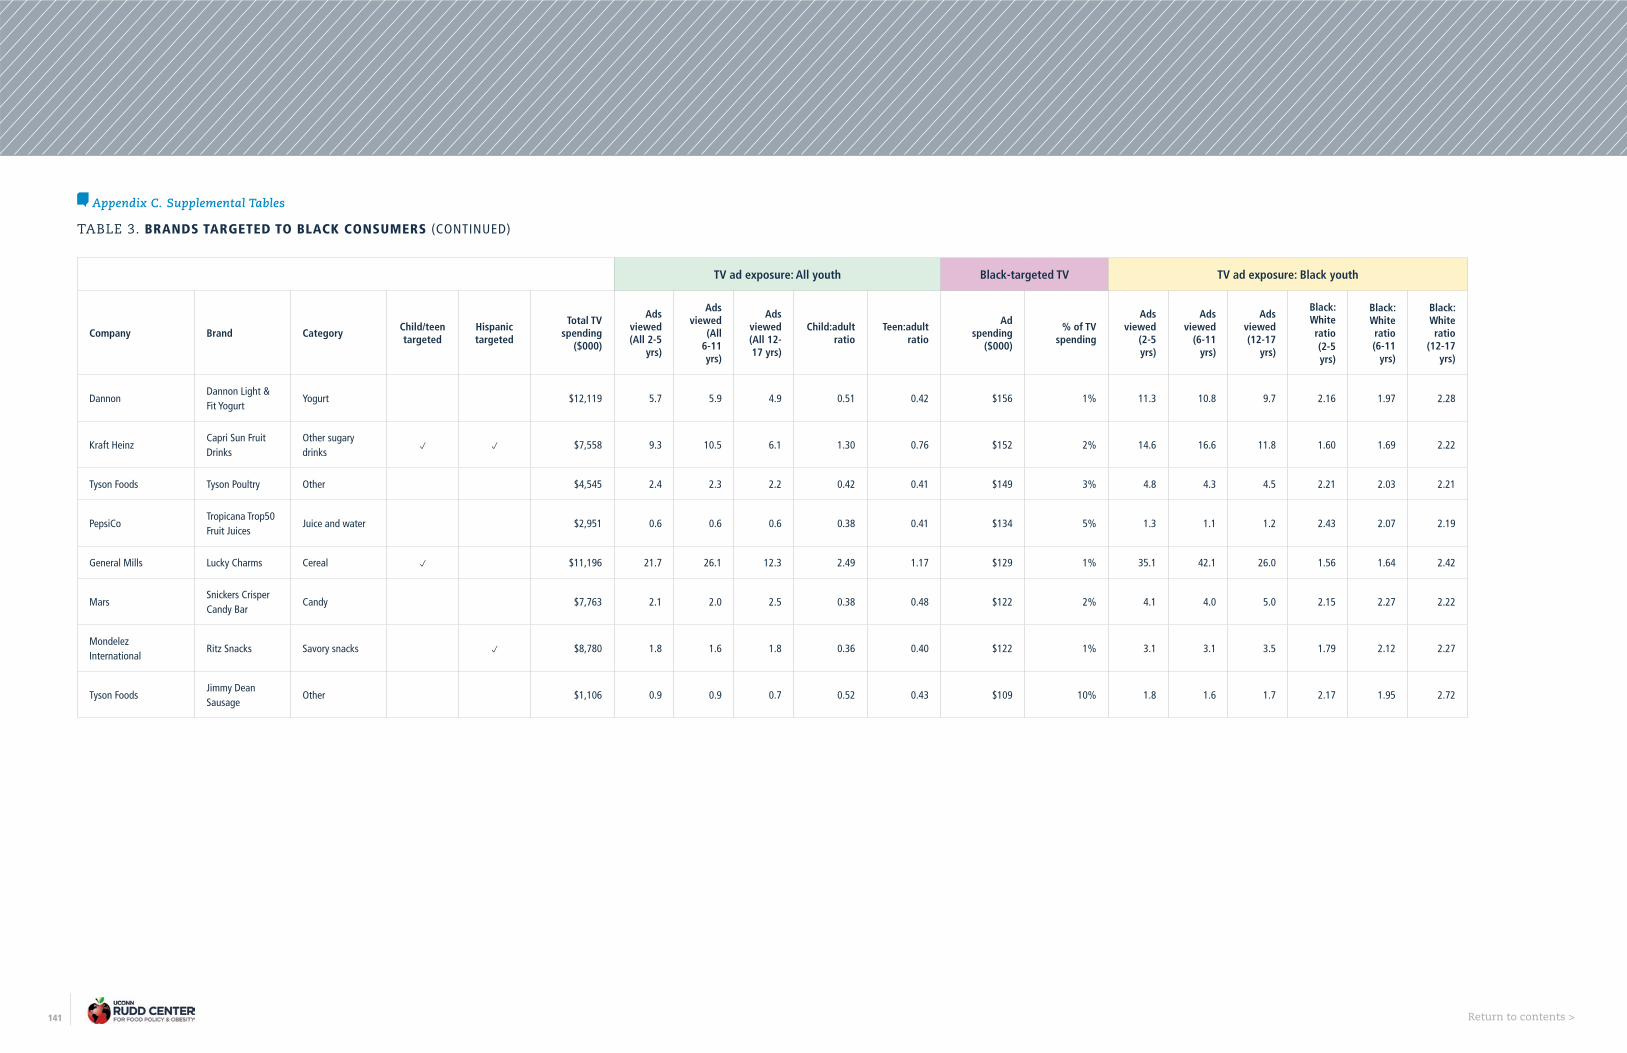
141 Return to contents >
TABLE 3. BRANDS TARGETED TO BLACK CONSUMERS (CONTINUED)
TV ad exposure: All youth Black-targeted TV TV ad exposure: Black youth
Company Brand CategoryChild/teen targeted
Hispanic targeted
Total TV spending
($000)
Ads viewed (All 2-5
yrs)
Ads viewed
(All 6-11 yrs)
Ads viewed (All 12-17 yrs)
Child:adult ratio
Teen:adult ratio
Adspending
($000)
% of TV spending
Ads viewed
(2-5 yrs)
Ads viewed
(6-11 yrs)
Ads viewed (12-17
yrs)
Black:White ratio (2-5 yrs)
Black:White ratio (6-11
yrs)
Black:White ratio
(12-17 yrs)
DannonDannon Light & Fit Yogurt
Yogurt $12,119 5.7 5.9 4.9 0.51 0.42 $156 1% 11.3 10.8 9.7 2.16 1.97 2.28
Kraft HeinzCapri Sun Fruit Drinks
Other sugary drinks
p p $7,558 9.3 10.5 6.1 1.30 0.76 $152 2% 14.6 16.6 11.8 1.60 1.69 2.22
Tyson Foods Tyson Poultry Other $4,545 2.4 2.3 2.2 0.42 0.41 $149 3% 4.8 4.3 4.5 2.21 2.03 2.21
PepsiCoTropicana Trop50 Fruit Juices
Juice and water $2,951 0.6 0.6 0.6 0.38 0.41 $134 5% 1.3 1.1 1.2 2.43 2.07 2.19
General Mills Lucky Charms Cereal p $11,196 21.7 26.1 12.3 2.49 1.17 $129 1% 35.1 42.1 26.0 1.56 1.64 2.42
MarsSnickers Crisper Candy Bar
Candy $7,763 2.1 2.0 2.5 0.38 0.48 $122 2% 4.1 4.0 5.0 2.15 2.27 2.22
MondelezInternational
Ritz Snacks Savory snacks p $8,780 1.8 1.6 1.8 0.36 0.40 $122 1% 3.1 3.1 3.5 1.79 2.12 2.27
Tyson FoodsJimmy Dean Sausage
Other $1,106 0.9 0.9 0.7 0.52 0.43 $109 10% 1.8 1.6 1.7 2.17 1.95 2.72
Appendix C. Supplemental Tables

142 Return to contents >
TABLE 4. ALL OTHER BRANDS
TV ad exposure: All youth TV ad exposure: Black youth
Company Brand CategoryChild/teen targeted
Total TV ad spending ($000)
Ads viewed (All 2-5 yrs)
Ads viewed (All 6-11 yrs)
Ads viewed (All 12-17
yrs)
Child:adult ratio
Teen:adult ratio
Ads viewed (2-5 yrs)
Ads viewed (6-11 yrs)
Ads viewed (12-17 yrs)
Black:White ratio (2-5
yrs)
Black:White ratio (6-11
yrs)
Black:White ratio (12-17
yrs)
Ferrero USANutella Sandwich Spread
Condiments and food preparation
$33,053 7.6 7.1 7.0 0.41 0.41 14.3 13.2 13.1 2.03 2.04 2.08
The Wonderful Company
Wonderful Nuts Nuts $31,124 7.6 7.4 8.0 0.37 0.40 8.7 8.6 8.3 1.19 1.19 1.06
Dr Pepper Snapple Group
Diet Dr Pepper Diet soda $24,961 3.9 3.9 4.8 0.42 0.52 5.5 5.7 6.8 1.41 1.52 1.44
CampbellV8 Vegetable Juice
Juice and water $24,035 6.2 5.1 5.1 0.37 0.37 10.9 8.5 7.5 1.84 1.76 1.54
Coca-ColaSimply Orange Fruit Juices
Juice and water $22,663 5.6 5.5 6.1 0.36 0.40 7.0 7.0 7.6 1.24 1.30 1.26
Kellogg Cheez-It Crackers Savory snacks $21,749 8.0 8.2 9.3 0.41 0.46 13.9 13.6 15.2 1.80 1.74 1.76
CampbellCampbell’s Well Yes!
Prepared meals $21,732 4.4 3.7 3.9 0.34 0.36 6.0 4.7 4.3 1.38 1.27 1.09
Dr Pepper Snapple Group
Bai Antioxidant Infusion Fruit Drinks
Other sugary drinks
$19,289 4.3 4.6 5.3 0.45 0.52 5.3 5.8 6.6 1.27 1.30 1.27
KelloggRaisin Bran Crunch
Cereal $18,434 7.0 7.1 7.3 0.41 0.42 12.3 12.1 12.6 1.90 1.84 1.88
Coca-ColaGold Peak Iced Tea
Other sugary drinks
$17,740 5.0 5.3 5.2 0.48 0.47 6.1 6.7 6.4 1.22 1.27 1.24
The Wonderful Company
Fiji Bottled Water Juice and water $17,679 4.5 4.7 5.7 0.38 0.47 5.7 6.1 7.1 1.28 1.34 1.30
Kraft HeinzKraft Natural Cheese
Other dairy $17,614 7.1 6.9 7.6 0.40 0.44 10.5 10.5 11.6 1.43 1.46 1.52
ConAgra BrandsMarie Callenders Frozen Entrees
Prepared meals $16,333 6.7 6.2 5.9 0.39 0.37 10.6 9.7 9.3 1.59 1.56 1.64
CONTINUES ON THE NEXT PAGE >
Appendix C. Supplemental Tables
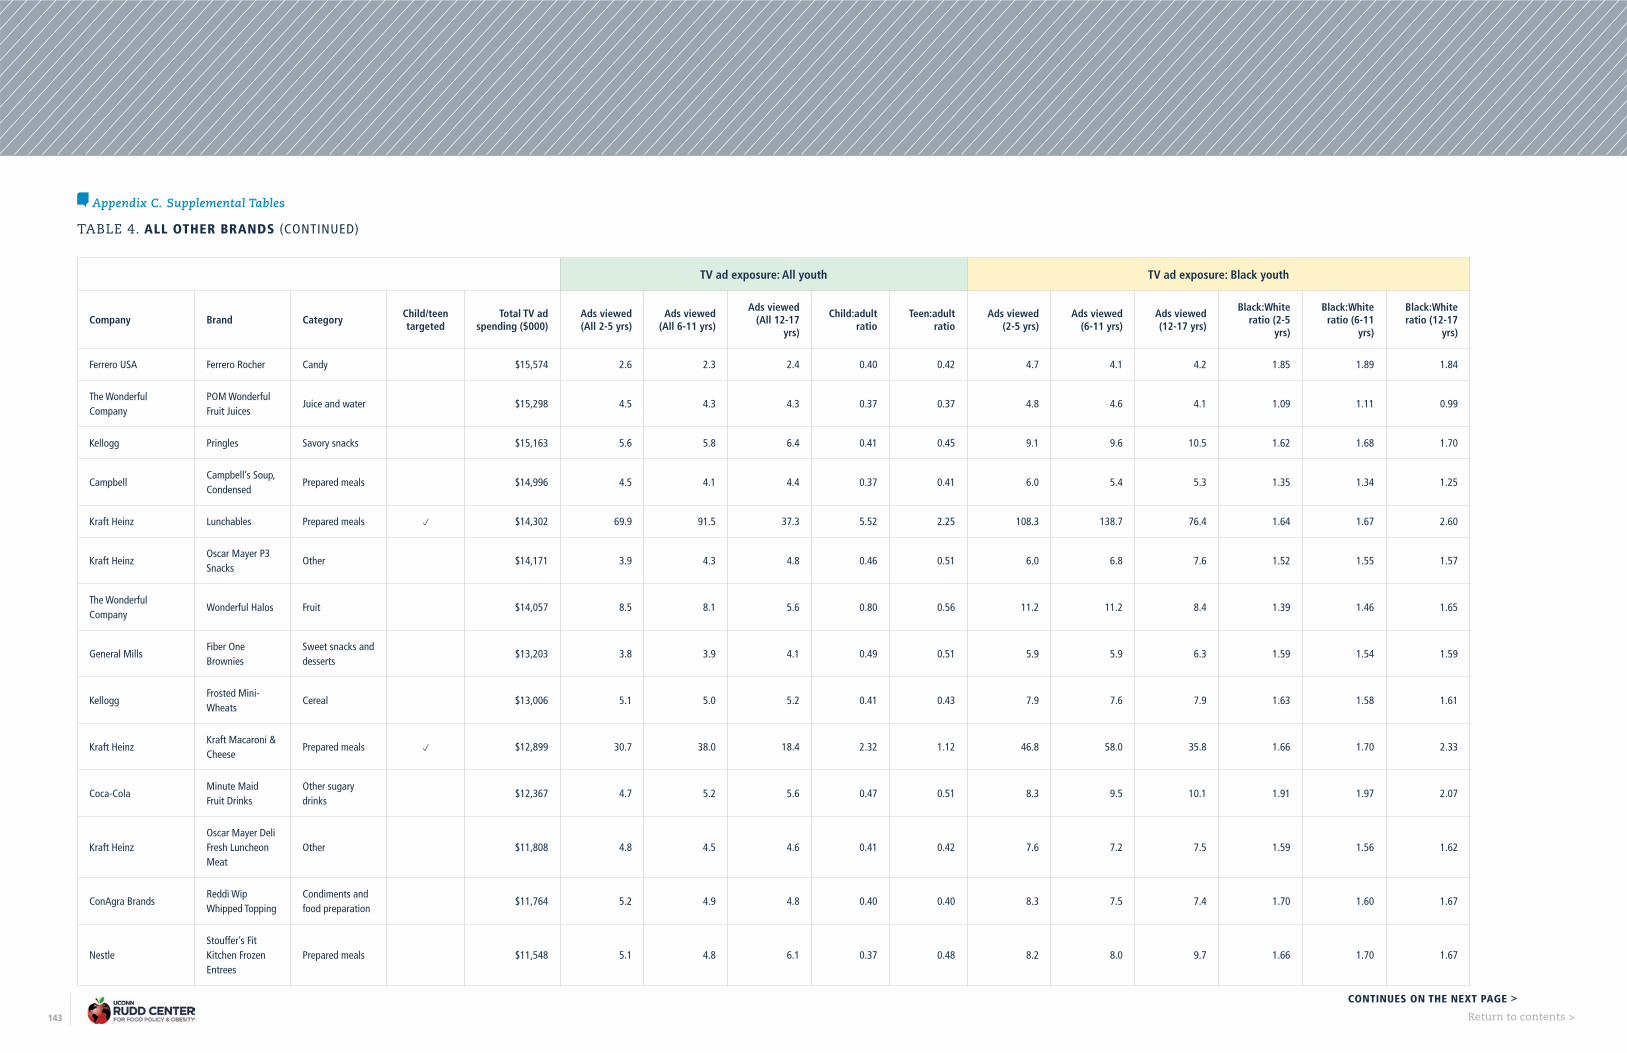
143 Return to contents >
TABLE 4. ALL OTHER BRANDS (CONTINUED)
TV ad exposure: All youth TV ad exposure: Black youth
Company Brand CategoryChild/teen targeted
Total TV ad spending ($000)
Ads viewed (All 2-5 yrs)
Ads viewed (All 6-11 yrs)
Ads viewed (All 12-17
yrs)
Child:adult ratio
Teen:adult ratio
Ads viewed (2-5 yrs)
Ads viewed (6-11 yrs)
Ads viewed (12-17 yrs)
Black:White ratio (2-5
yrs)
Black:White ratio (6-11
yrs)
Black:White ratio (12-17
yrs)
Ferrero USA Ferrero Rocher Candy $15,574 2.6 2.3 2.4 0.40 0.42 4.7 4.1 4.2 1.85 1.89 1.84
The Wonderful Company
POM Wonderful Fruit Juices
Juice and water $15,298 4.5 4.3 4.3 0.37 0.37 4.8 4.6 4.1 1.09 1.11 0.99
Kellogg Pringles Savory snacks $15,163 5.6 5.8 6.4 0.41 0.45 9.1 9.6 10.5 1.62 1.68 1.70
CampbellCampbell’s Soup, Condensed
Prepared meals $14,996 4.5 4.1 4.4 0.37 0.41 6.0 5.4 5.3 1.35 1.34 1.25
Kraft Heinz Lunchables Prepared meals p $14,302 69.9 91.5 37.3 5.52 2.25 108.3 138.7 76.4 1.64 1.67 2.60
Kraft HeinzOscar Mayer P3 Snacks
Other $14,171 3.9 4.3 4.8 0.46 0.51 6.0 6.8 7.6 1.52 1.55 1.57
The Wonderful Company
Wonderful Halos Fruit $14,057 8.5 8.1 5.6 0.80 0.56 11.2 11.2 8.4 1.39 1.46 1.65
General MillsFiber One Brownies
Sweet snacks and desserts
$13,203 3.8 3.9 4.1 0.49 0.51 5.9 5.9 6.3 1.59 1.54 1.59
KelloggFrosted Mini-Wheats
Cereal $13,006 5.1 5.0 5.2 0.41 0.43 7.9 7.6 7.9 1.63 1.58 1.61
Kraft HeinzKraft Macaroni & Cheese
Prepared meals p $12,899 30.7 38.0 18.4 2.32 1.12 46.8 58.0 35.8 1.66 1.70 2.33
Coca-ColaMinute Maid Fruit Drinks
Other sugary drinks
$12,367 4.7 5.2 5.6 0.47 0.51 8.3 9.5 10.1 1.91 1.97 2.07
Kraft HeinzOscar Mayer Deli Fresh Luncheon Meat
Other $11,808 4.8 4.5 4.6 0.41 0.42 7.6 7.2 7.5 1.59 1.56 1.62
ConAgra BrandsReddi Wip Whipped Topping
Condiments and food preparation
$11,764 5.2 4.9 4.8 0.40 0.40 8.3 7.5 7.4 1.70 1.60 1.67
NestleStouffer’s Fit Kitchen Frozen Entrees
Prepared meals $11,548 5.1 4.8 6.1 0.37 0.48 8.2 8.0 9.7 1.66 1.70 1.67
CONTINUES ON THE NEXT PAGE >
Appendix C. Supplemental Tables

144 Return to contents >
TABLE 4. ALL OTHER BRANDS (CONTINUED)
TV ad exposure: All youth TV ad exposure: Black youth
Company Brand CategoryChild/teen targeted
Total TV ad spending ($000)
Ads viewed (All 2-5 yrs)
Ads viewed (All 6-11 yrs)
Ads viewed (All 12-17
yrs)
Child:adult ratio
Teen:adult ratio
Ads viewed (2-5 yrs)
Ads viewed (6-11 yrs)
Ads viewed (12-17 yrs)
Black:White ratio (2-5
yrs)
Black:White ratio (6-11
yrs)
Black:White ratio (12-17
yrs)
DannonDannon Oikos Yogurt
Yogurt $11,101 3.5 3.4 3.6 0.38 0.41 6.0 5.6 5.7 1.74 1.74 1.61
Kraft Heinz Velveeta Other dairy $10,536 5.2 4.4 4.4 0.38 0.39 8.2 6.9 6.8 1.64 1.61 1.58
General Mills Pillsbury DoughCondiments and food preparation
$10,522 3.3 3.1 3.2 0.47 0.48 5.5 5.1 5.5 1.70 1.65 1.82
NestleNestle Butterfinger Candy Bar
Candy $10,094 5.6 5.7 6.6 0.43 0.50 9.5 9.5 12.1 1.82 1.78 1.99
Tyson FoodsHillshire Farm Sausage
Other $9,841 6.0 5.7 5.3 0.44 0.41 10.7 9.9 10.0 1.88 1.83 2.05
Berkshire Hathaway DQ Grill & Chill Fast food $9,666 2.8 3.0 3.4 0.41 0.47 4.3 4.5 5.4 1.48 1.47 1.59
Kraft HeinzOscar Mayer Hot Dogs
Other $9,633 2.7 2.7 3.0 0.42 0.45 4.0 3.9 4.2 1.48 1.39 1.42
Mondelez International
Good Thins Crackers
Savory snacks $9,427 3.2 2.6 3.1 0.32 0.37 5.4 4.8 5.7 1.71 1.97 2.03
Kraft Heinz Planters Nuts Nuts $9,319 2.8 2.6 2.9 0.35 0.39 4.1 3.7 3.9 1.44 1.35 1.30
General MillsFiber One Snack Bar
Sweet snacks and desserts
$9,296 3.7 3.5 3.7 0.42 0.44 5.8 5.5 6.0 1.58 1.58 1.70
General MillsPillsbury Crescents Dough
Condiments and food preparation
$9,248 3.8 3.6 3.8 0.44 0.47 6.4 6.2 6.8 1.73 1.80 1.88
CampbellCampbell’s Slow Kettle Soup
Prepared meals $9,233 2.3 2.1 2.4 0.40 0.44 3.1 2.9 2.7 1.33 1.38 1.14
General Mills LarabarSweet snacks and desserts
$8,649 1.6 1.3 1.5 0.34 0.39 1.9 1.8 1.8 1.14 1.32 1.20
General MillsOld El Paso Taco Boats Taco Shells
Condiments and food preparation
$8,590 3.7 3.3 3.6 0.39 0.43 6.4 5.7 6.8 1.85 1.83 2.00
CONTINUES ON THE NEXT PAGE >
Appendix C. Supplemental Tables
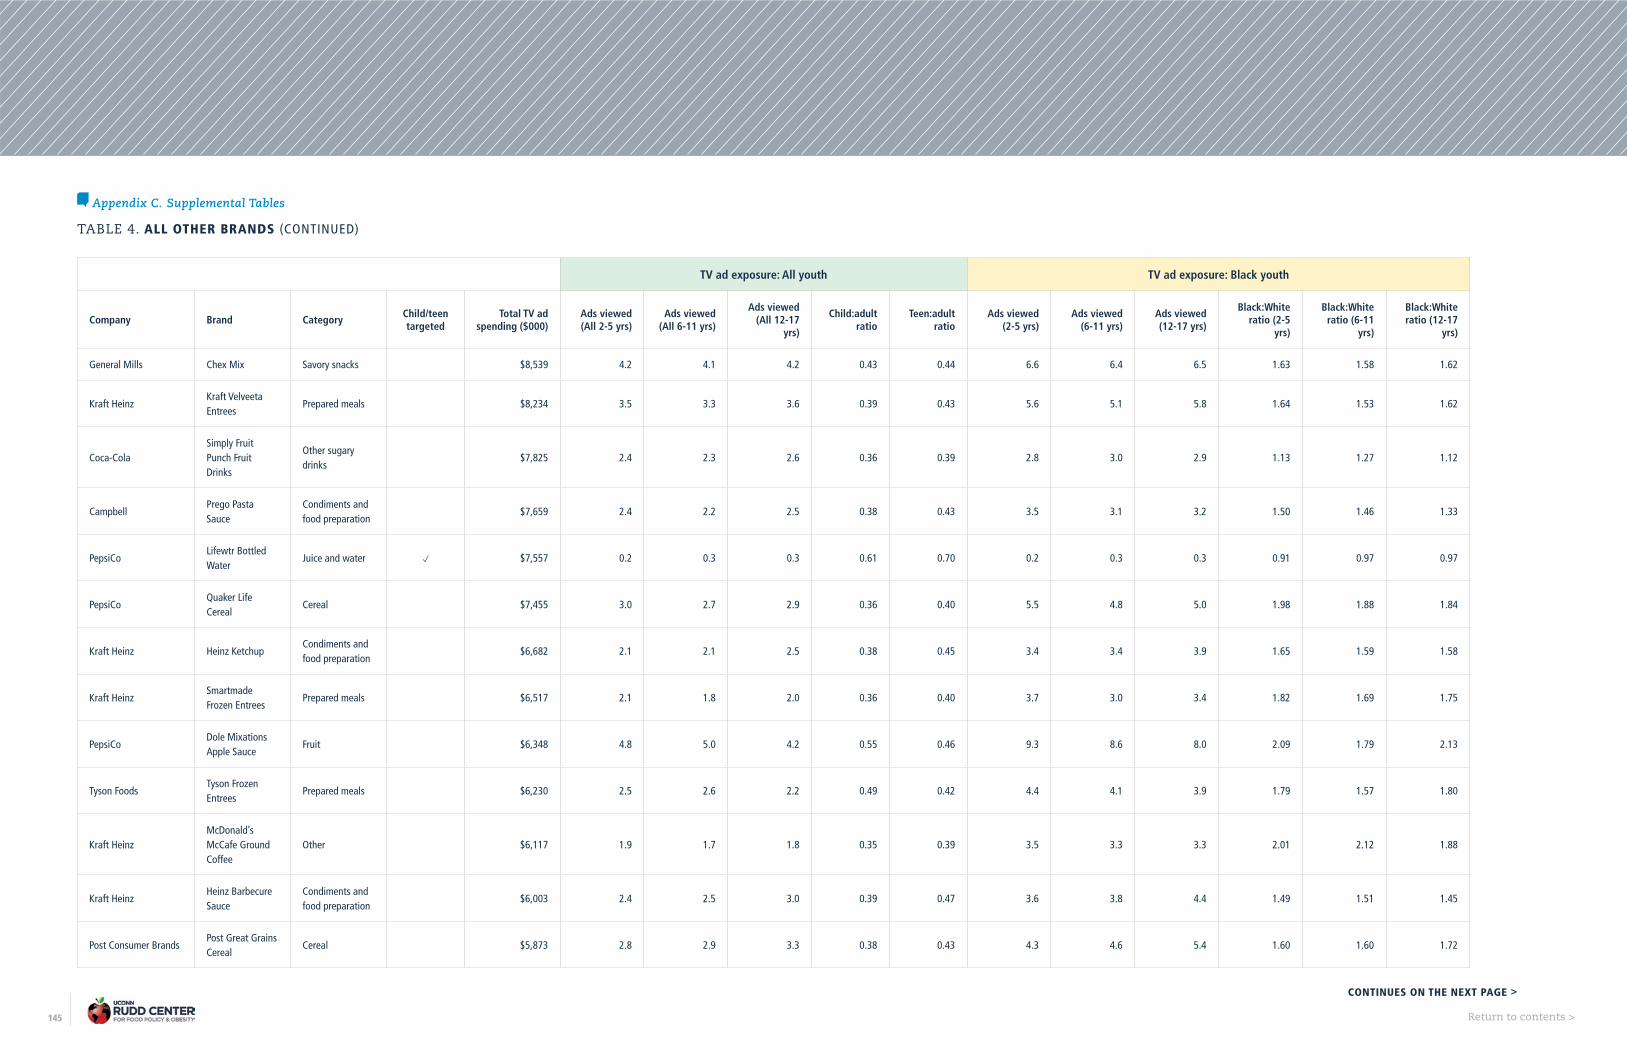
145 Return to contents >
TABLE 4. ALL OTHER BRANDS (CONTINUED)
TV ad exposure: All youth TV ad exposure: Black youth
Company Brand CategoryChild/teen targeted
Total TV ad spending ($000)
Ads viewed (All 2-5 yrs)
Ads viewed (All 6-11 yrs)
Ads viewed (All 12-17
yrs)
Child:adult ratio
Teen:adult ratio
Ads viewed (2-5 yrs)
Ads viewed (6-11 yrs)
Ads viewed (12-17 yrs)
Black:White ratio (2-5
yrs)
Black:White ratio (6-11
yrs)
Black:White ratio (12-17
yrs)
General Mills Chex Mix Savory snacks $8,539 4.2 4.1 4.2 0.43 0.44 6.6 6.4 6.5 1.63 1.58 1.62
Kraft HeinzKraft Velveeta Entrees
Prepared meals $8,234 3.5 3.3 3.6 0.39 0.43 5.6 5.1 5.8 1.64 1.53 1.62
Coca-ColaSimply Fruit Punch Fruit Drinks
Other sugary drinks
$7,825 2.4 2.3 2.6 0.36 0.39 2.8 3.0 2.9 1.13 1.27 1.12
CampbellPrego Pasta Sauce
Condiments and food preparation
$7,659 2.4 2.2 2.5 0.38 0.43 3.5 3.1 3.2 1.50 1.46 1.33
PepsiCoLifewtr Bottled Water
Juice and water p $7,557 0.2 0.3 0.3 0.61 0.70 0.2 0.3 0.3 0.91 0.97 0.97
PepsiCoQuaker Life Cereal
Cereal $7,455 3.0 2.7 2.9 0.36 0.40 5.5 4.8 5.0 1.98 1.88 1.84
Kraft Heinz Heinz KetchupCondiments and food preparation
$6,682 2.1 2.1 2.5 0.38 0.45 3.4 3.4 3.9 1.65 1.59 1.58
Kraft HeinzSmartmade Frozen Entrees
Prepared meals $6,517 2.1 1.8 2.0 0.36 0.40 3.7 3.0 3.4 1.82 1.69 1.75
PepsiCoDole Mixations Apple Sauce
Fruit $6,348 4.8 5.0 4.2 0.55 0.46 9.3 8.6 8.0 2.09 1.79 2.13
Tyson FoodsTyson Frozen Entrees
Prepared meals $6,230 2.5 2.6 2.2 0.49 0.42 4.4 4.1 3.9 1.79 1.57 1.80
Kraft HeinzMcDonald’s McCafe Ground Coffee
Other $6,117 1.9 1.7 1.8 0.35 0.39 3.5 3.3 3.3 2.01 2.12 1.88
Kraft HeinzHeinz Barbecure Sauce
Condiments and food preparation
$6,003 2.4 2.5 3.0 0.39 0.47 3.6 3.8 4.4 1.49 1.51 1.45
Post Consumer BrandsPost Great Grains Cereal
Cereal $5,873 2.8 2.9 3.3 0.38 0.43 4.3 4.6 5.4 1.60 1.60 1.72
CONTINUES ON THE NEXT PAGE >
Appendix C. Supplemental Tables
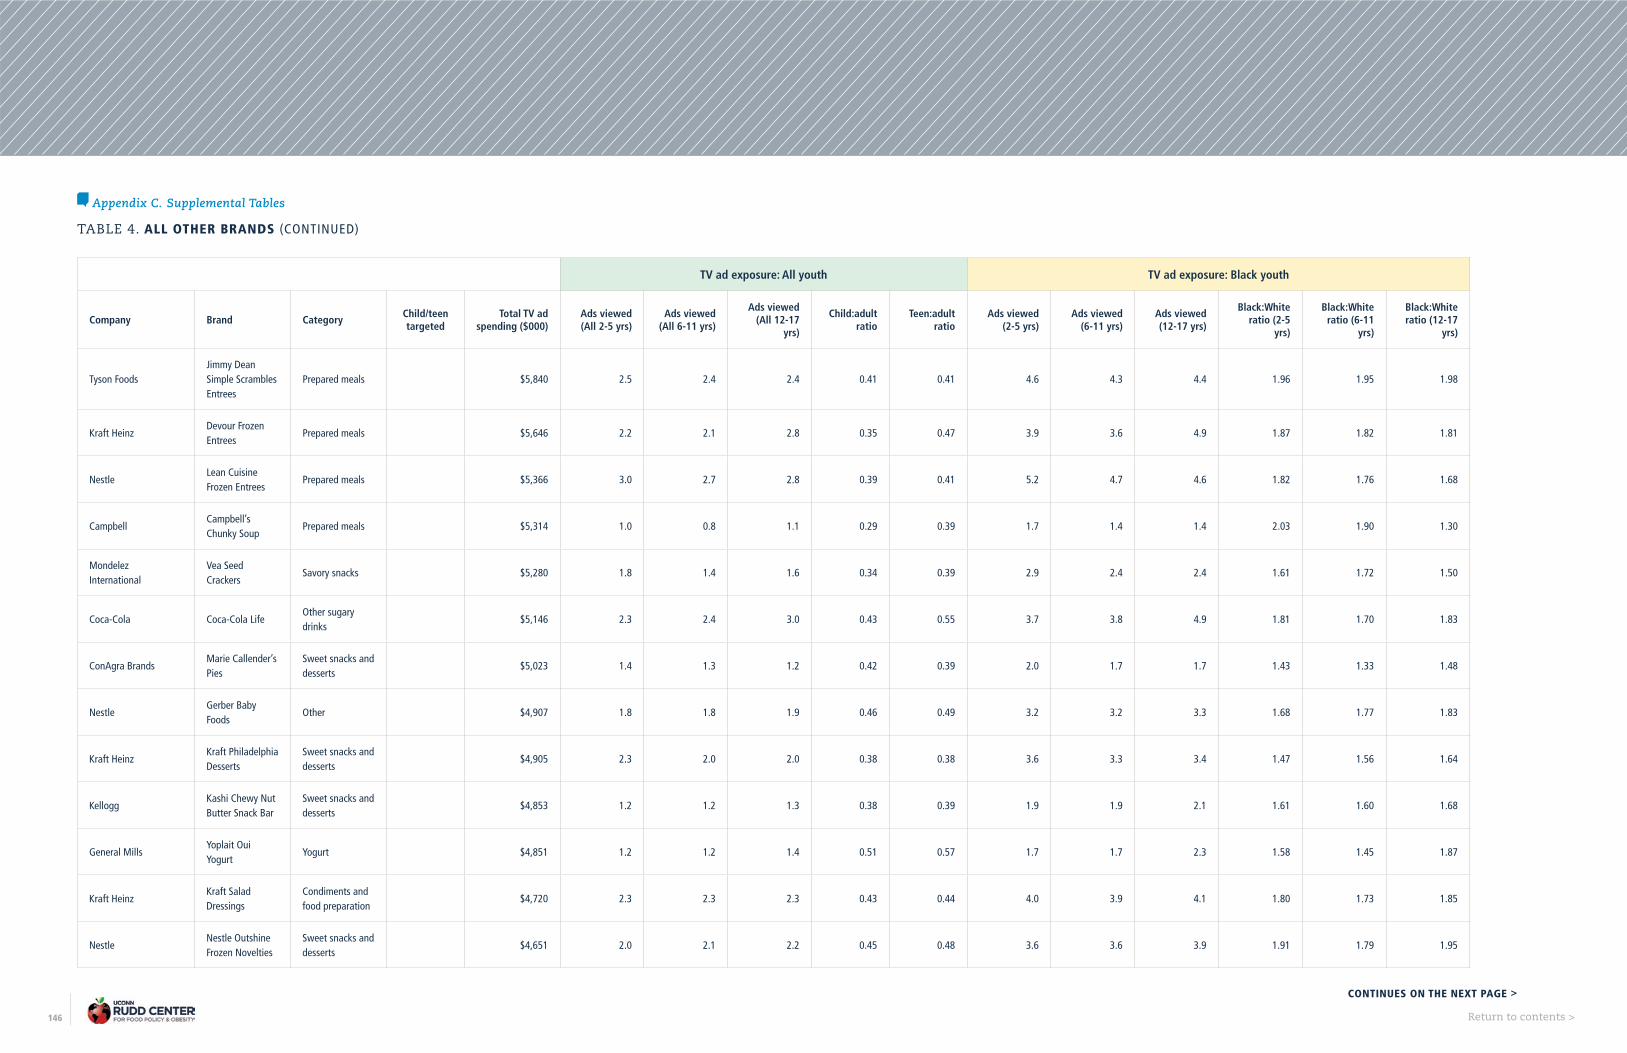
146 Return to contents >
TABLE 4. ALL OTHER BRANDS (CONTINUED)
TV ad exposure: All youth TV ad exposure: Black youth
Company Brand CategoryChild/teen targeted
Total TV ad spending ($000)
Ads viewed (All 2-5 yrs)
Ads viewed (All 6-11 yrs)
Ads viewed (All 12-17
yrs)
Child:adult ratio
Teen:adult ratio
Ads viewed (2-5 yrs)
Ads viewed (6-11 yrs)
Ads viewed (12-17 yrs)
Black:White ratio (2-5
yrs)
Black:White ratio (6-11
yrs)
Black:White ratio (12-17
yrs)
Tyson FoodsJimmy Dean Simple Scrambles Entrees
Prepared meals $5,840 2.5 2.4 2.4 0.41 0.41 4.6 4.3 4.4 1.96 1.95 1.98
Kraft HeinzDevour Frozen Entrees
Prepared meals $5,646 2.2 2.1 2.8 0.35 0.47 3.9 3.6 4.9 1.87 1.82 1.81
NestleLean Cuisine Frozen Entrees
Prepared meals $5,366 3.0 2.7 2.8 0.39 0.41 5.2 4.7 4.6 1.82 1.76 1.68
CampbellCampbell’s Chunky Soup
Prepared meals $5,314 1.0 0.8 1.1 0.29 0.39 1.7 1.4 1.4 2.03 1.90 1.30
Mondelez International
Vea Seed Crackers
Savory snacks $5,280 1.8 1.4 1.6 0.34 0.39 2.9 2.4 2.4 1.61 1.72 1.50
Coca-Cola Coca-Cola LifeOther sugary drinks
$5,146 2.3 2.4 3.0 0.43 0.55 3.7 3.8 4.9 1.81 1.70 1.83
ConAgra BrandsMarie Callender’s Pies
Sweet snacks and desserts
$5,023 1.4 1.3 1.2 0.42 0.39 2.0 1.7 1.7 1.43 1.33 1.48
NestleGerber Baby Foods
Other $4,907 1.8 1.8 1.9 0.46 0.49 3.2 3.2 3.3 1.68 1.77 1.83
Kraft HeinzKraft Philadelphia Desserts
Sweet snacks and desserts
$4,905 2.3 2.0 2.0 0.38 0.38 3.6 3.3 3.4 1.47 1.56 1.64
KelloggKashi Chewy Nut Butter Snack Bar
Sweet snacks and desserts
$4,853 1.2 1.2 1.3 0.38 0.39 1.9 1.9 2.1 1.61 1.60 1.68
General MillsYoplait Oui Yogurt
Yogurt $4,851 1.2 1.2 1.4 0.51 0.57 1.7 1.7 2.3 1.58 1.45 1.87
Kraft HeinzKraft Salad Dressings
Condiments and food preparation
$4,720 2.3 2.3 2.3 0.43 0.44 4.0 3.9 4.1 1.80 1.73 1.85
NestleNestle Outshine Frozen Novelties
Sweet snacks and desserts
$4,651 2.0 2.1 2.2 0.45 0.48 3.6 3.6 3.9 1.91 1.79 1.95
CONTINUES ON THE NEXT PAGE >
Appendix C. Supplemental Tables
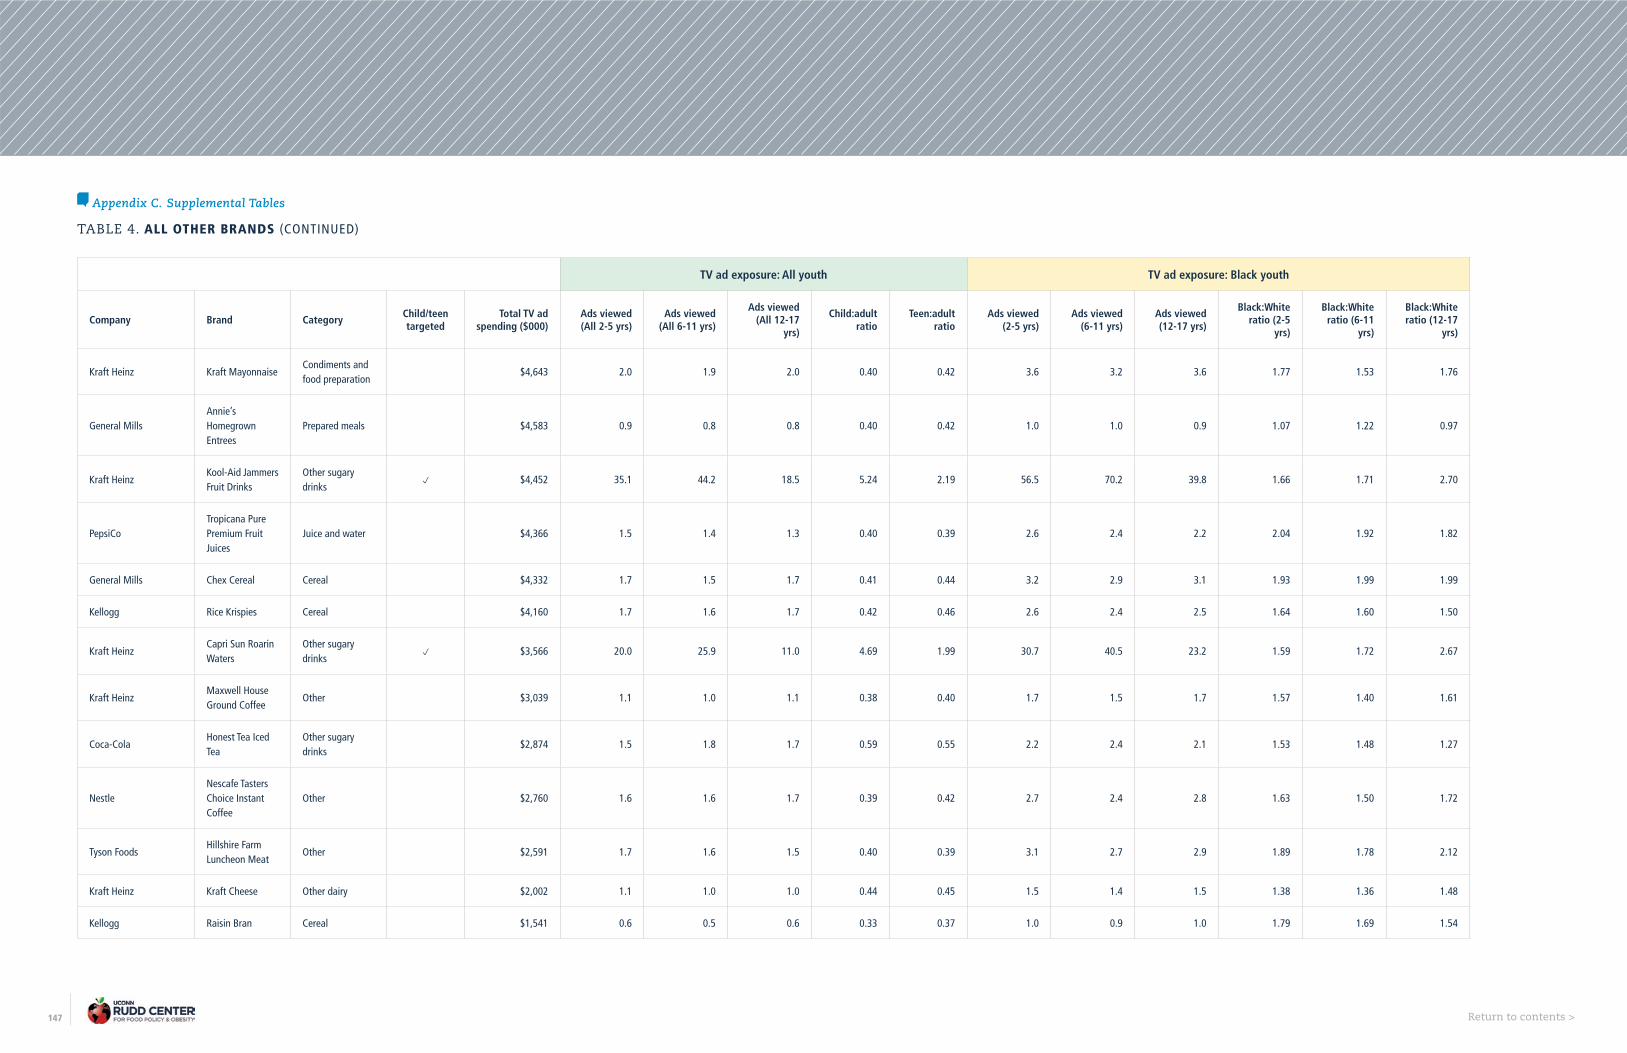
147 Return to contents >
TABLE 4. ALL OTHER BRANDS (CONTINUED)
TV ad exposure: All youth TV ad exposure: Black youth
Company Brand CategoryChild/teen targeted
Total TV ad spending ($000)
Ads viewed (All 2-5 yrs)
Ads viewed (All 6-11 yrs)
Ads viewed (All 12-17
yrs)
Child:adult ratio
Teen:adult ratio
Ads viewed (2-5 yrs)
Ads viewed (6-11 yrs)
Ads viewed (12-17 yrs)
Black:White ratio (2-5
yrs)
Black:White ratio (6-11
yrs)
Black:White ratio (12-17
yrs)
Kraft Heinz Kraft MayonnaiseCondiments and food preparation
$4,643 2.0 1.9 2.0 0.40 0.42 3.6 3.2 3.6 1.77 1.53 1.76
General MillsAnnie’s Homegrown Entrees
Prepared meals $4,583 0.9 0.8 0.8 0.40 0.42 1.0 1.0 0.9 1.07 1.22 0.97
Kraft HeinzKool-Aid Jammers Fruit Drinks
Other sugary drinks
p $4,452 35.1 44.2 18.5 5.24 2.19 56.5 70.2 39.8 1.66 1.71 2.70
PepsiCoTropicana Pure Premium Fruit Juices
Juice and water $4,366 1.5 1.4 1.3 0.40 0.39 2.6 2.4 2.2 2.04 1.92 1.82
General Mills Chex Cereal Cereal $4,332 1.7 1.5 1.7 0.41 0.44 3.2 2.9 3.1 1.93 1.99 1.99
Kellogg Rice Krispies Cereal $4,160 1.7 1.6 1.7 0.42 0.46 2.6 2.4 2.5 1.64 1.60 1.50
Kraft HeinzCapri Sun Roarin Waters
Other sugary drinks
p $3,566 20.0 25.9 11.0 4.69 1.99 30.7 40.5 23.2 1.59 1.72 2.67
Kraft HeinzMaxwell House Ground Coffee
Other $3,039 1.1 1.0 1.1 0.38 0.40 1.7 1.5 1.7 1.57 1.40 1.61
Coca-ColaHonest Tea Iced Tea
Other sugary drinks
$2,874 1.5 1.8 1.7 0.59 0.55 2.2 2.4 2.1 1.53 1.48 1.27
NestleNescafe Tasters Choice Instant Coffee
Other $2,760 1.6 1.6 1.7 0.39 0.42 2.7 2.4 2.8 1.63 1.50 1.72
Tyson FoodsHillshire Farm Luncheon Meat
Other $2,591 1.7 1.6 1.5 0.40 0.39 3.1 2.7 2.9 1.89 1.78 2.12
Kraft Heinz Kraft Cheese Other dairy $2,002 1.1 1.0 1.0 0.44 0.45 1.5 1.4 1.5 1.38 1.36 1.48
Kellogg Raisin Bran Cereal $1,541 0.6 0.5 0.6 0.33 0.37 1.0 0.9 1.0 1.79 1.69 1.54
Appendix C. Supplemental Tables


![Juvenal 6th satire [rudd]](https://img.pdfslide.us/doc/110x75/579074e21a28ab6874b1fcbb/juvenal-6th-satire-rudd-57962ae6c18f5.jpg)