Embed Size (px)
Citation preview

1979
Using the at?mic radii listed by Pauling4l (1.40 A for 0 and 1.33 A for K+)o, the van der Waals contact dis- tance would be 2.73 A. The only potassium distance which was found to be shorter than this involves 01, the amide group oxygen. If this is a charge interaction, it is further evidence of delocalization of the charge on the carbanion from its formal location on C4. In any event, the atomic distribution shows that potassium 4,4-dinitro-2-butenamide forms an ionic solid.
gen atoms of the amide group are involved: one in a bond to the amide oxygen atom of the anion IFcated at ( - x , - y , -2) with an N-0 distance of 2.93 A and the other in a bond to Os of the anion locate; at (- 1 - x, 1 - y , -2) with an N-0 distance of 2.97 A.
(Note: If bond angle C1-C2-C3 had a more usual value, i.e., 122”, while C3, C4, and the nitro groups main- tained their positions and the bond distances and angles of the amide group remaiped normal, this N-0 separa- tion would be only 2.81 A. Therefore, intermolecular crowding probably causes angle C1-C2-C3 to assume the unusually small value of 1 18.1 ”.)
Double hydrogen bonding between amide groups has been found in the following compounds: formamide, l6
decanamide, l* tetradecanamide, l9 oxamide, 2o suc- cinamide,?l glutaramide, suberamide, 2 4 benzamide, 2 5
picolinamide,?’ and a-pyrazinamide. 28 Th? N-0 dis- tance found for dinitrobutenamide, 2.93 A, is about equal to the aLerage value from these other amide structures, 2.94 A. The nitro group hydrogen bond in potassium dinitrobutenamide has the same N-0 separation as the average value found for the inter- molecular amine to nitro group bonds in the strongly bonded compounds, 1,3-diamino-2,4,6-trinitroben- zene3’ and 1,3,5-triamin0-2,4,6-t;initrobenzene. 38
The potassium cations lie 0.7 A above (+) and below (-) the anion planes (Figure 3). The eight shortest distances between anion atoms and the potassium posi- tion listed in Table IV are listed in Table VI. These atoms do not form an obvious coordination pattern.
Table VI. Shortest Distances to the K + Ion
Anion atom Anion position Distance, A
(x , Y , 2 ) ( - x , 1 - y , 1 - z) ( 1 - x, 1 - y , 1 - z) ( x , -1 + Y , z) (1 + x, -1 + y , 2) (1 - x, 1 - y , 1 - 2 )
( x , -1 + Y , 2) ( - x , 1 - y, 1 - z)
2.633 2.726 2.796 2.852 2.899 3.024 3.167 3.214
Acknowledgment. The authors are deeply indebted to Dr. Lloyd Kaplan of this laboratory for permission to use his unpublished results and for his detailed ex- planation of their significance. Also the authors wish to acknowledge the Foundational Research Fund of the U. S . Naval Ordnance Laboratory, Task FR-44, for financial support of this work.
University Press, Ithaca, N. Y., 1960. (41) L. Pauling, “Nature of the Chemical Bond,” 3rd ed, Cornell
The Electrochemical Reduction of Aromatic Azo Compounds
Joe L. Sadler and Allen J. Bard’
Contribution from the Department of Chemistry, The University of Texas, Austin, Texas 78712. Received September 11, 1967
Abstract: The electrochemical behavior of a series of aromatic azo compounds in dimethylformamide solutions was studied by polarography, cyclic voltammetry, controlled-potential coulometry, electron spin resonance spec- troscopy, and ultraviolet spectroscopy. The electrochemical reduction of these compounds is generally similar to that of the aromatic hydrocarbons in aprotic media. The reduction occurs in two one-electron steps. The product of the first electron transfer is a stable anion radical. The second electron transfer to the dianion is fol- lowed by a chemical reaction producing a protonated species which is oxidizable to the parent azo compound. The product of the second electron transfer also produces the corresponding arylhydrazine in a following reaction.
lthough the electrochemical reduction of azobenzene A and relatedcompounds has been studied extensively, relatively few studies of the reaction in aprotic media have been reported. Aylward, Garnett, and Sharp? re- cently reported the ac and dc polarographic reduction of azobenzene in dimethylformamide (DMF) solutions. They proposed that azobenzene is reduced in a rapid one-electron transfer reaction to the anion radical and in a second slow electron transfer to produce a stable dianion.
(1) To whom correspondence and requests for reprints should be directed.
(2) G. G. Aylward, J. L. Garnett, and J. H. Sharp, Anal. Chem., 39, 457 (1967).
The aim of this investigation was to study the elec- trochemical reduction of a series of aromatic azo com- pounds in DMF using a variety of electrochemical techniques, so that a general mechanism for the reduc- tion of these compounds could be formulated. A fur- ther aim is to obtain electrochemical data, e.g., reduc- tion potentials, which can be correlated with electron spin resonance (esr) spectroscopic results and molecular orbital calculations, as has been accomplished with aromatic hydrocarbons.
The compounds studied in this investigation are given below.
The voltammetric behavior of these compounds in
Sadler, Bard / Electrochemical Reduction of Aromatic Azo Compounds

1980 R-N=N-R
azobenzene R = C6Hs
05 1,l’-azonaphthalene R =
2,2’-azonaphthalene R =
4,4’-azobiphenyl
R = 6- 3,3 ’-azotoluene
4,4’-azopyridine R = N 3- DMF solutions at mercury and platinum electrodes, in the absence and presence of proton donors, will be de- scribed first. The coulometric reduction of these sub- stances, the analysis of products of the reduction, and the electrochemical oxidation of these products will then be given, A mechanism consistent with the experi- mental results will be proposed.
Results Voltammetric Methods. The polarographic reduc-
tion of each of the members of this series in a DMF solution containing 0.10 M tetra-n-butylammonium perchlorate (TBAP) as indifferent electrolyte shows two well-defined waves. The polarogram given in Figure 1, that of 4,4’-azopyridine, is typical of the polarographic
I 0‘ + . - O ’ T d
0 2 P O - 0 2 - 0 4 - 0 6 -08 - I O - 1 2 - 1 4 - 1 6 - l e -20 - 2 2 - 2 4
E ( V v s SCEl
Figure 1. Polarogram for the reduction of azopyridine. The solu- tion was 0.10 M TBAP in DMF containing 0.74 m M azopyridine.
behavior exhibited by every member of the series. The half-wave potentials (E l lp ) and other polarographic data are given in Table I. The slope of a plot of E tis. log i / ( id - i ) for the first wave exhibited by these com- pounds was in every case close to 59 mV, suggesting a reversible, one-electron reaction. A similar plot for the second reduction wave of each of these compounds shows slopes ranging from 67 mV for 4,4’-azopyridine to 110 mV for 3,3’-azotoluene. The diffusion currents of both waves for every compound varied as the square root of the head of the dropping mercury electrode. The diffusion current constants, Id, decrease as the mo-
a
I
\ I
L -0 8 - I o -I z -I 4 - I 6 -I e - 2 o -2 z
Figure 2. Cyclic voltammograms of azobenzene in DMF con- taining 0.1 M TBAP at (a) hmde and (b) ppde.
E ( V VI S C E )
lecular size of the compound increases. The Id values for azobenzene are very close to those reported by Ayl- ward, et a ln2
The cyclic voltammetric behavior of this series of compounds in DMF containing 0.10 M TBAP at both a hanging mercury drop electrode (hmde) and a planar platinum disk electrode (ppde) is, in general, very similar to that observed for aromatic hydrocarbons. Typical cyclic voltammetric behavior, that of azobenzene at a hmde and ppde, is shown in Figure 2. The first wave exhibits a corresponding anodic peak upon scan reversal about 100 mV past the first cathodic peak, while the second electron-transfer step gives no reversal peak. Typical cyclic voltammetric data at different scan rates, Y, and concentrations, at both a hmde and ppde, are given in Table 11.
The cyclic voltammetric behavior of 4,4’-azopyridine in a DMF-TBAP medium at a hmde is distinctly dif- ferent from that of other azo compounds examined (Fig- ure 3, curve a). The second reduction wave is clearly followed, upon scan reversal, by an anodic wave corre- sponding to oxidation of the reduction product of the second step. This anodic wave is absent when a ppde is used as the working electrode material (Figure 2, curve b). Data which illustrate this contrasting be- havior are given in Table 111.
The first reduction wave of every compound examined exhibits similar cyclic voltammetric behavior. The separation of anodic (Ep,) and cathodic (Epc) peak
(3) M. E. Peover in “Electroanalytical Chemistry. A Series of Monographs on Recent Advances,” Vol. 11, A. J. Bard, Ed., Marcel Dekker, Inc., New York, N. Y., 1967, Chapter 1, and references therein
Journal of the American Chemical Society / 90:8 / April I O , 1968

1981
Table I. Polarographic Data for the Reduction of Aromatic Azo Compounds”
7 First wave---- Second wave-------- Log plotd Log plotd
Compound -El/: I d slope - B / , b I d slope
Azobenzene 1.36 2.76 61 2.03 4.78 82 3,3’-Azotoluene 1.38 2.44 63 2.01 4.46 110 1,l ’-Azonaphthalene 1.13 2. I O 58 1.69 3.86 103 2,2’-Azonaphthalene 1.22 2.03 60 1.75 3.47 98 4,4’-Azobiphenyl 1.22 2.06 63 1.77 3.88 109 4,4’-Azopyridine 0.80 2.49 60 1.53 3.95 67
Q The solution was 0.10 M TBAP in DMF. * Potentials are in volts us. an aqueous saturated calomel electrode (sce) and are uncorrected I d = id/m2/3t‘ /6cC, where id is the diffusion current measured at the maximum
Slope of plot of E GS. log i / ( i d - i), in milli- for the small uncompensated iR drop which may be present. of the instantaneous current. I d for the second wave is based on total diffusion current. volts.
potentials is very nearly 57 mV, the value corresponding to a reversible one-electron t r a n ~ f e r . ~ The peak po- tentials are independent of scan rate (v), and the half- peak (Ep /2 ) to peak potential separation is also very close to the correct value (57 mV) for a reversible one- electron transfer. The ratio of anodic ( ip8) to cathodic (ipc) peak currents is near unity and the current function ( ipc / v ’ /2 ) is invarient with changing scan rate, all of which are indicative of a charge-transfer process produc- ing a species which is stable for the duration of the ex- periment.
Every azo compound examined, with the exception of 4,4/-azopyridine, shows no corresponding anodic peak upon scan reversal following the second reduction step. For the second wave the current function decreases with increasing scan rate and the peak potentials shift cathod- ically about 30 mV for a tenfold increase in scan rate, both of which correspond to the behavior exhibited by a reversible charge transfer followed by a very fast, irre- versible chemical reaction (case VI in the work of Nicholson and Shain4b).
These voltammetric results suggest the following mechanism
(1)
(2)
(3)
R-N= N-R + e = R-N= N-Rs-
R-N = N-R .- + e 1_ R-N = N-RZ-
R-N = N-R2- + HS --f R-N = N-RH- + S- where HS denotes any proton source. Reaction 3 is suggested by analogy to the behavior exhibited by the aromatic hydrocarbons.
The dianion of 4,4’-azopyridine is apparently more stable than those of the other azo compounds. The difference in behavior of this dianion at mercury and platinum electrodes suggests that a reaction causing de- composition of the dianion may be catalyzed by plat- inum; a similar effect has been found during the electro- reduction of 4,4’-azopyridine 1,1 ‘-dioxide.j
Controlled-Potential Coulometry. Coulometric ex- periments at a stirred mercury pool working electrode controlled at a potential corresponding to the plateau of either the first or second polarographic wave were undertaken to determine unambiguously the number of electrons transferred in each reduction step, to pre- pare solutions of the mono- and dinegative anions for further study, and to investigate slower chemical reac- tions in the system. The results for the reduction of
(4) (a) H. Matsuda, 2. Elektrochem., 61, 489 (1957); (b) R. S. Nich- olson and I . Shain, Anal. Chem., 36, 706 (1964).
(5) 3. L. Sadler and A. J. Bard, J . Elecrrochem. SOC., 115,343 (1968).
these compounds at potentials on the first and second polarographic plateaus are shown in Table IV, columns 3 and 4. In every case napp, the number of faradays consumed per mole of azo compound, is close to one for reduction at the first cathodic wave; an additional 1 faraday per mole is consumed for further reduction at the second cathodic wave.
0
!- z w K K
0 a
c
-0 j6 -0.8 -1.0 -1.2 -1.4 -1.6 E ( V v s S C E )
Figure 3. taining 0.1 M TBAP at (a) hmde and (b) ppde.
Cyclic voltammograms of azopyridine in DMF con-
Reversal coulometry was employed to study the sta- bility of the anion radical produced during the reduction at the first plateau. In this technique, following reduc- tion of the parent azo compound with a consumption of Qf coulombs, the potential is shifted so that the product is completely oxidized, with Qbo coulombs involved. The ratio Qr/Qbo can be used to determine the stability of the reduction product.6 The results of these experi- ments are given in Table IV, column 5. With the ex- ception of azopyridine, each of the radical anions is seen
(6) S. V. Tatwawadi and A. J. Bard, J . Phys. Chem., 68, 2676 (1964).
Sadler, Bard J Electrochemical Reduction of Aromatic Azo Compounds

1982 Table 11. Cyclic Voltammetric Data for Two-step Reduction of Aromatic Azo Compounds at HMDE and PPDEa
430 29 8 203 91 73
430 298 203 91 73
430 298 20 3 91 73
430 298 20 3 91 73
430 29 8 20 3 91 73
430 29 8 20 3 91 73
430 29 8 203 91 73
430 29 8 20 3 91 73
430 298 203 91 73
0.88 0.88 0.89 0.89 0.92
0.63 0 .64 0.63 0.63 0.65
0 .43 0 .45 0 .44 0.45 0.45
0.39 0.39 0.36 0 .35 0.35
0.62 0.62 0.63 0.60 0.64
0 .36 0.36 0.36 0.35 0.35
0.20 0.20 0.20 0.20 0.20
0.39 0.32 0.36 0.37 0 .36
0.51 0 .45 0.45 0.47 0.48
~ ~~
Azobenzene at a Hmde; Concentration = 0.96 mM 0.94 1.39 1.33 1.33 0.73 0.92 1.39 1.33 1.33 0.75 0.90 1.39 1.33 1.33 0.80 0.92 1.39 1.33 1.33 0 .83 0.86 1.39 1.33 1.33 0.83
Azobenzene at a Ppde; Concentration = 0.96 mM 0.17 1.39 1.33 1.32 0.43 0.75 1.39 1.33 1.32 0.39 0.72 1.39 1.33 1.32 0.41 0 .67 1.39 1 .33 1.32 0 .42 0.51 1.39 1.33 1.32 0.47
Azotoluene at a Hmde; Concentration = 0.68 m M 0.97 1.41 1.35 1.35 0 .36 0.94 1.41 1.35 1.35 0.39 0.95 1.41 1.35 1.35 0.41 0.96 1.41 1.35 1.35 0 .44 0.97 1.41 1.35 1.35 0 .42
Azotoluene at a Ppde; Concentration = 0.68 m M 1 .o 1.42 1.35 1.35 0.25 1 .o 1.42 1 I35 1.35 0 .24 1 .o 1.42 1.35 1.35 0.25 1 . 0 1.42 1.35 1.35 0.27 1 . 0 1.42 1.35 1.35 0.27
1,l’-Azonaphthalene at a Hmde; Concentration = 1.50 m M 0.98 1.17 1.11 1.11 0.51 0.98 1.17 1.11 1.11 0.49 0.92 1.17 1.11 1.11 0.52 1 .OO 1.17 1.11 1.11 0.50 0.96 1.17 1.11 1.11 0.48
1,l’-Azonaphthalene at a Ppde; Concentration = 1.50 mM 0.73 1.17 1.11 1.11 0 .24 0.68 1.17 1.11 1.11 0 .23 0.64 1.17 1.11 1.11 0.24 0.70 1.17 1 .11 1 .11 0 .23 0.60 1.17 1.11 1.11 0 .23
2,2’-Azonaphthalene at a Hmde; Concentration = 0.86 m M 1 . 0 1.26 1 .20 1.20 0 .17 1 .0 1.26 1.20 1.20 0.16 1 . 0 1 .26 1 .20 1.20 0 .17 1 . 0 1.26 1.20 1 ,20 0.19 1 . 0 1.26 1.20 1.20 0.18
4,4‘-Azobiphenyl at a Ppde; Concentration = 0.89 m M 0.96 1.26 1.19 1.19 0.18 0.95 1 .26 1.19 1.19 0.19 0 .96 1.26 1.19 1.19 0 .20 0.97 1.26 1.19 1.19 0 .21 0.97 1.26 1.19 1.19 0 .22
0 .94 1 .27 1.21 1.20 0 .34 0.98 1.27 1.21 1.20 0 .35 0.99 1.27 1.21 1.20 0 .34 1 . 0 1.27 1.21 1.20 0.36 1 . o 1.27 1.21 1.20 0.38
4,4’-Azobiphenpl at a Hmde; Concentration = 0.89 mM
2.11 2.10 2.09 2.07 2.07
2.11 2.10 2.09 2.08 2.08
2.10 2.09 2.09 2.08 2.08
2.10 2.09 2.08 2.07 2.06
1.87 1.87 1.86 1.85 1.85
1.81 1.80 1.79 1.78 1.77
1.73 1.72 1.72 1.71 1.71
1.82 1.81 1.80 1.79 1.78
1 ,89 1.89 1.88 1.88 1.88
2.02 2.01 2.01 2.00 1.99
2 .02 1.99 2.00 1.98 1 .98
2.00 1.99 1.98 1.98 1 .97
2.00 2.00 2.00 1.99 1.98
1.77 1 .77 1.77 1.76 1.76
1.72 1.72 1.70 1.70 1.68
1.62 1.62 1.63 1 .63 1 .63
1.72 1.73 1.72 1.71 1.70
1.80 1 .80 1 .80 1.80 1.81
4 The solution was 0 .10 M TBAP in DMF. Hmde = hanging mercury drop electrode. Ppde = planar platinum disk electrode. * For Measured using extrap- scan reversed 100 mV past Epe.
olation of decreasing current of first peak as base line. In volts us. sce; potentials given may include some uncompensated iR drop.
to undergo a slow chemical reaction following its forma- The exact nature of this side reaction was not investi- tion. If we assume that the radical anion reacts in a gatedfurther. pseudo-first-order reaction, the rate constant for this Voltammetry of Reduced Solutions. The electro- following reaction is found to be 10-5 to sec-1 in chemical behavior of solutions of the monoanions was every case. Azopyridine anion radical does not undergo studied by polarography and cyclic voltammetry. this decomposition reaction to a measurable extent, The polarographic behavior of azobenzene anion rad- even during long duration coulometric studies (1-2 hr). ical is typical of all the members of this series and is
Journal of the American Chemical Society / 90:8 / April 10, 1968
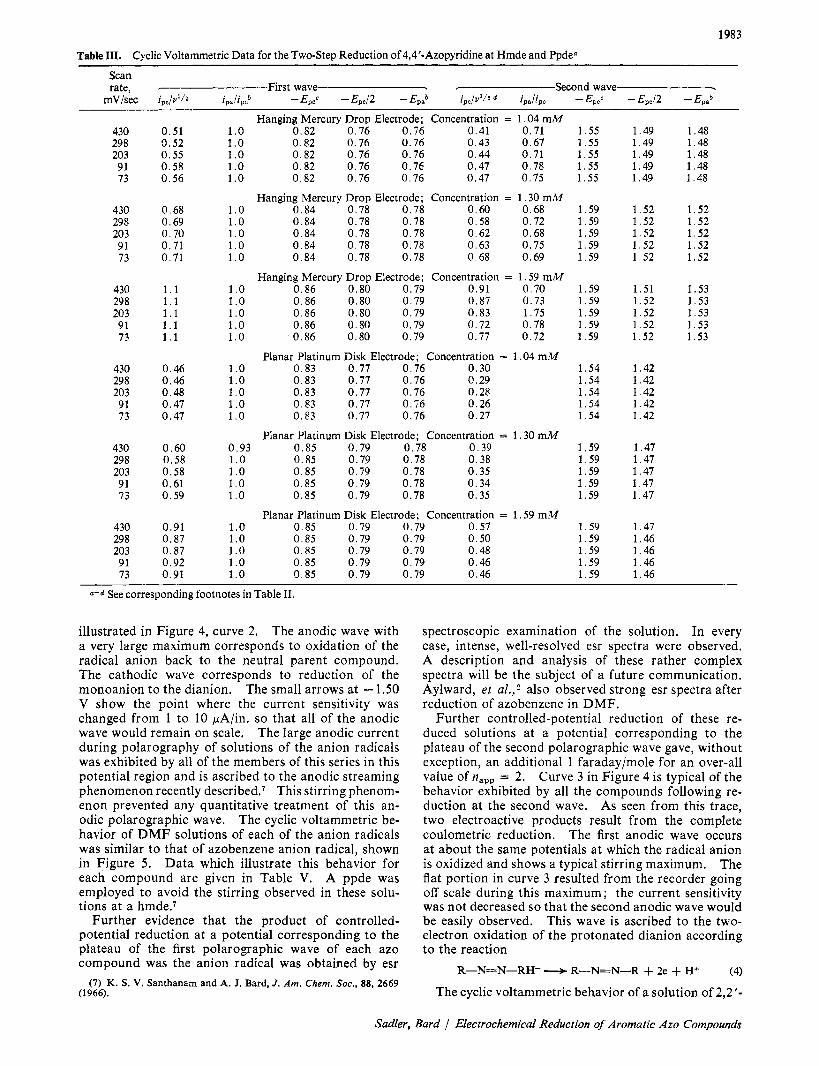
1983 Table 111. Cyclic Voltammetric Data for the Two-step Reduction of 4,4’-Azopyridine at Hmde and Ppde“
Scan rate, First wave - Second wave -
mV/sec ipc/vl /z i,,iipoh -Epee - Ep,/2 - EPBh ipc/u1/2 ip& -Ep,< -Epc/2 -Ep.’
430 29 8 203 91 73
430 298 203 91 73
430 29 8 203 91 73
430 298 203 91 73
430 298 203 91 73
430 29 8 203 91 73
0 .51 0.52 0.55 0 .58 0 .56
0.68 0.69 0.70 0.71 0 .71
1 . 1 1 .1 1 . 1 1 .1 1 .1
0.46 0.46 0.48 0.47 0 .47
0.60 0.58 0.58 0.61 0.59
0.91 0.87 0.87 0.92 0 .91
Hanging Mercury Drop Electrode; Concentration = 1 .04 m M 1 . 0 0.82 0 .76 0.76 0.41 0 .71 1.0 0 .82 0.76 0.76 0 .43 0.67 1 .o 0.82 0 .76 0.76 0 .44 0 .71 1 .0 0 .82 0.76 0.76 0.47 0 .78 1 .o 0.82 0.76 0 .76 0 .47 0.75
Hanging Mercury Drop Electrode; Concentration = 1.30 mM 1 .0 0.84 0 .78 0 .78 0.60 0.68 1 . 0 0.84 0.78 0.78 0.58 0.72 1 . 0 0 .84 0.78 0.78 0.62 0.68 1 . o 0 .84 0.78 0 .78 0 .63 0 .75 1 .0 0 .84 0.78 0.78 0 .68 0.69
Hanging Mercury Drop Electrode; Concentration = 1.59 m M 1 .o 0 .86 0 .80 0.79 0.91 0 .70 1 .o 0.86 0 .80 0.79 0.87 0.73 1 . 0 0.86 0.80 0.79 0 .83 1.75 1 .o 0.86 0.80 0.79 0.72 0.78 1 .0 0.86 0.80 0.79 0.77 0.72
Planar Platinum Disk Electrode; Concentration = 1.04 m M 1 .o 0 .83 0.77 0.76 0.30 1 .0 0 .83 0.77 0.76 0.29 1 . 0 0 .83 0.77 0 .76 0.28 1 .o 0 .83 0.77 0.76 0.26 1 . 0 0 .83 0.77 0.76 0.27
Planar Platinum Disk Electrode; Concentration = 1.30 mM 0 .93 0 .85 0 .79 0.78 0 .39 1 . 0 0.85 0.79 0.78 0.38 1 . 0 0.85 0.59 0.78 0 .35 1 . 0 0 .85 0 .79 0.78 0.34 1 . 0 0.85 0.79 0.78 0.35
1 .o 0 .85 0.79 0.79 0.57 1 .0 0.85 0.79 0.79 0 .50 1 .0 0.85 0.79 0.79 0 .48 1 .o 0.85 0.79 0.79 0 .46 1 .0 0.85 0.79 0.59 0.46
Planar Platinum Disk Electrode; Concentration = 1.59 m M
1.55 1.55 1.55 1.55 1.55
1.59 1.59 1.59 1.59 1.59
1.59 1.59 1.59 1.59 1.59
1.54 1 .54 1 .54 1.54 1 .54
1 .59 1.59 1.59 1.59 1.59
1.59 1.59 1.59 1.59 1.59
1.49 1.49 1.49 1.49 1.49
1.52 1.52 1.52 1.52 1.52
1.51 1.52 1.52 1.52 1.52
1.42 1 .42 1.42 1.42 1.42
1.47 1.47 1.47 1.47 1.47
1.47 1 .46 1.46 1 .46 1.46
1.48 1.48 1.48 1.48 1.48
1 .52 1.52 1.52 1.52 1.52
1.53 1.53 1.53 1.53 1.53
a-d See corresponding footnotes in Table 11.
illustrated in Figure 4, curve 2. The anodic wave with a very large maximum corresponds to oxidation of the radical anion back to the neutral parent compound. The cathodic wave corresponds to reduction of the monoanion to the dianion. The small arrows at - 1.50 V show the point where the current sensitivity was changed from 1 to 10 pA/in. so that all of the anodic wave would remain on scale. The large anodic current during polarography of solutions of the anion radicals was exhibited by all of the members of this series in this potential region and is ascribed to the anodic streaming phenomenon recently described.’ This stirring phenom- enon prevented any quantitative treatment of this an- odic polarographic wave. The cyclic voltammetric be- havior of DMF solutions of each of the anion radicals was similar to that of azobenzene anion radical, shown in Figure 5 . Data which illustrate this behavior for each compound are given in Table V. A ppde was employed to avoid the stirring observed in these solu- tions at a hmde.’
Further evidence that the product of controlled- potential reduction at a potential corresponding to the plateau of the first polarographic wave of each azo compound was the anion radical was obtained by esr
(7) K . S. V. Santhanam and A. 3. Bard, J . Am. Chem. SOC., 88, 2669 (1966).
spectroscopic examination of the solution. In every case, intense, well-resolved esr spectra were observed. A description and analysis of these rather complex spectra will be the subject of a future communication. Aylward, et u I . , ~ also observed strong esr spectra after reduction of azobenzene in DMF.
Further controlled-potential reduction of these re- duced solutions at a potential corresponding to the plateau of the second polarographic wave gave, without exception, an additional 1 faraday/mole for an over-all value of napp = 2. Curve 3 in Figure 4 is typical of the behavior exhibited by all the compounds following re- duction at the second wave. As seen from this trace, two electroactive products result from the complete coulometric reduction. The first anodic wave occurs at about the same potentials at which the radical anion is oxidized and shows a typical stirring maximum. The flat portion in curve 3 resulted from the recorder going off scale during this maximum ; the current sensitivity was not decreased so that the second anodic wave would be easily observed. This wave is ascribed to the two- electron oxidation of the protonated dianion according to the reaction
R-N=N-RH- -3 R-N=N-R + 2e + H+ (4)
The cyclic voltammetric behavior of a solution of 2,2’-
Sadier, Bard 1 Electrochemical Reduction of Aromatic Azo Compounds

1984
1 3 /
i 4 I I
4 -I
!
0 2 0 0 .02 -04 -06 - 0 8 -IO -12 - 1 4 -16 -18 - 2 0 - 2 2 - 2 4
E ( V v 6 SCEI
Figure 4. Polarograms of azobenzene during various stages of reduction and oxidation. The solution was DMF containing 0.1 M TBAP: (1) original azobenzene solution; (2) solution completely reduced at -1.50 V ; (3) solution completly reduced at -2.20 V; (4) solution completely oxidized a t - 1.0 V, following complete re- duction at - 2.20 v; ( 5 ) solution in (4) completely oxidized at 0.0 v; (6) solution in ( 5 ) with addition of an authentic sample of phenyl- hydrazine; (7) solution in (6) after oxidation at 0.0 V.
azonaphthalene, completely reduced at potentials of the second wave (Figure 6 , curve l), also shows two anodic peaks. Typical cyclic voltammetric data for azoben- zene and azopyridine solutions following complete reduction are given in Table VI. Note that the anodic peak current, ipa, for the first anodic wave is about twice as large as the cathodic peak current, ipo found on
!
Figure 5 . Cyclic voltammogram a t ppde of azobenzene solution completely reduced at - 1.50 V. The scan was initiated at - 1.80 V in an anodic direction.
o! -0.4 -0 6 -0 E -1.0 -1.2 -I.? -I 6 -1.8 1
E ( V wa SCE)
- 0 4 - 0 6 - 0 0 -1.0 E ( V vs - I SCE) 2 - 1 4 -16 -18
Figure 6. Cyclic voltammograms of 2,2'-azonaphthalene at a ppde in DMF containing 0.10 MTBAP after (a) controlled-potential reduction at a potential corresponding to the plateau of the second polarographic wave, and (b) controlled-potential oxidation of a solution (a) at potentials corresponding to the plateau of the first anodic polarographic wave.
reversal of the potential scan, This supports the mech- anism in which the protonated dianion is oxidized to the parent azo compound in a two-electron step, and on reversal the parent azo compound is reduced in its usual (first cathodic wave) one-electron step. The re- sults of controlled-potential oxidation of these com-
Journal of the American Chemical Society 90:8 I April 10, 1968

1985
Table IV. Controlled-Potential Coulometric Resultsa - nsppr faradaysimole - - napp, faradays/mole -- First redn Second redn Reversal cou- First anodic Second anodic
Compound Concn, m M step stepb lometry,c Q b o / Q f waved waved
0 -
W 0 t
K 0 m
2 O -
2 0-
0 -
Azobenzene 0.96
0-
1.11 1.25
I
I I I I I
Azotoluene
1.38 1.54
0.68 0.96 2.72
1,l ’-Azonaphthalene 0.76 0.73 1.56 2.56
2,2’-Azonaphthalene 0.50 0.86 0.95
4,4’-Azobiphenyl 0 .89
4,4‘-Azopyridine 1.04 1.30 1.59 2.18
1.13
1.16 1.10 1.04
1.08 1.10 1.01
0.92
1.10 1.05
0.96 0.98 1.04
1.13
0.94 0.97 0.98 1.08
. . .
. . .
2.16 2.02 2.05 2 .04 2.04
2.04 2.05 2.20
2.06 2.00 2.07 1.89
1.90 2.01 1.93
2.08
1.85 1.90 1.96 2.07
. . .
. . . 0.71 . . . . . .
. . .
. . . 0.81
. . .
. . . 0.74 . . .
. . .
. . . 0.70
. . .
. . . 1 . 0 . . . . . .
. . . 0 .71 . . . . . . . . .
. . . 0.94 . . .
0.46
0.60 . . .
. . .
0.66 . . . . . .
. . .
. . I
1.32 . . . . . .
0.70 . . . . . I
. . .
. . .
. . .
. . .
. . .
. . . 0.87
I . .
. . .
. . .
. . .
. . .
. . .
. . .
. . .
. . .
0 The solution was D M F containing 0.10 M TBAP. The cathode was a mercury pool with an approximate area of 12 cmz and the anode was a platinum wire spiral, isolated by a medium-porosity, sintered-glass disk. Electrolysis times were 0.5 to 1.0 hr. * Total faradays per mole for reduction of parent azo compound. c The number of coulombs passed during the forward (reduction) portion of reversal coulom- etry is Qf. The number of coulombs required for oxidation of all the reduction product remaining back to the starting compound is QbO.
Reduction at plateau of first polarographic wave. d Oxidation at potentials corresponding to the plateau of the first anodic polarographic wave observed when the polarographic scan was initiated at -2.60 V us. sce in a positive direction, following reduction a t second cathodic wave. Oxidation at potentials corresponding to the plateau of the second anodic polarographic wave observed when the polarographic scan was initiated at -2.60 V cs. sce in a positive direction, following reduction at second cathodic wave.
pletely reduced solutions at a potential corresponding to the plateau region of the first anodic wave are given in Table IV, column 6 . Note that for azobenzene, for example, only 0.7 of the 2.0 faradays/mole is recovered in this oxidation. The polarographic behavior of the solutions resulting from this oxidation is typified by curve 4, Figure 4. This trace shows that azobenzene is regenerated in this oxidation step, in amounts smaller than that originally present. Cyclic voltammetric curves of these solutions, typified by that for 2,2’- azonaphthalene shown in Figure 6 , curve 2, also clearly show regeneration of the parent compound.
The second anodic wave observed both in completely reduced solutions (Figure 4, curve 3 and Figure 6 , curve 1) and in the solutions resulting from the oxidation of these (Figure 4, curve 4 and Figure 6 , curve 2) is clearly due to a second electroactive species. This species ap- parently is produced by decomposition of the product of the complete reduction (the dianion or postulated pro- tonated dianion), since it is not found following reduction at the first polarographic plateau and does not disappear upon oxidation at the first anodic wave. The identity of this second product resulting from the complete reduc- tion of each of these compounds was shown to be the cor- responding arylhydrazine. The following procedure was used to confirm the presence of phenylhydrazine fol- lowing the two-electron reduction of azobenzene. This same approach was also used for the other compounds. The ultraviolet absorption spectrum of the azobenzene solution resulting from coulometric oxidation at the plateau of the first anodic wave following complete re- duction is shown in Figure 7, curve 3. The absorption
curve is identical with that of azobenzene (curve 2) down to about 310 mp, at which point another species, with an absorption maximum at 300 mp, is shown to be
J
Figure 7. Ultraviolet sDectra of azobenzene solutions during vaiious stages of reduction and oxidation. All solutions are in DMF: (1) phenylhydrazine; (2) original azobenzene solution; (3) solution of azobenzene which had been completely reduced at - 2.20 V followed by oxidation at -1.0 V ; (4) solution of azobenzene which had been completely reduced at -2.20 V followed by com- plete oxidation at 0.0 V ; (5) solution in (4) following addition of an authentic sample of phenylhydrazine.
Sadler, Bard 1 Electrochemical Reduction of Aromatic Azo Compounds

1986 Table V. Cyclic Voltammetric Data for Solutions of Aromatic Azo Compounds Following Coulometric Reduction at Plateau of First Polarographic Wavea
Scan rate, First (anodic) wave - -Second (cathodic) wave--
mV/sec ipo/v'/2 ipa/ipcb - Emc -Epc/2 - Eps ipc/vl/a d - Epee - EpJ2
430 298 20 3 91 73
430 298 20 3 91 73
430 298 203 91 73
430 298 20 3 91 73
430 29 8 203 91 73
430 29 8 203 91 73
0.58 0.57 0.55 0.52 0.53
0.39 0.35 0.34 0.31 0 .31
0.11 0 .11 0.10 0.10 0.10
0.15 0.15 0.16 0.14 0.15
0.29 0.29 0 .28 0.29 0.28
0.59 0.58 0.58 0.61 0.60
Azobenzene at a Ppde; Concentration = 0.96 m M 1 . 2 1.38 1.31 1.30 0.50 1 . 2 1.38 1.31 1.30 0.48 1 . 2 1.38 1.31 1.31 0.49 1 .2 1.38 1.31 1.31 0.50 1 . 2 1.38 1.31 1.31 0.47
Azotoluene at a Ppde; Concentration = 0.96 m M 1 . 0 1.42 1.35 1.34 0.31 1 . 1 1.41 1.35 1.35 0.29 1 . 1 1.41 1.35 1.35 0.29 1.1 1.41 1.35 1.35 0.27 1 . 1 1.41 1.35 1.35 0.27
1 .o 1.16 1.10 1.10 0.10 1 . o 1.16 1.10 1.10 0.10 1 .o 1.16 1.10 1.10 0 .10 0 . 9 1.16 1.10 1.10 0.10 1 .o 1.16 1.10 1.10 0.10
1 .o 1.28 1.21 1.21 0 . 1 3 1 . 0 1.28 1.21 1.21 0.12 1 .o 1.28 1.22 1.21 0.12 1 .o 1.28 1.22 1.21 0.13 1.0 1.28 1.22 1.21 0 .13
4,4'-Azobiphenyl at a Ppde; Concentration = 0.89 m M 1 . 0 1.27 1.20 1.19 0.10 1 .0 1.27 1.20 1.19 0.10 1 . 0 1.26 1.19 1.19 0.11 1 .o 1.26 1 ,19 1.20 0.12 1 . 0 1.26 1.19 1.20 0.14
1,l'-Azonaphthalene at a Ppde; Concentration = 0.76 m M
2,2'-Azonaphthalene at a Ppde; Concentration = 0.86 m M
Azopyridine at a Ppde; Concentration = 1.30 mM 1 .o 0.85 0.79 0.78 0.38 1 .o 0.85 0.79 0.78 0.38 1 .0 0.85 0.79 0.79 0.35 1 . 0 0.85 0.79 0.79 0.35 1 .o 0.85 0.79 0.79 0.37
2.11 2.10 2.09 2.07 2.06
2.12 2.11 2.10 2.09 2.08
1.79 1.78 1.78 1.77 1.76
1 . ,3 1 .73 1.72 1.71 1.70
1.81 1.80 1.79 1.78 1.78
1.59 1.59 1.59 1.59 1.59
2.02 1.99 1.99 1.98 1.98
2.04 2.03 2.01 2.00 2.00
1.71 1.71 1.70 1.68 1.68
1.64 1.65 1.65 1.64 1.62
1.73 1.72 1.71 1.70 1.70
1.47 1.48 1.48 1 .49 1.49
4 The solution was 0.10 M TBAP in DMF. Each solution was completely reduced at a potential corresponding to the plateau of the first * -d See polarographic reduction wave. The cyclic voltammetric scan was initiated in an anodic direction from this reduction potential.
corresponding footnotes in Table 11.
Table VI. Cyclic Voltammetric Data of Solutions of Azobenzene and Azopyridine Following Coulometric Reduction at Plateau of Second Polarographic Wave"
Scan First wave - -Second wave- rate, ipo,b lpa, ipc,
mV/sec PA PA - E p c C - Epa -Ep&? PA -Epc/2
Azobenzene at a Ppde; Concentration = 0.96 m M 430 6 .0 11.0 1.41 1.34 1.29 1.36 4 . 0 2.15 2.04 29 8 4 .8 9 . 2 1.41 1.34 1.33 1.38 3 . 0 2.14 2.02 203 3 . 6 7 . 3 1.41 1.34 1.35 1.39 2 . 6 2.13 2.02 91 2 . 2 4 . 4 1.41 1.34 1.36 1.40 1 . 4 2.12 2.01 73 1.7 3 . 3 1.41 1.34 1.36 1.40 0.7 2.12 2.01
29 8 7 .0 13.8 0.83 0.77 0.76 0.83 4 . 2 1.52 1.44 203 5.4 10.6 0 .83 0.77 0.77 0.82 3.1 1.51 1.43 91 3.5 7 .0 0.83 0.77 0.77 0.81 1 . 3 1.49 1.40 73 3 . 0 6.0 0 .83 0.77 0.77 0.81 1 . 0 1.48 1.40
Azopyridine a t a Ppde; Concentration = 1.30 m M
4 The solution was 0.10 MTBAP in DMF. Each solution was completely reduced at a potential corresponding to the plateau of the second polarographic wave. The cyclic voltammetric scan was initiated in an anodic direction from this reduction potential. b-d See corresponding footnotes in Table 11.
present. The absorption maximum of phenylhydrazine also occurs at 300 mp (curve 1). At this point, the solution was subjected to controlled-potential oxidation at 0.0 V, the plateau region of the second anodic wave.
The polarographic behavior of this oxidized solution is shown in Figure 4, curve 5 . Coulometric results for this oxidation are given in Table IV, column 7. As seen from this curve, the second anodic wave has disappeared
Journal of the American Chemical Society / 90:8 1 April I O , 1968
and the product of this oxidation gives rise to a new re- duction wave with an Ell2 of - 1.08 v. The ultraviolet absorption spectrum of this oxidized solution is shown in Figure 7, curve 4. The absorption maximum at 300 mp has disappeared, showing that it can be ascribed to the species giving rise to the second anodic wave. The addition of an authentic sample of phenylhydrazine to the oxidized solution gave rise to the ultraviolet absorp- tion spectrum shown by Figure 7, curve 5. The polaro- gram corresponding to this mixture is shown in Figure 4, curve 6. The oxidation wave exhibited by the added phenylhydrazine occurs at the same potential as the second anodic wave. Coulometric oxidation at 0.0 V following the phenylhydrazine addition resulted in a solution which gave the polarogram illustrated in Figure 4, curve 7. The oxidation product of phenyl- hydrazine also gives a reduction wave with El,, equal to - 1.08 V. The combined spectroscopic and electro- chemical results provide persuasive evidence for the decomposition of the protonated dianion to the hydra- zine. The other compounds show similar behavior upon complete reduction and oxidation ; cu-naphthyl- hydrazine and /3-naphthylhydrazine were shown to be produced by experiments such as those described above for the azonaphthalenes.*
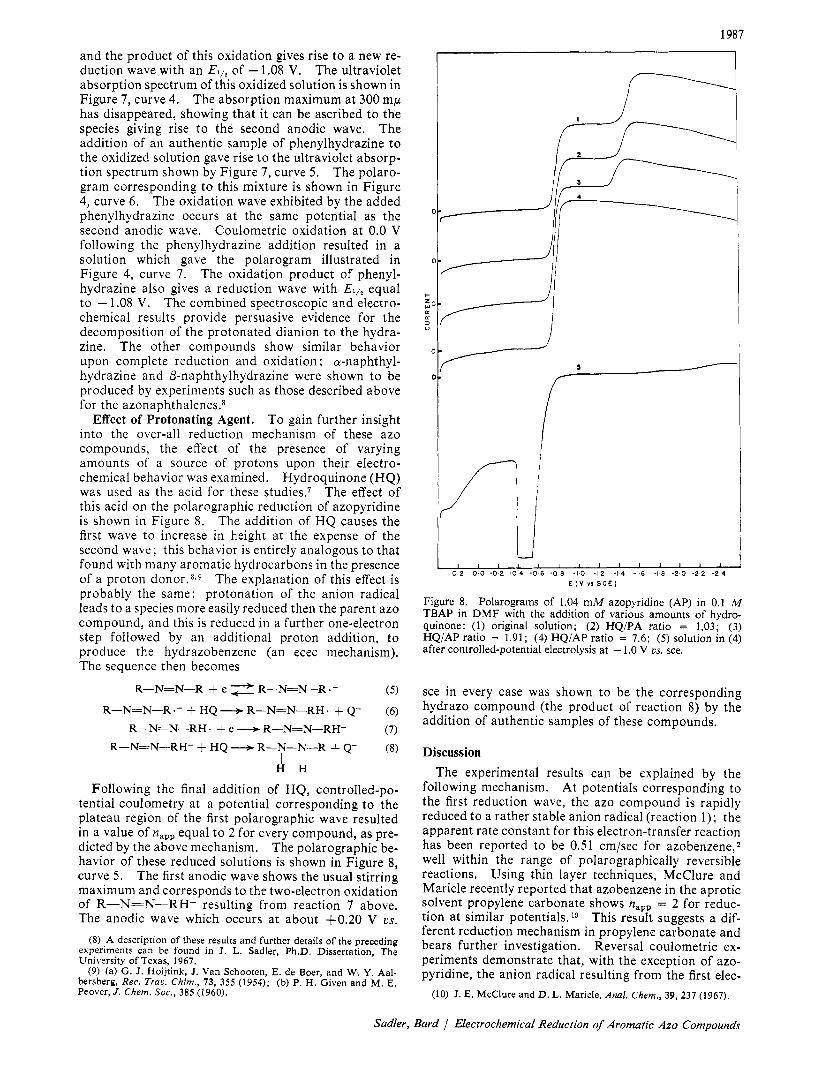
To gain further insight into the over-all reduction mechanism of these azo compounds, the effect of the presence of varying amounts of a source of protons upon their electro- chemical behavior was examined. Hydroquinone (HQ) was used as the acid for these studies.I The effect of this acid on the polarographic reduction of azopyridine is shown in Figure 8. The addition of HQ causes the first wave to increase in height at the expense of the second wave; this behavior is entirely analogous to that found with many aromatic hydrocarbons in the presence of a proton d o n ~ r . ~ , ~ The explanation of this effect is probably the same: protonation of the anion radical leads to a species more easily reduced then the parent azo compound, and this is reduced in a further one-electron step followed by an additional proton addition, to produce the hydrazobenzene (an ecec mechanism). The sequence then becomes
(5)
Effect of Protonating Agent.
R-N=N-R + e Jr R-N=N-R .- R-N=N-R.- + HQ R-N=N-RH. + Q- (6)
R-N=N-RH. + e + R-N=N-RH-
R-N=N-RH- + HQ --+ R-N-N-R + Q- (7)
(8) I 1
H H
Following the final addition of HQ, controlled-po- tential coulometry at a potential corresponding to the plateau region of the first polarographic wave resulted in a value of napp equal to 2 for every compound, as pre- dicted by the above mechanism. The polarographic be- havior of these reduced solutions is shown in Figure 8, curve 5. The first anodic wave shows the usual stirring maximum and corresponds to the two-electron oxidation of R-N=N-RH- resulting from reaction 7 above. The anodic wave which occurs at about +0.20 V us.
(8) A description of these results and further details of the preceding experiments can be found in J. L. Sadler, Ph.D. Dissertation, The University of Texas, 1967.
(9) (a) G. J. Hoijtink, J. Van Schooten, E. de Boer, and W. Y . Aal- bersberg, Rec. Trau. Chim., 73, 355 (1954); (b) P. H. Given and M. E. Peover, J . Chem. Soc., 385 (1960).
1987
I I I I I I 1 I I 1 1 1 1 '
0 2 0 0 -02 - 0 4 - 0 6 - 0 8 - I O -12 -14 -16 -18 -20 - 2 2 - 2 4 E ( V v% S C E 1
Figure 8. Polarograms of 1.04 mM azopyridine (AP) in 0.1 M TBAP in DMF with the addition of various amounts of hydro- quinone: (1) original solution; (2) HQ/PA ratio = 1.03; (3) HQ/AP ratio = 1.91; (4) HQ/AP ratio = 7.6; (5) solution in (4) after controlled-potential electrolysis at - 1.0 V vs. sce.
sce in every case was shown to be the corresponding hydrazo compound (the product of reaction 8) by the addition of authentic samples of these compounds.
Discussion The experimental results can be explained by the
following mechanism. At potentials corresponding to the first reduction wave, the azo compound is rapidly reduced to a rather stable anion radical (reaction 1); the apparent rate constant for this electron-transfer reaction has been reported to be 0.51 cmjsec for azobenzene,2 well within the range of polarographically reversible reactions. Using thin layer techniques, McClure and Maricle recently reported that azobenzene in the aprotic solvent propylene carbonate shows napp = 2 for reduc- tion at similar potentials.'O This result suggests a dif- ferent reduction mechanism in propylene carbonate and bears further investigation. Reversal coulometric ex- periments demonstrate that, with the exception of azo- pyridine, the anion radical resulting from the first elec-
(10) J. E. McClure and D. L. Maricle, Anal. Chem., 39, 237 (1967).
Sadler, Bard J Electrochemical Reduction of Aromatic Azo Compounds

1988
tron-transfer step undergoes a slow chemical reaction, the nature of which was not determined; the rate con- stant of this reaction was about to sec-'.
The second reduction wave is most reasonably ex- plained as a reversible one-electron transfer followed by a fast chemical reaction, probably a protonation step (reactions 2 and 3) . This contention is based primarily on the general similarity of behavior of all of the azo compounds to azopyridine, where the dianion is clearly formed in a reversible electron-transfer reaction and is much more stable than in the other cases. The pres- ence of a small ac polarographic wave at potentials of the second reduction wave for the reduction of azo- benzene2 is also suggestive of this mechanism.
The dianion or the protonated dianion decoinposes in a slower reaction to form the corresponding aryl- hydrazine. The oxidation wave of the arylhydrazine is not found in solutions of the parent compound on cyclic voltammetric sweeps continued past the second reduc- tion peak and then swept in a positive direction. This suggests that the arylhydrazine is formed by a slow de- composition of the protonated dianion. No wave for the oxidation of the arylhydrazine is observed in solu- tions resulting from the reduction of the parent azo com- pound in the presence of excess proton donor; the de- composition of the protonated dianion under these con- ditions probably favors the hydrazo compound. Even in the presence of a large excess of proton donor, how- ever, a wave ascribed to the monoprotonated dianion (shifted in a positive direction in the presence of excess proton donor), in addition to the oxidation wave of the hydrazo compound, occurs ( e . g . , Figure 8, curve 5) so that the total protonation reaction 8 is not complete. In the absence of excess proton donor no evidence for hydrazo-compound formation is found. A more com- plete description of the rates and mechanisms of the re- actions following the second reduction wave must await further investigations. We might note, however, the recent work of Cauquis and Fauvelot'' which showed that the oxidation of hydrazo-9-acridine in acetonitrile solutions followed a similar stepwise sequence with radical-ion intermediates.
Experimental Section The cell and vacuum line used were essentially the
same as reported previously.7 Purification and storage of the D M F also followed the procedure outlined there. The filling of the elec- trochemical cell was accomplished by first evacuating the cell con- taining the support electrolyte and mercury pool to at least mm, cooling with liquid nitrogen, and then distilling D M F under vacuum into the cell. After the distillation had been completed, the cell and contents were allowed to warm to room temperature with continuous evacuation. The cell was then brought to atmo- spheric pressure by introducing helium (The Matheson Co., La Porte, Texas) through the vacuum line. It was passed successively through anhydrous magnesium perchlorate, copper turnings (heated to 350"), activated charcoal cooled to liquid nitrogen temperature, and finally to the cell. A helium blanket over the solution was maintained throughout the experiment. The auxiliary electrode was a platinum wire. The reference electrode was an aqueous sce connected cia an agar plug and sintered-glass disk to the test solution.
The voltammetric experiments were carried out using a multi- purpose instrument employing operational amplifier circuitry with
Apparatus.
Stirring was by means of a magnetic stirrer.
(11) (a) G. Cauquis and G. Fauvelot, Bull. Soc. Chim. France, 2014 (1964); (b) "Polarography 1964. Proceedings of the Third Interna- tional Congress, Southampton," Vol. 11, G. J. Hills, Ed., Macmillan and Co., Ltd., London, 1966, pp 847-861.
three-electrode configuration, similar to those discussed in the literature. 1 2
The platinum working electrode (ppde) consisted of a piece of platinum wire sealed in the bottom of a 6-mm soft-glass tube, ground flat and polished. The apparent area of the platinum elec- trode was 1.54 mmz, The hmde consisted of a mercury drop sus- pended on a mercury-coated platinum wire; the apparent area was 8.8 mm2.
Controlled-potential coulometry was carried out using a pre- viously described apparatus.
Chemicals. Azobenzene was obtained from Eastman Organic Chemicals. It was recrystallized four times from hot 95 ethanol. The product from the final recrystallization was freed from solvent by evacuation at room temperature for 24 hr. The crystalline product gave a very sharp melting point of 68.1". Anal. Calcd: C , 79.1; H , 5.5; N, 15.4. Found: C, 79.1; H, 5.6; N, 15.2.
Hydrazobenzene was synthesized from azobenzene by adding to 0.5 g of azobenzene in 25 ml of 95 % ethanol 1 g of zinc powder and 10 ml of NH40H. The mixture was refluxed with stirring for 6 hr, at which time it was filtered to remove the remaining me- tallic zinc particles. The filtrate was cooled to precipitate the hy- drazobenzene. The precipitate was recrystallized twice from hot water and dried by vacuum desiccation for 24 hr. The white crystal- line product gave a sharp melting point at 131 '.
Phenylhydrazine was purchased from Eastman Organic Chemicals and used as received. Hydroquinone (HQ) was obtained from J. T. Baker Chemical Co. It was vacuum sublimed just prior to use. The 3,3'-azotoluene was purchased from Aldrich Chemical Co. and used without further purification.
1,l '-Azonaphthalene was purchased from Columbia Organic Chemicals Co., Inc., Columbia, S. C. This material was twice recrystallized from 9 5 z ethanol and once from benzene. The product of these recrystallizations was a deep red, platelet form, with a melting point of 191.5", as reported by Hodgson and Mars- den.14
Symmetrical 1,l '-hydrazonaphthalene was synthesized by the same procedure used for hydrazobenzene preparation. The mate- rial resulting from this synthesis was a colorless, needle-like crystal- line form with melting point of 154", in agreement with Cumming and Howie. l 5
1-Naphthylhydrazine hydrochloride was purchased from K & K Laboratories, Inc. (Plainview, N. Y.), The free base was obtained by dissolving 3 g of the hydrochloride in I 0 0 ml of water by gentle heating. Sodium carbonate was added slowly until evolution of C 0 2 had ceased; then an additional 2 g was added and the mixture was stirred for 30 min. The solid product was then separated by filtration, dissolved in a minimum of 95% ethanol, and reprecipi- tated by gradual addition of water. This recrystallization was repeated once; the product was then dried by vacuum desiccation at room temperature. A melting point of 122", in agreement with that reported in Lange's "Handbook of Chemistry," was obtained.
2,2'-Azonaphthalene was obtained from Columbia Organic Chemicals Co., Inc. It was twice recrystallized from 95 z ethanol. The recrystallized product gave a melting point of 205" (uncor- rected), in agreement with the previously reported value. l6
4,4'-Azopyridine was synthesized as follows : 1 g of 4,4'-azopyri- dine 1,l'-dioxide, purchased from Aldrich Chemical Co., was dis- solved in 50 ml of 95 z ethanol. To this solution was added 5 g of zinc dust and 10 ml of ammonium hydroxide (about 25 z ammonia). The mixture was refluxed with stirring for 4 hr, at which time the remaining zinc powder was removed by filtration while the solution was hot. About 100 ml of water was added and the solution was extracted five times with 50-ml portions of petroleurn ether. The combined extracts were concentrated to a total volume of 50 ml which was then cooled in a Dry Ice-2-propanol bath. The crystal- line product (0.3 g) was separated by filtration, dissolved in a mini- mum amount of hot petroleum ether, and recrystallized by chilling in the Dry Ice bath. This crop of needle-like crystals, pale orange in color, was freed from solvent and dried by vacuum desiccation. The melting point of this material was a sharp 107.6", in agreement with the reported value." And. Calcd: C, 65.1; H, 4.4; N, 30.5. Found: C, 65.0; H, 4.6; N, 30.8. The sample of
(12) (a) W. M. Schwarz and I . Shain, Anal. Chem., 35, 1770 (1963);
(13) A. J.Bard, ibid. ,35, 1121 (1963). (14) H. H. Hodgson and E. Marsden, J . Chem. Soc., 274 (1945). (15) W. M. Cumming and G. Howie, ihid., 133 (1933). (16) S. F. D. Orr, P. Sins, and D. Manson, ibid., 1337 (1956). (17) H. J . den Hertog and W. P. Combe, Rec. Trau. Chim., 70, 581
(b) W. L. Underkofler and I . Shain, ihid., 35, 1778 (1963).
(1951).
Journal of the American Chemical Society 90:8 1 April 10, 1968
1989
4,4’-azobiphenyl was obtained from Professor H. Shine (Texas discussions during the course of the work, and to Pro- Technological College). fessor H. Shine for a sample of 4,4’-azobiphenyl.
Acknowledgment. We are indebted to Mr. T. V. The support of the Robert A. Welch Foundation and the Atkinson and Dr. L. 0. Wheeler for aid in the esr National Science Foundation (GP 6688x3) is gratefully experiments, to Dr. K. S. V. Santhanam for helpful acknowledged.
Electrochemical Reduction of Benzophenone in Aprotic Medium. Effect of Proton Availability
Ralph F. Michielli and Philip J. Elving
Contribution from the University of Michigan, Ann Arbor, Michigan. Received September 27, 1967
Abstract: In aprotic medium (pyridine with tetraethylammonium perchlorate as background electrolyte), benzo- phenone is electrochemically reduced at a mercury electrode in two successive one-electron steps, first to the free radical anion and then to the benzhydrol dianion. Cyclic voltammetry indicates that the free radical is nearly reversibly reoxidized while the carbanion (or the pyridyl alcohol species resulting from its reaction with the solvent) and its monoprotonated form (formed by reaction with residual water in the solvent) are reoxidized with consider- able overpotential compared to the second reduction step; a third cathodic wave at much less negative potential than the original two benzophenone reduction waves is due to reduction of the product arising from oxidation of the carbanion or derived pyridyl species. On addition of protons, additional mechanistic paths become opera- tive; the second one-electron benzophenone reduction step merges with the first since the neutral free radical produced on the first electron transfer is more readily reduced than the anionic form (actually, it is reduced at the potential of initial reduction of benzophenone) and the anodic wave due to oxidation of the anionic free radical dis- appears. In addition, the anodic wave due to oxidation of the carbanion or pyridyl species decreases while that due to oxidation of the benzhydrol monoanion increases; this is accompanied by a decrease in the third cathodic wave with the growth of a fourth cathodic wave due to reduction of the free radical produced on oxidation of the benzhydrol monoanion.
he polarographic behavior of benzophenone has T been extensively studied as a model for that of ketones in general, The mechanism and kinetics of the electrochemical reduction of benzophenone in aqueous and alcoholic-aqueous solution have been investi- gated, and the conditions for the formation of free radical and carbanion intermediates have been dis- cussed.’V2 In acidic and neutral media, two well-de- fined reduction waves, each corresponding to a one- electron process, are observed: the first wave is pH- dependent to the extent of ca. 60 mV/pH unit; the second is only slightly pH dependent. Above pH 6, the two waves merge into one pH-dependent wave whose height approximates the sum of the two waves in acidic media. At still higher pH, a third wave appears at more negative potential.
The following mechanism for reduction of benzo- phenone in aqueous solution is generally accepted. (1) In acidic media, the first one-electron wave repre- sents the possibly reversible. reduction of benzophenone to the free radical, (CaH&COH, which can dimerize to pinacol; the second one-electron wave is due to reduc- tion of the free radical to carbinol, which is assumed to be electrochemically irreversible. The pH depen- dence of the first wave is ascribed to the simultaneous polarization of the carbon-oxygen bond by the bonding of hydrogen ion to the oxygen as the ketone diffuses into the electrode field and as the electron is transferred to the molecule from the electrode. ( 2 ) The two-electron
(1) P. J. Elving and J. T. Leone, J . Am. Chem. SOC., 80, 1021 (1958). (2) M. Suzuki and P. J. Elving, J . Phq’s. Chem., 65, 391 (1961).
combined wave involves reduction of benzophenone to carbinol through the free-radical state. (3) Because of the relative proton scarcity in alkaline media, the free radical ion, [(C,H&CO]-, is formed along with the neutral free radical; the third wave is attributed to the more difficult reduction of the free radical ion.
The most significant study of benzophenone reduc- tion in nonaqueous media has been in dimethylform- amide (DMF), where two waves are observed with the height of the second wave being 67 to 7 8 x that of the first ~ a v e . ~ , ~ On addition of a “weak” acid, phenol, Given and Peover3 found that wave I grew at the ex- pense of wave 11, which disappeared at an acid/ketone molar ratio of 2; addition of a stronger acid, benzoic acid, caused the appearance of a new wave at somewhat more positive potential, which grew at the expense of waves I and I1 (the latter disappeared at an acid/ketone ratio of 2 ) . Wawzonek and Gundersen4 observed that, on addition of water, wave I became slightly more posi- tive and increased slightly in height, whereas wave I1 became much more positive and decreased appreciably in height.
In view of the importance of hydrogen ion or avail- able proton in the electrochemical reduction of benzo- phenone, it was decided to investigate the behavior of benzophenone in an aprotic medium, namely pyridine, which is considered by Kolthoff5 to be the
(3) P. H. Given and M. E. Peover, J . Chem. Soc., 385 (1960). (4) S. Wawzonek and A. Gundersen, J . Electrochem. Soc., 107, 537
(5) I . M. Kolthoff, J . Polarog. Soc., 10, 22 (1964). (1960).
Michielli, Eloing 1 Electrochemical Reduction of Benzophenone


![&*i] 6CC>K:GH6GN - DannyBritt.com Greb from Europe, and Darryn Farrugia, Cameron McGlinchey and Gene Peterson from Australia. Gene, the winner of last year’s Open competition](https://img.pdfslide.us/doc/110x75/5aa649cd7f8b9a7c1a8e80e4/i-6cckgh6gn-greb-from-europe-and-darryn-farrugia-cameron-mcglinchey-and-gene.jpg)