Embed Size (px)
Citation preview

© 1997 Prentice-Hall, Inc.© 1997 Prentice-Hall, Inc.
S3 - S3 - 11
Principles of Principles of Operations ManagementOperations Management
Principles of Principles of Operations ManagementOperations Management
Quality Via Quality Via Statistical Process ControlStatistical Process Control
Chapter S3Chapter S3

© 1997 Prentice-Hall, Inc.© 1997 Prentice-Hall, Inc.
S3 - S3 - 22
Learning ObjectivesLearning ObjectivesLearning ObjectivesLearning Objectives
Explain statistical process controlExplain statistical process control Develop control charts for variablesDevelop control charts for variables
RR chart, chart,XX chart chart
Develop control charts for attributesDevelop control charts for attributes PP chart, chart, cc chart chart

© 1997 Prentice-Hall, Inc.© 1997 Prentice-Hall, Inc.
S3 - S3 - 33
Thinking ChallengeThinking ChallengeThinking ChallengeThinking Challenge
In the mid-1980’s, most firms In the mid-1980’s, most firms adjusted the process if output adjusted the process if output varied by varied by ± 3± 3 from average from average ((2,7002,700 defects per million defects per million products). In trouble, Motorola products). In trouble, Motorola decided to use decided to use ± 6± 6. This meant . This meant no more than no more than 22 defects per defects per billionbillion products. Should Motorola have products. Should Motorola have followed industry practice, used followed industry practice, used 66, or some other standard?, or some other standard?
© 1995 Corel Corp.
AloneAlone GroupGroup Class Class

© 1997 Prentice-Hall, Inc.© 1997 Prentice-Hall, Inc.
S3 - S3 - 44
Statistical Statistical Quality Control (SQC)Quality Control (SQC)
Statistical Statistical Quality Control (SQC)Quality Control (SQC)
Uses mathematics (i.e., statistics)Uses mathematics (i.e., statistics) Involves collecting, organizing, & Involves collecting, organizing, &
interpreting data interpreting data Objective: Regulate product qualityObjective: Regulate product quality Used toUsed to
Control the process as products are Control the process as products are producedproduced
Inspect samples of finished productsInspect samples of finished products

© 1997 Prentice-Hall, Inc.© 1997 Prentice-Hall, Inc.
S3 - S3 - 55
Types of Statistical Types of Statistical Quality ControlQuality Control
Types of Statistical Types of Statistical Quality ControlQuality Control
StatisticalQuality Control
ProcessControl
AcceptanceSampling
VariablesCharts
AttributesCharts
Variables Attributes
StatisticalQuality Control
ProcessControl
AcceptanceSampling
VariablesCharts
AttributesCharts
Variables Attributes

© 1997 Prentice-Hall, Inc.© 1997 Prentice-Hall, Inc.
S3 - S3 - 66
Characteristics for Characteristics for which you focus on which you focus on defectsdefects
Classify products as Classify products as either ‘good’ or ‘bad’, either ‘good’ or ‘bad’, or count # defectsor count # defects e.g., radio works or note.g., radio works or not
Categorical or discrete Categorical or discrete random variablesrandom variables
AttributesAttributes
Quality CharacteristicsQuality CharacteristicsQuality CharacteristicsQuality Characteristics
Characteristics that Characteristics that you measureyou measure e.g., weight, lengthe.g., weight, length
May be whole May be whole number or fractionalnumber or fractional
Continuous random Continuous random variablesvariables
VariablesVariables
© 1997 Prentice-Hall, Inc.© 1997 Prentice-Hall, Inc.
S3 - S3 - 77
Statistical Statistical Process Control (SPC)Process Control (SPC)
Statistical Statistical Process Control (SPC)Process Control (SPC)
Statistical technique used to ensure Statistical technique used to ensure process is making product to standardprocess is making product to standard
All process are subject to variabilityAll process are subject to variability Natural causesNatural causes: Random variations: Random variations Assignable causesAssignable causes: Correctable problems: Correctable problems
Machine wear, unskilled workers, poor mat’lMachine wear, unskilled workers, poor mat’l
Objective: Identify assignable causesObjective: Identify assignable causes Uses process control chartsUses process control charts

© 1997 Prentice-Hall, Inc.© 1997 Prentice-Hall, Inc.
S3 - S3 - 88
0
20
40
60
1 3 5 7 9 11
X
Time
0
20
40
60
1 3 5 7 9 11
X
Time
Process Control ChartsProcess Control ChartsProcess Control ChartsProcess Control Charts
Graph of sample data plotted over timeGraph of sample data plotted over time
UCLUCL
LCLLCL
Assignable Assignable Cause Cause VariationVariation
Process Process Average Average ± 3± 3
Natural Natural VariationVariation

© 1997 Prentice-Hall, Inc.© 1997 Prentice-Hall, Inc.
S3 - S3 - 99
Control Chart PurposesControl Chart PurposesControl Chart PurposesControl Chart Purposes
Show changes in data patternShow changes in data pattern e.g., trendse.g., trends
Make corrections Make corrections beforebefore process is out of process is out of controlcontrol
Show causes of changes in dataShow causes of changes in data Assignable causesAssignable causes
Data outside control limits or trend in dataData outside control limits or trend in data Natural causesNatural causes
Random variations around averageRandom variations around average

© 1997 Prentice-Hall, Inc.© 1997 Prentice-Hall, Inc.
S3 - S3 - 1010
X
Theoretical Basis Theoretical Basis of Control Chartsof Control ChartsTheoretical Basis Theoretical Basis of Control Chartsof Control Charts
As As sample sample size gets size gets large large enough enough (( 30) ... 30) ...
sampling sampling distribution distribution becomes becomes almost normal almost normal regardless of regardless of population population distribution.distribution.
Central Limit TheoremCentral Limit Theorem
XX

© 1997 Prentice-Hall, Inc.© 1997 Prentice-Hall, Inc.
S3 - S3 - 1111
Theoretical Basis Theoretical Basis of Control Chartsof Control ChartsTheoretical Basis Theoretical Basis of Control Chartsof Control Charts
Properties of normal distributionProperties of normal distribution
X X X
99.7% of all99.7% of allX X fall within ± 3fall within ± 3XX

© 1997 Prentice-Hall, Inc.© 1997 Prentice-Hall, Inc.
S3 - S3 - 1313
Produce GoodProvide Service
Stop Process
Yes
No
Assign.Causes?Take Sample
Inspect Sample
Find Out WhyCreate
Control Chart
StartProduce Good
Provide Service
Stop Process
Yes
No
Assign.Causes?Take Sample
Inspect Sample
Find Out WhyCreate
Control Chart
Start
Statistical Process Statistical Process Control StepsControl Steps
Statistical Process Statistical Process Control StepsControl Steps

© 1997 Prentice-Hall, Inc.© 1997 Prentice-Hall, Inc.
S3 - S3 - 1414
Control Chart TypesControl Chart TypesControl Chart TypesControl Chart Types
ControlCharts
RChart
VariablesCharts
AttributesCharts
XChart
PChart
CChart
ControlCharts
RChart
VariablesCharts
AttributesCharts
XChart
PChart
CChart
Continuous Continuous Numerical DataNumerical Data
Categorical or Categorical or Discrete Numerical Discrete Numerical DataData

© 1997 Prentice-Hall, Inc.© 1997 Prentice-Hall, Inc.
S3 - S3 - 1515
RR Chart ChartRR Chart Chart
Type of variables control chartType of variables control chart Interval or ratio scaled numerical dataInterval or ratio scaled numerical data
Shows sample ranges over timeShows sample ranges over time Difference between smallest & largest Difference between smallest & largest
values in inspection samplevalues in inspection sample
Monitors variability in processMonitors variability in process Example: Weigh samples of coffee & Example: Weigh samples of coffee &
compute ranges of samples; Plotcompute ranges of samples; Plot

© 1997 Prentice-Hall, Inc.© 1997 Prentice-Hall, Inc.
S3 - S3 - 1616
RR Chart Chart Control LimitsControl Limits
RR Chart Chart Control LimitsControl Limits
UCL D R
LCL D R
R
R
k
R
R
ii
k
4
3
1
UCL D R
LCL D R
R
R
k
R
R
ii
k
4
3
1
Sample Range Sample Range at Timeat Time i i
# Samples# Samples
From Table S3.1From Table S3.1

© 1997 Prentice-Hall, Inc.© 1997 Prentice-Hall, Inc.
S3 - S3 - 1717
RR Chart Chart ExampleExampleRR Chart Chart ExampleExample
You’re manager of a You’re manager of a 500-room hotel. You 500-room hotel. You want to analyze the want to analyze the time it takes to deliver time it takes to deliver luggage to the room. luggage to the room. For 7 days, you collect For 7 days, you collect data ondata on 5 5 deliveries deliveries per day. Is the per day. Is the process in controlprocess in control??

© 1997 Prentice-Hall, Inc.© 1997 Prentice-Hall, Inc.
S3 - S3 - 1818
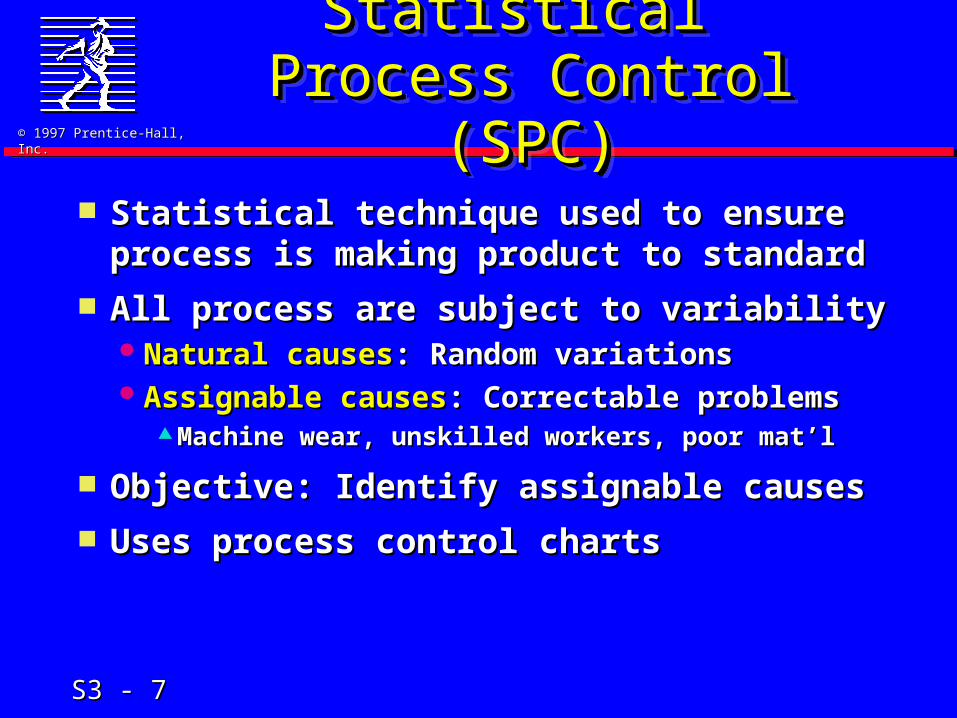
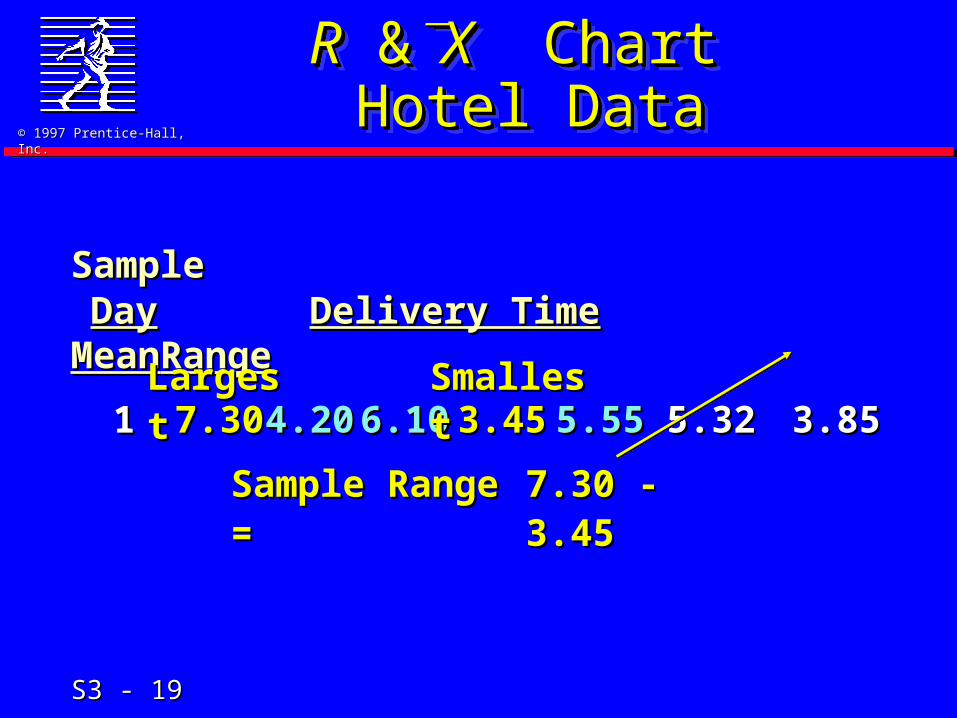
RR & &XX Chart Chart Hotel DataHotel Data
RR & &XX Chart Chart Hotel DataHotel Data
SampleSampleDayDay Delivery TimeDelivery Time MeanMean RangeRange
11 7.307.30 4.204.20 6.106.10 3.453.45 5.555.55 5.325.32
7.30 + 4.20 + 6.10 + 3.45 + 5.557.30 + 4.20 + 6.10 + 3.45 + 5.55 5 5
Sample Mean = Sample Mean =
© 1997 Prentice-Hall, Inc.© 1997 Prentice-Hall, Inc.
S3 - S3 - 1919
RR & &XX Chart Chart Hotel DataHotel Data
RR & &XX Chart Chart Hotel DataHotel Data
SampleSampleDayDay Delivery TimeDelivery Time MeanMean RangeRange
11 7.307.30 4.204.20 6.106.10 3.453.45 5.555.55 5.325.32 3.853.85
7.30 - 3.457.30 - 3.45Sample Range = Sample Range =
LargestLargest SmallestSmallest

© 1997 Prentice-Hall, Inc.© 1997 Prentice-Hall, Inc.
S3 - S3 - 2020
RR & &XX Chart Chart Hotel DataHotel Data
RR & &XX Chart Chart Hotel DataHotel Data
SampleSampleDayDay Delivery TimeDelivery Time MeanMean RangeRange
11 7.307.30 4.204.20 6.106.10 3.453.45 5.555.55 5.325.32 3.853.8522 4.604.60 8.708.70 7.607.60 4.434.43 7.627.62 6.596.59 4.274.2733 5.985.98 2.922.92 6.206.20 4.204.20 5.105.10 4.884.88 3.283.2844 7.207.20 5.105.10 5.195.19 6.806.80 4.214.21 5.705.70 2.992.9955 4.004.00 4.504.50 5.505.50 1.891.89 4.464.46 4.074.07 3.613.6166 10.1010.10 8.108.10 6.506.50 5.065.06 6.946.94 7.347.34 5.045.0477 6.776.77 5.085.08 5.905.90 6.906.90 9.309.30 6.796.79 4.224.22

© 1997 Prentice-Hall, Inc.© 1997 Prentice-Hall, Inc.
S3 - S3 - 2121
RR
RR
RR Chart Chart Control Limits SolutionControl Limits Solution
RR Chart Chart Control Limits SolutionControl Limits Solution
From Table From Table S3.1 (S3.1 (nn = 5) = 5)
RR
kk
UCLUCL DD
iiii
kk
RR
11
44
33 8585 44 2727 44 2222
7733 894894
22 114114 33 894894 88 232232
.. .. ....
.. .. ..
LL

© 1997 Prentice-Hall, Inc.© 1997 Prentice-Hall, Inc.
S3 - S3 - 2222
Partial Table for Partial Table for Control Chart LimitsControl Chart Limits
Partial Table for Partial Table for Control Chart LimitsControl Chart Limits
n A2 D4 D3
2 1.880 3.268 0
3 1.023 2.574 0
4 0.729 2.282 0
5 0.577 2.114 0
6 0.483 2.004 0
7 0.419 1.924 0.076
n A2 D4 D3
2 1.880 3.268 0
3 1.023 2.574 0
4 0.729 2.282 0
5 0.577 2.114 0
6 0.483 2.004 0
7 0.419 1.924 0.076
© 1997 Prentice-Hall, Inc.© 1997 Prentice-Hall, Inc.
S3 - S3 - 2323
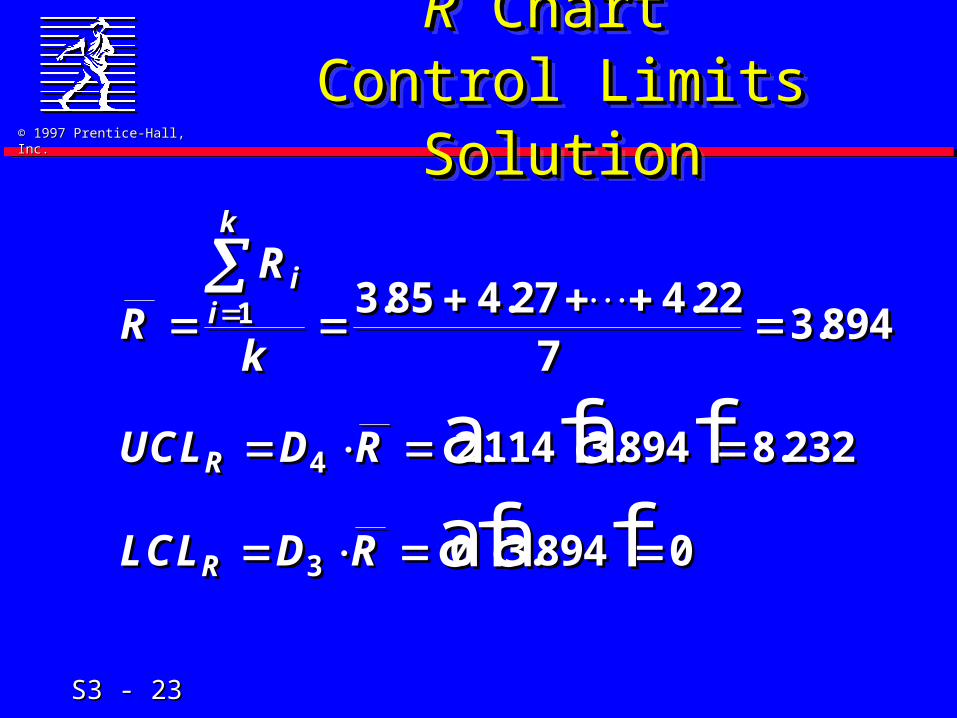
RR Chart Chart Control Limits SolutionControl Limits Solution
RR Chart Chart Control Limits SolutionControl Limits Solution
R
R
k
UCL D R
LCL D R
ii
k
R
R
1
4
3
3 85 4 27 4 227
3 894
2114 3 894 8 232
0 3 894 0
. . ..
. . .
.
a fa fafa f
R
R
k
UCL D R
LCL D R
ii
k
R
R
1
4
3
3 85 4 27 4 227
3 894
2114 3 894 8 232
0 3 894 0
. . ..
. . .
.
a fa fafa f

© 1997 Prentice-Hall, Inc.© 1997 Prentice-Hall, Inc.
S3 - S3 - 2424
02468
1 2 3 4 5 6 7
R, Minutes
Day
02468
1 2 3 4 5 6 7
R, Minutes
Day
02468
1 2 3 4 5 6 7
R, Minutes
Day
RR Chart Chart Control Chart SolutionControl Chart Solution
RR Chart Chart Control Chart SolutionControl Chart Solution
UCLUCL

© 1997 Prentice-Hall, Inc.© 1997 Prentice-Hall, Inc.
S3 - S3 - 2525
XX Chart ChartXX Chart Chart
Type of variables control chartType of variables control chart Interval or ratio scaled numerical dataInterval or ratio scaled numerical data
Shows sample means over timeShows sample means over time Monitors process averageMonitors process average Example: Weigh samples of coffee & Example: Weigh samples of coffee &
compute means of samples; Plotcompute means of samples; Plot

© 1997 Prentice-Hall, Inc.© 1997 Prentice-Hall, Inc.
S3 - S3 - 2626
XX Chart Chart Control LimitsControl Limits
XX Chart Chart Control LimitsControl Limits
UCL X A R
LCL X A R
X
X
kR
R
k
X
X
ii
k
ii
k
2
2
1 1
UCL X A R
LCL X A R
X
X
kR
R
k
X
X
ii
k
ii
k
2
2
1 1
Sample Sample Range Range at Timeat Time i i
# Samples# Samples
Sample Sample Mean at Mean at Time Time ii
From From Table S3.1Table S3.1

© 1997 Prentice-Hall, Inc.© 1997 Prentice-Hall, Inc.
S3 - S3 - 2727
RR & &XX Chart Chart Hotel DataHotel Data
RR & &XX Chart Chart Hotel DataHotel Data
SampleSampleDayDay Delivery TimeDelivery Time MeanMean RangeRange
11 7.307.30 4.204.20 6.106.10 3.453.45 5.555.55 5.325.32 3.853.8522 4.604.60 8.708.70 7.607.60 4.434.43 7.627.62 6.596.59 4.274.2733 5.985.98 2.922.92 6.206.20 4.204.20 5.105.10 4.884.88 3.283.2844 7.207.20 5.105.10 5.195.19 6.806.80 4.214.21 5.705.70 2.992.9955 4.004.00 4.504.50 5.505.50 1.891.89 4.464.46 4.074.07 3.613.6166 10.1010.10 8.108.10 6.506.50 5.065.06 6.946.94 7.347.34 5.045.0477 6.776.77 5.085.08 5.905.90 6.906.90 9.309.30 6.796.79 4.224.22

© 1997 Prentice-Hall, Inc.© 1997 Prentice-Hall, Inc.
S3 - S3 - 2828
XX Chart Chart Control Limits SolutionControl Limits Solution**
XX Chart Chart Control Limits SolutionControl Limits Solution**
X
X
k
R
R
k
UCL X A R
LCL X A R
ii
k
ii
k
X
X
1
1
2
2
5 32 6 59 6 797
5 813
3 85 4 27 4 227
3 894
5 813 0 577 3 894 8 060
5 813 0 577 3 894 3 566
. . ..
. . ..
. . . .
. . . .
a fa fa fa f
X
X
k
R
R
k
UCL X A R
LCL X A R
ii
k
ii
k
X
X
1
1
2
2
5 32 6 59 6 797
5 813
3 85 4 27 4 227
3 894
5 813 0 577 3 894 8 060
5 813 0 577 3 894 3 566
. . ..
. . ..
. . . .
. . . .
a fa fa fa f
From Table From Table S3.1 (S3.1 (nn = 5) = 5)

© 1997 Prentice-Hall, Inc.© 1997 Prentice-Hall, Inc.
S3 - S3 - 2929
XX Chart ChartControl Chart Solution*Control Chart Solution*
XX Chart ChartControl Chart Solution*Control Chart Solution*
02468
1 2 3 4 5 6 7
X, Minutes
Day
02468
1 2 3 4 5 6 7
X, Minutes
Day
UCLUCL
LCLLCL

© 1997 Prentice-Hall, Inc.© 1997 Prentice-Hall, Inc.
S3 - S3 - 3030
Thinking ChallengeThinking ChallengeThinking ChallengeThinking Challenge
You’re manager of a You’re manager of a 500-room hotel. The 500-room hotel. The hotel owner tells you hotel owner tells you that it takes too long to that it takes too long to deliver luggage to the deliver luggage to the room (even if the room (even if the process may be in process may be in control). What do you control). What do you do?do?
© 1995 Corel Corp.
AloneAlone GroupGroup Class Class

© 1997 Prentice-Hall, Inc.© 1997 Prentice-Hall, Inc.
S3 - S3 - 3131
pp Chart Chartpp Chart Chart
Type of attributes control chartType of attributes control chart Nominally scaled categorical dataNominally scaled categorical data
e.g., good-bade.g., good-bad
Shows % of nonconforming itemsShows % of nonconforming items Example: Count # defective chairs & Example: Count # defective chairs &
divide by total chairs inspected; Plotdivide by total chairs inspected; Plot Chair is either defective or not defectiveChair is either defective or not defective

© 1997 Prentice-Hall, Inc.© 1997 Prentice-Hall, Inc.
S3 - S3 - 3232
cc Chart Chartcc Chart Chart
Type of attributes control chartType of attributes control chart Discrete quantitative dataDiscrete quantitative data
Shows number of nonconformities Shows number of nonconformities (defects) in a unit (defects) in a unit Unit may be chair, steel sheet, car etc.Unit may be chair, steel sheet, car etc. Size of unit must be constantSize of unit must be constant
Example: Count # defects (scratches, Example: Count # defects (scratches, chips etc.) in chips etc.) in eacheach chair of a sample chair of a sample of 100 chairs; Plotof 100 chairs; Plot

© 1997 Prentice-Hall, Inc.© 1997 Prentice-Hall, Inc.
S3 - S3 - 3333
What Is What Is Acceptance Sampling?Acceptance Sampling?
What Is What Is Acceptance Sampling?Acceptance Sampling?
Form of quality testing used for Form of quality testing used for incoming materials or finished goodsincoming materials or finished goods e.g., purchased material & componentse.g., purchased material & components
ProcedureProcedure Take one or more samples at random Take one or more samples at random
from a lot (shipment) of itemsfrom a lot (shipment) of items Inspect each of the items in the sampleInspect each of the items in the sample Decide whether to reject the whole lot Decide whether to reject the whole lot
based on the inspection resultsbased on the inspection results

© 1997 Prentice-Hall, Inc.© 1997 Prentice-Hall, Inc.
S3 - S3 - 3434
What Is an What Is an Acceptance Plan?Acceptance Plan?
What Is an What Is an Acceptance Plan?Acceptance Plan?
Set of procedures for inspecting Set of procedures for inspecting incoming materials or finished goodsincoming materials or finished goods
IdentifiesIdentifies Type of sampleType of sample Sample size (Sample size (nn)) Criteria (Criteria (cc) used to reject or accept a lot) used to reject or accept a lot
Producer (supplier) & consumer Producer (supplier) & consumer (buyer) must negotiate(buyer) must negotiate

© 1997 Prentice-Hall, Inc.© 1997 Prentice-Hall, Inc.
S3 - S3 - 3535
Producer’s & Producer’s & Consumer’s RiskConsumer’s Risk
Producer’s & Producer’s & Consumer’s RiskConsumer’s Risk
Producer's risk (Producer's risk ()) Probability of rejecting a good lot Probability of rejecting a good lot Probability of rejecting a lot when Probability of rejecting a lot when
fraction defective is AQLfraction defective is AQL
Consumer's risk (ß)Consumer's risk (ß) Probability of accepting a bad lot Probability of accepting a bad lot Probability of accepting a lot when Probability of accepting a lot when
fraction defective is LTPDfraction defective is LTPD

© 1997 Prentice-Hall, Inc.© 1997 Prentice-Hall, Inc.
S3 - S3 - 3636
ConclusionConclusionConclusionConclusion
Explained statistical process controlExplained statistical process control Developed control charts for variablesDeveloped control charts for variables
RR chart, chart,XX chart chart
Discussed control charts for attributesDiscussed control charts for attributes PP chart, chart, cc chart chart
Explained acceptance samplingExplained acceptance sampling Producer’s & consumer’s riskProducer’s & consumer’s risk