Embed Size (px)
Citation preview
♥♥ 1. Intro. 2. VTS Var.. 3. Method 4. Results 5. Concl. ♠♠ ◄◄ ►► 1/18
IIT
Bom
bay
NCC 2011 : 17th National Conference on Communications, Jan. 28-30, 2011, Bangalore, India, Sp Pr. II, P4
Improving the Consistency ofVocal Tract Shape Estimation
K. S. NatarajJagbandhu
P. C. Pandey{natarajks, jagbandhu, pcpandey}@ee.iitb.ac.in
M. S. [email protected]
IIT Bombayhttp://www.ee.iitb.ac.in/~spilab
♥♥ 1. Intro. 2. VTS Var.. 3. Method 4. Results 5. Concl. ♠♠ ◄◄ ►► 2/18
IIT
Bom
bay
OVERVIEW
1. Introduction
2. Variation in Vocal Tract Shape
3. Method
4. Results
5. Conclusion
♥♥ 1. Intro. 2. VTS Var.. 3. Method 4. Results 5. Concl. ♠♠ ◄◄ ►► 3/18
IIT
Bom
bay
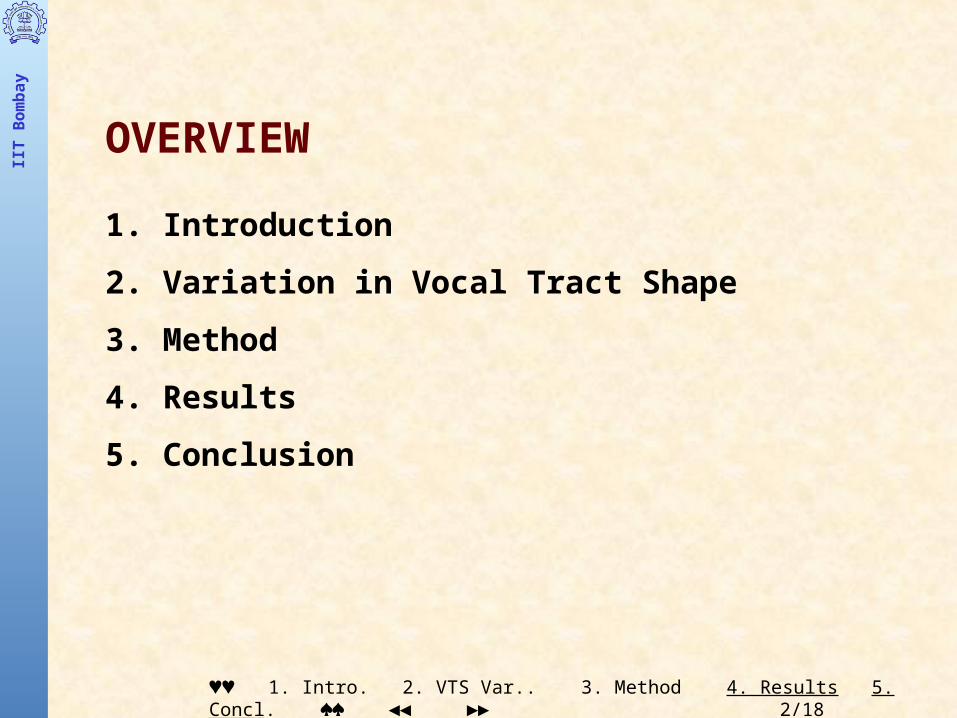
1. INTRODUCTIONVocal Tract Shape : Cross-section area of the vocal tract as a function of the distance from the glottis towards the lips along its length.
Applications
Articulatory synthesis
Speech recognition
Speech-training aids
Visual Speech-training Aids
Visual feedback of articulatory effort for teaching the production of vowels and lingual consonants
Intro. 1/4
♥♥ 1. Intro. 2. VTS Var.. 3. Method 4. Results 5. Concl. ♠♠ ◄◄ ►► 4/18
IIT
Bom
bay
Estimation of Vocal Tract Shape from Speech Signal Linear Predictive Coding (LPC)
Formant analysis
Articulatory codebook mapping
Intro. 2/4
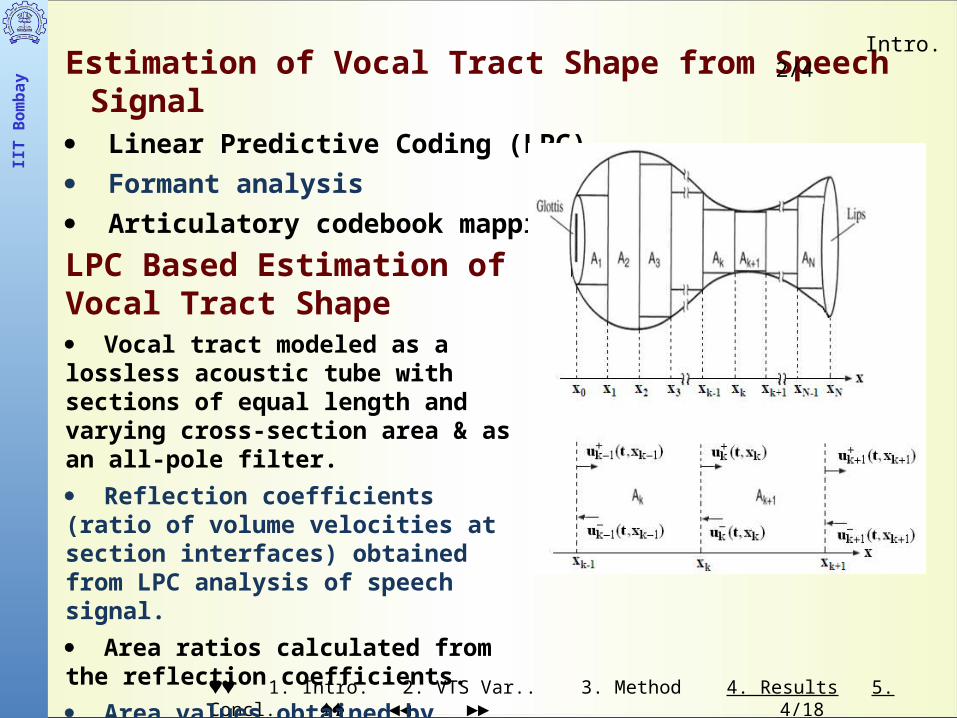
LPC Based Estimation of Vocal Tract Shape Vocal tract modeled as a lossless acoustic tube with sections of equal length and varying cross-section area & as an all-pole filter.
Reflection coefficients (ratio of volume velocities at section interfaces) obtained from LPC analysis of speech signal.
Area ratios calculated from the reflection coefficients.
Area values obtained by multiplying the area ratios by an assumed area at the glottis end.
♥♥ 1. Intro. 2. VTS Var.. 3. Method 4. Results 5. Concl. ♠♠ ◄◄ ►► 5/18
IIT
Bom
bay
Intro. 3/4Features of LPC Based VT Shape Estimation Usable for estimating fixed as well as transitional vocal tract configurations.
Real-time processing feasible.
Limitations of LPC Based VT Shape Estimation Improper estimation during nasalized vowels, nasal stops, and fricatives, due to deviations from all-pole filter model.
Improper estimation during stop closures due to very low signal energy.
Error in estimation due to band-limited speech signal.
Error due to uncertain glottal source characteristics.
Error during varying tract configuration due to assumption of fixed area at the glottal end.Variability in vocal tract shape during fixed tract configuration due to variations in the position of the analysis window with respect to the glottal pulse.
♥♥ 1. Intro. 2. VTS Var.. 3. Method 4. Results 5. Concl. ♠♠ ◄◄ ►► 6/18
IIT
Bom
bay
Intro. 4/4
Objective of the Investigation
A method for improving
the consistency of the LPC-based estimation
of the area values of the vocal tract cross-sections
without smearing the variations during speech segments
with transitional vocal tract configuration.
♥♥ 1. Intro. 2. VTS Var.. 3. Method 4. Results 5. Concl. ♠♠ ◄◄ ►► 7/18
IIT
Bom
bay
2. VARIATION IN VOCAL TRACT SHAPEVT Shape Estimation by LPC Analysis ▪ Fs = 10 kHz, Pre-emphasis: 6 dB/octave, LPC order = 12
▪ Analysis frame length: twice the average pitch period▪ Analysis window: Hamming
Variation in the area values estimated with window shift of 5 ms, even for the vowel segments with fixed tract configurations.
Reduction in the variability possible by low-pass filtering (along time) of the estimated area values or by using a longer analysis window, but at the expense of smearing of the transitions during segments with transitional tract configurations e.g. diphthongs, VC and CV transitions.
♥♥ 1. Intro. 2. VTS Var.. 3. Method 4. Results 5. Concl. ♠♠ ◄◄ ►► 8/18
IIT
Bom
bay
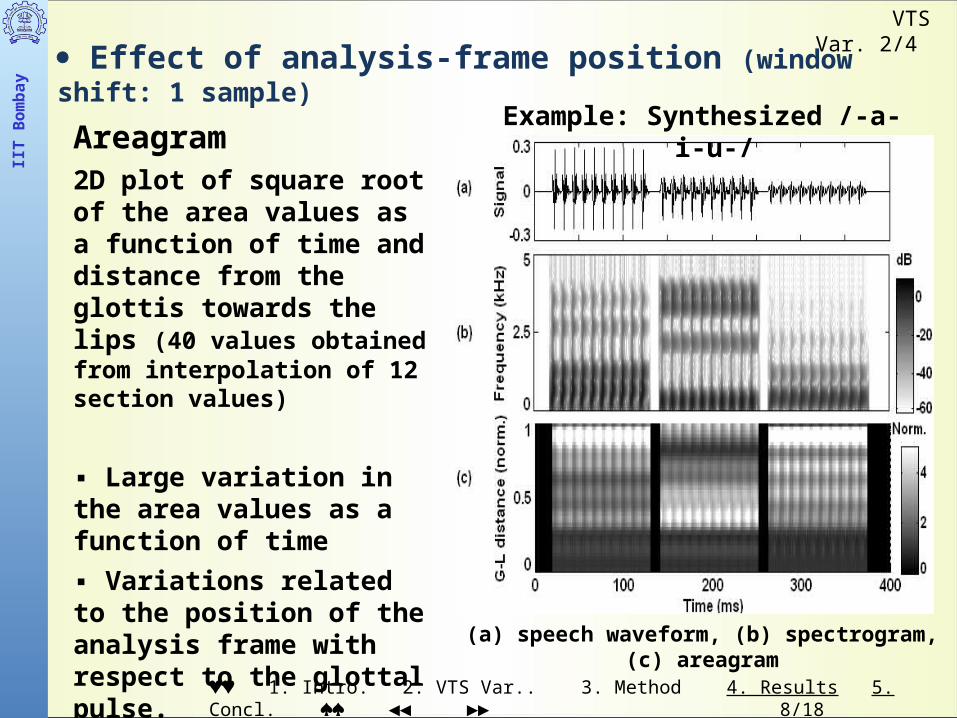
Example: Synthesized /-a-i-u-/
(a) speech waveform, (b) spectrogram, (c) areagram
VTS Var. 2/4
Effect of analysis-frame position (window shift: 1 sample)
Areagram2D plot of square root of the area values as a function of time and distance from the glottis towards the lips (40 values obtained from interpolation of 12 section values)
▪ Large variation in the area values as a function of time
▪ Variations related to the position of the analysis frame with respect to the glottal pulse.
♥♥ 1. Intro. 2. VTS Var.. 3. Method 4. Results 5. Concl. ♠♠ ◄◄ ►► 9/18
IIT
Bom
bay
Earlier StudiesRabiner et al. (1977)
▪ A substantial variation in the LPC prediction error with change in the position of the analysis frame.▪ Variability in the prediction error could be reduced by all-pass filtering and pre-emphasis of the speech signal, but at the expense of an increase in the error.
Mezzalama (1979)▪ A large variation in the formants estimated by LPC analysis with change in the position of the analysis frame with respect to the glottal pulse.
▪ Variation could be reduced by selecting the frame length to be equal to the multiple of the pitch period and by repeatedly concatenating the frame before applying the analysis window.
Mizoguchi et al. (1982): "Selective LP in time domain", involving rejection of speech segments corresponding to prediction error above a threshold, for reducing the variation in the prediction coefficients across the frames for steady-state vowel segments.
Ma et al. (1993): Selection of speech samples on the basis of short-time energy found to be more robust for reducing the variation in the prediction coefficients than the selection based on LPC prediction error.
VTS Var. 3/4
♥♥ 1. Intro. 2. VTS Var.. 3. Method 4. Results 5. Concl. ♠♠ ◄◄ ►► 10/18
IIT
Bom
bay
VTS Var. 4/4
Selection of Frames for Reducing Variability in VT Shape
Variation in the RMS value of the LPC prediction error with the analysis frame position.
Frame positions corresponding to the minimum in the prediction error found to be related to the least estimation error in the vocal tract parameters.
Difficulty in consistently locating the peaks or the valleys of the LPC prediction error.
The variation in the prediction error found to be related to the GCIs, but the location of the frame positions for minimum error with respect to the GCIs found to be different for different vowels.
Minima of the prediction error coincide with the minima of the windowed energy for steady-state vowel segments.
♥♥ 1. Intro. 2. VTS Var.. 3. Method 4. Results 5. Concl. ♠♠ ◄◄ ►► 11/18
IIT
Bom
bay
3. METHODWindowed Energy Index
Automated selection of frames by using “windowed energy index”, calculated as the ratio of the energy of the windowed frame to the frame energy
Ew (n) = Windowed energy index for frame position n
w(m) = Hamming window of length N
sn(m) = speech segment for the frame position n
1 12 2( ) [ ( ) ( )] ( )0 0
N NE n s m w m s mw n n
m m
Method 1/3
♥♥ 1. Intro. 2. VTS Var.. 3. Method 4. Results 5. Concl. ♠♠ ◄◄ ►► 12/18
IIT
Bom
bay
Method 2/3Windowed Energy Index
Ew for Synthesized Vowels
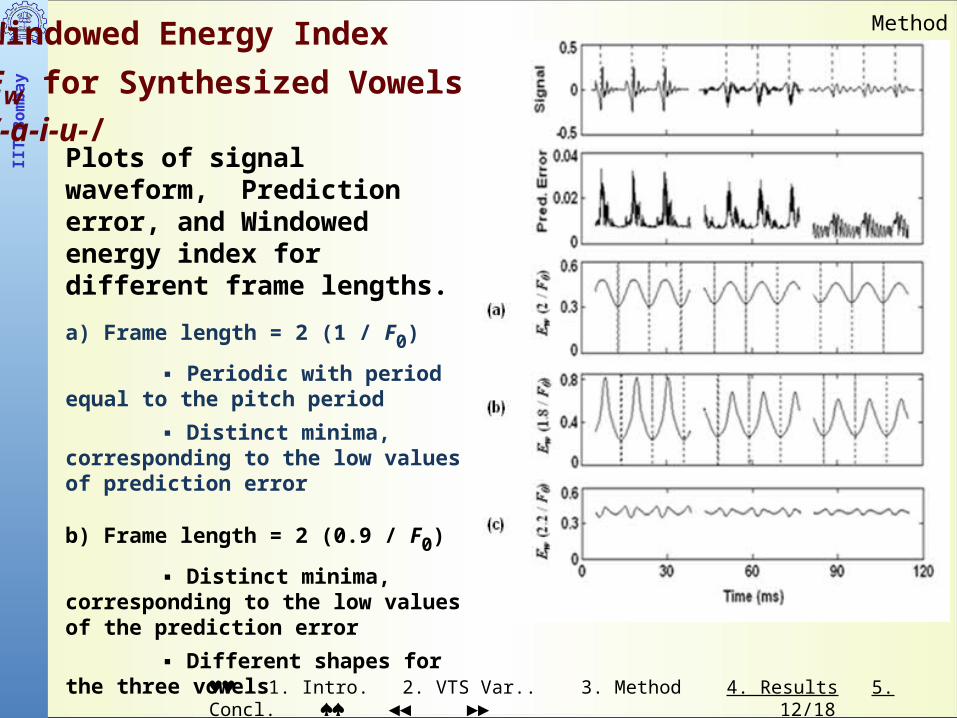
/-a-i-u-/Plots of signal waveform, Prediction error, and Windowed energy index for different frame lengths.
a) Frame length = 2 (1 / F0)
▪ Periodic with period equal to the pitch period
▪ Distinct minima, corresponding to the low values of prediction error
b) Frame length = 2 (0.9 / F0)
▪ Distinct minima, corresponding to the low values of the prediction error
▪ Different shapes for the three vowels
c) Frame length = 2 (1.1 / F0)
Indistinct minima
♥♥ 1. Intro. 2. VTS Var.. 3. Method 4. Results 5. Concl. ♠♠ ◄◄ ►► 13/18
IIT
Bom
bay
Method 3/3
Observations from Ew for Synthesized Vowels
Variability in estimated area values can be reduced by selecting the frame positions corresponding to the minima in Ew , calculated with analysis frames of length equal to two
pitch periods or slightly shorter.
♥♥ 1. Intro. 2. VTS Var.. 3. Method 4. Results 5. Concl. ♠♠ ◄◄ ►► 14/18
IIT
Bom
bay
Results 1/3
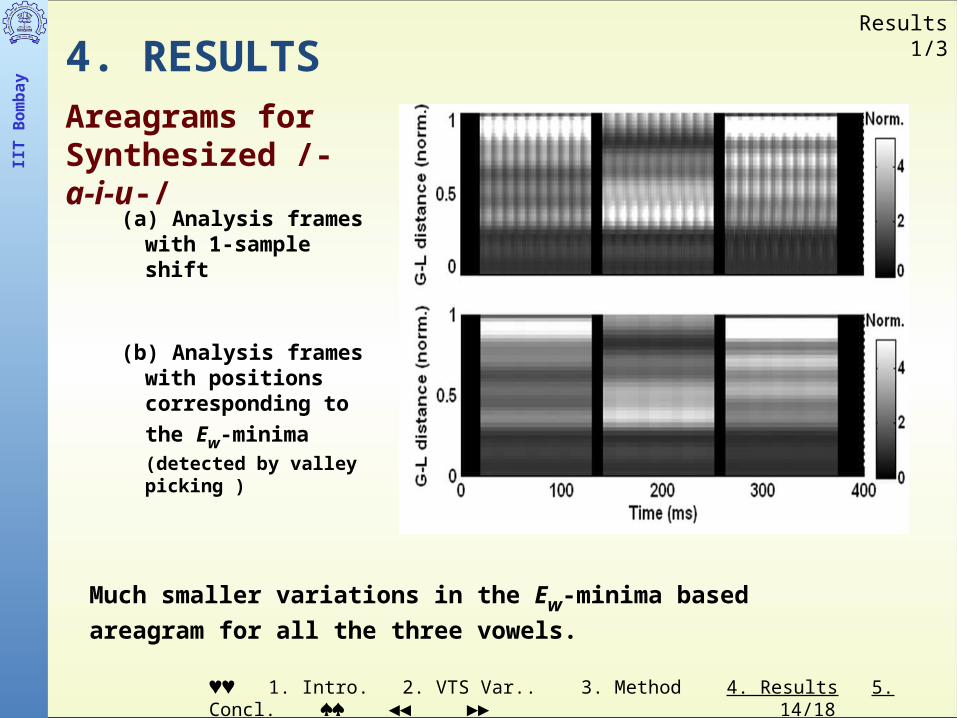
(a) Analysis frames with 1-sample shift
(b) Analysis frames with positions corresponding
to the Ew-minima (detected
by valley picking )
4. RESULTSAreagrams for Synthesized /-a-i-u-/
Much smaller variations in the Ew-minima based areagram for all the three vowels.
♥♥ 1. Intro. 2. VTS Var.. 3. Method 4. Results 5. Concl. ♠♠ ◄◄ ►► 15/18
IIT
Bom
bay
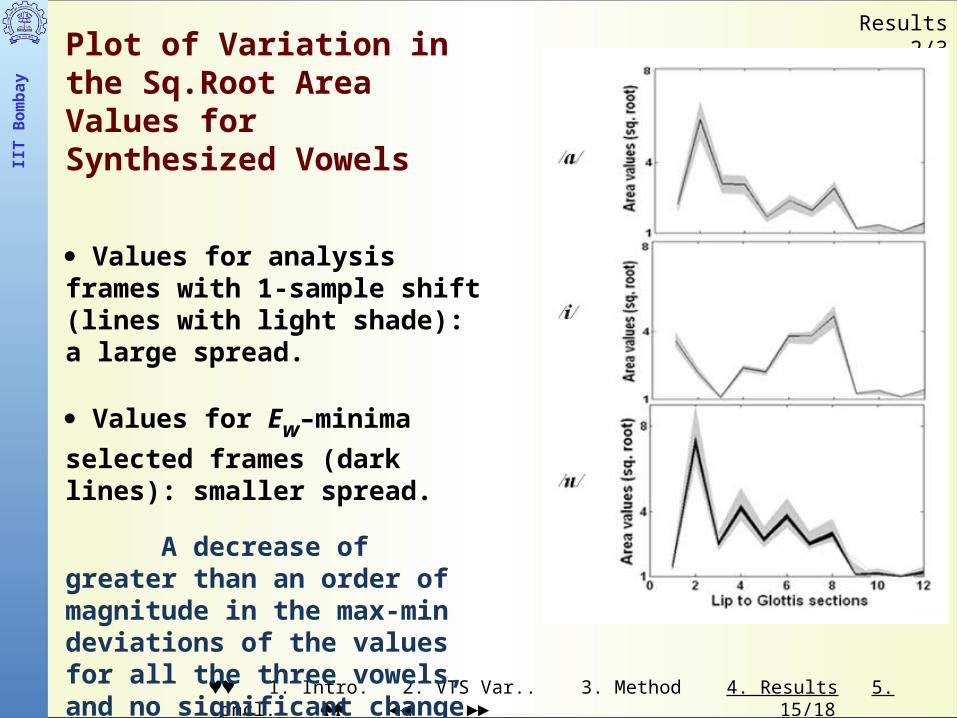
Results 2/3Plot of Variation in the Sq.Root Area Values for Synthesized Vowels
Values for analysis frames with 1-sample shift (lines with light shade): a large spread.
Values for Ew–minima selected
frames (dark lines): smaller spread.
A decrease of greater than an order of magnitude in the max-min deviations of the values for all the three vowels, and no significant change in the mean values.
♥♥ 1. Intro. 2. VTS Var.. 3. Method 4. Results 5. Concl. ♠♠ ◄◄ ►► 16/18
IIT
Bom
bay
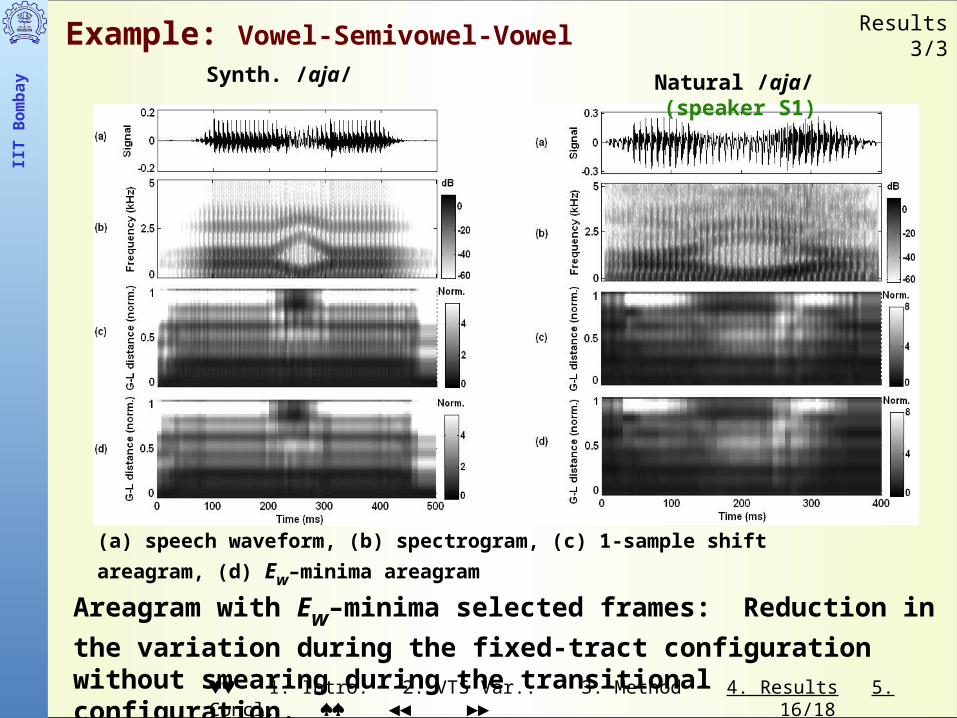
Results 3/3Example: Vowel-Semivowel-Vowel
Synth. /aja/ Natural /aja/ (speaker S1)
(a) speech waveform, (b) spectrogram, (c) 1-sample shift areagram, (d) Ew–minima areagram
Areagram with Ew–minima selected frames: Reduction in the variation during the
fixed-tract configuration without smearing during the transitional configuration.
♥♥ 1. Intro. 2. VTS Var.. 3. Method 4. Results 5. Concl. ♠♠ ◄◄ ►► 17/18
IIT
Bom
bay
5. CONCLUSION Analysis frames positioned at Ew-minima resulted in
▪ low prediction error in LPC analysis,
▪ significantly reduced variability in the area values estimated by LP analysis during vowel segments with fixed-tract configurations.
Consistency of vocal tract shape estimation improved without smearing the variations in the shape during semivowel segments with transitional-tract configuration.
Method may be used to estimate the VC and CV transition area values during Vowel-Oral stop-Vowel utterances for improving
▪ the accuracy of the vocal tract shape during stop closures as estimated by bivariate surface modeling,
▪ vocal tract shape estimation for speech training aids.
Concl. 1/1
♥♥ 1. Intro. 2. VTS Var.. 3. Method 4. Results 5. Concl. ♠♠ ◄◄ ►► 18/18
IIT
Bom
bay
Thank You
♥♥ 1. Intro. 2. VTS Var.. 3. Method 4. Results 5. Concl. ♠♠ ◄◄ ►► 19/18
IIT
Bom
bay
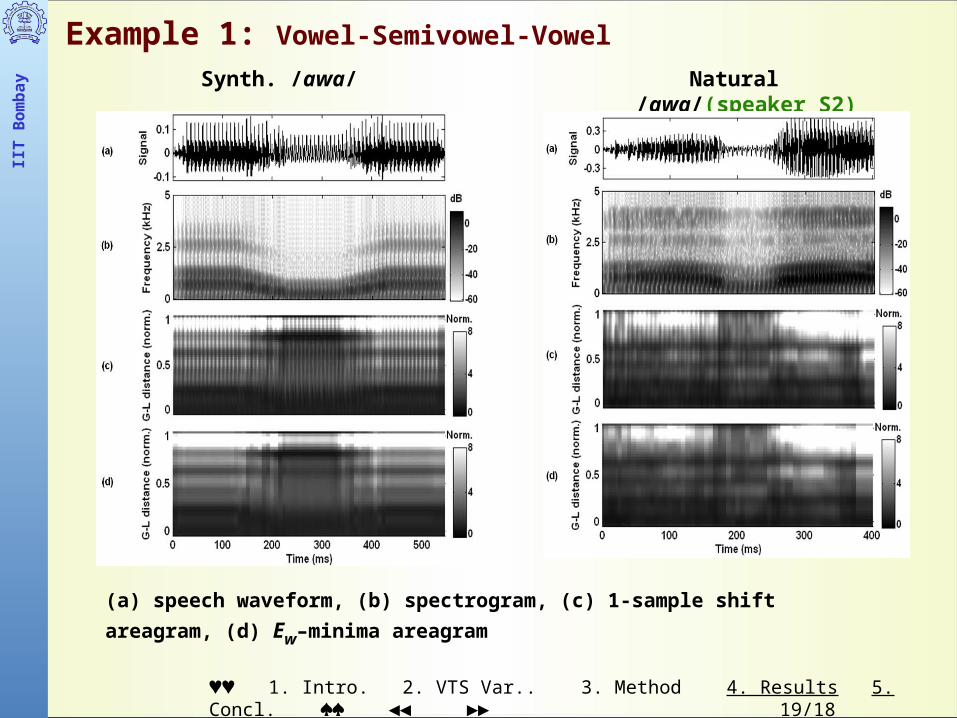
Example 1: Vowel-Semivowel-Vowel
Synth. /awa/ Natural /awa/(speaker S2)
(a) speech waveform, (b) spectrogram, (c) 1-sample shift areagram, (d) Ew–minima areagram
♥♥ 1. Intro. 2. VTS Var.. 3. Method 4. Results 5. Concl. ♠♠ ◄◄ ►► 20/18
IIT
Bom
bay
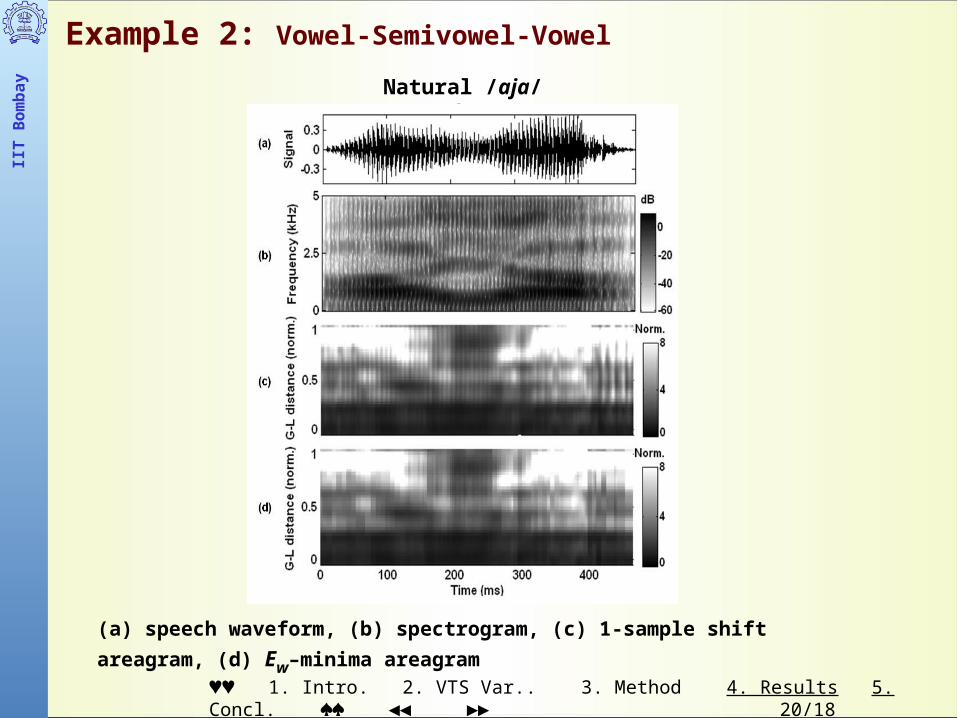
Example 2: Vowel-Semivowel-Vowel
Natural /aja/ (speaker S2)
(a) speech waveform, (b) spectrogram, (c) 1-sample shift areagram, (d) Ew–minima areagram
♥♥ 1. Intro. 2. VTS Var.. 3. Method 4. Results 5. Concl. ♠♠ ◄◄ ►► 21/18
IIT
Bom
bay
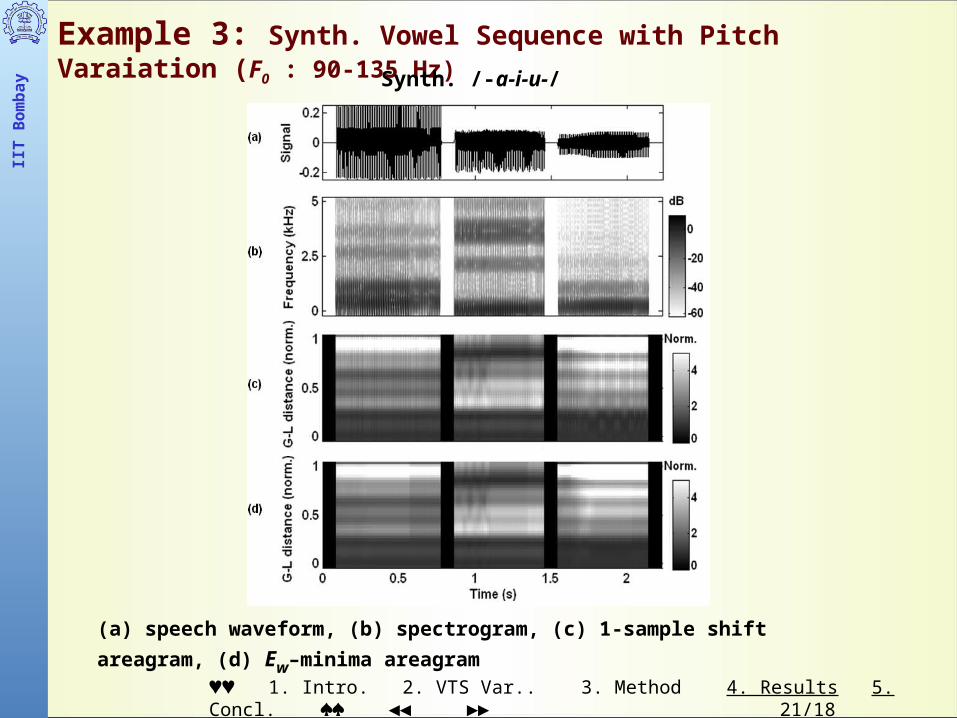
Example 3: Synth. Vowel Sequence with Pitch Varaiation (F0 : 90-135 Hz)
(a) speech waveform, (b) spectrogram, (c) 1-sample shift areagram, (d) Ew–minima areagram
Synth. /-a-i-u-/
♥♥ 1. Intro. 2. VTS Var.. 3. Method 4. Results 5. Concl. ♠♠ ◄◄ ►► 22/18
IIT
Bom
bay
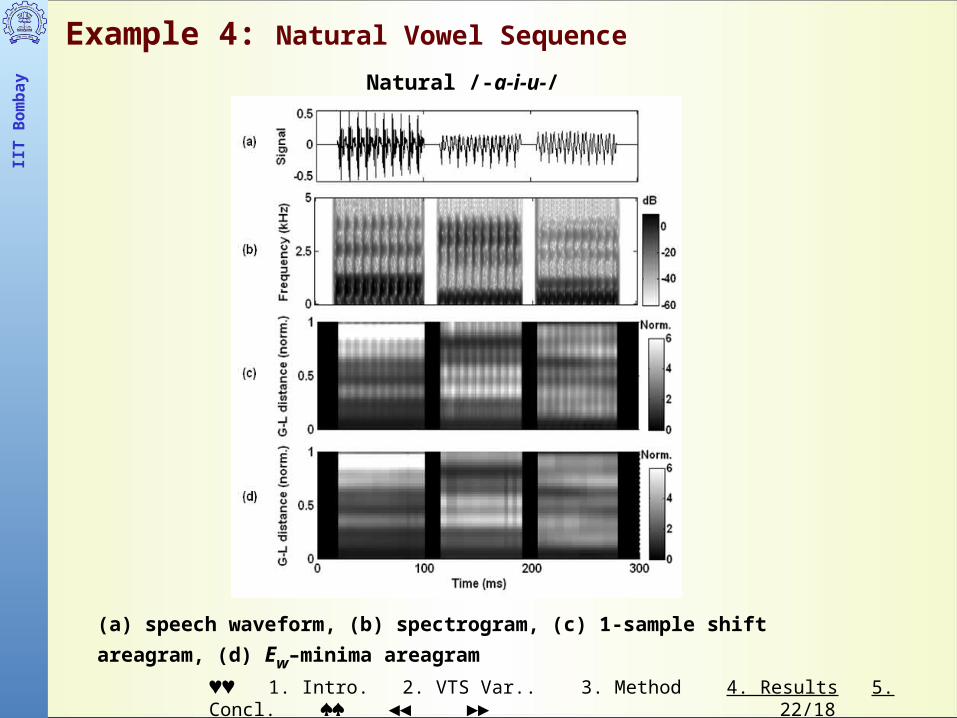
Example 4: Natural Vowel Sequence
Natural /-a-i-u-/ (speaker S1)
(a) speech waveform, (b) spectrogram, (c) 1-sample shift areagram, (d) Ew–minima areagram


![355 2x 3x 4x 5x ♥ ♥ ♥ ♥ ♥ ♥ ♥ ♥ 3 4 KEILA – Human Rogue [3] : Before combat, Roll 1d6: (3-6) Escape Monster [4] : May ignore Servant encounter after reveal](https://img.pdfslide.us/doc/110x75/56649d195503460f949eec88/355-2x-3x-4x-5x-3-4-keila-human-rogue-3.jpg)