Embed Size (px)
Citation preview

- 1 -
European Aviation Club12 March 2009
Brussels
Ulrich Schulte-StrathausAEA Secretary General
The State of the Industry – and what AEA can do
The current crisis – A catalyst for a structural change of
European aviation

- 2 -
AEA member airlines' brands give credibility and weight to the Association…
AEA leverages this weight and gives it back, multiplied, to each individual
member.
The Association of European Airlines

- 3 -
The worst crisis since the 1930s
0
1
2
3
4
5
6
7
8
19
61
19
63
19
65
19
67
19
69
19
71
19
73
19
75
19
77
19
79
19
81
19
83
19
85
19
87
19
89
19
91
19
93
19
95
19
97
19
99
20
01
20
03
20
05
20
07
20
09
%
Source: AEA research, IMF data
Timeline of crises since 1961 (GDP Growth)
1973-75Oil crisis
1979-80Oil crisis
1981-83Economic
crisis
1990-92Economic
crisis
1997-98Asian
Financial crisis
2001-039/11
Economic crisis
2008-?
World recession =GDP growth below 3%

- 4 -
Economies worldwide are suffering
-3
-1
1
3
5
7
9
US
EU
Ce
ntr
al &
Ea
ste
rnE
uro
pe
Ja
pa
n
Ch
ina
Ind
ia
Bra
zil
Wo
rld
% g
row
th r
ate
GD
P
20082009
Source: IMF
Recession is Here% growth GDP

- 5 -
Government bail-outs of banks and financial institutions
Targeted assistance to e.g. Fannie Mae, Freddie Mac, AIG, Fortis, Bradford & Bingley, Glitnir, Kaupthing, RBS, Lloyds TSB,…
Government guarantees for interbank lending
Government guarantees of savings deposits
Interest rate cuts to counter economic slide
IMF provides financial support to Iceland, Ukraine, Turkey
IMF, EU and World Bankprovide financial support to Hungary.
Global Action
Concerted governmental action to …contain the financial problems
Source: AEA staff research, BBC
Eurozonerescue
package EUR 1000 bn
Eurozonerescue
package EUR 1000 bn
UK rescuepackage
GBP 387 bn(EUR 480 bn)
UK rescuepackage
GBP 387 bn(EUR 480 bn)
US rescuepackage
US$ 700 bn(EUR 550 bn)
US rescuepackage
US$ 700 bn(EUR 550 bn)

- 6 -
World economic outlook weakens further
3.0
2.2
0.5
0
1
2
3
4
5
19
96
19
97
19
98
19
99
20
00
20
01
20
02
20
03
20
04
20
05
20
06
20
07
20
08
20
09
%
Source: IMF
IMF Revises World GDP ForecastGross Domestic Product, Constant Prices, Annual % Change
Nov'08
Jan'09
Oct'08
IMF has progressively revised its world forecast for 2009 down, from +3.0% to +0.5%.On 10 March 2009, Strass-Kahn warned that the world economy could shrink in 2009, suggesting an even gloomier outlook than the current official forecast of 0.5% growth.

- 7 -
Confidence Levels are at historic lows
In early 2009 the ESI for Euro Area and EU continued to fall. Both indicators stand at their lowest levels since the series was launched in 1985.
60
70
80
90
100
110
120
20
00
20
01
20
02
20
03
20
04
20
05
20
06
20
07
20
08
20
09
%
Base year of index is annual 2000. Source: European Commission.
EU Economic Sentiment Index
Euro Area ESI
EU ESI

- 8 -
Airlines
- 9 -
Traffic Trend Turnaround since mid-year
Passenger RPKs
Total Freight Tonne-Kms
-30
-25
-20
-15
-10
-5
0
5
10
15
Ja
n-0
8
Fe
b-0
8
Ma
r-0
8
Ap
r-0
8
Ma
y-0
8
Ju
n-0
8
Ju
l-0
8
Au
g-0
8
Se
p-0
8
Oc
t-0
8
No
v-0
8
De
c-0
8
%
Source: AEA
2008 RPK % H1: +3.4% H2: -0.8% = Year +1.2%
2008 TFTK % H1: +3.1% H2: -8.3% = Year -2.8%
Traffic Trend Turnaround came mid-year 2008AEA Total Scheduled Services

- 10 -
Traffic Volumes are in free fall since mid year 2008
Passenger RPKs
Total Freight Tonne-Kms
-25
-20
-15
-10
-5
0
5
10
15
Ju
l-0
5
Se
p-0
5
No
v-0
5
Ja
n-0
6
Ma
r-0
6
Ma
y-0
6
Ju
l-0
6
Se
p-0
6
No
v-0
6
Ja
n-0
7
Ma
r-0
7
Ma
y-0
7
Ju
l-0
7
Se
p-0
7
No
v-0
7
Ja
n-0
8
Ma
r-0
8
Ma
y-0
8
Ju
l-0
8
Se
p-0
8
No
v-0
8
Ja
n-0
9
% g
row
th
Source: AEA
Traffic Volumes Are in Free FallAEA Total Scheduled Services

- 11 -
All routes from Europe are affected
Cross Border Europe
North Atlantic
Far East Australasia
-10
-5
0
5
10
15
20
Ju
l-0
5
Oc
t-0
5
Ja
n-0
6
Ap
r-0
6
Ju
l-0
6
Oc
t-0
6
Ja
n-0
7
Ap
r-0
7
Ju
l-0
7
Oc
t-0
7
Ja
n-0
8
Ap
r-0
8
Ju
l-0
8
Oc
t-0
8
Ja
n-0
9
%
Source: AEA
Passenger Traffic Volumes on Major AEA Route AreasRPK % Growth

- 12 -
Passenger traffic will fall by 4% in 2009
-10
-5
0
5
10
15
19
76
19
78
19
80
19
82
19
84
19
86
19
88
19
90
19
92
19
94
19
96
19
98
20
00
20
02
20
04
20
06
20
08
% R
PK
gro
wth
Source: AEA
2009 will bring the lowest growth in 30 years of passenger air transportwith the exception of external shocks
1991Gulf War I
20019/11
2003-04Gulf War II, SARS
2009: - 4%
▼Passenger traffic levels started to fall in H2 2008 ▼ AEA forecasts -4% growth in RPK in 2009▼ Over a ‘normal’ baseline -4% equates to -6% loss in RPK

- 13 -
Freight is an indicator of economic health
-10
-5
0
5
10
15
20
25
19
76
19
78
19
80
19
82
19
84
19
86
19
88
19
90
19
92
19
94
19
96
19
98
20
00
20
02
20
04
20
06
20
08
% F
reig
ht
TK
gro
wth
Source: AEA
Freight traffic will weaken as recession spreads… and will not recover until economies do.
2008: -2.8%2009: - 5%
1981-83Economic
Crisis
▼Freight traffic levels started to fall mid-2008 ▼ AEA forecasts -5% growth in FTK in 2009▼ Over a ‘normal’ baseline -5% equates to -10% loss in FTK

- 14 -
Premium traffic is losing importance
Source: AEA RB2*AEA Airlines, International routes
Short haul Long haul2
1.0
17
.3
18
.1
16
.0
10
.4
10
.1
9.3
8.4
7.8
0%
10%
20%
30%
40%
50%
60%
70%
80%
90%
100%
2000 2002 2004 2006 2008
Low
Premium
14
.4
13
.2
14
.3
13
.5
13
.7
13
.9
14
.4
14
.3
14
.4
0%
10%
20%
30%
40%
50%
60%
70%
80%
90%
100%
2000 2002 2004 2006 2008
Low
Premium

- 15 -
European Capacity cuts go deep
-12
-10
-8
-6
-4
-2
0
Apr-09 May-09 Jun-09 Jul-09 Aug-09 Sep-09
% g
row
th
Number of FlightsAvailable Seat Kms
Source: Schedule analysis
European capacity cuts go deep% change in flights and seats on offer on services within Europe

- 16 -
Fewer aircraft are needed
0
1000
2000
3000
4000
5000
In Service Stored On Order On Option
nu
mb
er
of a
irc
raft
Nov-08
Feb-09
Source: ASCEND
In the last 3 months Europe's airlines have taken 102 aircraft out of service
102 aircraft taken out of
service
136 more aircraft parked
115 aircraft fewer on
order29 aircraft
more under option

- 17 -
Employment: 15,000 jobs lost already
300
350
400
450
500
20
00
20
01
20
02
20
03
20
04
20
05
20
06
20
07
20
08
& t
od
ate
Th
ou
sa
nd
s
Source: AEA Yearbook & staff research
Further Job Losses are inevitableAEA Carriers' total FTE count to 2007, announced cuts through 2008 to date
To date AEA carriers have already announced 15,000 job losses + another 5,000 positions affected by other labour cost saving measures (unpaid leave,reduced working hours,..) More are likely to follow.
40,000 job losses

- 18 -
Aviation in its entirety is losing traffic
-10
-5
0
5
10
Jan-08 Feb-08 Mar-08 Apr-08 May-08 Jun-08 Jul-08 Aug-08 Sep-08 Oct-08 Nov-08 Dec-08
%
Major Airports >25 mill/pax
Large Airports 10-25 mill/pax
Medium Airports 5-10 mill/pax
Small Airports <5 mill/pax
Source: ACI-Europe
ACI-Europe Passenger Traffic Development% month-on-month Growth rate, per Airport Category

- 19 -
Access to aircraft financing has been curtailed
The aircraft leasing sector has not been unaffected by the financial crisis. Although lease rates are falling, access to capital has become an issue which could touch airlines and manufacturers alike. The stock of white-tails and aircraft entering the market from bankruptcies will also depress the assest value of aircraft.
0
250
500
750
1000
1250
1500
1750
2000G
EC
AS
ILF
C
Avi
atio
nC
apit
al G
rou
p
AW
AS
CIT
Aer
osp
ace
Bab
cock
&B
row
n
Aer
Cap
Bo
ein
gC
apit
al C
orp
DA
E C
apit
al
RB
S A
viat
ion
Cap
ital
Nu
mb
er
of
Air
cra
ft
Current Fleet
On Order
Source: ASCEND
Aircraft Lessors were caught in the financial markets turmoil
For Sale
For Sale

- 20 -
AEA Airline financial outlook is dismal
-4
-3
-2
-1
0
1
2
3
4
5
2000 2001 2002 2003 2004 2005 2006 2007 2008e 2009f
EU
R b
n
Operating ProfitNet Profit (after Interest)
Source: AEA
AEA Airlines will once again post losses in 2009after just 5 years of profits
Forecast Loss-1.5bn to -2.5bn

- 21 -
2008 marks the beginning of recession
Fuel: Single biggest, and most volatile cost factor
Economic downturn will reduce demand increasingly
Cost factors such as airport charges, ATC likely to increase
Volume-dependent no-frills likely to maintain overcapacity
Governments could impose further taxes to fund bail-out of other sectors
EU ETS could lead to trade sanctions from third countries
Key figures 2007 2008 and beyond
Demand (RPK) +5.3% +2.0% ▼
Capacity (ASK) +4.6% +4.0%
Seat Load Factor 77.0% 75.5% ▼

- 22 -
Global recession makes it even more imperative to drive down external costs:
An ETS in 2012 – from a cap-and-trade system to a disincentive tax measure
A proliferation of national taxes
Volatility of fuel price: from 9% of our operating costs in 1998 to 34% in 2008
And ATM fragmentation costs the environment €16mln tons of CO2 and airlines € 5 bln a year
Airport charges and ATM Unit Rates will increase in 2009 despite the recession
External costs of utmost urgency
- 23 -
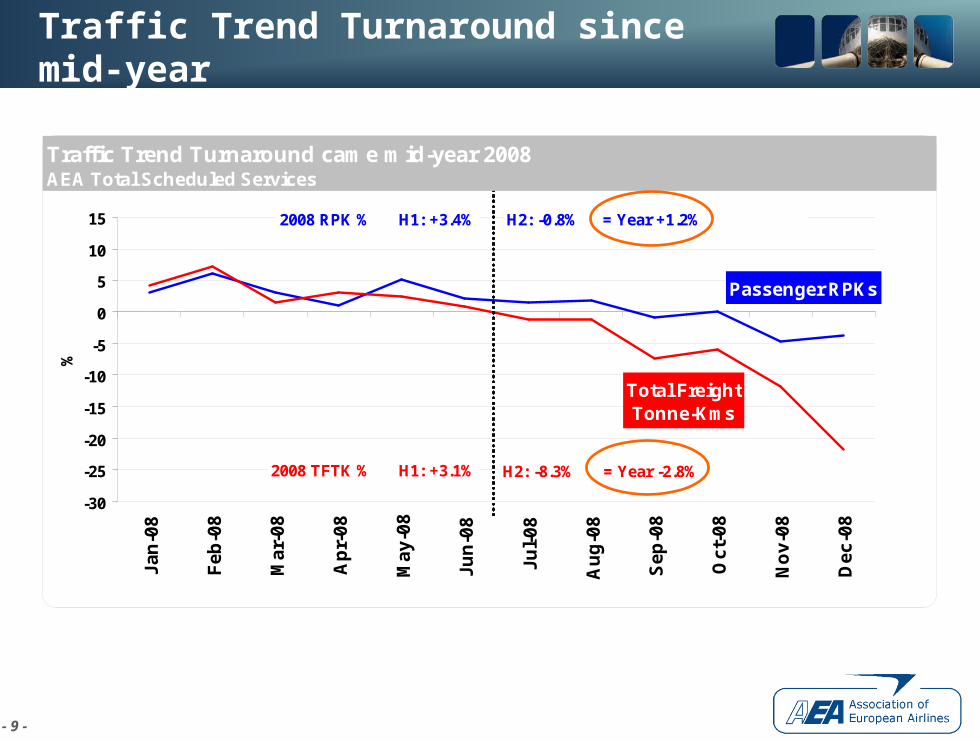
ANSP Unit Rates rise, less traffic
% Increase 2009 over 2008
-15
-10
-5
0
5
10
15
20
25
30
Slo
ve
nia
Bo
sn
ia &
He
rz.
Cze
ch
Re
p.
Cro
ati
a
Slo
va
kia
Be
lgiu
m-L
ux
.
Mo
ldo
va
Sw
ed
en
Ne
the
rla
nd
s
Sp
ain
Hu
ng
ary
Ire
lan
d
Fra
nc
e
De
nm
ark
Alb
an
ia
Sw
itze
rla
nd
Ge
rma
ny
Ro
ma
nia
Po
lan
d
Po
rtu
ga
l
Sp
ain
Ca
na
rie
s
Po
rtu
ga
l S.
Se
rbia
-Mo
nt.
Ma
lta
Au
str
ia
Fin
lan
d
Tu
rke
y
Gre
ec
e
Ita
ly
Lit
hu
an
ia
No
rwa
y
FY
RO
M
Bu
lga
ria
UK
Cy
pru
s
% c
ha
ng
e 2
00
9 o
ver
20
08
Source: Eurocontrol
European ATC Unit Rates will rise by 3.2% in 2009, despite reduced traffic levels
Average increase of +3.2%in unit rates for ATC Charges
- 24 -
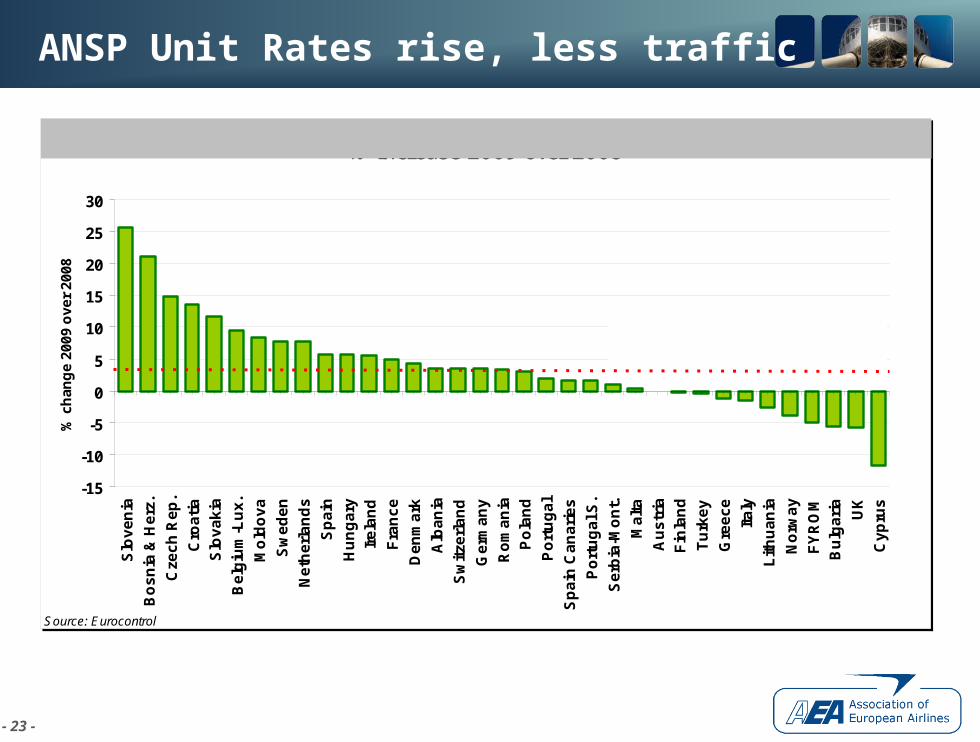
Europe needs a Single European Sky
For passengers: delays caused by bottlenecks in the sky, circuitous
routings and holding patterns above airports…
For the environment: unnecessary emissions of 16 million tons of CO2 a
year
For the airlines: unnecessary costs of around €5 billion a year

- 25 -
EU ATM : more costs… inferior performance
1 ATC Organisation (civil + mil.)21 En-Route Centres1 Operating System
ATM Airspace: 9,8 million km²
USAUSAATM Airspace: 10,5 million km²
47 ATC Organisations (civil + mil.)
58 En-Route Centres22 Operating Systems
EuropeEurope
900 Movements per Air Traffic Controller
$400 ATM Cost / Flight
480 Movements per Air Traffic Controller
$800 ATM Cost / Flight

- 26 -
Airport Charges increases 2008/2009

- 27 -
Buying 15% of carbon allocation will massively increase the cost base → additional financial hardship;
Increase of administrative burden with regard to the MRV guidelines + additional requirements by individual Member States;
ETS will fundamentally change the operating economics of every route and flight: Many communities will lose service;
International distortion of competition;
Some non-EU competitors will see traffic diversion as a gift; for others, the EU ETS will be unacceptable, and will spark trade wars.
Consequences of ETS post 2012

- 28 -
2009 crisis management to ensureEurope’s global sustainable competitiveness
Europe as a region must confront unnecessary regulatory burdens:
ETS & MRV as economic instrument
Proliferation of national taxes (UK, NL, Ireland)
Non-safety EASA rulemaking proposals
Surge of costs for security measures
Further unnecessary administrative burdens
Role of EU institutions in airline restructuring process
Structural inefficiencies of the value chain to be addressed jointly:
Cost efficiency of airport services
Cost efficiency of ANSP services
Sufficient and well organised infrastructure
Review of market orientation of all aviation service providers