Embed Size (px)
Citation preview

第二章 细胞生物学研究方法
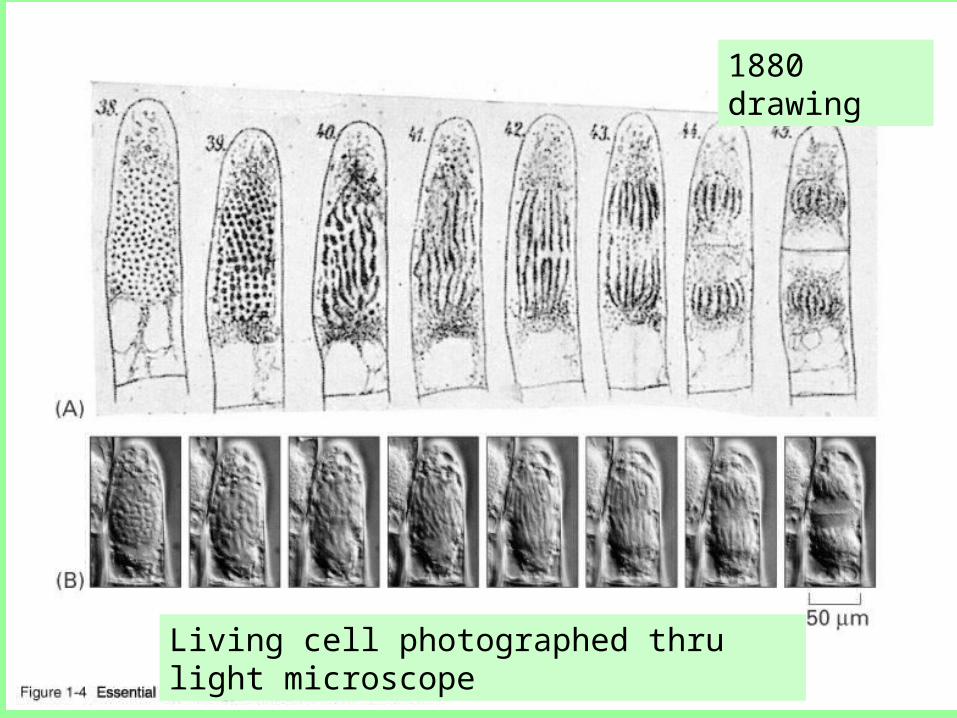
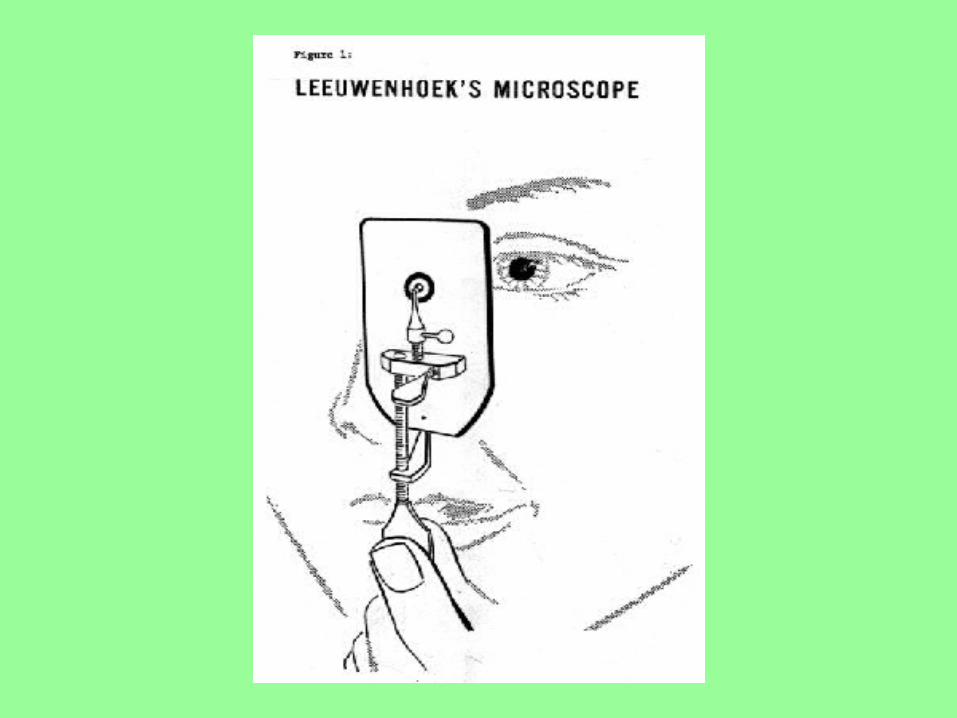
01_04_Early microscopes.jpg1880 drawing
Living cell photographed thru light microscope
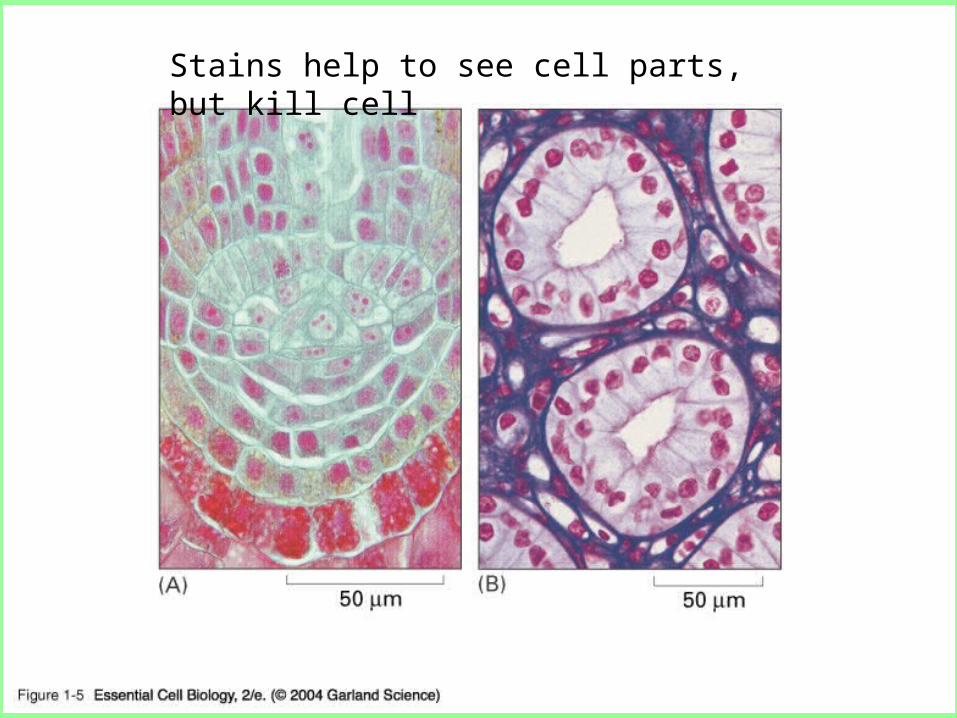
01_05_Cells form tissues.jpgStains help to see cell parts, but kill cell
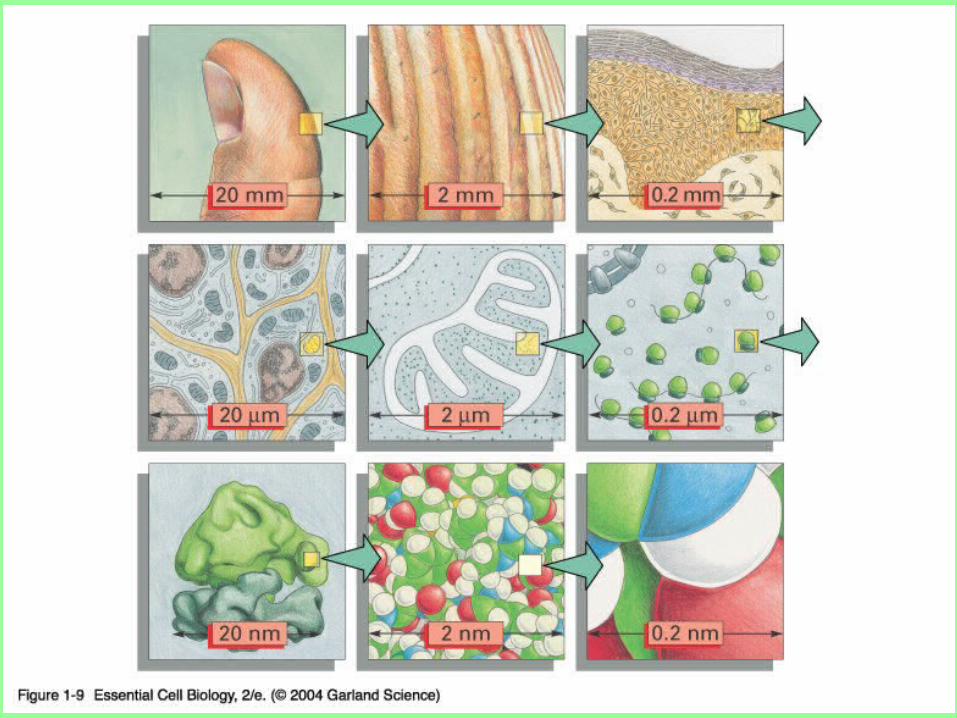
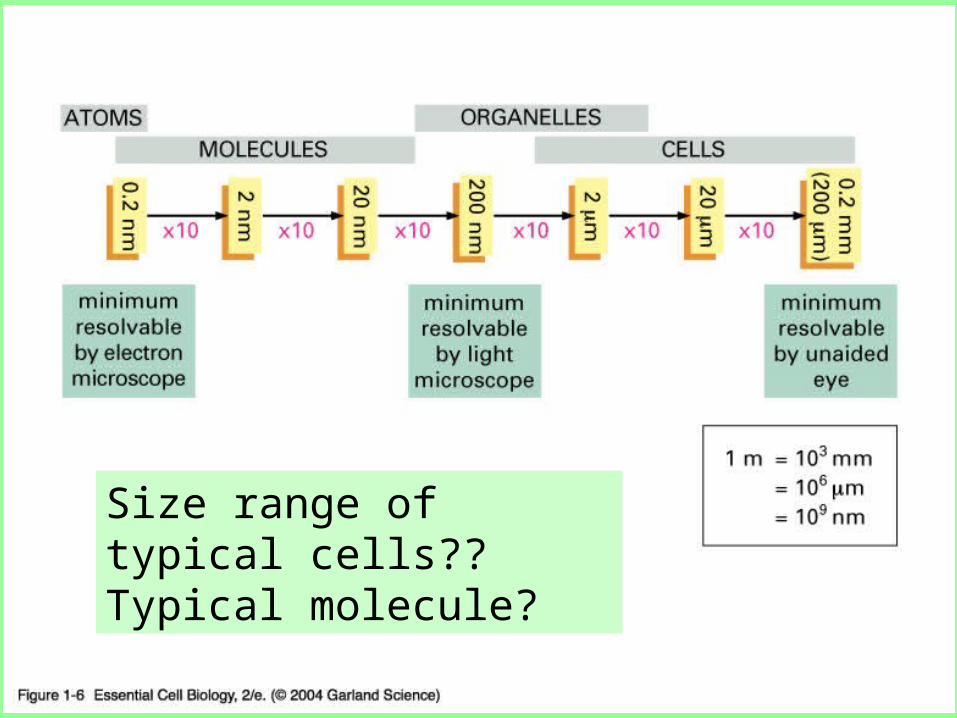
01_09_Scale.jpg
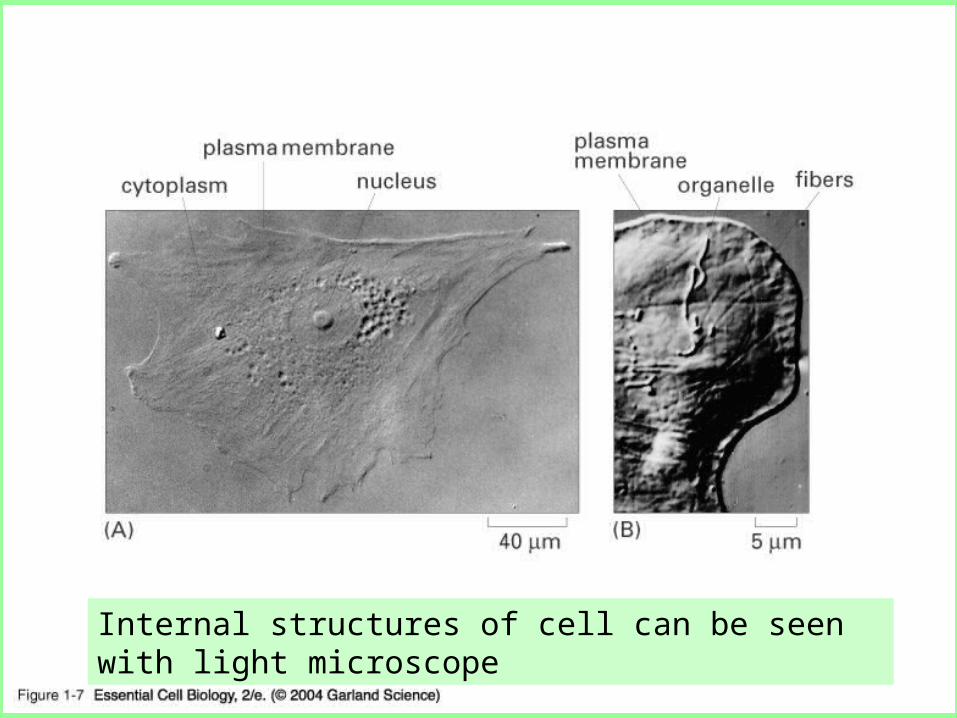
01_07_Internal structures.jpg
Internal structures of cell can be seen with light microscope
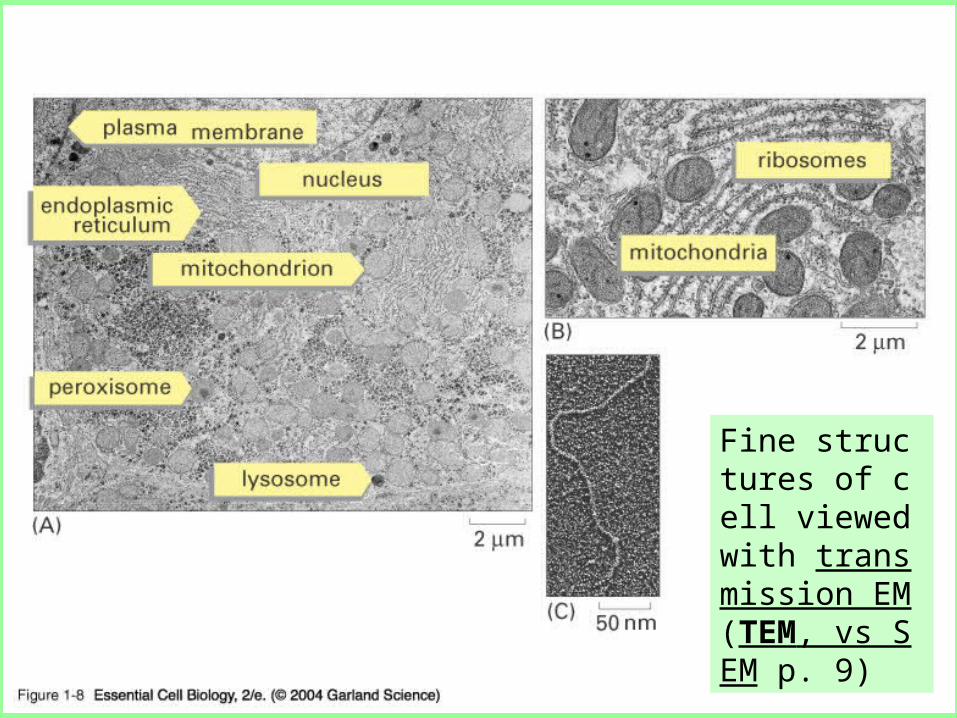
01_08_TEM.jpg
Fine structures of cell viewed with transmission EM (TEM, vs SEM p. 9)
Visualizing Cells
• Cells are small and complex
Typical cell 10 -20 μm in diameter (1/5th size of smallest particle seen by naked eye)
Resolution of cells is achieved by microscopy
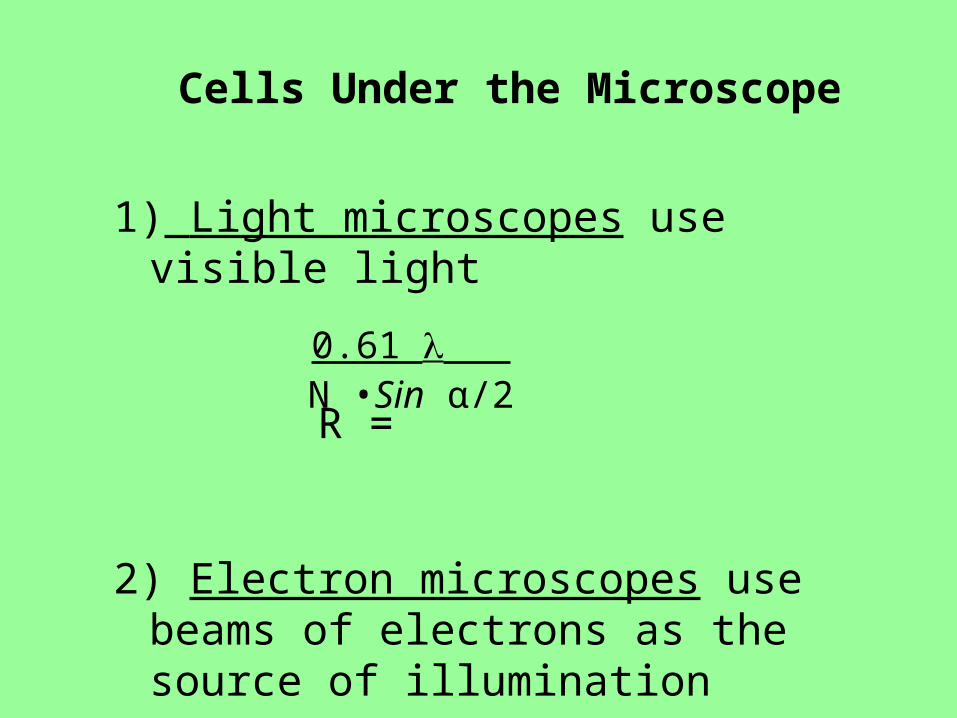
Cells Under the Microscope
1) Light microscopes use visible light
R =
2) Electron microscopes use beams of electrons as the source of illumination
0.61 N •Sin α/2
Microscopy technologies
Light microscopy(1600’s)Bright fieldPhase contrastNomarski
Electron microscopy (1930’s)Scanning EMTransmission EM
Fluorescence microscopy (1911)FluorescenceDeconvolutionConfocal
01_06_What can we see.jpg
Size range of typical cells?? Typical molecule?
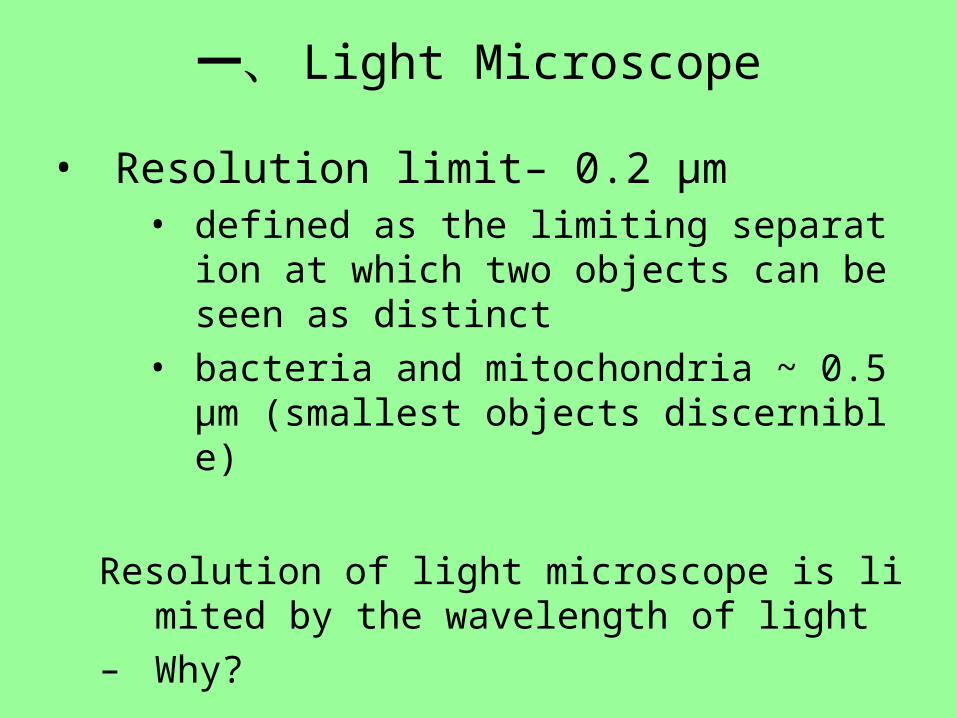
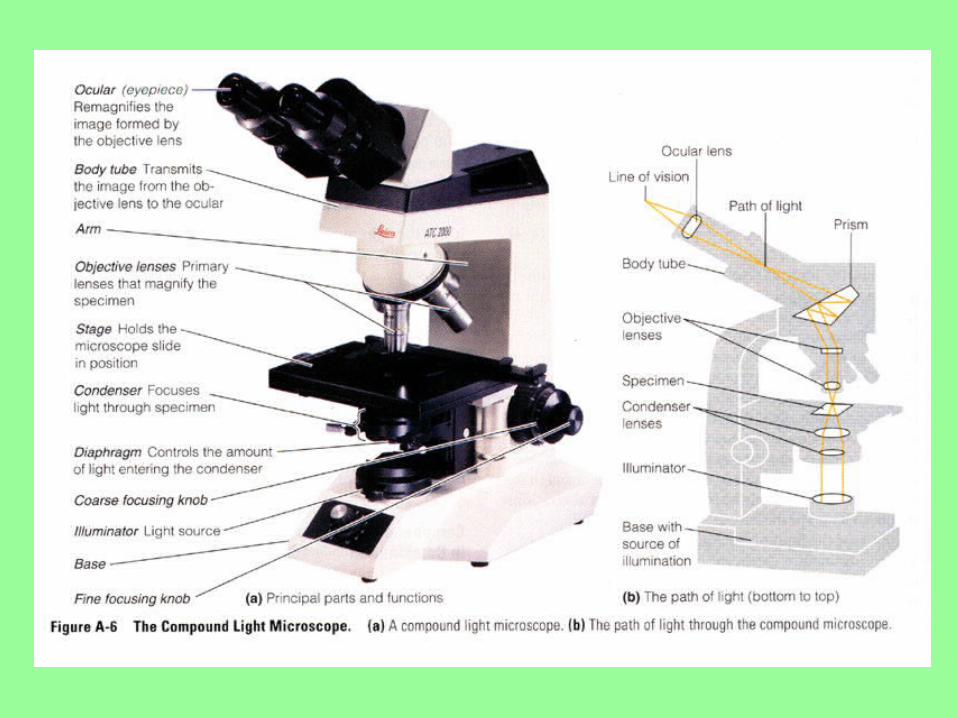
一、 Light Microscope
• Resolution limit– 0.2 μm• defined as the limiting separation at which two
objects can be seen as distinct• bacteria and mitochondria ~ 0.5 μm (smallest o
bjects discernible)
Resolution of light microscope is limited by the wavelength of light
– Why?
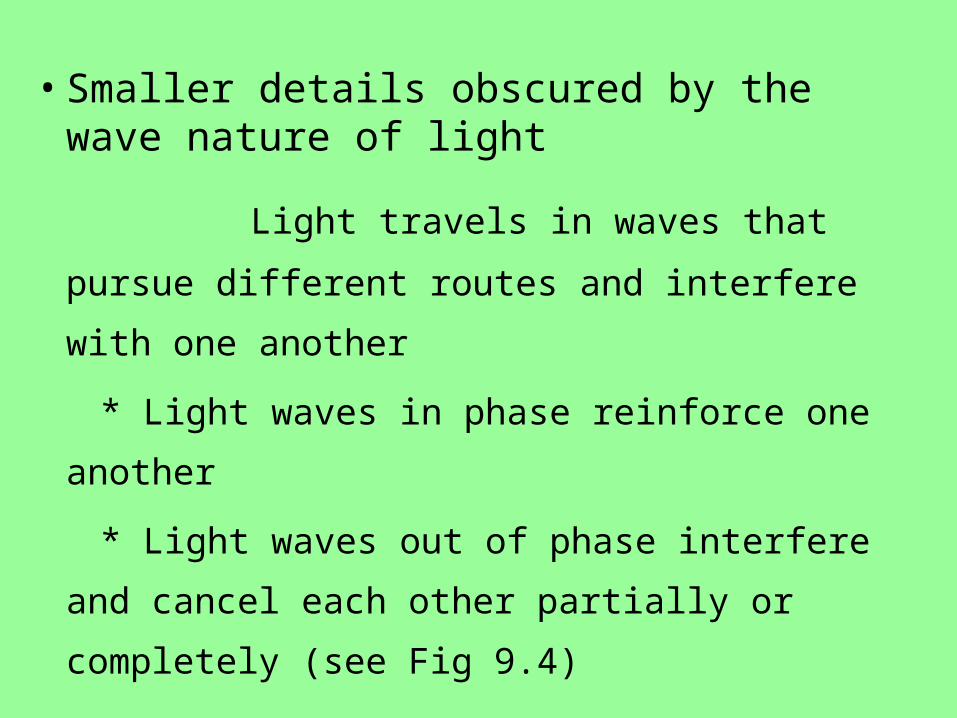
• Smaller details obscured by the wave nature of light
Light travels in waves that pursue different
routes and interfere with one another
* Light waves in phase reinforce one another
* Light waves out of phase interfere and cancel
each other partially or completely (see Fig 9.4)
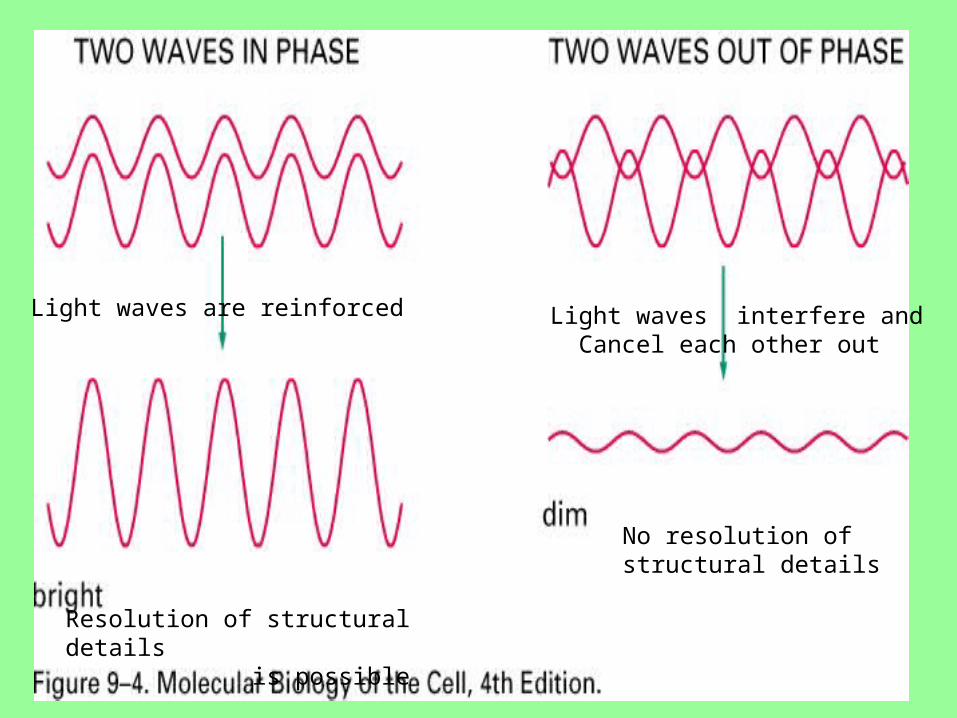
Light waves are reinforced
Resolution of structural details is possible
Light waves interfere and Cancel each other out
No resolution of structural details
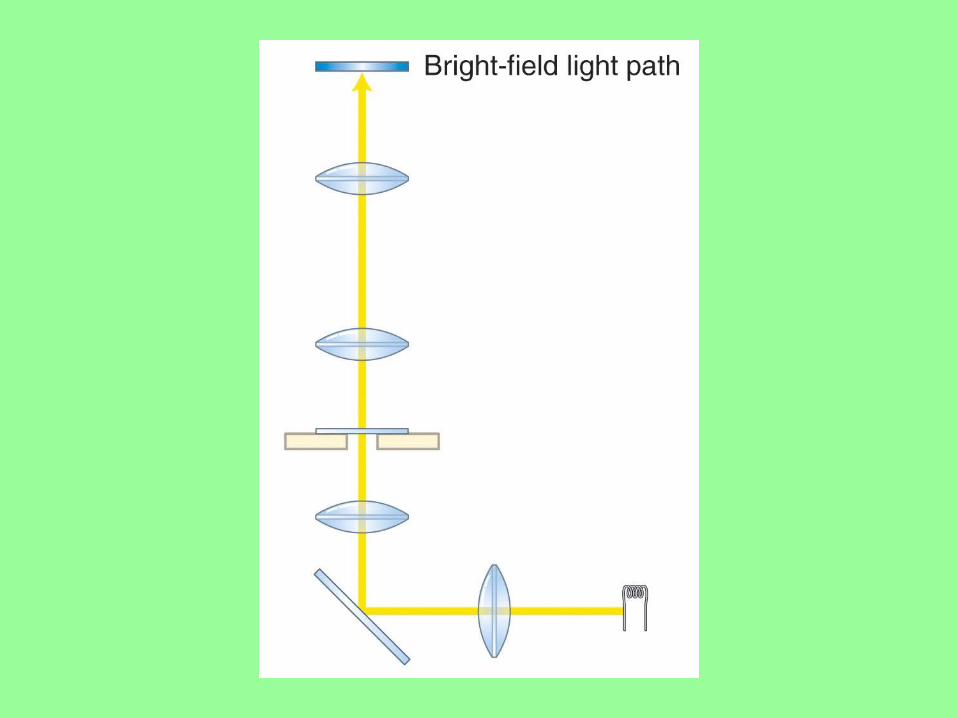
1. Light field mucroscope
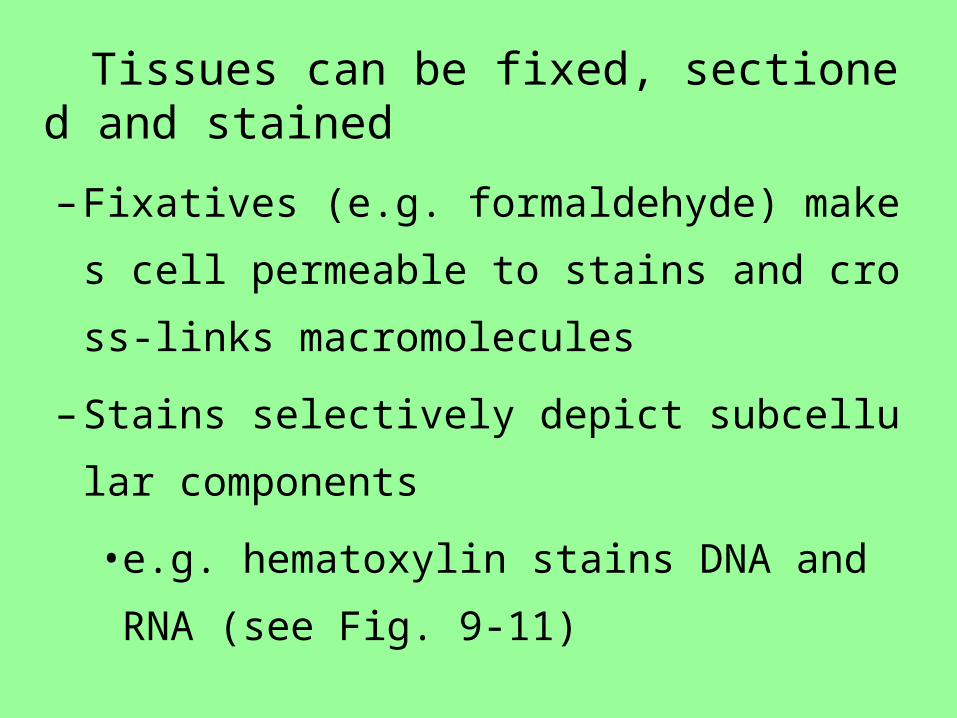
Tissues can be fixed, sectioned and stained
– Fixatives (e.g. formaldehyde) makes cell perme
able to stains and cross-links macromolecules
– Stains selectively depict subcellular component
s
• e.g. hematoxylin stains DNA and RNA (see F
ig. 9-11)
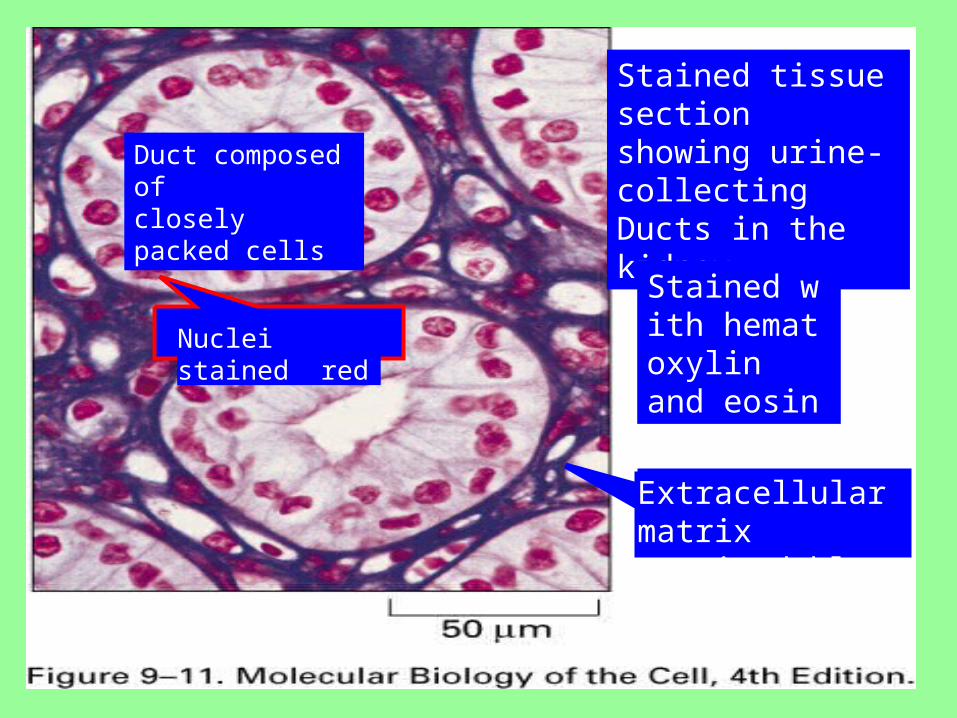
Stained tissue sectionshowing urine-collecting Ducts in the kidney
Stained with hematoxylin and eosin
Duct composed of closely packed cells
Nuclei stained red
Extracellular matrix stained blue
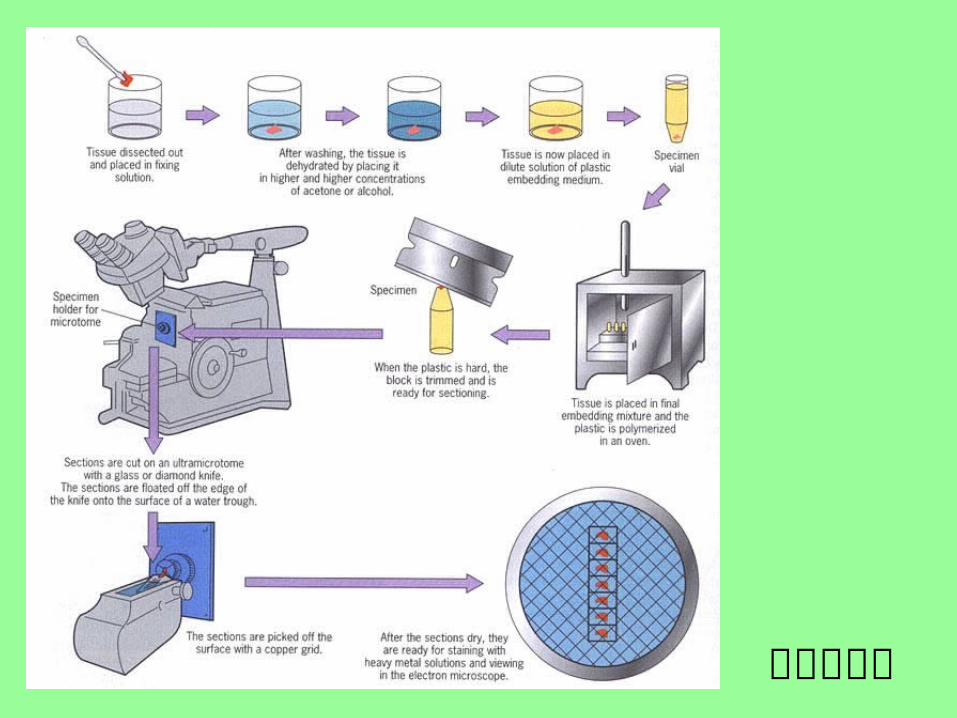
切片流程图
2. Dark field microscope
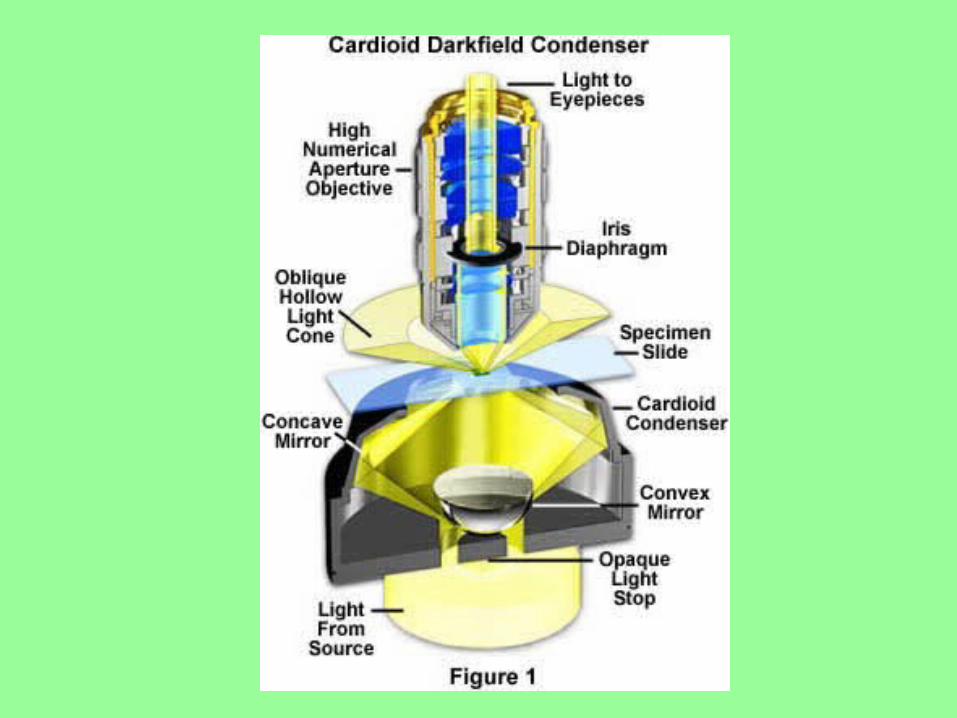
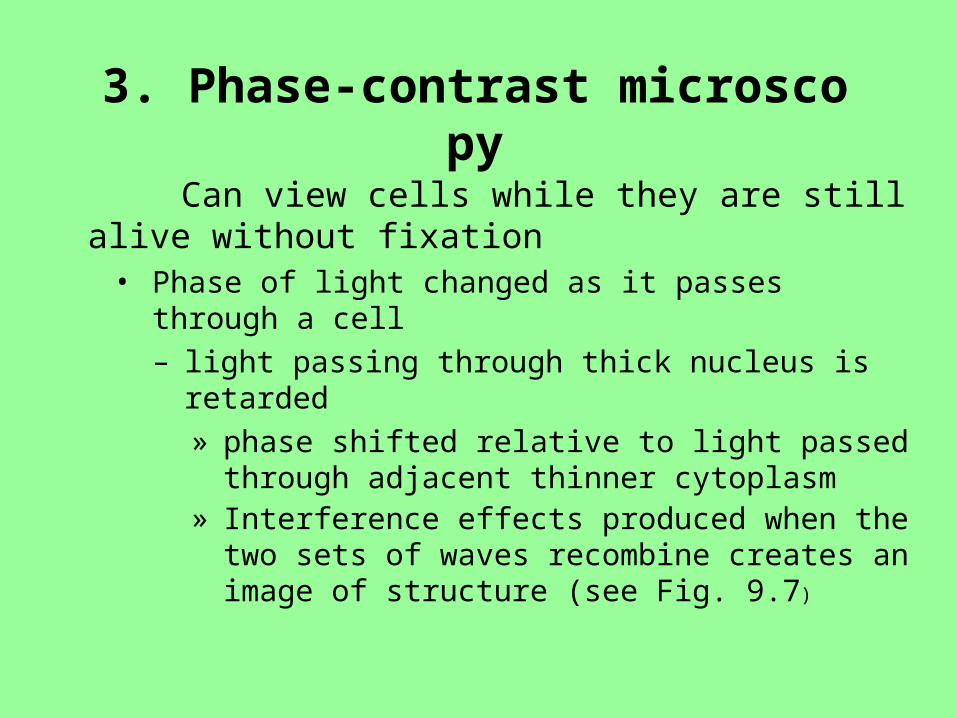
Can view cells while they are still alive without fixation
• Phase of light changed as it passes through a cell– light passing through thick nucleus is retarded
» phase shifted relative to light passed through adjacent thinner cytoplasm
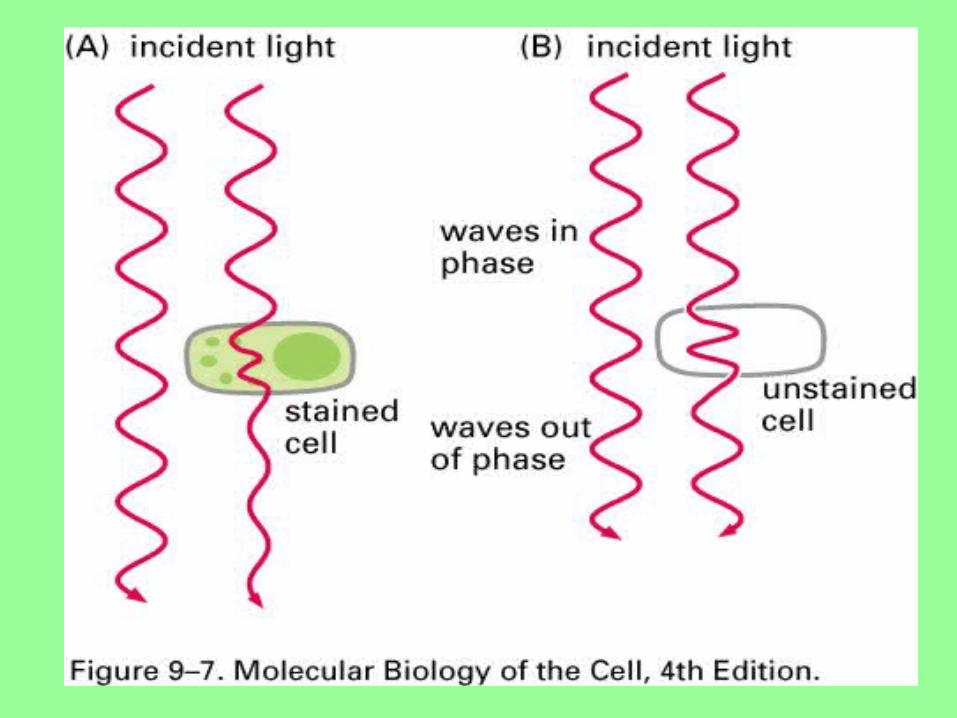
» Interference effects produced when the two sets of waves recombine creates an image of structure (see Fig. 9.7)
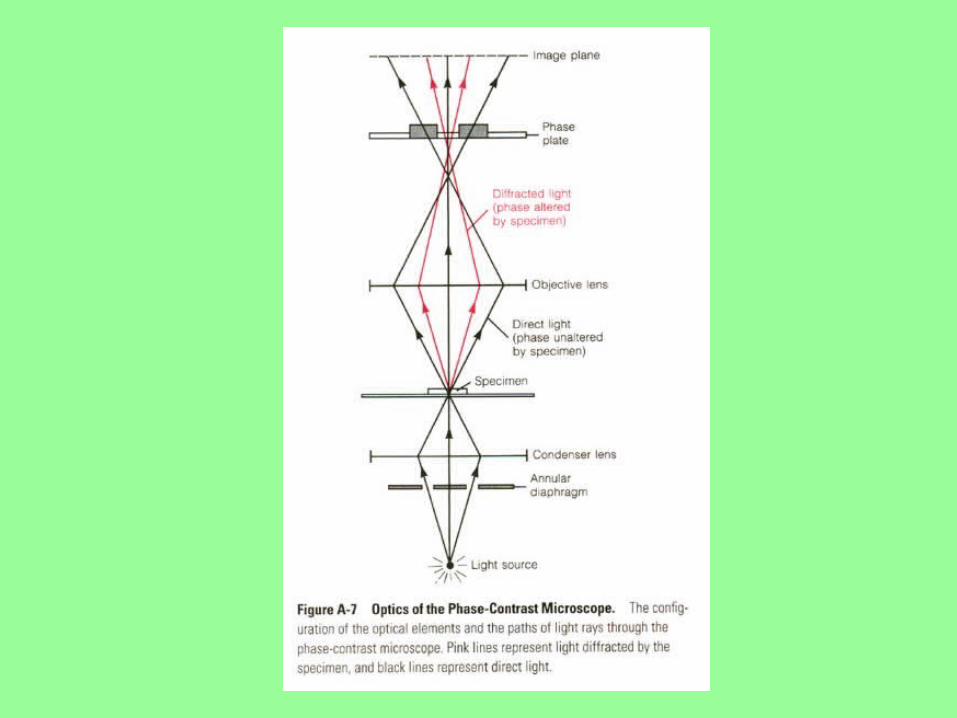
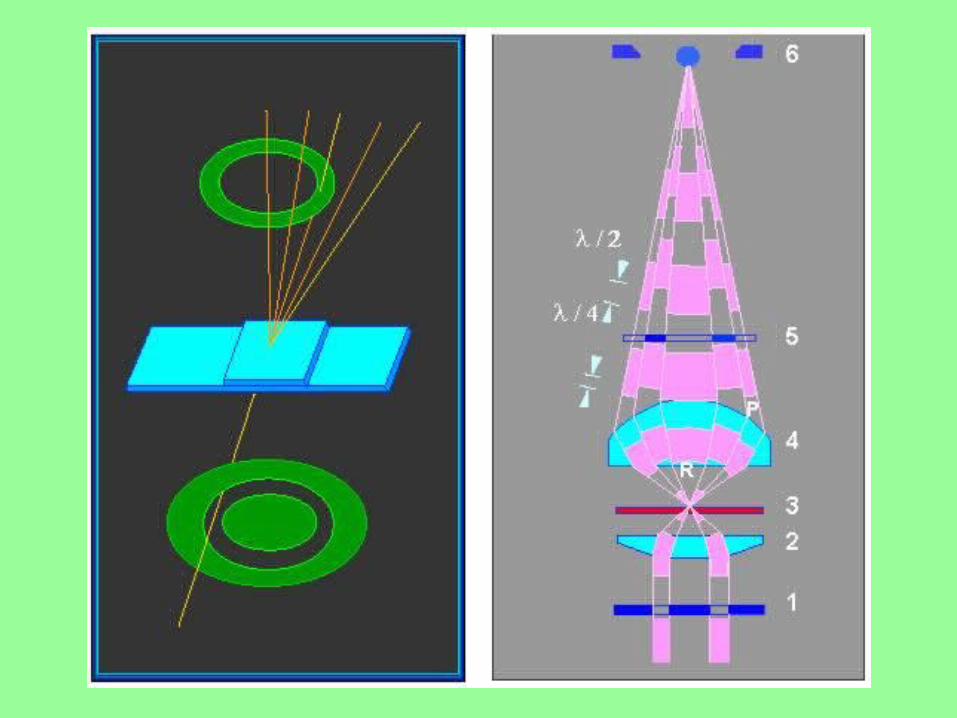
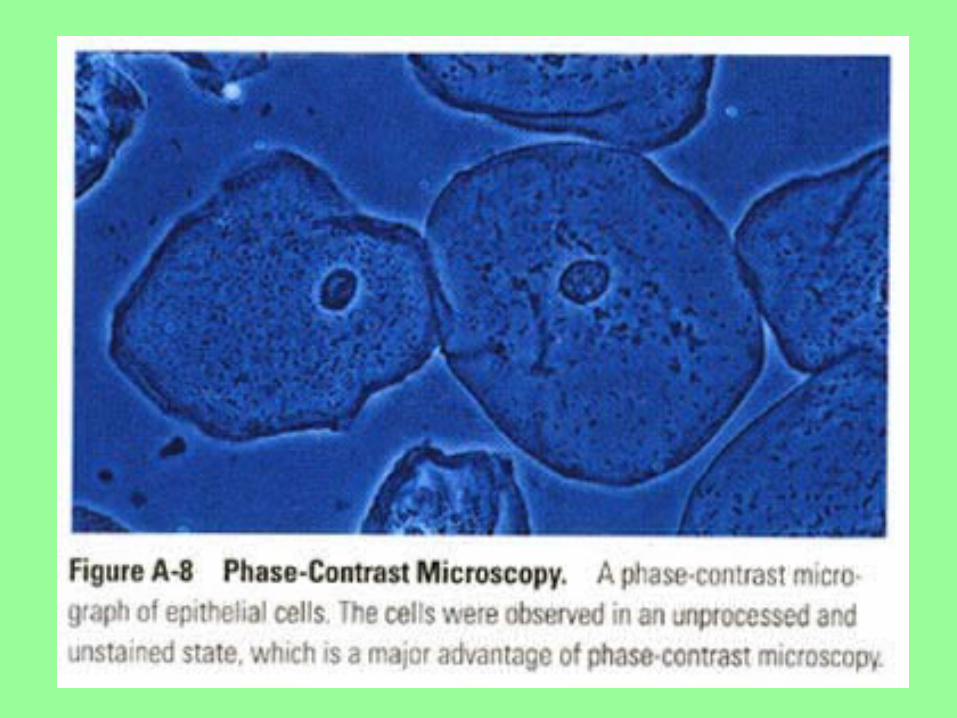
3. Phase-contrast microscopy
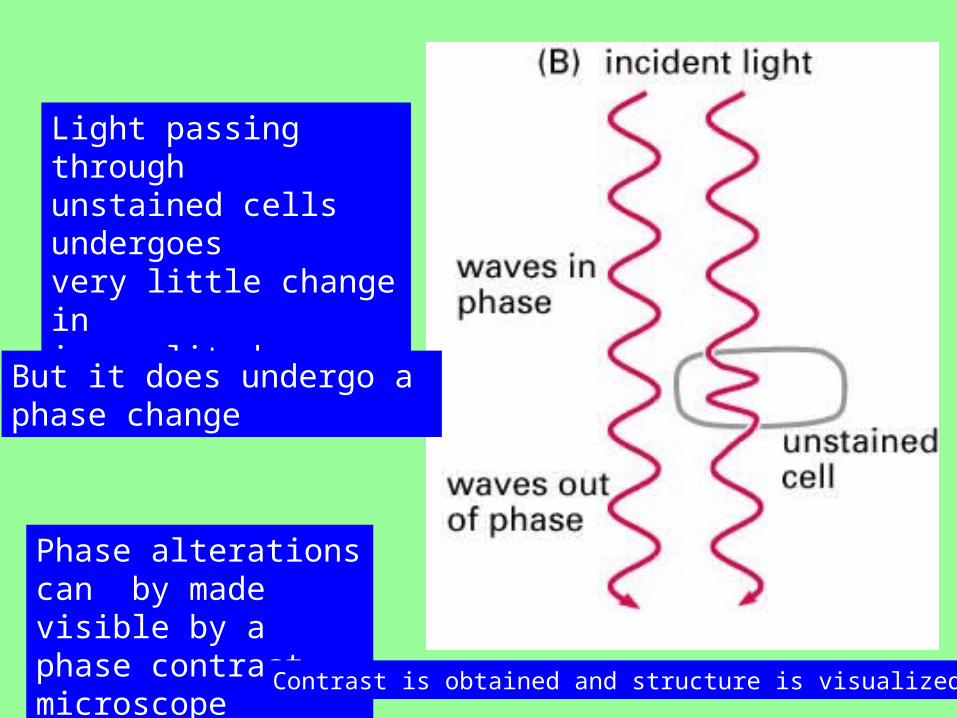
Light passing throughunstained cells undergoesvery little change in in amplitude
But it does undergo a phase change
Phase alterations can by made visible by a phase contrast microscope
Contrast is obtained and structure is visualized
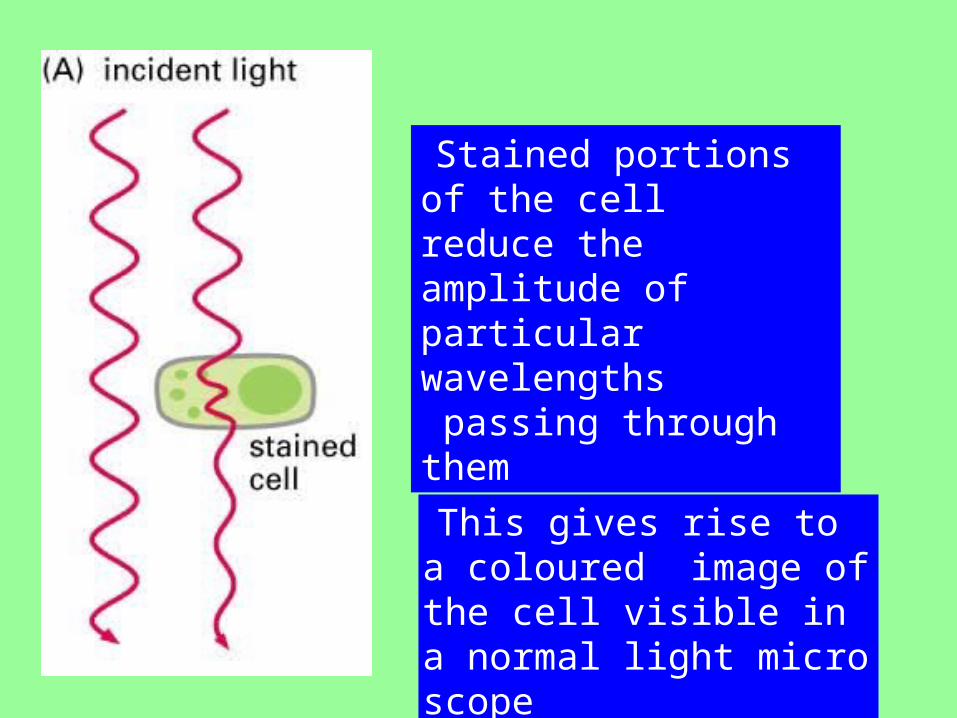
Stained portions of the cell reduce the amplitude of particular wavelengths passing through them
This gives rise to a coloured image of the cell visible in a normal light microscope
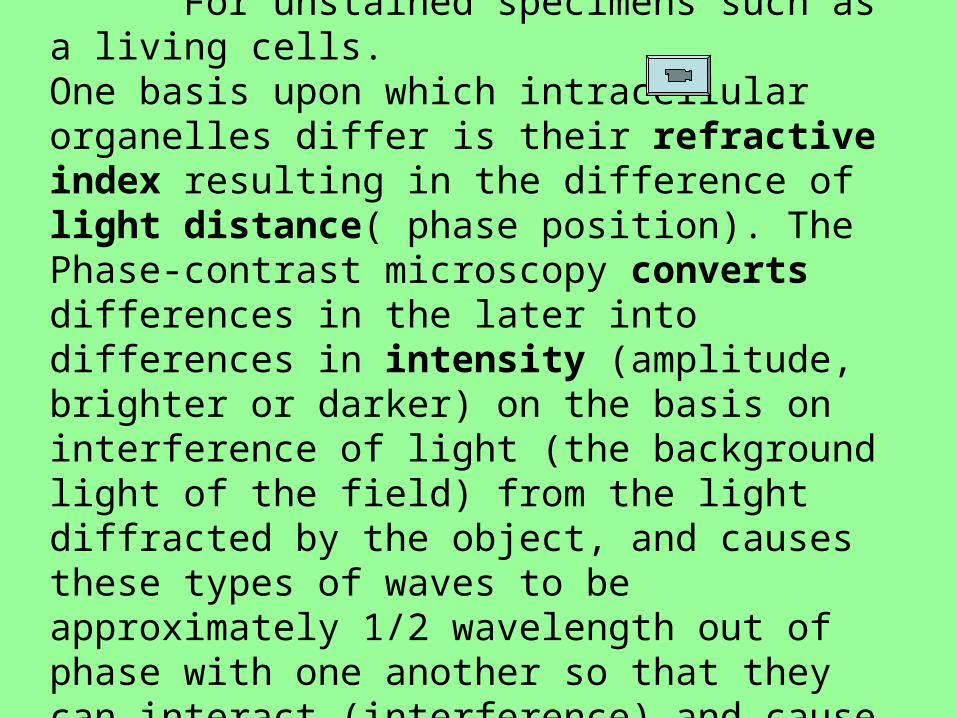
Phase-contrast microscopy For unstained specimens such as a living cells.One basis upon which intracellular organelles differ is their refractive index resulting in the difference of light distance( phase position). The Phase-contrast microscopy converts differences in the later into differences in intensity (amplitude, brighter or darker) on the basis on interference of light (the background light of the field) from the light diffracted by the object, and causes these types of waves to be approximately 1/2 wavelength out of phase with one another so that they can interact (interference) and cause changes in intensity.
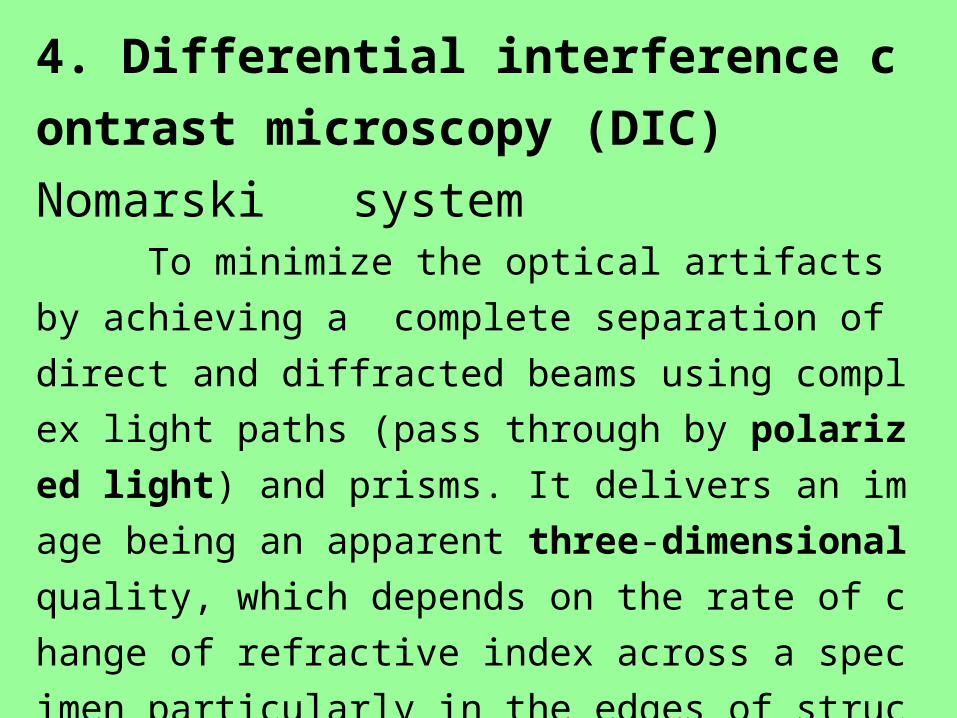
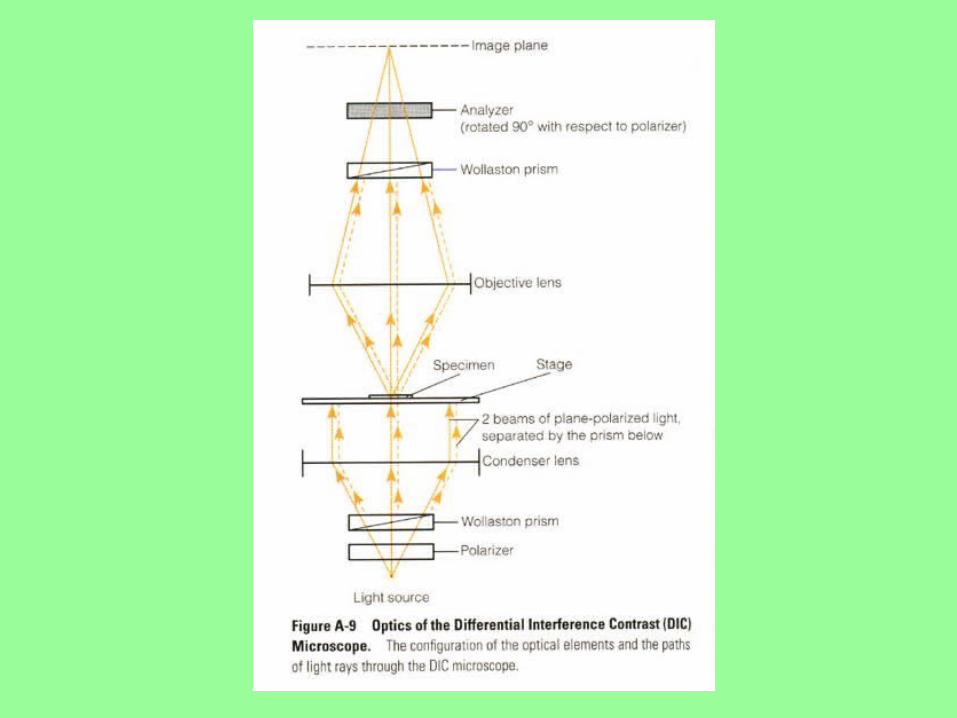
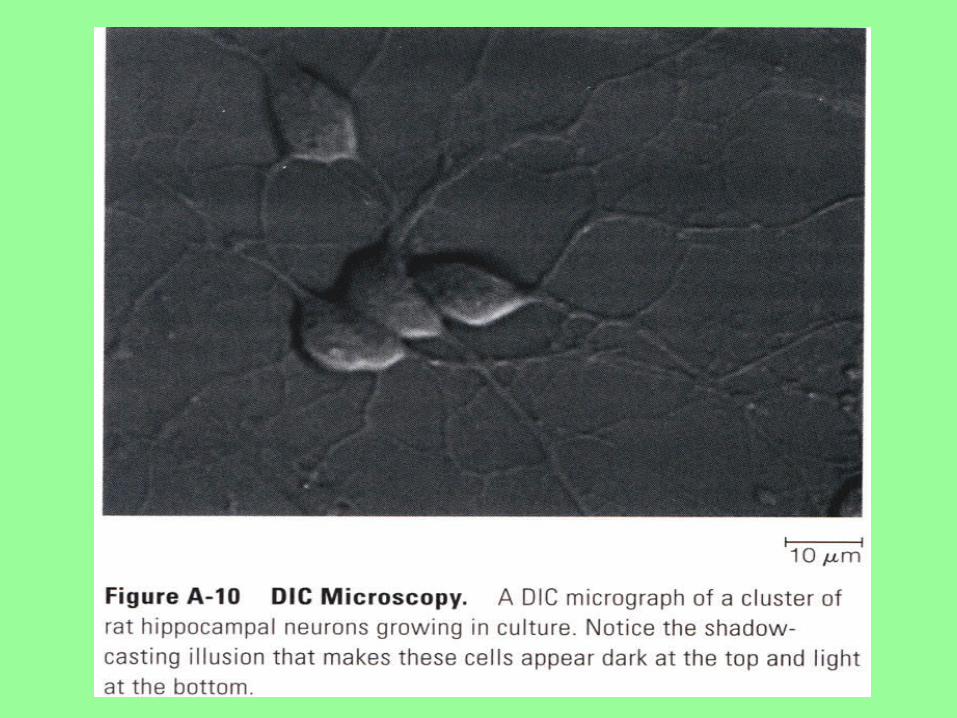
4. Differential interference contrast micros
copy (DIC) Nomarski system To minimize the optical artifacts by achieving a comple
te separation of direct and diffracted beams using complex
light paths (pass through by polarized light) and prisms. It
delivers an image being an apparent three-dimensional qu
ality, which depends on the rate of change of refractive ind
ex across a specimen particularly in the edges of structure.
偏振光经合成后,使样品中厚度上的微小区别转化成明暗区别,增加了样品反差且具有立体感。适于研究活细胞中较大的细胞器
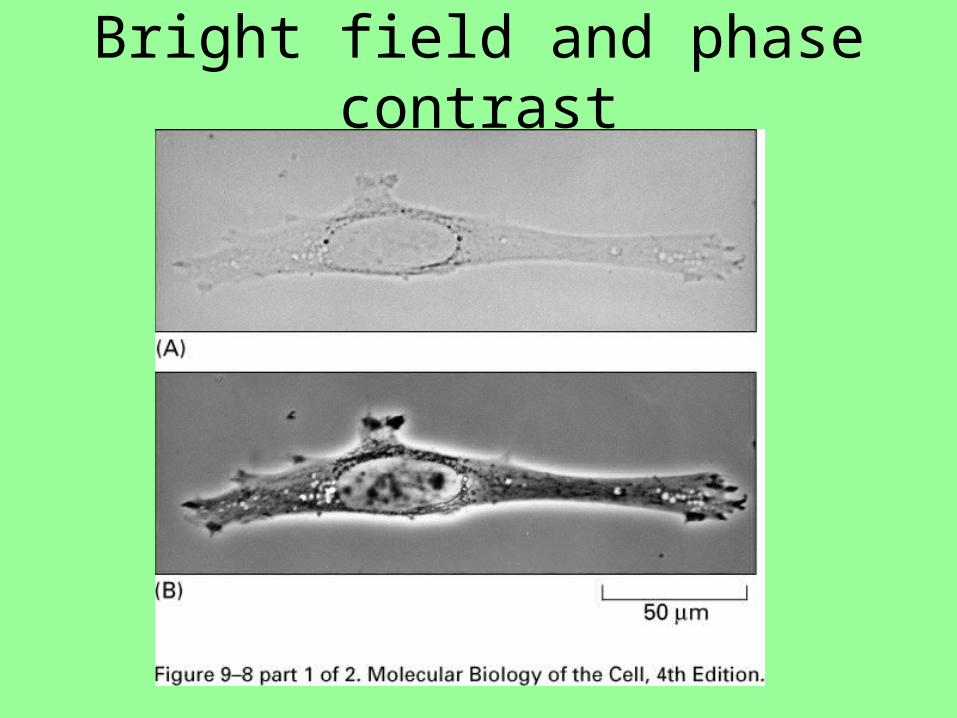
Bright field and phase contrast
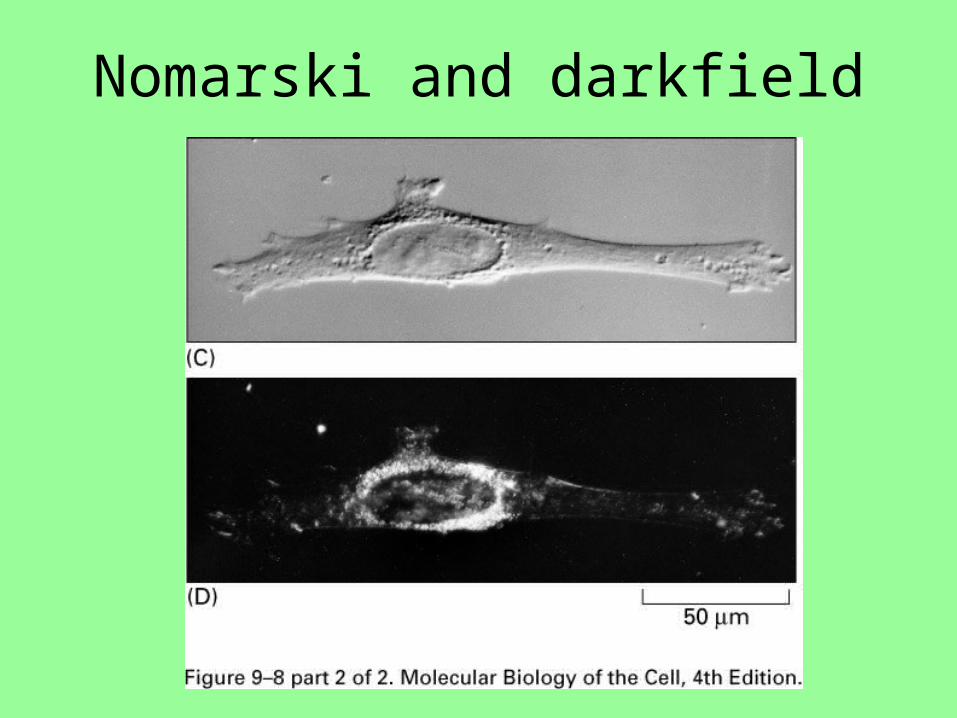
Nomarski and darkfield
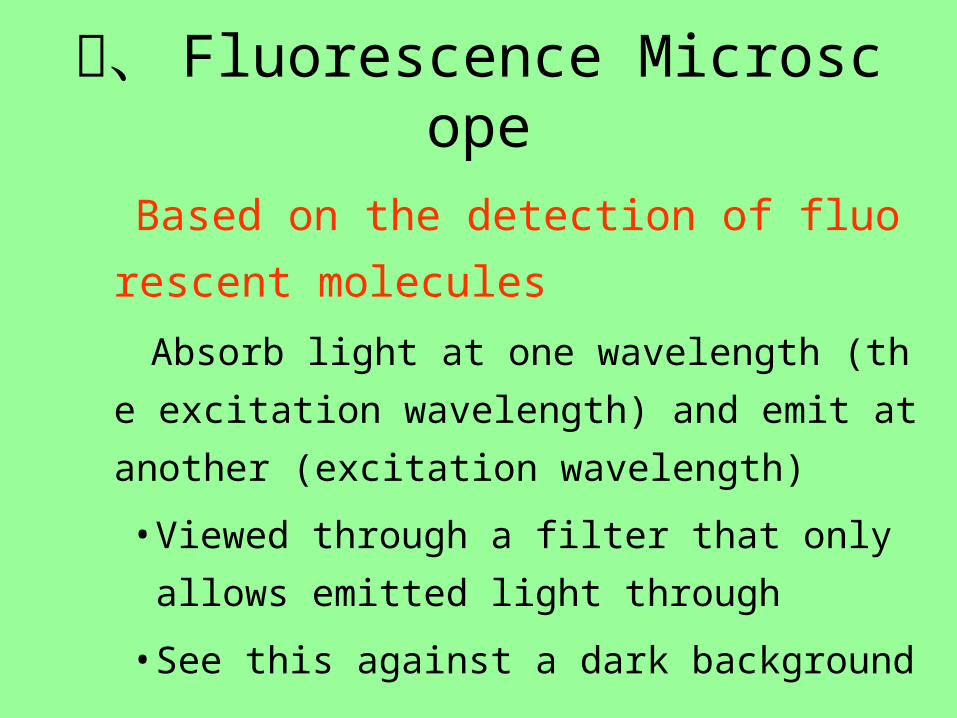
二、 Fluorescence Microscope
Based on the detection of fluorescent mole
cules
Absorb light at one wavelength (the excitation w
avelength) and emit at another (excitation wavel
ength)
• Viewed through a filter that only allows emitte
d light through
• See this against a dark background
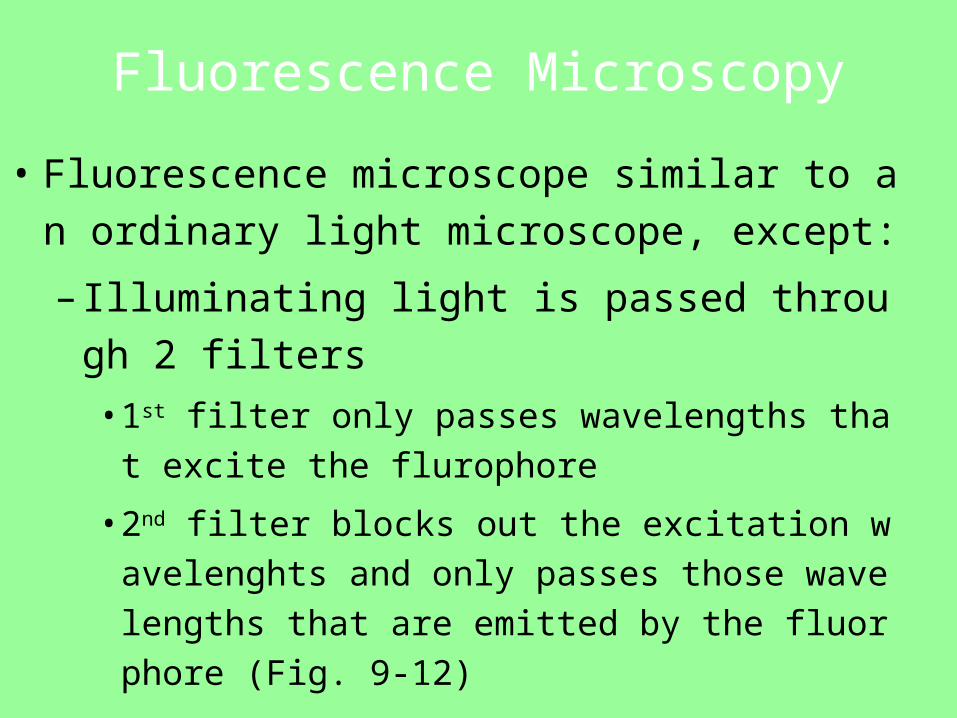
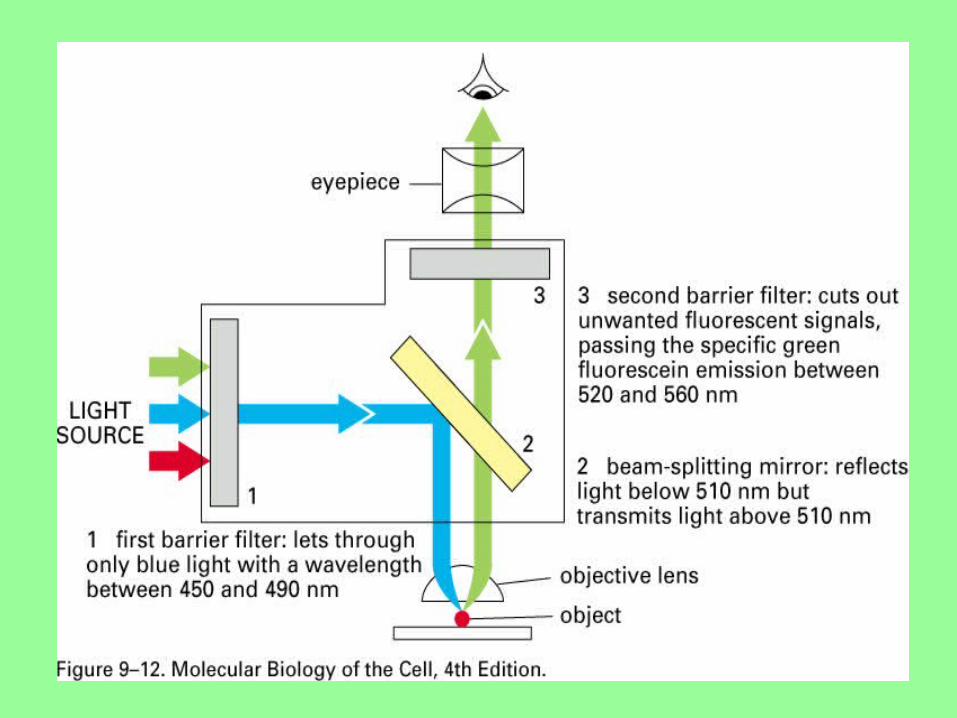
Fluorescence Microscopy
• Fluorescence microscope similar to an ordinary li
ght microscope, except:
– Illuminating light is passed through 2 filters
• 1st filter only passes wavelengths that excite th
e flurophore
• 2nd filter blocks out the excitation wavelenghts
and only passes those wavelengths that are e
mitted by the fluorphore (Fig. 9-12)
Fluorescence Microscopy
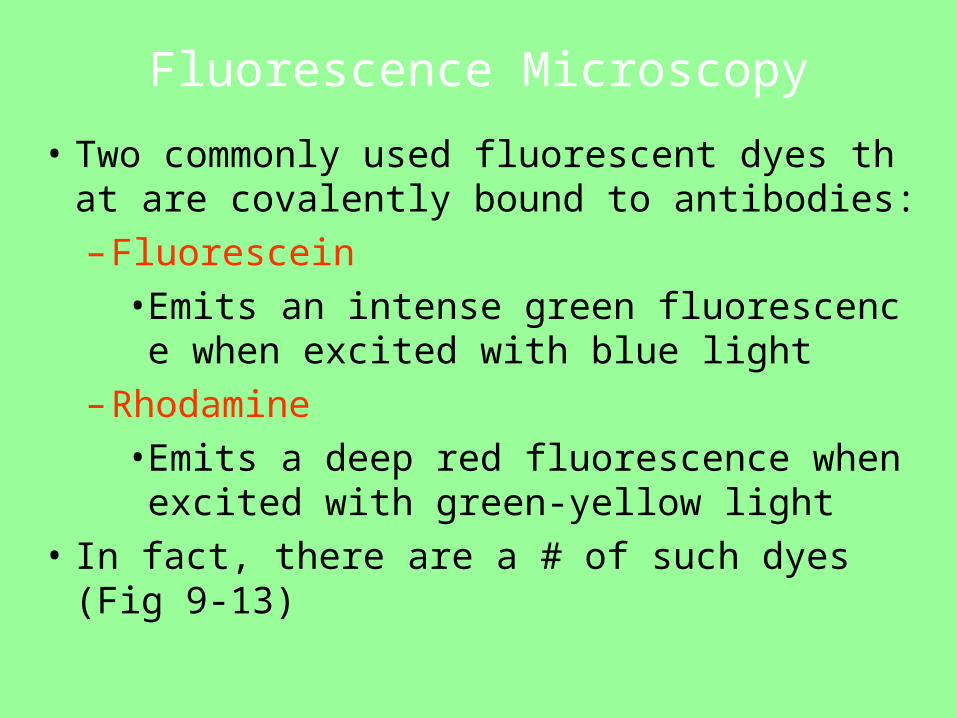
• Two commonly used fluorescent dyes that are covalently bound to antibodies:
– Fluorescein
• Emits an intense green fluorescence when excited with blue light
– Rhodamine
• Emits a deep red fluorescence when excited with green-yellow light
• In fact, there are a # of such dyes (Fig 9-13)
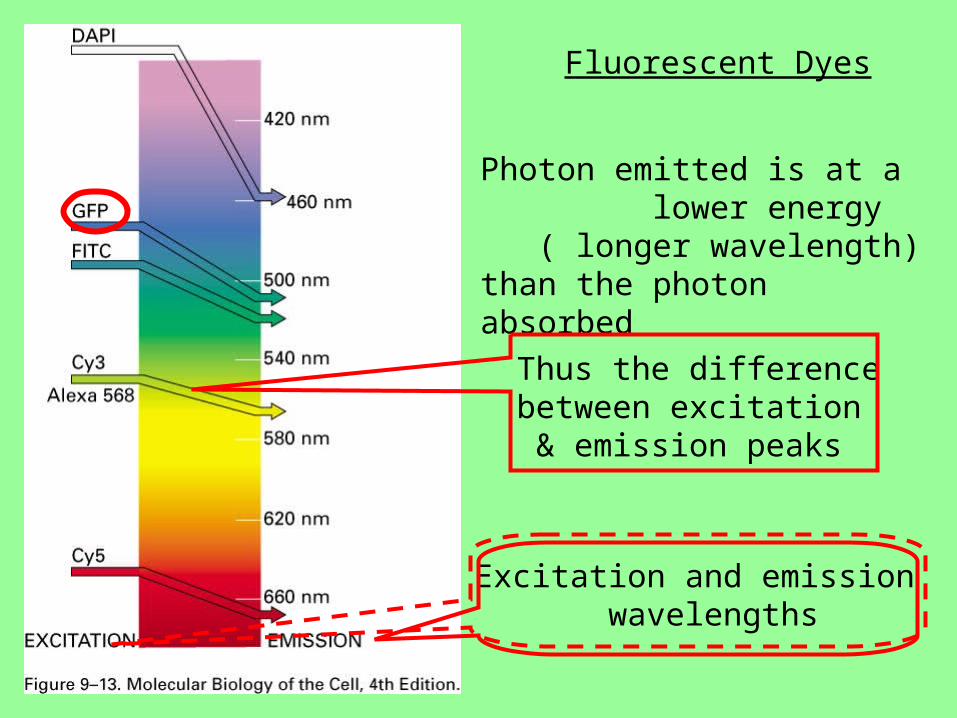
Fluorescent Dyes
Excitation and emission wavelengths
Photon emitted is at a lower energy ( longer wavelength) than the photon absorbed
Thus the differencebetween excitation & emission peaks
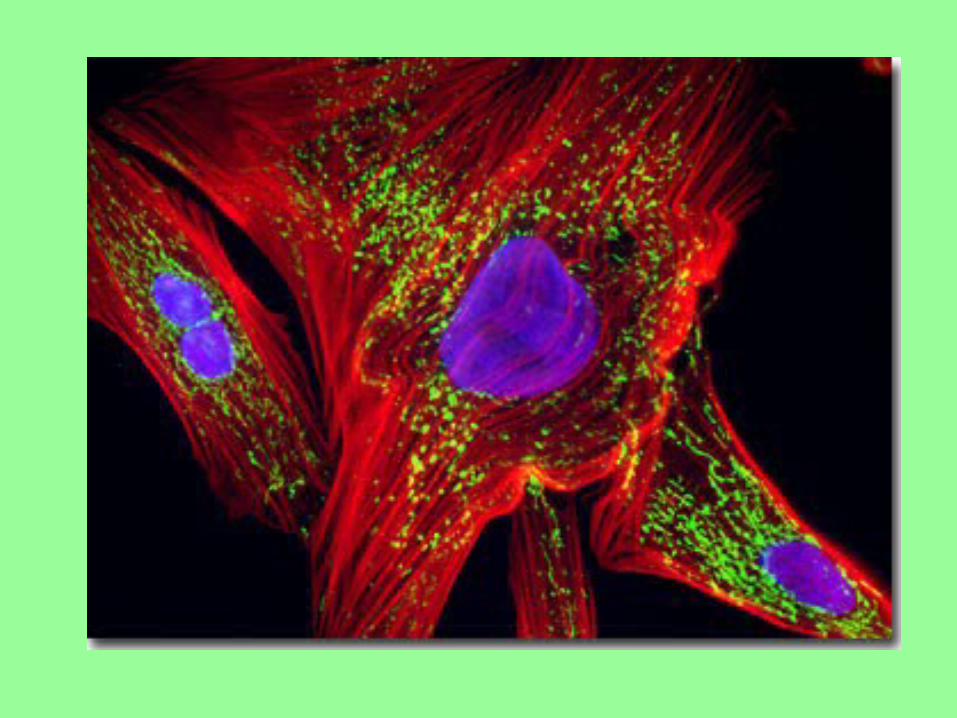
• Fluorescence microscope often used to
detect specific proteins or other molecules
in cells
e.g. use of antibodies to which specific
fluorescent dyes have been covalently
attached
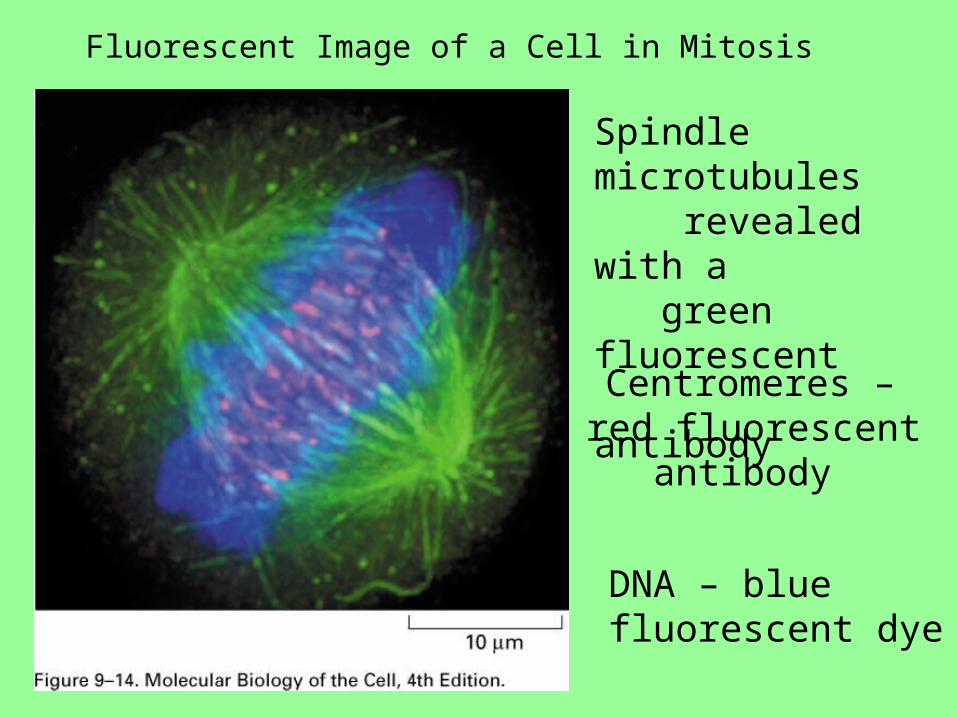
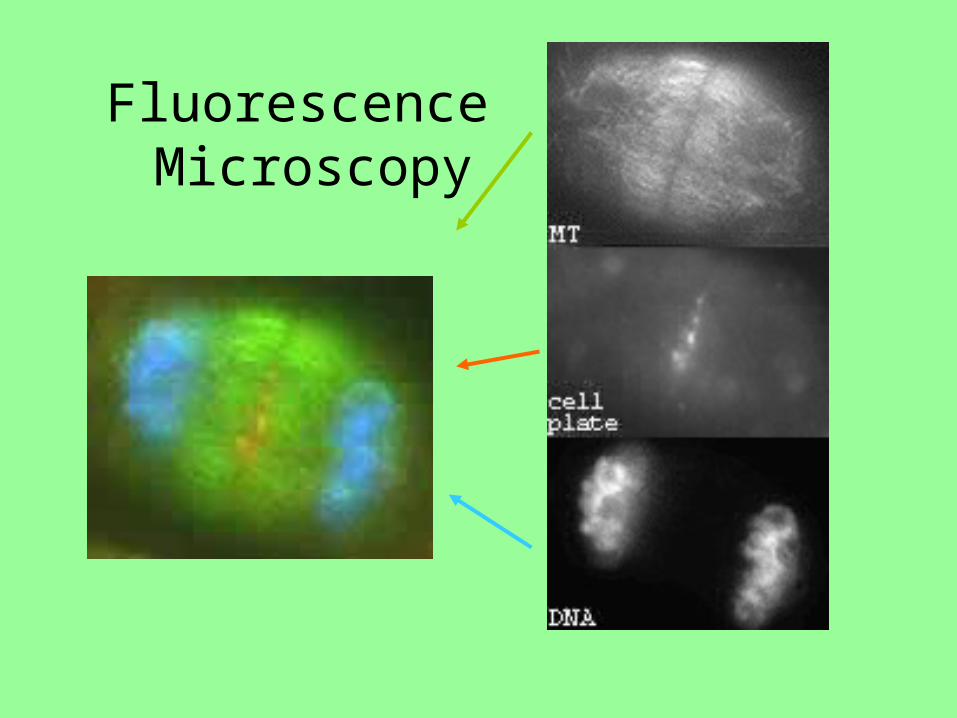
Fluorescent Image of a Cell in Mitosis
Spindle microtubules revealed with a green fluorescent antibody
Centromeres –red fluorescent antibody
DNA – bluefluorescent dye
三、 Confocal Microscopy
Emitted light from regions out of the
plane of focus is out of focus at the pinhole
and largely excluded
Confocal Microscopy
• For ordinary light microscopy, the tissue slic
ed into sections
– Sectioning results in loss of information in the 3rd dimension
• As well, optical microscope focussed on a sp
ecific focal plane
–Parts above and below the focal plane ar
e illuminated, but out of focus
Confocal Microscopy
• Confocal microscope allows 3 dimensional imaging by manipulation of light before it is measured– Uses fluorscence optics
• Does not illuminate the whole specimen simultaneously.
• Rather, uses a laser to focus a spot of light onto a single point at a specific depth in the specimen
• This is possible because of the power of a laser beam
Confocal Microscopy
• Emitted fluorescence collected and brought
to an image on the detector
– Pinhole aperture placed in front of the detector
at a position confocal with the illuminating pinho
le
• i.e. precisely where the rays from the illumina
ted point in the specimen come into focus (Fi
g. 9-18)
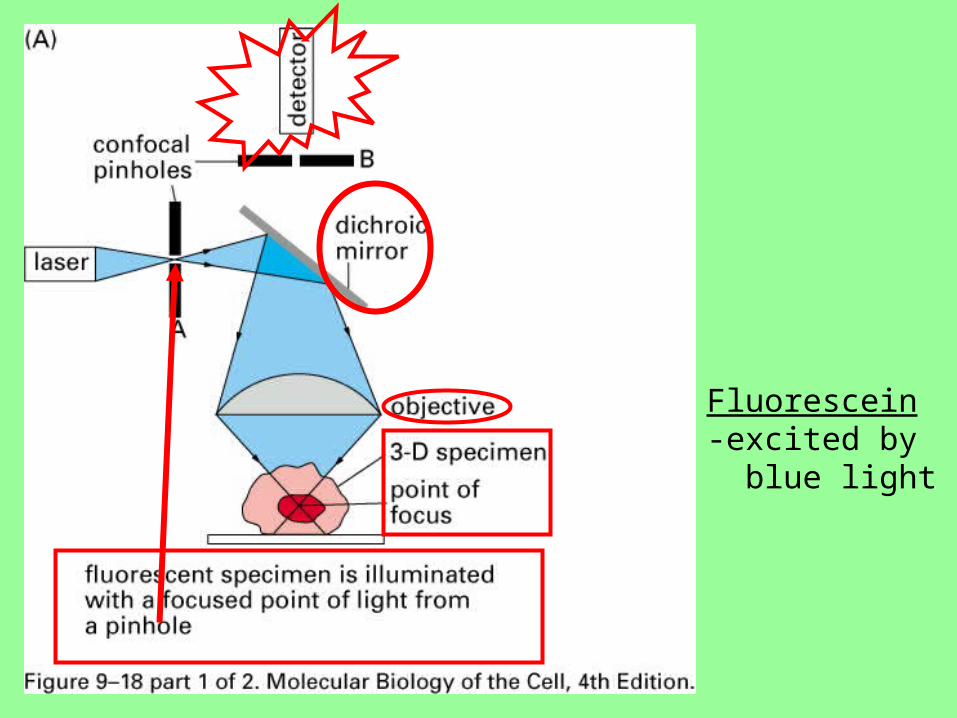
Fluorescein-excited by blue light
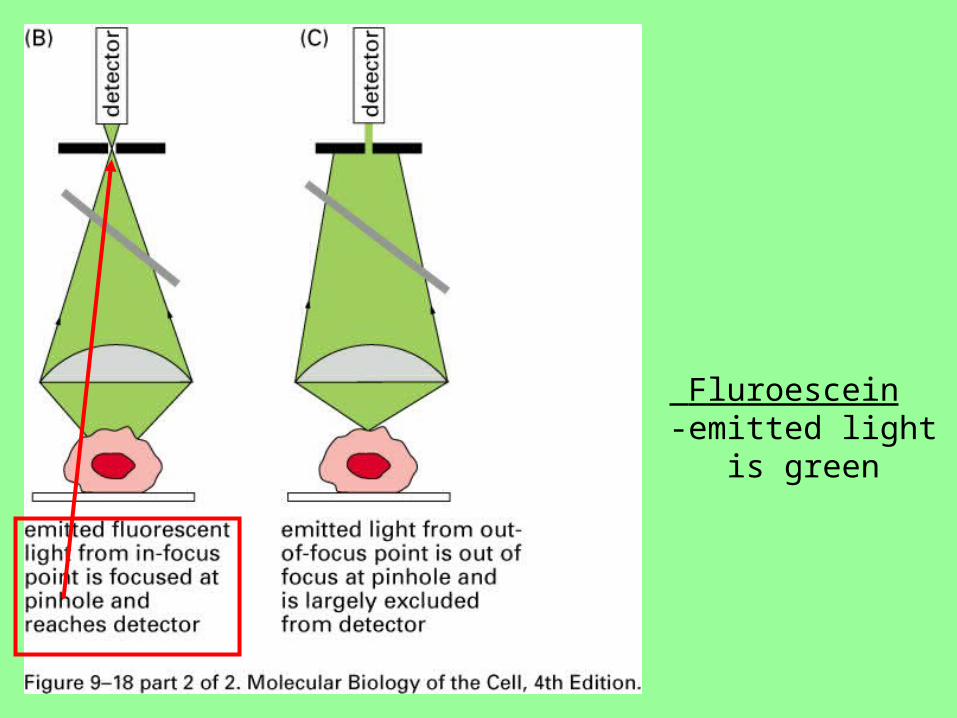
Fluroescein-emitted light is green
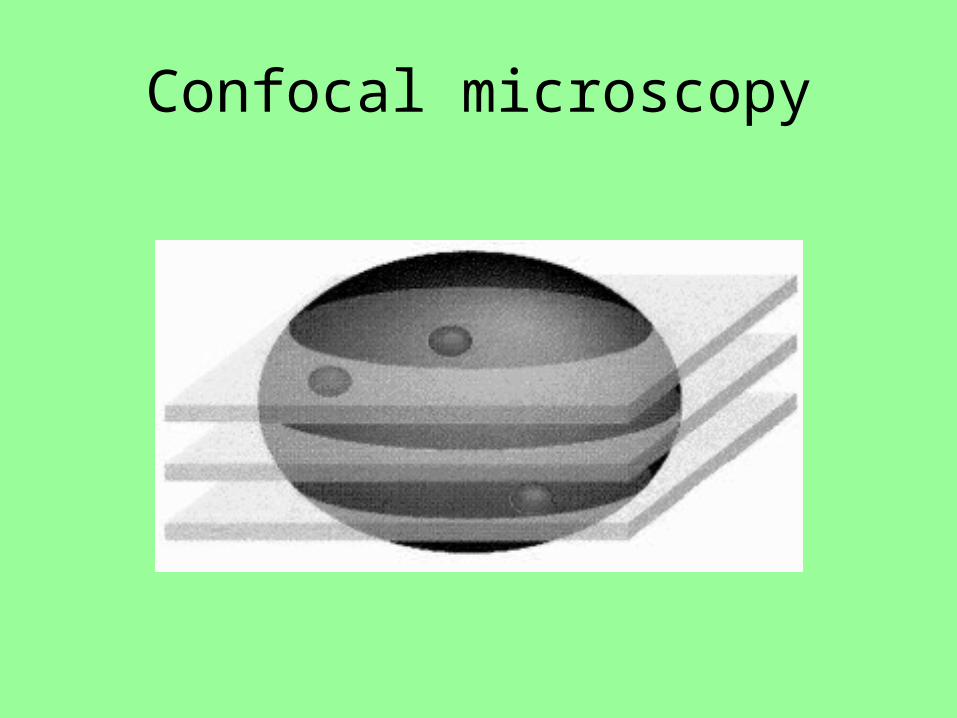
Confocal microscopy

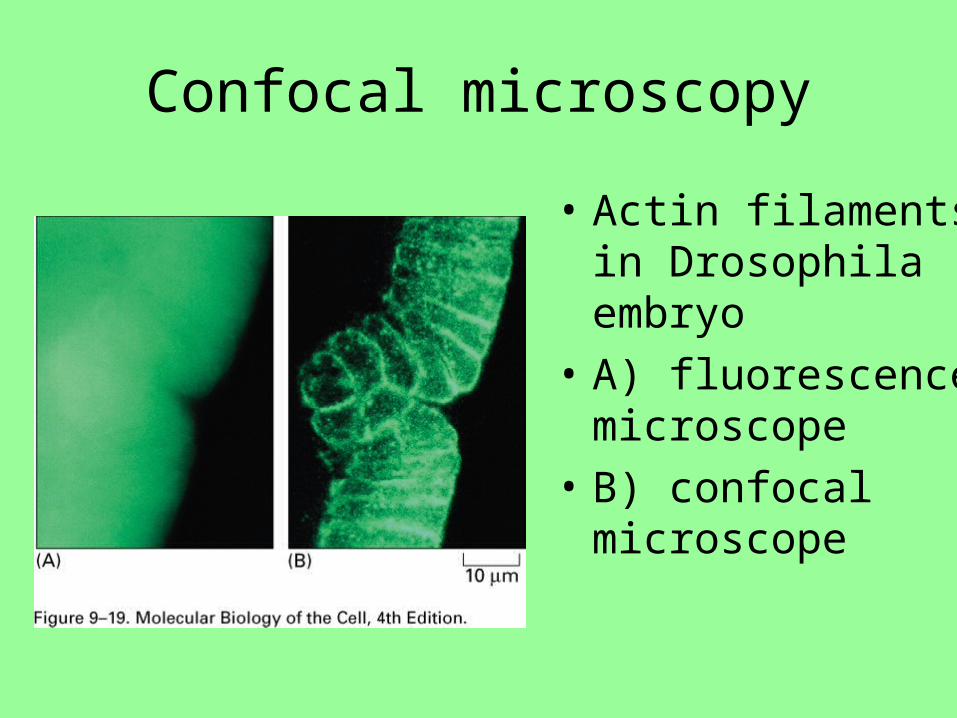
Confocal microscopy
• Actin filaments in Drosophila embryo
• A) fluorescence microscope
• B) confocal microscope
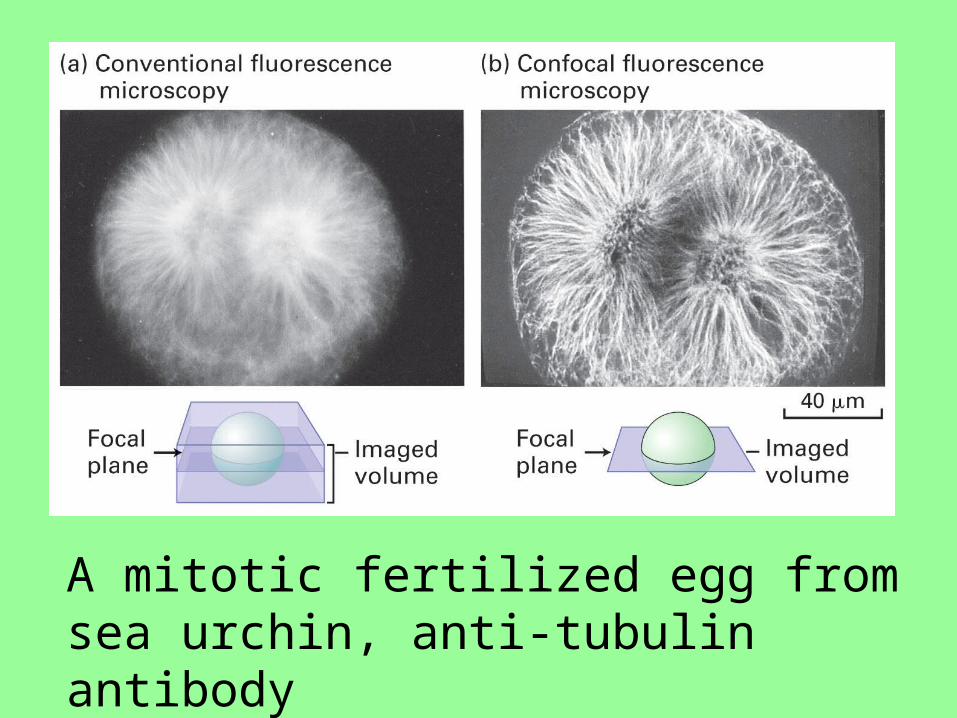
A mitotic fertilized egg from sea urchin, anti-tubulin antibody
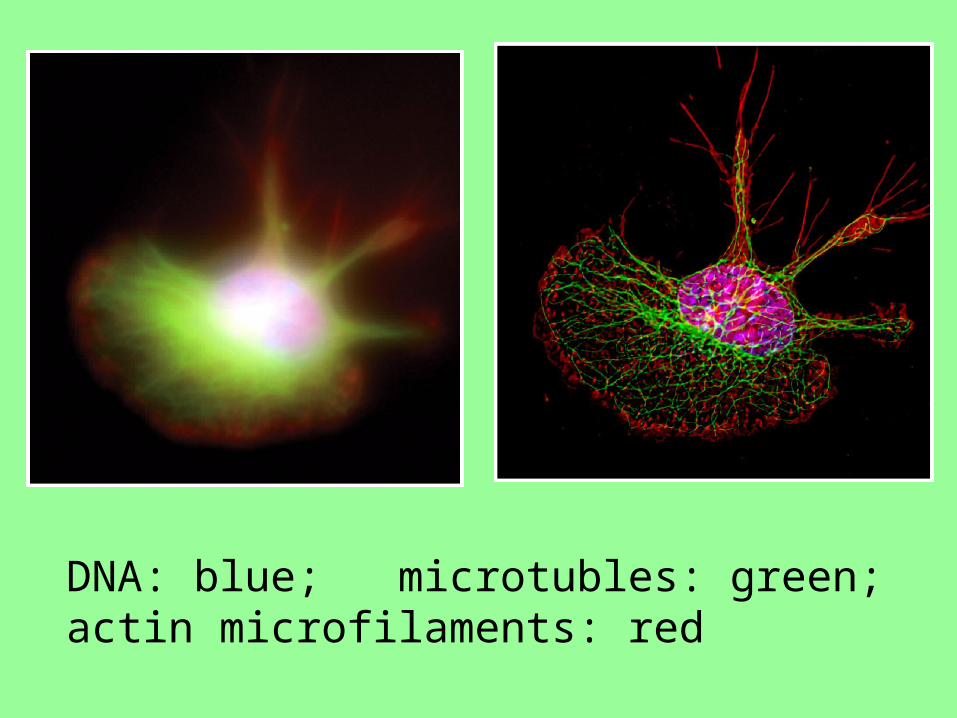
DNA: blue; microtubles: green;actin microfilaments: red
四、 Detection with Antibodies
1. Nature of Antibodies– Bind to specific antigens, usually 5 to 6
amino acid sequence on proteins (Fig. 24-21)
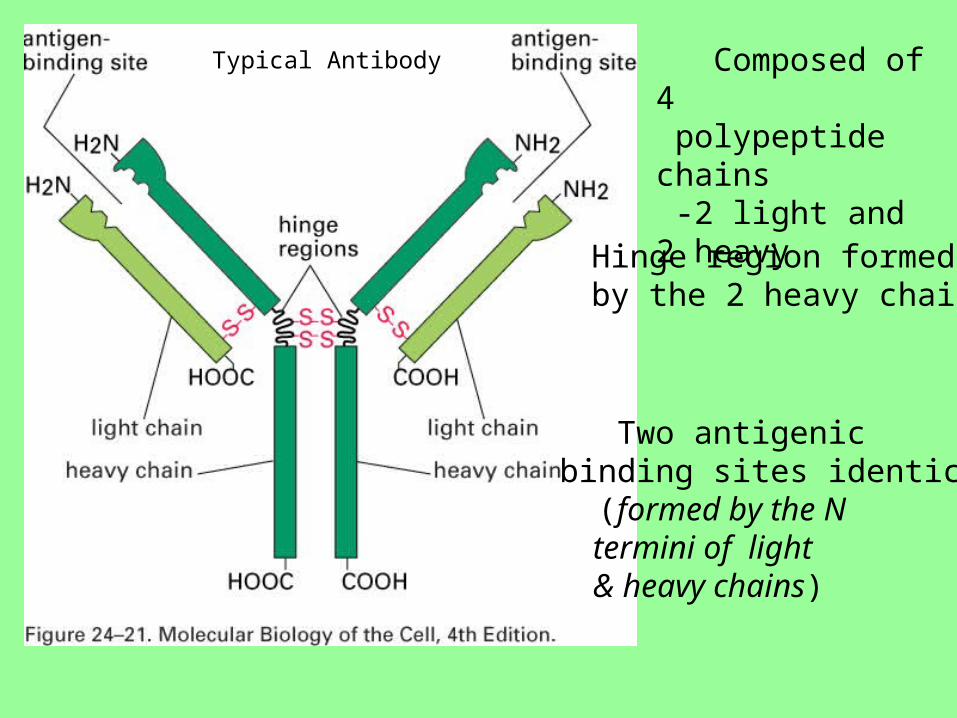
Composed of 4 polypeptide chains -2 light and 2 heavy
Two antigenic binding sites identical (formed by the N termini of light & heavy chains)
Hinge region formedby the 2 heavy chains
Typical Antibody
Detection with Antibodies
2. Types of Antibodies– Polyclonal
• Made by injecting antigen into rabbit (goat)
• Antiserum contains polyclonal antibodies
– Each produced by a different antibody-se
creting cell (B lymphocyte) (Fig. 24-17)
» Each recognizes a certain part (epitop
e) of the antigen (Fig. 24-29)
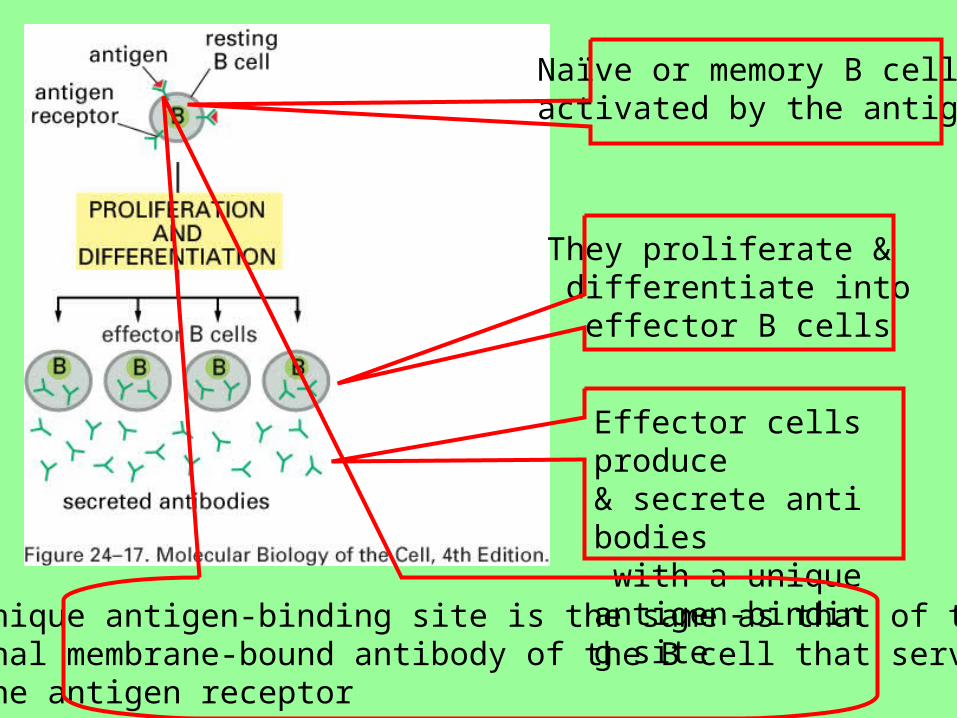
Naïve or memory B cellsactivated by the antigen
They proliferate & differentiate into effector B cells
Effector cells produce& secrete antibodies with a unique antigen-binding site
The unique antigen-binding site is the same as that of the original membrane-bound antibody of the B cell that served as the antigen receptor
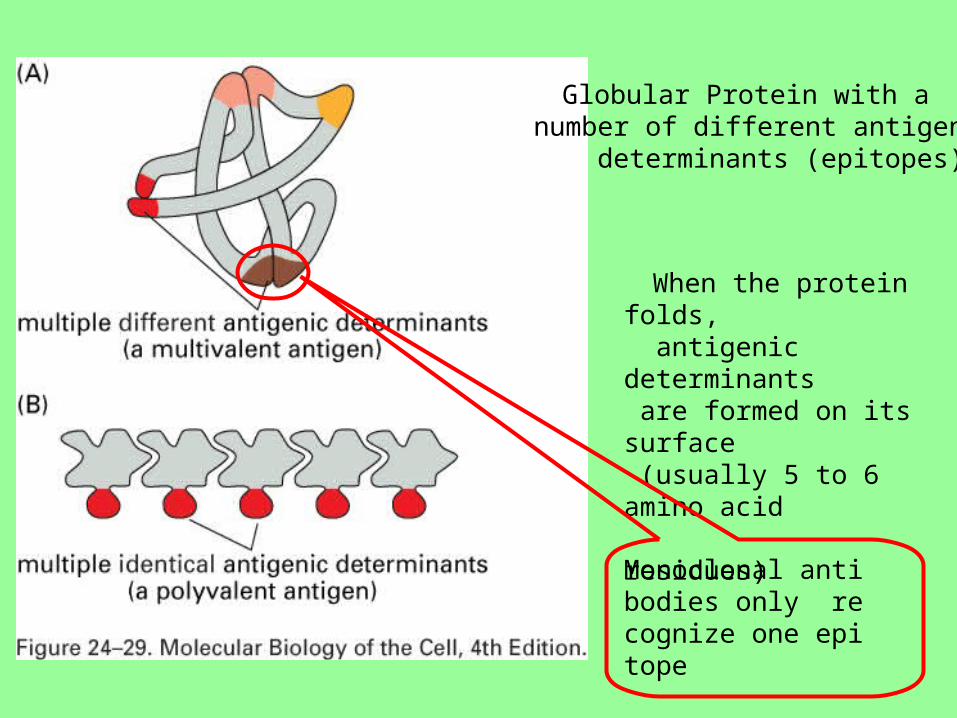
Globular Protein with anumber of different antigenic determinants (epitopes)
When the protein folds, antigenic determinants are formed on its surface (usually 5 to 6 amino acid residues)
Monoclonal antibodies only recognize one epitope
Detection with Antibodies
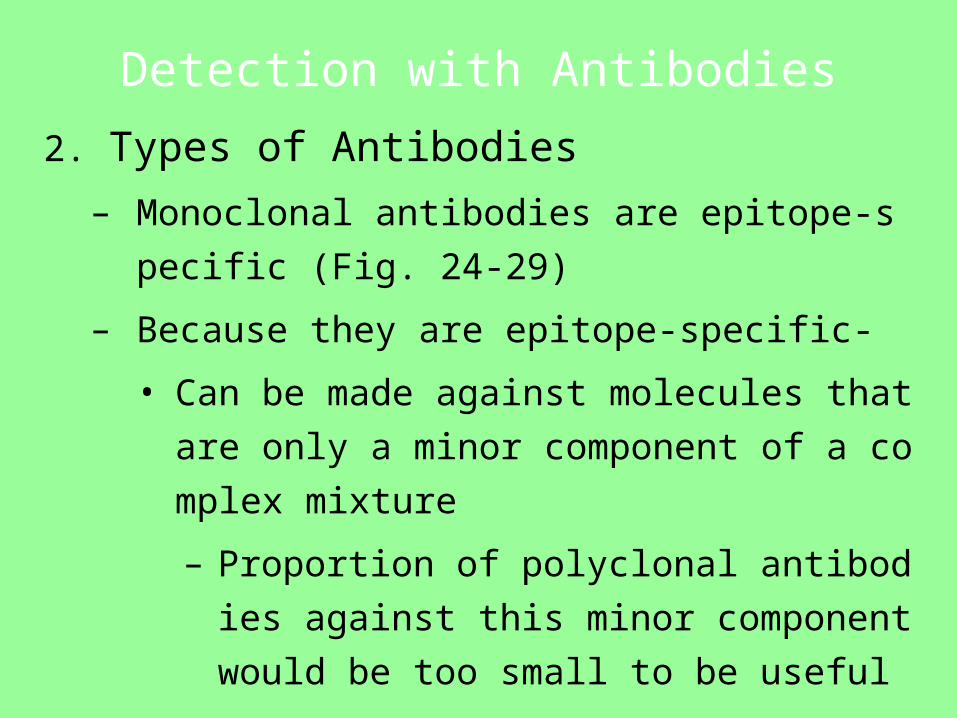
2. Types of Antibodies
– Monoclonal antibodies are epitope-specific (Fi
g. 24-29)
– Because they are epitope-specific-
• Can be made against molecules that are onl
y a minor component of a complex mixture
– Proportion of polyclonal antibodies agains
t this minor component would be too smal
l to be useful
Detection with Antibodies
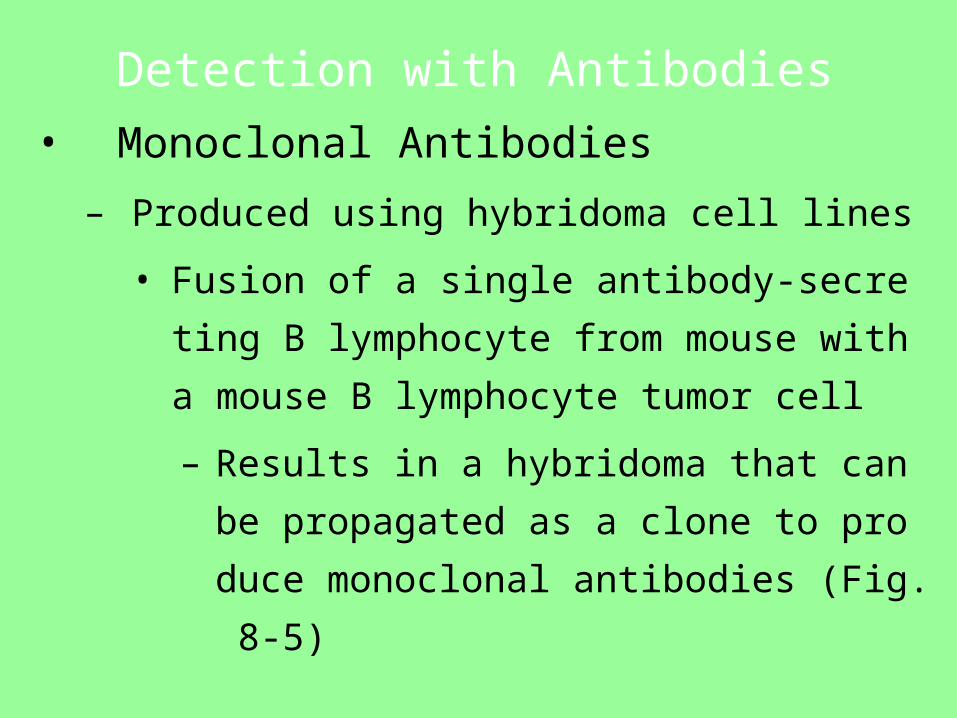
• Monoclonal Antibodies
– Produced using hybridoma cell lines
• Fusion of a single antibody-secreting B lymp
hocyte from mouse with a mouse B lymphoc
yte tumor cell
– Results in a hybridoma that can be propa
gated as a clone to produce monoclonal a
ntibodies (Fig. 8-5)
Detection with Antibodies
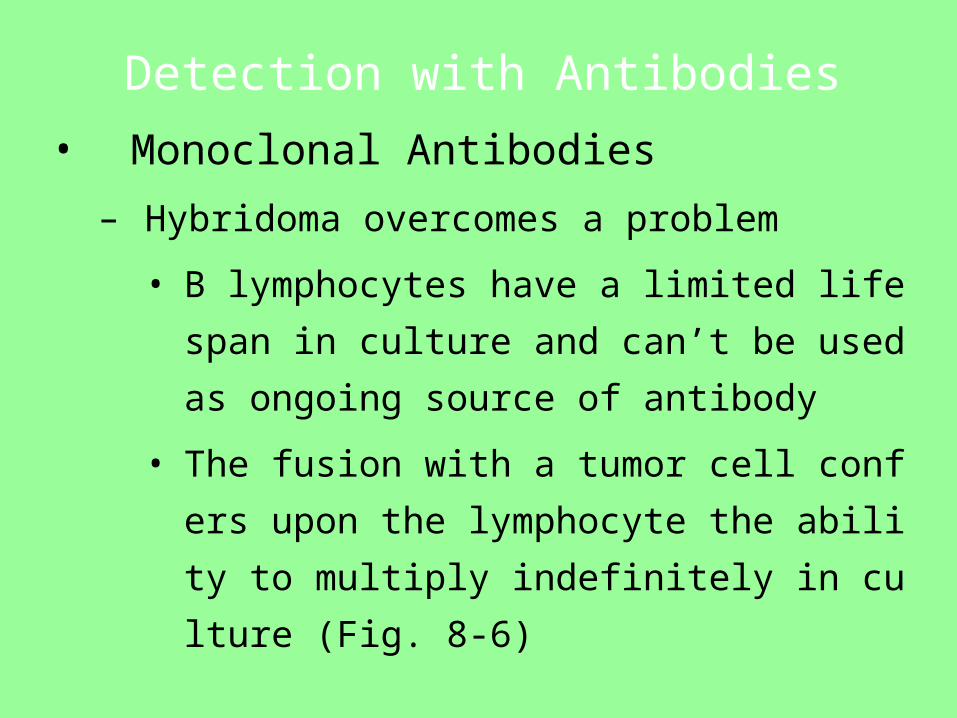
• Monoclonal Antibodies
– Hybridoma overcomes a problem
• B lymphocytes have a limited life span in cu
lture and can’t be used as ongoing source o
f antibody
• The fusion with a tumor cell confers upon th
e lymphocyte the ability to multiply indefinite
ly in culture (Fig. 8-6)
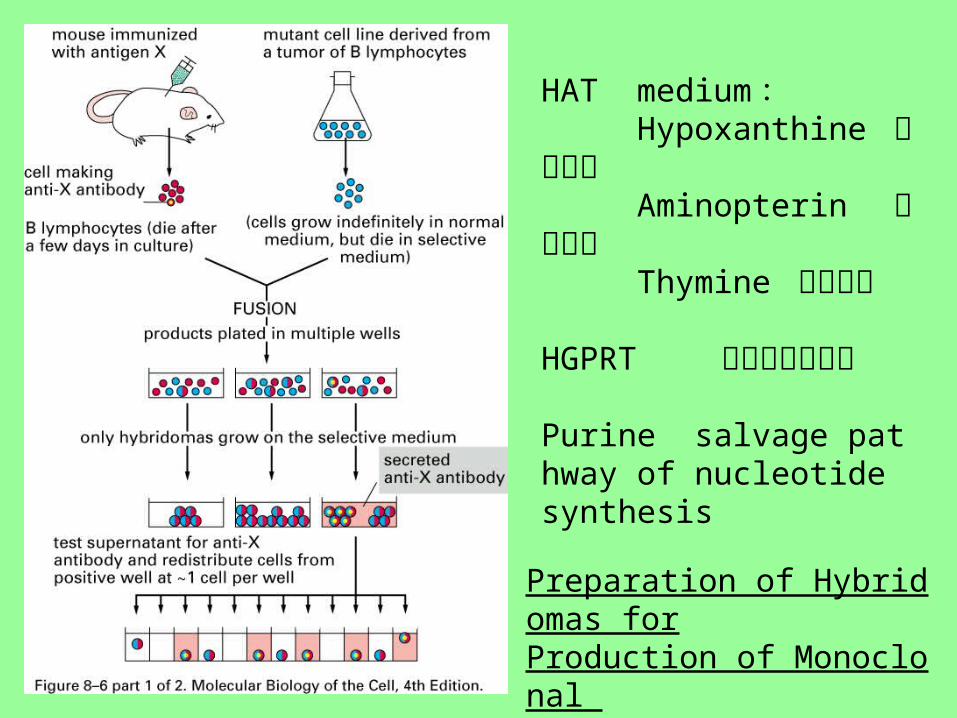
Preparation of Hybridomas forProduction of Monoclonal Antibodies
HAT medium : Hypoxanthine 次黄嘌呤 Aminopterin 氨基蝶呤 Thymine 胸腺嘧啶
HGPRT 磷酸核糖转移酶
Purine salvage pathway of nucleotide synthesis
Detection with Antibodies
• Fluorescently labelled antibodies can be u
sed simultaneously to depict distributions
of different molecules or structures (Fig. 9-
14)
Fluorescence Microscopy
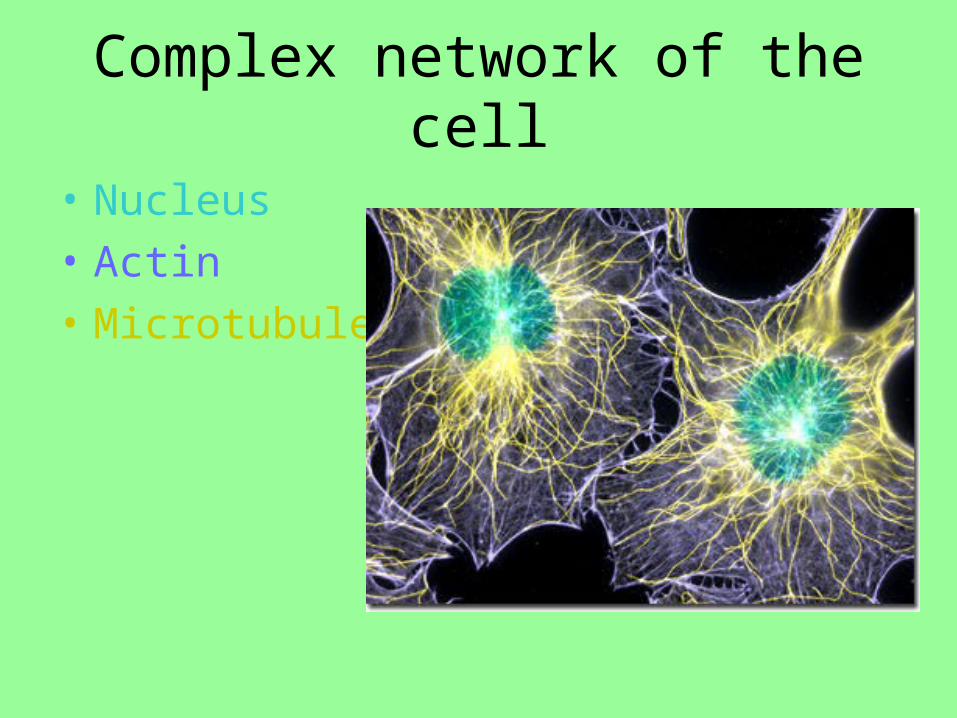
Complex network of the cell
• Nucleus
• Actin
• Microtubules
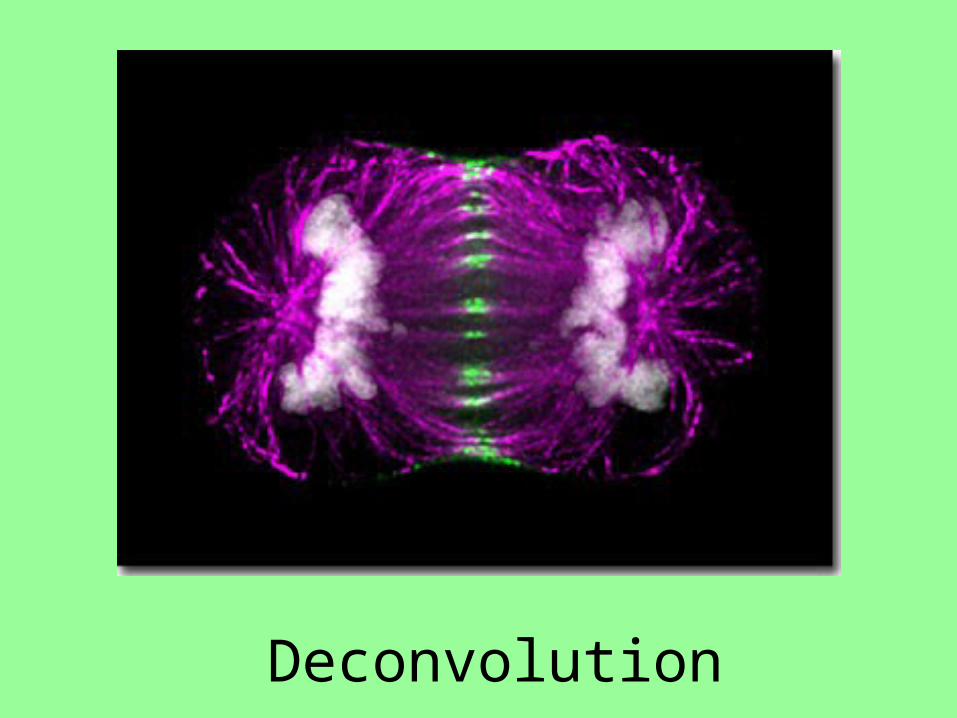
Deconvolution
Detection with Antibodies
• Amplification of the signal
1. Unlabelled primary antibody and group
of labeled secondary antibodies (Fig. 9-
16)
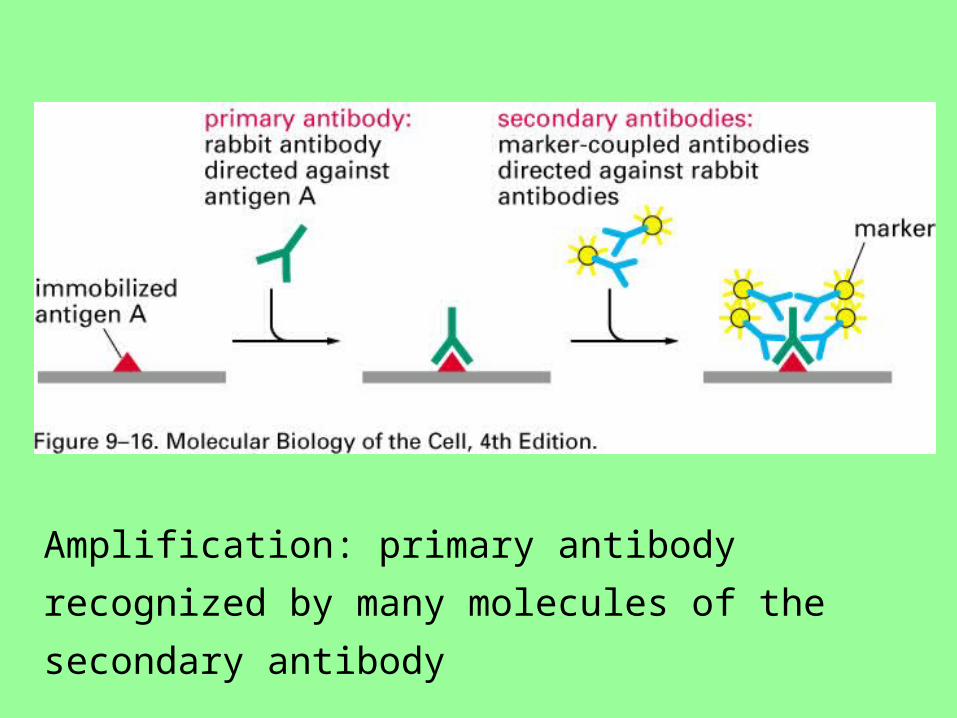
Amplification: primary antibody recognized by many
molecules of the secondary antibody
Detection with Antibodies
• Amplification of the signal
2. Alkaline phosphatase is linked to the secon
dary antibody
– Produces localized accumulaion of colo
ured precipitate upon addition of suitable
substrate
» This can be detected by measuring a
bsorbance on a Plate Reader
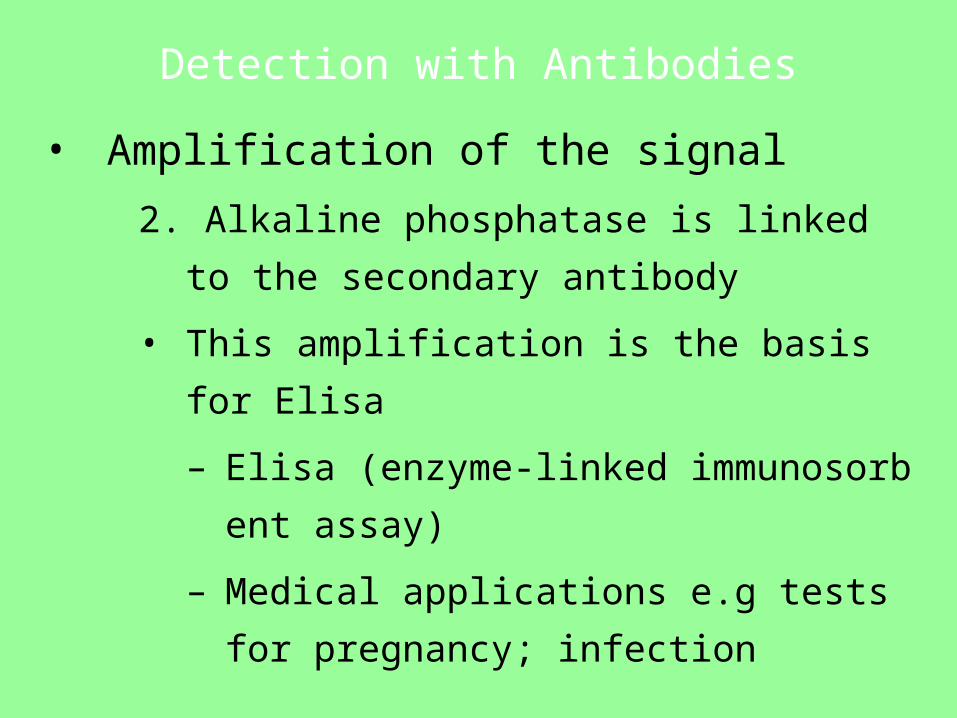
Detection with Antibodies
• Amplification of the signal
2. Alkaline phosphatase is linked to the secon
dary antibody
• This amplification is the basis for Elisa
– Elisa (enzyme-linked immunosorbent ass
ay)
– Medical applications e.g tests for pregna
ncy; infection
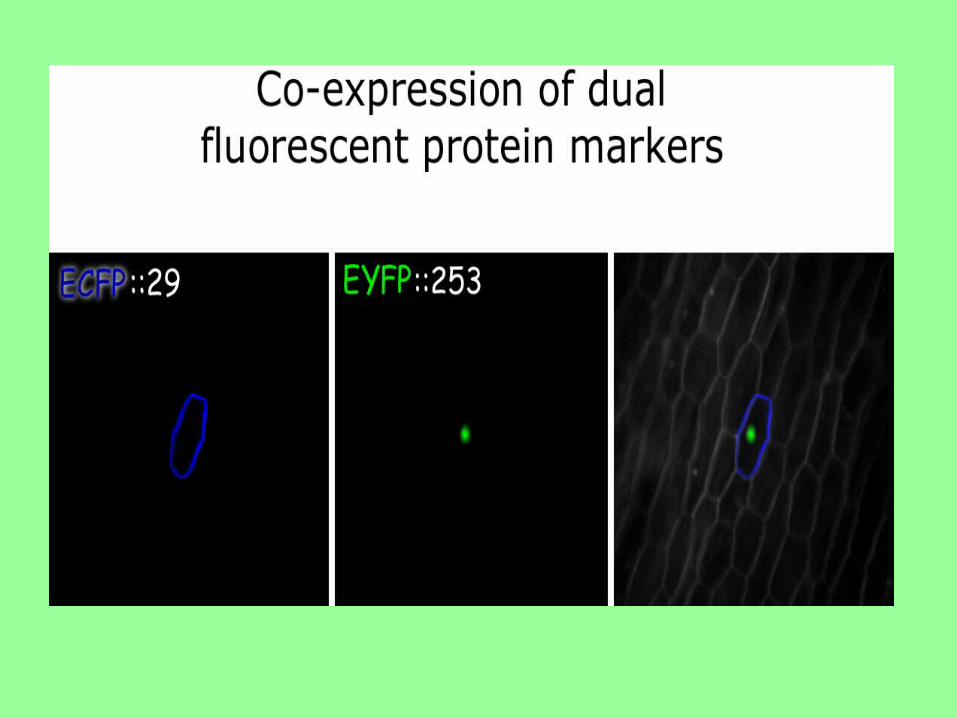
Green Fluorescent Protein (GFP)
• Very powerful experimental tool when used i
n conjunction with confocal microscopy
Green Fluorescent Protein (GFP)
• Fluorescent dyes (e.g. fluorescently labelled antibodies) have to be introduced into the cell
• GFP can be used to tag individual proteins in living cells– Reason:
• this protein is naturally fluorescent
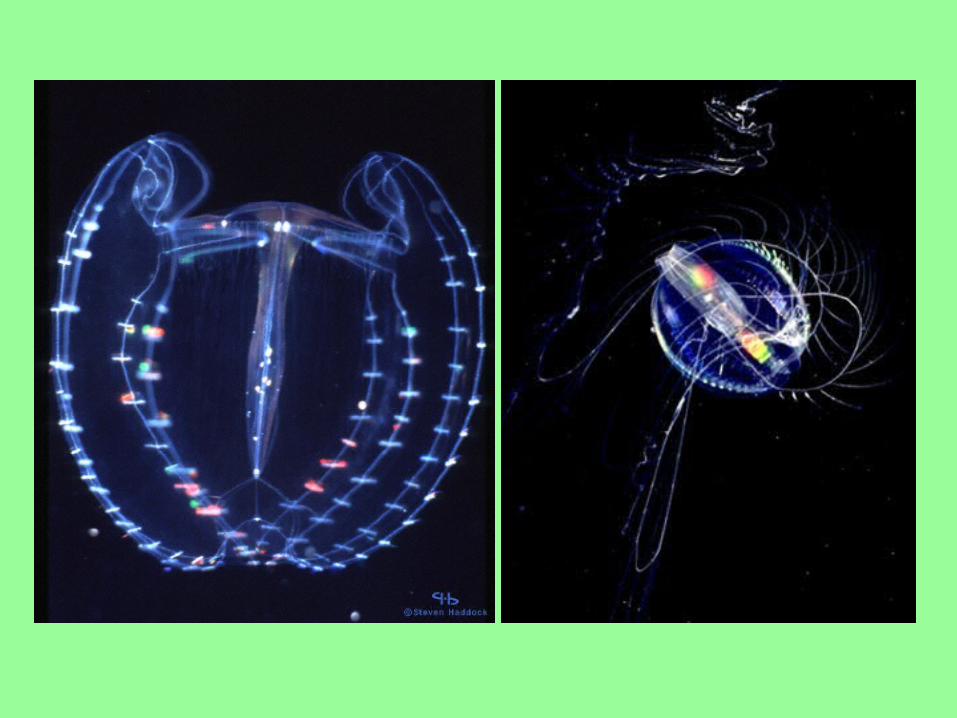
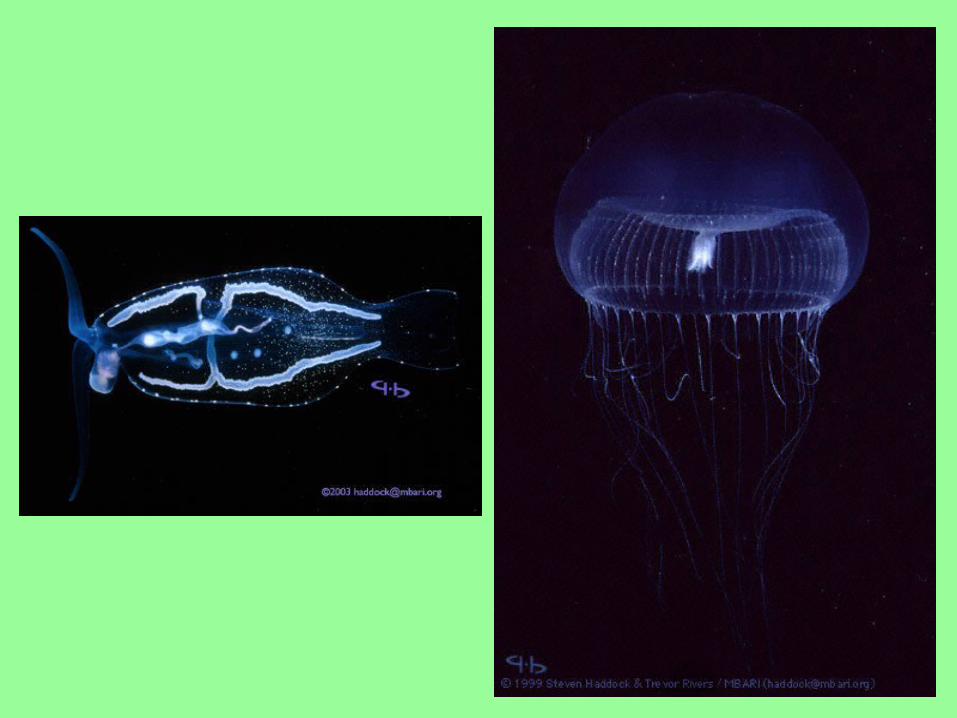
Green Fluorescent Protein (GFP)
• Gene encoding GFP isolated from the jellyfis
h Aequoria victoria
– GFP can be cloned and introduced into cells of o
ther species
Use of Green Fluorescent Protein (GFP)
• As a reporter molecule to monitor gene expression– Transgenic organism made with the GFP-coding
sequence under the transcriptional control of the promoter belonging to the gene of interest
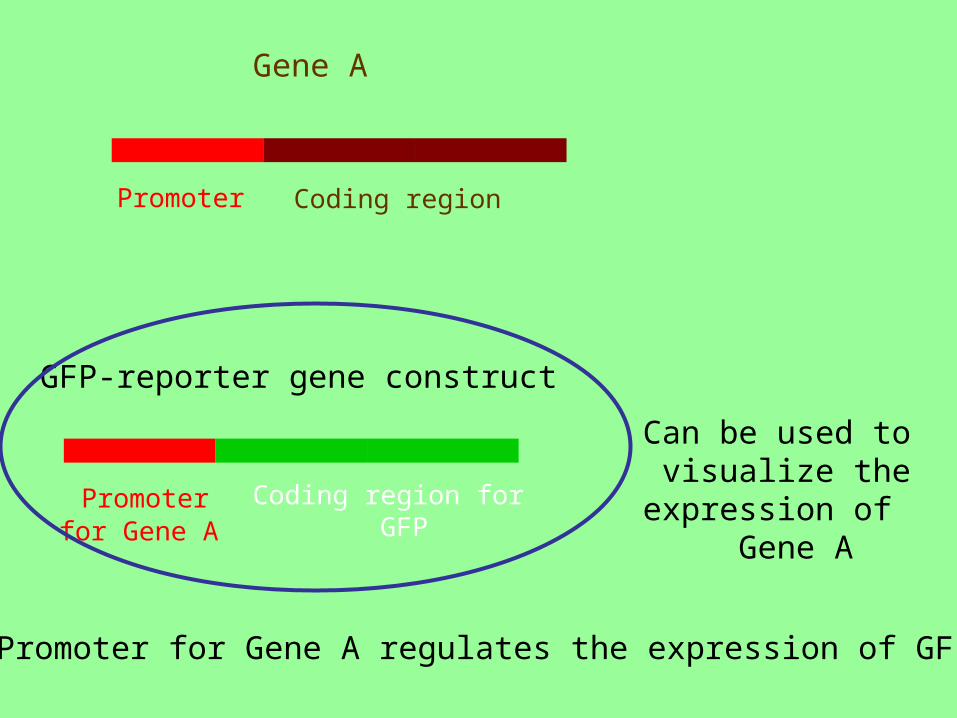
Gene A
Promoter Coding region
GFP-reporter gene construct
Promoter for Gene A
Coding region for GFP
Can be used to visualize the expression of Gene A
Promoter for Gene A regulates the expression of GFP
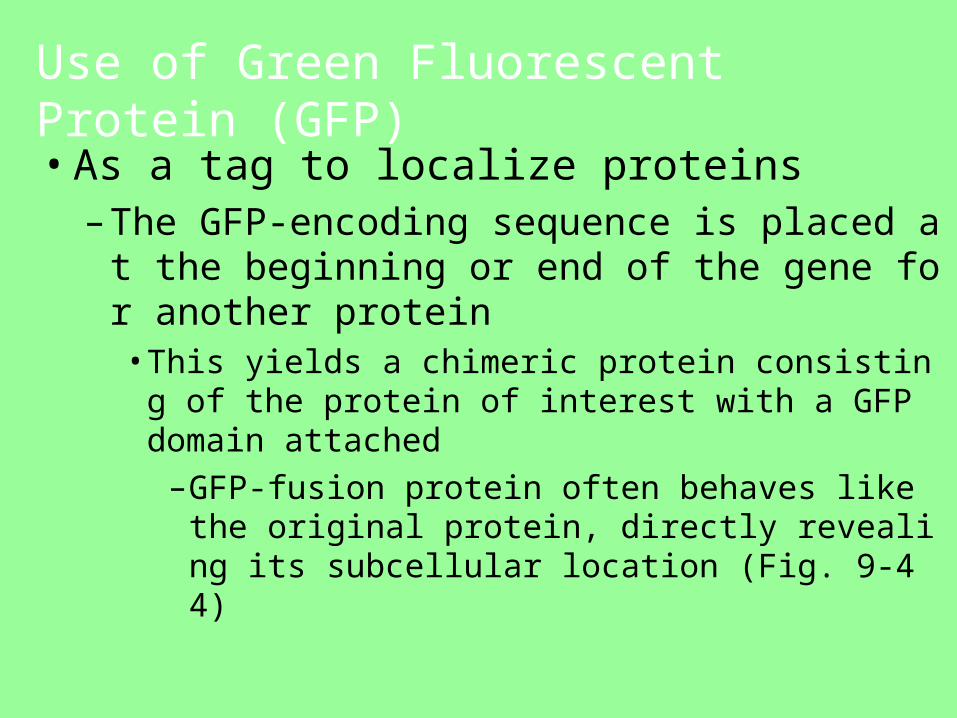
Use of Green Fluorescent Protein (GFP)
• As a tag to localize proteins– The GFP-encoding sequence is placed at t
he beginning or end of the gene for another protein• This yields a chimeric protein consisting of the
protein of interest with a GFP domain attached–GFP-fusion protein often behaves like the ori
ginal protein, directly revealing its subcellular location (Fig. 9-44)
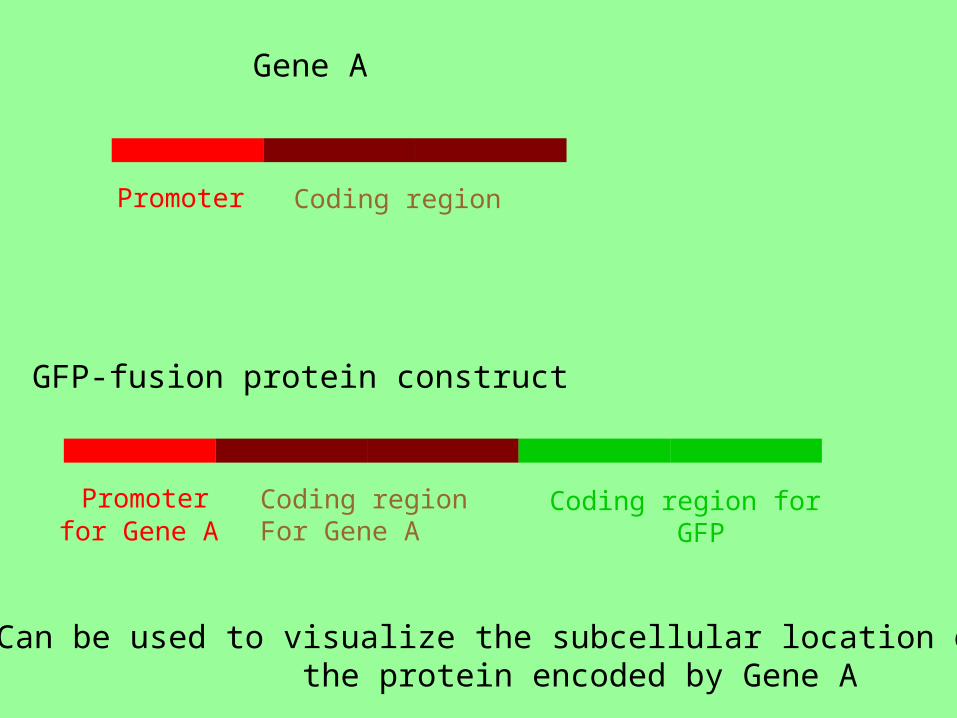
Gene A
Promoter Coding region
GFP-fusion protein construct
Promoter for Gene A
Coding region for GFP
Coding regionFor Gene A
Can be used to visualize the subcellular location of the protein encoded by Gene A
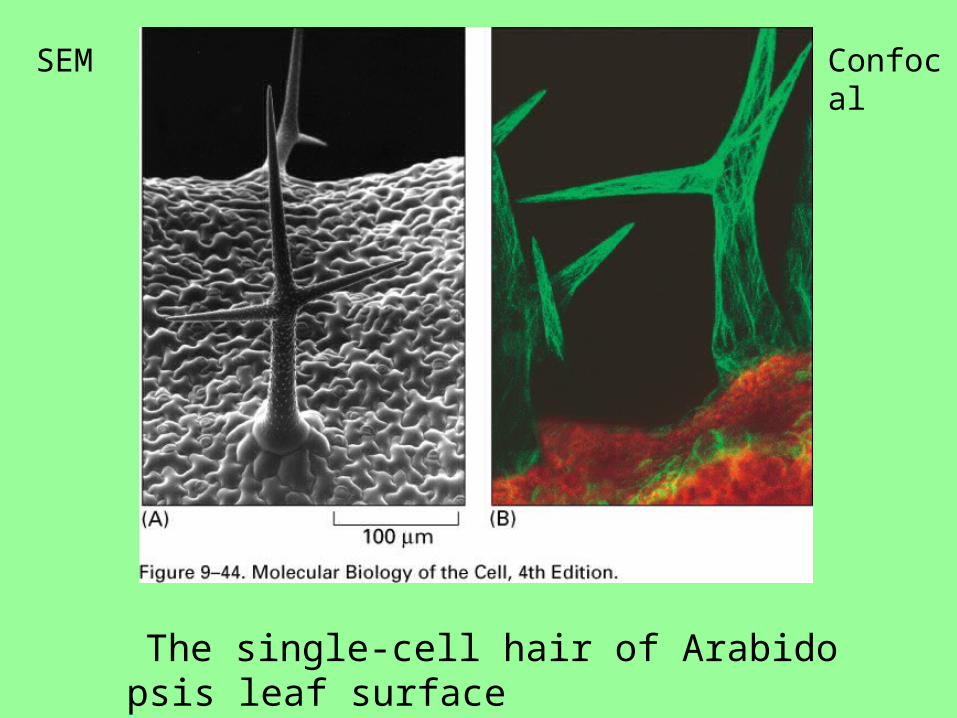
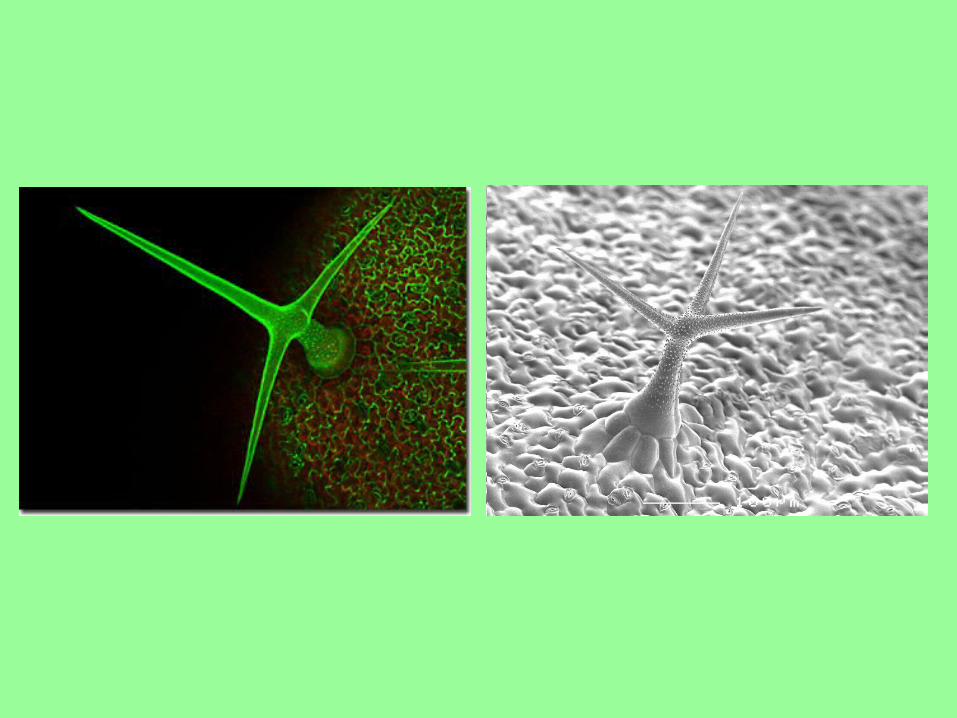
The single-cell hair of Arabidopsis leaf surface Talin ( actin-binding protein ) -GFP
SEM Confocal
五、 Electron Microscope
• Resolves fine structure of the cell– Relationship between limit of resolution
and wavelength applies for any form of radiation
• Wavelength of electron decreases as its velocity increases
Electron Microscope• With an accelerating voltage of 100,000 V,
wavelength of an electron is 0.004nm
– In theory, resolution is ~0.002 nm
• 10,000 X that of light microscope
– However, aberrations of electron lens more difficult to correct than those of light microscope
• Practical resolving power is 0.1 nm
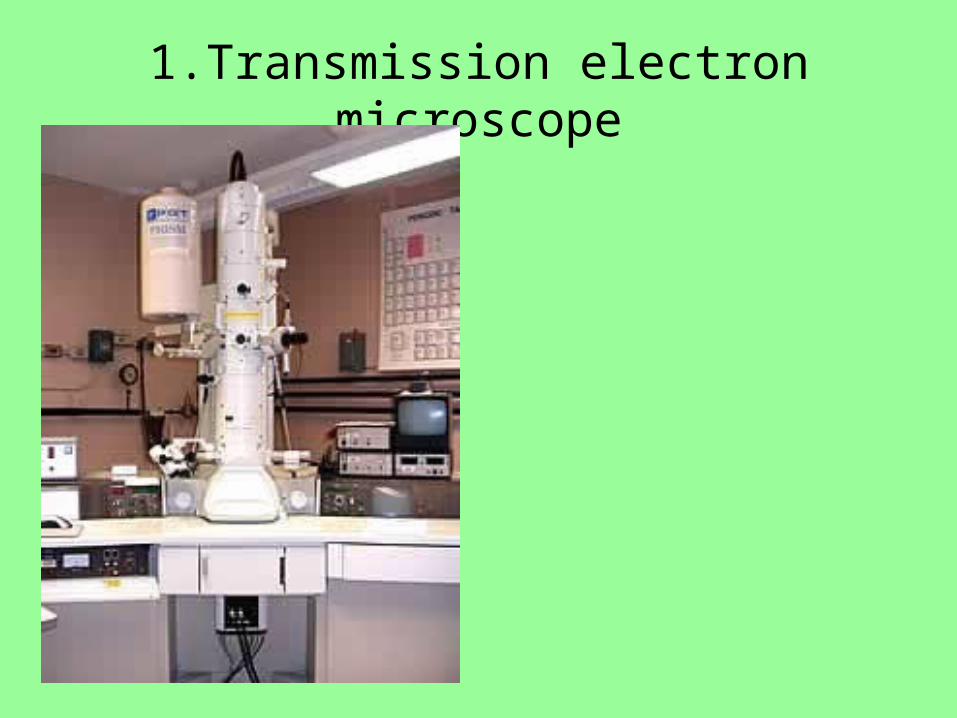
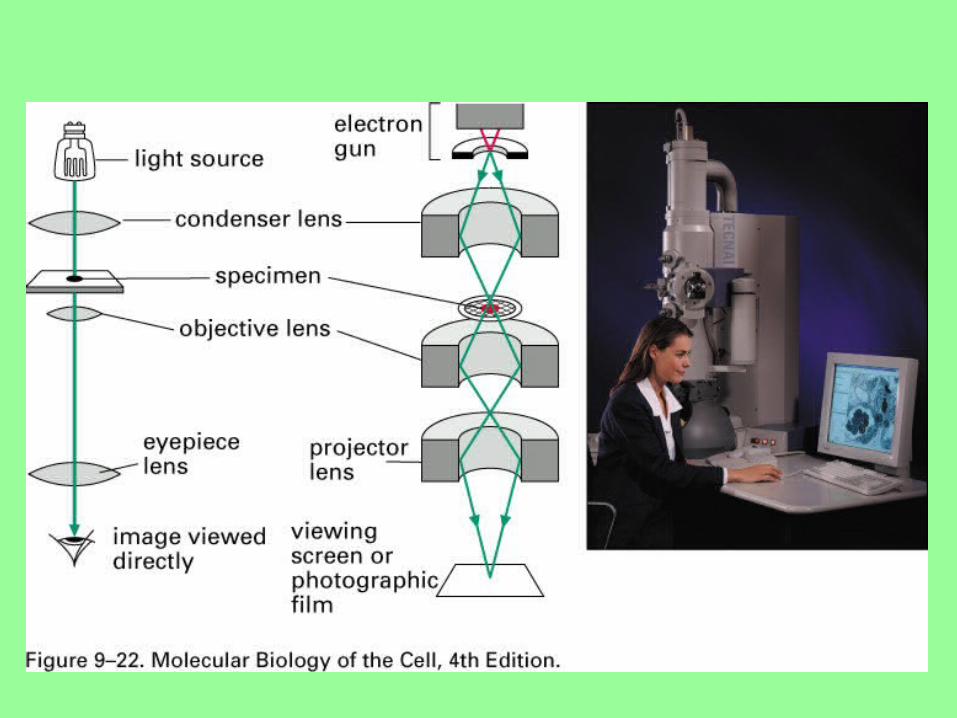
1.Transmission electron microscope
Electron Microscope
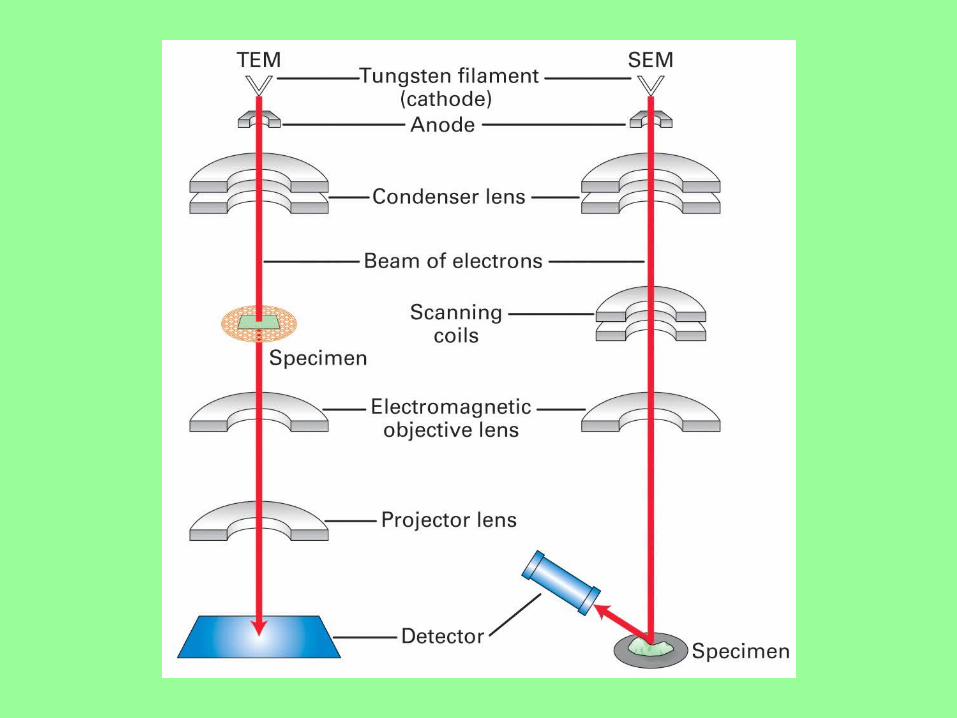
• Design of transmission electron microscope
(TEM) similar to light microscope, except:
– Much larger
– Upside down (Fig. 9-22)
Electron Microscopy
• Source of illumination is a filament (cathode)
that emits electrons at the top of the column
– Since electrons are scattered by collisions
with air molecules, column must be under
a vacuum
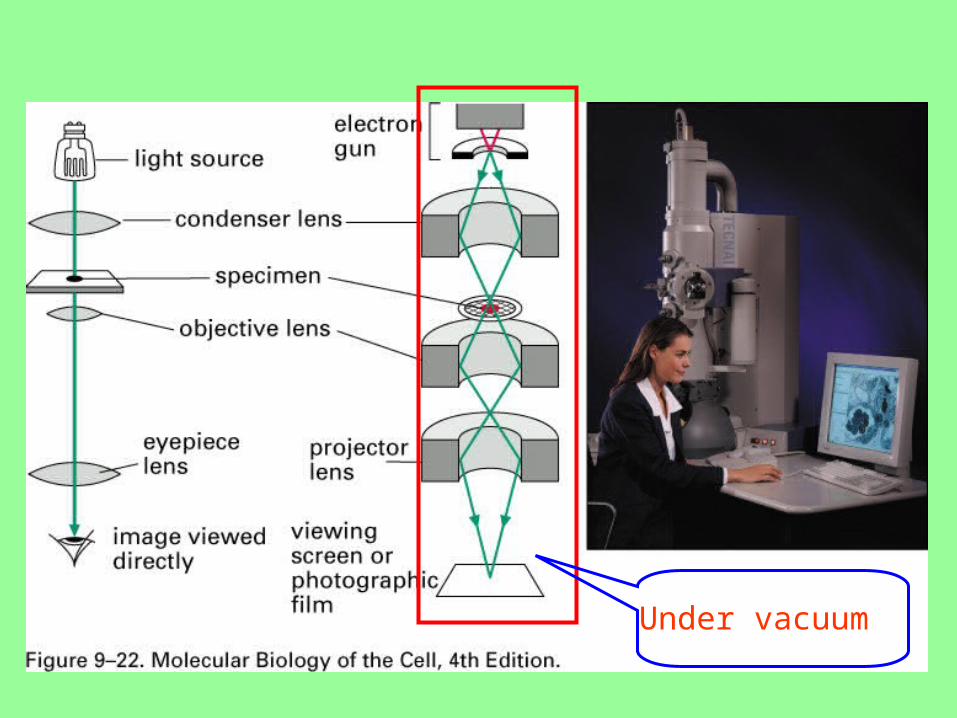
Under vacuum
Electron Microscopy
• Electrons are accelerated by a nearby
anode
– Then passed through a tiny hole to form
an electron beam
• Magnetic coils focus the beam
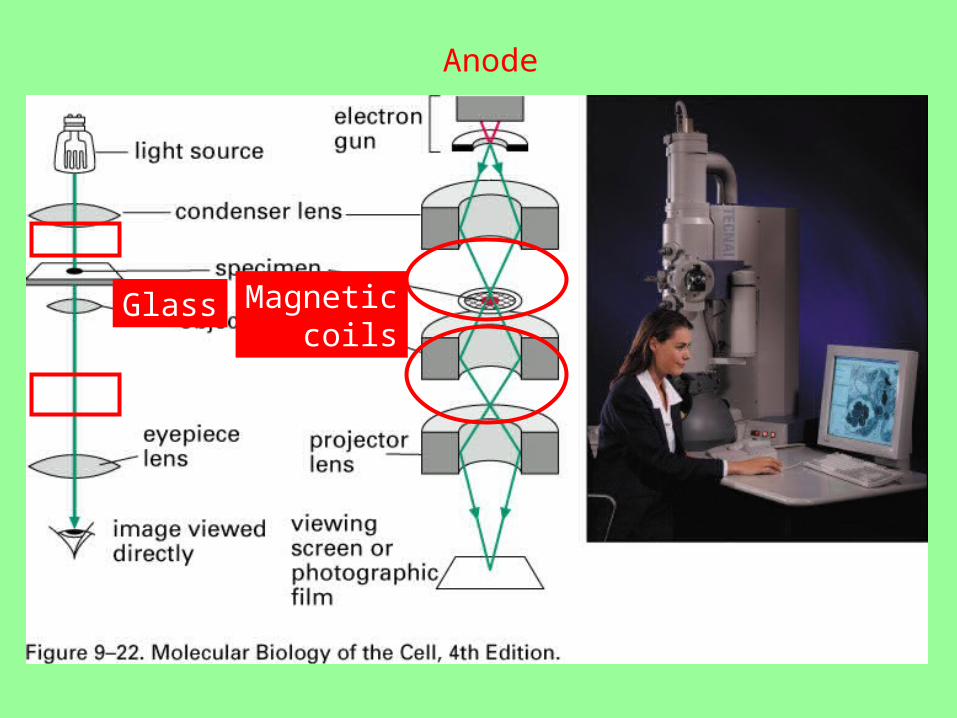
Glass Magnetic coils
Anode
Electron Microscopy• How is contrast achieved in the electron
microscope?
• Specimen is stained with an electron dense material
– Some of the electrons passing through the specimen are scattered by structures stained with electron dense material
• Others pass through parts of the cell not stained to form an image on a phosphorescent screen
Electron Microscopy
• Because the scattered electrons are lost
from the beam, the stained regions show up
as dark
– Thus the image is a montage of light (non
stained) and dark (stained) regions
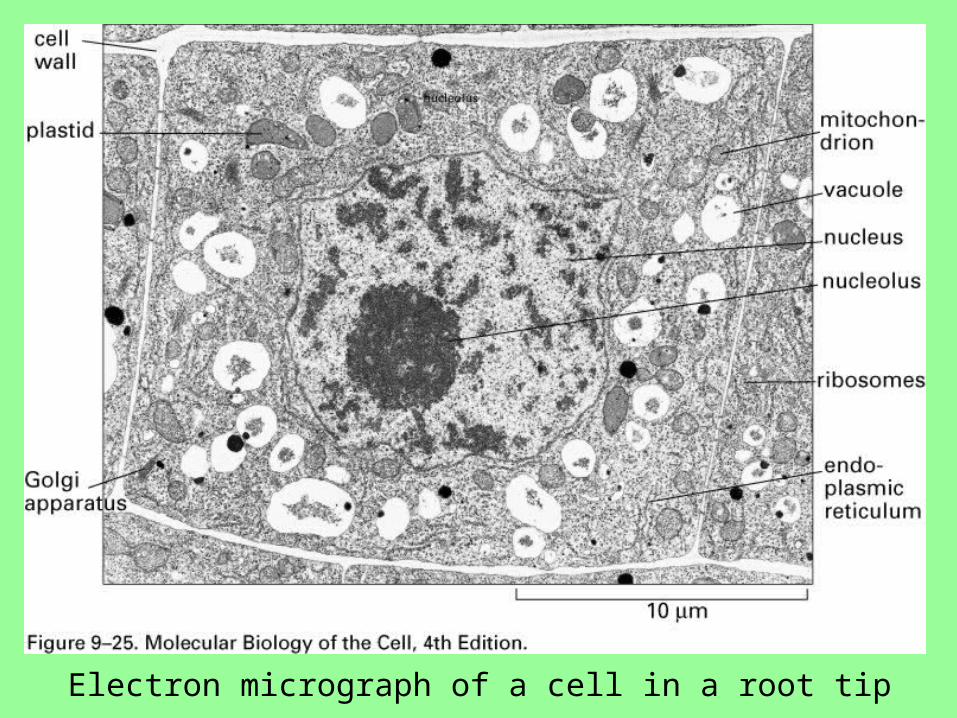
Electron micrograph of a cell in a root tip
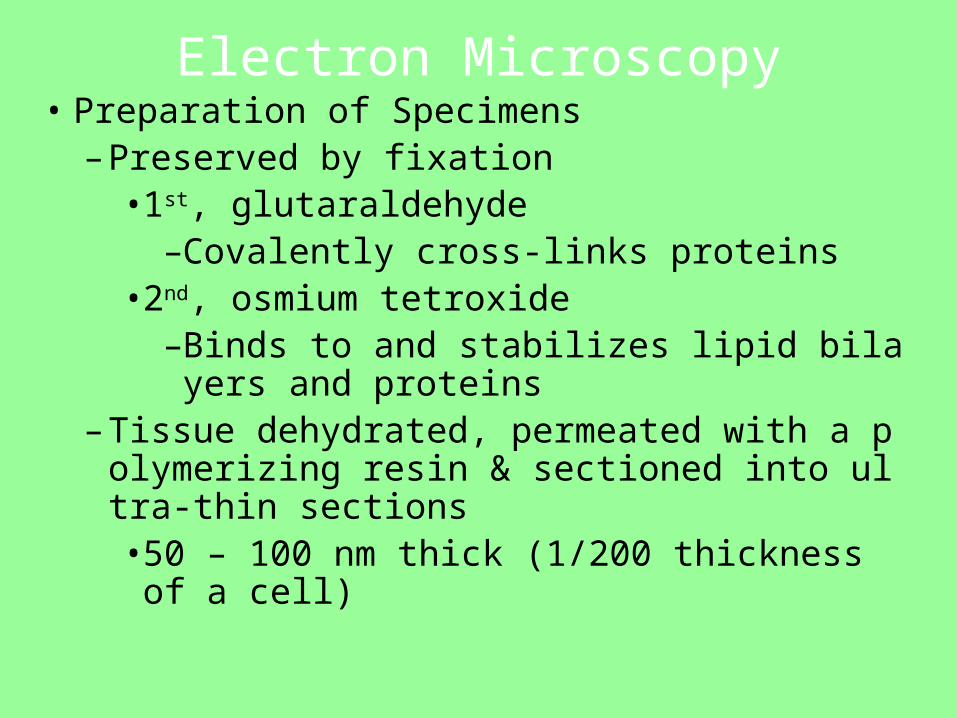
Electron Microscopy• Preparation of Specimens
– Preserved by fixation• 1st, glutaraldehyde
–Covalently cross-links proteins• 2nd, osmium tetroxide
–Binds to and stabilizes lipid bilayers and proteins
– Tissue dehydrated, permeated with a polymerizing resin & sectioned into ultra-thin sections• 50 – 100 nm thick (1/200 thickness of a cel
l)
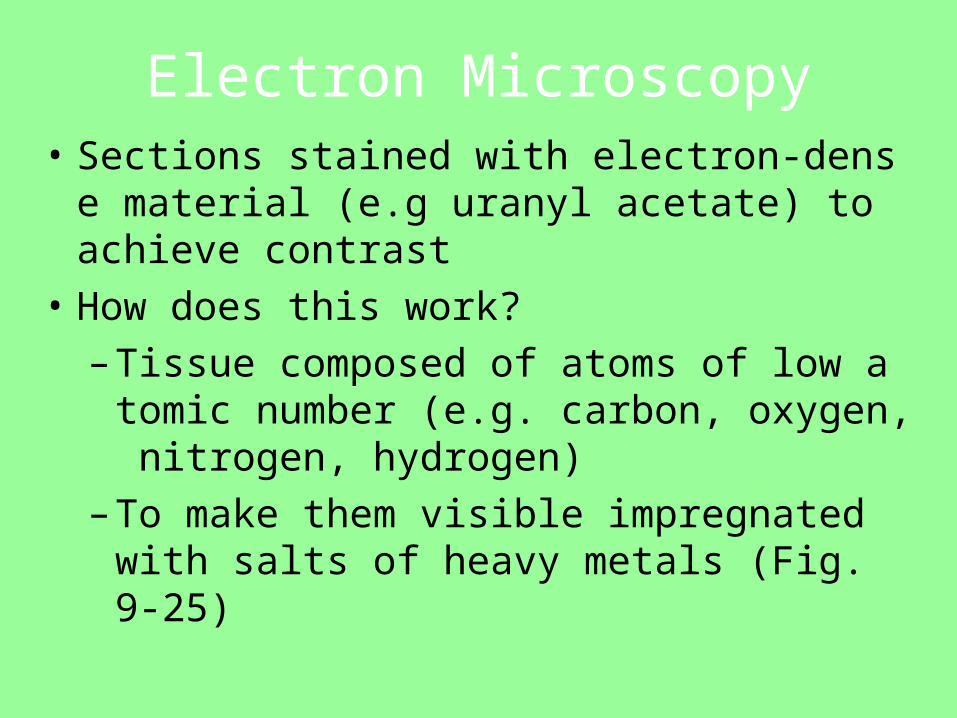
Electron Microscopy• Sections stained with electron-dense materi
al (e.g uranyl acetate) to achieve contrast
• How does this work?
– Tissue composed of atoms of low atomic number (e.g. carbon, oxygen, nitrogen, hydrogen)
– To make them visible impregnated with salts of heavy metals (Fig. 9-25)
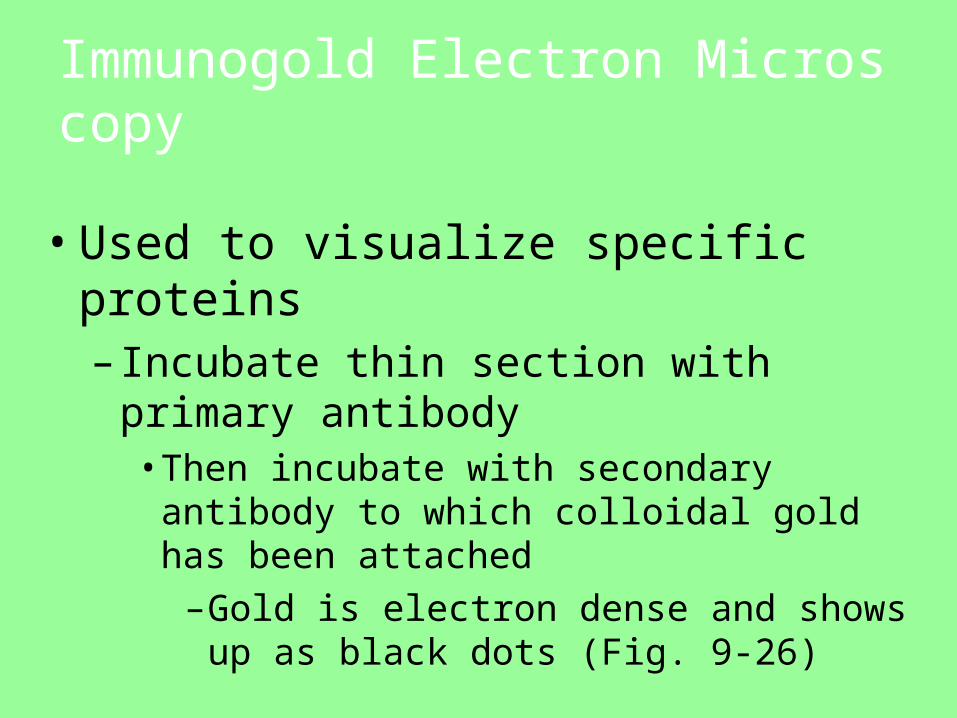
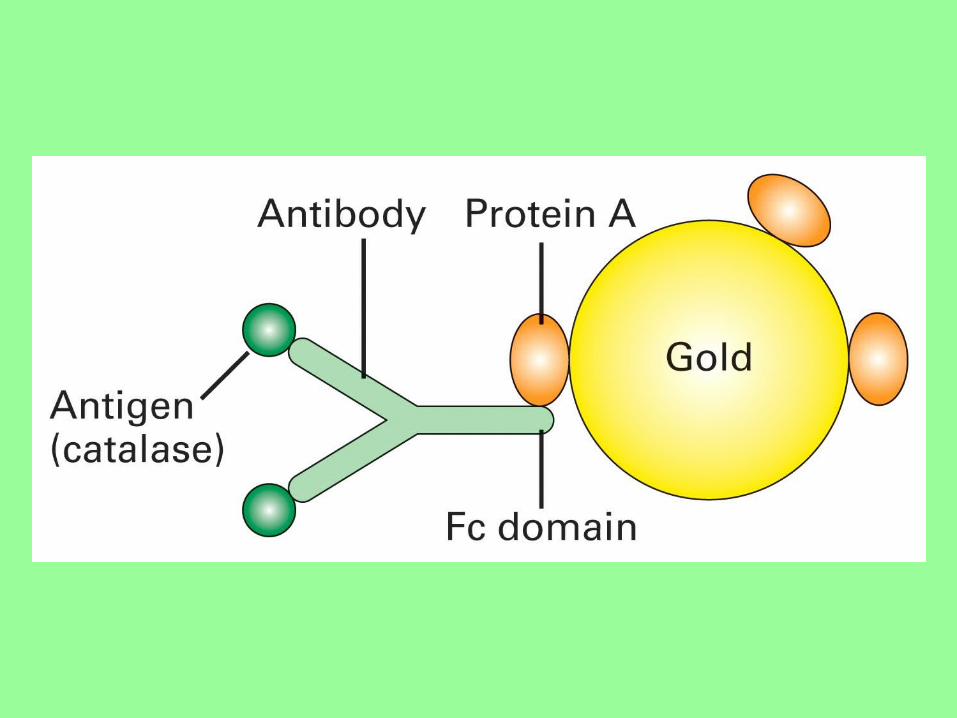
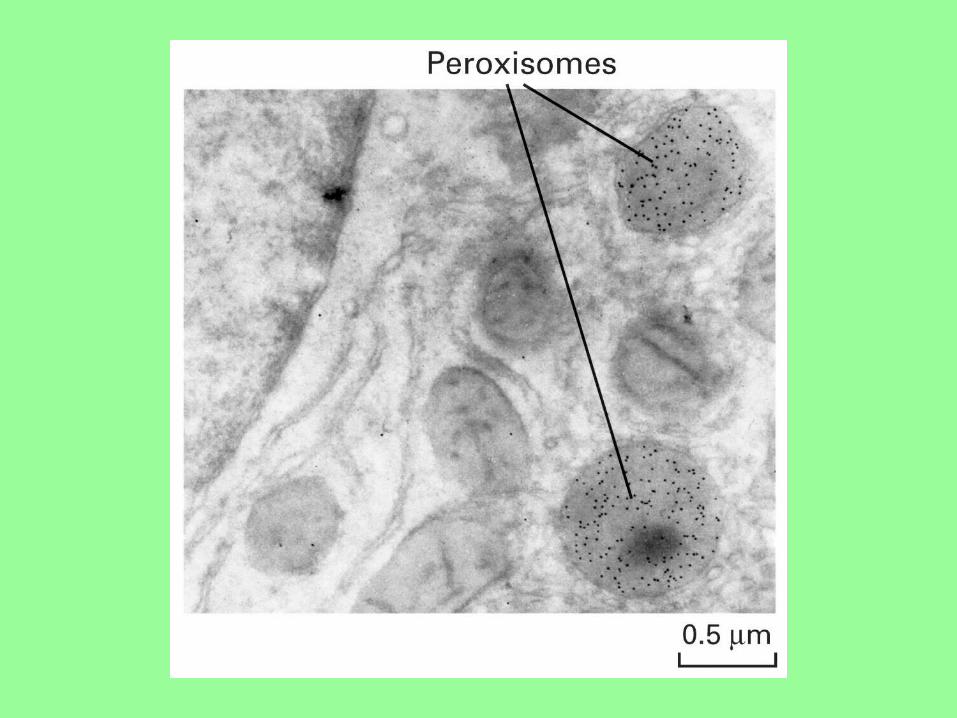
Immunogold Electron Microscopy
• Used to visualize specific proteins– Incubate thin section with primary
antibody• Then incubate with secondary antibody to
which colloidal gold has been attached–Gold is electron dense and shows up as
black dots (Fig. 9-26)
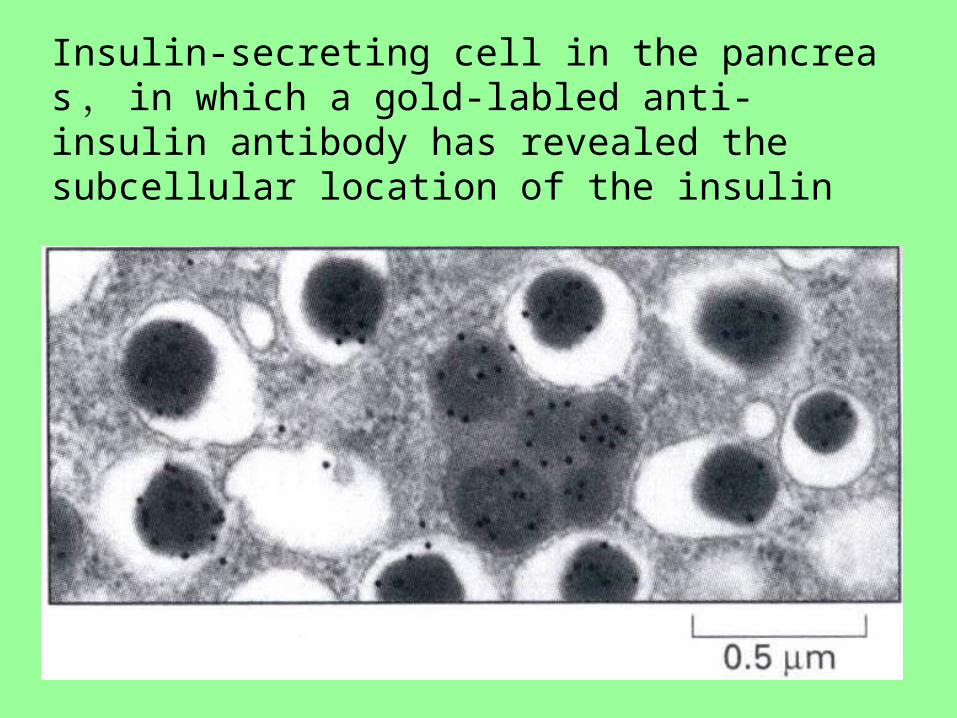
Insulin-secreting cell in the pancreas , in which a gold-labled anti-insulin antibody has revealed the subcellular location of the insulin
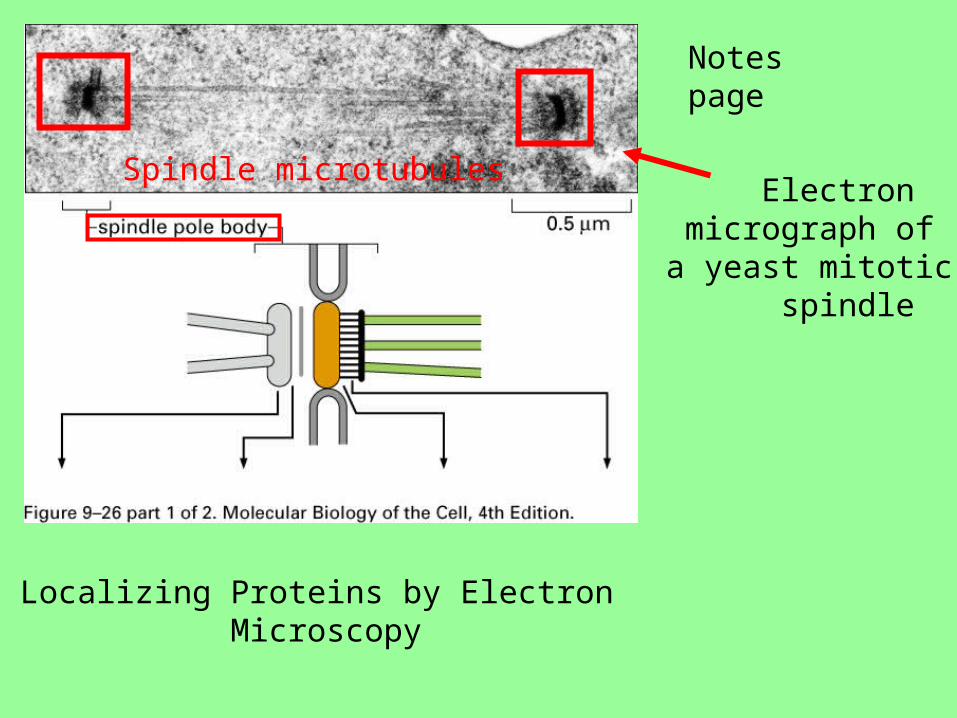
Localizing Proteins by Electron Microscopy
Notes page
Electron micrograph ofa yeast mitotic spindle
Spindle microtubules
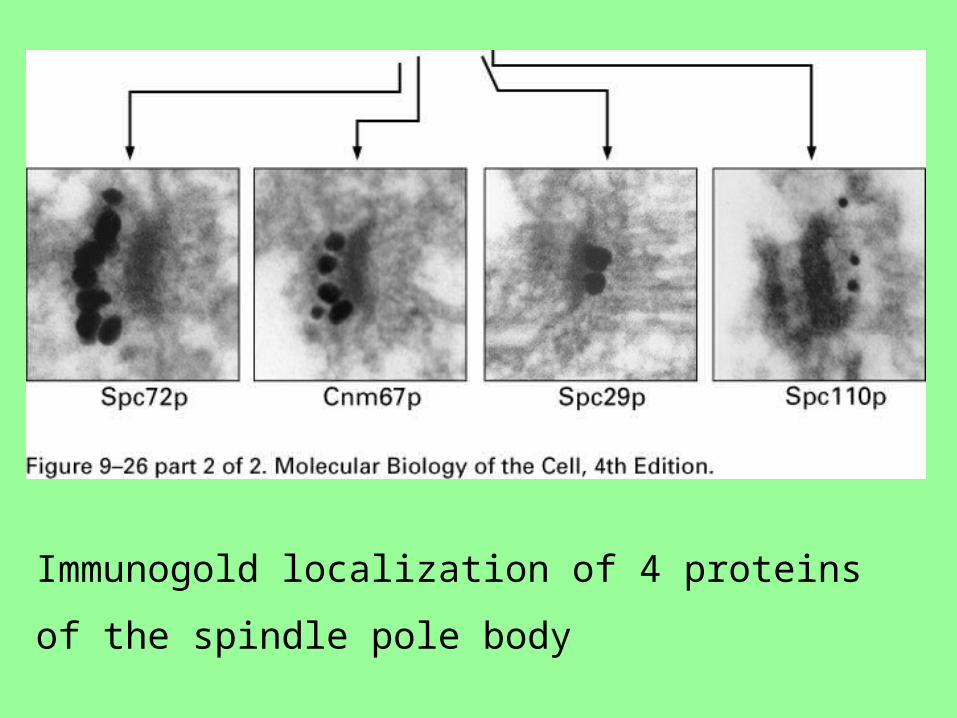
Immunogold localization of 4 proteins of the spindle pole body
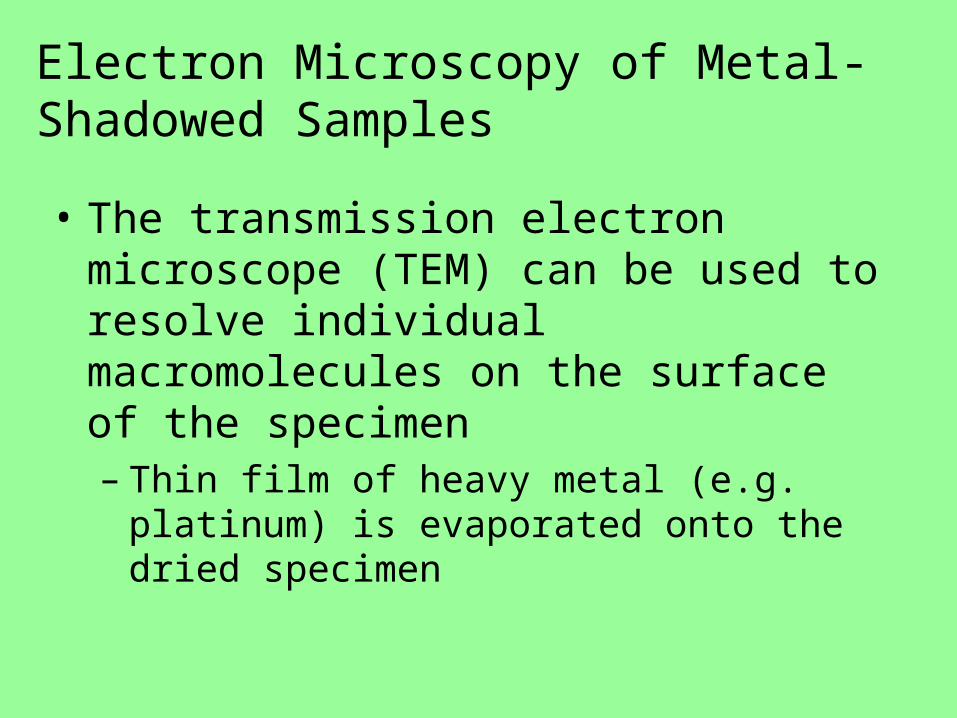
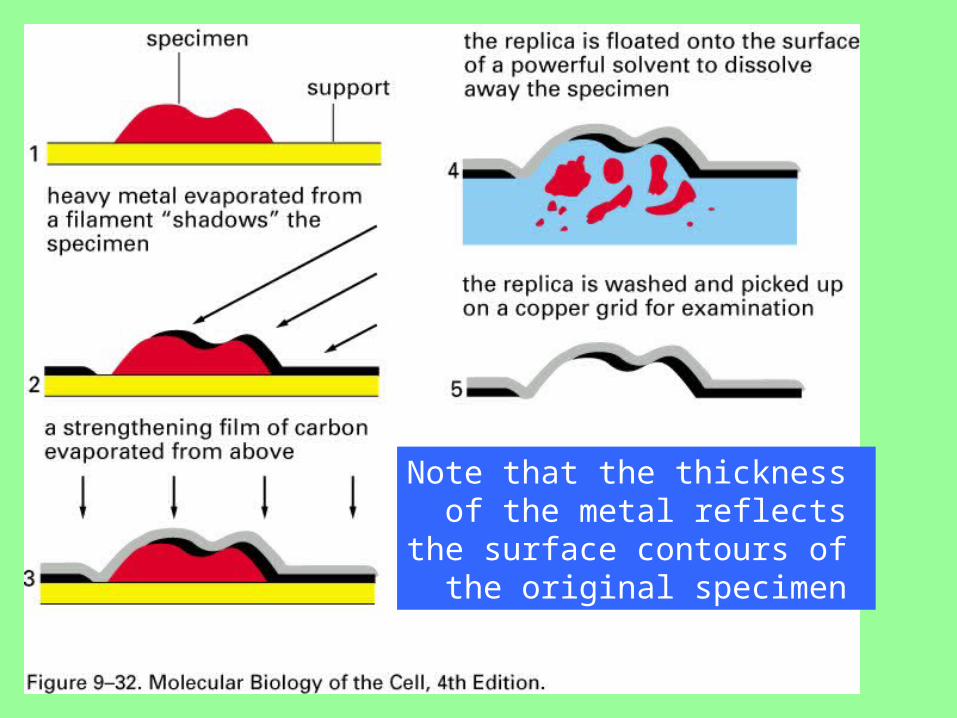
Electron Microscopy of Metal-Shadowed Samples
• The transmission electron microscope (TEM) can be used to resolve individual macromolecules on the surface of the specimen– Thin film of heavy metal (e.g. platinum) is
evaporated onto the dried specimen
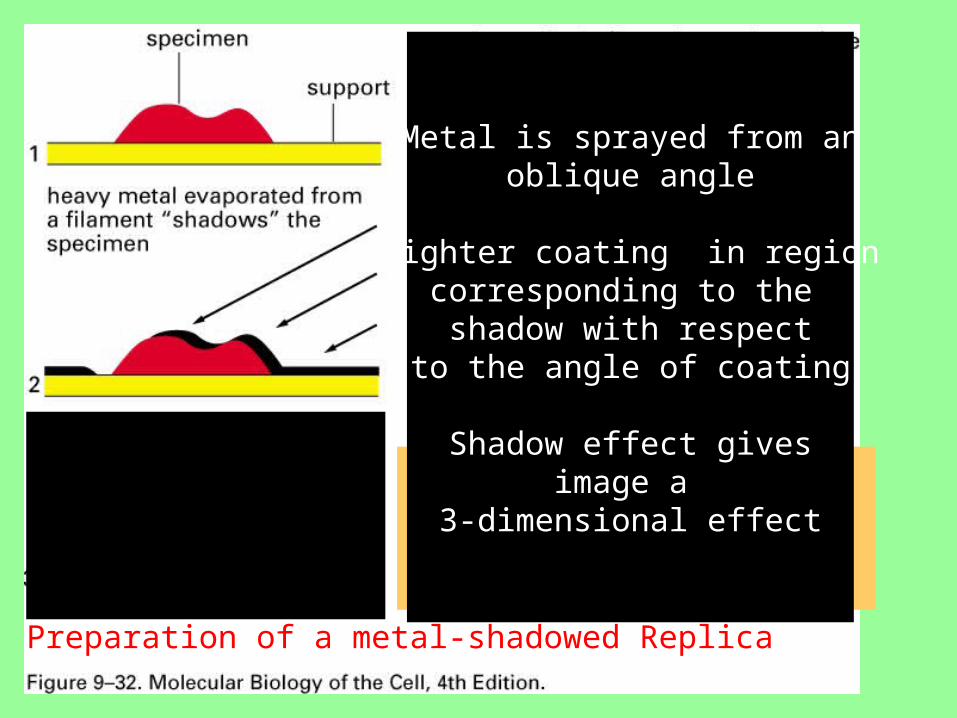
Preparation of a metal-shadowed Replica
Note that the thickness of the metal reflects the surface contours of the original specimen
Metal is sprayed from anoblique angle
Lighter coating in regioncorresponding to the shadow with respect
to the angle of coating
Shadow effect givesimage a
3-dimensional effect
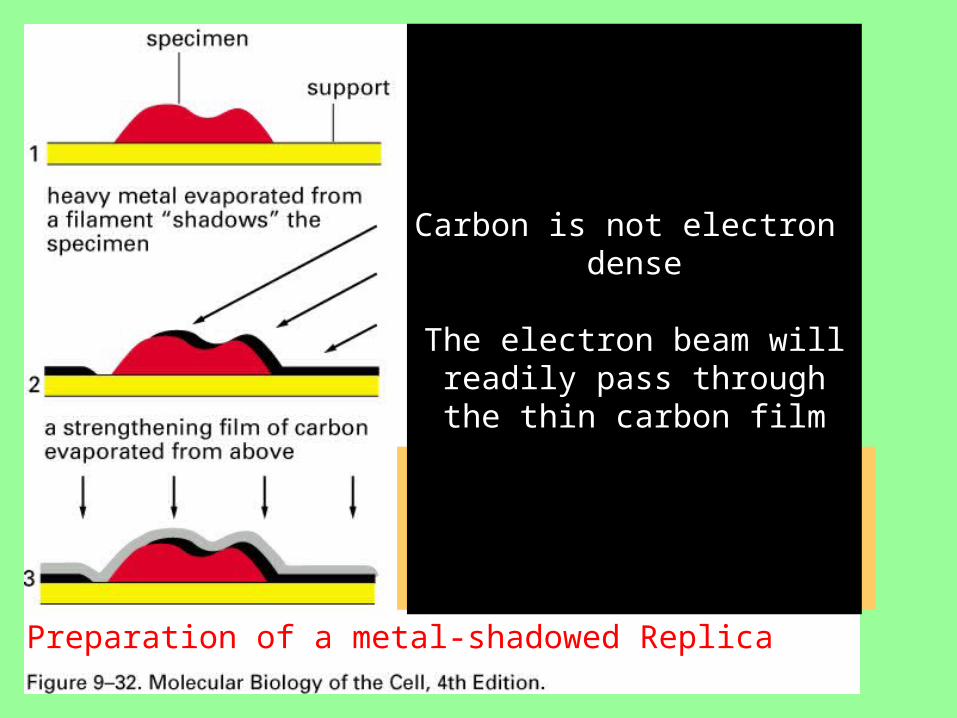
Preparation of a metal-shadowed Replica
Note that the thickness of the metal reflects the surface contours of the original specimen
Carbon is not electron dense
The electron beam willreadily pass throughthe thin carbon film
Electron Microscopy of Metal-ShadowedSamples
• For thick samples (e.g. cells), the organic material is dissolved away after shadowing– Only the thin metal replica of the surface is
left• This is thin enough for the electron beam to
penetrate (Fig. 9-32)
Preparation of a metal-shadowed Replica
Note that the thickness of the metal reflects the surface contours of the original specimen
Freeze-Fracture Electron Microscopy• Metal shadowing of replicas can be used in
conjunction with freeze fracture electron microscopy• Provides views of the inside surface of cell
membranes– Cells are frozen in liquid nitrogen
• Frozen block is cracked with a knife blade– The fracture plane passes through the hydrophobic interior of
membranes » Interior surfaces of the cell membrane are exposed
• Fracture faces are shadowed with platinum– Organic material is dissolved away
» Replicas viewed under the electron microscope (Fig. 9-33)
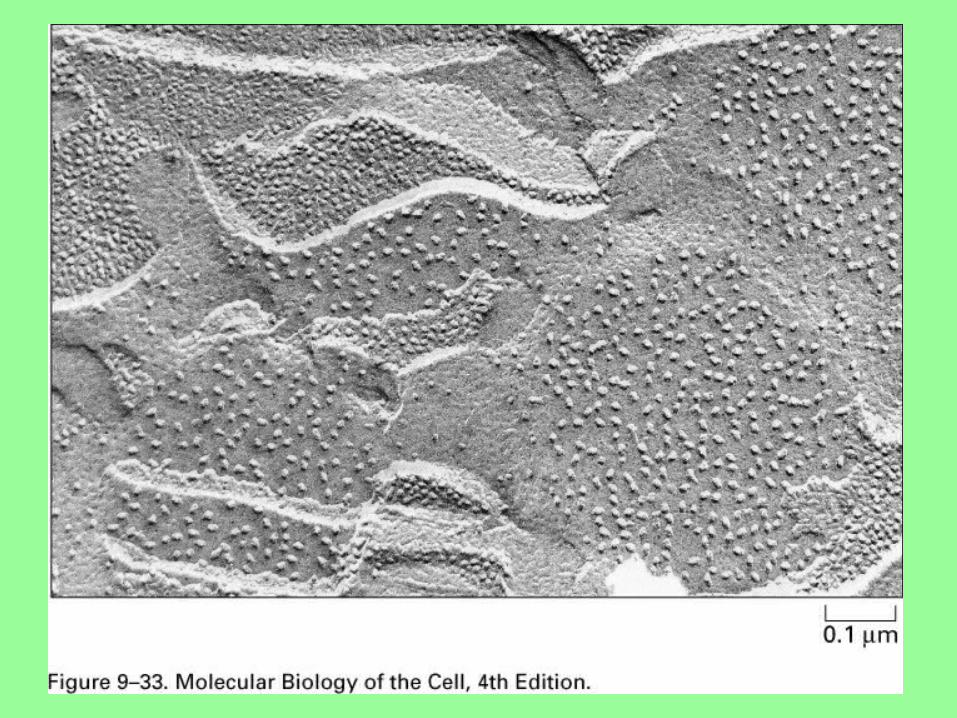
Freeze-fracture electron micrograph of Thylakoid membranes
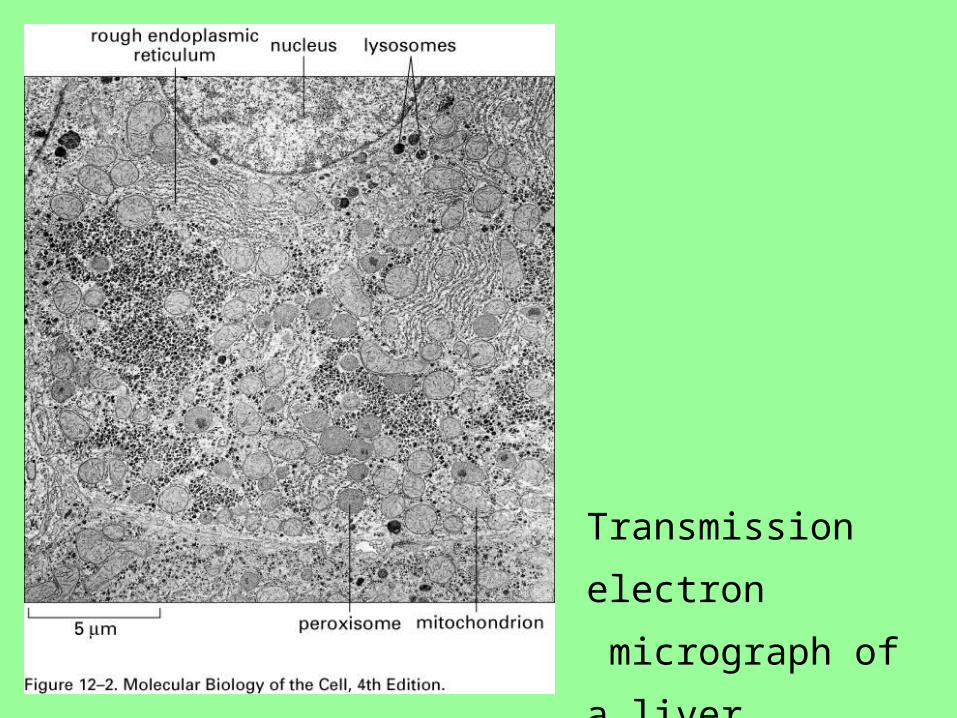
Transmission electron
micrograph of a liver
cell in cross section
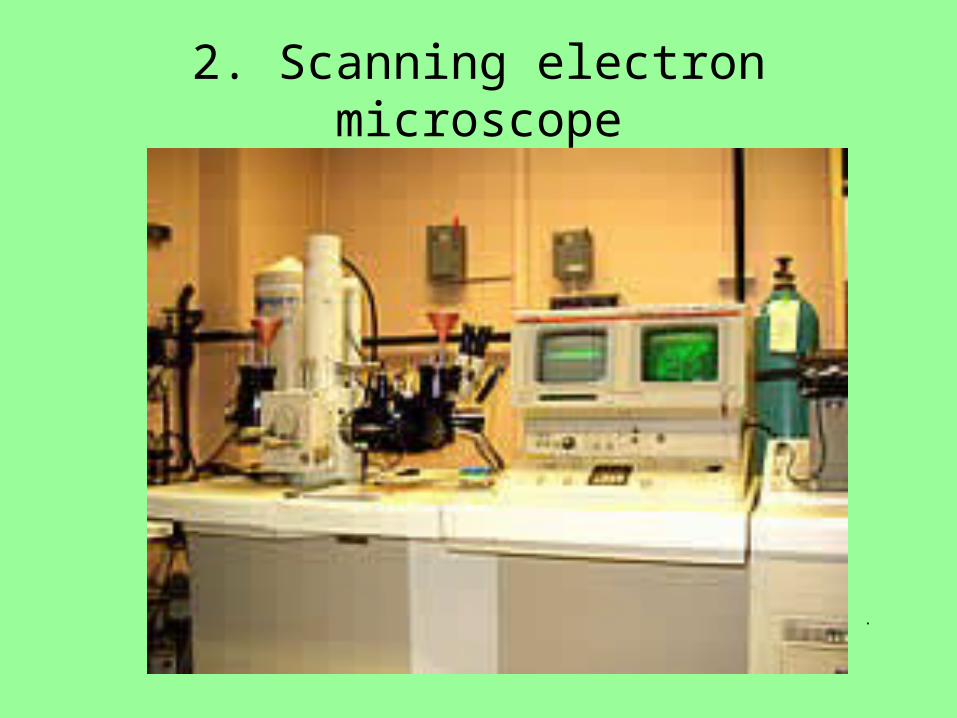
2. Scanning electron microscope
•
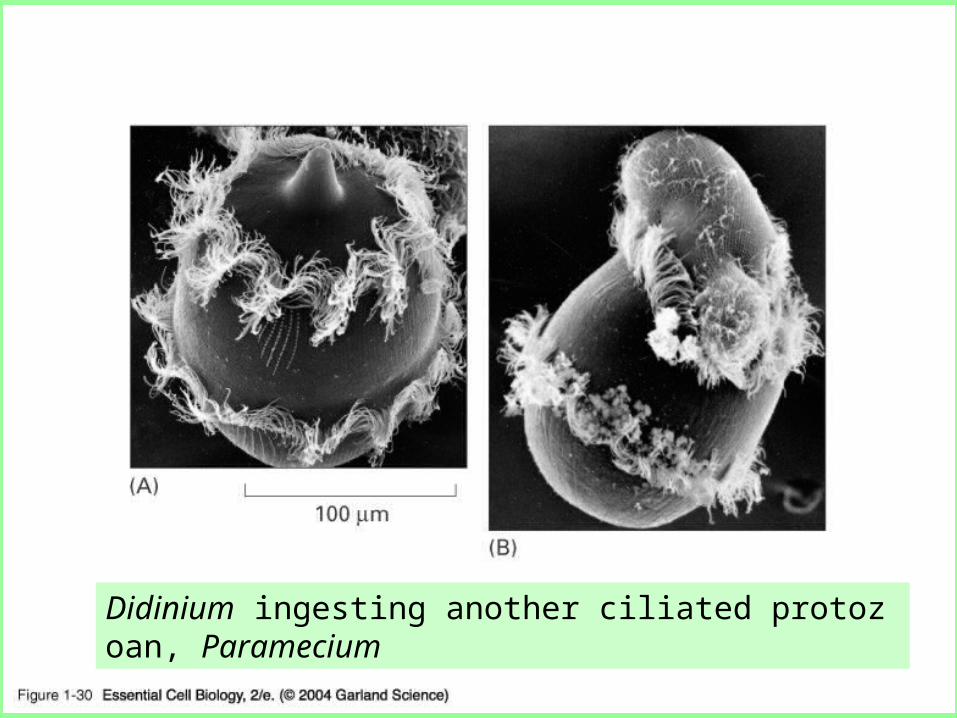
01_30_protozoan eats.jpg
Didinium ingesting another ciliated protozoan, Paramecium
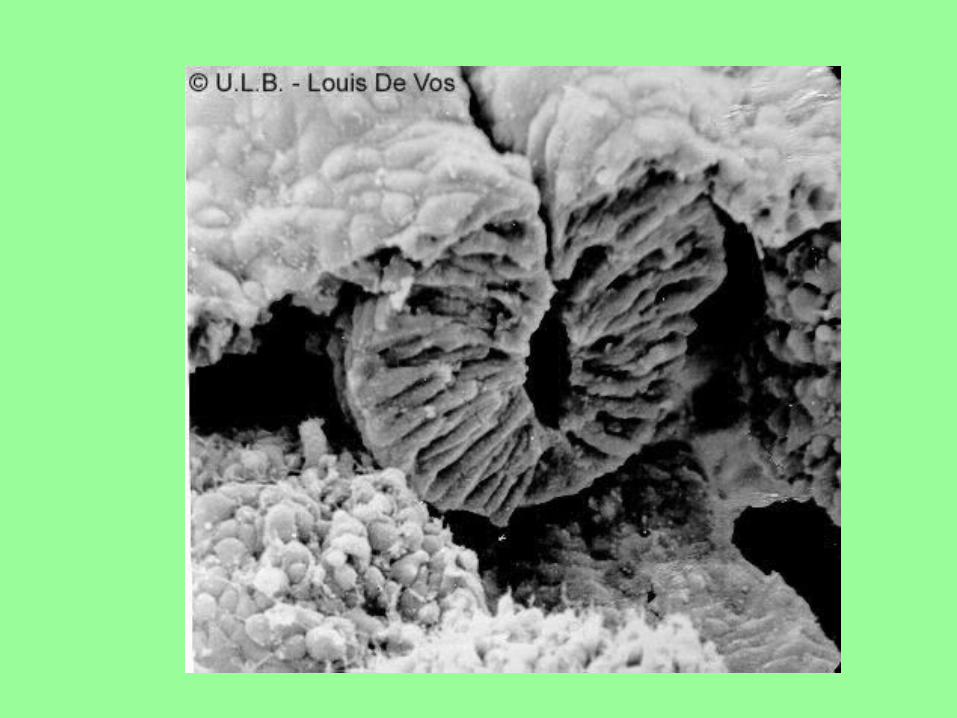
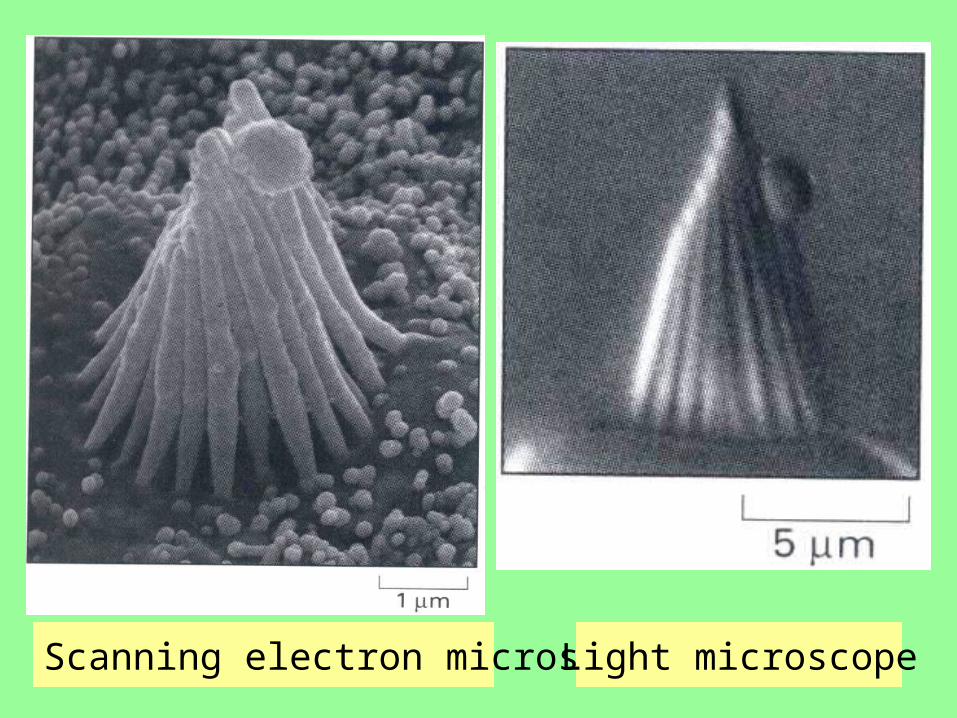
Scanning electron microscopy Light microscope
六、 Flow cytometer , FCM
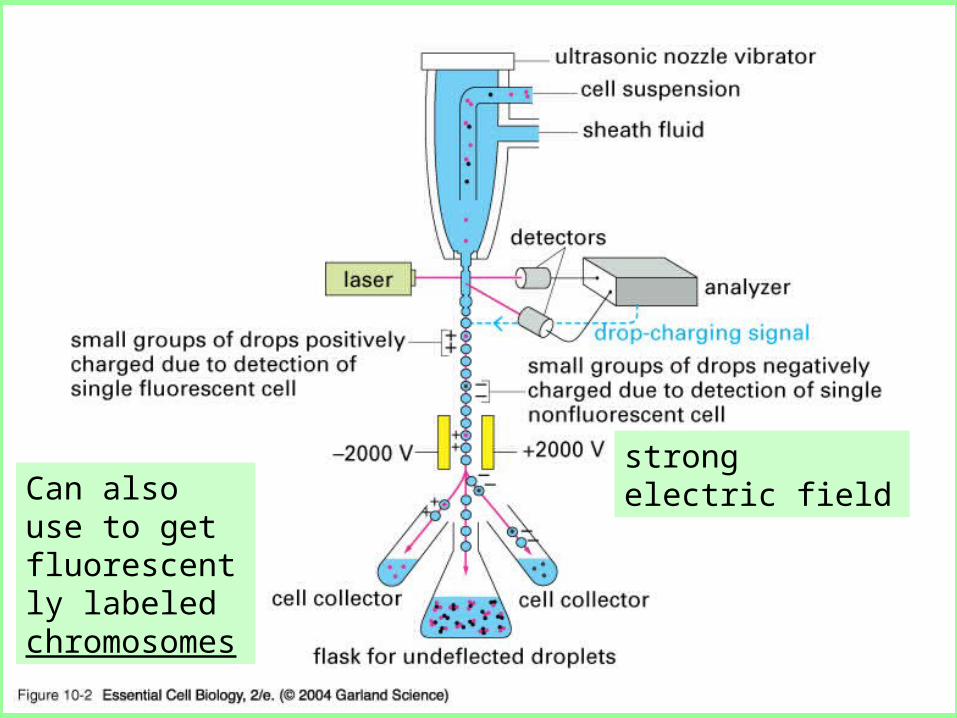
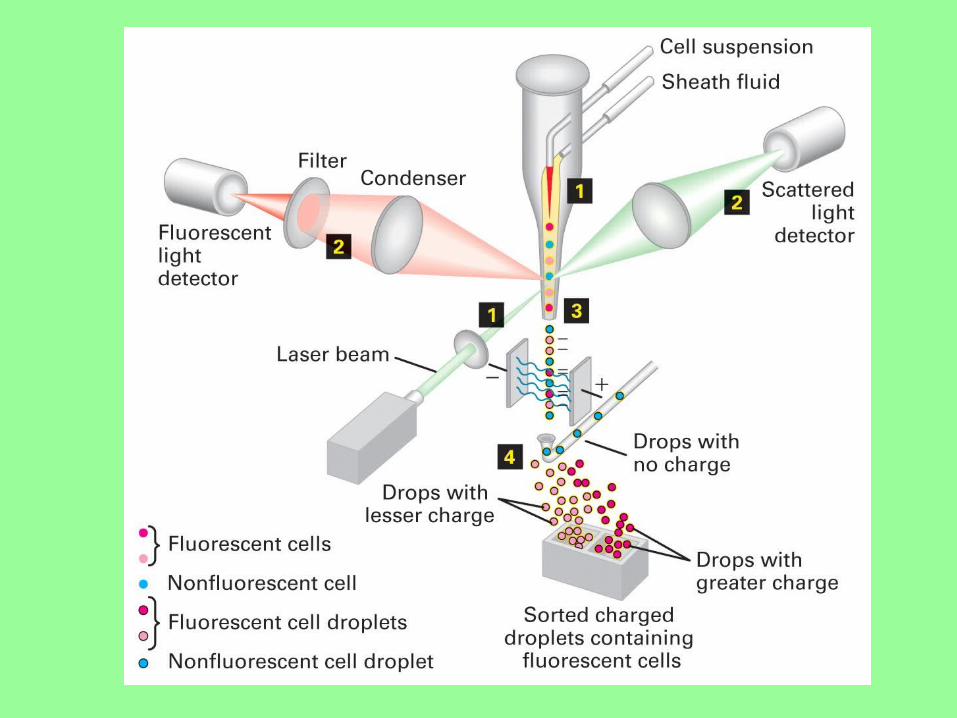
10_02_cell_sorter.jpg
Can also use to get fluorescently labeled chromosomes
strong electric field
七、 Purification of Cells and Their parts
Centrifugation
Velocity sedimentation
Differential centrifugation
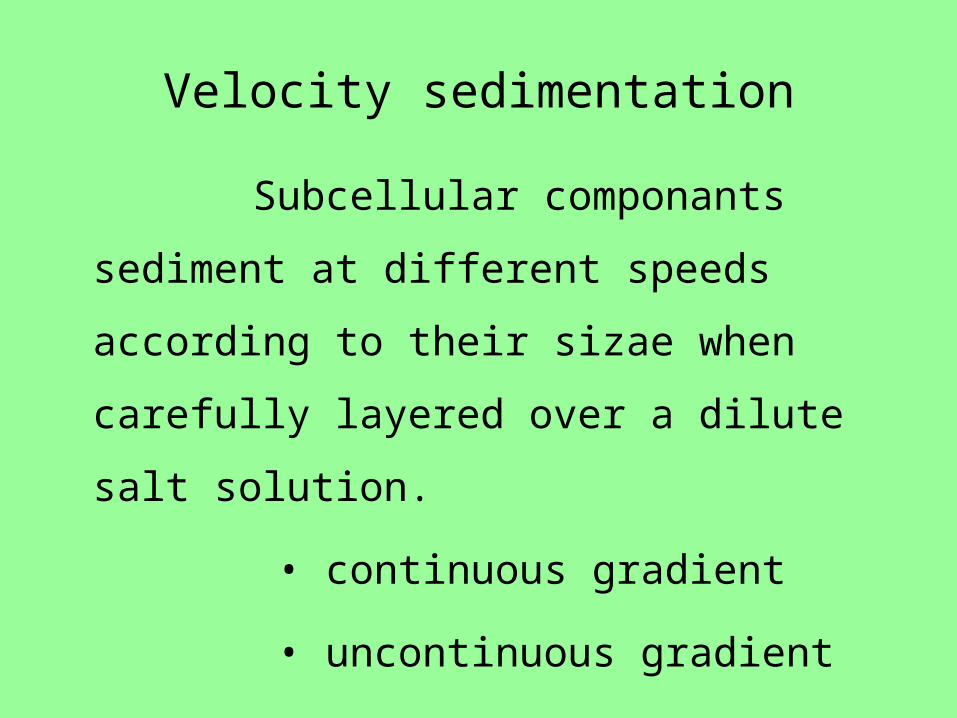
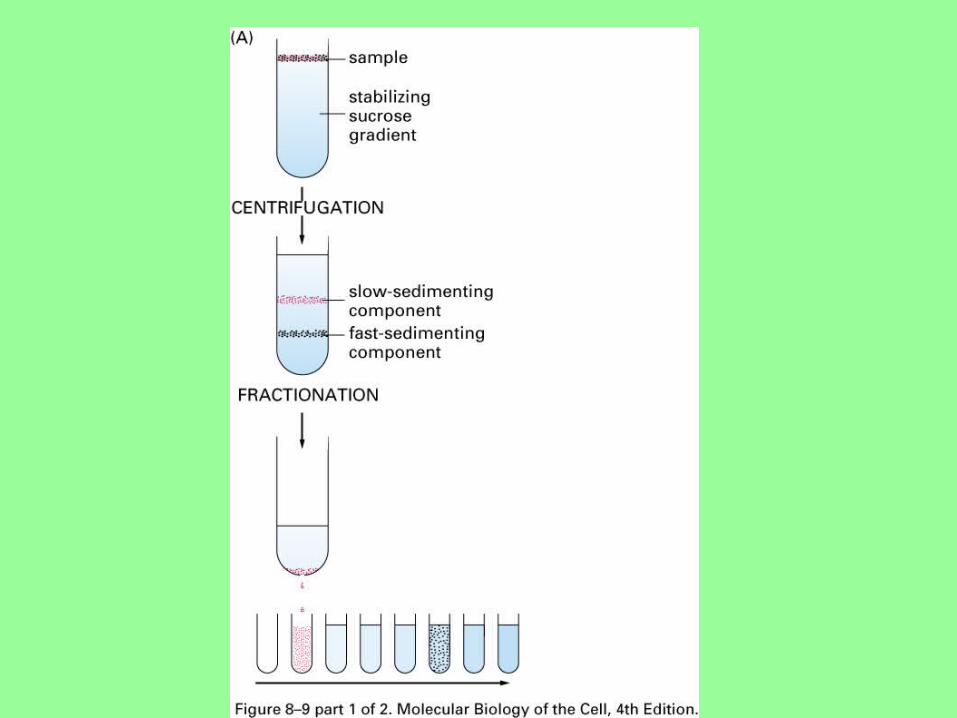
Velocity sedimentation
Subcellular componants sediment at
different speeds according to their sizae
when carefully layered over a dilute salt
solution.
• continuous gradient
• uncontinuous gradient

Pouring a Sucrose gradient
Stir Bar
HighDensity
LowDensity
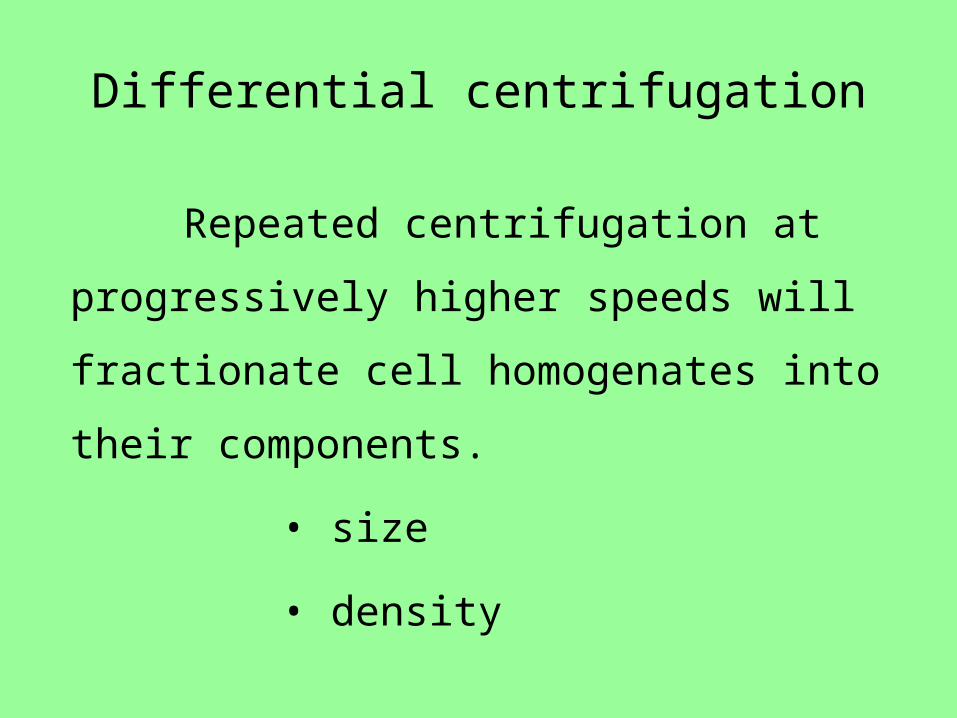
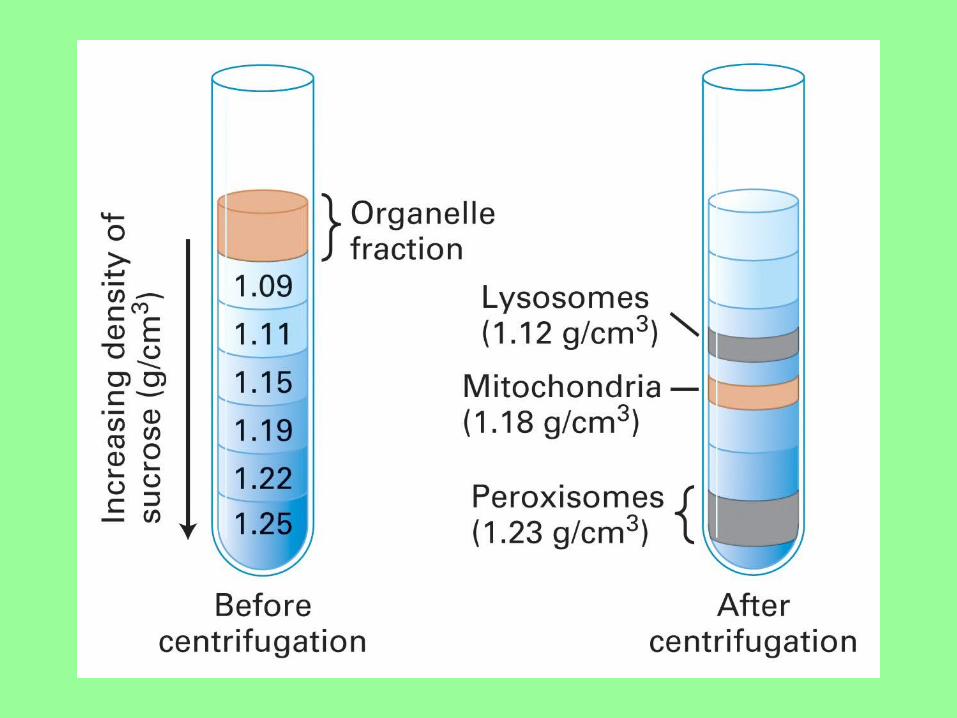
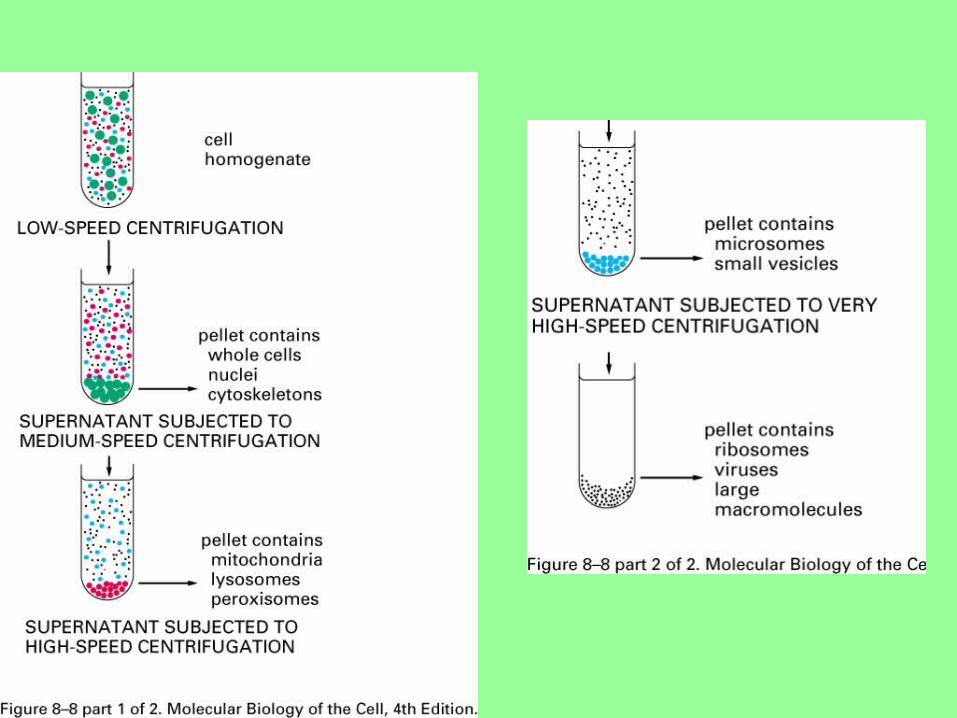
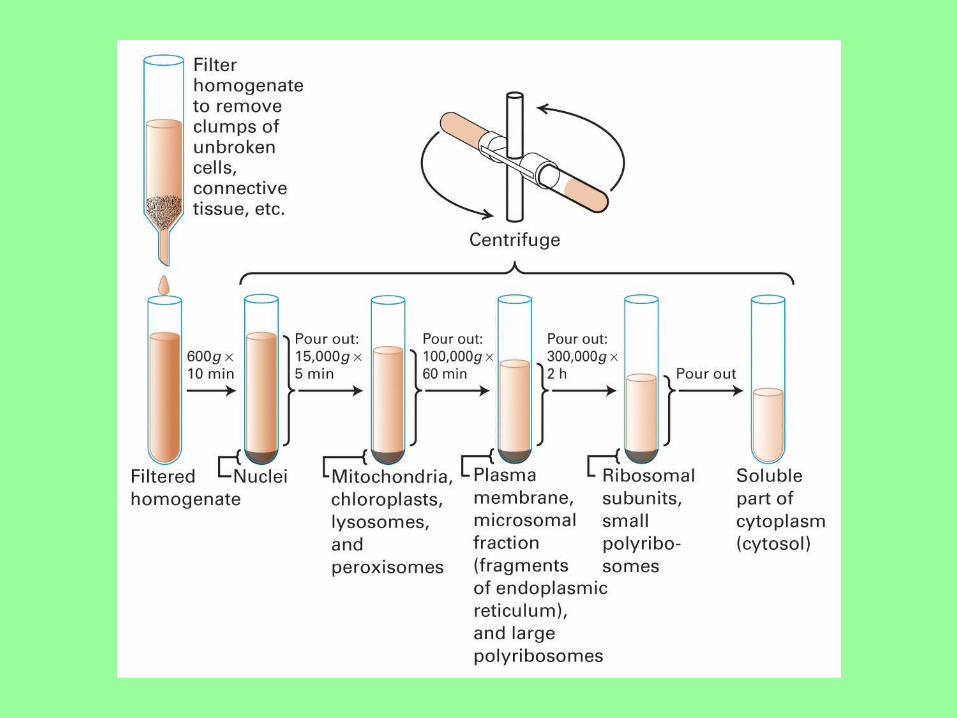
Differential centrifugation
Repeated centrifugation at progressively
higher speeds will fractionate cell
homogenates into their components.
• size
• density
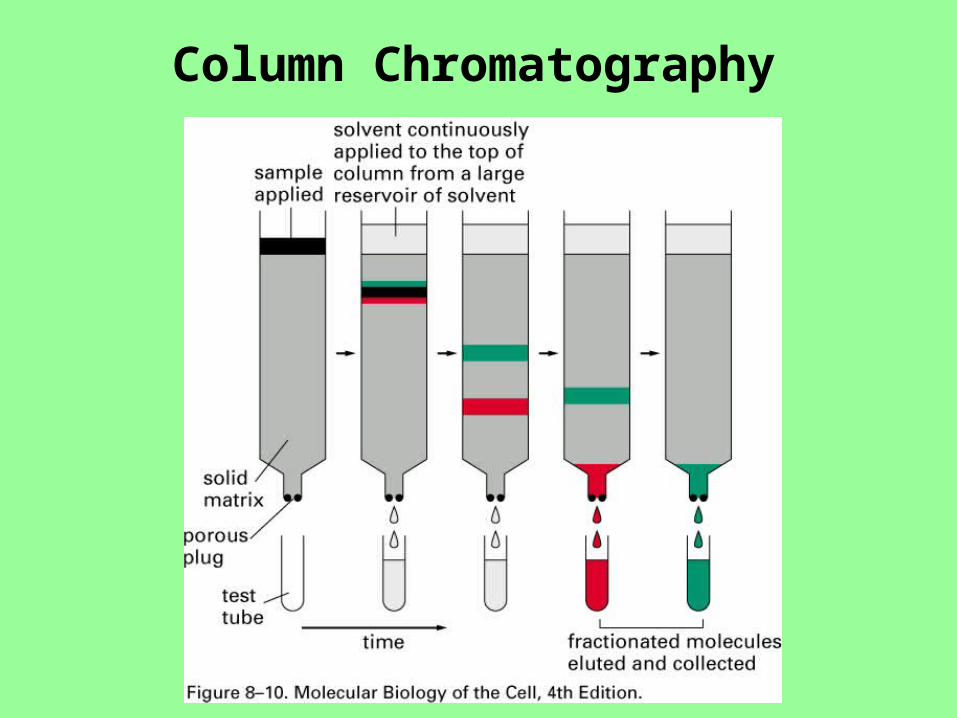
Column Chromatography
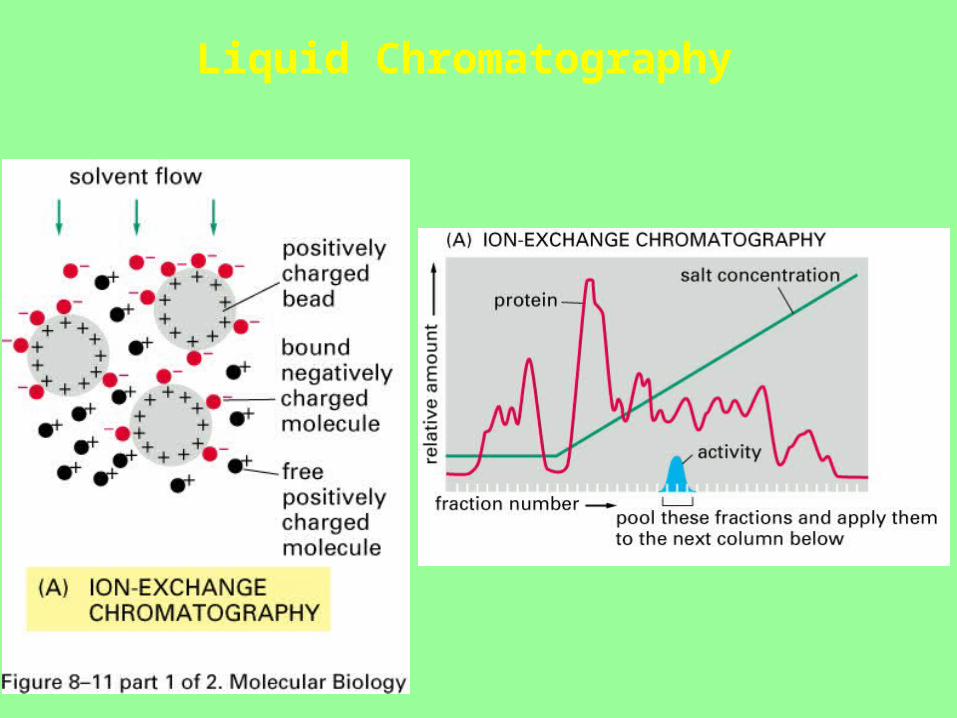
Liquid Chromatography
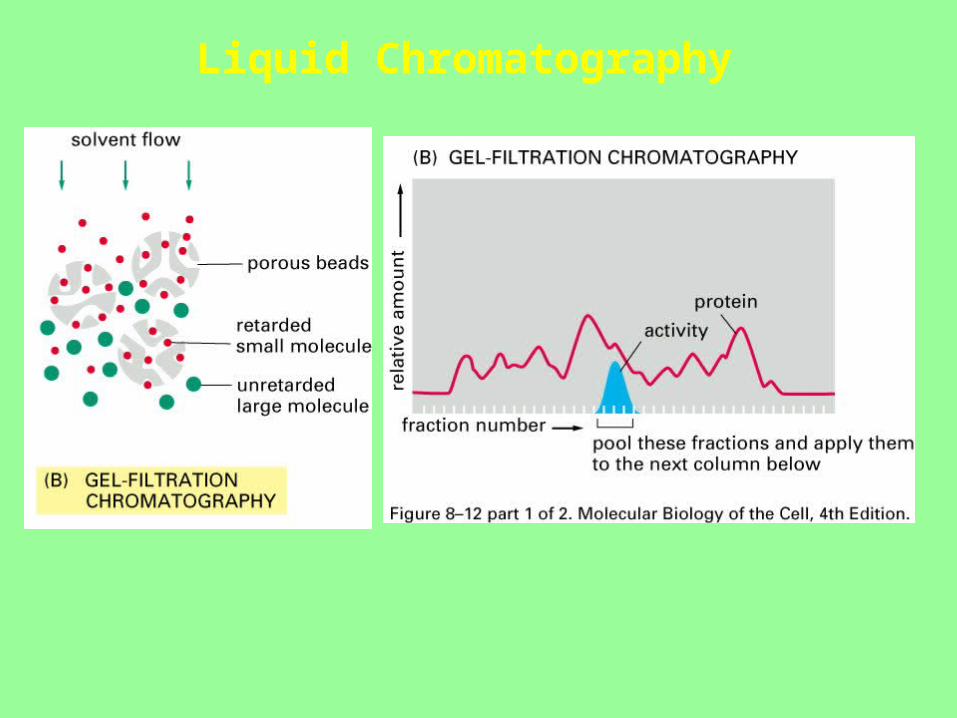
Liquid Chromatography
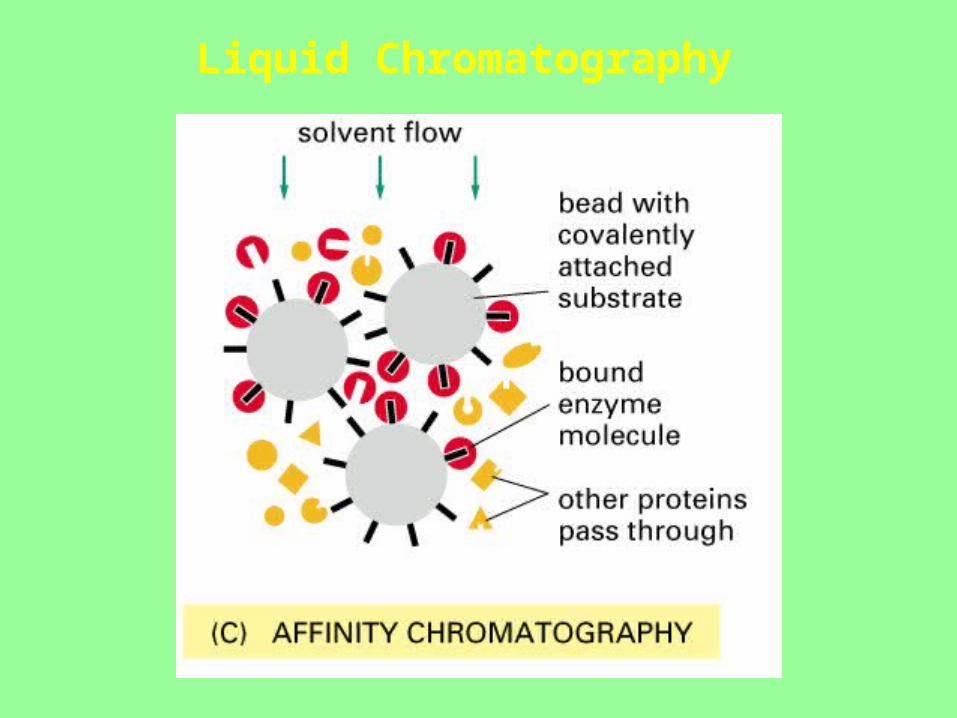
Liquid Chromatography
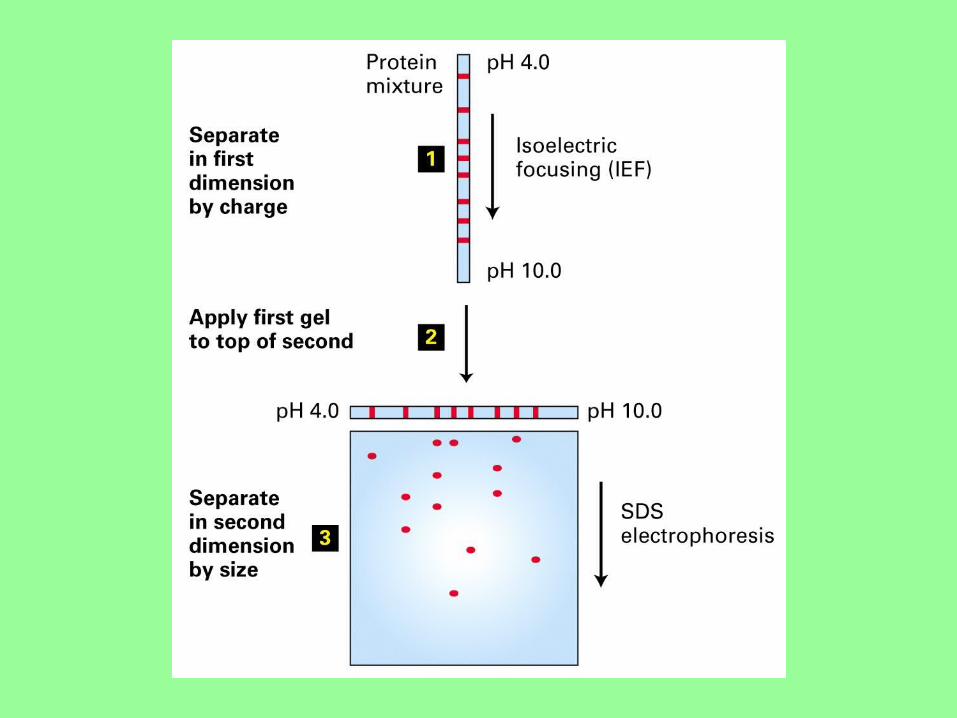
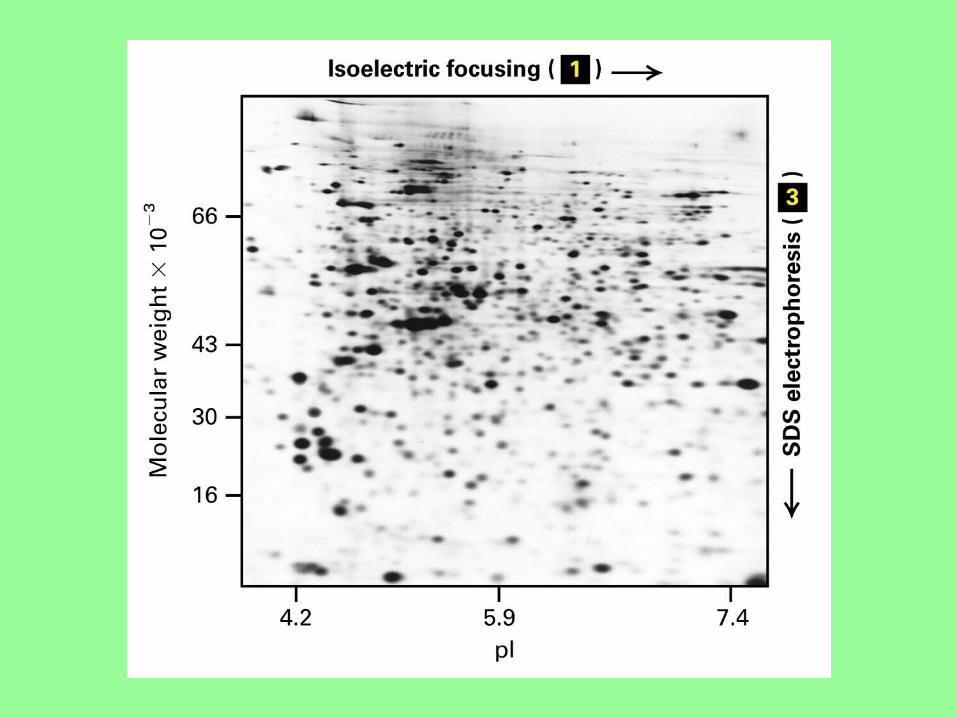
Protein electrophoresis
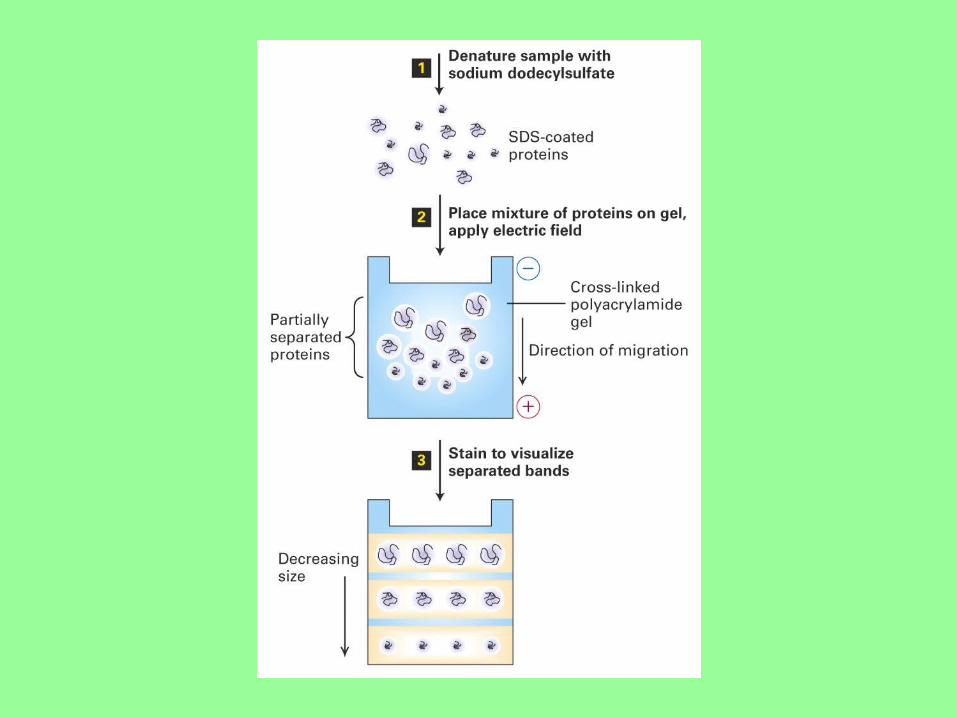
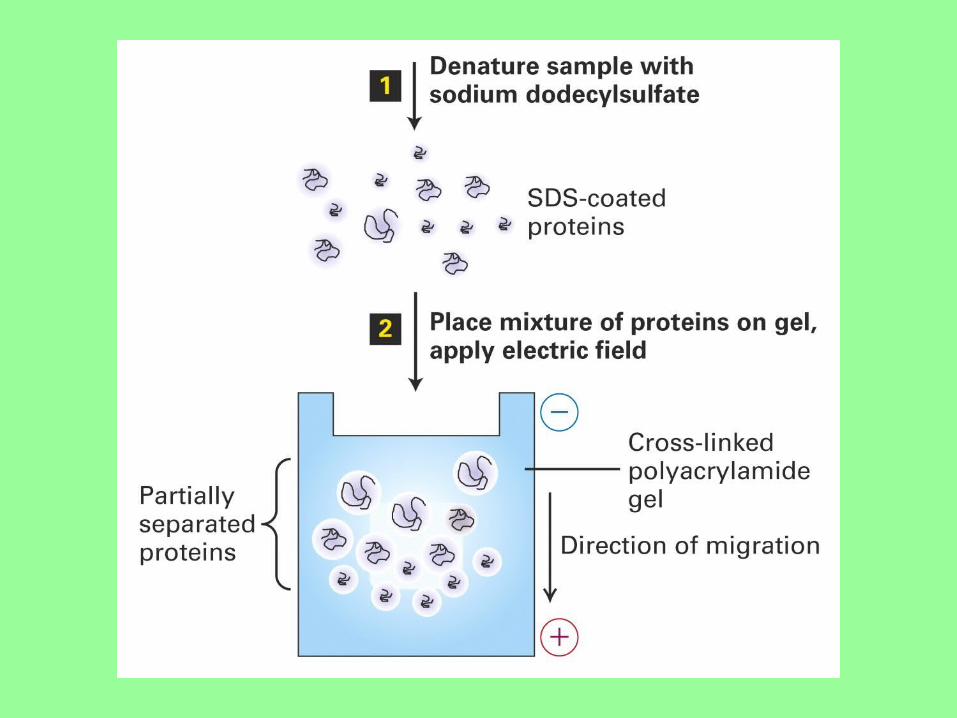
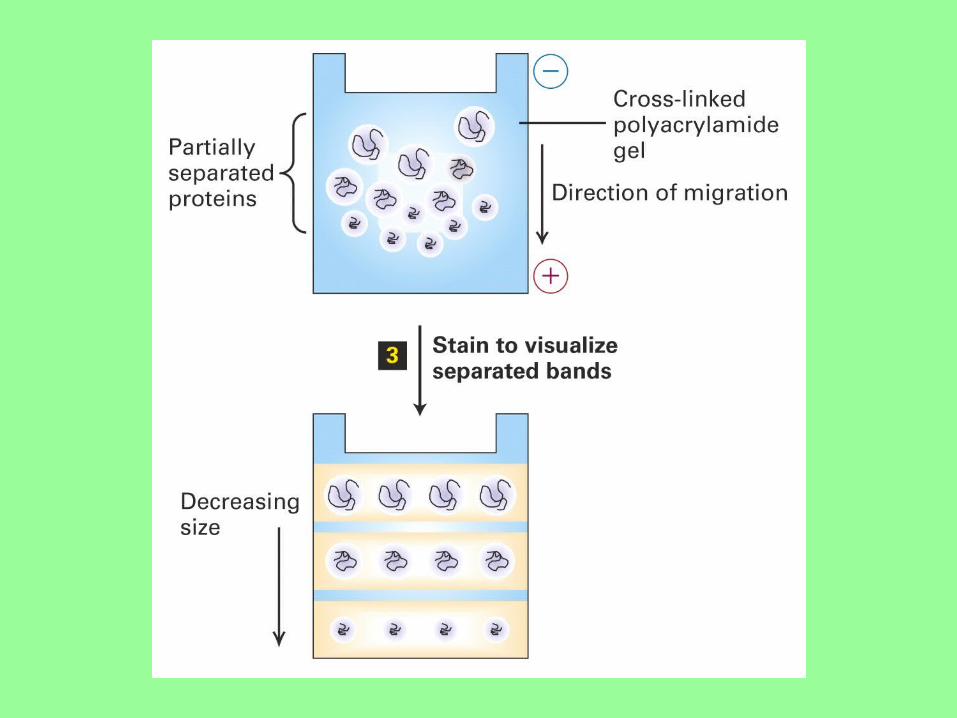
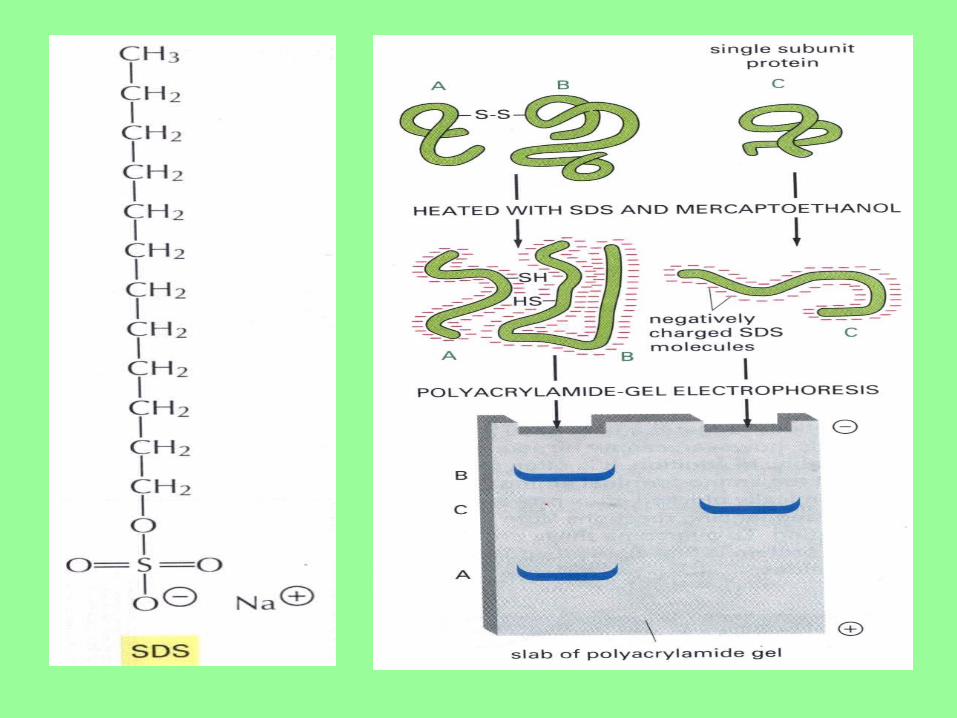
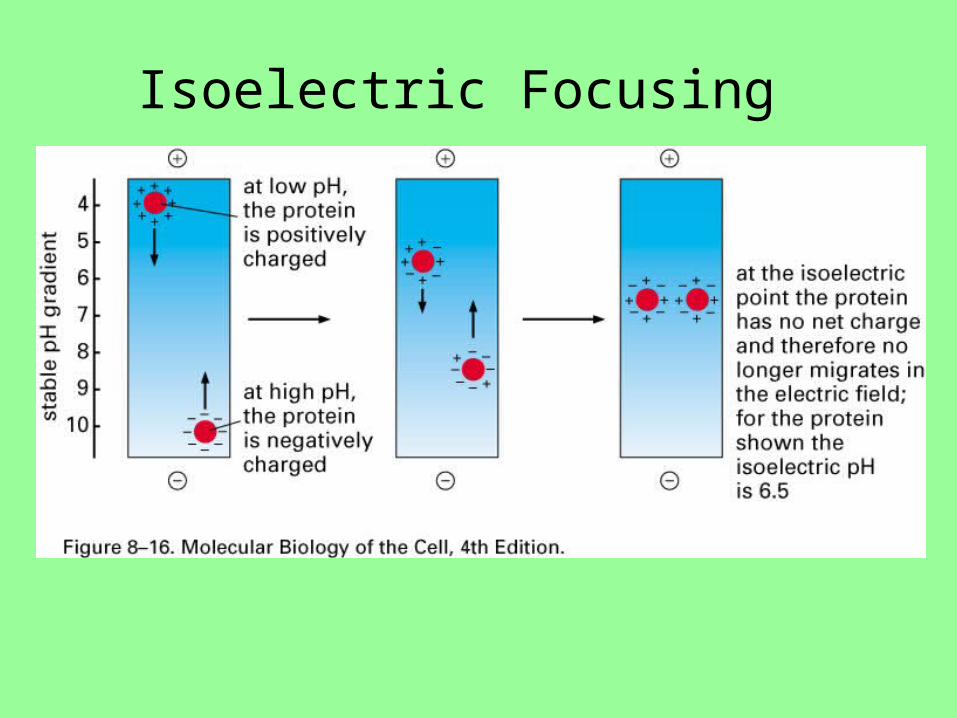
Isoelectric Focusing
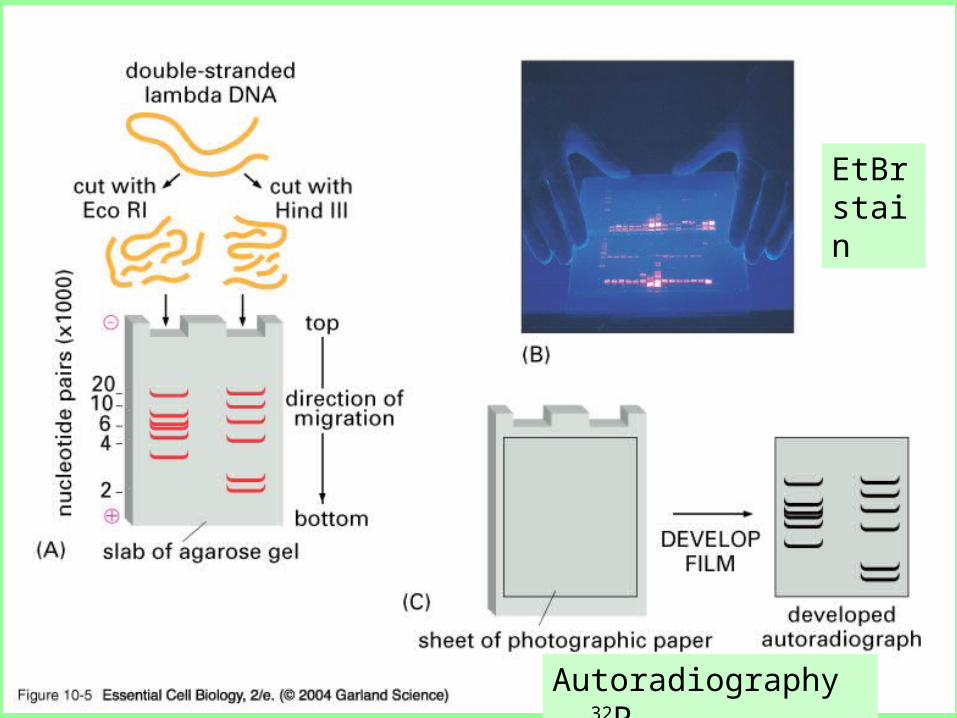
10_05_gel.electrophor.jpgEtBr stain
Autoradiography – 32P
八、 Molecular Methods
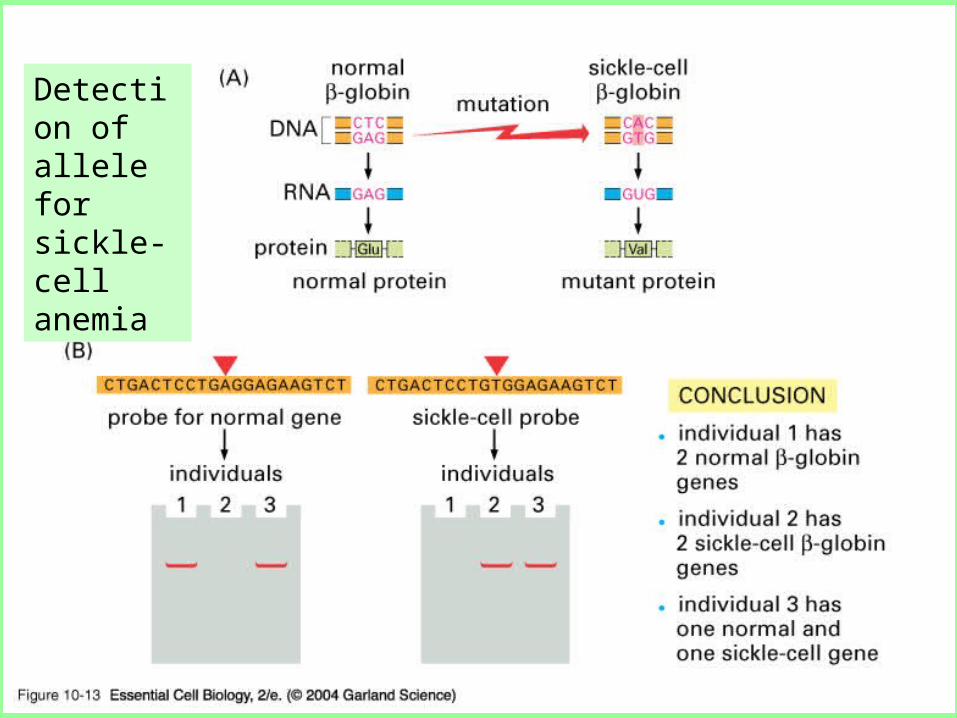
10_13_hybridization.jpgDetection of allele for sickle-cell anemia
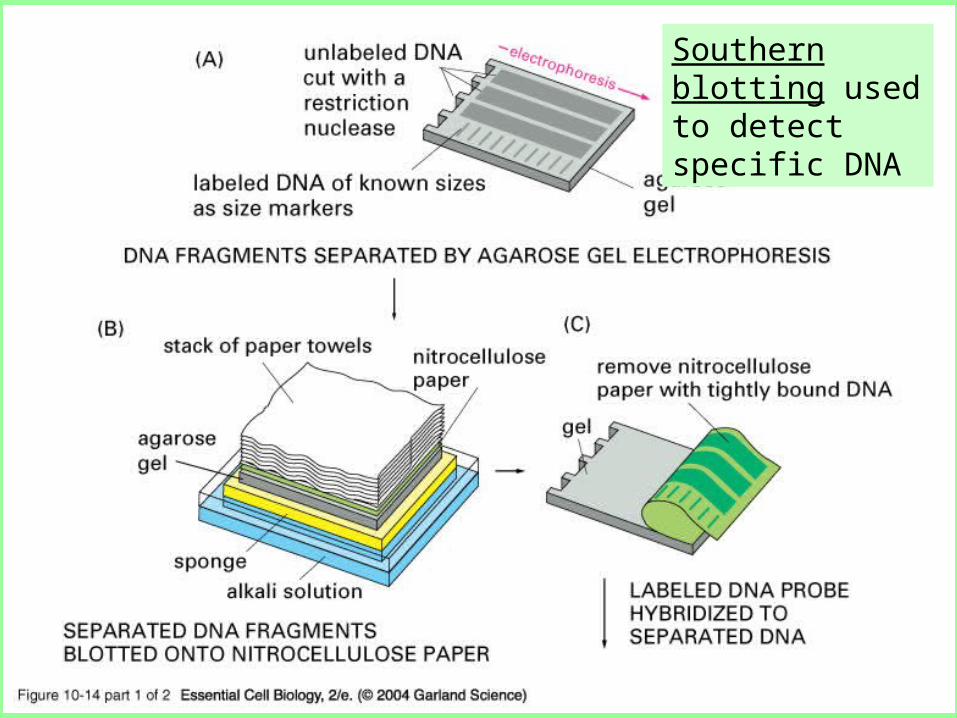
10_14_1_Southrn.blotting.jpgSouthern blotting used to detect specific DNA
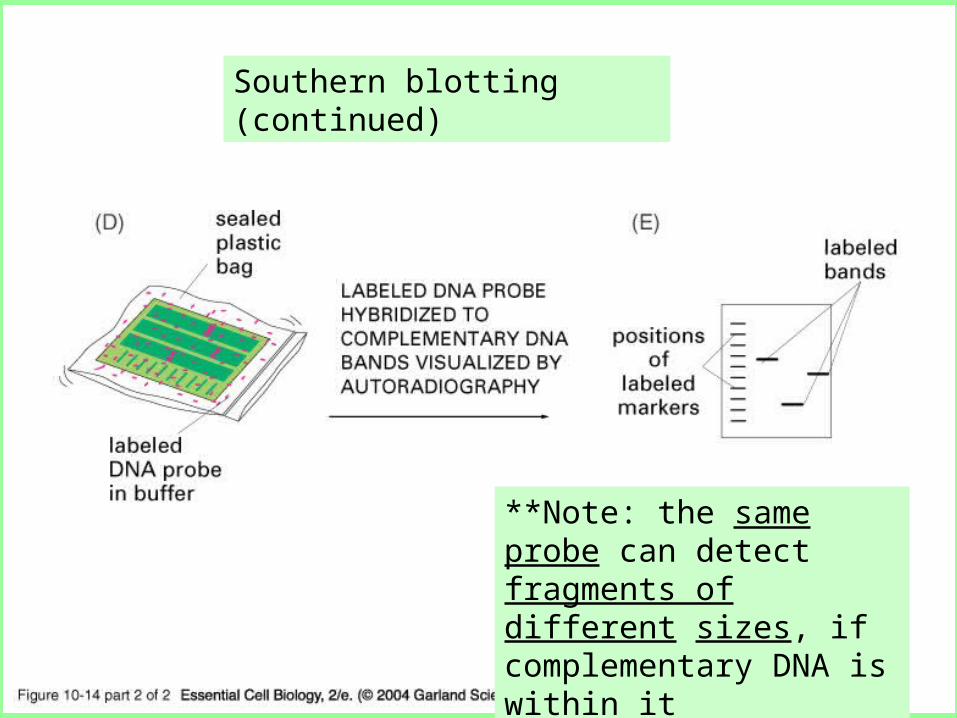
10_14_2_Southrn.blotting.jpgSouthern blotting (continued)
**Note: the same probe can detect fragments of different sizes, if complementary DNA is within it


![集成微流控芯片在单细胞测序样品制备中的应用gene.pku.edu.cn/media/publication/papers/Yu_SciChinaChem_Rev.pdf · 了新的思路[21]. 又如, 通过单细胞全基因组扩增测序,](https://img.pdfslide.us/doc/110x75/5dd13165d6be591ccb64aad9/eecoecefccgenepkueducnmediapublicationpapersyuscichinachemrevpdf.jpg)


