Embed Size (px)
Citation preview


ix
Preface
Th ere has been a revolution in our understanding of human perception that
goes under the name “ active vision. ” Active vision means that we should
think about graphic designs as cognitive tools, enhancing and extending
our brains. Although we can, to some extent, form mental images in our
heads, we do much better when those images are out in the world, on paper
or computer screen. Diagrams, maps, web pages, information graphics,
visual instructions, and technical illustrations all help us to solve problems
through a process of visual thinking. We are all cognitive cyborgs in this
Internet age in the sense that we rely heavily on cognitive tools to amplify
our mental abilities. Visual thinking tools are especially important because
they harness the visual pattern fi nding part of the brain. Almost half the
brain is devoted to the visual sense and the visual brain is exquisitely capa-
ble of interpreting graphical patterns, even scribbles, in many diff erent
ways. Often, to see a pattern is to understand the solution to a problem.
Th e active vision revolution is all about understanding perception as a
dynamic process. Scientists used to think that we had rich images of the
world in our heads built up from the information coming in through the
eyes. Now we know that we only have the illusion of seeing the world in
detail. In fact the brain grabs just those fragments that are needed to exe-
cute the current mental activity. Th e brain directs the eyes to move, tunes
up parts of itself to receive the expected input, and extracts exactly what
PRE-P370896.indd ixPRE-P370896.indd ix 1/24/2008 12:09:43 PM1/24/2008 12:09:43 PM
x
is needed for our current thinking activity, whether that is reading a map,
making a peanut butter and jelly sandwich, or looking at a poster. Our
impression of a rich detailed world comes from the fact that we have the
capability to extract anything we want at any moment through a move-
ment of the eye that is literally faster than thought. Th is is automatic and
so quick that we are unaware of doing it, giving us the illusion that we
see stable detailed reality everywhere. Th e process of visual thinking is a
kind of dance with the environment with some information stored inter-
nally and some externally and it is by understanding this dance that we
can understand how graphic designs gain their meaning.
Active vision has profound implications for design and this is the
subject of this book.
It is a book about how we think visually and what that understanding
can tell us about how to design visual images. Understanding active vision
tells us which colors and shapes will stand out clearly, how to organize
space, and when we should use images instead of words to convey an idea.
Early on in the writing and image creation process I decided to “ eat my
own dog food ” and apply active vision-based principles to the design of
this book. One of these principles being that when text and images are
related they should be placed in close proximity. Th is is not as easy as it
sounds. It turns out that there is a reason why there are labeled fi gure
legends in academic publishing (e.g. Figure 1, Figure 2, etc.). It makes the
job of the compositor much easier. A compositor is a person whose spe-
cialty is to pack images and words on the page without reading the text .
Th is leads to the labeled fi gure and the parenthetical phrase often found
in academic publishing, “ see Figure X ” . Th is formula means that Figure X
need not be on the same page as the accompanying text. It is a bad idea
from the design perspective and a good idea from the perspective of the
publisher. I decided to integrate text and words and avoid the use of “ see
Figure X ” and the result was a diffi cult process and some confl ict with
a modern publishing house that does not, for example, invite authors
to design meetings, even when the book is about design. Th e result is
something of a design compromise but I am grateful to the individuals at
Elsevier who helped me with what has been a challenging exercise.
Th ere are many people who have helped. Diane Cerra with Elsevier was
patient with the diffi cult demands I made and full of helpful advice when
I needed it. Denise Penrose guided me through the later stages and came
up with the compromise solution that is realized in these pages. Dennis
Schaefer and Alisa Andreola helped with the design. Mary James and Paul
Gottehrer provided cheerful and effi cient support through the detailed
PRE-P370896.indd xPRE-P370896.indd x 1/24/2008 12:09:44 PM1/24/2008 12:09:44 PM

Preface xi
editing the production process. My wife, Dianne Ramey, read the whole
thing twice and fi xed a very great number of grammar and punctuation
errors. I am very grateful to Paul Catanese of the New Media Department
at San Francisco State University and David Laidlaw of the Computer
Graphics Group at Brown University who provided content reviews
and told me what was clear and what was not. I did major revisions to
Chapters 3 and 8 as a result of their input.
Th is book is an introduction to what the burgeoning science of per-
ception can tell us about visual design. It is intended for anyone who does
design in a visual medium and it should be of special interest to anyone who
does graphic design for the internet or who designs information graphics
of one sort or another. Design can take ideas from anywhere, from art and
culture as well as particular design genres. Science can enrich the mix.
Colin Ware
January 2008
PRE-P370896.indd xiPRE-P370896.indd xi 1/24/2008 12:09:44 PM1/24/2008 12:09:44 PM
1
Visual Queries
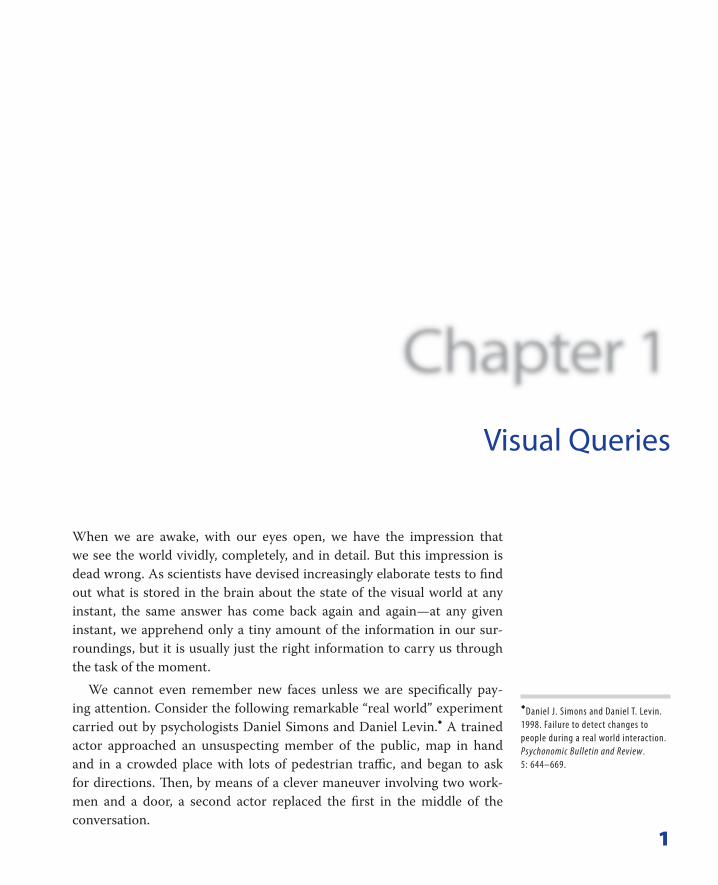
When we are awake, with our eyes open, we have the impression that
we see the world vividly, completely, and in detail. But this impression is
dead wrong. As scientists have devised increasingly elaborate tests to fi nd
out what is stored in the brain about the state of the visual world at any
instant, the same answer has come back again and again—at any given
instant, we apprehend only a tiny amount of the information in our sur-
roundings, but it is usually just the right information to carry us through
the task of the moment.
We cannot even remember new faces unless we are specifi cally pay-
ing attention. Consider the following remarkable “ real world ” experiment
carried out by psychologists Daniel Simons and Daniel Levin. � A trained
actor approached an unsuspecting member of the public, map in hand
and in a crowded place with lots of pedestrian traffi c, and began to ask
for directions. Th en, by means of a clever maneuver involving two work-
men and a door, a second actor replaced the fi rst in the middle of the
conversation.
�
Daniel J. Simons and Daniel T. Levin.
1998. Failure to detect changes to
people during a real world interaction.
Psychonomic Bulletin and Review .
5: 644–669.
CH01-P370896.indd 1CH01-P370896.indd 1 1/23/2008 6:48:55 PM1/23/2008 6:48:55 PM

2
Eager to help.
A second actor resumes the request for information.
Workmen (also actors) arrive with door. The two must step apart to get out of the way.
Unsuspecting member of the public fails to notice they are talking to a different person!
Actor with map asks unsuspecting member of the public for directions.
Original actor with map creeps away.
Th e second actor could have diff erent clothing and diff erent hair color,
yet more than 50 percent of the time the unsuspecting participants failed
to notice the substitution. Incredibly, people even failed to notice a change
in gender! In some of the experiments, a male actor started the dialogue
and a female actor was substituted under the cover of the two workmen
with the door, but still most people failed to spot the switch.
What is going on here? On the one hand, we have a subjective impres-
sion of being aware of everything, on the other hand, it seems, we see very
little. How can this extraordinary fi nding be reconciled with our vivid
impression that we see the whole visual environment? Th e solution, as psy-
chologist Kevin O ’ Regan � puts it, is that “ Th e world is its own memory. ”
We see very little at any given instant, but we can sample any part of our
visual environment so rapidly with swift eye movement, that we think we
have all of it at once in our consciousness experience. We get what we need,
when we need it. Th e reason why the unwitting participants in Simons and
Levin ’ s experiment failed to notice the changeover was that they were doing
their best to concentrate on the map, and although they had undoubtedly
glanced at the face of the person holding it, that information was not criti-
cal and was not retained. We have very little attentional capacity, and infor-
mation unrelated to our current task is quickly replaced with something we
need right now.
Th ere is a very general lesson here about seeing and cognition. Th e
brain, like all biological systems, has become optimized over millennia of
evolution. Brains have a very high level of energy consumption and must
be kept as small as possible, or our heads would topple us over. Keeping
a copy of the world in our brains would be a huge waste of cognitive
resources and completely unnecessary. It is much more effi cient to have
rapid access to the actual world—to see only what we attend to and only
attend to what we need—for the task at hand.
�
Kevin O ’ Regan ’ s essay on the nature of
the consciousness illusion brings into
clear focus the fact that there is a major
problem to be solved, how do we get
a subjective impression of perceiving
a detailed world, while all available
evidence shows that we pick up very
little information. It also points to the
solution—just in time processing.
J.K. O ’ Regan, 1992. Solving the “ real ”
mysteries of visual perception: The
world as an outside memory. Canadian
Journal of Psychology . 46: 461–488.
CH01-P370896.indd 2CH01-P370896.indd 2 1/23/2008 6:48:56 PM1/23/2008 6:48:56 PM
Th e one-tenth of a second or so that it takes to make an eye move-
ment is such a short time in terms of the brain ’ s neuron-based process-
ing clock that it seems instantaneous. Our illusory impression that we
are constantly aware of everything happens because our brains arrange
for eye movements to occur and the particularly relevant information to
be picked up just as we turn our attention to something we need. We do
not have the whole visual world in conscious awareness. In truth, we have
very little, but we can get anything we need through mechanisms that are
rapid and unconscious. We are unaware that time has passed and cogni-
tive eff ort has been expended. Exactly how we get the task-relevant infor-
mation and construct meaning from it is a central focus of this book.
Th e understanding that we only sample the visual world on a kind of
need-to-know basis leads to a profoundly diff erent model of perception,
one that has only emerged over the last decade or so as psychologists and
neurophysiologists have devised new techniques to probe the brain.
According to this new view, visual thinking is a process that has the allo-
cation of attention as its very essence. Attention, however, is multifaceted.
Making an eye movement is an act of attending. Th e image on the retina is
analyzed by further attention-related processes that tune our pattern-fi nd-
ing mechanisms to pull out the pattern most likely to help with whatever
we are doing. At a cognitive level, we allocate scarce “ working memory ”
resources to briefl y retain in focal attention only to those pieces of infor-
mation most likely to be useful. Seeing is all about attention. Th is new
understanding leads to a revision of our thinking about the nature of visual
consciousness. It is more accurate to say that we are conscious of the fi eld
of information to which we have rapid access rather than that we are imme-
diately conscious of the world.
Th is new understanding also allows us to think about graphic design
issues from a new and powerful perspective. We can now begin to develop
a science of graphic design based on a scientifi c understanding of visual
attention and pattern perception. To the extent to which it is possible to
set out the message of this book in a single statement, the message is this:
Visual thinking consists of a series of acts of attention, driving eye move-
ments and tuning our pattern-fi nding circuits. Th ese acts of attention are
called visual queries, and understanding how visual queries work can
make us better designers. When we interact with an information display,
such as a map, diagram, chart, graph, or a poster on the wall, we are usu-
ally trying to solve some kind of cognitive problem. In the case of the
map, it may be how to get from one location to another. In the case of the
graph, it may be to determine the trend; for example, is the population
Visual Queries 3
CH01-P370896.indd 3CH01-P370896.indd 3 1/23/2008 6:48:56 PM1/23/2008 6:48:56 PM

4
increasing or decreasing over time? What is the shape of the trend? Th e
answers to our questions can be obtained by a series of searches for par-
ticular patterns—visual queries.
Imp
ort
s ($
)
Ap
ple
s
Ora
ng
es
Ban
anas
Pear
sOrleans
Cherbourg
Port-Bou
Brest
DijonLyon
Grenoble
NiceToulouse
Calais
Paris
Poitiers
Nantes
Caen
Rouen
Montpellier
Marseille
Bordeaux
Metz
AvingnonValence
Limoges
At this point, you may be considering an obvious objection. What
about the occasions when we are not intensely involved in some particular
task? Surely we are not continually constructing visual queries when we
are sitting in conversation with someone, or strolling along a sidewalk, or
listening to music. Th ere are two answers to this. Th e fi rst is that, indeed,
we are not always thinking visually with reference to the external environ-
ment; for example, we might be musing about the verbal content of a con-
versation we had over the telephone. Th e second is we are mostly unaware
of just how structured and directed our seeing processes are. Even when
we are in face-to-face conversation with someone, we constantly monitor
facial expressions, the gestures and gaze direction of that person, to pick
up cues that supplement verbal information. If we walk on a path along
the sidewalk of a city, we constantly monitor for obstacles and choose a
path to take into account the other pedestrians. Our eyes make anticipa-
tory movements to bumps and stones that may trip us, and our brains
detect anything that may be on a trajectory to cross our path, triggering
an eye movement to monitor it. Seeing while walking is, except on the
smoothest and most empty road, a highly structured process.
To fl esh out this model of visual thinking, we need to introduce key ele-
ments of the apparatus of vision and how each element functions.
To find out which kind of fruit import is the largest by dollar value we make visual queries to find the tallest bar, then find and read the label beneath.
To find a fast route, we first make visual queries to find the starting and ending cities, then we make queries to find a connected red line, indicative of fast roads, between those points.
CH01-P370896.indd 4CH01-P370896.indd 4 1/23/2008 6:48:56 PM1/23/2008 6:48:56 PM
THE APPARATUS AND PROCESS OF SEEING Th e eyes are something like little digital cameras. Th ey contain lenses that
focus an image on the eyeball. Many fi nd the fact that the image is upside-
down at the back of the eye to be a problem. But the brain is a computer,
albeit quite unlike a digital silicon-based one, and it is as easy for the brain
to compute with an upside-down image as a right-side-up image.
Just as a digital camera has an array of light-sensitive elements recording
three diff erent color values, so the eye also has an array of light-sensitive
cones recording three diff erent colors (leaving aside rods � ). Th e analogy
goes still further. Just as digital cameras compress image data for more
compact transmission and storage, so several layers of cells in the retina
extract what is most useful. As a result, information can be transmitted
from the 100 million receptors in the eye to the brain by means of only 1
million fi bers in the optic nerve.
Th ere is, however, a profound diff erence between the signal sent from
the eye to the back of the brain for early-stage processing and the sig-
nal sent to a memory chip from the pixel array of a digital camera. Brain
pixels are concentrated in a central region called the fovea, whereas cam-
era pixels are arranged in a uniform grid. Also, brain pixels function as
little image-processing computers, not just passive recorders.
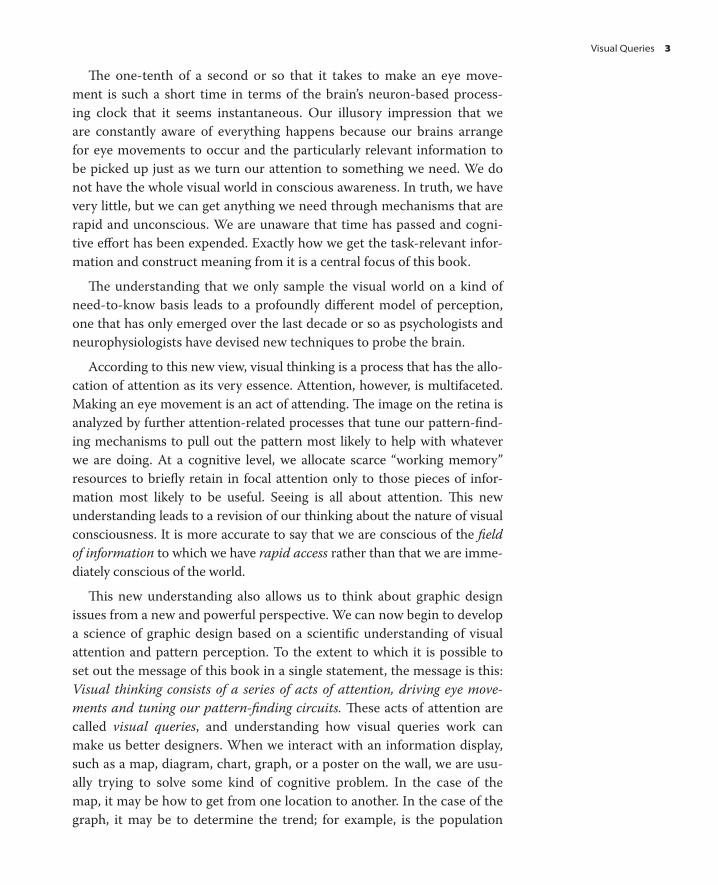
Visual detail can only be seen via the fovea, at the very center of the visual
fi eld. Our vision is so good in this region that each eye can resolve about 100
At the back of the eye is a mosaic of photo-receptors. Each responds to the amount of light falling on it. This example shows the central foveal region where three different cone receptors register different colors of light.
We can resolve about 100 points onthe head of a pin held at arm's length inthe very center of the visual field calledthe fovea.
Over half of our visual processing poweris concentrated in a slightly larger areacalled the parafovea.
At the edge of the visual field wecan only barely see something the sizeof a fist at arm's length.
Brain pixels vary enormously in sizeover the visual field. This reflects differingamounts of neural processing power devotedto different regions of visual space.
�
The human eye actually contains four
diff erent receptor types, three cone types and
rods. However, because rods function mainly
only at low light levels, in our modern, brightly
lit world we can for all practical purposes treat
the eye as a three-receptor system. It is because
of this that we need only three diff erent
wavelength receptors in digital cameras.
The Apparatus and Process of Seeing 5
CH01-P370896.indd 5CH01-P370896.indd 5 1/23/2008 6:48:57 PM1/23/2008 6:48:57 PM

6
points on the head of a pin held at arm ’ s length, but the region is only about
the size of our thumbnail held at arm ’ s length. At the edge of the visual fi eld,
vision is terrible; we can just resolve something the size of a human head. For
example, we may be vaguely aware that someone is standing next to us, but
unless we have already glanced in that direction we will not know who it is.
Th e non-uniformity of the visual processing power is such that half
our visual brain power is directed to processing less than 5 percent of the
visual world. Th is is why we have to move our eyes; it is the only way we
can get all that brain power directed where it will be most useful. Non-
uniformity is also one of the key pieces of evidence showing that we do not
comprehend the world all at once. We cannot possibly grasp it all at once
since our nervous systems only process details in a tiny location at any one
instant.
We only process details in the center of the visual field. We pick up information by directing our foveas using rapid eye movements.
At the edge of the visual field, we can barely see that someone is standing next to us.
CH01-P370896.indd 6CH01-P370896.indd 6 1/23/2008 6:48:59 PM1/23/2008 6:48:59 PM

Th e term brain pixel was introduced earlier by way of contrast with
digital camera pixels. Brain pixels provide a kind of distorted neural map
covering the whole visual fi eld. Th ere are a great many tiny ones process-
ing information from central regions where we direct our gaze and only a
few very large ones processing information at the edge of the visual fi eld.
Because of this, we cannot see much out of the corners of our eyes.
Strong eye muscles attached to each eyeball rotate it rapidly so that diff erent
parts of the visual world become imaged on the central high-resolution fovea.
Th e muscles accelerate the eyeball to an angular velocity up to 900 degrees
per second, then stop it, all in less than one-tenth of a second. Th is movement
is called a saccade, and during a saccadic eye movement, vision is suppressed.
Th e eyes move in a series of jerks pointing the fovea at interesting and
useful locations, pausing briefl y at each, before fl icking to the next point of
interest. Controlling these eye movements is a key part of the skill of seeing.
We do not see the world as jerky, nor for the most part are we aware of
moving our eyes, and this adds yet more evidence that we do not perceive
what is directly available through our visual sense.
Eye muscles move the eyesrapidly to cause the fovea to be directed to different parts ofthe scene.
The retina at the back of the eyecontains light receptors that convert light intosignals which travel up the optic nerve to the visual areas 1 and 2 at the back of the brain.
Visual signals are first processed here in visual area 1 (V1) at the back of the brain.
Each optic nerve contains about a million fibers transmitting visual information from the retina to processing in visual area 1.
The cornea and the lens form a compound lens to focusan image on the retina.
Cornea
Lens
Retina
This illustration is based on a slice through the head of the visible man at the level of the eyeballs. Its color has been altered to show the eye muscles and the eyeballs more clearly.
The Apparatus and Process of Seeing 7
CH01-P370896.indd 7CH01-P370896.indd 7 1/23/2008 6:49:04 PM1/23/2008 6:49:04 PM
8
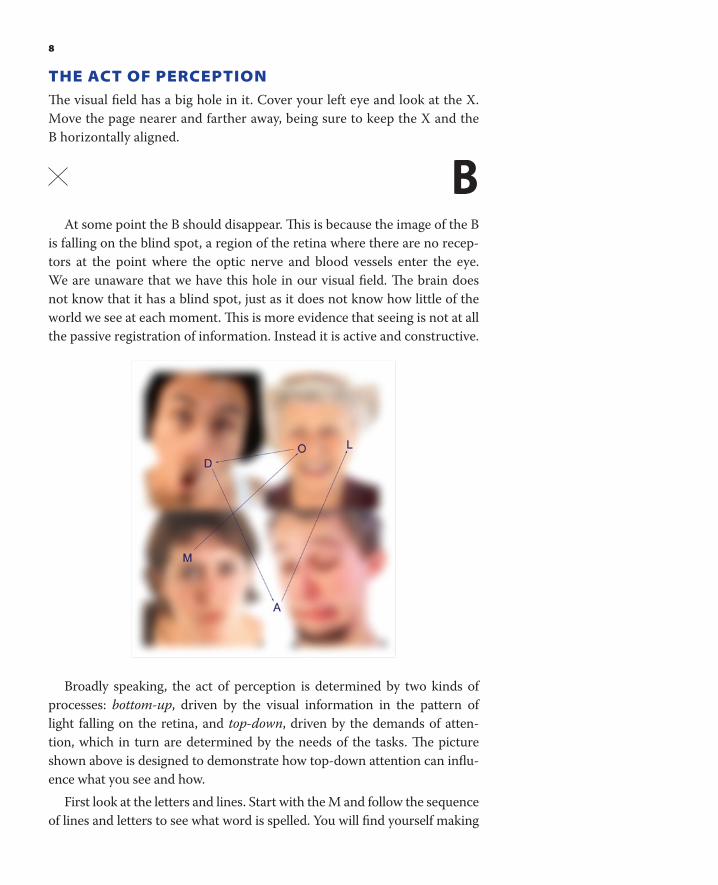
THE ACT OF PERCEPTION Th e visual fi eld has a big hole in it. Cover your left eye and look at the X.
Move the page nearer and farther away, being sure to keep the X and the
B horizontally aligned.
B
At some point the B should disappear. Th is is because the image of the B
is falling on the blind spot, a region of the retina where there are no recep-
tors at the point where the optic nerve and blood vessels enter the eye.
We are unaware that we have this hole in our visual fi eld. Th e brain does
not know that it has a blind spot, just as it does not know how little of the
world we see at each moment. Th is is more evidence that seeing is not at all
the passive registration of information. Instead it is active and constructive .
Broadly speaking, the act of perception is determined by two kinds of
processes: bottom-up , driven by the visual information in the pattern of
light falling on the retina, and top-down , driven by the demands of atten-
tion, which in turn are determined by the needs of the tasks. Th e picture
shown above is designed to demonstrate how top-down attention can infl u-
ence what you see and how.
First look at the letters and lines. Start with the M and follow the sequence
of lines and letters to see what word is spelled. You will fi nd yourself making
CH01-P370896.indd 8CH01-P370896.indd 8 1/23/2008 6:49:07 PM1/23/2008 6:49:07 PM

a series of eye movements focusing your visual attention on the small area
of each letter in turn. You will, of course, notice the faces in the background
but as you perform the task they will recede from your consciousness.
Next look at the faces and try to interpret their expressions. You will
fi nd yourself focusing in turn on each of the faces and its specifi c features,
such as the mouth or eyes, but also as you do this the letters and lines
will recede from your consciousness. Th us, what you see depends on both
the information in the pattern on the page as it is processed bottom-up
through the various neural processing stages, and on the top-down eff ects
of attention that determines both where you look and what you pull out
from the patterns on the page.
Th ere are actually two waves of neural activity that occur when our eye
alights on a point of interest. An information-driven wave passes infor-
mation fi rst to the back of the brain along the optic nerve, then sweeps
forward to the forebrain, and an attention-driven wave originates in the
attention control centers of the forebrain and sweeps back, enhancing the
most relevant information and suppressing less relevant information.
Th e neural machinery of the visual system is modular in the sense that
distinct regions of the brain perform specifi c kinds of computations before
passing the processed information on to some other region. Th e visual sys-
tem has at least two dozen distinct processing modules, each performing
some diff erent computational task, but for the purposes of this overview we
Features are processed in parallel from every part of the visual field. Millions of featuresare processed simultaneously.
Patterns are built outof features depending onattentional demands.Attentional tuning reinforces those mostrelevant.
Objects most relevant to the task at hand are held in Visual Working Memory. Only betweenone and three are held at any instant. Objects have both non-visual and visual attributes.
loyalDOGfriendly
petfu
rry
Top-down attentional processes reinforce relevant information
Bottom-up information drives pattern building
The Act of Perception 9
CH01-P370896.indd 9CH01-P370896.indd 9 1/23/2008 6:49:08 PM1/23/2008 6:49:08 PM

10
will simplify to a three-stage model. Th e processing modules are organized
in a hierarchy, with information being transferred both up and down from
low-level brain-pixel processors to pattern and object processors. We shall
consider it fi rst from a bottom-up perspective, and then from a top-down
perspective.
BOTTOMUP In the bottom-up view, information is successively selected and fi ltered so
that meaningless low-level features in the fi rst stage form into patterns in
the second stage, and meaningful objects in the third stage.
Th e main feature processing stage occurs after information arrives in
the V1 cortex, having traveled up the optic nerve. Th ere are more neurons
devoted to this stage than any other. Perhaps as many as fi ve billion neu-
rons form a massively parallel processing machine simultaneously operat-
ing on information from only one million fi bers in the optic nerve. Feature
detection is done by several diff erent kinds of brain pixel processors that
are arranged in a distorted map of visual space. Some pull out little bits
of size and orientation information, so that every part of the visual fi eld
is simultaneously processed for the existence of oriented edges or con-
tours. Others compute red-green diff erences and yellow-blue diff erences,
and still others process the elements of motion and the elements of ste-
reoscopic depth. Th e brain has suffi cient neurons in this stage to process
every part of the visual fi eld simultaneously for each kind of feature infor-
mation. In later chapters, we will discuss how understanding features pro-
cessing can help us design symbols that stand out distinctly.
At the intermediate level of the visual processing hierarchy, feature
information is used to construct increasingly complex patterns . Visual
space is divided up into regions of common texture and color. Long chains
of features become connected to form continuous contours. Understanding
how this occurs is critical for design because this is the level at which
space becomes organized and diff erent elements become linked or segre-
gated. Some of the design principles that emerge at this level have been
understood for over seventy years through the work of Gestalt psychology
( gestalt means form or confi guration in German). But there is also much
that we have learned in the intervening years through the advent of mod-
ern neuroscience that refi nes and deepens our understanding.
At the top level of the hierarchy, information that has been processed
from millions upon millions of simple features has been reduced and dis-
tilled through the pattern-processing stage to a small number of visual
objects . Th e system that holds about three objects in attention at one
Some neurons that process elementary features respond to little packets of orientation and size information. Others respond best to redness, yellowness, greenness, and blueness. Still others respond to different directions of motion.
At the intermediate pattern finding stage of the visual system, patterns are formed out of elementary features. A string of features may form the boundary of a region having a particular color. The result is that the visual field is segmented into patterns.
CH01-P370896.indd 10CH01-P370896.indd 10 1/23/2008 6:49:08 PM1/23/2008 6:49:08 PM

time is called visual working memory. Th e small capacity of visual work-
ing memory is the reason why, in the experiment described at the start
of this chapter, people failed to recognize that they were speaking to a
diff erent person. Th e information about the person they were talking to
became displaced from their visual (and verbal) working memories by
more immediate task-relevant data.
Although something labeled “ dog ” might be one of the objects we hold
in our visual working memory, there is nothing like a picture of a dog in the
head; rather we have a few visual details of the dog that have been recently
fi xated. Th ese visual details are linked to various kinds of information that
we already know about dogs through a network of association, and therein
lies the power of the system. Concepts that dogs are loyal, pets, furry, and
friendly may become activated and ready for use. In addition, various pos-
sibilities for action may become activated, leading to a heightened state of
readiness. Actions such as petting the dog or avoiding the dog (depending
on our concepts) become primed for activation. Of course if it is our own
dog, “ Millie, ” a much richer set of associations become activated and the
possibilities for action more varied. Th is momentary binding together of
visual information with nonvisual concepts and action priming is central
to what it means to perceive something.
Th e reason why we can make do with only three or four objects extracted
from the blooming buzzing confusion of the world is that these few objects
are made up of exactly what we need to help us perform the task of the
moment. Each is a temporary nexus of meaning and action. Sometimes
nexus objects are held in mind for a second or two; sometimes they only
last for a tenth of a second. Th e greatly limited capacity of visual working
memory is a major bottleneck in cognition, and it is the reason why we
must often rely on external visual aids in the process of visual thinking.
It is tempting to think of visual working memory as the place real visual
thinking occurs, but this is a mistake. One reason it is easy to think this
way is that this is the way computers work. In a digital computer, all com-
plex operations on data occur in the central processing unit. Everything
else is about loading data, getting it lined up so that it is ready to be pro-
cessed just when it is needed, and sending it back out again. Th e brain is
not like this. Th ere is actually far more processing going on in the lower-
level feature processing and pattern-fi nding systems of the brain than in
the visual working memory. It is much more accurate to think of visual
thinking as a multicomponent cognitive system. Each part does something
that is relatively simple. For example, the intermediate pattern processors
detect and pass on information about a particular red patch of color that
loyalDOG friendly
petfurry
When we see something, such as a dog, we do not simply form an image of that dog in our heads. Instead, the few features that we have directly fixated are bound together with the knowledge we have about dogs in general and this particular dog. Possible behaviors of the dog and actions we might take in response to it are also activated.
Bottom-up 11
CH01-P370896.indd 11CH01-P370896.indd 11 1/23/2008 6:49:10 PM1/23/2008 6:49:10 PM

12
happens to be imaged on a particular part of the retina. An instant later
this red patch may come to be labeled as “ poppies. ”
In many ways, the real power of visual thinking rests in pattern fi nding.
Often to see a pattern is to fi nd a solution to a problem. Seeing the path to
the door tells us how to get out of the room, and that path is essentially a
kind of visual pattern. Similarly, seeing the relative sizes of segments in a
pie chart tells us which company has the greatest market shares.
Responses to visual patterns can be thought of as another type of pat-
tern. (To make this point we briefl y extend the use of the word “ pattern ”
beyond its restricted sense as something done at a middle stage in visual
processing.) For most mundane tasks we do not think through our actions
from fi rst principles. Instead, a response pattern like walking towards
the door is triggered from a desire to leave the room. Indeed it is possi-
ble to think of intelligence in general as a collaboration of pattern-fi nding
processors. � A way of responding to a pattern is also a pattern, and usually
one we have executed many times before. A very common pattern of see-
ing and responding is the movement of a mouse cursor to the corner of
a computer interface window, together with a mouse click to close that
window. Response patterns are the essence of the skills that bind percep-
tion to action. But they have their negative side, too. Th ey also cause us to
ignore the great majority of the information that is available in the world
so that we often miss things that are important.
TOPDOWN So far we have been focusing on vision as a bottom-up process:
retinal image features patterns objects→ → →
but every stage in this sequence contains corresponding top-down pro-
cesses. In fact, there are more neurons sending signals back down the
hierarchy than sending signals up the hierarchy.
We use the word attention to describe top-down processes. Top-down
processes are driven by the need to accomplish some goal. Th is might be
an action, such as reaching out and grasping a teacup or exiting a room.
It might be a cognitive goal, such as understanding an idea expressed in
a diagram. Th ere is a constant linking and re-linking of diff erent visual
information with diff erent kinds of nonvisual information. Th ere is also
a constant priming of action plans (so that if we have to act, we are ready)
and action plans that are being executed. Th is linking and re-linking is
the essence of high-level attention, but it also has implications for other
lower-level processes.
�
This view of intelligence as a kind of
hierarchy of pattern finding systems
has been elaborated in On Intelligence
by Jeff Hawkins and Sandra Blakeslee
(Times Books, New York, 2004).
CH01-P370896.indd 12CH01-P370896.indd 12 1/23/2008 6:49:10 PM1/23/2008 6:49:10 PM

At the low level of feature and elementary pattern analysis, top-down
attention causes a bias in favor of the signals we are looking for. If we are
looking for red spots then the red spot detectors will signal louder. If we
are looking for slanted lines then slanted line feature detectors will have
their signal enhanced. Th is biasing in favor of what we are seeking or
anticipating occurs at every stage of processing. What we end up actu-
ally perceiving is the result of information about the world strongly biased
according to what we are attempting to accomplish.
Perhaps the most important attentional process is the sequencing of
eye movements. Psychologist Mary Hayhoe and computer scientist Dana
Ballard collaborated in using a new technology that tracked individuals’
eye movements while they were able to move freely. � Th is allowed them to
study natural eye movements “ in the wild ” instead of the traditional labo-
ratory setup with their heads rigidly fi xed in a special apparatus.
Th ey had people carry out everyday tasks, such as making a peanut but-
ter and jelly sandwich, and discovered a variety of eye movement patterns.
Typically, people exhibited bursts of rapid eye movements when they fi rst
encountered the tools and ingredients laid out in front of them. Th is pre-
sumably allowed them to get a feel for the overall layout of the workspace.
Each of these initial fi xations was brief, usually one-tenth of a second or less.
Once people got to work, they would make much longer fi xations so that
they could, for example, spread the peanut butter on the bread. Generally,
�
Mary Hayhoe and Dana Ballard. 2005.
Eye movements in natural behavior.
Trends in Cognitive Science . 9(4):
188–194.
The sequence of eye movements made by someone making a peanut butter and jelly sandwich. The yellow circles show the eye fixations. (Image courtesy of Mary M. Hayhoe.)
Top-down 13
CH01-P370896.indd 13CH01-P370896.indd 13 1/23/2008 6:49:10 PM1/23/2008 6:49:10 PM
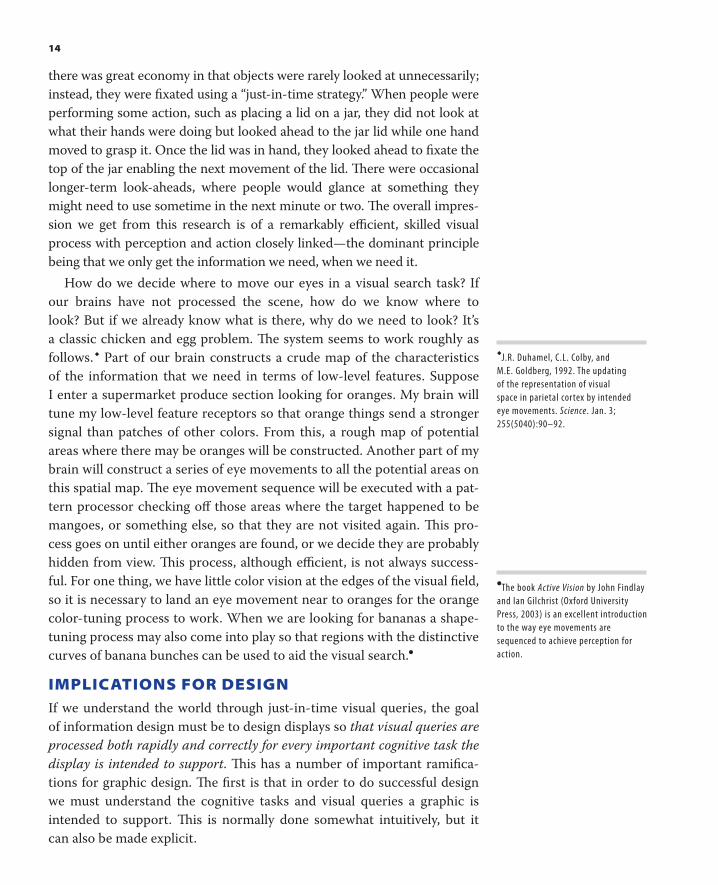
14
there was great economy in that objects were rarely looked at unnecessarily;
instead, they were fi xated using a “ just-in-time strategy. ” When people were
performing some action, such as placing a lid on a jar, they did not look at
what their hands were doing but looked ahead to the jar lid while one hand
moved to grasp it. Once the lid was in hand, they looked ahead to fi xate the
top of the jar enabling the next movement of the lid. Th ere were occasional
longer-term look-aheads, where people would glance at something they
might need to use sometime in the next minute or two. Th e overall impres-
sion we get from this research is of a remarkably effi cient, skilled visual
process with perception and action closely linked—the dominant principle
being that we only get the information we need, when we need it.
How do we decide where to move our eyes in a visual search task? If
our brains have not processed the scene, how do we know where to
look? But if we already know what is there, why do we need to look? It ’ s
a classic chicken and egg problem. Th e system seems to work roughly as
follows. � Part of our brain constructs a crude map of the characteristics
of the information that we need in terms of low-level features. Suppose
I enter a supermarket produce section looking for oranges. My brain will
tune my low-level feature receptors so that orange things send a stronger
signal than patches of other colors. From this, a rough map of potential
areas where there may be oranges will be constructed. Another part of my
brain will construct a series of eye movements to all the potential areas on
this spatial map. Th e eye movement sequence will be executed with a pat-
tern processor checking off those areas where the target happened to be
mangoes, or something else, so that they are not visited again. Th is pro-
cess goes on until either oranges are found, or we decide they are probably
hidden from view. Th is process, although effi cient, is not always success-
ful. For one thing, we have little color vision at the edges of the visual fi eld,
so it is necessary to land an eye movement near to oranges for the orange
color-tuning process to work. When we are looking for bananas a shape-
tuning process may also come into play so that regions with the distinctive
curves of banana bunches can be used to aid the visual search. �
IMPLICATIONS FOR DESIGN If we understand the world through just-in-time visual queries, the goal
of information design must be to design displays so that visual queries are
processed both rapidly and correctly for every important cognitive task the
display is intended to support . Th is has a number of important ramifi ca-
tions for graphic design. Th e fi rst is that in order to do successful design
we must understand the cognitive tasks and visual queries a graphic is
intended to support. Th is is normally done somewhat intuitively, but it
can also be made explicit.
�
J.R. Duhamel, C.L. Colby, and
M.E. Goldberg, 1992. The updating
of the representation of visual
space in parietal cortex by intended
eye movements. Science . Jan. 3;
255(5040):90–92.
�
The book Active Vision by John Findlay
and Ian Gilchrist (Oxford University
Press, 2003) is an excellent introduction
to the way eye movements are
sequenced to achieve perception for
action.
CH01-P370896.indd 14CH01-P370896.indd 14 1/23/2008 6:49:13 PM1/23/2008 6:49:13 PM

Implications for Design 15
A map is perhaps the best example illustrating how graphic design can
support a specifi c set of visual queries. Suppose we are lodged in a hotel
near Ealing in West London, and we wish to go to a pub near Clapham
Common where we will meet a friend. We would do well to consider the
underground train system and this will result is our formulating a number
of cognitive tasks. We might like to know the following:
• Which combination of lines will get us to the pub?
• If there is more than one potential route, which is the shortest?
• What are the names of stations where train changes are needed?
• How long will the trip take?
• What is the distance between the hotel and its nearest underground
station?
• What is the distance between the pub and its nearest underground
station?
• How much will it cost?
• Many of these tasks can be carried out through visual thinking with a
map.
Reproduced with kind permission of © Transport for London.
CH01-P370896.indd 15CH01-P370896.indd 15 1/23/2008 6:49:13 PM1/23/2008 6:49:13 PM

16
Th e famous London Underground map designed by Harry Beck is an
excellent visual tool for carrying out some, but not all, of these tasks. Its
clear schematic layout makes the reading of station names easy. Th e color
coding of lines and the use of circles showing connection points make it
relatively easy to visually determine routes that minimize the number of
stops. Th e version shown here also provides rapidly accessible informa-
tion about the fare structure through the grey and white zone bars.
Since we have previously used maps for route planning, we already
have a cognitive plan for solving this kind of problem. It will likely consist
of a set of steps something like the following.
STEP ONE is to construct a visual query to locate the station nearest our hotel. Assuming we have the name of
a station, this may take quite a protracted visual search since there are more than two hundred stations on the map;
if, as is likely, we already have a rough idea where in London our hotel is located, this will narrow the search space.
STEP TWO is to visually locate a station near the pub, and this particular task is also not well supported.
The famous map does support the station-finding task by spacing the labels for clear reading, but unlike other
maps it does not give an index or a spatial reference grid.
STEP THREE is to find the route connecting our start station and our destination station. This visual query
is very well supported by the map. The lines are carefully laid out in a way that radically distorts geographical
space, but this is done to maintain clarity so that the visual tracing of lines is easy. Color coding also supports
visual tracing, as well as providing labels that can be matched to the table of lines at the side.
Suppose that the start station is Ealing on the District Line (green) and
the destination station is Clapham Common on the Northern Line (black).
Our brains will break this down into a set of steps executed roughly as fol-
lows. Having identifi ed the Ealing station and registered that it is on the
green-colored District Line, we make a series of eye movements to trace
the path of this green contour. As we do so, our top-down attentional
mechanisms will increase the amplifi cation on neurons tuned to green so
that they “ shout louder ” than those tuned to other colors, making it eas-
ier for our mid-level pattern fi nder to fi nd and connect parts of the green
contour. It may take several fi xations to build the contour, and the process
will take about two seconds. At this point, we repeat the tracing operation
starting with Clapham Common, our destination station, which is on the
black Northern Line. As we carry out this tracing, a second process may
be operating in parallel to look for the crossing point with the green line.
Th ese operations might take another second or two.
Because of the very limited capacity of visual working memory, most
information about the green contour (District Line) will be lost as we
trace out the black contour (Northern Line). Not all information about the
green line is lost, however; although its path will not have been retained
explicitly, considerable savings occur when we repeat an operation such
CH01-P370896.indd 16CH01-P370896.indd 16 1/23/2008 6:49:16 PM1/23/2008 6:49:16 PM

as this. Repeating a tracing operation will take less cognitive eff ort, and
require fewer fi xations, than fi nding it in the fi rst place. A hallmark of
visual thinking is that it is often easier to redo some cognitive operation
than to remember it.
Of course, the process may not be quite as straightforward as described.
Much can go wrong. We may be visually sidetracked by the wrong branch
of the Northern Line. Th e process is fl exible and adaptive, and good visual
thinkers have error-checking procedures. A fi nal scan of the entire route
will confi rm that it is, indeed, a valid solution.
STEP FOUR is a visual query to get a rough estimate of how many stations there are on the route. This is
unlikely to involve actual counting; instead, it will be a judgment that will be used together with prior experience
to produce an estimate of the journey duration. This will naturally lead to misjudgments because the lengths of
lines on the map do not correspond to travel times.
Our analysis shows that the London Underground map supports the
visual route-fi nding step well but almost completely fails to support other
planning steps such as fi nding a tube station near to the pub and estimat-
ing journey time. Th is is not to say that it is a bad design; the map is jus-
tifi ably famous. Th e designers sacrifi ced spatial accuracy in favor of clear
labels and routes, and therefore the map is very poor for providing infor-
mation about the distance covered on the ground.
Having a computer behind an interactive graphic display takes the
capability of visual cognitive tools to another level. A program called tube-
guru ™ is an Internet-based computer program that adds many of the cog-
nitive supports that the underground map lacks; a local street map in the
vicinity of a selected station helps with the start and end of journeys, and
a journey planner provides information about how to get from a specifi c
address to another specifi c address, using London ’ s busses and trains.
Tubeguru and other computer programs with visual interfaces add an
additional dimension to the cognitive process. Th ey allow for some parts of
the computation process to occur in the brain, and other parts to occur in the
computer program. Human and computer together form a problem-solving
system with the screen display and the keyboard providing the interface. In
later chapters, we further explore this rather mind-bending idea. For now
we return to the simpler case of visual thinking with a static graphic display.
NESTED LOOPS A useful way of describing the way the brain operates to solve problems is
as a set of nested loops. Outer loops deal with generalities. Inner loops pro-
cess the details. In the outer loop, the brain constructs a set of steps to solve
Nested Loops 17
CH01-P370896.indd 17CH01-P370896.indd 17 1/23/2008 6:49:16 PM1/23/2008 6:49:16 PM

18
the problem and then executes them: fi nd a map, fi nd end point stations,
trace lines, fi nd intersections. Th is sequencing of the problem components
is not in and of itself visual in nature; it is more likely to occur through
the operations of verbal language subsystems of the brain. However, some
problem components may be identifi ed as having visual-thinking solutions,
and these are used to construct visual queries on the display.
Outer problem solving loop includes finding candidatesfor visual problem solving
Middle loop consists ofa visual pattern searchusing eye movements
Pattern testing
Th e middle loop on the diagram is a visual search executed to fi nd pat-
terns that address the visual query. Th is involves executing a sequence of
eye movements. In the previous example, this involved a visual tracing of
the colored contours that represent train lines.
Th e inner loop is activated when the eye arrives at a point of fi xation.
A process of visual testing begins, and patterns within the central region
of the visual fi eld are evaluated at a rate of about twenty per second;
although since the eye only stays in one place for less than two-tenths of a
second, roughly one to four simple patterns may be evaluated on each fi x-
ation. In the example of fi nding the green line, this evaluation might have
the following form. Is this contour green? Is it a continuation of the sec-
tion of contour that was just registered?
Of course we are being metaphoric here. Nothing in the brain is mak-
ing up questions and answering them. Rather, a neural process produces a
signal that results in a change in the status of objects held in visual work-
ing memory. One such change in status would be that a neural represen-
tation of a green contour object becomes “ bound ” to another section of
green contour in the temporary nexus and held together through the pro-
cess called visual working memory.
Nested processes are characteristic of computer programs, but the
ones executed by the brain are far more fl exible and adaptive than those
executed in a computer. Th ey rely on patterns of action that have been
built up over experience. We already have encoded in our memories visual
search patterns for a huge number of situations, such as what we need to
CH01-P370896.indd 18CH01-P370896.indd 18 1/23/2008 6:49:16 PM1/23/2008 6:49:16 PM
look for when entering a restaurant, looking at a web page, and driving a
car toward an intersection. Th ese are not, however, rigid rules, but rather
like fl exible plans that can be adapted to particular circumstances.
DISTRIBUTED COGNITION Th is chapter has alluded to the existence of various brain structures and
processes. In later chapters, specifi c areas of the brain where processes
occur will be discussed in more detail. We will encounter visual areas,
V1 and V2 specialized for parallel feature processing, V4 specialized for
pattern processing, the Fusiform Gyrus specialized for object processing,
and the frontal lobes as well as midbrain areas specialized for controlling
high-level attention. Th e control of eye movements is mediated by mech-
anisms in the lateral interparietal area and superior colliculus. Th ere are
several dozen areas of the brain that have been mapped in animals using
recordings from single neurons. Recent advances in brain scanning have
allowed researchers to see which areas of the brain are most active when
people perform specifi c visual tasks. Th e latest techniques even reveal the
sequence in which diff erent areas become active.
Th is is not, however, a book about neurophysiology, but a book about
visual thinking. Its purpose is to provide a theoretical understanding of
how we perceive in order to inform the design process. Th e names are
useful but ultimately it does not matter exactly where in the brain some-
thing happens; instead it is important to know what kinds of visual infor-
mation the brain can process effi ciently. Th e timing and sequencing of
visual operations is also important. Th erefore, the approach taken in this
book is functional and modular. Specifi c brain structures are mentioned
because each has a specialized function in the visual thinking process.
We could just talk about these brain structures as abstract functioning
modules, but giving them their proper names preserves the link with the
underlying science. Overall the goal is to steer a path between oversimpli-
fi cation and overwhelming neurophysiological detail.
Th ere is a general point to be considered regarding the modular struc-
ture of the brain. Th e brain is not a holistic undiff erentiated processor of
information, as was once thought. Instead, it is made up of a number of
specialized regions, each devoted to carrying out some specifi c process-
ing task, such as scheduling eye movements or processing features. Visual
thinking comes about through the coordinated activities of these processing
regions. Th ere is no central processing unit in the brain; rather the
whole functions as a kind of distributed computer. Also, there is no cen-
tral conductor coordinating all of the distributed parts. Each component
Distributed Cognition 19
CH01-P370896.indd 19CH01-P370896.indd 19 1/23/2008 6:49:17 PM1/23/2008 6:49:17 PM
20
coordinates interactions with the other components to which it is con-
nected. Th is is the reason why we can sometimes carry out more than one
task simultaneously—talking and driving a car, for example. Th ese tasks
use regions of the brain that are mostly independent.
Th e idea of distributed cognition is no longer particularly controversial,
but the idea of distributed cognition begs to be extended outside the head,
and this is truly radical. Distributed cognition holds that cognition is the
result of a set of interconnected processing modules, each doing some-
thing relatively simple and sending signals on to other modules. But why
must these modules be inside the head? What is the diff erence between
information stored in human memory and information stored in a book
or picture? After all, we can store images in a photo album far better than
we can store them in our head. We can store them even better on a com-
puter if it has a eff ective search capability. Th inking involves a constant
interplay between new patterns and old patterns, and patterns can come
from both inside and outside the skull. As Don Norman famously noted, �
“ Th e power of the unaided mind is highly overrated. Without external aids,
memory, thought and reasoning are all constrained. But human intelligence
is highly fl exible and adaptive, superb at inventing procedures and objects
that overcome its own limits. Th e real powers come from devising external
aids that enhance cognitive activities. How have we increased memory,
thought and reasoning? By the invention of external aids: it is things that
make us smart. ”
Graphs, diagrams, and illustrations have only become widely available as
visual thinking tools over the past two hundred years. More recently there
has been an explosive development of diagramming techniques driven
fi rst by color printing technology and currently by the Internet. Graphic
PowerPoint slides and the like have become a ubiquitous tool for informa-
tion presentation. Increasingly, the tools that support cognition are com-
puter-based, and increasingly they incorporate images and visualizations as
well as words. Th e term visualization as it is used in the previous sentence
is actually quite new. Visualizations used to be mental images that people
formed while they thought. Now the term more often means a graphi-
cal representation of some data or concepts. Visualizations are becoming
important in most areas of science and commerce. Advertisements have
long been visualizations. All of these artifacts are tools for visual thinking.
CONCLUSION Perceiving is a skilled active process. We seek out what we need
through frequent eye movements, so that critical information falls on the
�
Donald A. Norman, 1993. Cognition
in the head and in the world. Cognitive
Science . 17: 1–6.
CH01-P370896.indd 20CH01-P370896.indd 20 1/23/2008 6:49:17 PM1/23/2008 6:49:17 PM

high-resolution fovea. Eye movements are executed to satisfy our need for
information and can be thought of as a sequence of visual queries on the
visual world. Each time the eye briefl y comes to rest, the pattern-processing
machinery goes to work sorting out what is most likely to be relevant to
our current cognitive task. Almost everything else is either not seen at all
or retained for only a fraction of a second. A few fragments are held for a
second or two, and a tiny percentage forms part of our long-term mem-
ory. To be sure we do have visual memories built up over our lifetimes and
these are what make the scraps of information we capture meaningful and
useful. Th ese memories are not detailed, but they do provide frameworks
for fl eshing out the fragments. Th ey also provide frameworks for planning
eye movements and other kinds of actions.
Th e idea of the visual query is shorthand for what we do when we
obtain information either from the world at large or some kind of informa-
tion display. We make visual queries every time we search for some visual
information that we need to carry out our cognitive task of the moment.
Understanding what visual queries are easily executed is a critical skill for
the designer. Th e special skill of designers is not so much skill with draw-
ing or graphic design software, although these are undoubtedly useful, but
the talent to analyze a design in terms of its ability to support the visual
queries of others. Th is talent comes from hard-won pattern analysis skills
that become incorporated into the neural fabric of perception, as well as
the skill to execute a cognitive process that takes into account a variety of
competing considerations.
One reason design is diffi cult is that the designer already has the knowl-
edge expressed in the design, has seen it develop from inception, and
therefore cannot see it with fresh eyes. Th e solution is to be analytic and
this is where this book is intended to have value. Eff ective design should
start with a visual task analysis, determine the set of visual queries to be
supported by a design, and then use color, form, and space to effi ciently
serve those queries. Skilled graphic designers already do this intuitively. It
is my earnest hope that this book will help in the transition from unskilled
to skilled designer by providing visual analytic tools derived from an up-
to-date understanding of human perception.
At this stage, it should be clear that this book is not about the kind of
visual thinking that goes into fi ne art where the goals are frequently the
opposite of clarity, but rather beauty, visual impact, or an investigation
of a new vocabulary of expression. Because of its exploratory, pioneer-
ing nature, leading-edge art often speaks only to small cliques of insiders,
collectors, critics, and gallery owners. Th is book is about graphic design
Conclusion 21
CH01-P370896.indd 21CH01-P370896.indd 21 1/23/2008 6:49:17 PM1/23/2008 6:49:17 PM

22
that provides a channel for clear communication that supports visual
thinking and acts as an interface to the vast information resources of the
modern world. Th is should not, however, imply that its message is the
enemy of creative expression. Th ere is never a single optimal solution to a
design problem, but rather a huge variety of alternative clear and eff ective
designs.
CH01-P370896.indd 22CH01-P370896.indd 22 1/23/2008 6:49:17 PM1/23/2008 6:49:17 PM

23
What We Can Easily See
Imagine a thief searching a moonlit room with a fl ashlight. He can see the
vague outlines of furniture, but no details at all. He uses the narrow beam
of the fl ashlight to pick out the tops of dressers and side tables where he
expects valuables may be. Our visual attention actually works something
like this; we move the spotlight of our attention by moving our eyes from
point to point, picking out details. Generally we only have vague informa-
tion to plan each eye movement, so we often fail to fi nd the information
we seek on a particular eye fi xation. But some things are very easy to fi nd
even at the edge of the visual fi eld, like a blinking light over the water, or
a bright patch of red sweater in a crowd of people wearing black. We can
sense them in the periphery and then make an eye movement so that they
become the center of both vision and attention.
Th is chapter is about the theory of vision that describes what makes
something small easy to see. It is also about the nitty-gritty details of design.
What does it take to make a graphic symbol that can be found rapidly? How
can something be highlighted? Th e problem for the designer is to ensure all
visual queries can be eff ectively and rapidly served. In practice, this means
CH02-P370896.indd 23CH02-P370896.indd 23 1/23/2008 6:49:52 PM1/23/2008 6:49:52 PM

24
ensuring that semantically meaningful graphic objects that make up a design
each has the right amount of salience. Th e most important and frequent
visual queries should be supported with the most visually distinct objects. Th e
perceptual laws of visual distinctness are based on the low-level early-stage
processing in the visual system. Th e elementary pattern-processing systems we
fi nd there provide the substrate on which all graphical interpretation is built.
In the following set of random letters, two p ’ s have been highlighted
with a blue background. Finding those two p ’ s is easy. Th ey seem to pop out
from the page. In contrast, it is more diffi cult to fi nd the two q ’ s. To fi nd
the q ’ s every letter must be scanned and it will take at least ten times lon-
ger than fi nding the p ’ s. Further, fi nding the q ’ s will impose a much greater
cognitive burden, certainly disrupting one ’ s train of thought.
ehklhfdiyaioryweklblkhockxlyhirhupwerlkhlkuyxoiasusifdhlksajdhflkihqdaklljerlajesljselusdslfjsalsuslcjlsdsjaf;ljdulafjlujoufojrtopjhklghqlkshlkfhlkdshflymcvciwopzlsifhrmckreieui
A view of the brain from beneath. Light is transformed into neural signals by the retina. Information is then passed along the optic nerve, via the waystation of the lateral geniculate nucleus to the primary visual cortex located at the back of the brain.
In the primary visual cortex billions of neurons process the entire image, providing the elements of form, color, texture, stereoscopic depth, and motion all at once.
CH02-P370896.indd 24CH02-P370896.indd 24 1/23/2008 6:49:53 PM1/23/2008 6:49:53 PM
Th e fact that the p ’ s are easy to see seems straightforward and unsur-
prising. But why do the q ’ s take longer to fi nd? After all, we all spend
thousands of hours reading and writing with this alphabet. So the q shape
is not unfamiliar.
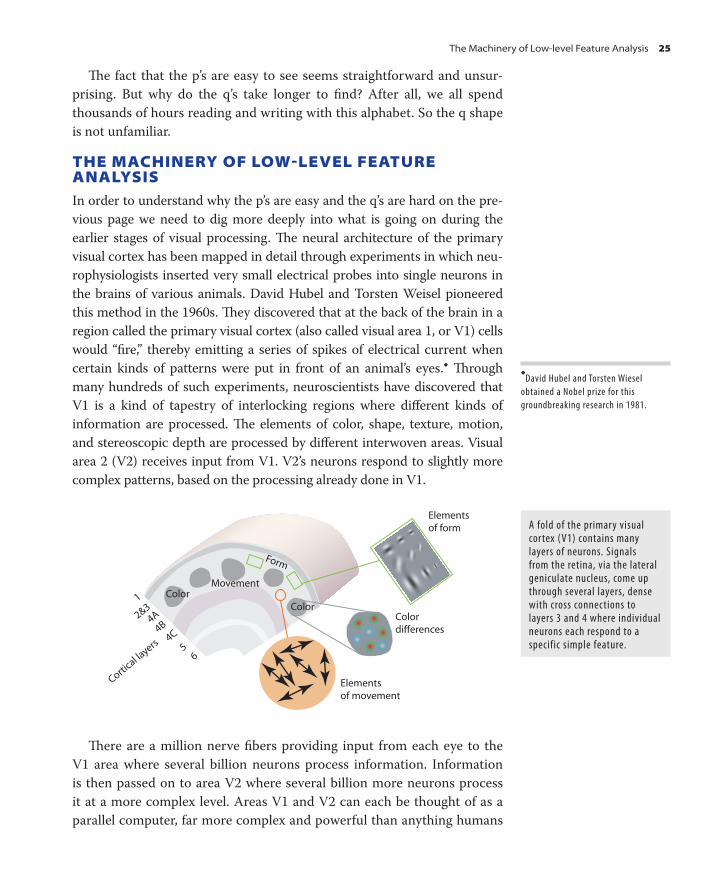
THE MACHINERY OF LOWLEVEL FEATURE ANALYSIS In order to understand why the p ’ s are easy and the q ’ s are hard on the pre-
vious page we need to dig more deeply into what is going on during the
earlier stages of visual processing. Th e neural architecture of the primary
visual cortex has been mapped in detail through experiments in which neu-
rophysiologists inserted very small electrical probes into single neurons in
the brains of various animals. David Hubel and Torsten Weisel pioneered
this method in the 1960s. Th ey discovered that at the back of the brain in a
region called the primary visual cortex (also called visual area 1, or V1) cells
would “ fi re, ” thereby emitting a series of spikes of electrical current when
certain kinds of patterns were put in front of an animal ’ s eyes. � Th rough
many hundreds of such experiments, neuroscientists have discovered that
V1 is a kind of tapestry of interlocking regions where diff erent kinds of
information are processed. Th e elements of color, shape, texture, motion,
and stereoscopic depth are processed by diff erent interwoven areas. Visual
area 2 (V2) receives input from V1. V2 ’ s neurons respond to slightly more
complex patterns, based on the processing already done in V1.
Movement
Form
Colordifferences
Elementsof form
Elementsof movement
ColorColor
1
2&34A
4B4C
56
Cortical la
yers
Th ere are a million nerve fi bers providing input from each eye to the
V1 area where several billion neurons process information. Information
is then passed on to area V2 where several billion more neurons process
it at a more complex level. Areas V1 and V2 can each be thought of as a
parallel computer, far more complex and powerful than anything humans
� David Hubel and Torsten Wiesel
obtained a Nobel prize for this
groundbreaking research in 1981.
A fold of the primary visual cortex (V1) contains many layers of neurons. Signals from the retina, via the lateral geniculate nucleus, come up through several layers, dense with cross connections to layers 3 and 4 where individual neurons each respond to a specific simple feature.
The Machinery of Low-level Feature Analysis 25
CH02-P370896.indd 25CH02-P370896.indd 25 1/23/2008 6:50:01 PM1/23/2008 6:50:01 PM
26
have built to date. Parallel computing is the name given to computer sys-
tems that are made up of many small computers, each doing essentially
the same thing on a diff erent piece of data. Th ese kinds of computers are
used to solve problems such as weather forecasting, where each processor
deals with a little bit of the atmosphere. Th ese cortical areas are parallel
computers because they process every part of the visual image simulta-
neously, computing local orientation information, local color diff erence
information, local size information, and local motion information.
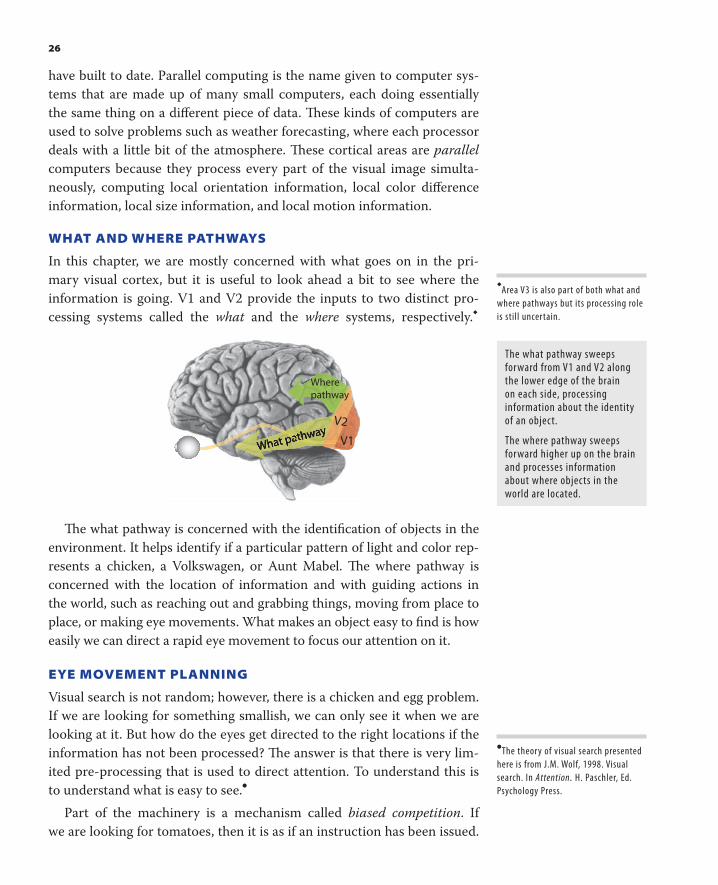
WHAT AND WHERE PATHWAYS
In this chapter, we are mostly concerned with what goes on in the pri-
mary visual cortex, but it is useful to look ahead a bit to see where the
information is going. V1 and V2 provide the inputs to two distinct pro-
cessing systems called the what and the where systems, respectively. �
V1
V2
Where pathway
Th e what pathway is concerned with the identifi cation of objects in the
environment. It helps identify if a particular pattern of light and color rep-
resents a chicken, a Volkswagen, or Aunt Mabel. Th e where pathway is
concerned with the location of information and with guiding actions in
the world, such as reaching out and grabbing things, moving from place to
place, or making eye movements. What makes an object easy to fi nd is how
easily we can direct a rapid eye movement to focus our attention on it.
EYE MOVEMENT PLANNING
Visual search is not random; however, there is a chicken and egg problem.
If we are looking for something smallish, we can only see it when we are
looking at it. But how do the eyes get directed to the right locations if the
information has not been processed? Th e answer is that there is very lim-
ited pre-processing that is used to direct attention. To understand this is
to understand what is easy to see. �
Part of the machinery is a mechanism called biased competition . If
we are looking for tomatoes, then it is as if an instruction has been issued.
� Area V3 is also part of both what and
where pathways but its processing role
is still uncertain.
The what pathway sweeps forward from V1 and V2 along the lower edge of the brain on each side, processing information about the identity of an object.
The where pathway sweeps forward higher up on the brain and processes information about where objects in the world are located.
�
The theory of visual search presented
here is from J.M. Wolf, 1998. Visual
search. In Attention. H. Paschler, Ed.
Psychology Press.
CH02-P370896.indd 26CH02-P370896.indd 26 1/23/2008 6:50:01 PM1/23/2008 6:50:01 PM

Triesm
an's
“ All you red-sensitive cells in V1, you all have permission to shout louder.
All you blue- and green-sensitive cells, try to be quiet. ” Similar instruc-
tions can be issued for particular orientations, or particular sizes—these
are all features processed by V1. Th e responses from the cells that are
thereby sensitized are passed both up the what pathway, biasing the things
that are seen, and up the where pathway, to regions that send signals to
make eye movements occur. Other areas buried deeper in the brain, such
as the hippocampus, are also involved in setting up actions.
In a search for tomatoes all red patches in the visual fi eld of the searcher
become candidates for eye movements, and the one that causes red-
sensitive neurons to shout the loudest will be visited fi rst. Th e same biased
shouting mechanism also applies to any of the feature types processed by
the primary visual cortex, including orientation, size, and motion. Th e
important point here is that knowing what the primary visual cortex does
tells us what is easy to fi nd in a visual search.
Th is is by no means the whole story of eye-movement planning. Prior
knowledge about where things are will also determine where we will look.
However, in the absence of prior knowledge, understanding what will stand
out on a poster, or computer screen, is largely about the kinds of features
that are processed early on, before the where and what pathways diverge.
WHAT STANDS OUT � WHAT WE CAN BIAS FOR Some things seem to pop out from the page at the viewer. It seems you
could not miss them if you tried. For example, name
almost certainly popped out at you the moment you turned to this
page. Ann Triesman is the psychologist who was the fi rst to systemati-
cally study the properties of simple patterns that made them easy to fi nd.
Triesman carried out dozens of experiments on our ability to see sim-
ple colored shapes as distinct from other shapes surrounding them. �
Triesman ’ s experiments consisted of visual search tasks. Subjects were
fi rst told what the target shape was going to be and given an instant to
look at it; for example, they were told to look for a tilted line.
Next they were briefl y exposed to that same shape embedded in a set of
other shapes called distracters.
Anne
�
A large number of popout
experiements are summarized in
A. Triesman, and S. Gormican, 1988.
Feature analysis in early vision:
Evidence from search asymmetries,
Psychological Review. 95(1): 15–98.
What Stands Out � What We Can Bias For 27
CH02-P370896.indd 27CH02-P370896.indd 27 1/23/2008 6:50:02 PM1/23/2008 6:50:02 PM
28
Th ey had to respond by pressing a “ yes ” button if they saw the shape,
and a “ no ” button if they did not see it. In some trials, the shape was pres-
ent, and in others it was not.
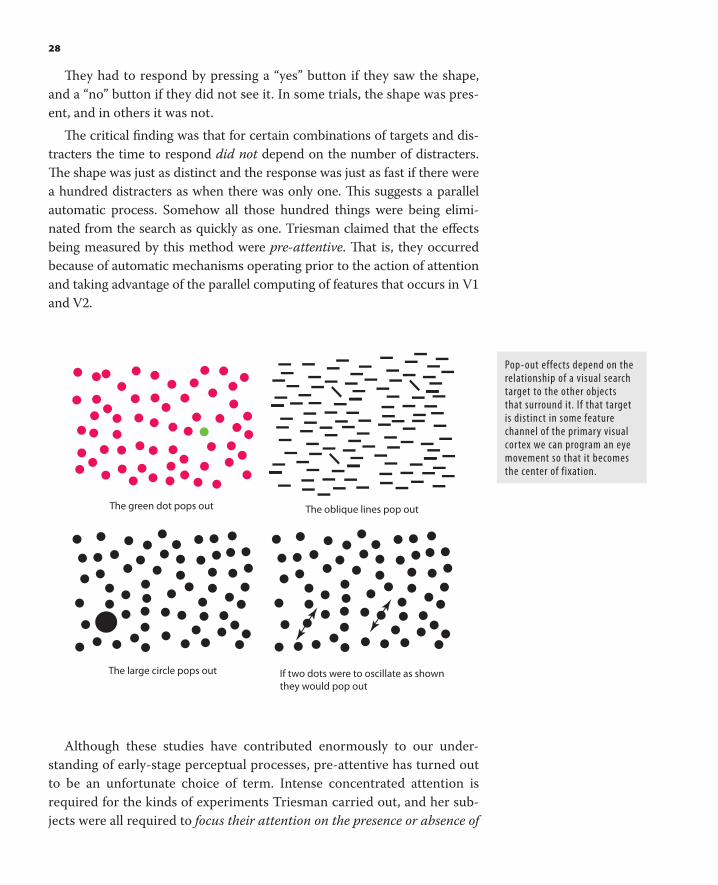
Th e critical fi nding was that for certain combinations of targets and dis-
tracters the time to respond did not depend on the number of distracters.
Th e shape was just as distinct and the response was just as fast if there were
a hundred distracters as when there was only one. Th is suggests a parallel
automatic process. Somehow all those hundred things were being elimi-
nated from the search as quickly as one. Triesman claimed that the eff ects
being measured by this method were pre-attentive . Th at is, they occurred
because of automatic mechanisms operating prior to the action of attention
and taking advantage of the parallel computing of features that occurs in V1
and V2.
The oblique lines pop outThe green dot pops out
The large circle pops out If two dots were to oscillate as shownthey would pop out
Although these studies have contributed enormously to our under-
standing of early-stage perceptual processes, pre-attentive has turned out
to be an unfortunate choice of term. Intense concentrated attention is
required for the kinds of experiments Triesman carried out, and her sub-
jects were all required to focus their attention on the presence or absence of
Pop-out effects depend on the relationship of a visual search target to the other objects that surround it. If that target is distinct in some feature channel of the primary visual cortex we can program an eye movement so that it becomes the center of fixation.
CH02-P370896.indd 28CH02-P370896.indd 28 1/23/2008 6:50:03 PM1/23/2008 6:50:03 PM

a particular target. Th ey were paid to attend as hard as they could. More
recent experiments where subjects were not told of the target ahead of
time show that all except the most blatant targets are missed. � To be sure,
some things shout so loudly that they pop out whether we want them to
or not. A bright fl ashing light is an example. But most of the visual search
targets that Triesman used would not have been seen if subjects had not
been told what to look for, and this is why pre-attentive is a misnomer.
A better term would be tunable, to indicate those visual properties that
can be used in the planning of the next eye movement. Triesman ’ s experi-
ments tell us about those kinds of shapes that have properties to which our
eye-movement programming system is sensitive. Th ese are the properties
that guide the visual search process and determine what we can easily see.
Th e strongest pop-out eff ects occur when a single target object dif-
fers in some feature from all other objects and where all the other objects
are identical, or at least very similar to one another. Visual distinctness
has as much to do with the visual characteristics of the environment of
an object as the characteristics of the object itself. It is the degree of
feature-level contrast between an object and its surroundings that make
it distinct. From the purposes of understanding pop-out, contrast should
be defi ned in terms of the basic features that are processed in the pri-
mary visual cortex. Th e simple features that lead to pop out are color,
orientation, size, motion, and stereoscopic depth. Th ere are some excep-
tions, such as convexity and concavity of contours, that are somewhat
mysterious, because primary visual cortex neurons have not yet been
found that respond to these properties. But generally there is a strik-
ing correspondence between pop-out eff ects and the early processing
mechanisms.
Something that pops out can be seen in a single eye fi xation and exper-
iments show that processing to separate a pop-out object from its sur-
roundings actually takes less than a tenth of a second. Th ings that do not
pop out require several eye movements to fi nd, with eye movements taking
place at a rate of roughly three per second. Between one and a few seconds
may be needed for a search. Th ese may seem like small diff erences, but
they represent the diff erence between visually effi cient at-a-glance pro-
cessing and cognitively eff ortful search.
So far we have only looked at patterns that show the pop-out eff ect.
But what patterns do not show pop-out? It is equally instructive to exam-
ine these. At the bottom of the following page, there is a box containing
a number of red and green squares and circles. When you turn the page,
look for the green squares.
�
The phenomenon of not seeing
things that should be obvious is called
inattentional blindness. A. Mack and
I. Rock, 1998. Inattentional Blindness.
MIT Press, Cambridge, MA.
What Stands Out � What We Can Bias For 29
CH02-P370896.indd 29CH02-P370896.indd 29 1/23/2008 6:50:04 PM1/23/2008 6:50:04 PM

30
Blinking Direction of motion
Convex and concaveCast shadow
Shape Added surround color
Grey value Elongation Curvature Added surround box
Filled Sharpness
Phase of motion
Joined linesSharp vertex
Misalignment
What makes a feature distinct is that it differs from the surrounding feature in terms of the signal it provides to the low-level feature-processing mechanisms of the primary visual cortex.
There are three green squares in this pattern. The green squares do not show a pop-out effect, even though you know what to look for. The problem is that your primary visual cortex can either be tuned for the square shapes, or the green things, but not both.
CH02-P370896.indd 30CH02-P370896.indd 30 1/23/2008 6:50:04 PM1/23/2008 6:50:04 PM
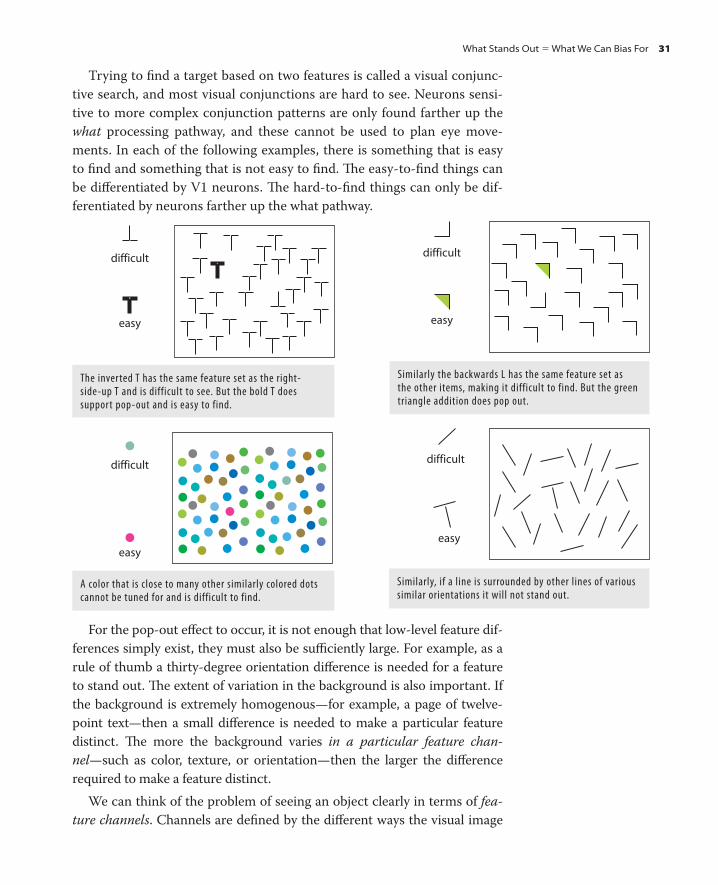
Trying to fi nd a target based on two features is called a visual conjunc-
tive search, and most visual conjunctions are hard to see. Neurons sensi-
tive to more complex conjunction patterns are only found farther up the
what processing pathway, and these cannot be used to plan eye move-
ments. In each of the following examples, there is something that is easy
to fi nd and something that is not easy to fi nd. Th e easy-to-fi nd things can
be diff erentiated by V1 neurons. Th e hard-to-fi nd things can only be dif-
ferentiated by neurons farther up the what pathway.
The inverted T has the same feature set as the right-side-up T and is difficult to see. But the bold T does support pop-out and is easy to find.
Similarly the backwards L has the same feature set as the other items, making it difficult to find. But the green triangle addition does pop out.
For the pop-out eff ect to occur, it is not enough that low-level feature dif-
ferences simply exist, they must also be suffi ciently large. For example, as a
rule of thumb a thirty-degree orientation diff erence is needed for a feature
to stand out. Th e extent of variation in the background is also important. If
the background is extremely homogenous—for example, a page of twelve-
point text—then a small diff erence is needed to make a particular feature
distinct. Th e more the background varies in a particular feature chan-
nel —such as color, texture, or orientation—then the larger the diff erence
required to make a feature distinct.
We can think of the problem of seeing an object clearly in terms of fea-
ture channels . Channels are defi ned by the diff erent ways the visual image
What Stands Out � What We Can Bias For 31
A color that is close to many other similarly colored dots cannot be tuned for and is difficult to find.
Similarly, if a line is surrounded by other lines of various similar orientations it will not stand out.
difficult
easy
difficult
easy
difficult
easy
difficult
easy
CH02-P370896.indd 31CH02-P370896.indd 31 1/23/2008 6:50:06 PM1/23/2008 6:50:06 PM

32
is processed in the primary visual cortex. Feature channels provide a useful
way of thinking about what makes something distinct. Th e diagrams below
each represent two feature channels. You can think of one axis represent-
ing the color channel and the other axis representing the size channel. Th e
circle represents a target symbol having a particular color and size. Th is is
what is being searched for. Th e fi lled circles represent all of the other fea-
tures on the display.
Corresponding feature space diagrams
Small Large
Gre
en
Red
Gre
en
Red
Gre
en
Red
Small Large Small Large
Objects to be searched
TOP ROW. Three sets of objects to be searched. In each case an arrow shows the search target. LEFT BOTTOM ROW. The corresponding feature space diagrams. If a target symbol differs on two feature channels it will be more distinct than if it differs only on one. On the left panel the target differs in both color and size from non-targets. In the middle panel the target differs only in size from non-targets. A target will be least distinct if it is completely surrounded in feature space as is shown in the right panel.
The number 6 cannot be picked out from all the other numbers despite a lifetime ’ s experience looking at numbers; searching for it will take about two seconds. By contrast the dot can be seen in a single glance, about ten times faster. The features that pop out are hardwired in the brain, not learned.
54789048200953554687542558558932450 452
35543875425689807754321884
2359807754321
23598077543216
difficult
easy
Individual faces also do not pop out from the crowd even though it may be our brother or sister we are looking for. However, the pinkish round shapes of faces in general may be tunable, and so our visual systems can program a series of eye movements to faces. This does not help much in this picture because there are so many faces. The yellow jacket in the image on the right can be found with a single fixation because there is only one yellow object and no other similar colors.
difficult
easy
One might think that fi nding things quickly is simply a matter of prac-
tice and we could learn to fi nd complex patterns rapidly if we practiced
enough. Th e fact is that learning does not help much. Visual learning is
CH02-P370896.indd 32CH02-P370896.indd 32 1/23/2008 6:50:07 PM1/23/2008 6:50:07 PM

a valuable skill and with practice experts can interpret patterns that
non-experts fail to see. But this expertise applies more to identifying pat-
terns once they have been fi xated with the eyes, and not to fi nding those
patterns out of the corner of the eye .
LESSONS FOR DESIGN
Th e lessons from these examples are straightforward. If you want to make
something easy to fi nd, make it diff erent from its surroundings according
to some primary visual channel. Give it a color that is substantially diff er-
ent from all other colors on the page. Give it a size that is substantially dif-
ferent from all other sizes. Make it a curved shape when all other shapes
are straight; make it the only thing blinking or moving, and so on.
Many design problems, however, are more complex. What if you wish
to make several things easily searchable at the same time? Th e solution
is to use diff erent channels . As we have seen, layers in the primary visual
cortex are divided up into small areas that separately process the elements
of form (most importantly, orientation and size), color, and motion. Th ese
can be thought of as semi-independent processing channels for visual
information.
A design to support a rapid visual query for two diff erent kinds
of symbols from among many others will be most eff ective if each kind
of query uses a diff erent channel. Suppose we wish to understand how
gross domestic product (GDP) relates to education, population growth
rates, and city dwelling for a sample of countries. Only two of these vari-
ables can be shown on a conventional scatter plot, but the other can be
shown using shape and color. We have plot the (GDP) against population
growth rate, and we use shape coding for literacy and color coding for
urbanization.
Population Growth Rate
GDP
High literacyLow literacy
High urbanLow urban
In this scatter plot, two different kinds of points are easy to find. It is easy to visually query those data points representing countries with a high level of literacy. These use color coding. It is also easy to visually query the set of points representing countries with a low urban population. These are distinct on the orientation channel because these symbols are made with X s containing strong oblique lines.
What Stands Out � What We Can Bias For 33
CH02-P370896.indd 33CH02-P370896.indd 33 1/23/2008 6:50:09 PM1/23/2008 6:50:09 PM

34
It is not necessary to restrict ourselves to a single channel for each kind
of symbol. If there are diff erences between symbols on multiple channels
they will be even easier to fi nd. Also, tunability is not an all-or-nothing
property of graphic symbols. A symbol can be made to stand out in only a
single feature channel. For example, the size channel can be used to make
a symbol distinct, but if the symbol can be made to diff er from other sym-
bols in both size and color, it will be even more distinct.
e than000 population
With megastores
Any complex design will contain a number of background colors, line
densities and textures, and the symbols will similarly diff er in size, shape,
color, and texture. It is a challenge to create a design having more than
Suppose that we wish to display both large towns and towns with megastores on the same map. Multiple tunable differences can be used. The blue symbols are shaded in 3D and have cast shadows. The outline squares are constructed from the only bold straight vertical and horizontal lines on the map. This means that visual queries for either large towns or towns with megastores will be efficiently queried.
A set of symbols designed so that each would be independently searchable.
Each symbol differs from the others on several channels. For example, there is only one green symbol; it is the only one with oblique lines and it is the only one with no sharp edges.
CH02-P370896.indd 34CH02-P370896.indd 34 1/23/2008 6:50:10 PM1/23/2008 6:50:10 PM
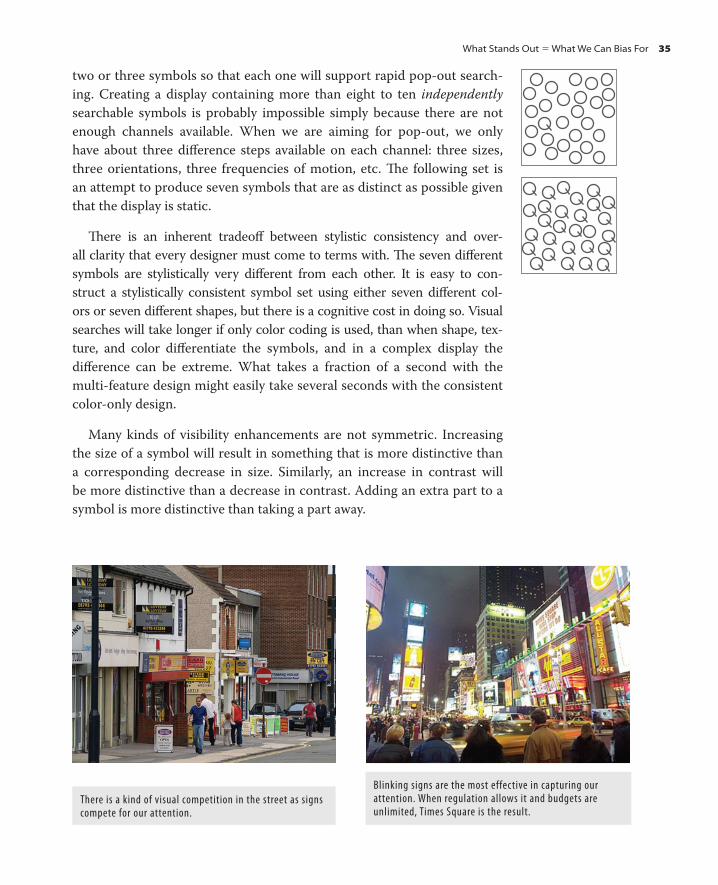
two or three symbols so that each one will support rapid pop-out search-
ing. Creating a display containing more than eight to ten independently
searchable symbols is probably impossible simply because there are not
enough channels available. When we are aiming for pop-out, we only
have about three diff erence steps available on each channel: three sizes,
three orientations, three frequencies of motion, etc. Th e following set is
an attempt to produce seven symbols that are as distinct as possible given
that the display is static.
Th ere is an inherent tradeoff between stylistic consistency and over-
all clarity that every designer must come to terms with. Th e seven diff erent
symbols are stylistically very diff erent from each other. It is easy to con-
struct a stylistically consistent symbol set using either seven diff erent col-
ors or seven diff erent shapes, but there is a cognitive cost in doing so. Visual
searches will take longer if only color coding is used, than when shape, tex-
ture, and color diff erentiate the symbols, and in a complex display the
diff erence can be extreme. What takes a fraction of a second with the
multi-feature design might easily take several seconds with the consistent
color-only design.
Many kinds of visibility enhancements are not symmetric. Increasing
the size of a symbol will result in something that is more distinctive than
a corresponding decrease in size. Similarly, an increase in contrast will
be more distinctive than a decrease in contrast. Adding an extra part to a
symbol is more distinctive than taking a part away.
There is a kind of visual competition in the street as signs compete for our attention.
Blinking signs are the most effective in capturing our attention. When regulation allows it and budgets are unlimited, Times Square is the result.
What Stands Out � What We Can Bias For 35
CH02-P370896.indd 35CH02-P370896.indd 35 1/23/2008 6:50:11 PM1/23/2008 6:50:11 PM

36
MOTION
Making objects move is a method of visibility enhancement that is in a
class by itself. If you are resting on the African Savannah, it pays to be sen-
sitive to motion at the edge of your visual fi eld. Th at shaking of a bush seen
out of the corner of your eye might be the only warning you get that some-
thing is stalking you with lunch in mind. Th e need to detect predators has
been a constant factor through hundreds of millions of years of evolution,
which presumably explains why we and other animals are extremely sensi-
tive to motion in the periphery of our visual fi eld. Our sensitivity to static
detail falls off very rapidly away from the central fovea. Our sensitivity to
motion falls off much less, so we can still see that something is moving out
of the corner of our eye, even though the shape is invisible.
Motion is extremely powerful in generating an orienting response .
It is hard to resist looking at an icon jiggling on a web page, which is
exactly why moving icons can be irritating. A study by A.P. Hillstrom and
S. Yantis suggests that the things that most powerfully elicit the orienting
response are not simply things that move, but things that emerge into the
visual fi eld. � We rapidly become habituated to simple motion; otherwise,
every blade of grass moving would startle us.
In the design of computer interfaces, one good use of motion is as a
kind of human interrupt. Sometimes people wish to be alerted to incoming
email or instant messaging requests. Perhaps in the future virtual agents will
scour the Internet for information and occasionally report back their fi nd-
ings. Moving icons can signal their arrival. If the motion is rapid, the eff ect
may be irritating and hard to ignore, and this would be useful for urgent
messages. If the motion is slower and smoother, the eff ect can be a gentler
reminder that there is something needing attention. Of course, if we want to
use the emergence of an object to provoke an orienting response on the part
of the computer user it is not enough to have something emerge only once.
We do not see things that change when we are in the midst of making an eye
movement or when we are concentrating. Signaling icons should emerge
then disappear every few seconds or minutes to reduce habituation. �
Th e web designer now has the ability to create web pages that crawl,
jiggle, and fl ash. Unsurprisingly, because it is diffi cult for people to sup-
press the orienting response to motion, this has provoked a strong aversion
�
A.P. Hillstrom and S. Yantis, 1994.
Visual attention and motion capture.
Perception and Psychophysics . 55(4):
109–154.
�
I introduced the idea of using motion
as a human interrupt in a paper I wrote
with collaborators in 1992. C. Ware,
J. Bonner, W. Knight and R. Cater.
Moving icons as a human interrupt.
International Journal of Human–
Computer Interaction . 4(4): 173–178.
CH02-P370896.indd 36CH02-P370896.indd 36 1/23/2008 6:50:15 PM1/23/2008 6:50:15 PM
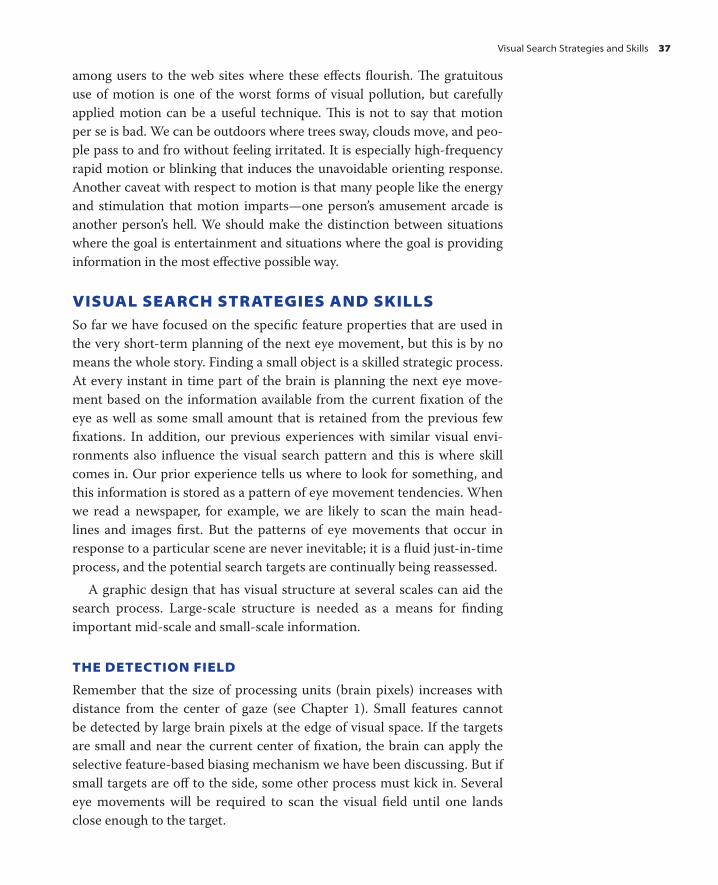
among users to the web sites where these eff ects fl ourish. Th e gratuitous
use of motion is one of the worst forms of visual pollution, but carefully
applied motion can be a useful technique. Th is is not to say that motion
per se is bad. We can be outdoors where trees sway, clouds move, and peo-
ple pass to and fro without feeling irritated. It is especially high-frequency
rapid motion or blinking that induces the unavoidable orienting response.
Another caveat with respect to motion is that many people like the energy
and stimulation that motion imparts—one person ’ s amusement arcade is
another person ’ s hell. We should make the distinction between situations
where the goal is entertainment and situations where the goal is providing
information in the most eff ective possible way.
VISUAL SEARCH STRATEGIES AND SKILLS So far we have focused on the specifi c feature properties that are used in
the very short-term planning of the next eye movement, but this is by no
means the whole story. Finding a small object is a skilled strategic process.
At every instant in time part of the brain is planning the next eye move-
ment based on the information available from the current fi xation of the
eye as well as some small amount that is retained from the previous few
fi xations. In addition, our previous experiences with similar visual envi-
ronments also infl uence the visual search pattern and this is where skill
comes in. Our prior experience tells us where to look for something, and
this information is stored as a pattern of eye movement tendencies. When
we read a newspaper, for example, we are likely to scan the main head-
lines and images fi rst. But the patterns of eye movements that occur in
response to a particular scene are never inevitable; it is a fl uid just-in-time
process, and the potential search targets are continually being reassessed.
A graphic design that has visual structure at several scales can aid the
search process. Large-scale structure is needed as a means for fi nding
important mid-scale and small-scale information.
THE DETECTION FIELD
Remember that the size of processing units (brain pixels) increases with
distance from the center of gaze (see Chapter 1). Small features cannot
be detected by large brain pixels at the edge of visual space. If the targets
are small and near the current center of fi xation, the brain can apply the
selective feature-based biasing mechanism we have been discussing. But if
small targets are off to the side, some other process must kick in. Several
eye movements will be required to scan the visual fi eld until one lands
close enough to the target.
Visual Search Strategies and Skills 37
CH02-P370896.indd 37CH02-P370896.indd 37 1/23/2008 6:50:15 PM1/23/2008 6:50:15 PM

38
1 2
3 4
5
Search Target Fixation sequence
Detection field for this size of target
Brain pixels get larger the farther away they are from the point of fixation, thus several eye movements are needed before the target can be detected. On the fourth fixation, the target is detected at the edge of the tunable region. A final eye movement brings it to the center of the fovea.
Th e area around the center of the fovea where the presence of a particu-
lar target may be detected can be thought of as a detection fi eld . If a search
target is within the detection fi eld, this does not necessarily mean that it
can be positively identifi ed; it only means that this can become a target
for the next fi xation, and after that it may be identifi ed. In the absence of
a candidate target in the detection fi eld, the purpose of a scanning strategy
is to get the eye in the vicinity of the target so that the feature-based pop-
out mechanism can function as a fi nal step.
A typical scanning strategy is the one we use when reading; we start
in the upper-left-hand corner and move our eyes across from left to right
starting at the top and progressing down. In most real-world search
tasks, the visual fi eld is not uniformly fi lled with potential candidates.
Sometimes the likely candidates are grouped in clusters, and our search
strategy will take advantage of this. Big patterns have a much bigger detec-
tion fi eld, and this allows for a hierarchical search strategy. If small target
patterns are embedded in specifi c types of large patterns, then this infor-
mation can be used. First we make an eye movement to the likely neigh-
borhood of a target, based on the limited information in our peripheral
vision; next, the local pattern information provides a few candidates for
individual detailed fi xations.
Our everyday environment has structure at all scales. Rooms contain
large furniture objects such as desks, chairs, bookshelves, and cupboards,
as well as small hand-sized objects such as books, telephones, and coff ee
cups. Th ese are arranged in predictable relationships; the books are on the
shelves and the desktops, and the coff ee cup is on the desk. Th is allows for a
much more effi cient visual search. For the thief in the night, the big patterns
CH02-P370896.indd 38CH02-P370896.indd 38 1/23/2008 6:50:15 PM1/23/2008 6:50:15 PM

may be dressers and side tables. Th e small patterns may be pieces of jewelry.
Sometimes it can be enough that the small targets are arranged in clumps,
enabling a strategy based on looking fi rst for the clumps, then searching
within each clump.
First search targets Fixation sequenceUltimate target
1
23
Th e process we have described so far is missing one essential prop-
erty. How does the search control system avoid revisiting places that have
already been examined? Unless there is a memory for where eye fi xations
have recently been placed, the point just visited will be the best candi-
date for the next fi xation. Without a blocking mechanism the eye would
be trapped, fl icking back and forth between the two most likely target
areas. Th e brain must somehow mark the locations of recent fi xations
and inhibit the tendency to revisit them. It is thought that a structure
on the where pathway called the lateral interparietal area performs this
function. � Experimental evidence suggests that between four and six loca-
tions recently visited with eye movements are retained. In some cases, the
identity of the object at a particular location may also be retained in visual
working memory, but in other cases the brain simply fl ags the fact that a
particular location has been visited.
THE VISUAL SEARCH PROCESS
We can now elaborate on the inner loops of visual problem solving that
were introduced in Chapter 1, concentrating on the eye movement con-
trol process. We will start with the outermost loop and work in.
Move and scan loop . Assuming that we know what we are looking for,
when we enter an environment, our initial search strategy will involve ori-
enting the head and perhaps walking to get the best viewpoint. From this
vantage, we will initiate a sequence of fi xations. If the target is not found
we move to a new vantage point to continue the search.
Eye movement control loop . Planning and executing eye movements
occurs between one and three times per second. Th is involves both the
biasing mechanism, so that new candidate targets can be determined
In this example, the targets are clustered and a two-stage search strategy is used. The first stage involves tuning for and making an eye movement to a cluster of targets (seen as fuzzy blobs in the periphery). After the fixation is made, the blob is resolved into individual targets. The second stage involves tuning for and making an eye movement to a particular candidate target within a blob. The final tuning is based on orientation.
�
See James W. Bisley, and Michael
E. Goldberg, 2003. Neuronal activity
in the lateral interparietal area and
spatial attention. Science . 299: 81–86.
Visual Search Strategies and Skills 39
CH02-P370896.indd 39CH02-P370896.indd 39 1/23/2008 6:50:16 PM1/23/2008 6:50:16 PM

40
based on their elementary properties of form (orientation, size, color,
motion), and a simple map of what regions have been recently visited by
means of eye movements.
Pattern-testing loop . When the eye alights on a promising target area,
the inner loop function is executed. Th is involves testing the pattern to
see if it is the search target or not. Th e brain takes about one-twentieth of
a second to make each test; typically between one and four tests are made
on each fi xation.
Inhibitedtarget areas
If pattern not presenttune primary visual cortexfor relevant features
Process current area of fixation for search pattern
Make eye and possibly head movement to acquirecandidate area
If good nearby candidatemake eye movement to acquire it. Next candidates
current pointof fixation
Inhibit areas already visitedwith eye movements
Tune for peripheral cues
Otherwiseuse task knowledge andmore peripheral scene informationto determine next most likelycandidate search area.
Pattern testing
USING MULTISCALE STRUCTURE TO DESIGN FOR SEARCH To support effi cient visual search, a design should be given large-scale as
well as small scale structure. All too often, artifi cial information displays
lack visual structure at diff erent scales. Menus and windows tend to all look
the same. One rectangular box is much like another. Adding multiscale
visual structure will make search much more effi cient, as long as the smaller
objects of search can predictably be associated with larger visual objects.
Multi-scale structure
CH02-P370896.indd 40CH02-P370896.indd 40 1/23/2008 6:50:17 PM1/23/2008 6:50:17 PM

Having structure at multiple scales is most important for designs that
will be used over and over again. It permits visual search skills to develop
in the form of eye movement sequences that occur in response to the gen-
eral properties of a particular scene. But even for designs that are used
only for a few minutes, high-level structure supports location memory and
makes it easier to revisit places that have been looked at only seconds ago.
CONCLUSION Visual search is not an occasional activity only occurring when we have
lost something. Because we have so little information in our heads, search
is something that is fundamental to almost all seeing. Even though we are
mostly unaware that we are doing it, the visual world is being reassessed
in terms of where we should look next on every fi xation. Two seconds is
a long time in a visual thinking. Th ere is a world of diff erence between
something that can be located with a single eye movement and one that
takes fi ve or ten. In the former case, visual thinking will be fl uid, in the lat-
ter, it will be ineffi cient and frustrating.
Color
Elementaryshape
size elongation
orientation
Motion
hue lightness
Spatial grouping
Basic Popout Channels
Conclusion 41
CH02-P370896.indd 41CH02-P370896.indd 41 1/23/2008 6:50:18 PM1/23/2008 6:50:18 PM
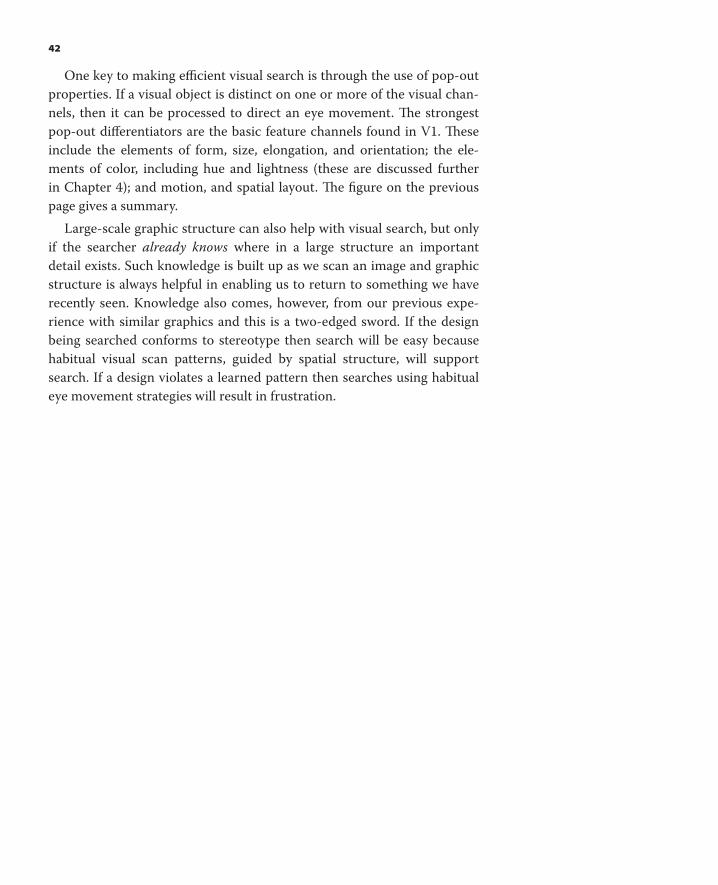
42
One key to making effi cient visual search is through the use of pop-out
properties. If a visual object is distinct on one or more of the visual chan-
nels, then it can be processed to direct an eye movement. Th e strongest
pop-out diff erentiators are the basic feature channels found in V1. Th ese
include the elements of form, size, elongation, and orientation; the ele-
ments of color, including hue and lightness (these are discussed further
in Chapter 4); and motion, and spatial layout. Th e fi gure on the previous
page gives a summary.
Large-scale graphic structure can also help with visual search, but only
if the searcher already knows where in a large structure an important
detail exists. Such knowledge is built up as we scan an image and graphic
structure is always helpful in enabling us to return to something we have
recently seen. Knowledge also comes, however, from our previous expe-
rience with similar graphics and this is a two-edged sword. If the design
being searched conforms to stereotype then search will be easy because
habitual visual scan patterns, guided by spatial structure, will support
search. If a design violates a learned pattern then searches using habitual
eye movement strategies will result in frustration.
CH02-P370896.indd 42CH02-P370896.indd 42 1/23/2008 6:50:19 PM1/23/2008 6:50:19 PM
43
Structuring Two-Dimensional Space
Patterns are formed where ideas meet the evidence of the world. Top-
down attentional processes cause patterns to be constructed from the
retinal image that has been decomposed, like an impressionist paint-
ing, into a myriad of features in V1. Patterns are formed in a middle
ground of fl uid dynamic visual processing that both pulls meaningful
patterns from features and imposes order. Patterns are also the building
blocks of objects, which themselves can be thought of as more complex
patterns.
Understanding how patterns are constructed and reconstructed can
tell us a lot about the design problems of organizing space, either in ways
that are unambiguous and clear, or in ways that are subject to multiple
interpretations. Both have their uses. We shall start with a discussion of
the dimensions of space to show why image plane patterns are so special.
Th en we move on to discuss how patterns are formed from the low-level
features discussed in the previous chapter.
CH03-P370896.indd 43CH03-P370896.indd 43 1/24/2008 4:32:00 PM1/24/2008 4:32:00 PM

2.5D SPACE Although we live in a three-dimensional world, these dimensions are not
equal in terms of human perception of space. Th e two dimensions laid
out “ in the picture plane ” have little in common with the third dimension
towards and away from the viewpoint.
Up-down
Away Towards
Sideways
If we direct an imaginary ray away from the pupil of one of our eyes
into the world, it will eventually encounter a point on the surface of an
object; except for those cases when the ray reaches the empty sky. Th at
surface point has a color and a distance from the eye. Of course, in the
real world, light travels in the reverse direction and information about
the surface color is recorded by cone receptors at the back of the eye, but
the point is that there is only one color in the away direction correspond-
ing to each retina location. About a million fi bers in each optic nerve
transmit to the brain a million pieces of information about the world in
the combined up-down and sideways dimensions (defi ned by the dia-
gram above). For each of those points of information there is, at best,
one additional piece of distance information relating specifi cally to the
away dimension, and this extra information must be indirectly inferred.
It is for this reason that people sometimes refer to visual space as hav-
ing 2.5 dimensions, where the 0.5 refers to the away dimension. However,
We only see the outside shell of the world
Tho
usan
ds
of points in this direction
One point along each ray
Since most things are not transparent, only facing surfaces are visible and only one point of color is available on each ray from a particular brain pixel. But there are millions of rays that can be distinguished in the up-down and sideways dimensions.
44
It is useful to consider visual space using radial coordinates, centered on the eye-point of an observer. We can usefully call the three dimensions the up-down dimension, the sideways dimension, and the towards-away dimension. For convenience we shall shorten these to up-down , sideways , and away .
CH03-P370896.indd 44CH03-P370896.indd 44 1/24/2008 4:32:01 PM1/24/2008 4:32:01 PM

this substantially overstates the case. It would be more accurate to say that
visual space has 2.05 dimensions. Sometimes the term image plane is used
to refer to up-down and sideways dimensions combined because this is
the information that can be captured on the image plane of a camera. Th e
term depth is used to refer to away information.
Our ability to get a whole new sample of visual space is also radically
diff erent for the diff erent dimensions. We can sample the up-down and
sideways dimensions of space with rapid eye movements and get a mostly
new sample of a million points of data on each retina in less than one-
tenth of a second. By contrast, in order to get new information in the
away direction we have to walk to a new location, so that information that
was blocked becomes revealed. Th is can take from several seconds to a
few minutes or more. Head-turning movements are intermediate in time
costs and allow us to access parts of the up-down and sideways dimen-
sions using eye movements. Th e point here is that image-plane sampling
through eye movements is ten to a hundred times more effi cient than
depth sampling by walking and provides much greater cognitive effi ciency.
Pattern-processing resources in the brain are mostly devoted to infor-
mation in the image plane, as opposed to depth. Th ese two-dimensional
patterns are fundamentally important for two reasons. First, they are the
precursors of objects. Second, a pattern can also be a relationship between
objects. In some ways, pattern fi nding is the very essence of visual think-
ing, and often to perceive a pattern is to solve a problem.
Later in this chapter, we will examine the design implications of the
brain ’ s pattern-fi nding mechanisms. First, we consider the nature of the
pattern-processing machinery.
Finding the boundaries of objects is an important function of the pattern-processing systems. In order for the brain to find an object, it must somehow be distinguished from other objects in the environment, and often the most important piece of information is that it has a continuous contour running all around it. The figure on the left is distinguished from its background by many different kinds of contours.
2.5D Space 45
CH03-P370896.indd 45CH03-P370896.indd 45 1/24/2008 4:32:02 PM1/24/2008 4:32:02 PM
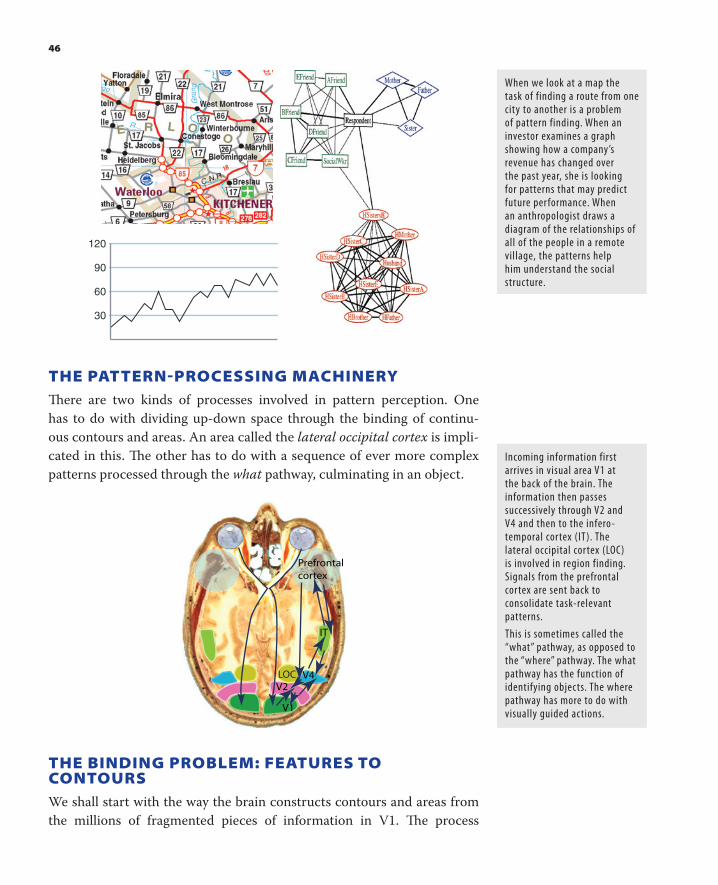
30
60
120
90
THE PATTERNPROCESSING MACHINERY Th ere are two kinds of processes involved in pattern perception. One
has to do with dividing up-down space through the binding of continu-
ous contours and areas. An area called the lateral occipital cortex is impli-
cated in this. Th e other has to do with a sequence of ever more complex
patterns processed through the what pathway, culminating in an object.
V1
V2V4
Prefrontalcortex
IT
LOC
THE BINDING PROBLEM: FEATURES TO CONTOURS We shall start with the way the brain constructs contours and areas from
the millions of fragmented pieces of information in V1. Th e process
When we look at a map the task of finding a route from one city to another is a problem of pattern finding. When an investor examines a graph showing how a company ’ s revenue has changed over the past year, she is looking for patterns that may predict future performance. When an anthropologist draws a diagram of the relationships of all of the people in a remote village, the patterns help him understand the social structure.
Incoming information first arrives in visual area V1 at the back of the brain. The information then passes successively through V2 and V4 and then to the infero-temporal cortex (IT). The lateral occipital cortex (LOC) is involved in region finding. Signals from the prefrontal cortex are sent back to consolidate task-relevant patterns.
This is sometimes called the “ what ” pathway, as opposed to the “ where ” pathway. The what pathway has the function of identifying objects. The where pathway has more to do with visually guided actions.
46
CH03-P370896.indd 46CH03-P370896.indd 46 1/24/2008 4:32:03 PM1/24/2008 4:32:03 PM

of combining diff erent features that will come to be identifi ed as parts of
the same contour or region is called binding . Th ere is no such thing as an
object embedded in an image; there are just patterns of light, shade, color,
and motion. Objects and patterns must be discovered, and binding is
essential because it is what makes disconnected pieces of information into
connected pieces of information. �
To explain how the responses of individual feature-detecting neurons
may become bound into a pattern representing the continuous edge of an
object, let us indulge in a little anthropomorphism and imagine ourselves
to be a single neuron in the primary visual cortex. As a neuron, we are far
more complex than a transistor in a computer—our state is infl uenced by
incoming signals from thousands of other neurons; some excite us, some
inhibit us. When we get overexcited we fi re , shooting a convulsive burst
of electrical energy along our axon. Our outgoing axon branches out and
ultimately infl uences the fi ring of thousands of other neurons. Supposing
we are the kind of neuron in the primary visual cortex that responds to
oriented edge information, we get most excited when part of an edge or a
contour falls over a particular part of the retina to which we are sensitive.
Th is exciting information may come from almost anything, part of the sil-
houette of a nose or just a bit of oriented texture.
Inputs
axon
Outputs
Thousands of inputs are received on the dendrites. These signals are combined in the cell body.
The neuron fires an electrical spike of energy along the axon, which branches out at the end to influence other neurons, some positively, some negatively. Neurons fire all the time, and information is carried by both increases and decreases in the rate.
Now comes the interesting bit. In addition to the information from
the retina, we also receive input from neighboring neurons and we set
up a kind of mutual admiration society with some of them, egging them
on as they egg us on. To form part of our edge-detecting club, they must
respond to part of the visual world that is in-line with our preferred axis,
and they must be attuned to roughly the same orientation. When these
conditions are met, we start to pulse in unison sending out pulses of elec-
trical energy together.
� It is never acceptable to simply say
that a higher level mechanism looks
at the low-level information. That is
called the homunculus fallacy. It is like
saying that there is an inner person (a
homunculus) that sees the information
on the retina or in the primary visual
cortex. A proper explanation is that
a set of mechanisms and processes
produce intelligent actions as an
outcome of interactions between
processes operating in sub-systems of
the brain.
The Binding Problem: Features to Contours 47
CH03-P370896.indd 47CH03-P370896.indd 47 1/24/2008 4:32:06 PM1/24/2008 4:32:06 PM

Our neuron is also surrounded by dozens of other neurons that respond
to other orientations and, like some human groups, it actively discourages
them. It sends inhibitory signals to nearby neurons that have diff erent
orientation preferences. Th is has the eff ect of damping their enthusiasm.
Th e result is that neurons that are stimulated by long unbroken edges in
the visual image mutually reinforce one another and all begin to fi re in
unison. Neurons responding to little fragments of edges have their signals
suppressed.
A noisy edgeThe response to the main contour is enhanced through mutual excitation.
The response to the short contourswith other orientations is suppressed.
In addition to the signals received by the neuron from the retinal image
and from its neighbors, we should not forget the top-down actions of
attention. If a particular edge is part of an object that is related to some
task being performed, for example, the edge belonging to the handle of a
48
� �
�
�� �
��
�
�
� ��
Edge detector neurons have a positive excitatory relationship with other edge detectors that are nearby and aligned. There is an inhibitory relationship with cells responding to non-aligned features.
When light from an edge falls across the receptive fields of positively connected neurons a whole chain of neurons will start pulsing together. They are bound together by this common activity.
CH03-P370896.indd 48CH03-P370896.indd 48 1/24/2008 4:32:07 PM1/24/2008 4:32:07 PM

mug that someone is reaching for, then additional reinforcement and
binding will occur between the pattern information and an action pattern
involving the guidance of a hand. Th e mental act of looking for a pattern
makes that pattern stand out more distinctly. On the other hand, if we are
looking for a particular pattern and another pattern appears that is irrel-
evant to our immediate task, we are unlikely to see it.
Binding is not only something required for the edge-fi nding machinery.
A binding mechanism is needed to account for how information stored in
various parts of the brain is momentarily associated through the process of
visual thinking. Visual objects that we see in our immediate environment
must be temporarily bound to the information we already have stored in
our brains about those objects. Also, information we gain visually must
be bound to action sequences, such as patterns of eye movements or hand
movements. Th is higher-level binding is the subject of Chapter 6.
THE GENERALIZED CONTOUR An object may be separated from its background in many diff erent ways
including luminance changes at its silhouette, color diff erences, texture
boundaries, and even motion boundaries. Th erefore the brain requires a
generalized contour extraction mechanism in the pattern-processing stage of
perception. Emerging evidence points to this occurring in a region called the
lateral occipital cortex (LOC) that receives input from V2 and V3 allowing
us to discern an object or pattern from many kinds of visual discontinuity.�
Generalized contour
One of the mysteries that is solved by the generalized contour mechanism
is why line drawings are so eff ective in conveying diff erent kinds of informa-
tion. A pencil line is nothing like the edge of a person ’ s face, yet a simple
Many different kinds of boundaries can activate a generalized contour.
A generalized contour does not actually look like anything. It is a pattern of neural activation in part of the brain.
�
Zoe Kourtzi of the University of
Tuebingen in Germany and Nancy
Kanwisher of MIT in the U.S. recently
found that the lateral occipital cortex
has neurons that respond to shapes
irrespectively of how the bounding
contours are defined.
Kourtzi, Z. and Kanwisher, N. 2001.
Representation of perceived object
shapes by the human lateral occipital
cortex. Science. 293: 1506–1509.
The Generalized Contour 49
CH03-P370896.indd 49CH03-P370896.indd 49 1/24/2008 4:32:08 PM1/24/2008 4:32:08 PM

sketch can be instantly identifi able. Th e explanation of the power of lines is
that they are eff ective in stimulating the generalized contour mechanism.
TEXTURE REGIONS Th e edges of objects in the environment are not always defi ned by clear con-
tours. Sometimes it is only the texture of tree bark, the pattern of leaves on
the forest fl oor, or the way the fur lies on an animal ’ s back that makes these
things distinct. Presumably because of this, the brain also contains mecha-
nisms that rapidly defi ne regions having common texture and color. We shall
discuss texture discrimination here. Th e next chapter is devoted to color.
In general, the same properties that make individual symbols distinct
(discussed in Chapter 2) will also make textures distinct. Primarily these
are texture element orientation, size contrast, and color—the properties
of V1 neurons in the primary visual cortex. In a way, this is hardly surpris-
ing; if large numbers of symbols or simple shapes are densely packed we
stop thinking of them as individual objects and start thinking of them as a
texture. Th e left- and right-hand sides of these texture patches are easy to
discriminate because they contain diff erences in how they aff ect neurons
in the primary visual cortex.
Excluding color and overall lightness, the primary factors that make one texture distinct from another are grain size, orientation, and contrast.
Orientation
Grain size
Curve versus Straight
Blur
50
CH03-P370896.indd 50CH03-P370896.indd 50 1/24/2008 4:32:08 PM1/24/2008 4:32:08 PM

When low-level feature diff erences are not present in adjacent regions
of texture, they are more diffi cult to distinguish. Th e following examples
show hard-to-discriminate texture pairs.
Ts and Ls have the same line components.
Red circles and green rectangles versus green circles and red rectangles.
The spikes are oriented differently; the field of orientations is the same.
Although the mechanisms that bind texture elements into regions have
been studied less than the mechanisms of contour formation, we may pre-
sume that they are similar. Mutual excitation between similar features in V1
and V2 explains why we can easily see regions with similar low-level feature
components through spreading activation. More complex texture patterns,
such as the Ts and Ls, do not allow for the rapid segmentation of space into
regions. Only basic texture diff erences should be used to divide space.
INTERFERENCE AND SELECTIVE TUNING Th e other side of the coin of visual distinctness is visual interference. As a
general rule, like interferes with like. Th is is easy to illustrate with text.
Text on a background containingsimilar feature elements will be very difficult to read even thoughthe background color is different.
The more the background differsin element granularity, in feature similarity, and in the overall contrast, the easier the text will be to read.
Subtle, low-contrast background texture with little feature similarity will interfere less.
To minimize this kind of visual interference (it cannot be entirely
eliminated), one must maximize feature-level diff erences between pat-
terns of information. Having one set of features move, and another set
static is probably the most eff ective way of separating overlaying patterns,
although there are obvious reasons why doing this may not be desirable.
Interference and Selective Tuning 51
CH03-P370896.indd 51CH03-P370896.indd 51 1/24/2008 4:32:09 PM1/24/2008 4:32:09 PM

PATTERNS, CHANNELS, AND ATTENTION As we discussed in Chapter 2, attentional tuning operates at the feature
level, rather than the level of patterns. Nevertheless, because patterns are
made up of features we can also choose to attend to particular patterns
if the basic features in the patterns are diff erent. Th e factors that make it
easy to tune are the usual set and include color, orientation, texture, and
the common motion of the elements. However, some pattern-level factors,
such as the smooth continuity of contours, are also important. Once we
choose to attend to a particular feature type, such as the thin red line in
the illustration below, the mechanisms that bind the contour automatically
kick in.
Representing overlapping regions is an interesting design problem
that can be approached using the channel theory introduced in the previ-
ous chapter. An example problem is to design a map that shows both the
mean temperature and the areas of diff erent vegetation types. Th e goal
is to support a variety of visual queries on the temperature zones, or the
vegetation zones, or both. Applying what we know about low-level feature
processing is the best way of accomplishing this. If diff erent zones can be
With this figure you can choose to attend to the text, the numbers, the thin red line, or the fuzzy black symbols. As you attend to one kind of representation, the others will recede.
52
If many overlapping regions are to be shown then a heterogeneous channel-based approach can help. On the left is a diagram in which every combination of five overlapping regions is shown. The central version using color is clearer, but still confusing. The version on the right uses color, texture, and outline. Take any point on this last diagram and it is easy to see the set of regions to which it belongs.
CH03-P370896.indd 52CH03-P370896.indd 52 1/24/2008 4:32:11 PM1/24/2008 4:32:11 PM

represented in ways that are as distinct as possible in terms of simple
features, the result will be easy to interpret, although it may look stylisti-
cally muddled.
INTERMEDIATE PATTERNS It is thought that the what pathway identifi es objects in a series of brain
regions responding to increasingly complex patterns. In area V2, neu-
rons exist that respond to patterns only slightly more complex than the
patterns found in V1 neurons. At the V4 stage, the patterns are still more
complex chunks of information. V4 neurons then feed into regions in
the inferotemporal cortex where specifi c neurons respond to images of
faces, hands, automobiles, or letters of the alphabet. Each of the regions
provides a kind of map of visual space that is distorted to favor central
vision as discussed in Chapter 1. However, as we move up the hierarchy
the mapping of visual imagery on the retina becomes less precise.
Features Patterns
Objects
The What Hierarchy
Loca
tio
n t
ied
to re
tin
a
Can
be
in a
ny
loca
tio
n
Currently, there is no method for directly fi nding out which of an infi -
nite number of possible patterns a neuron responds to best. All researchers
can do is to fi nd, by a process of trial and error, what they respond to well.
Th e problem increases as we move up the what hierarchy. As a result much
less is known about the mid-complexity patterns of V4 than the simple
ones of V1 and V2. What is known is they include patterns such as spikes,
convexities, concavities, as well as boundaries between texture regions,
and T and X junctions. � A selection is illustrated here.
As information flows up the what hierarchy, it becomes increasingly complex and tied to specific tasks, but also decreasingly localized in space. In the inferotemporal cortex, a neuron might respond to a cat anywhere in the central part of the visual field.
�
Anitha Pasupathy and Charles Connor,
2002. Population coding of shape in
area V4. Nature Neuroscience. 5(12):
1332–1338.
Intermediate Patterns 53
CH03-P370896.indd 53CH03-P370896.indd 53 1/24/2008 4:32:14 PM1/24/2008 4:32:14 PM
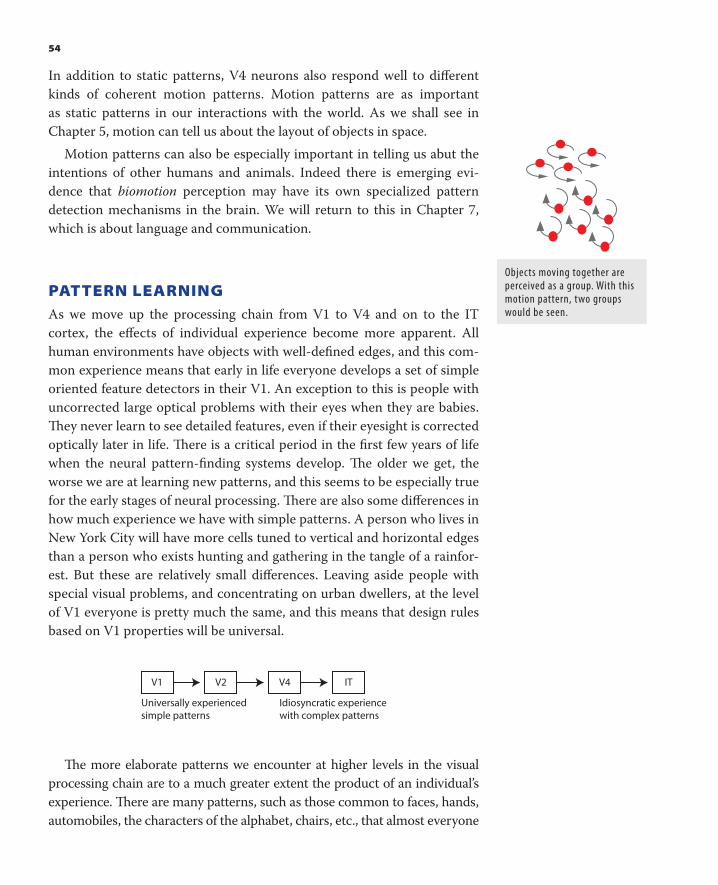
In addition to static patterns, V4 neurons also respond well to diff erent
kinds of coherent motion patterns. Motion patterns are as important
as static patterns in our interactions with the world. As we shall see in
Chapter 5, motion can tell us about the layout of objects in space.
Motion patterns can also be especially important in telling us abut the
intentions of other humans and animals. Indeed there is emerging evi-
dence that biomotion perception may have its own specialized pattern
detection mechanisms in the brain. We will return to this in Chapter 7,
which is about language and communication.
PATTERN LEARNING As we move up the processing chain from V1 to V4 and on to the IT
cortex, the eff ects of individual experience become more apparent. All
human environments have objects with well-defi ned edges, and this com-
mon experience means that early in life everyone develops a set of simple
oriented feature detectors in their V1. An exception to this is people with
uncorrected large optical problems with their eyes when they are babies.
Th ey never learn to see detailed features, even if their eyesight is corrected
optically later in life. Th ere is a critical period in the fi rst few years of life
when the neural pattern-fi nding systems develop. Th e older we get, the
worse we are at learning new patterns, and this seems to be especially true
for the early stages of neural processing. Th ere are also some diff erences in
how much experience we have with simple patterns. A person who lives in
New York City will have more cells tuned to vertical and horizontal edges
than a person who exists hunting and gathering in the tangle of a rainfor-
est. But these are relatively small diff erences. Leaving aside people with
special visual problems, and concentrating on urban dwellers, at the level
of V1 everyone is pretty much the same, and this means that design rules
based on V1 properties will be universal.
V1 V2 V4 IT
Universally experiencedsimple patterns
Idiosyncratic experiencewith complex patterns
Th e more elaborate patterns we encounter at higher levels in the visual
processing chain are to a much greater extent the product of an individual ’ s
experience. Th ere are many patterns, such as those common to faces, hands,
automobiles, the characters of the alphabet, chairs, etc., that almost everyone
54
Objects moving together are perceived as a group. With this motion pattern, two groups would be seen.
CH03-P370896.indd 54CH03-P370896.indd 54 1/24/2008 4:32:14 PM1/24/2008 4:32:14 PM

experiences frequently, but there are also many patterns that are related to
the specialized cognitive work of an individual. All visual thinking is skilled
and depends on pattern learning. Th e map reader, the art critic, the geolo-
gist, the theatre lighting director, the restaurant chef, the truck driver, and
the meat inspector have all developed particular pattern perception capabili-
ties encoded especially in the V4 and IT cortical areas of their brains.
As an individual becomes skilled, increasingly complex patterns
become encoded for rapid processing at the higher levels of the what path-
way. For the beginning reader, a single fi xation and a tenth of a second may
be needed to process each letter shape. Th e expert reader will be able to
capture whole words as single perceptual chunks if they are common. Th is
gain in skill comes from developing connections in V4 neurons that trans-
forms the neurons into effi cient processors of commonly seen patterns.
SERIAL PROCESSING
Th e pop-out eff ects discussed in the previous chapter are based on simple
low-level processing. More complex patterns such as those processed by
levels V4 and above do not exhibit pop out. Th ey are processed one chunk
at a time. We can take in only two or three chunks on a single fi xation.
VISUAL PATTERN QUERIES AND THE APPREHENDABLE CHUNK Patterns range from novel to those that are so well learned that they are
encoded in the automatic recognition machinery of the visual system. Th ey
also range from the simple to the complex. What is of particular interest
for design is the complexity of a pattern that can be apprehended in a sin-
gle fi xation of the eye and read into the brain in a tenth of a second or less.
Apprehendability is not a matter of size so long as a pattern can be
clearly seen. For example, the green line snaking across this page can easily
be apprehended in a single fi xation. Th e visual task of fi nding out what lies
at the end of the green line requires only a single additional eye movement
once we have seen the line. But apprehendability does have to do with both
complexity and interference from other patterns. Finding out if the line
beginning at the red circle ends in the star shape will require a sequence of
fi xations. Th at pattern is made up of several apprehendable chunks.
For unlearned patterns the size of the apprehendable chunk appears to
be about three feature components. Even with this simple constraint, the
variety is enormous. A few samples are given on the right. Each illustrates
roughly the level of unlearned pattern complexity that research suggests
we can take in and hold from a single glance.
Visual Pattern Queries and the Apprehendable Chunk 55
CH03-P370896.indd 55CH03-P370896.indd 55 1/24/2008 4:32:14 PM1/24/2008 4:32:14 PM

MULTICHUNK QUERIES
Performing visual queries on patterns that are more complex than a single
apprehendable chunk requires substantially greater attentional resources
and a series of fi xations. When the pattern is more complex than a single
chunk the visual query must be broken up into a series of subqueries, each
of which is satisfi ed, or not, by a separate fi xation. Keeping track of appre-
hendable chunks is the task of visual working memory, and this is a major
topic of Chapter 6.
SPATIAL LAYOUT Pattern perception is more than contours and regions. Groups of objects
can form patterns based on the proximity of the elements.
We do not need to propose any special mechanism to explain these
kinds of grouping phenomena. Pattern detection mechanisms work on
many scales; some neurons respond best to large shapes, others respond
to smaller versions of those same shapes. A group of smaller points or
objects will provoke a response from a large-shape detecting neuron,
while at the same time other neurons, tuned to detect small features,
respond to the individual components.
Both of the patterns shown above will excite the same large-scale feature detectors giving the overall shape. The pattern on the left will additionally stimulate small-scale detectors corresponding to the grey dots.
Large-scale oriented feature detectors will be stimulated by the large-scale structure of these patterns.
Both the perception of groups and outliers are determined by proximity.
56
CH03-P370896.indd 56CH03-P370896.indd 56 1/24/2008 4:32:15 PM1/24/2008 4:32:15 PM

Objects in the real world have structure at many scales. In a garden,
for example, individual fl owers provide small-scale patterns, and these are
organized into patches of color depending on the design of a fl ower bed.
Th e entire structure of lawns, fl ower beds, trees, and paths form a large-
scale pattern.
V4 neurons still respond strongly to patterns despite distortions that
stretch or rotate the pattern, so long as the distortion is not too extreme.
Th is is a critical property that allows us to recognize shapes and patterns
even when they are seen from somewhat diff erent angles and from some-
what diff erent distances. A single V4 neuron might respond well to all of
these diff erent T patterns.
Th e ability to respond to a distorted pattern is the kind of thing that
neurons do well but has been very diffi cult to reproduce with computers.
It is not an exaggeration to say that our ability to perceive patterns
under distortions and when partially hidden is fundamental to visual
intelligence.
HORIZONTAL AND VERTICAL
Th e up-down direction and the sideways direction are special. Th ey are
perceived diff erently from each other and from other orientations. We are
very sensitive to whether something is exactly vertical or horizontal and
can make this judgment far more accurately than judging if a line is ori-
ented at forty-fi ve degrees. Th e reason for this has to do with two things:
one is maintaining our posture with respect to gravity; the other is that
our modern world contains many vertically oriented rectangles and so
more of our pattern-sensitive neurons become tuned to vertical and hor-
izontal contours. Th is makes the vertical and horizontal organization of
information an eff ective way of associating a set of visual objects.
These patterns stimulate mechanisms responding to both small-scale feature and medium-scale features. They are patterns of pattern.
Spatial Layout 57
CH03-P370896.indd 57CH03-P370896.indd 57 1/24/2008 4:32:16 PM1/24/2008 4:32:16 PM

The line on the right is only rotated 3 degrees from the vertical, yet this departure from parallel is clearly evident.
People are extremely sensitive when judging small end-to-end misalignments of straight lines.
PATTERN FOR DESIGN Most designs can be considered hybrids of learned symbolic meanings,
images that we understand from our experience, and patterns that visu-
ally establish relationships between the components, tying the design
elements together. A design can be made visually effi cient by expressing
relationships by means of easily apprehended patterns.
Relationships between meaningful graphical entities can be established
by any of the basic pattern-defi ning mechanisms we have been discussing:
connecting contours, proximity, alignment, enclosing contour, color, tex-
ture, and common movement.
F
AB
C
Connecting contour
AB
Enclosing contour
AB
CE
ABC
Common color region
Proximity grouping
FA B C D E F
Alignment Common movement
EF
AAACCCBBBFEE
BC
A
Common texture region
Graphic patterns defi ned by contour or region can be used in very
abstract ways to express the structure of ideas. Th e relationship between
concepts can be defi ned by graphically using techniques that are funda-
mental to the way diagrams work.
Nested concepts Overlapping concepts Entities relatedacross groups
Multiple differingrelationships
58
CH03-P370896.indd 58CH03-P370896.indd 58 1/24/2008 4:32:16 PM1/24/2008 4:32:16 PM

Pattern for Design 59
Relationship-defi ning patterns can also be used in combination. For exam-
ple, a texture region can be used to defi ne one kind of relationship, and this
can be used in combination with connecting contours that defi ne another
kind of relationship. Th e design challenge is to use each kind of design device
to its greatest advantage in providing effi cient access to visual queries.
Road Map. Supports route planning.
Example: Find an efficient route between Glen Allan in the upper left corner and Cambridge in the lower right. The cognitive process involves the following complex set of visual pattern queries.
Locate end points corresponding to Glen Allan and Cambridge. [Query, visual search for tex t labels].
Find path from Glen Allan to main road. [Query, search for where grey line intersects with red line ].
Follow highway in direction of Cambridge. [Query, visually trace red and orange lines towards the lower left] .
Detect highway exit point [query white oval] near to road connecting to Cambridge. At this point the point of fixation will be close enough to Cambridge that the remainder of the route can be grasped in a single apprehendable chunk.
Find path from exit to Cambridge. [ Query, discover red path from exit symbol to Cambridge symbol ].
Map of water currents and temperature. Supports reasoning about currents in the Western North Atlantic. The ocean current patterns are represented using streaklets of different length and width. The background color provides information about water temperature.
Example: Find where the strongest currents are located. [Query, find locations of the fat long streaklets].
Example: Find out where something that was dropped in the water (for example, fish larvae) might end up after a period of time. [Query, find where a particular train of streaklets leads].
Example: Find the regions with the coldest water. [Query, find locations of darkest blue color].
Design comment: In the regions where the current velocity is slow (thin lines), the direction is unclear.
CH03-P370896.indd 59CH03-P370896.indd 59 1/24/2008 4:32:17 PM1/24/2008 4:32:17 PM

EXAMPLES OF PATTERN QUERIES WITH COMMON GRAPHICAL ARTIFACTS To elaborate these ideas, the remainder of this chapter is devoted to
a set of examples of common graphical information displays. Each of
them supports a form of visual reasoning; in each case the quality of the
design depends on its supporting a specifi c set of visual pattern queries.
We begin with two maps shown on the previous page and continue with a
selection of charts, a news page, and some other diagrams.
Time
Wat
er
tem
pe
ratu
re10
5
15
20
Time
Fish
Cat
ch
30
60
120
90
Fish
Cat
ch
Wat
er
tem
pe
ratu
re
Time
10
5
15
20
30
60
120
90
Uncertainty
Time
Fish
Cat
ch
30
60
120
90
Line Graph: Supports reasoning about how one measured variable changes with another.
Example: Determine fish catch as it varies over time. Common tasks are to determine when the maximum and minimum catches occurred, and whether the catch is trending up or down. [Queries, find the highest point; find the lowest point; find whether the line slopes up or down overall.]
Example: Often people reason by comparing one graph against another. In this case, the task might be to see if the fish catch is correlated with water temperature. [Queries, discover if the high points and low points match for the two graphs; find if there is a correspondence in the overall trend for the two graphs.]
Design note: Visual queries to find corresponding patterns are much easier to make if the two graphs can be combined.
Example: Often there is a degree of uncertainty in measurements, and this can be represented by a broad swath showing the uncertainty range at each point. [Query, determine the vertical ex tent of the grey band at a particular point on the black line.]
Th e point of the preceding examples has been to show that a wide vari-
ety of graphical display can be analyzed in terms of visual queries, each of
which is essentially a visual search for a particular set of patterns. It is easy
to construct such examples for any kind of graphical display. Indeed, it is
a central thesis of this book that this kind of visual analysis is a critical
design skill.
60
CH03-P370896.indd 60CH03-P370896.indd 60 1/24/2008 4:32:27 PM1/24/2008 4:32:27 PM

Web page for news site: Supports the search for various classes of current news including business, sports, politics, etc., as well as headline stories. The page has been deliberately blurred to bring out the overall spacial structure of the page.
Example: Discover major categories of news supported by this site. [Query to locate top bar and left bar to find menus of alternatives]. This design benefits from the fact that most web pages have adopted similar layout patterns.
Example: Discover current headline stories. [Query to locate large tex t headlines. Read headlines. Query to locate pictures. Apprehend gist]. The rapid apprehension of the gist of images is discussed in Chapter 5.
Examples of Pattern Queries with Common Graphical Artifacts 61
CH03-P370896.indd 61CH03-P370896.indd 61 1/24/2008 4:32:27 PM1/24/2008 4:32:27 PM

A
B
Node link diagrams: Support reasoning about relationships between entities. Typically the boxes represent entities, and the linking lines represent relationships. One variation on the node-link diagram is the organization chart.
Example: If A and B should work together on a project, who in the organization should be involved in setting this up. [Query, trace upward paths from both A and B noting all the boxes and the individuals these boxes represent].
Node link diagrams (second example): Shows network links between computers. Different styles of lines represent different rates of data communication.
Example: Can the network function when a node fails? [Query, is node X is the sole link connecting any pair of components].
Example: Is data bandwidth is adequate between a given pair of nodes? [Query, locate end points and trace paths between them, using line style representing the capacity of alternative links.] This becomes broken down into subqueries for colored connected contours, and is similar to the problem of route planning using maps.
SEMANTIC PATTERN MAPPINGS For the most part, when we see patterns in graphic designs we are rely-
ing on the same neural machinery that is used to interpret the everyday
environment. Th ere is, however, a layer of meaning—a kind of natural
semantics—that is built on top of this. For example, we use a big graphi-
cal shape to represent a large quantity in a bar chart. We use something
graphically attached to another object to show that it is part of it.
Th ese natural semantics permeate our spoken language, as well as the
language of design. Indeed, the philosopher of language, George Lakoff ,
argues persuasively that spatial metaphors are not just ways of making lan-
guage more vivid, they are fundamental to the way language works in com-
munication and reasoning.� Even when we talk about abstract, inherently �
George Lakoff, 1980. Metaphors we
live by. University of Chicago Press .
62
CH03-P370896.indd 62CH03-P370896.indd 62 1/24/2008 4:32:29 PM1/24/2008 4:32:29 PM

non-spatial ideas, phrases such as connected to , built on, contained within
are so common that we do not even think of them as metaphoric. According
to Lakoff , these kinds of spatial analogies are fundamental to human rea-
soning, which is ultimately grounded in human experience gained by inter-
acting with the environment.
Lakoff is interested in the use of spatial metaphors in natural language.
Here we are concerned with spatial metaphors and their use in graphic
design, where they are just as ubiquitous. Below is a list of the most basic
ones.
Small shapes defined by closed contour, texture, color, shaded solid.
Object, idea, entity, node.
Graphical Code Semantics
Spatially ordered graphical objects.
Related information or a sequence. In a sequence the left-to-rightordering convention borrowsfrom the western conventionfor written language.
Graphical objectsin proximity.
Graphical objectshaving the sameshape, color, or texture.
Similar concepts,related information.
Similar concepts,related information.
Size of graphical objectHeight of graphical object.
Magnitude, quantity,importance.
In this chapter, we have used the term pattern in its everyday sense to
refer to an abstract arrangement of features or shapes. Th ere is a more
general sense of the word used in cognitive neuroscience, according to
which every piece of stored information can be thought of as a pattern.
Th e sequence of processing from V1 through the inferotemporal cortex
can be thought of as a series of ever more complex pattern processors, with
the patterns at each level being made up of the simpler patterns processed
by the preceding levels. Th us complex patterns are patterns of patterns .
Th e generalized idea of a pattern applies to more than just shapes.
Temporal patterns can also be found in changing sequences of visual
shapes. Behavioral responses to visual patterns can be regarded as action
patterns. Finding patterns is the essence of how we make sense of the
world. In a fundamental sense, the brain can be thought of as a set of inter-
connected pattern-processing modules. Input patterns from the visual
Semantic Pattern Mappings 63
CH03-P370896.indd 63CH03-P370896.indd 63 1/24/2008 4:32:31 PM1/24/2008 4:32:31 PM

Graphical Code Semantics
Shapes connectedby contour.
Contained entities.Related entities.
Shapes enclosed by a contour, or a common texture, or a commoncolor.
Related entities,path between entities.
Nested regions,partitioned regions.
Hierarchical concepts.
Thickness of connectingcontour.
Strength of relationship.
Color and texture ofconnecting contour.
Type of relationship.
Attached shapes. Parts of a conceptualstructure.
world activate patterns of responding, such as sequences of eye movements.
Th e processing of visual thinking also involves the interplay between pat-
terns of activity in the non-visual verbal processing centers of the brain.
Although pattern fi nding is something that everyone can do because
it is a fundamental part of the process of seeing, designers must have an
additional skill. Th ey must see critically. Th is is very diff erent from sim-
ply seeing that a pattern is present and using that pattern for some cogni-
tive task like fi nding a route using a map. Th e map designer must critically
analyze which combinations of patterns will provide the best support for
the set of cognitive tasks a map supports. Th is critical seeing may seem
intuitive to the skilled designer, but this intuition is hard-won through
years of experience honing critical perception. Because pattern perception
is so central, we will return to this and many of the other issues raised in
this chapter.
64
CH03-P370896.indd 64CH03-P370896.indd 64 1/24/2008 4:32:32 PM1/24/2008 4:32:32 PM
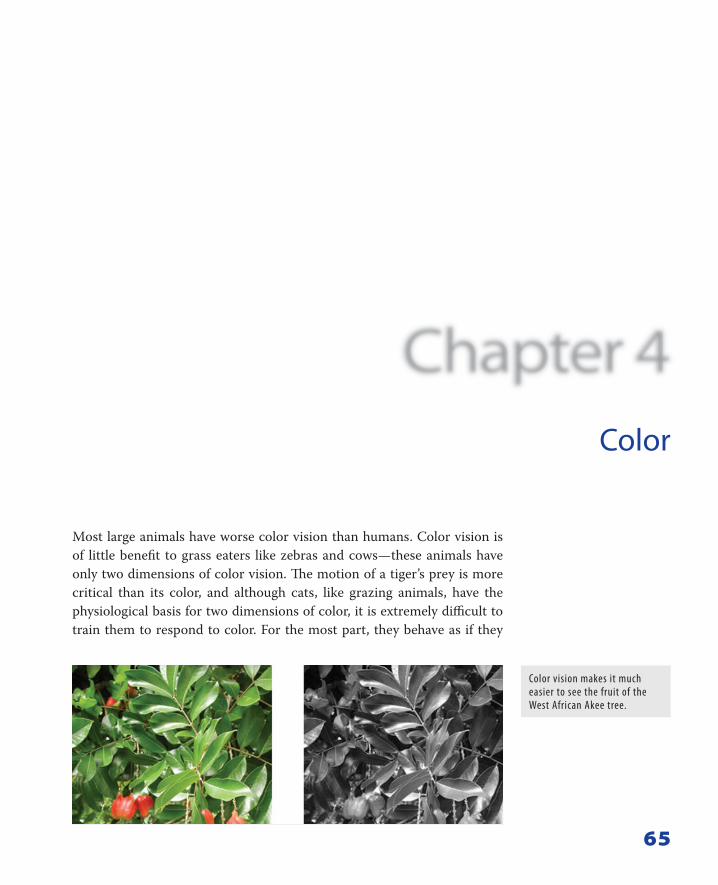
65
Color
Color vision makes it much easier to see the fruit of the West African Akee tree.
Most large animals have worse color vision than humans. Color vision is
of little benefi t to grass eaters like zebras and cows — these animals have
only two dimensions of color vision. Th e motion of a tiger ’ s prey is more
critical than its color, and although cats, like grazing animals, have the
physiological basis for two dimensions of color, it is extremely diffi cult to
train them to respond to color. For the most part, they behave as if they
CH04-P370896.indd 65CH04-P370896.indd 65 1/23/2008 6:53:08 PM1/23/2008 6:53:08 PM

66
live in a grey-scale world. On the other hand, color is invaluable to fruit
eaters; color lets them see the oranges in the tree or the red berries in
the bush. Birds have even better color vision than humans, being able to
distinguish four or more dimensions. Humans and the other great apes,
omnivorous hunter-gatherers that we are, have three dimensions of color.
Th e purpose of this chapter is to develop a theory-based approach
to how color should be used in design. Th is will be somewhat incom-
plete because color is a complex technical subject, although a surprisingly
small amount of theory is needed to derive the most important aesthetic
principles. Th e parts of color theory not covered include colorimetry
and color reproduction. Colorimetry is the discipline dealing with the
precise measurement and specifi cation of color. � Color reproduction
is the discipline dealing with how colors are printed on paper, as well as
methods for transforming colors from some display medium, such as a
computer monitor, to another, such as printed paper through color gamut
mapping. �
THE COLORPROCESSING MACHINERY Th ere are two basic types of light receptors in the retina at the back of the
eyeball: rods and cones. Rods, the most numerous type, are specialized for
very low light levels. Rods are wasted on modern humans because they
are overloaded at the light levels of our artifi cially lit world. Th ese days
most people rarely try to get around under starlight, and this is no longer
an important survival skill. Unfortunately, we have no way of trading our
rod receptors for cone receptors.
Cone receptors are the basis for normal daytime vision, and they come
in three subtypes—short-wavelength sensitive, middle-wavelength sensi-
tive, and long-wavelength sensitive. Th ese three diff erent types of cones
mean color vision is fundamentally three-dimensional. Th is is the reason
that televisions and monitors have three types of liquid crystal fi lters, or
three diff erent-colored light-emitting phosphors in older cathode-ray tube
monitors.
David Williams, at the University of Rochester, has recently succeeded
in obtaining images of the human retina and classifying the cones. Here
are examples from two diff erent people.
What is immediately apparent in these images of retinas is that there are
far fewer short-wavelength-sensitive cones (blue) than middle- or long-wave-
length-sensitive cones. Compounding this, the few short-wavelength-sensitive
cones are less sensitive to light than either the middle- or long-wavelength-
sensitive cones.
�
The classic text dealing with color
measurement as well as basic results
is G. Wyszecki and W. S. Styles, 1982.
Color Science: Concepts and Methods,
Quantitative Data and Formulae
(2nd ed.), John Wiley & Sons, Inc.,
New York. As of 2007 it is still in press.
Charles Poynton ’ s site http://www.
poynton.com/ColorFAQ.html is a
very useful source of technical color
information.
�
See Maureen Stone, 2003. A Field
Guide to Digital Color. A.K. Peters. The
effects of mixing paints and printing
inks are complex because of the ways
light interacts with pigments—mixing
colored lights is much simpler. Still, a
reasonably complete range of colors
can be produced with the colors cyan,
magenta, and yellow. The reason these
are different from the red, green,
and blue of monitors is that these
printing dyes subtract light reflected by
underlying white paper, as opposed to
emitting it.
CH04-P370896.indd 66CH04-P370896.indd 66 1/23/2008 6:53:11 PM1/23/2008 6:53:11 PM

L
M
S
400
Wavelength (nanometers)
0.2
0.4
0.6
0.8
1.0
Rela
tive
ab
sorb
ance
500 600 700
Sensitivity functions for the three classes of cone receptors. Cone receptors are sensitive to light having wavelengths between 400 and 700 nanometers (1 nm � 10–9 meters).
Note that the sensitivity distributions of long (L) and medium (M) wavelength-sensitive cones overlap considerably. The brain takes the difference between the two signals to get useful hue information.
It is impossible to reproduce pure spectral colors with printing inks so the color bands below should only be taken as rough approximations to the actual hues.
A consequence of our having few and weak blue-sensitive cones is that
it is a mistake to show text or anything else with detail using blue on a
dark background. Th e result is usually illegible.
Showing small blue text on a black background is a bad idea. There is insufficient luminance contrast.
Showing small blue text on a black background is a bad idea. There is insufficient luminance contrast.
A related problem occurs when using yellow for text. A pure yellow
hue excites both the numerous middle- and long-wavelength cones, mak-
ing yellow the lightest of all pure hues. Yellow can be almost as light as
Cones in the fovea where there are no rods. Those sensitive to short, medium, and long wavelengths are colored blue, green, and red, respectively (Images from David R. Williams, University of Rochester.)
The Color-processing Machinery 67
CH04-P370896.indd 67CH04-P370896.indd 67 1/23/2008 6:53:11 PM1/23/2008 6:53:11 PM

68
white, and small yellow text on a white background is extremely hard to
read, but pure yellow is very distinct on a black background.
Showing small yellow text on a white background is a bad idea. There is insufficient luminance contrast.
Showing small yellow text on a white background is a bad idea. There is insufficient luminance contrast.
Another interesting feature of the images of retinas on the previous
page is the way the red- and green-colored cones are clumped together.
We can see considerable detail in black and white images because for
black-white detail it is only necessary for black and white parts of the
image to fall on two or more diff erent cone receptors, no matter which
type. But the patchy nature of the diff erent cone types means that we are
far less able to see detail where the diff erences are purely chromatic.
OPPONENT PROCESS THEORY A major transformation in the color signal from the receptors occurs in
area V1, where information traveling along the optic nerve fi rst arrives
at the cortex. Neural networks add and subtract the cone signals in dif-
ferent ways, transforming them into what are called the color-opponent
channels . � Th ere are three channels, designated red-green , yellow-blue ,
and black-white (or luminance), respectively. Th e red-green channel
represents the diff erence between the signal from the middle- and long-
wavelength-sensitive cones.
Th is allows us to be highly sensitive to subtle red-green contrasts
despite the overlap in the cone-sensitivity functions. Th e luminance chan-
nel combines the outputs of long- and middle-wavelength-sensitive cones.
Th e yellow-blue channel represents the diff erence between the luminance
white
black
yellow
blue
green
red
long wavelengthsensitive cones
short wavelengthsensitive cones
medium wavelengthsensitive cones �
�
�
� Color-opponent theory can be traced
back to Ewald Hering who published his
ideas in Vienna in 1878.
In V1, the raw signals from the cones in the retina are transformed. Some neurons compute differences between red- and green-sensitive cone signals. Some neurons compute the sum of red- and green-sensitive cones. Still others compute yellow-blue differences.
The result is three kinds of color signals that are called color-opponent channels.
CH04-P370896.indd 68CH04-P370896.indd 68 1/23/2008 6:53:14 PM1/23/2008 6:53:14 PM
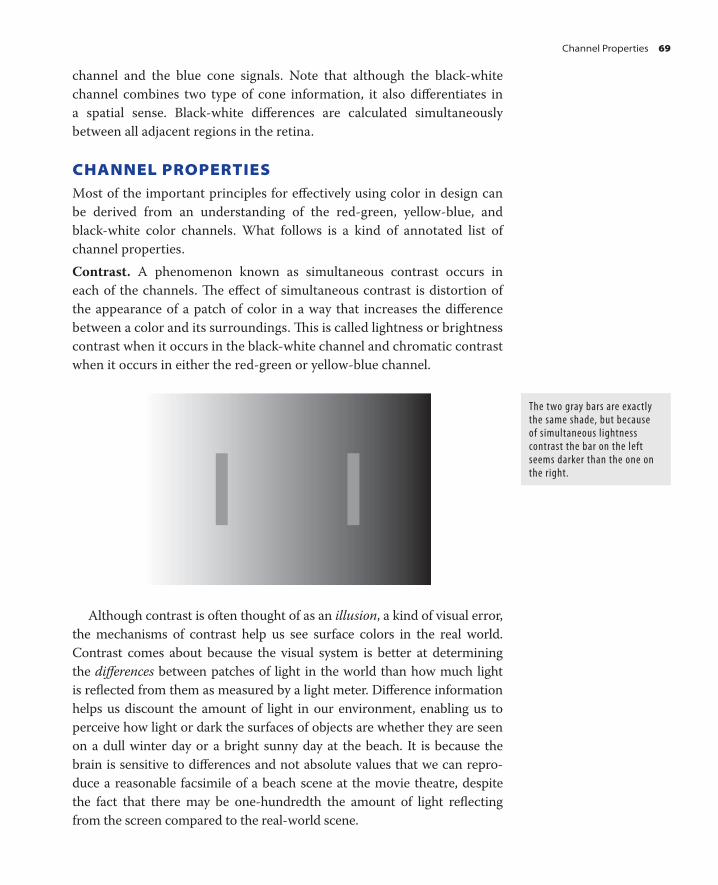
channel and the blue cone signals. Note that although the black-white
channel combines two type of cone information, it also diff erentiates in
a spatial sense. Black-white diff erences are calculated simultaneously
between all adjacent regions in the retina.
CHANNEL PROPERTIES Most of the important principles for eff ectively using color in design can
be derived from an understanding of the red-green, yellow-blue, and
black-white color channels. What follows is a kind of annotated list of
channel properties.
Contrast. A phenomenon known as simultaneous contrast occurs in
each of the channels. Th e eff ect of simultaneous contrast is distortion of
the appearance of a patch of color in a way that increases the diff erence
between a color and its surroundings. Th is is called lightness or brightness
contrast when it occurs in the black-white channel and chromatic contrast
when it occurs in either the red-green or yellow-blue channel.
Although contrast is often thought of as an illusion , a kind of visual error,
the mechanisms of contrast help us see surface colors in the real world.
Contrast comes about because the visual system is better at determining
the diff erences between patches of light in the world than how much light
is refl ected from them as measured by a light meter. Diff erence information
helps us discount the amount of light in our environment, enabling us to
perceive how light or dark the surfaces of objects are whether they are seen
on a dull winter day or a bright sunny day at the beach. It is because the
brain is sensitive to diff erences and not absolute values that we can repro-
duce a reasonable facsimile of a beach scene at the movie theatre, despite
the fact that there may be one-hundredth the amount of light refl ecting
from the screen compared to the real-world scene.
The two gray bars are exactly the same shade, but because of simultaneous lightness contrast the bar on the left seems darker than the one on the right.
Channel Properties 69
CH04-P370896.indd 69CH04-P370896.indd 69 1/23/2008 6:53:15 PM1/23/2008 6:53:15 PM

70
Chromatic contrast occurs in the red-green and yellow-blue channels.
Its eff ects are much more complex and harder to predict than grey-scale
contrast.
Unique hues. Th e opponent-process theory suggests that the colors black,
white, red, green, yellow, and blue are special. Each occurs when there is
a strong signal (either positive or negative) on one of the channels and a
neutral signal on the other two channels. Confi rming their importance, a
remarkable study of more than one hundred human languages by Brent
Berlin and Paul Kay carried out in the 1960s showed these basic color
terms are the most commonly used no matter what the language. �
Sensitivity to spatial detail. Th e luminance channel has much greater
capacity to convey detailed information than the chromatic channels. Th e
patterns show that we can still see large shapes represented chromatically,
but the fi ne pattern is much harder to see expressed through chromatic dif-
ferences than when expressed through black-white diff erences.
The two yellowish bars have the same hue, but because of simultaneous chromatic contrast the one on the left seems more yellow and the one on the right greener.
�
Brent Berlin and Paul Kay, 1969.
Basic Color Terms: Their Universality and
Evolution. University of California Press,
Berkeley.
CH04-P370896.indd 70CH04-P370896.indd 70 1/23/2008 6:53:16 PM1/23/2008 6:53:16 PM
Motion. Th e luminance channel can convey motion information much
more eff ectively than the chromatic cannels. When moving shapes are
shown in red and green only, their motion appears to slow down.
Stereoscopic depth. Th is is the kind of depth information we get from
having two eyes. Th e brain ’ s processing of stereoscopic depth information
is done via the luminance channel.
Shape-from-shading. We understand the shape of three-dimensional
surfaces from the pattern of shading that comes from the way diff erent
facets of a surface are oriented to the light. Th e luminance channel can
process shape-from-shading, whereas the chromatic channels cannot. In
the illustration below, a black and white photograph of a shaded surface
has been doctored so that the black-white sequence has been transformed
into a red-green sequence. In this way, the original image that stimulated
only the luminance channel has been modifi ed so that it only stimulates
the red-green channel. Although sharp boundaries are still clear, the
topography of the shape has become virtually meaningless.
This image has had all of its grey-scale values transformed into red-green values. Because shape-from-shading processing is based on luminance channel information it is difficult to interpret.
, This is a NASA image of sand dunes on Mars taken by the Viking Lander. Note how readily we see the different grey values as making up a 3D undulating surface.
Saturation. Th e more vivid a color, the more saturated it is said to be.
More saturated colors are those that have strong signals on one or both of
the chromatic channels.
Low saturation High saturation Low saturation High saturation
Channel Properties 71
CH04-P370896.indd 71CH04-P370896.indd 71 1/23/2008 6:53:17 PM1/23/2008 6:53:17 PM
72
Maximum saturation varies with luminance. When colors are dark
there is a smaller diff erence signal on the chromatic channels, and satura-
tions are lower for dark colors. When colors are light there is also usually
a reduction in saturation for reasons having to do with color reproduction
technology rather than perception. Colors on a computer monitor are
limited by the maximum amount of light coming from the red, green, and
blue pixels. Th e lightest (or brightest) color is necessarily white because
this occurs when all the pixels are fully on. Th e next lightest colors are low-
saturation pastel hues. A similar eff ect occurs for printing inks.
Low saturation High saturation Low saturation High saturation
Low Lightness High Lightness
Luminance, lightness, brightness. Luminance refers to the physical
amount of light as it might be measured by an instrument such as a pho-
tometer. Th e term lightness is used when discussing surface colors, and
brightness is generally used when discussing emitted light. Both terms,
however, apply to the amount of light coming from a particular part of the
visual fi eld and therefore to signals that aff ect the luminance channel.
Luminance nonlinearity. Th e luminance channel is nonlinear. We are more
sensitive to dark gray diff erences than to light diff erences, although this eff ect
also depends on the background. On top of this, the background is impor-
tant. With a dark gray background, our sensitivity is increased to gray diff er-
ences in the midrange. With a light background, our sensitivity is increased to
diff erences near white. Th is eff ect is sometimes called sharpening.
Color segmentation. Th e visual system has a strong tendency to segment
smoothly changing colors into regions consisting of the unique hues.
The top and bottom inner patterns are the same. Only the background is different.
CH04-P370896.indd 72CH04-P370896.indd 72 1/23/2008 6:53:19 PM1/23/2008 6:53:19 PM
Notice how the eye tends to divide the smoothly varying colors in the square on the left into regions of red, green, yellow and blue. To a lesser extent, purple and orange can be seen. It is almost impossible to see the neutral gray in the center. In the segmented version (on the right), more colors are clearly evident even though there are actually fewer present.
Color blindness. People who are color blind (about 8 percent of males)
are missing the red-green channel, and therefore have a two-dimensional
rather than a three-dimensional color space. Th ey can still distinguish col-
ors that diff er in the yellow-blue direction, and their ability to see gray-scale
is unaff ected. Yellow-blue color blindness is much less common.
Color-blind individuals will have difficulty distinguishing the patch of green colors from the surrounding red colors.
They will have no difficulty distinguishing a patch of yellow colors from the surrounding blue colors.
Chromatic color as a property of surfaces. A major function of visual
processing is to let us perceive the properties of surfaces in the envi-
ronment, rather than the amount of light coming from those surfaces.
Many of the mechanisms of color vision exist to support this function.
Adaptation in the receptors means that we are relatively insensitive to
overall changes in light levels. Contrast mechanisms make us more sensi-
tive to local changes in surface colors, rather than diff erences in light and
shade across a scene.
Color and attention. As discussed in Chapter 2, the pattern-fi nding mech-
anisms of the brain can be tuned for color. Th is allows for rapid visual
searches for things that are of particular colors. But color search also
Channel Properties 73
CH04-P370896.indd 73CH04-P370896.indd 73 1/23/2008 6:53:19 PM1/23/2008 6:53:19 PM

74
depends how many other colors there are in the environment. If all the
world is gray, a patch of vivid color pops out. If the world is a riot of color
then a visual search for a particular hue becomes diffi cult.
Color solids. Th e three-dimensional nature of color space is a straight-
forward consequence of having three cone types in the retina. But if we
wish to view this three-dimensional space, how exactly should the colors
be laid out? Here are just two of the many possible solutions.
Color appearance. It only takes a combination of three lights (red, green,
and blue) to create a full range of colors (for example, a photographic
image reproduced on a computer monitor), and this is why color vision
is said to be three-dimensional. Nevertheless, color appearance has more
than three dimensions. Th e reason is spatial. A patch of color is never seen
in isolation, and its appearance is aff ected by the colors that surround it,
its orientation with respect to the light source, whether is it perceived as
lying in or out of shadow, the texture of the surface on which it lies, and
so on. Colors like brown and olive green only occur through contrast with
surrounding colors. A color patch that seems brown when viewed on a
white background will be perceived as orange when viewed in isolation in
a dark room.
This is the outside of the cube of colors that can be represented on a computer monitor by combinations of the outputs of the red, green, and blue guns. The space is not perceptually uniform.
This is a set of calibrated color samples. Each is designed to be equally different from the adjacent sample, making it an example of a uniform color space . (From Science Museum/Science and Society Picture Library, London.)
CH04-P370896.indd 74CH04-P370896.indd 74 1/23/2008 6:53:25 PM1/23/2008 6:53:25 PM
This remarkable demonstration by R. Beau Lotto of University College, London, shows how dramatically our perception of light and shade can affect our perception of color. The (apparently) brown square at the top center has exactly the same color as the (apparently) yellow square in the center of the front face. If you don ’ t believe it, cut a small hole in a piece of white paper and use it to examine each patch of color with the surroundings blocked out. (Image created by R. Beau Lotto, www.lottolab.org.)
PRINCIPLES FOR DESIGN Th e remainder of this chapter is devoted to applying color theory in elab-
orating a set of principles for the use of color in design. Th e approach is
utilitarian, emphasizing clarity and support for visual tasks, but should
not prevent designers from creating graphics that are visually delight-
ful. Th ere is a huge scope for creativity within the functional framework
developed here.
SHOWING DETAIL
Th e most important single principle in the use of color is that whenever
detailed information is to be shown, luminance contrast is necessary. Of
course, black and white give the most extreme contrast possible. However,
it is also possible to get excellent luminance contrast with yellow on black
or dark blue on white. As graphical features get larger, so the need for
extreme luminance contrast declines.
Principles for Design 75
CH04-P370896.indd 75CH04-P370896.indd 75 1/23/2008 6:53:31 PM1/23/2008 6:53:31 PM
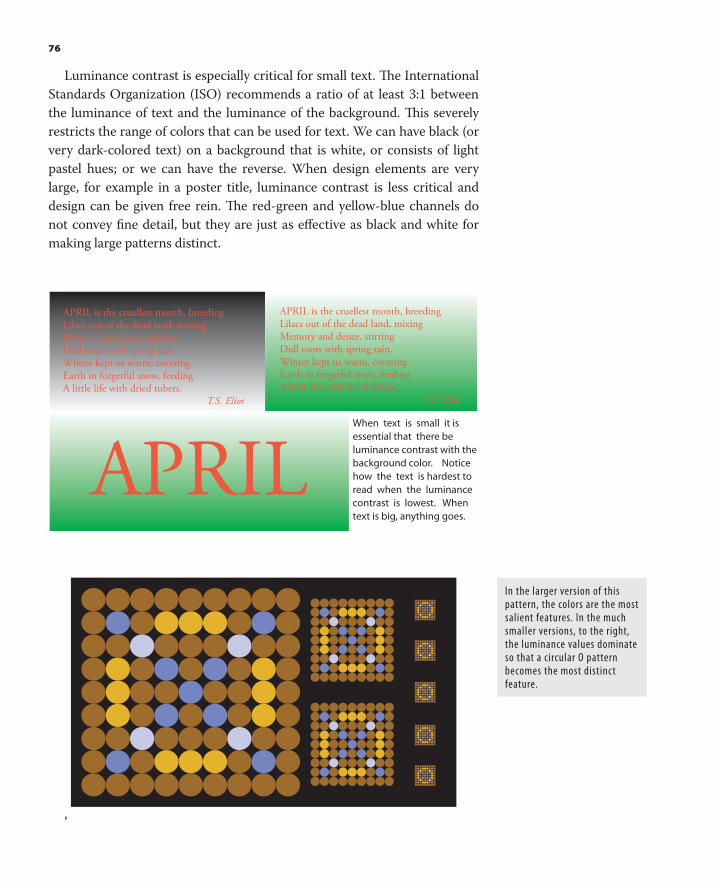
76
Luminance contrast is especially critical for small text. Th e International
Standards Organization (ISO) recommends a ratio of at least 3:1 between
the luminance of text and the luminance of the background. Th is severely
restricts the range of colors that can be used for text. We can have black (or
very dark-colored text) on a background that is white, or consists of light
pastel hues; or we can have the reverse. When design elements are very
large, for example in a poster title, luminance contrast is less critical and
design can be given free rein. Th e red-green and yellow-blue channels do
not convey fi ne detail, but they are just as eff ective as black and white for
making large patterns distinct.
APRIL is the cruellest month, breeding Lilacs out of the dead land, mixing Memory and desire, stirring Dull roots with spring rain. Winter kept us warm, covering Earth in forgetful snow, feeding A little life with dried tubers. T.S. Eliot
APRILWhen text is small it is
essential that there be
luminance contrast with the
background color. Notice
how the text is hardest to
read when the luminance
contrast is lowest. When
text is big, anything goes.
APRIL is the cruellest month, breeding Lilacs out of the dead land, mixing Memory and desire, stirring Dull roots with spring rain. Winter kept us warm, covering Earth in forgetful snow, feeding A little life with dried tubers. T.S. Eliot
,
In the larger version of this pattern, the colors are the most salient features. In the much smaller versions, to the right, the luminance values dominate so that a circular O pattern becomes the most distinct feature.
CH04-P370896.indd 76CH04-P370896.indd 76 1/23/2008 6:53:39 PM1/23/2008 6:53:39 PM

COLORCODING INFORMATION Perhaps the most important use of color is to indicate categories of informa-
tion. In this land-use map, color codes are used to show diff erent land-use
zones.
In the design of color codes, the two primary considerations must be
visual distinctness , to support visual search operations, and learnability ,
so that particular colors come to “ stand for ” particular entities. When
learnability is the issue, it is important to use the unique hues fi rst—red,
green, yellow, and blue—followed by other colors that have relatively con-
sistent names: pink, brown, orange, grey, and purple. �
Th ere are strict limits as to how many colors can be used eff ectively as
codes. If a design is complex and the symbols are quite small, then no
more than a dozen codes can be used with complete reliability. � Th e main
reason why we cannot use more colors is that the backgrounds can distort
the appearance of a small patch of symbol color leading to the confusion
of one symbol with another.
To eff ectively support visual search the colors of the background and
the other symbols in the set are as important as the symbol being searched.
When we conduct a visual search for an object having a particular color
our brains tune our visual systems so that neurons sensitive to that hue get
to “ shout louder ” than neurons tuned to other colors. Th ere are, however,
limits to this capability. A strong pop-out eff ect depends both on the other
colored objects in the scene and on the background color.
LARGE AND SMALL AREAS
More complex designs often include color-coded background regions
as well as color-coded symbols. Because of diff erent channel properties,
�
Although there may be quite large
individual differences in how people
perceive colors, when it comes to
labeling them with words we appear
to have a shared system.
B. Salim, K.A. Jameson, N. Alvarado,
and M.K. Szeszel, 2005. Semantic and
perceptual representations of color:
Evidence for a shared color naming
function. The Journal of Cognition and
Culture. 5 (3–4): 427–486.
�
There have been many studies
designed to answer the question “ How
many colors can be used reliably in
a symbol set? ” yielding a range of
answers, depending on exactly how
they were conducted. But the number
of colors recommended is always
between 6 and 12.
Color-coding Information 77
CH04-P370896.indd 77CH04-P370896.indd 77 1/23/2008 6:53:41 PM1/23/2008 6:53:41 PM
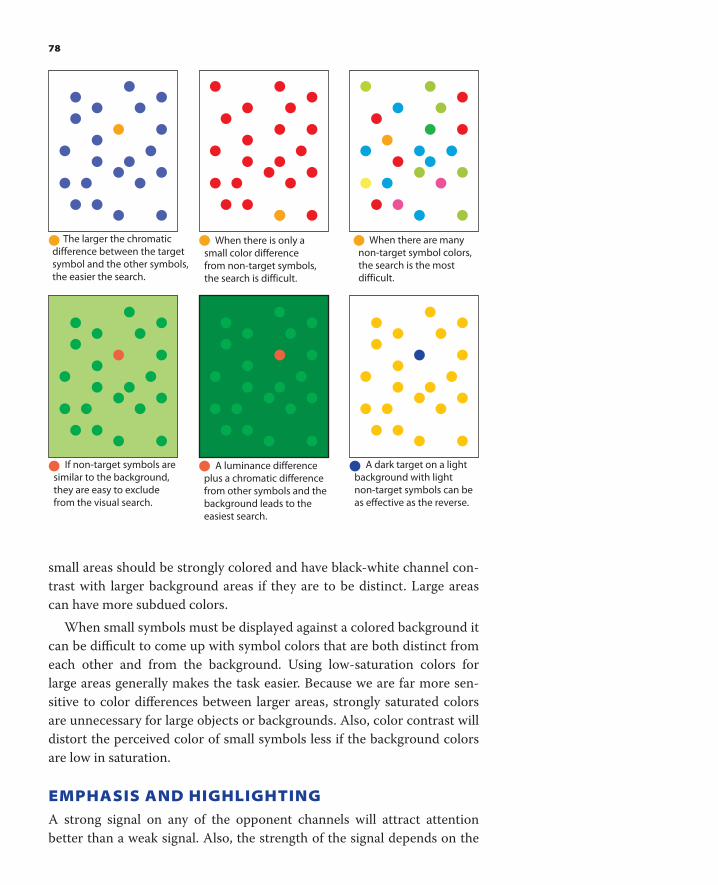
78
The larger the chromaticdifference between the targetsymbol and the other symbols, the easier the search.
A luminance difference plus a chromatic differencefrom other symbols and the background leads to the easiest search.
When there is only asmall color differencefrom non-target symbols,the search is difficult.
If non-target symbols aresimilar to the background, they are easy to exclude from the visual search.
When there are many non-target symbol colors,the search is the most difficult.
A dark target on a light background with light non-target symbols can be as effective as the reverse.
small areas should be strongly colored and have black-white channel con-
trast with larger background areas if they are to be distinct. Large areas
can have more subdued colors.
When small symbols must be displayed against a colored background it
can be diffi cult to come up with symbol colors that are both distinct from
each other and from the background. Using low-saturation colors for
large areas generally makes the task easier. Because we are far more sen-
sitive to color diff erences between larger areas, strongly saturated colors
are unnecessary for large objects or backgrounds. Also, color contrast will
distort the perceived color of small symbols less if the background colors
are low in saturation.
EMPHASIS AND HIGHLIGHTING A strong signal on any of the opponent channels will attract attention
better than a weak signal. Also, the strength of the signal depends on the
CH04-P370896.indd 78CH04-P370896.indd 78 1/23/2008 6:53:44 PM1/23/2008 6:53:44 PM
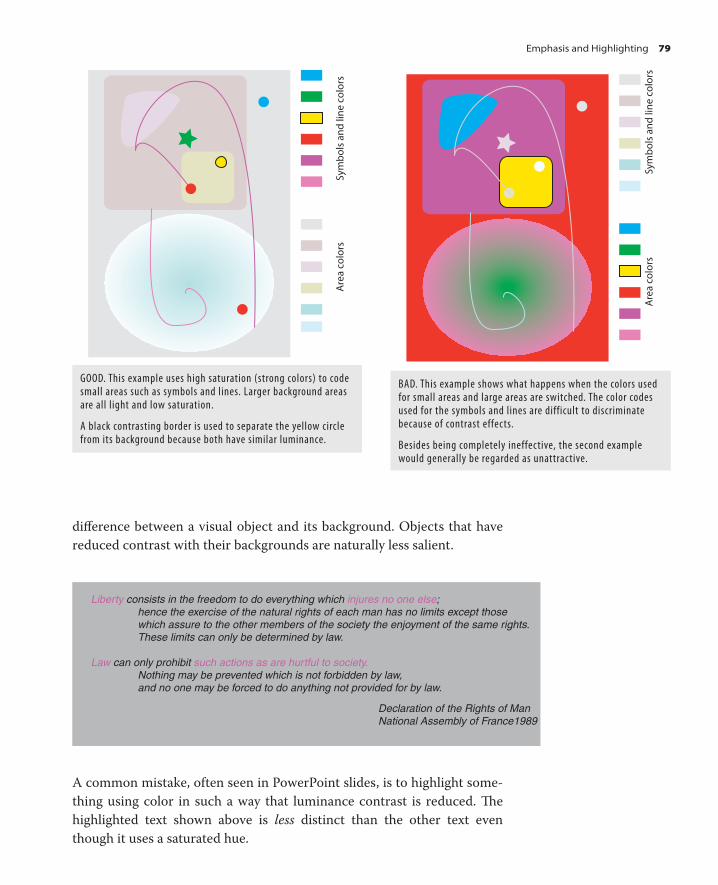
Sym
bo
ls a
nd
lin
e c
olo
rsA
rea
co
lors
Sym
bo
ls a
nd
lin
e c
olo
rsA
rea
co
lors
GOOD. This example uses high saturation (strong colors) to code small areas such as symbols and lines. Larger background areas are all light and low saturation.
A black contrasting border is used to separate the yellow circle from its background because both have similar luminance.
BAD. This example shows what happens when the colors used for small areas and large areas are switched. The color codes used for the symbols and lines are difficult to discriminate because of contrast effects.
Besides being completely ineffective, the second example would generally be regarded as unattractive.
diff erence between a visual object and its background. Objects that have
reduced contrast with their backgrounds are naturally less salient.
Liberty consists in the freedom to do everything which injures no one else; hence the exercise of the natural rights of each man has no limits except those which assure to the other members of the society the enjoyment of the same rights. These limits can only be determined by law.
Law can only prohibit such actions as are hurtful to society. Nothing may be prevented which is not forbidden by law, and no one may be forced to do anything not provided for by law.
Declaration of the Rights of ManNational Assembly of France1989
A common mistake, often seen in PowerPoint slides, is to highlight some-
thing using color in such a way that luminance contrast is reduced. Th e
highlighted text shown above is less distinct than the other text even
though it uses a saturated hue.
Emphasis and Highlighting 79
CH04-P370896.indd 79CH04-P370896.indd 79 1/23/2008 6:53:44 PM1/23/2008 6:53:44 PM

80
Liberty consists in the freedom to do everything whichiinjures no one else; hence the exercise of the natural rights of each man has no limits except those which assure to the other members of the society the enjoyment of the same rights. These limits can only be determined by law.
Law can only prohibit such actions as are hurtful to society. Nothing may be prevented which is not forbidden by law, and no one may be forced to do anything not provided for by law.
Declaration of the Rights of ManNational Assembly of France1989
It is often more eff ective to emphasize text by reducing the contrast of the
other text. Care must be taken to maintain suffi cient luminance contrast
for clarity.
COLOR SEQUENCES A particular specialized use of color is the color-coding of maps. A map
need not be geographical; we might have a map of the stock market, a map
of radiation levels in the cosmos, or generally speaking, of any quantity
that varies over a plane. Some maps have well-established color sequences
already defi ned by convention. Usually in these cases it is unnecessary and
unwise to promote an alternative. An example is the convention used by
geographers to show the height of land with a color sequence that starts
with green for the land transitions through light and dark brown in the
mountains and often ends with white at the peaks.
This illustration of a lumbar spinal fusion technique, by medical illustrator Christy Krames, has highlighted the critical area of interest by de-emphasizing the background through the use of neutral tones with some low-saturation blues. The critical area of interest is rendered in higher contrast and with the color red appearing only in this area. (Image courtesy of Christy Krames.)
CH04-P370896.indd 80CH04-P370896.indd 80 1/23/2008 6:53:45 PM1/23/2008 6:53:45 PM

Color is most effective as a highlighter when there is only a single color used, other than black and white. (Image courtesy of National Park Service.)
Th ere are two primary tasks supported by color sequences used with
maps. First, it allows people to perceive the spatial layout of patterns in
the data , such as the shape and location of the hills, ridges, and valleys.
Second, we can read quantitative values from the map; for example, judg-
ing the height or energy level at a particular location.
Because shape perception is based mainly on luminance channel infor-
mation, color sequences that vary mainly in luminance will be the most
eff ective in revealing patterns in the data. For example, contrast eff ects in
gray-scale sequence can lead to very large errors when it comes to reading
off data values using a key. � Diff erent colors in the sequence along with a
color key makes for more accurate readings. Th e best solution may be to
provide a sequence that spirals up through color space, starting off with a
dark color and selecting a series of colors, each of which has higher lumi-
nance than the previous one.
Zero is often an important number in data analysis, and sometimes
a color sequence is needed that represents zero in an intuitive way. A
good way of showing zero is to use a neutral value on the red-green and
yellow-blue channels. Increasingly saturated values can be used to repre-
sent values above and below zero.
�
In a study published in 1988 I
measured errors as large as 20% of the
data range for grey-sequence codings.
I proposed the use of color sequences
that spiral up through color space,
always increasing in lightness.
Ware, C. 1988. Color sequences for
univariate maps: Theory, experiments
and principles. IEEE Computer Graphics
and Applications. Sept. 41–49.
Color Sequences 81
CH04-P370896.indd 81CH04-P370896.indd 81 1/23/2008 6:53:46 PM1/23/2008 6:53:46 PM
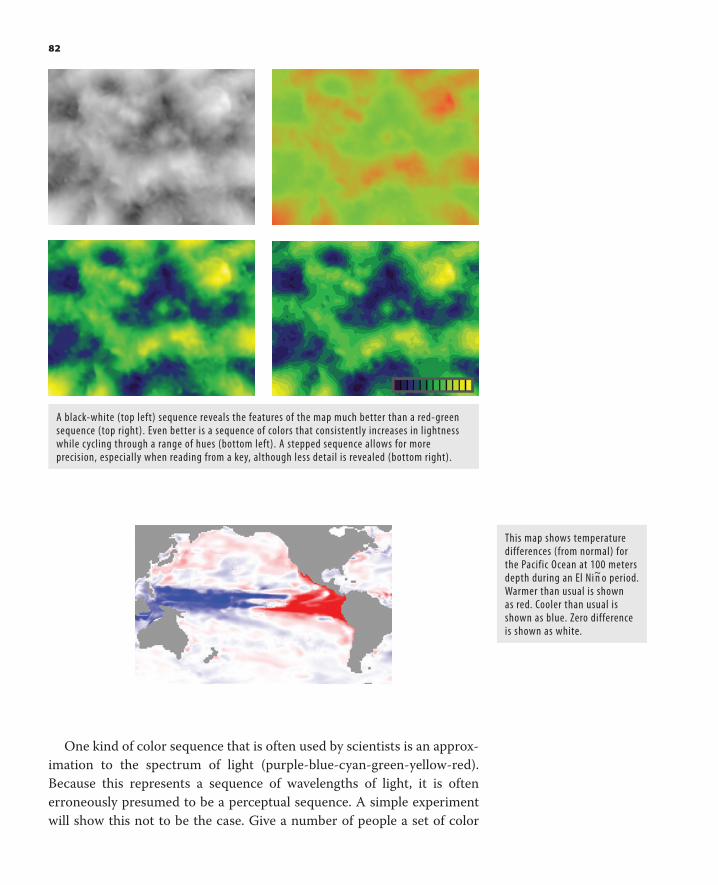
82
One kind of color sequence that is often used by scientists is an approx-
imation to the spectrum of light (purple-blue-cyan-green-yellow-red).
Because this represents a sequence of wavelengths of light, it is often
erroneously presumed to be a perceptual sequence. A simple experiment
will show this not to be the case. Give a number of people a set of color
A black-white (top left) sequence reveals the features of the map much better than a red-green sequence (top right). Even better is a sequence of colors that consistently increases in lightness while cycling through a range of hues (bottom left). A stepped sequence allows for more precision, especially when reading from a key, although less detail is revealed (bottom right).
This map shows temperature differences (from normal) for the Pacific Ocean at 100 meters depth during an El Ni n~o period. Warmer than usual is shown as red. Cooler than usual is shown as blue. Zero difference is shown as white.
CH04-P370896.indd 82CH04-P370896.indd 82 1/23/2008 6:53:49 PM1/23/2008 6:53:49 PM
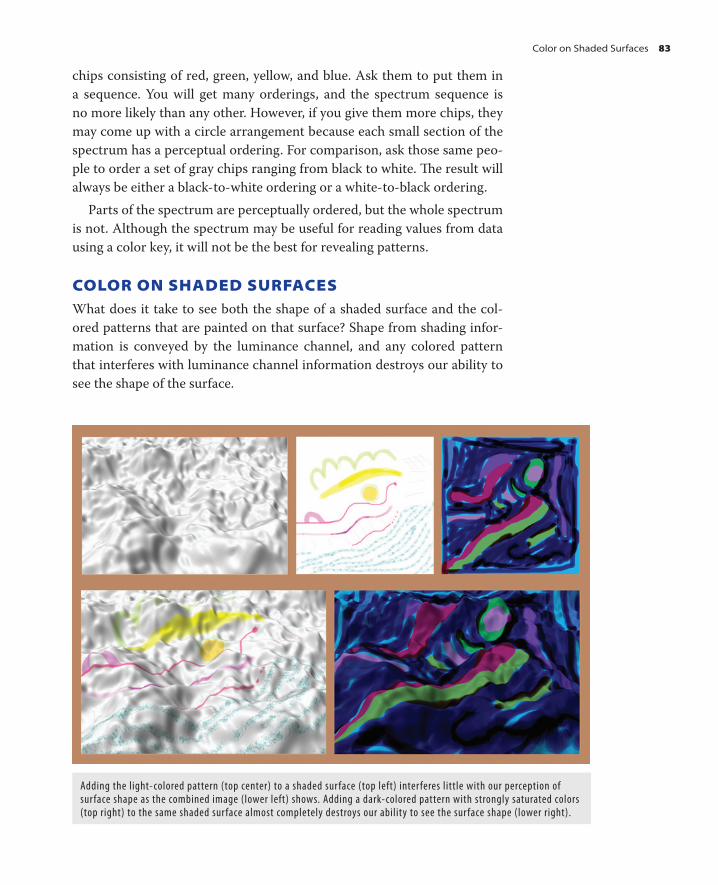
chips consisting of red, green, yellow, and blue. Ask them to put them in
a sequence. You will get many orderings, and the spectrum sequence is
no more likely than any other. However, if you give them more chips, they
may come up with a circle arrangement because each small section of the
spectrum has a perceptual ordering. For comparison, ask those same peo-
ple to order a set of gray chips ranging from black to white. Th e result will
always be either a black-to-white ordering or a white-to-black ordering.
Parts of the spectrum are perceptually ordered, but the whole spectrum
is not. Although the spectrum may be useful for reading values from data
using a color key, it will not be the best for revealing patterns.
COLOR ON SHADED SURFACES What does it take to see both the shape of a shaded surface and the col-
ored patterns that are painted on that surface? Shape from shading infor-
mation is conveyed by the luminance channel, and any colored pattern
that interferes with luminance channel information destroys our ability to
see the shape of the surface.
Adding the light-colored pattern (top center) to a shaded surface (top left) interferes little with our perception of surface shape as the combined image (lower left) shows. Adding a dark-colored pattern with strongly saturated colors (top right) to the same shaded surface almost completely destroys our ability to see the surface shape (lower right).
Color on Shaded Surfaces 83
CH04-P370896.indd 83CH04-P370896.indd 83 1/23/2008 6:54:14 PM1/23/2008 6:54:14 PM

84
SEMANTICS OF COLOR Colors are often used symbolically. In western culture, red represents dan-
ger, heat, and stop; green represents go, safety, and renewal; blue repre-
sents cold; white represents purity, and so on. Some of these meanings are
well entrenched. Changing stop signs to the color green would have disas-
trous consequences. Such color meanings are culturally determined, and
so a particular choice of colors may have diff erent a meaning in another
country. For example, in China red is used to symbolize good fortune and
renewal. In most of Asia, white is the color for mourning, whereas in the
west it is black. Designers for international markets must take such color
symbolisms into account.
Other semantic mappings relating to quantity may be more universal.
Quantities that are larger should generally be mapped to colors that are
more distinct. Th is visually means that more saturated colors should be
used to represent greater quantity. Similarly, darker colors on a light back-
ground or lighter colors on a dark background can be used to indicate
greater quantity.
Six different ways of showing greater quantity. All involve increasing the relative difference from the background color.
For all but the simplest designs, the choice of a set of colors is a com-
plex problem that typically involves tradeoff s. Every piece of information
cannot be maximally distinct. Considerations such as the consistency of
design across multiple graphics used in a document or a web site may also
restrict design options. As a rule of thumb, the most common and most
important visual queries should be given the most weight. Th is means
that the most distinctive hues should be reserved for the most commonly
accessed symbols and patterns in a design.
CONCLUSION Based on color-opponent theory, the functional aesthetics of color can
be reduced to a remarkably small number of guidelines. Th e image on
the retina is transformed at every point into red-green, yellow-blue, and
black-white diff erence signals. Every region of an image is evaluated
CH04-P370896.indd 84CH04-P370896.indd 84 1/23/2008 6:54:18 PM1/23/2008 6:54:18 PM

with respect to its adjoining regions in terms of how much it diff ers in
each of the channels. One consequence of this is that colors are changed
in appearance by adjacent colors. Th is is called simultaneous lightness
or chromatic contrast. As a result, we can reliably use only a handful of
very diff erent colors symbolically to label information. If we try to use
more, contrast eff ects mean that colors will be confused. Also, contrast
eff ects mean that the appearance of a specifi c hue can only be judged in
the context of a particular set of surrounding colors. Not only that, but
color appearance depends on the amount of area covered by each patch of
color; large areas change the color appearance of small areas, much more
than small areas change the appearance of large areas. Because of this it
is generally better if large areas have subdued colors. Also, to make small
areas distinct they should be strongly colored to counter the lack of spatial
resolution in the red-green and yellow-blue channels.
Another consequence of opponent-channel theory is that red, green,
yellow, blue, black, and white are special. Th ey each produce the most
extreme signal on one channel while being neutral with respect to the
other channels. Th ese are the most distinct and easily identifi ed colors
and form the ideal labels, all other considerations being equal.
Only the black-white channel is capable of conveying much detail and
so dark-light contrast is essential if detail is to be shown. Th is is true for
text, fi ne lines, and fi ne textures. Th e black-white channel is also essential
to show the shape of curved surfaces through shading, and this means that
smooth graduations of darkness and lightness will be perceived largely as
shading diff erences.
Unlike gray-scale gradients, smooth graduations of color tend to be
perceptually categorized into regions of red, yellow, green, and blue. If it is
necessary to present a hue so that it can be properly judged it is useful to
isolate it with a neutral black, white, or gray border. Even better is to see it
in context. Computer graphics allows this; the color of a graphical object
can be adjusted in situ in a developing design.
We have just listed the main properties needed to make design deci-
sions leading to visual clarity. Not surprisingly, there is a lot more to the
use of color than this. Color design is subtle and can be a source of beauty
and pleasure or disgust and irritation. Mostly this is a matter of socially
constructed taste—there are no absolute standards. Our goal in this book
is to fi nd the bedrock of functional aesthetics in the wiring of the brain,
and sadly, we have little to say about beauty.
Conclusion 85
CH04-P370896.indd 85CH04-P370896.indd 85 1/23/2008 6:54:18 PM1/23/2008 6:54:18 PM

87
Getting the Information: Visual Space and Time
“ It is one thing to say with the psalmist ‘ I lift mine eyes up to the
hills ’ —it is another thing to drag one ’ s carcass up there. ”
GK Chesterton paraphrased by John Prange.
Moving our eyes is the lowest-cost method we have for getting additional
information about our environment. It has such a low cognitive cost that
we are not even aware that we are making eye movements several times a
second. In visual data searches “ drag[ing] one ’ s carcass up there ” is what we
do when we search through a jumbled fi ling cabinet to fi nd information,
often entirely losing our train of thought in the process. It is also what we
do when we travel a thousand miles to an information-sharing meeting.
Often when we engage in business travel, our goal is to meet people
and discuss a project or gain access to concentrated information, for
CH05-P370896.indd 87CH05-P370896.indd 87 1/24/2008 4:33:20 PM1/24/2008 4:33:20 PM

88
example, at a conference. Th ese are essentially cognitive activities, and so
the cost of travel can be thought of as a cognitive cost. From a business
perspective, even the social alliances that are formed are communication
channels for the fl ow of valuable information and ideas. Although sound
can be transmitted cheaply, sincerity, or the lack of it, is conveyed by sub-
tle facial expressions, which is why face-to-face meetings are often worth
the cost of travel.
Eye movements, rummaging through fi ling cabinets, and business
travel are ultimately all methods for traversing space to get information
into our working memory systems, though they diff er enormously in
effi ciency. It is in this light that we consider the structure of three-
dimensional space.
With technology we can radically change the costs of access, storage,
and transmission for both visual and auditory information. For example,
This map of the region around Cambridge, England, shows the times to reach various regions by means of public transportation.
Some outlying villages can be reached as quickly as places on the outskirts of the city. Others are inaccessible. If the reason for travel were to obtain information, these times should be regarded as cognitive costs.
The colors give the travel times in hours.
1.0h
2.0h
3.0h
4.0h
5.0h
CH05-P370896.indd 88CH05-P370896.indd 88 1/24/2008 4:33:21 PM1/24/2008 4:33:21 PM

high-quality video conferencing systems can provide all of the visual
and sound cues for the social dynamics of meetings to be preserved. Th e
result can be substantial cost savings from reduced air travel, and meeting
expenses, as well as greater overall productivity since more time can be
spent in environments conducive to cognitive work.
Th is chapter is about the perceptual and cognitive structure of space
taking into account both how depth is perceived and the costs of naviga-
tion to access information. Next we will look at the ways in which depth is
perceived.
DEPTH PERCEPTION AND CUE THEORY It seems incontestable to say that we live in a three-dimensional world. But
“ live in ” is a weasel phrase. Th e physical world is indeed three-dimensional,
for most practical purposes. Although some theoretical physicists believe
that all matter is constructed of strings in twelve-dimensional space, this
only matters at a subatomic scale. Th e cognitive organism, however, acts
on visual information that is imaged on the retina. Th e leads to perceived
space having dimensions that are very diff erent from the spaces math-
ematicians and physicists consider because each dimension has diff erent
aff ordances. Th e perceptual egocentric space is commonly thought of in
terms of the up dimension, the sideways dimension, and the towards-away
dimension.
In Chapter 3, we considered visual pattern processing that occurs on
information captured by the up and sideways dimensions. Now we turn our
attention to the information available to the eye and brain from the towards-
away dimension. Th is information is contained in what psychologists
High-quality video conferencing systems can transmit many of the social cues that make face-to-face meetings important.
Conversely, low-quality video conferencing systems fail to convey the subtle cues of expression and gesture important for judging intentions. (Image from Polycom.)
Depth Perception and Cue Theory 89
CH05-P370896.indd 89CH05-P370896.indd 89 1/24/2008 4:33:40 PM1/24/2008 4:33:40 PM

90
call depth cues . Most depth cues consist of environmental information that
we use to judge distances from our particular viewpoint. Th ere is much
less information available in the towards-away directions than up and
sideways directions, since the latter is directly available from the image on
the retina. Th is is why perception is sometimes called a 2.5-dimensional
phenomenon with the 0.5 referring to the towards-away information. Th e
0.5 should not be taken literally; towards-away information is much less
than a half of what is provided by the other dimensions because we cannot
see through most objects and so for every one of the million brain pixels
recording up and sideways information there is only, at best, one point of
depth information.
Pictorial depth cues are defined by thepattern of light that converges on a viewpoint
away
up
lateraldown
towards
Depth cues can be divided into those that are pictorial and those that
are non-pictorial . Pictorial depth cues can be reproduced in a photograph
or a realistic painting. First and most powerful among these is occlusion;
objects that visually block other objects appear closer. Th ere is a whole
set of pictorial depth cues that derives from the geometry of perspective
including size gradients, texture gradients, and linear perspective. Other
pictorial depth cues are cast shadows, height on the picture plane, shape
from shading, depth of focus, size relative to known objects, and atmo-
spheric contrast reduction. Th e non-pictorial depth cues are stereopsis
(arising from our having two eyes), structure from motion (which we get
as we move through the world), as well as lesser eff ects like focusing of the
lens in the eye, and the convergence of the two eyes that occurs when we
fi xate near objects.
Some of the depth cues are called pictorial, because they can be used in static pictures.
One way of thinking about pictorial cues is in terms of a pane of glass which we look through with one eye holding steady at a particular viewpoint. If we were to put dabs of paint on the glass pane, corresponding to the colors in the world behind it, we would capture all of the pictorial depth cues because pictorial cues are defined by the projection of points in space onto a plane.
CH05-P370896.indd 90CH05-P370896.indd 90 1/24/2008 4:33:41 PM1/24/2008 4:33:41 PM

Linear perspective: Parallel lines, such as those defining the facades of buildings converge to "vanishing points".
Texture gradients: The textures elements on textured surfaces become finer with distance
Occlusion: nearer objects overlap further objects.
Object size gradient:These two bins are the same physical sizeThe more distant one is smaller in the photograph
Pictorial depth cues do not have to be applied as a complete package in
an all-or-nothing fashion; they can be applied independently according to
the goals of the design. Th is means that the choice of the designer is not
three-dimensional versus two-dimensional, but which of the depth cues to
apply. Each of them has unique properties that can support diff erent kinds
of visual queries.
Depth Perception and Cue Theory 91
Occlusion: Objects near to us block or visually occlude objects far-
ther away. An object that occludes another appears closer. Occlusion
is the strongest depth cue, and if it is placed in competition with
another, such as size constancy, occlusion wins.
Occlusion provides both a method and a metaphor for rank-
ordering information with the most important partially occluding
the less important. When designing with occlusion it is critical that
the partially occluded objects can still be identifi ed. Interactive com-
puter applications allow for occluded information to be brought to
the front with a mouse click.
CH05-P370896.indd 91CH05-P370896.indd 91 1/24/2008 4:33:41 PM1/24/2008 4:33:41 PM
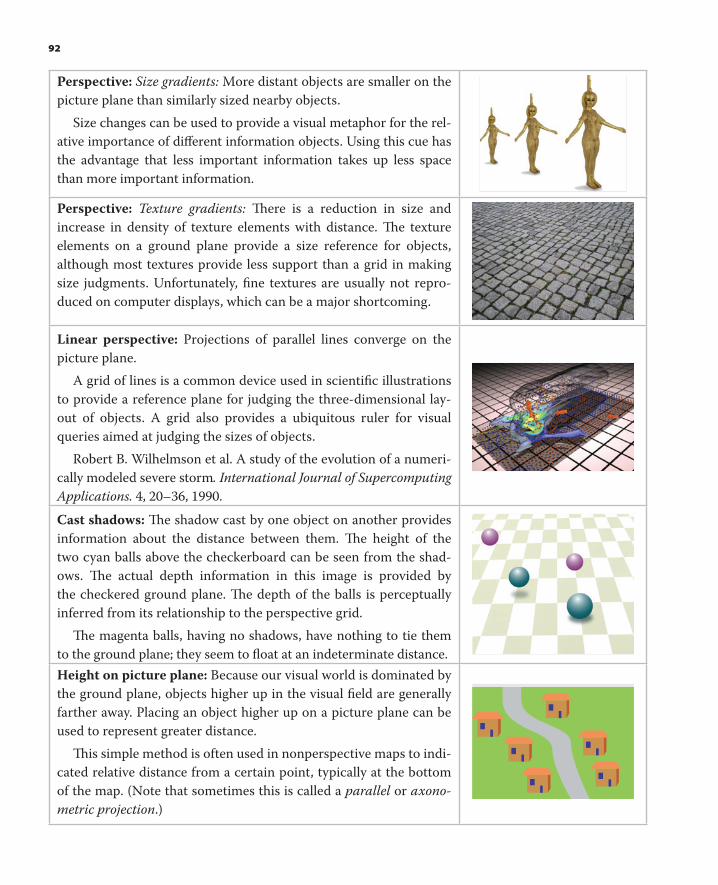
92
Perspective: Size gradients: More distant objects are smaller on the
picture plane than similarly sized nearby objects.
Size changes can be used to provide a visual metaphor for the rel-
ative importance of diff erent information objects. Using this cue has
the advantage that less important information takes up less space
than more important information.
Perspective: Texture gradients: Th ere is a reduction in size and
increase in density of texture elements with distance. Th e texture
elements on a ground plane provide a size reference for objects,
although most textures provide less support than a grid in making
size judgments. Unfortunately, fi ne textures are usually not repro-
duced on computer displays, which can be a major shortcoming.
Linear perspective: Projections of parallel lines converge on the
picture plane.
A grid of lines is a common device used in scientifi c illustrations
to provide a reference plane for judging the three-dimensional lay-
out of objects. A grid also provides a ubiquitous ruler for visual
queries aimed at judging the sizes of objects.
Robert B. Wilhelmson et al. A study of the evolution of a numeri-
cally modeled severe storm. International Journal of Supercomputing
Applications . 4, 20–36, 1990.
Cast shadows: Th e shadow cast by one object on another provides
information about the distance between them. Th e height of the
two cyan balls above the checkerboard can be seen from the shad-
ows. Th e actual depth information in this image is provided by
the checkered ground plane. Th e depth of the balls is perceptually
inferred from its relationship to the perspective grid.
Th e magenta balls, having no shadows, have nothing to tie them
to the ground plane; they seem to fl oat at an indeterminate distance.
Height on picture plane: Because our visual world is dominated by
the ground plane, objects higher up in the visual fi eld are generally
farther away. Placing an object higher up on a picture plane can be
used to represent greater distance.
Th is simple method is often used in nonperspective maps to indi-
cated relative distance from a certain point, typically at the bottom
of the map. (Note that sometimes this is called a parallel or axono-
metric projection. )
CH05-P370896.indd 92CH05-P370896.indd 92 1/24/2008 4:33:46 PM1/24/2008 4:33:46 PM

Shading: Th e surfaces of objects refl ect more or less light depending
on how they are oriented towards the light source.
Depth of focus: Th e human eye, like a camera lens, focuses objects
at a specifi c distance. Objects that are farther away or nearer are
blurred. Th is eff ect provides inexact depth information. It is also
called depth of fi eld by photographers.
Sharp images more readily attract the eye than blurred ones, and
so degree of blur can be used as a design technique to direct the
attention of a viewer.
Reference to nearby known objects: Objects of known size provide
a reference against which other objects are judged. Perspective cues
only give cues to relative size, but with a reference object absolute
size can be judged. Note that although this eff ect is knowledge-based
and not pure geometry like the rest, it is one of the most important
cues to distance.
Th e pink cow has been placed next to a boulder in this image of
Martian rocks to provide a size reference. It would work even better
if the cow had been given a cast shadow to anchor it to the ground.
Image courtesy of Kurt Schwehr and NASA.
Degree of contrast: Because neither air nor water is completely
transparent, the contrast between an object and its background is
reduced as distance increases.
Air is relatively clear, and most atmospheric contrast eff ects only
occur when considerable distances are involved. Water, being less
transparent, generates larger eff ects.
Designers can reduce contrast artifi cially to exaggerate atmo-
spheric contrast and create an enhanced sense of depth. In addition,
reducing contrast, like depth of focus or size scaling, can be used to
direct attention away from less important objects.
Depth Perception and Cue Theory 93
CH05-P370896.indd 93CH05-P370896.indd 93 1/24/2008 4:33:48 PM1/24/2008 4:33:48 PM

94
STEREOSCOPIC DEPTH
Some depth cues are not captured in a static image, and are therefore not
pictorial. One kind of depth cue comes from the fact that humans, like
many other animals, have two front-facing eyes. Visual area 1 contains
specialized mechanisms for using the small diff erences in the images in
the two eyes to extract distance information; this ability is called stereo-
scopic depth perception .
Diff erent depth cues have diff erent uses depending on the tasks we are
trying to perform. Stereoscopic vision is optimal for visually guiding our
hands as we reach for nearby objects. It works best in making judgments
of the relative distances of nearby objects, within a meter or two of our
heads. Stereoscopic depth judgments are also most precise for objects
that are at nearly the same depth. Th e brain is not good at using stereo
information to judge large relative distances. Because of these proper-
ties, people who have little or no stereo depth perception (20 percent of
the population) still have no diffi culty driving cars or walking around,
although they will be clumsy when trying to thread needles.
Stereo technology has, for the most part, been a story of fads that faded,
and this is largely because of a failure to understand that the main virtue
of stereo vision is the precise guidance of hand movements. Th e Victorians
were fascinated with stereo photos and sold thousands of stereo images.
Now they clutter the stands of fl ea markets. Stereo cameras had a heyday in
the 1930s and 1940s but now are almost unobtainable. Many inventors and
entrepreneurs have lost their shirts on stereographic movies and television
systems. Th e problem is that none of these technologies allowed for manual
interaction with the visual three-dimensional objects that were represented.
If we had virtual three-dimensional environments that allowed us to reach
in and move things, then we would appreciate stereo technology more.
The brain uses differences between the images in the two eyes to determine the relative distance to objects.
Technologies that support stereoscopic viewing present slightly different perspective views of a three-dimensional scene, each based on a slightly different viewpoint.
CH05-P370896.indd 94CH05-P370896.indd 94 1/24/2008 4:33:51 PM1/24/2008 4:33:51 PM
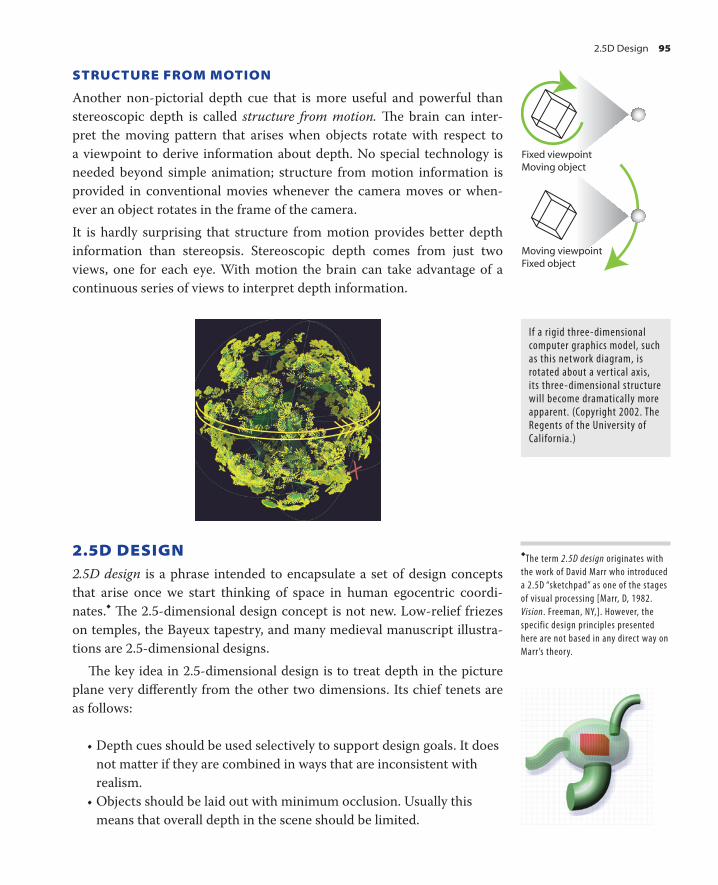
STRUCTURE FROM MOTION
Another non-pictorial depth cue that is more useful and powerful than
stereoscopic depth is called structure from motion. Th e brain can inter-
pret the moving pattern that arises when objects rotate with respect to
a viewpoint to derive information about depth. No special technology is
needed beyond simple animation; structure from motion information is
provided in conventional movies whenever the camera moves or when-
ever an object rotates in the frame of the camera.
It is hardly surprising that structure from motion provides better depth
information than stereopsis. Stereoscopic depth comes from just two
views, one for each eye. With motion the brain can take advantage of a
continuous series of views to interpret depth information.
2.5D DESIGN 2.5D design is a phrase intended to encapsulate a set of design concepts
that arise once we start thinking of space in human egocentric coordi-
nates. � Th e 2.5-dimensional design concept is not new. Low-relief friezes
on temples, the Bayeux tapestry, and many medieval manuscript illustra-
tions are 2.5-dimensional designs.
Th e key idea in 2.5-dimensional design is to treat depth in the picture
plane very diff erently from the other two dimensions. Its chief tenets are
as follows:
• Depth cues should be used selectively to support design goals. It does
not matter if they are combined in ways that are inconsistent with
realism.
• Objects should be laid out with minimum occlusion. Usually this
means that overall depth in the scene should be limited.
Fixed viewpointMoving object
Moving viewpointFixed object
If a rigid three-dimensional computer graphics model, such as this network diagram, is rotated about a vertical axis, its three-dimensional structure will become dramatically more apparent. (Copyright 2002. The Regents of the University of California.)
� The term 2.5D design originates with
the work of David Marr who introduced
a 2.5D “sketchpad” as one of the stages
of visual processing [Marr, D, 1982.
Vision. Freeman, NY,]. However, the
specific design principles presented
here are not based in any direct way on
Marr’s theory.
2.5D Design 95
CH05-P370896.indd 95CH05-P370896.indd 95 1/24/2008 4:33:52 PM1/24/2008 4:33:52 PM

96
• When occlusion is necessary, ensure critical information is not
occluded. Sometimes transparency can help reveal what is behind an
occluded object.
• Joints between compound multipart objects should be made clearly
visible.
• Make clear spatial relationships, such as on top of, attached to, and
inside of .
• Depth should be minimized, but when there are diff erent depths the
layout should be carefully designed to make relative distances clear.
Simple cast shadows, depth-of-focus eff ects, and transparency can be
used for this.
• Display text in the image plane. Text that is slanted in perspective
views is harder to read.
• Give common views of objects for rapid identifi cation.
Note that some of the principles listed above particularly the ones relat-
ing to joint and object views, are based on concepts that are presented
later in Chapter 6. Th ese have been included here to make a more coher-
ent and complete list of 2.5-dimensional design concepts.
This illustration of the human digestive system is an example of 2.5-dimensional design. Although many of the individual components are rendered in three dimensions, the layout is almost entirely in the picture plane. The connections between components are made very clear. There is occasional occlusion but it never destroys object identity. (Image from David Dickson, illustrator.www.daviddicksonillustration.com.)
CH05-P370896.indd 96CH05-P370896.indd 96 1/24/2008 4:33:53 PM1/24/2008 4:33:53 PM

HOW MUCH OF THE THIRD DIMENSION?
An important issue in determining whether a three-dimensional or
two-dimensional design is appropriate is the nature of what is to be
displayed. Some data already has three-dimensional spatial properties; for
example, architectural designs, and data from the physical and biological
sciences.
On the other hand, many kinds of data and concepts are not inherently
spatial. Typical examples are business statistics, social networks, and the
myriad of abstract concepts people have developed to cope with the world
(education, economic value, causality, to name a few). Some people have
tried to use three-dimensional representations for these kinds of things,
believing that because we live in a three-dimensional world, three dimen-
sions must be better than two. Th is argument fails to take into account the
fact that we do not perceive three dimensions. Even saying that we per-
ceive 2.5 dimensions is a considerable exaggeration because the informa-
tion we pick up from the towards-away direction is much less than half
of what we get from the other two. Attempts to show abstract non-spatial
data using three-dimensional views have not been successful mostly
because the information is not displayed clearly and because getting
around in three dimensions is much harder than navigation in two dimen-
sions. Th e cost of getting a good viewpoint in three dimensions is almost
always higher than clicking to follow a hypertext link or zooming in two
dimensions. Th is makes visual queries expensive and slows down the cog-
nitive process. Th ree-dimensional information mazes are especially to be
avoided since it takes people a long time to generate a mental map of such
a space. On the other hand, a primarily two-dimensional design with a
judicious use of depth can be useful because it allows for eff ective ways of
layering information.
Even when designing a truly three-dimensional virtual information
space is justifi ed because the data to be displayed has important three-
dimensional properties, 2.5-dimensional design principles should still
be applied. Any time we take the viewpoint into account we are making
a 2.5-dimensional design decision. Th is is because the viewpoint aff ects
the visibility of things in the image plane, which is a two-dimensional
representation. Often it is useful to mix two-dimensional design ele-
ments with three-diemensional design elements. Navigation controls
should always be visible on the screen and have a size such that they can
be easily selected. Th erefore, many three-dimensional interfaces actu-
ally have two-dimensional controls placed in the margin. Text labels
should be laid out in the image plane, even though they are attached to
2.5D Design 97
CH05-P370896.indd 97CH05-P370896.indd 97 1/24/2008 4:33:56 PM1/24/2008 4:33:56 PM

This design of a business process was developed by the company XPLANE™ by xplane.com©.
It is a good example of the application of 2.5-dimensional design principles to the visualization of a complex business system. It makes careful use of occlusion, height on the picture plane, and layering. No important objects are obscured through occlusion. All the important junctions in the information network are clearly visible.
CH05-P370896.indd 98CH05-P370896.indd 98 1/24/2008 4:33:56 PM1/24/2008 4:33:56 PM
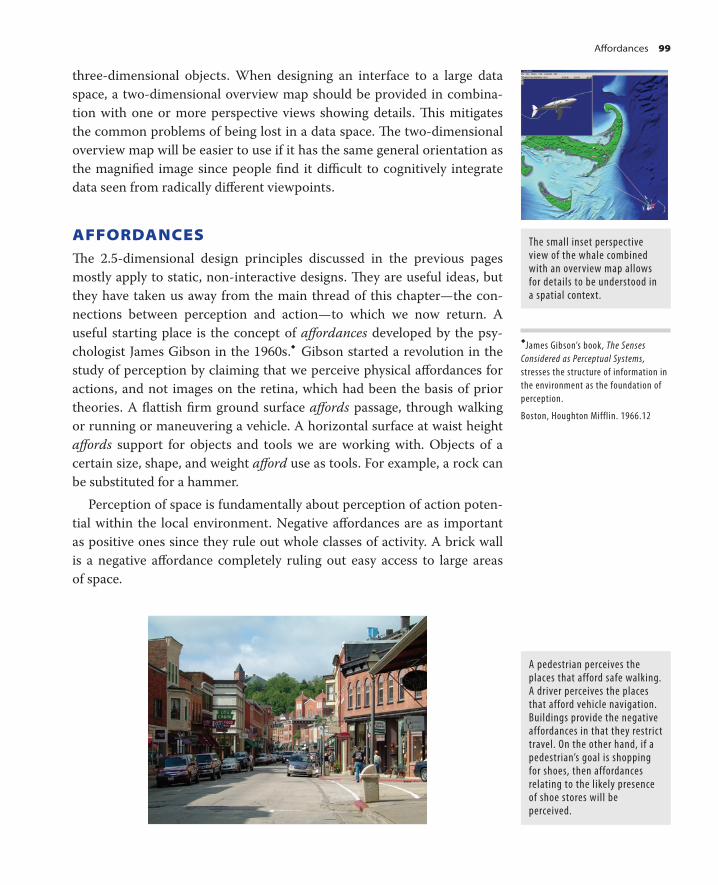
three-dimensional objects. When designing an interface to a large data
space, a two-dimensional overview map should be provided in combina-
tion with one or more perspective views showing details. Th is mitigates
the common problems of being lost in a data space. Th e two-dimensional
overview map will be easier to use if it has the same general orientation as
the magnifi ed image since people fi nd it diffi cult to cognitively integrate
data seen from radically diff erent viewpoints.
AFFORDANCES Th e 2.5-dimensional design principles discussed in the previous pages
mostly apply to static, non-interactive designs. Th ey are useful ideas, but
they have taken us away from the main thread of this chapter—the con-
nections between perception and action—to which we now return. A
useful starting place is the concept of aff ordances developed by the psy-
chologist James Gibson in the 1960s. � Gibson started a revolution in the
study of perception by claiming that we perceive physical aff ordances for
actions, and not images on the retina, which had been the basis of prior
theories. A fl attish fi rm ground surface aff ords passage, through walking
or running or maneuvering a vehicle. A horizontal surface at waist height
aff ords support for objects and tools we are working with. Objects of a
certain size, shape, and weight aff ord use as tools. For example, a rock can
be substituted for a hammer.
Perception of space is fundamentally about perception of action poten-
tial within the local environment. Negative aff ordances are as important
as positive ones since they rule out whole classes of activity. A brick wall
is a negative aff ordance completely ruling out easy access to large areas
of space.
The small inset perspective view of the whale combined with an overview map allows for details to be understood in a spatial context.
�James Gibson’s book, The Senses
Considered as Perceptual Systems,
stresses the structure of information in
the environment as the foundation of
perception.
Boston, Houghton Mifflin. 1966.12
Aff ordances 99
A pedestrian perceives the places that afford safe walking. A driver perceives the places that afford vehicle navigation. Buildings provide the negative affordances in that they restrict travel. On the other hand, if a pedestrian’s goal is shopping for shoes, then affordances relating to the likely presence of shoe stores will be perceived.
CH05-P370896.indd 99CH05-P370896.indd 99 1/24/2008 4:33:59 PM1/24/2008 4:33:59 PM
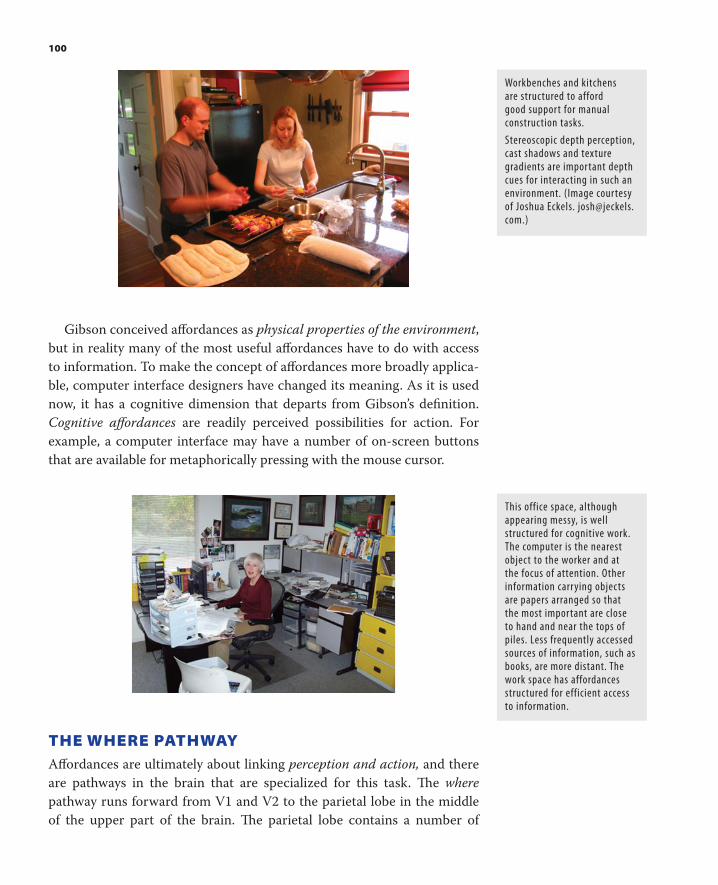
100
Gibson conceived aff ordances as physical properties of the environment ,
but in reality many of the most useful aff ordances have to do with access
to information. To make the concept of aff ordances more broadly applica-
ble, computer interface designers have changed its meaning. As it is used
now, it has a cognitive dimension that departs from Gibson ’ s defi nition.
Cognitive aff ordances are readily perceived possibilities for action. For
example, a computer interface may have a number of on-screen buttons
that are available for metaphorically pressing with the mouse cursor.
THE WHERE PATHWAY Aff ordances are ultimately about linking perception and action, and there
are pathways in the brain that are specialized for this task. Th e where
pathway runs forward from V1 and V2 to the parietal lobe in the middle
of the upper part of the brain. Th e parietal lobe contains a number of
Workbenches and kitchens are structured to afford good support for manual construction tasks.
Stereoscopic depth perception, cast shadows and texture gradients are important depth cues for interacting in such an environment. (Image courtesy of Joshua Eckels. [email protected].)
This office space, although appearing messy, is well structured for cognitive work. The computer is the nearest object to the worker and at the focus of attention. Other information carrying objects are papers arranged so that the most important are close to hand and near the tops of piles. Less frequently accessed sources of information, such as books, are more distant. The work space has affordances structured for efficient access to information.
CH05-P370896.indd 100CH05-P370896.indd 100 1/24/2008 4:34:01 PM1/24/2008 4:34:01 PM
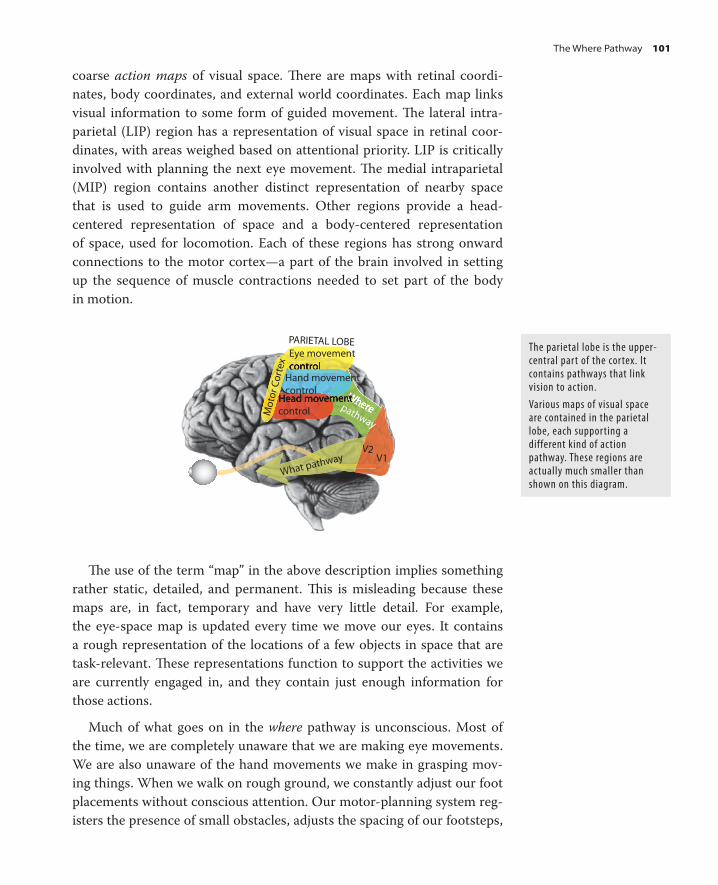
coarse action maps of visual space. Th ere are maps with retinal coordi-
nates, body coordinates, and external world coordinates. Each map links
visual information to some form of guided movement. Th e lateral intra-
parietal (LIP) region has a representation of visual space in retinal coor-
dinates, with areas weighed based on attentional priority. LIP is critically
involved with planning the next eye movement. Th e medial intraparietal
(MIP) region contains another distinct representation of nearby space
that is used to guide arm movements. Other regions provide a head-
centered representation of space and a body-centered representation
of space, used for locomotion. Each of these regions has strong onward
connections to the motor cortex—a part of the brain involved in setting
up the sequence of muscle contractions needed to set part of the body
in motion.
V1What pathway
pathway
V2
Eye movement
controlMot
or C
orte
x
Hand movementcontrol
PARIETAL LOBE
Th e use of the term “ map ” in the above description implies something
rather static, detailed, and permanent. Th is is misleading because these
maps are, in fact, temporary and have very little detail. For example,
the eye-space map is updated every time we move our eyes. It contains
a rough representation of the locations of a few objects in space that are
task-relevant. Th ese representations function to support the activities we
are currently engaged in, and they contain just enough information for
those actions.
Much of what goes on in the where pathway is unconscious. Most of
the time, we are completely unaware that we are making eye movements.
We are also unaware of the hand movements we make in grasping mov-
ing things. When we walk on rough ground, we constantly adjust our foot
placements without conscious attention. Our motor-planning system reg-
isters the presence of small obstacles, adjusts the spacing of our footsteps,
The parietal lobe is the upper-central part of the cortex. It contains pathways that link vision to action.
Various maps of visual space are contained in the parietal lobe, each supporting a different kind of action pathway. These regions are actually much smaller than shown on this diagram.
The Where Pathway 101
CH05-P370896.indd 101CH05-P370896.indd 101 1/24/2008 4:34:03 PM1/24/2008 4:34:03 PM
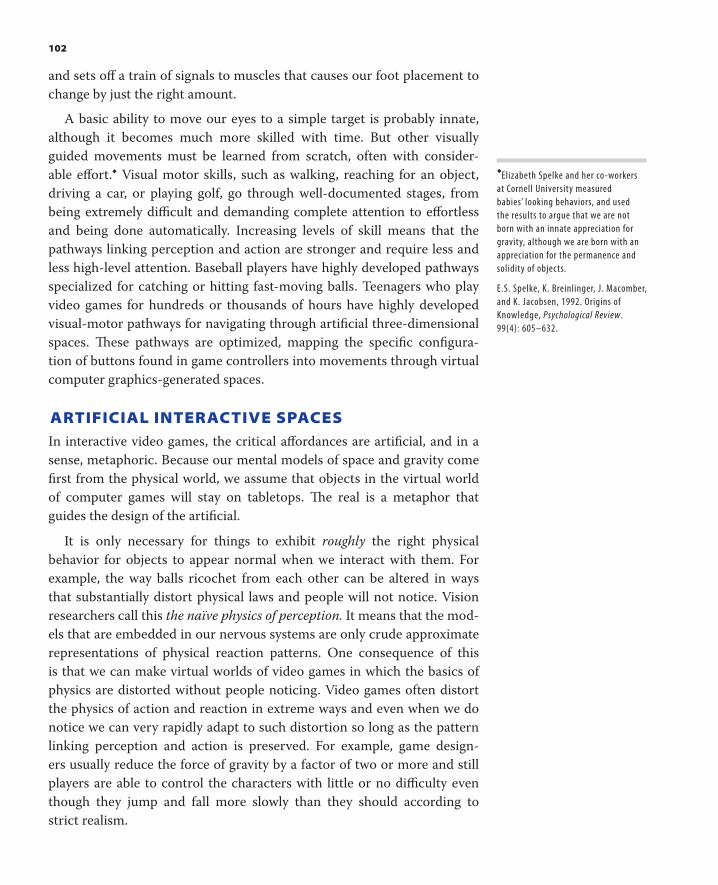
102
and sets off a train of signals to muscles that causes our foot placement to
change by just the right amount.
A basic ability to move our eyes to a simple target is probably innate,
although it becomes much more skilled with time. But other visually
guided movements must be learned from scratch, often with consider-
able eff ort. � Visual motor skills, such as walking, reaching for an object,
driving a car, or playing golf, go through well-documented stages, from
being extremely diffi cult and demanding complete attention to eff ortless
and being done automatically. Increasing levels of skill means that the
pathways linking perception and action are stronger and require less and
less high-level attention. Baseball players have highly developed pathways
specialized for catching or hitting fast-moving balls. Teenagers who play
video games for hundreds or thousands of hours have highly developed
visual-motor pathways for navigating through artifi cial three-dimensional
spaces. Th ese pathways are optimized, mapping the specifi c confi gura-
tion of buttons found in game controllers into movements through virtual
computer graphics-generated spaces.
ARTIFICIAL INTERACTIVE SPACES In interactive video games, the critical aff ordances are artifi cial, and in a
sense, metaphoric. Because our mental models of space and gravity come
fi rst from the physical world, we assume that objects in the virtual world
of computer games will stay on tabletops. Th e real is a metaphor that
guides the design of the artifi cial.
It is only necessary for things to exhibit roughly the right physical
behavior for objects to appear normal when we interact with them. For
example, the way balls ricochet from each other can be altered in ways
that substantially distort physical laws and people will not notice. Vision
researchers call this the naïve physics of perception. It means that the mod-
els that are embedded in our nervous systems are only crude approximate
representations of physical reaction patterns. One consequence of this
is that we can make virtual worlds of video games in which the basics of
physics are distorted without people noticing. Video games often distort
the physics of action and reaction in extreme ways and even when we do
notice we can very rapidly adapt to such distortion so long as the pattern
linking perception and action is preserved. For example, game design-
ers usually reduce the force of gravity by a factor of two or more and still
players are able to control the characters with little or no diffi culty even
though they jump and fall more slowly than they should according to
strict realism.
� Elizabeth Spelke and her co-workers
at Cornell University measured
babies’ looking behaviors, and used
the results to argue that we are not
born with an innate appreciation for
gravity, although we are born with an
appreciation for the permanence and
solidity of objects.
E.S. Spelke, K. Breinlinger, J. Macomber,
and K. Jacobsen, 1992. Origins of
Knowledge, Psychological Review.
99(4): 605–632.
CH05-P370896.indd 102CH05-P370896.indd 102 1/24/2008 4:34:03 PM1/24/2008 4:34:03 PM

Effi cient designs for information access generally build on visual motor
skills we already possess. For example, although a computer mouse is com-
pletely disconnected from the cursor on the screen, the cursor moves to the
right when we move our hand to the right. Th is builds on the very early skills
a baby develops when initially random hand movements cause objects in the
visual fi eld to move. Try rotating your mouse 90 degrees and selecting some
object on your screen to see how diffi cult things can be when we violate the
basic correspondence between hand movement and cursor movement.
Th e idea that our mental models of space perception are grounded in
real-world interaction requires some qualifi cation. Th e neural architecture
and the most basic human capabilities are innate. Th e world is changing in
profound ways. As younger and younger children work with computers,
purely invented consequences of actions, such as cursors that move with
the mouse, become basic. Pull-down menus are common and have come
to be as real in an important way as physical balls that roll when kicked.
With extended use, the motor pathways that connect perception to action
can become just as strong for the computer interaction as for the physical
action.
Many individuals spend signifi cant parts of their lives interacting with
computers containing simulated environments. If these virtual worlds con-
tain virtual laws that diff er substantially from the real world, then these
patterns will become the basis for an alternative naïve physics, not based
on the real world, but upon artifi cial worlds. Human perception is, over
time, becoming less grounded in real-world interactions. Skill with a com-
puter mouse is already assumed for computer-interface designers. Skill
with common video game controllers is becoming increasingly ubiquitous.
SPACE TRAVERSAL AND COGNITIVE COSTS We now return to the point that moving through space can be regarded
as a cognitive cost. We weigh the time to go to the library against the
time to access information online, taking into account the relative qual-
ity of information we are likely to get. Th ere are cognitive tradeoff s other
than time to consider. We choose to travel by train, as opposed to driv-
ing a car, because we can read and write while on the train but not in the
car, although even on the train the work we can do is far less than we can
accomplish in an offi ce that is highly optimized for cognitive work.
In this light, it is useful to review the basic costs of some common
modes of information access. A list of rough values for various costs is set
out in the following table. Some designers of computer interfaces literally
count such costs for the execution of a particular task—how many mouse
As natural as walking?
Space Traversal and Cognitive Costs 103
CH05-P370896.indd 103CH05-P370896.indd 103 1/24/2008 4:34:03 PM1/24/2008 4:34:03 PM

104
movements, how many eye movements, how many keystrokes, and so on.
In this way, the effi ciency of one design can be compared against another.
Th e table is far too rough an approximation to be used for this purpose.
Rather it is intended as food for thought. A computer interface design
can often be dramatically improved by changes that involve, for example,
making it possible to access a frequently used piece of information via an
eye movement instead of a mouse movement. Although pure cognitive
effi ciency is never the only design issue, it is always something that should
be taken into account.
Internal pattern comparison 0.04 seconds Occurs whenever our eyes alight.
Eye movements 0.1 seconds Tightly coupled with visual cognitive system .
Mouse hover: A hover query is what occurs when
the cursor is placed over an information object and
information appears. No clicking is required.
1.0 seconds If they are highly optimized, hover queries can be invaluable
techniques for rapid exploration. As the mouse cursor moves over
a particular object, related data objects become highlighted .
Mouse select 1.5 seconds A mouse selection of a web link can cause an entirely new page of
information to appear.
Zooming: Discussed shortly Dist � 4 t (seconds) The most efficient way of traversing large distances with visual
continuity.
Walk 4 kph/dist (minutes) Good affordances for contemplative thought. Poor affordances for
interactive cognitive work.
Drive 80 kph/dist
(minutes-hours)
Moderate affordances for contemplative thought. Poor affordances
for interactive cognitive work.
Fly 400 kph/dist (hours) Moderate affordances for contemplative thought. Depending on
class of travel moderate affordances for interactive cognitive work.
Train 100 kph/dist (hours) Moderate affordances for contemplative thought. Depending on
class of travel moderate affordances for interactive cognitive work.
Th e advent of high-performance three-dimensional computer graphics
has led to the invention of navigation methods that are non-metaphoric
in that they are not based on real-world interactions. One of these is the
zooming interface. As it is usually implemented (for example, in Google
Earth), zooming causes a constant change in scale per unit time. If we are
zooming in, in one second we might see objects four times as big. In two
seconds, we will be able to see four times as big again, or sixteen times in
total. In three seconds we can see 4 � 4 � 4, or sixty-four times the detail.
CH05-P370896.indd 104CH05-P370896.indd 104 1/24/2008 4:34:04 PM1/24/2008 4:34:04 PM
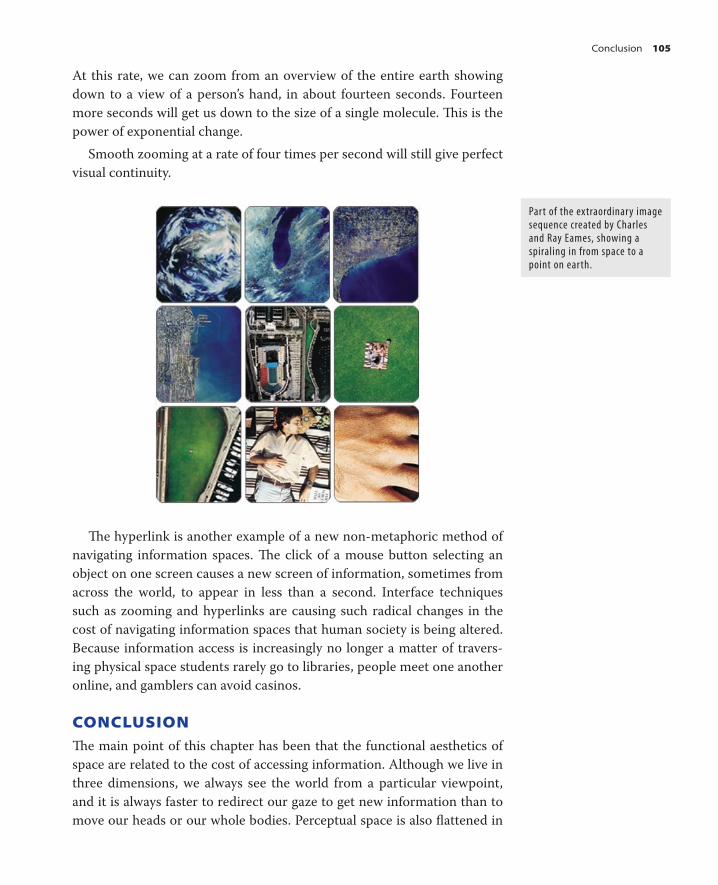
At this rate, we can zoom from an overview of the entire earth showing
down to a view of a person ’ s hand, in about fourteen seconds. Fourteen
more seconds will get us down to the size of a single molecule. Th is is the
power of exponential change.
Smooth zooming at a rate of four times per second will still give perfect
visual continuity.
Th e hyperlink is another example of a new non-metaphoric method of
navigating information spaces. Th e click of a mouse button selecting an
object on one screen causes a new screen of information, sometimes from
across the world, to appear in less than a second. Interface techniques
such as zooming and hyperlinks are causing such radical changes in the
cost of navigating information spaces that human society is being altered.
Because information access is increasingly no longer a matter of travers-
ing physical space students rarely go to libraries, people meet one another
online, and gamblers can avoid casinos.
CONCLUSION Th e main point of this chapter has been that the functional aesthetics of
space are related to the cost of accessing information. Although we live in
three dimensions, we always see the world from a particular viewpoint,
and it is always faster to redirect our gaze to get new information than to
move our heads or our whole bodies. Perceptual space is also fl attened in
Part of the extraordinary image sequence created by Charles and Ray Eames, showing a spiraling in from space to a point on earth.
Conclusion 105
CH05-P370896.indd 105CH05-P370896.indd 105 1/24/2008 4:34:04 PM1/24/2008 4:34:04 PM
106
terms of its information content, with much less information being rap-
idly available in the towards-away (depth) direction than the sideways and
up-down directions because we cannot see through most objects. Th e
pattern-processing mechanisms of the brain operate on the two-
dimensional retinal image which means that two-dimensional image plane
information is analyzed much more effi ciently than depth information.
Th is is not to deny depth perception, but depth is perceived in ways
that are radically diff erent from the way patterns in the image plane are
perceived. Th e brain determines relative distance by means of depth cues
such as occlusion, shape from shading, and linear perspective. Information
from the depth cues is used in a piecemeal fashion to help perform the
task at hand. Sometimes motion parallax will be most important, some-
times relative size and sometimes shading information, it all depends on
what we are trying to accomplish.
Th e set of design principles that takes the space-time structure of per-
ception into account is called 2.5-dimension design. Th e fact that the
brain is capable of interpreting depth cues in a piecemeal fashion frees the
designer to break the rules of perspective and make use of depth cues in
diff erent combinations as they seem most suitable to serve the purposes
of a design. Th ere is no need to use them all together in a consistent way
unless visual realism is, in and of itself, a design goal. Th e piecemeal use of
depth cues is part of 2.5-dimension design; however, the layout of objects
and patterns as they appear in the image plane should be the primary
design consideration.
Th e designer of interactive computer-based applications has options
relating to the cost of information access. Th e cost of eye movements can
be compared together with the cost of a mouse click. Th e cost of virtu-
ally walking can be compared to the cost of fl ying or zooming. Having an
understanding of the various tradeoff s involved in making these choices is
critical in designing eff ective cognitive tools.
CH05-P370896.indd 106CH05-P370896.indd 106 1/24/2008 4:34:06 PM1/24/2008 4:34:06 PM

107
Visual Objects, Words, and Meaning
In the movie A Clockwork Orange, the antihero, Alex, a sadistic punk of the
future, is a guinea pig in an experiment to “ reprogram ” him and thereby
make him a useful member of society. Ultimately, it is hoped, the method
will remove the need for prisons. Th e reprogramming involves pairing
images of sex and violence with nausea-inducing drugs. It is a plausible
idea that this should work because images can evoke strong emotional
responses and are often associated with obsessive behavior; however, this
kind of treatment has not been successful in reality.
Th e activation of meaning from an image generally occurs in a small
fraction of a second, much less time than it takes to read a paragraph of
text. Th is activation through a single glance makes images far more effi -
cient than words at conveying certain kinds of information.
In this chapter, we examine the brain processes involved in object and
scene perception and consider the links between visual and non-visual (espe-
cially verbal) information. We shall begin with an overview of the neurophys-
iology, and end with a discussion of the role of images in obsessive thinking.
CH06-P370896.indd 107CH06-P370896.indd 107 1/23/2008 6:56:42 PM1/23/2008 6:56:42 PM

108
THE INFEROTEMPORAL CORTEX AND THE WHAT CHANNEL We have already discussed the processing of increasingly complex pat-
terns through brain areas V1, V2, V4, and LOC. Now we move up to the
stage of the inferotemporal cortex, where we will encounter patterns that
are meaningful in an everyday sense.
V1V2V4IT
LOC
Th e inferotemporal cortex is an area at each side of the brain (behind
the temples) containing neurons specialized for complex visual patterns
corresponding to recognizable objects and scenes. It contains a number of
subareas. Th ere is, for example, a subregion called the fusiform gyrus that
contains cells responding specifi cally to faces. Other regions are special-
ized for cars and houses. Th ere are also links to areas in the forebrain and
the midbrain that provide multimodal connections between visual infor-
mation and information processed by other sensory channels.
In order to recognize objects and scenes, the brain must solve a num-
ber of very diffi cult problems. Consider face recognition; studies of human
pattern perception show that humans are much better at identifying
objects when the viewpoint is a familiar one. Recognizing an upside down
face is diffi cult and so is recognizing alterations to a familiar face as the
following image demonstrates.
The “ what ” channel consists of a series of strongly interconnected brain areas that contain neurons responding to progressively more complex patterns. At the end of the chain is the inferotemporal (IT) cortex.
This modified picture of Marilyn Monroe looks much worse when you turn it right side up! This effect is called the Thatcher Illusion because it was first illustrated with the face of the British Prime Minister Margaret Thatcher.
CH06-P370896.indd 108CH06-P370896.indd 108 1/23/2008 6:56:43 PM1/23/2008 6:56:43 PM

Spatial memory for scenes is also viewpoint specifi c. Suppose someone
has always entered a room from a particular door and has always stayed in
that room near to that entrance so they have never experienced it from a
substantially diff erent viewpoint. Generally they will fail to recognize the
room when entering from a door on the opposite side. We can still recog-
nize objects and scenes when there are quite large variations in the view-
point from which we see them; the diffi culties occur only with extreme
changes of view. What applies to scenes also applies to individual objects. As
a rule of thumb, we can rotate an object by about 20 degrees and scale it by a
factor of two or three and still identify it rapidly. How does the brain do it?
GENERALIZED VIEWS FROM PATTERNS Th e IT object identifi cation areas receive bottom-up information from the
V4 patterns processing region. V4 neurons are capable of responding to
patterns that are rotated and distorted in variations of a prototype.
But a pattern cannot be rotated or distorted too much or the neuron
will stop responding. Th is tolerance of distortion makes the task of the IT
cortex much easier. Complex objects, such as human faces, cats, teapots,
or automobiles (all things that neurons in the IT cortex are likely to be sen-
sitive to) can be thought of as patterns of patterns. Th e identifi able object
patterns are constructed from simpler V4 patterns, which in turn are made
up of elementary pattern components coming from V1 and V2. � In order
to identify a face, for example, several sets of neurons must respond to a
few generalized views such as a full face view, a three-quarters view, and a
profi le view. Each of these views provides a quite distinct visual pattern of
patterns. Most other views of a person ’ s face will provide only minor varia-
tions of one of these generalized views. Because the component pattern
recognizers are tolerant of distortion, the overall mechanism is too.
A neuron in area V4 might respond to all of these pattern variations.
�
Neuroscience has yet to decide
whether it is single neurons or
assemblages of neurons that fulfill this
function.
A face is a pattern of patterns .
Generalized Views from Patterns 109
CH06-P370896.indd 109CH06-P370896.indd 109 1/23/2008 6:56:44 PM1/23/2008 6:56:44 PM

110
Some theorists, beginning with the philosopher Plato, have held that we
recognize objects with reference to other objects that are somehow canon-
ical , abstract ideal forms. Superfi cially, the generalized views mentioned
above might seem like a similar idea. Th is is not at all what is intended. We
recognize faces and other things because clusters of neurons that receive
inputs from other clusters of neurons respond strongly when a certain face
becomes imaged on the retina. Th is is not a matching process, and there is
no idealized form, simply a response to a range of patterns.
STRUCTURED OBJECTS Th ere has been an intense theoretical debate in the community of vision
researchers as to whether or not we have three-dimensional “ models ” in
our heads. � Most of the evidence suggests that most of us do not and that
the “ generalized views ” account of recognition is suffi cient to explain how
people normally perceive objects in most cases. Th ere are exceptions; for
instance, people like carpenters and engineers develop specialized skills
to mentally manipulate 3D structures. Such people do have some limited
ability to build models in their head, albeit quite simple ones. Th e fact that
there are very large individual diff erences in this skill suggests that it is not
basic to all perception.
Nevertheless, there is clear evidence that we all have some limited abil-
ity to perceive the three-dimensional structure of objects. For some objects
composed of component parts, the way those parts are connected is critical.
If asked which object in the blue box matches the one in the pink box most people will choose the one on the right. But according to the theory of object perception, based on two-dimensional generalized views, the one on the left of the blue box should be chosen because the image is mostly identical.
In order to account for our ability to identify structured objects, Irving
Biederman proposed geon theory. � Th is is the idea that the brain con-
tains mechanisms to identify three-dimensional structural components
of objects that he calls geons. Geons, in his theory, are three-dimensional
shapes such as cones and cylinders that can be curved or straight. Th e
brain stores information about the geon components of objects, together
�
A model in the head would be a
neural representation of the three-
dimensional spatial layout of an
object ’ s parts.
�
I. Biederman, 1987. Recognition by
components: A theory of human image
understanding. Psychological Review.
92(2): 115–147.
CH06-P370896.indd 110CH06-P370896.indd 110 1/23/2008 6:56:46 PM1/23/2008 6:56:46 PM

with a description of the way they are connected—a kind of structural skel-
eton. When the object we see is a horse, the geons are its four legs, each
composed of sub-geons, its head, its neck, and its tail. Th e way these parts
are connected forms the geon skeleton.
A geonproblem
Th e geon theory is probably the most controversial of the theories
that are discussed here. Few researchers believe that neurons respond
to exactly the set of three-dimensional primitives that Biederman pro-
posed. However, there is strong evidence that we perceive the way parts of
objects are interconnected—the structural skeleton in Biederman ’ s theory.
Objects can be identifi ed far more rapidly if they are presented in views
that clearly reveal the connections between component parts. For this
reason, in design, it is always a good idea to make the connection points
between parts of objects as clear as possible.
In the left-hand pair of images, the critical connections between the parts of both the teapot and the hand are evident in the silhouette. In the right-hand pair these connections are not as clearly shown and in the case of the teapot the handle is invisible. The right-hand pair are less likely to be identified correctly from a brief presentation.
Th ere is no reason for the brain to have only a single process for object
identifi cation and it is likely that both the generalized two-dimensional
These kinds of objects are defined by the way their distinct component parts are attached together. If one of the attachments changes, our perception of the object will change into a different object, possibly something unrecognizable, or an object that is in some way bizarre, like the figure with an arm coming out of his stomach.
Structured Objects 111
CH06-P370896.indd 111CH06-P370896.indd 111 1/23/2008 6:56:46 PM1/23/2008 6:56:46 PM

112
views theory, and the structured object theory are correct. Th e brain appears
to do most identifi cation through the mechanism of two-dimensional pat-
terns, but for certain kinds of objects a kind of higher-level structural analysis
of the kind Biederman proposed may provide the most critical information.
Both theories suggest ways of making clear graphic representations.
GIST AND SCENE PERCEPTION Identifying scenes provides another kind of problem for the visual system.
People can easily identify scenes, such as “ a busy road, ” “ a rural landscape, ”
or “ a fast-food restaurant, ” and they can make this kind of categorical
judgment in less than a tenth of a second even if they have never seen that
particular road, landscape, or restaurant before. Th is is about the same
time it takes for a person to identify that an object is a person, a dog, a
car or belonging to some generic class. Th is rapid identifi cation is a prob-
lem for traditional theories of scene perception because they held that a
scene is identifi ed by means of the objects it contains, which implied that
objects would have to be recognized fi rst and faster.
We can get the gist of a scene in less than a tenth of a second. This is as fast as we can identify individual objects.
Th e rapid characterization of a scene is called getting its gist . Neither the
generalized two-dimensional views theory nor the structured object recog-
nition theory can account for why it is so rapid and effi cient. Gist perception
can, nevertheless, be thought of as another example of a process whereby
patterns of patterns are the key. Two researchers at the Massachusetts
Institute of Technology, Antonio Torralba and Aude Oliva, have sketched
out how this might occur. � Th ey showed how common scenes have typical
spatial feature components, distributed in characteristic ways. Th ese can
include large-scale pattern arrangements of patches of textures and colors.
Th ere is no need for objects to be identifi ed for a scene to be recognized.
�
A. Oliva and A. Torralba. 2006. Building
the gist of a scene: The role of global
image features in recognition. Progress
in Brain Research. 155: 527–532.
CH06-P370896.indd 112CH06-P370896.indd 112 1/23/2008 6:56:48 PM1/23/2008 6:56:48 PM

For example, beach scenes are generally characterized by a large blue area at
the top of the image (the sky) with striated white and blue-grey areas either
to the left or the right of the image (the sea with waves), and a large beige
area (sand) containing smaller vertical and horizontals shapes (people) on
the remaining side. Recognizing such patterns of patterns is exactly the kind
of thing that neurons in the IT cortex are good at.
This is the average of hundreds of pictures containing a person, all taken in Mallorca, Spain. Notice that even though there are no individual small-scale features present, it is clear that there is a standing person in an exterior environment with a quite flat terrain. It is not necessary to recognize objects to perceive the scene. A. Oliva and A. Torralba, 2006. Building the gist of a scene: The role of global image features in recognition. Progress in Brain Research, 155: 527–532.
The statistical properties of a medieval cityscape are represented here.
The statistical properties of a beach scene are represented here.
Gist and Scene Perception 113
CH06-P370896.indd 113CH06-P370896.indd 113 1/23/2008 6:56:50 PM1/23/2008 6:56:50 PM
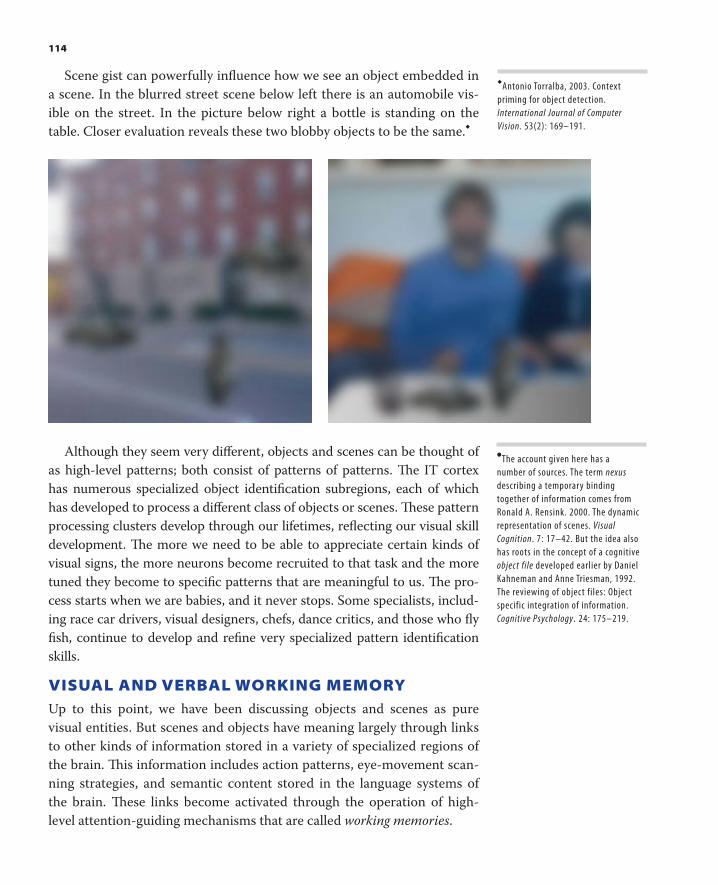
114
Scene gist can powerfully infl uence how we see an object embedded in
a scene. In the blurred street scene below left there is an automobile vis-
ible on the street. In the picture below right a bottle is standing on the
table. Closer evaluation reveals these two blobby objects to be the same. �
�
Antonio Torralba, 2003. Context
priming for object detection.
International Journal of Computer
Vision. 53(2): 169–191.
�
The account given here has a
number of sources. The term nexus
describing a temporary binding
together of information comes from
Ronald A. Rensink. 2000. The dynamic
representation of scenes. Visual
Cognition . 7: 17–42. But the idea also
has roots in the concept of a cognitive
object file developed earlier by Daniel
Kahneman and Anne Triesman, 1992.
The reviewing of object files: Object
specific integration of information.
Cognitive Psychology. 24: 175–219.
Although they seem very diff erent, objects and scenes can be thought of
as high-level patterns; both consist of patterns of patterns. Th e IT cortex
has numerous specialized object identifi cation subregions, each of which
has developed to process a diff erent class of objects or scenes. Th ese pattern
processing clusters develop through our lifetimes, refl ecting our visual skill
development. Th e more we need to be able to appreciate certain kinds of
visual signs, the more neurons become recruited to that task and the more
tuned they become to specifi c patterns that are meaningful to us. Th e pro-
cess starts when we are babies, and it never stops. Some specialists, includ-
ing race car drivers, visual designers, chefs, dance critics, and those who fl y
fi sh, continue to develop and refi ne very specialized pattern identifi cation
skills.
VISUAL AND VERBAL WORKING MEMORY Up to this point, we have been discussing objects and scenes as pure
visual entities. But scenes and objects have meaning largely through links
to other kinds of information stored in a variety of specialized regions of
the brain. Th is information includes action patterns, eye-movement scan-
ning strategies, and semantic content stored in the language systems of
the brain. Th ese links become activated through the operation of high-
level attention-guiding mechanisms that are called working memories .
CH06-P370896.indd 114CH06-P370896.indd 114 1/23/2008 6:56:58 PM1/23/2008 6:56:58 PM
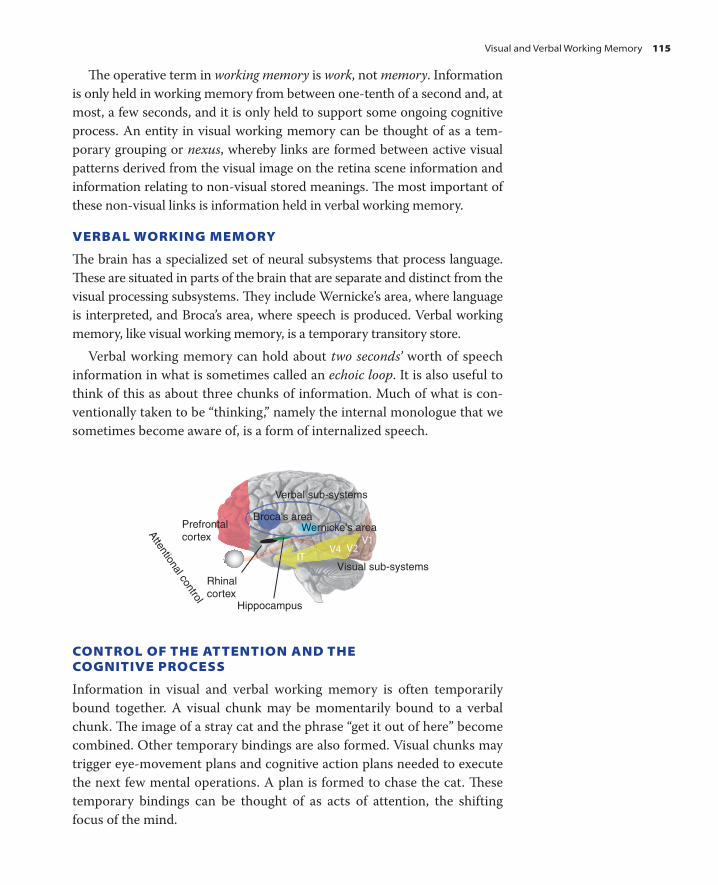
Th e operative term in working memory is work , not memory. Information
is only held in working memory from between one-tenth of a second and, at
most, a few seconds, and it is only held to support some ongoing cognitive
process. An entity in visual working memory can be thought of as a tem-
porary grouping or nexus , whereby links are formed between active visual
patterns derived from the visual image on the retina scene information and
information relating to non-visual stored meanings. Th e most important of
these non-visual links is information held in verbal working memory.
VERBAL WORKING MEMORY
Th e brain has a specialized set of neural subsystems that process language.
Th ese are situated in parts of the brain that are separate and distinct from the
visual processing subsystems. Th ey include Wernicke ’ s area, where language
is interpreted, and Broca ’ s area, where speech is produced. Verbal working
memory, like visual working memory, is a temporary transitory store.
Verbal working memory can hold about two seconds’ worth of speech
information in what is sometimes called an echoic loop . It is also useful to
think of this as about three chunks of information. Much of what is con-
ventionally taken to be “ thinking, ” namely the internal monologue that we
sometimes become aware of, is a form of internalized speech.
V1V2V4
IT
Broca's areaPrefrontalcortex
Rhinalcortex
Hippocampus
Wernicke's area
Verbal sub-systems
Visual sub-systemsAttentional control
CONTROL OF THE ATTENTION AND THE COGNITIVE PROCESS
Information in visual and verbal working memory is often temporarily
bound together. A visual chunk may be momentarily bound to a verbal
chunk. Th e image of a stray cat and the phrase “ get it out of here ” become
combined. Other temporary bindings are also formed. Visual chunks may
trigger eye-movement plans and cognitive action plans needed to execute
the next few mental operations. A plan is formed to chase the cat. Th ese
temporary bindings can be thought of as acts of attention, the shifting
focus of the mind.
Visual and Verbal Working Memory 115
CH06-P370896.indd 115CH06-P370896.indd 115 1/23/2008 6:57:05 PM1/23/2008 6:57:05 PM

116
Th e prefrontal cortex has long been considered critical to the tempo-
rary bindings that occur as part of more complex plans. In the words of
neuroscientists Earl Miller and Jonathan Cohen, “ Cognitive control stems
from the active maintenance of patterns of activity in the prefrontal cortex
that represent goals and the means to achieve them. Th ey provide bias sig-
nals to other brain structures whose net eff ect is to guide the fl ow of activity
along neural pathways that establish the proper mappings between inputs,
internal states, and outputs needed to perform a given task. ” �
LONGTERM MEMORY
When we look at something, perhaps 95 percent of what we consciously
perceive is not what is “ out there ” but what is already in our heads in long-
term memory. Th e reason we have the impression of perceiving a rich and
complex environment is that we have rich and complex networks of mean-
ing stored in our brains. Th is meaning becomes activated by the quite small
amount of information that actually makes it through the visual process-
ing system to visual working memory. Th is is why many husbands do not
notice when their wives have new hairstyles and wives do not notice when
their husbands shave off beards or moustaches. What is perceived of wives
and husbands is mostly what we have previously learned about them.
Long-term memory should not be thought of as a separate storage area
in the brain, like a computer disc drive, where information is dumped
after it has been processed by the sensory systems. It is not a distinct unit;
rather, the brain is a system where every neuron both processes and stores
information. V4 processes and stores visual pattern information and as
we learn to identify new patterns neural circuits are formed and strength-
ened to process those patterns. Similarly, the IT cortex both processes and
stores higher-level cognitive sequencing operations that relate, for exam-
ple, to the sequence of steps we carry out when performing a visual task,
such as reading a map.
Th e processes of visual thinking are very diverse, because what we think
about is very diverse. Most visual thinking involves situated interactions
with the world. Consider for a moment the following three examples: read-
ing a statistical bar chart, merging onto an expressway in an automobile,
and discussing a project in a face-to-face meeting. Th ese seem very diff er-
ent, but each requires the interpretation of visual information and a struc-
tured sequence of actions depending on the information. Each is a skilled
activity involving patterns of cognitive action that are refi ned and consoli-
dated every time we perform the act successfully. Th ey are also refi ned and
consolidated when mistakes are made, recognized, and corrected. Visual
�
E.F. Miller and J.D. Cohen. 2001.
An integrative theory of prefrontal
cortex function. Annual Review of
Neuroscience. 24: 167–202.
CH06-P370896.indd 116CH06-P370896.indd 116 1/23/2008 6:57:06 PM1/23/2008 6:57:06 PM
thinking procedures re-apply memory patterns that have been stored as
action sequences. Th is is what constitutes the skill of visual thinking.
Th ere are two diff erent classes of long-term memory information and
these are called explicit and implicit . Explicit memory is what we can
explicitly recall and describe when we are given a long-term memory test
and only a little of what we see and do makes it into this form of memory. �
Implicit memory is whatever is retained every time we see, hear, or do
something. Very little of this can be explicitly recalled but it does leave
a trace. Th ere is a lot more implicit memory than explicit memory, but
explicit memory is special because of the role it plays in communication.
We cannot communicate something if we cannot explicitly recall it.
For explicit learning of visual patterns and associations to occur, these
patterns must be the focus of attention, at least momentarily, and make
it into visual working memory. It is also necessary for an association to
be made between visual information and verbal information. In addition,
in order for long-term memory traces to be formed it is necessary for a
twenty-four-hour consolidation to occur.
Th e midbrain structure, the hippocampus, is key to the formation of
long-term memories. Th e evidence for this is striking; some unfortunate
people have had their hippocampi damaged on both sides of the brain,
and as a result they are completely unable to consolidate memories from
events that happened after the damage occurred. Th ese people will greet
their relatives as if there had been a long absence, even if they have been
out of the room for only a few minutes.
For long-term memory traces to occur there must be either an internal
or external consequence associated with a cognitive act. An internal con-
sequence might be that a particular sequence of neural processes leads to
a solution to a problem. For example, making it onto the freeway smoothly
will enhance and consolidate the neural patterns that lead to the particu-
lar sequence of eye movements, head movements, visual processing of the
pattern of moving vehicles, and steering movements that yielded the suc-
cessful outcome. Interpreting a bar chart and coming to a useful conclusion,
perhaps about a business strategy, will yield an internal cognitive reward
and similarly enhance the neural patterns that occurred during the inter-
pretation. A successful dialogue with a co-worker (involving visually inter-
preting facial expressions) may yield an external social reward in the form
of a smile. In each case, the reward strengthens the pathways supporting
a neural activation sequence that underlies the processing of information.
Th e long-term memory that is gained supports particular cognitive action
sequences and so skill is acquired. Th is is very unlike the static “ data ” that
�
D. Schacter, 1992. Implicit knowledge:
New perspectives on unconscious
processes. Proceedings of the National
Academy of Sciences. 89: 11113–11117.
Visual and Verbal Working Memory 117
CH06-P370896.indd 117CH06-P370896.indd 117 1/23/2008 6:57:06 PM1/23/2008 6:57:06 PM

118
is stored in computer disk drives. In visual thinking, perception is a kind of
cognitive action sequence, not some static registering of the external world.
Long-term memory results from a strengthening of neural connections,
increasing the likelihood that a particular neural chain reaction will occur.
PRIMING
To illustrate a point in a presentation, I might look through a few hundred
images in a database. But little is retained for explicit memory access; the
next day I will be unlikely to be able to explicitly recall having seen more
than two or three. Nevertheless, some trace of the others remains in my
brain. If I need to revisit the same database to fi nd a new image, I will
be able to skim through the images quite a bit faster. Somehow I can rule
out all of the irrelevant images faster because I have seen them before.
Th is eff ect is called long-term priming , or perceptual facilitation, and it is
a form of implicit memory. Any images that we see and process to some
extent prime the visual pathways involved in their processing. Th is means
that those images, and similar images, will be processed faster the second
time around. Repeat processing is easier, at least for a day or two.
Priming is the reason artists and designers often prepare for a particu-
lar creative bout by reviewing relevant images and other materials for a
day or two. Th is gets the relevant circuits into a primed state.
GETTING INTO VISUAL WORKING MEMORY
We are now in a position to sketch out the entire process whereby a visual
object comes to be represented in the mind. Of course, the cognitive pro-
cess is ongoing; what we have just seen infl uences where we will look next
and the information we pull out of the retinal image. In turn, that infor-
mation infl uences where we will look next, and so on.
But we must start somewhere, so we will start, arbitrarily, at the bot-
tom. Th e information (biased by attentional tuning as described in
Chapter 2) sweeps up through the various stages of the what hierarchy,
retina � V1 � V2 � V4 � IT, with more and more complex patterns being
formed at each level. Th e simple features of V1 and V2 become con-
tinuous contours and specifi c shapes in V4. More complex patterns are
activated in specialized regions of the IT cortex that correspond to mean-
ingful objects we have experienced in our lifetimes.
When the wave of activation reaches the IT cortex all similar patterns
are activated, although by diff ering amounts depending on how good a fi t
there is between the image information and the particular pattern detec-
tion unit. For example, if we are seeing the front of a person ’ s face all
CH06-P370896.indd 118CH06-P370896.indd 118 1/23/2008 6:57:06 PM1/23/2008 6:57:06 PM
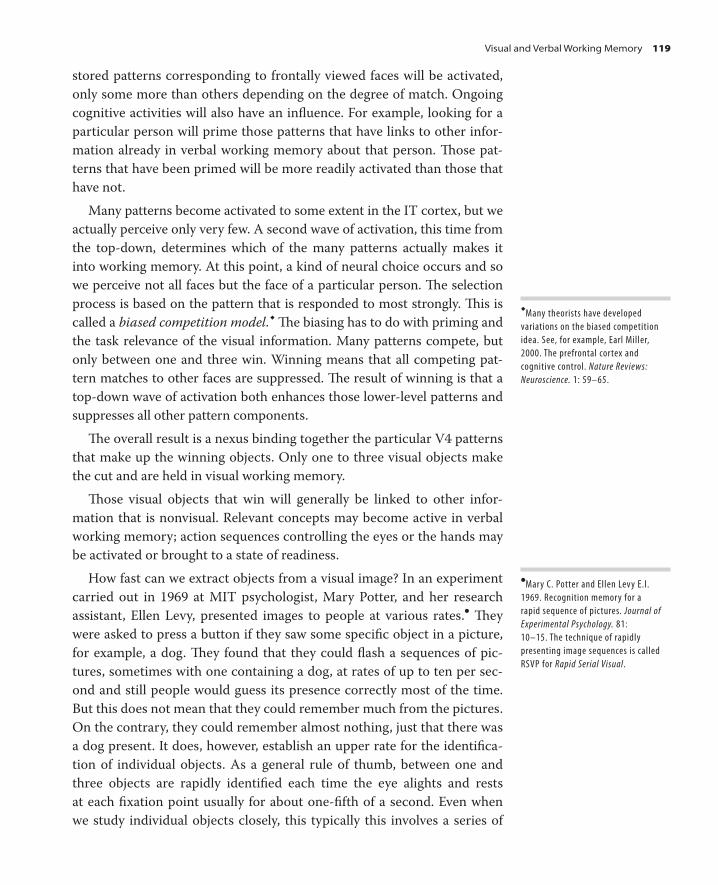
stored patterns corresponding to frontally viewed faces will be activated,
only some more than others depending on the degree of match. Ongoing
cognitive activities will also have an infl uence. For example, looking for a
particular person will prime those patterns that have links to other infor-
mation already in verbal working memory about that person. Th ose pat-
terns that have been primed will be more readily activated than those that
have not.
Many patterns become activated to some extent in the IT cortex, but we
actually perceive only very few. A second wave of activation, this time from
the top-down, determines which of the many patterns actually makes it
into working memory. At this point, a kind of neural choice occurs and so
we perceive not all faces but the face of a particular person. Th e selection
process is based on the pattern that is responded to most strongly. Th is is
called a biased competition model . � Th e biasing has to do with priming and
the task relevance of the visual information. Many patterns compete, but
only between one and three win. Winning means that all competing pat-
tern matches to other faces are suppressed. Th e result of winning is that a
top-down wave of activation both enhances those lower-level patterns and
suppresses all other pattern components.
Th e overall result is a nexus binding together the particular V4 patterns
that make up the winning objects. Only one to three visual objects make
the cut and are held in visual working memory.
Th ose visual objects that win will generally be linked to other infor-
mation that is nonvisual. Relevant concepts may become active in verbal
working memory; action sequences controlling the eyes or the hands may
be activated or brought to a state of readiness.
How fast can we extract objects from a visual image? In an experiment
carried out in 1969 at MIT psychologist, Mary Potter, and her research
assistant, Ellen Levy, presented images to people at various rates. � Th ey
were asked to press a button if they saw some specifi c object in a picture,
for example, a dog. Th ey found that they could fl ash a sequences of pic-
tures, sometimes with one containing a dog, at rates of up to ten per sec-
ond and still people would guess its presence correctly most of the time.
But this does not mean that they could remember much from the pictures.
On the contrary, they could remember almost nothing, just that there was
a dog present. It does, however, establish an upper rate for the identifi ca-
tion of individual objects. As a general rule of thumb, between one and
three objects are rapidly identifi ed each time the eye alights and rests
at each fi xation point usually for about one-fi fth of a second. Even when
we study individual objects closely, this typically this involves a series of
� Many theorists have developed
variations on the biased competition
idea. See, for example, Earl Miller,
2000. The prefrontal cortex and
cognitive control. Nature Reviews:
Neuroscience. 1: 59–65.
�
Mary C. Potter and Ellen Levy E.I.
1969. Recognition memory for a
rapid sequence of pictures. Journal of
Experimental Psychology. 81:
10–15. The technique of rapidly
presenting image sequences is called
RSVP for Rapid Serial Visual .
Visual and Verbal Working Memory 119
CH06-P370896.indd 119CH06-P370896.indd 119 1/23/2008 6:57:07 PM1/23/2008 6:57:07 PM

120
fi xations on diff erent parts of the object to pick out specifi c features, not a
prolonged fi xation.
THINKING IN ACTION: RECEIVING A CUP OF COFFEE To put some fl esh on these rather abstract bones, consider this example of
visual thinking in action. Suppose we are being given a cup of coff ee by a
new acquaintance at a social gathering. Th ere are a number of visual tasks
being executed. Th e most pressing is the hand coordination needed to reach
for and grasp the cup by the handle. Fixation is directed at the handle, and
the handle is one of the objects that makes it into visual working memory.
In this context the meaning of the handle has to do with its graspability and
a link is formed to a motor sequence required to reach for and grasp the
handle. Th e location of the other person ’ s hand is also critical because we
must coordinate our actions with hers and thus some information about the
hand makes it into visual working memory. Th is makes two visual working
memory objects.
Kitchen gist
Motor movement sequence to reach forhandle is activated.
Semantic schemaBeing offered coffee
Gesture of hospitalityBindings
Face objectSmiling
Verbal working memory
"Here's your coffee"
Visual working memory
Motor working memory
Handle objectGraspable
Hand objectCoordinatewith
Our fi xation immediately prior to the present one was directed to the
face of the acquaintance and this information is retained as a third visual
CH06-P370896.indd 120CH06-P370896.indd 120 1/23/2008 6:57:07 PM1/23/2008 6:57:07 PM
working memory object. Face information has links to verbal working
memory, information important for the dialogue we are engaged in. Th e
visual working memory objects also have links to several action plans.
One plan involves the motor sequence required to grasp the handle.
Another plan schedules the next eye movement. Once the handle has
been grasped, the eye will be directed back to the face. Yet another plan is
concerned with the maintenance of the conversation. None of these plans
is very elaborate, very little is held in each of the working memories, but
what is held is exactly what is important for us to carry out this social dia-
logue that includes the receipt of a mug of coff ee. Th e whole thing can be
thought of as a loosely coupled network of temporarily active processes, a
kind of dance of meaning.
ELABORATIONS AND IMPLICATIONS FOR DESIGN We now have the outline of what it means to have a visual object in mind.
Th e remainder of this chapter is devoted to elaborating parts of this the-
ory and discussing some of its implications for design.
MAKE OBJECTS EASY TO IDENTIFY
Th e theory of objects as patterns of patterns means that some objects
will be easier to identify than others. Th e most typical exemplars of an
object class are identifi ed faster because the corresponding visual pat-
terns are more strongly encoded. We will be able to see that a member of
the Labrador breed is a dog faster than we can identify a Daschund or a
Doberman.
Th ere are also views that are more canonical. Th ese include both typi-
cal views and views that show critical relationships between structural
parts. Showing the joints clearly in a structured object will make it easier
to identify that object. Th is can be done by posing the object in such a way
that the joints are clear in the silhouette, as is common in some Egyptian
low-relief carvings. It can also be done by selecting a viewpoint that makes
the critical joints and component parts clear.
To summarize, if we want objects to be rapidly and reliably identifi ed,
they should be typical members of their class and shown from a typical
viewpoint. In addition, for any compound object, connections between
component parts and all critical component parts should be clearly iden-
tifi able as discussed earlier in this chapter.
Elaborations and Implications for Design 121
CH06-P370896.indd 121CH06-P370896.indd 121 1/23/2008 6:57:09 PM1/23/2008 6:57:09 PM

122
NOVELTY Humans have come to dominate the world partly because of our curiosity.
Seeking visual novelty is one of the fundamental abilities of newborns. �
In later life we continue to actively seek novelty, either to exploit it to our
advantage or to avoid it if it presents a danger. Novelty seeking manifests
itself when we are not intensely focused on some cognitive agenda. At
such times people use their free cognitive cycles to scan their environ-
ments, seeking mental stimulation. We are usually not aware that we are
doing this.
Th is provides an opportunity for the advertiser. Because image gist is
processed rapidly, providing an image in an advertisement ensures that
at least some information will be processed on the fi rst glance. Holding
the viewer ’ s attention can be achieved through novelty. One method for
triggering further exploratory cognitive activity is by creating a strong
gist-object confl ict. If a scene with clearly expressed gist is combined with
an object that is incompatible with that gist, the result will be a cognitive
eff ort to resolve the confl ict in some way. Th e advertiser may thereby cap-
ture a few more cognitive cycles.
Gist-object mismatches are easy to create and can be as straightforward
as putting someone in his underwear in a room full of suits, although
This view of a low-relief carving in the Kom Ombo Temple in Egypt has figures arranged so that all their important parts are visible. Hands, feet, heads, and shoulders are all given in stereotyped views. Likewise, the connections between these components are all clear. (Image from Suresh Krishna.)
�
Novelty seeking in babies is so strong
that it has become one of the basic
tools used to understand the perceptual
capacities of the very young. For
example, this method has been used
to show that an understanding of
the persistence of objects seems to be
innate. Babies are most curious about
objects that disappear, or reappear
without cause. They look longer at
novel objects. Elizabeth Spelkey, and
co-workers 1992. Origins of knowledge
Psychological Review. 99, 605-632.
CH06-P370896.indd 122CH06-P370896.indd 122 1/23/2008 6:57:09 PM1/23/2008 6:57:09 PM
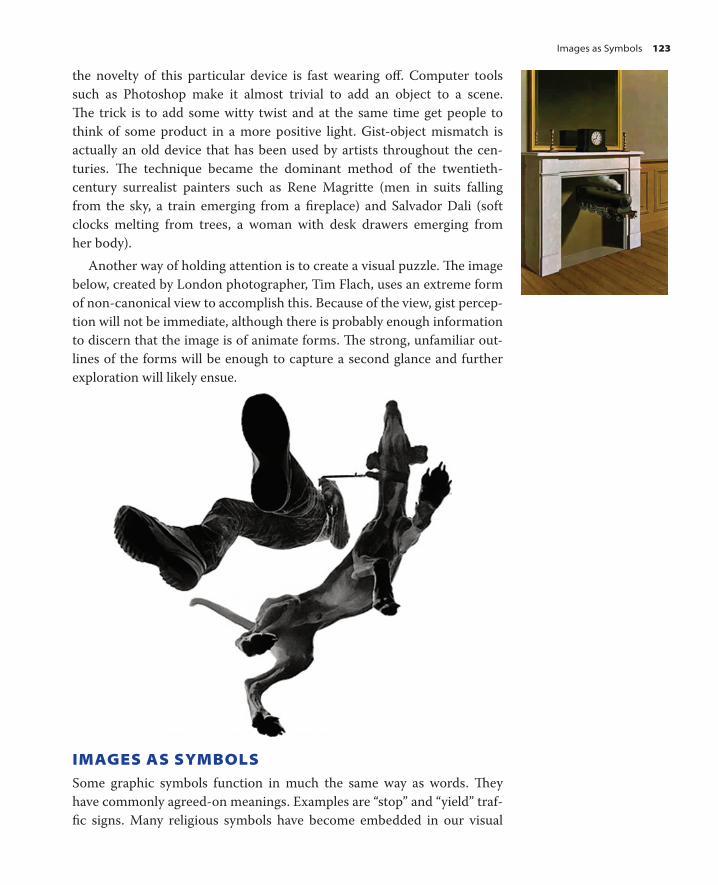
the novelty of this particular device is fast wearing off . Computer tools
such as Photoshop make it almost trivial to add an object to a scene.
Th e trick is to add some witty twist and at the same time get people to
think of some product in a more positive light. Gist-object mismatch is
actually an old device that has been used by artists throughout the cen-
turies. Th e technique became the dominant method of the twentieth-
century surrealist painters such as Rene Magritte (men in suits falling
from the sky, a train emerging from a fi replace) and Salvador Dali (soft
clocks melting from trees, a woman with desk drawers emerging from
her body).
Another way of holding attention is to create a visual puzzle. Th e image
below, created by London photographer, Tim Flach, uses an extreme form
of non-canonical view to accomplish this. Because of the view, gist percep-
tion will not be immediate, although there is probably enough information
to discern that the image is of animate forms. Th e strong, unfamiliar out-
lines of the forms will be enough to capture a second glance and further
exploration will likely ensue.
IMAGES AS SYMBOLS Some graphic symbols function in much the same way as words. Th ey
have commonly agreed-on meanings. Examples are “ stop ” and “ yield ” traf-
fi c signs. Many religious symbols have become embedded in our visual
Images as Symbols 123
CH06-P370896.indd 123CH06-P370896.indd 123 1/23/2008 6:57:12 PM1/23/2008 6:57:12 PM

124
culture. What is important about these symbols is that the visual shapes
have become cognitively bound to a particular non-visual cluster of con-
cepts. Viewing these symbols causes an automatic and rapid activation of
these concepts, although the degree to which this occurs will depend on
the cognitive activity of the moment.
Symbols with the ability to trigger particular associations can have huge
value. Companies often spend vast amounts in getting their symbols to
the state of automatic recognition by a large proportion of the population.
In extreme examples, such as soft drinks manufacturing, the value of the
company is closely linked to the value of the company ’ s symbol. Coca Cola
has been estimated to be worth thirty-three billion dollars. Most of that is
branding. Producing cola for a few cents a bottle is easy. What is diffi cult
is getting people to pay $2.00 for it. Coca Cola ’ s famous trademark itself is
estimated to be worth more than ten billion dollars.
Th ere is a confl ict between the need of advertisers to provide nov-
elty in order to capture the attention of potential buyers and the need
to be consistent to establish a well-defi ned brand image. Companies can
only change a logo at huge cost and with enormous care and planning.
Generally it is much safer to improvise variations on an old symbol than
to establish a new one. Th is allows for attention grabbing novelty, while
maintaining that all-important instant brand recognition.
Th e poster for the movie Walk the Line, advertising a biography of
country and western singer, Johnny Cash, is full of images that function as
symbols. Th e guitar symbolizes that its wearer is a musician. Th e particu-
lar shape of the fi nger plate denotes the country and western style. Th e
fl ames in the background symbolize the personal torment of the singer
and also, a famous Cash song “ Ring of Fire. ” Th e vertical bar symbolizes
the title of another song, also given in words, “ Walk the Line. ” For any-
one already somewhat familiar with the life and work of Johnny Cash, the
poster will automatically trigger these rich layers of meaning.
MEANING AND EMOTION Certain kinds of scenes and objects have strong emotive associations.
Some are universal. Most people have positive associations for cute chil-
dren and animals. But many other images have far more varied individual
associations. For one person an image of a lake might be associated with
good times at the family cottage. For another, the lake might be a foreign
place evoking discomfort, lack of sanitation, and insects.
CH06-P370896.indd 124CH06-P370896.indd 124 1/23/2008 6:57:14 PM1/23/2008 6:57:14 PM

Beyond the most superfi cial level, understanding a communication
requires cognitive eff ort and unless people have strong self-motivation,
information will not be attended to and therefore not processed. Without
some emotional valence many presentations will not be eff ective simply
because the audience will not care. Adding emotive images can turn a dis-
interested audience into an attentive audience.
IMAGERY AND DESIRE Mental imagery often accompanies feelings of desire. Daydreams about
food, sex, material goods, or experiences such as lying on the beach consist,
in large part, of a stream of mental imagery. In a paper entitled “ Imagery,
Relish and Exquisite Torture, ” a group of researchers from the University
Mothers and children have positive associations for almost everyone. Such images can be used to support messages about family values, health care products, or the need for education. (From andipantz/ stockphoto.)
A message about the danger to humpback whales from ship strikes is far more likely to result in actions and donations if accompanied by images such as this. It shows a whale killed by a ship ’ s propeller.
Imagery and Desire 125
CH06-P370896.indd 125CH06-P370896.indd 125 1/23/2008 6:57:16 PM1/23/2008 6:57:16 PM

126
of Queensland in Australia and the University of Sheffi eld in England set
out a theory of how the process works. � Th ey argue that imagery provides
a short-term form of relief for a psychological defi cit. Unfortunately, the
eff ect is short-lived and a heightened sense of defi cit results. Th is leads
to more imagery seeking behavior. Th e eff ect is something like scratching
an itch. At fi rst it helps, but a short time later the itch is worse and more
scratching results. Th e imagery involved can be either internal, purely in
the mind, or external, from magazines or web pages. An important point
is that the process can be started with external imagery. Th eir studies also
suggested a way of getting out of this cycle of imagery-mediated obsession.
Having people carry out cognitive tasks using alternative imagery, unre-
lated to the object of desire, was eff ective in reducing cravings.
CONCLUSION A visual object is a momentary nexus of meaning binding a set of visual
features from the outside world together with stuff we already know.
Perhaps 95% of what we “ see ” from the outside world is already in our
heads. Recognizing an object can cause both physical and cognitive action
patterns to be primed, facilitating future neural activation sequences. Th is
means that seeing an object biases our brain towards particular thought
and action patterns, making them more likely.
Th e name psychologists give to the temporary activation of visual
objects is visual working memory, and visual working memory has a
capacity of between one and three objects depending on their complexity.
Th is means that we can hold one to three nexii of meaning simultaneously,
and this is one of the main bottlenecks in the visual thinking process. A
similar number can be held in verbal working memory and often the two
kinds of objects are bound together. Some objects are constructed and
held only for the duration of a single fi xation. A few objects are held from
fi xation to fi xation but retaining objects reduces what can be picked up in
the next fi xation.
Visual working memory capacity is something that critically infl uences
how well a design works. When we are thinking with the aid of a graphic
image we are constantly picking up a chunk of information, holding it in
working memory, formulating queries, and then relating what is held to a
new information chunk coming in from the display. Th is means that the
navigation costs discussed in the previous chapter are critical. For exam-
ple, suppose a visual comparison is required between two graphic objects;
they might be faces, pictures of houses, or diagrams. We will be much
�
D.J. Kavanagh, J. Andrade and J. May,
2005. Imagery, relish and exquisite
torture: The elaborated intrusion theory
of desire. Psychological Review. 112:
446–467.
CH06-P370896.indd 126CH06-P370896.indd 126 1/23/2008 6:57:19 PM1/23/2008 6:57:19 PM

�
For a thorough review of the evidence
see Joseph B. Hellige ’ s 1993 book,
Hemispheric Asymmetry: What ’ s Right
and What ’ s Left? Harvard University
Press.
better off having them simultaneously on the same page or screen than
having them on diff erent pages. In each case visual working memory
capacity is the same, but we can pick up a chunk or two, then navigate to
a new point of comparison at least ten times faster with eye movements
than we can switch pages (either web pages or book pages), so side-by-
side comparison can be hugely more effi cient.
In this chapter, we have begun to discuss the separation of visual and
verbal processing in the brain. Th is is a good point to comment on a com-
monly held misconception. Th ere is a widely held belief that there are
right-brain people who are more visually creative and left-brain people
who are more verbal and analytic. Th e actual evidence is far more com-
plex. Th ere is indeed some lateral specialization in the brain. Language
functions tend to be concentrated on the left-hand side of the brain, espe-
cially in men. Rapid processing of the locations of objects in space tends
to be done more on the right. But the available evidence suggests that
creativity comes as a result of the interaction between the many subsys-
tems of the brain. � If there is a location for creativity it is in the frontal
lobes of the brain, which provide the highest level of control over these
subsystems.
Conclusion 127
CH06-P370896.indd 127CH06-P370896.indd 127 1/23/2008 6:57:19 PM1/23/2008 6:57:19 PM

129
Visual and Verbal Narrative
Forget about that old cliché, “ A picture is worth a thousand words. ” Try to
express the following in pictures.
If halibut is more than ten euros a kilo at Good Food, go to the fi sh
market on 5th Street.
It is unlikely that it could be done, even if you are capable of drawing a
halibut. Good design is not about pictures versus words. Th e real issues
are as follows. When are images most eff ective? When are words and
other formal symbols most eff ective? If both images and words are used,
how should they be combined?
We begin this discussion by considering sign languages used by deaf
people. It may seem strange that sign languages have much to tell us about
the fundamental nature of language, but thinking about them enables
us to make clear distinctions about what is best expressed through words
and images and diagrams. Sign language also gives us an incontestable
CH07-P370896.indd 129CH07-P370896.indd 129 1/24/2008 4:34:42 PM1/24/2008 4:34:42 PM

130
example of something that actually is a visual language, so we know what
one looks like.
It is easy to assume that sign languages were invented by hearing people as
ways of translating spoken languages, like English and French, into something
the deaf could easily understand. In fact, nothing could be further from the
truth. Sign languages were invented by deaf people. Mostly they arose spon-
taneously in the nineteenth century when previously isolated deaf children
came together in schools that were created by philanthropists. Sign languages
were developed by the students in those schools, not the teachers. Indeed, up
until the 1980s many schools for the deaf actually prohibited signing because
they believed that lip reading would better help integrate the pupils into soci-
ety at large. Th e attempt to suppress sign language was the cause of consid-
erable suff ering since signing provides the deaf with a means of expression
comparable in richness and expressive power to spoken language. �
Sign languages are not translations of spoken languages. Th ey are dis-
tinct languages with their own grammar and vocabularies. American Sign
Language (ASL) is quite distinct from British Sign Language (BSL) and
neither has the grammar of spoken English. New sign languages are still
being born. In Nicaragua, linguists have watched, fascinated, as a new sign
language has emerged over the past thirty years. Th is began to develop
with the establishment of a center for special education in 1977. It has
rapidly developed its own grammatical rules, demonstrating, among other
things, that language is an innate capability of humans. �
Although sign languages are gestural and not verbal, there are great simi-
larities between the two forms. Both sign language and spoken language have
a critical period of development. If children are not provided with the social
environment for their language skills to develop in the fi rst few years of life
they will never develop fl uency. Children who have grown up with animals,
enfants sauvage , never develop fl uency because the critical period is missed.
Th e parts of the brain used in the understanding and production of sign
languages are the same areas used in verbal language listening and talking—
namely Wernicke ’ s area and Broca ’ s area respectively. Sign language uses
the neural sub-systems normally associated with verbal processing, even
though signs must pass through the visual pattern-fi nding machinery of
the brain to get to these areas.
VISUAL THINKING VERSUS LANGUAGEBASED THINKING We need a clear way of distinguishing between the visual thinking that
goes with graphic expression, and other forms of thinking, especially
�
In his book on the history of sign
language in America, Douglas Baynton
describes how signing was banned in
schools for the deaf in favor of speaking
and lip reading, using techniques
pioneered by Alexander Graham Bell.
1996. See Forbidden Signs: American
Culture and the Campaign Against Sign
Language. University of Chicago Press.
�
For more on sign languages read
Karen Emmorey ’ s Language, Cognition,
and the Brain: Insights from Sign
Language Research , Mahwah,
N.J: Erlbaum, 2002.
CH07-P370896.indd 130CH07-P370896.indd 130 1/24/2008 4:34:43 PM1/24/2008 4:34:43 PM
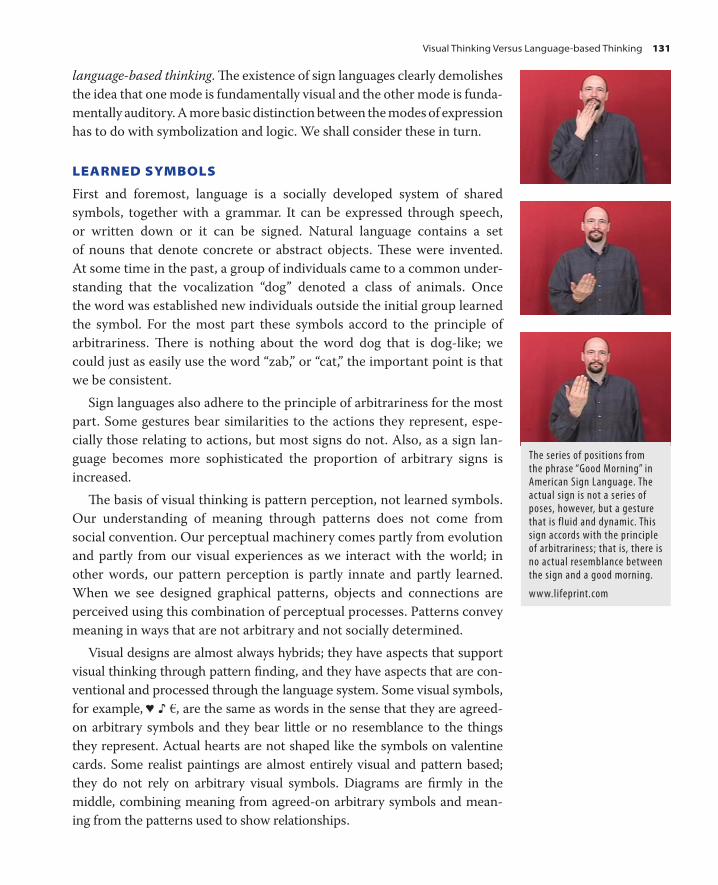
language-based thinking . Th e existence of sign languages clearly demolishes
the idea that one mode is fundamentally visual and the other mode is funda-
mentally auditory. A more basic distinction between the modes of expression
has to do with symbolization and logic. We shall consider these in turn.
LEARNED SYMBOLS
First and foremost, language is a socially developed system of shared
symbols, together with a grammar. It can be expressed through speech,
or written down or it can be signed. Natural language contains a set
of nouns that denote concrete or abstract objects. Th ese were invented.
At some time in the past, a group of individuals came to a common under-
standing that the vocalization “ dog ” denoted a class of animals. Once
the word was established new individuals outside the initial group learned
the symbol. For the most part these symbols accord to the principle of
arbitrariness. Th ere is nothing about the word dog that is dog-like; we
could just as easily use the word “ zab, ” or “ cat, ” the important point is that
we be consistent.
Sign languages also adhere to the principle of arbitrariness for the most
part. Some gestures bear similarities to the actions they represent, espe-
cially those relating to actions, but most signs do not. Also, as a sign lan-
guage becomes more sophisticated the proportion of arbitrary signs is
increased.
Th e basis of visual thinking is pattern perception, not learned symbols.
Our understanding of meaning through patterns does not come from
social convention. Our perceptual machinery comes partly from evolution
and partly from our visual experiences as we interact with the world; in
other words, our pattern perception is partly innate and partly learned.
When we see designed graphical patterns, objects and connections are
perceived using this combination of perceptual processes. Patterns convey
meaning in ways that are not arbitrary and not socially determined.
Visual designs are almost always hybrids; they have aspects that support
visual thinking through pattern fi nding, and they have aspects that are con-
ventional and processed through the language system. Some visual symbols,
for example, , are the same as words in the sense that they are agreed-
on arbitrary symbols and they bear little or no resemblance to the things
they represent. Actual hearts are not shaped like the symbols on valentine
cards. Some realist paintings are almost entirely visual and pattern based;
they do not rely on arbitrary visual symbols. Diagrams are fi rmly in the
middle, combining meaning from agreed-on arbitrary symbols and mean-
ing from the patterns used to show relationships.
The series of positions from the phrase “ Good Morning ” in American Sign Language. The actual sign is not a series of poses, however, but a gesture that is fluid and dynamic. This sign accords with the principle of arbitrariness; that is, there is no actual resemblance between the sign and a good morning.
www.lifeprint.com
Visual Thinking Versus Language-based Thinking 131
CH07-P370896.indd 131CH07-P370896.indd 131 1/24/2008 4:34:43 PM1/24/2008 4:34:43 PM

132
GRAMMAR AND LOGIC
Natural language, whether it is sign language or spoken language, incor-
porates a form of logic that is quite distinct from the logic of visual rep-
resentation. Natural language is full of qualifi ers such as “ if, ” “ and, ” “ but, ”
“ otherwise, ” “ nevertheless, ” and “ while. ” Th is is not formal mathematical
logic, but it does allow for a kind of abstract reasoning. Such terms enable
us to give conditional instructions to people, such as the directions to buy
halibut with which we started this chapter. Th e most widely used com-
puter programming languages are based on natural language. Statements
beginning with “ while, ” “ if, ” and “ else ” provide their basic structure and
this is why entry-level programming is easy to learn.
Th ere have been many attempts to make graphical computer program-
ming language alternatives to written languages. Th ese have mostly failed,
sometimes spectacularly. In the 1980s, a diagramming technique called the
fl owchart was mandated for large commercial software projects. It used
symbols to express programming logic for “ if ” and “ while ” statements. An
alternative technique called pseudo-code has proven to be a much better
way of expressing computer code in a more readable form. Pseudo-code
provides an explicit bridge between natural language and computer code;
in pseudo-code “ if ” and “ while ” statements are used much in the same
way as they are in natural language. Th e following program counts how
many large eggs and small eggs there are in a batch. It is shown using both
a fl owchart and pseudo-code to illustrate the diff erences.
while(more eggs){
if (egg greater than 50 gm) add 1 to largeEggCountelse add 1 to smallEggCount
}
largeEggCount � 0;
smallEggCount � 0;
more eggs?
egg �50gm?
y
nend
get egg
add 1 to largeEggCount
add 1 to smallEggCount
get egg;
largeEggCount � 0; smallEggCount � 0;
Flowchart Pseudocode
n
y
Notice that although the fl owchart is called a visual language it con-
tains almost as many words as the pseudo-code. Th e critical diff erence
is that the diamond-shaped symbols are used to represent program logic
CH07-P370896.indd 132CH07-P370896.indd 132 1/24/2008 4:34:44 PM1/24/2008 4:34:44 PM

in the fl owchart, whereas pseudo-code uses a form similar to the natural
language sentence, “ If an egg is greater than 50 gm then add 1 to the large
egg count, otherwise add 1 to the small egg count. ”
Flowcharts were a very expensive mistake. Hundreds of thousands of
dollars were spent documenting computer programs in this way, only
for the results to languish on shelves never to be consulted. It turned out
that it was easier to read a pseudo-code description, or even the program
logic itself, than the fl owchart. Flowcharts now stand as a reminder of the
limitations of visual representation. Th ere are some things that words do
much better.
Visual representations can incorporate a kind of logic, but it is very
diff erent from the more abstract logic of natural language. Visual logic
is the logic of pattern, object, and space that was discussed in Chapters 3,
5, and 6.
COMPARING AND CONTRASTING THE VERBAL AND WRITTEN MODES Let ’ s summarize and compare the relative strengths of verbal and visual
media. Verbal, sign, and written language provides a socially designed tool
for communication. Th e symbols and grammar are shared by hundreds of
millions of people in the case of the most common languages. Verbal, sign,
and written languages use the same specialized areas of the brain for pro-
cessing this information. What many people refer to as “ thought, ” the kind
of inner dialogue whereby people plan for the future and rehearse con-
versations with others, is mostly a form of internalized speech, sometimes
called mentalese . Th is internalized language form shares the kind of rough
and ready logic that comes from specialized conditional operators such
as “ if, ” “ and, ” “ but, ” “ maybe, ” and “ perhaps. ” Th ese enable people to reason
about consequences of action in ways that are very fl exible.
Visual representations of information are processed by the visual sys-
tem. Th is is an extremely powerful pattern fi nding system, which is very
good at fi nding structure in diagrams. Its logic is very diff erent from verbal
logic and consists mostly of structural relationships, such as those shown
below.
As the diagram on the following page shows, the graphic expressions
of the various kinds of structural relationships work well when radically
simplifi ed and each has a corresponding verbal expression, so it cannot
be claimed that this form of expression is uniquely graphic. Nevertheless,
Comparing and Contrasting the Verbal and Written Modes 133
CH07-P370896.indd 133CH07-P370896.indd 133 1/24/2008 4:34:45 PM1/24/2008 4:34:45 PM

134
when multiple relations are combined in a diagram the graphical form can
be far more succinct and easier to reason with.
A is inside B
A passes through B
A is on top of B
A is connected to B
Almost all graphic designs are hybrids of the visual and language modes
of expression and the amount of each should depend on what is to be con-
veyed. Words, images, and spatial patterns should be used for what they
express best. In most cases images do not make good labels, and describing
complex patterns of relationships with words is confusing. In the follow-
ing example the structure of a small company is described in two ways,
by diagram and by words. Both contain roughly the same information.
Helen: President
Mark
David Omar
Fan
Art Department Marketing
Edgy Media
Emma Paul
Project X
Kelley
Helen is the president of the Edgy Media company. Mark, Emma, Paul, and Kelley work in the art department. Mark is manager of the art department. Fan, David, and Omar work in Marketing. Fan is manager of the Marketing department. Mark, Paul, Kelly, and David all work on Project X.
CH07-P370896.indd 134CH07-P370896.indd 134 1/24/2008 4:34:45 PM1/24/2008 4:34:45 PM

It is diffi cult to get an overall understanding of the Edgy Media com-
pany structure from the verbal description, but with the diagram a number
of structural relationships become immediately evident; for example, that
the company personnel structure is a three-level hierarchy. It is also much
easier to carry out simple reasoning tasks with the aid of the diagram.
Questions such as “ Who is the most senior person working on Project X? ” ,
“ Which department has the most people working on Project X?, ” and
“ Who does Fan report to? ” can all be addressed with simple visual queries.
LINKING WORDS AND IMAGES THROUGH DIEXIS Even before she can speak an infant can communicate by pointing. A
reaching gesture can be interpreted as “ give me that. ” Add some facial
expression, indicating interest or dislike, and the gesture becomes modi-
fi ed, “ that scares me ” or “ what is that? ”
Later in life, pointing is still an important part of communication, espe-
cially when it is necessary to link visual and verbal information. Phrases
like “ look at that one, ” “ put it over there, ” and “ it ’ s here ” gain their mean-
ing through the linking of objects to speech by gestures such as pointing.
Actions that provide the subject or object of a spoken sentence by direct-
ing attention to objects in the world are called deictic gestures .
Richard Bolt of the MIT Media Lab captured this concept succinctly
with the phrase, “ put that there ” . � Th is phrase is uttered with two point-
ing gestures. Th e fi rst denotes the object to be moved and the second
denotes the intended location. What is special about this sentence is that
the words “ that ” and “ there ” gain their referents only by being combined
with pointing.
Deictic gestures can be accomplished in many more ways than pointing
with a fi nger. Th e direction of someone ’ s gaze, or how he orients his body,
can also serve to denote the subject of an utterance.
� R.A. Bolt. 1980. Put-that-there:
voice and gesture at the graphics
interface. Proceedings of the 7th Annual
Conference on Computer Graphics and
Interactive Techniques. SIGGRAPH.
262–270.
Linking Words and Images Through Diexis 135
CH07-P370896.indd 135CH07-P370896.indd 135 1/24/2008 4:34:46 PM1/24/2008 4:34:46 PM
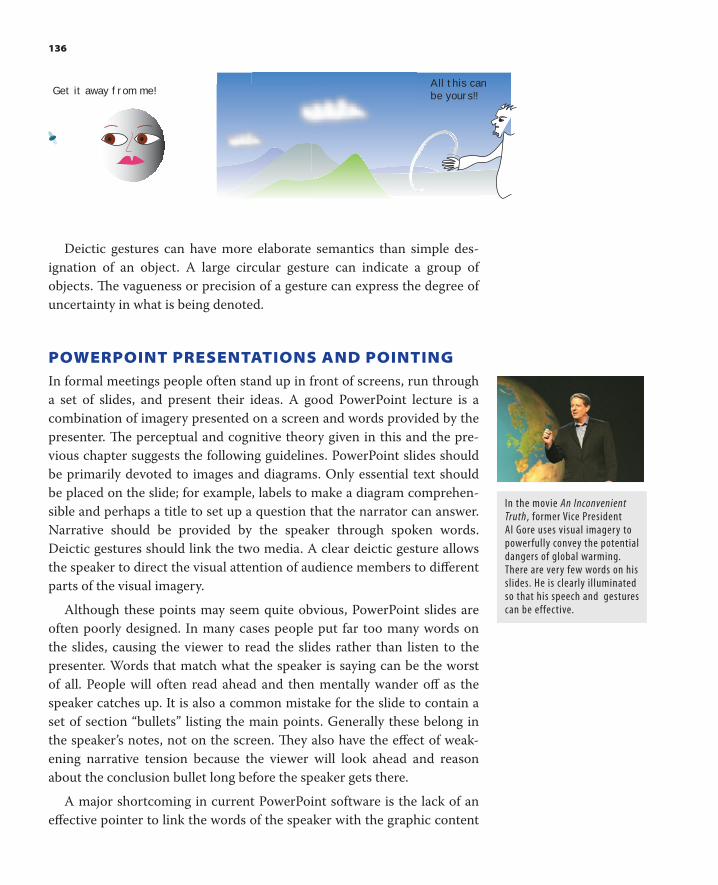
136
Get it away from me!All this can be yours!!
Deictic gestures can have more elaborate semantics than simple des-
ignation of an object. A large circular gesture can indicate a group of
objects. Th e vagueness or precision of a gesture can express the degree of
uncertainty in what is being denoted.
POWERPOINT PRESENTATIONS AND POINTING In formal meetings people often stand up in front of screens, run through
a set of slides, and present their ideas. A good PowerPoint lecture is a
combination of imagery presented on a screen and words provided by the
presenter. Th e perceptual and cognitive theory given in this and the pre-
vious chapter suggests the following guidelines. PowerPoint slides should
be primarily devoted to images and diagrams. Only essential text should
be placed on the slide; for example, labels to make a diagram comprehen-
sible and perhaps a title to set up a question that the narrator can answer.
Narrative should be provided by the speaker through spoken words.
Deictic gestures should link the two media. A clear deictic gesture allows
the speaker to direct the visual attention of audience members to diff erent
parts of the visual imagery.
Although these points may seem quite obvious, PowerPoint slides are
often poorly designed. In many cases people put far too many words on
the slides, causing the viewer to read the slides rather than listen to the
presenter. Words that match what the speaker is saying can be the worst
of all. People will often read ahead and then mentally wander off as the
speaker catches up. It is also a common mistake for the slide to contain a
set of section “ bullets ” listing the main points. Generally these belong in
the speaker’s notes, not on the screen. Th ey also have the eff ect of weak-
ening narrative tension because the viewer will look ahead and reason
about the conclusion bullet long before the speaker gets there.
A major shortcoming in current PowerPoint software is the lack of an
eff ective pointer to link the words of the speaker with the graphic content
In the movie An Inconvenient Truth , former Vice President Al Gore uses visual imagery to powerfully convey the potential dangers of global warming. There are very few words on his slides. He is clearly illuminated so that his speech and gestures can be effective.
CH07-P370896.indd 136CH07-P370896.indd 136 1/24/2008 4:34:47 PM1/24/2008 4:34:47 PM

of the screen. Th e mouse cursor is one option, but it is too small to be
clearly visible. Another option is the laser pointer, but laser spots are also
too small and the devices amplify hand tremor, which is distracting.
To realize the full value of PowerPoint presentations good support for
diexis is essential. What is needed is a bold on-screen non-jittery pointer
to link the screen images with the words of the speaker.
Gestures are an important part of communication and there should
be light on the speaker so that his or her gestures are clear. Unfortunately
this, too, is usually lacking. Most lecture rooms are dimmed to make the
slides clear and there is no provision to illuminate the speaker.
MIRROR NEURONS: COPYCAT CELLS In the early 1990s, an Italian team of researchers, led by Giacomo Rizzolatti,
made a discovery that relates to one of the most fundamental cognitive
capacities we have. � He was carrying out a study of the motor cortex of a
monkey and had inserted a tiny micro electrode into a neuron in its motor
cortex. Th is neuron, like others in the same region of the brain, sent out
electrical signals whenever the monkey reached out to move an object.
Th e experiment was proceeding much as usual when something
remarkable happened. A graduate student had entered the lab eating an
ice cream cone. Th is got the monkey ’ s attention and when the student
raised the cone to his lips, the monkey ’ s neuron responded just as it had
when it moved its own hands.
Th is event marked the discovery of mirror neurons that have since
been discovered in many areas of the brain. Mirror neurons exhibit
activation in the same neural pathways that would normally be used to
execute a particular action. Th us they provide a basis for learning by imi-
tation. Th ey have been found in many primates and evidence suggests that
they are especially prevalent in humans. Th ey have been called empathy
neurons because they may allow us to read the emotions of others through
the same pathways that generate our own facial expressions when we are
expressing emotions. �
Mirror neurons support a pre-language form of communication that
maps action onto action. Th ey probably provide the basis of a “ gut feeling ”
level of empathic communication. Indeed, some scientists speculate that
the mirror neuron system may be critical to the complex social structure
maintained by humans. Mirror neurons support a relatively unsophisti-
cated non-symbolic moment-to-moment form of communication. We
now turn our attention to the much more complex forms of communica-
tion that are involved in storytelling.
�
G. Rizzolatti and L. Craighero. 2004.
Annual Review of Neuroscience . 27:
169–192.
�
According to the research of
psychologist Paul Ekman there are
seven basic and universal facial
expressions expressing emotion:
anger, sadness, fear, surprise, disgust,
contempt, and happiness. P. Ekman.
2003. Emotions Revealed. Recognizing
Faces and Feelings to Improve
Communication and Emotional Life.
Times Books, New York.
Mirror Neurons: Copycat Cells 137
CH07-P370896.indd 137CH07-P370896.indd 137 1/24/2008 4:34:48 PM1/24/2008 4:34:48 PM

138
We may feel the emotions of others via our own facial muscles through the mediation of mirror neurons. These illustrations of anger, fear, joy,
and sadness are from Gary Faigin, The Artist ’ s Complete Guide to Facial Expression. Watson Guptill Publications. New York, 1990.
VISUAL NARRATIVE: CAPTURING THE COGNITIVE THREAD Th e purpose of narrative, whether it is visual or verbal, is to capture the
cognitive thread of the audience. Th e cognitive thread is the sequence of
concepts that are held actively in visual and verbal working memories,
together with the links between them. � If a movie or presentation is suc-
cessful, the cognitive thread of audience members will roughly follow the
narrative thread that the author has designed. Th is means that designing
for narrative is very diff erent from designing for information seeking.
Information seekers have highly individual cognitive threads that are
shaped moment-to-moment by the specifi c demands of the cognitive pro-
cess of solving a problem. Th is process is internally driven. Conversely, the
audience of a narrative presentation will, if they are attending, have cogni-
tive threads that are much more similar to each other, although still far
from identical because of the variety of their prior experiences. A profes-
sional fi lm critic and a regular movie fan will see many things diff erently
in a movie, but in each frame they both will look mostly at the same visual
objects in the same order and this will result in many of the same concepts
being activated in the same order.
Th e broad framework around which narratives are built has three com-
ponents: establishing a problem, elaborating a problem, and resolving a
problem. Th e kind of problem and the nature of its resolution depend on
the genre. In a mystery thriller, fi nding a murderer is often the problem.
A lecture about science will generally have some unsolved puzzle about the
nature of the world as the problem. In a business presentation the prob-
lem may be opening up a new market for a particular type of product.
Th is pattern of setting up, elaborating, and resolving is repeated at
many levels in a narrative. Th e same pattern can be found in a single short
� We are using the term concept here to
refer to a temporary nexus of meaning,
as described in the previous chapter.
CH07-P370896.indd 138CH07-P370896.indd 138 1/24/2008 4:34:48 PM1/24/2008 4:34:48 PM

dialogue as well as longer episodes. It makes the audience seek for cogni-
tive resolution and this provides the motivation for sustained attention.
As we shall see in this chapter narrative can be carried either visually or
through verbal language.
Q & A PATTERNS
An example of short time scale visual narrative is the question and answer
(Q & A) pattern used in cinematography. In his book on cinematography
Steven Katz discusses the three-shot sequence as a method for accomplish-
ing narrative tension on a small scale. He calls these Q & A patterns. Th e
fi rst two shots provide seemingly unrelated information and this leads the
viewer to question the connection between these ideas. Th e third shot
then provides the link and the resolution. �
A simple example has become a cinematic cliché. First we see a woman
walking along a street towards the right side of the screen; she is carrying
a pile of parcels. Because the camera follows her our eyes follow her. Next
we follow a man also walking along a street. He is moving quickly towards
the left side of the screen. In the third shot, the two collide and the par-
cels spill on the sidewalk. Th is provides the resolution of the three-shot
sequence, but opens up a new question: what will be the future relation-
ship of these two people?
FRAMING
At the most basic level the main task for the author of visual narrative is
to capture and control what the audience is looking at, and hence attend-
ing to, from moment to moment. Part of this is done simply by carefully
framing each shot and by designing the transitions between shots so that
intended object attention becomes inescapable. Cinematographers have
worked out how to do this with great precision.
Th e camera frame itself is a powerful device for controlling attention.
Anything outside of it cannot be visually attended and so framing a scene
divides the world into the class of objects that can be attended and those
that cannot. Within the frame objects can be arranged to bias attention.
Having the critical objects or people at the center of the screen, having the
camera follow a moving object, or having only the critical objects in focus
are all methods for increasing the likelihood that we will attend according
to the cinematographer ’ s plans.
Cinematographers pay great attention to the background of a shot.
Anything that is visually distinctive, but irrelevant, is like an invitation to
viewers to switch their attention to that item and away from the narrative
thread. One mechanism for making the background less likely to attract
�
Most of the points relating to
cinematography come from a book by
S.D. Katz. 1991. Film Directing Shot by
Shot: Visualizing from Concept to the
Screen. Michael Weiss Productions and
Focal Press.
Visual Narrative: Capturing the Cognitive Thread 139
CH07-P370896.indd 139CH07-P370896.indd 139 1/24/2008 4:34:50 PM1/24/2008 4:34:50 PM
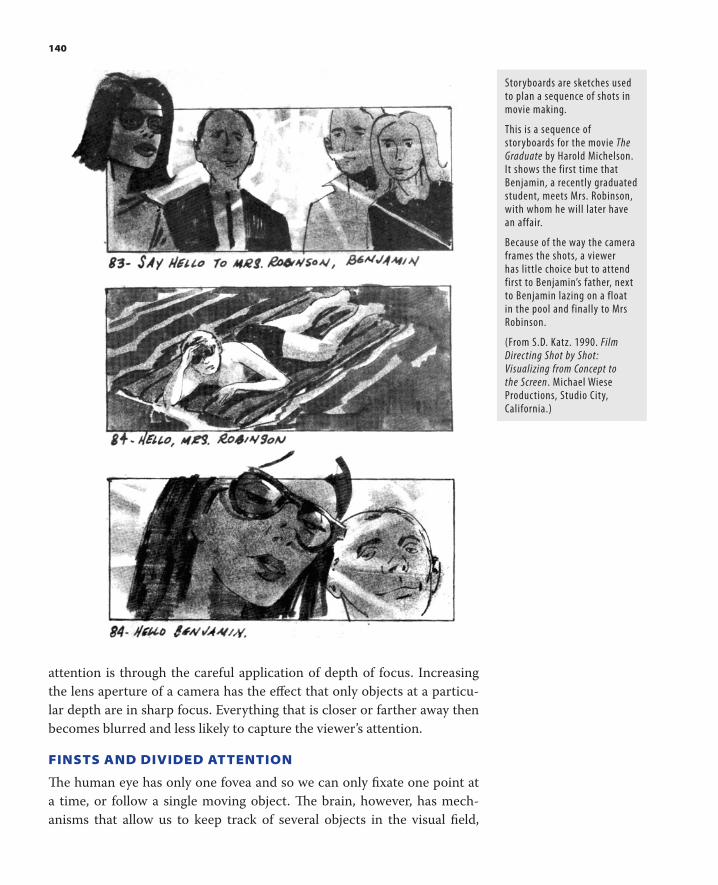
140
attention is through the careful application of depth of focus. Increasing
the lens aperture of a camera has the eff ect that only objects at a particu-
lar depth are in sharp focus. Everything that is closer or farther away then
becomes blurred and less likely to capture the viewer ’ s attention.
FINSTS AND DIVIDED ATTENTION
Th e human eye has only one fovea and so we can only fi xate one point at
a time, or follow a single moving object. Th e brain, however, has mech-
anisms that allow us to keep track of several objects in the visual fi eld,
Storyboards are sketches used to plan a sequence of shots in movie making.
This is a sequence of storyboards for the movie The Graduate by Harold Michelson. It shows the first time that Benjamin, a recently graduated student, meets Mrs. Robinson, with whom he will later have an affair.
Because of the way the camera frames the shots, a viewer has little choice but to attend first to Benjamin ’ s father, next to Benjamin lazing on a float in the pool and finally to Mrs Robinson.
(From S.D. Katz. 1990. Film Directing Shot by Shot: Visualizing from Concept to the Screen. Michael Wiese Productions, Studio City, California.)
CH07-P370896.indd 140CH07-P370896.indd 140 1/24/2008 4:34:50 PM1/24/2008 4:34:50 PM
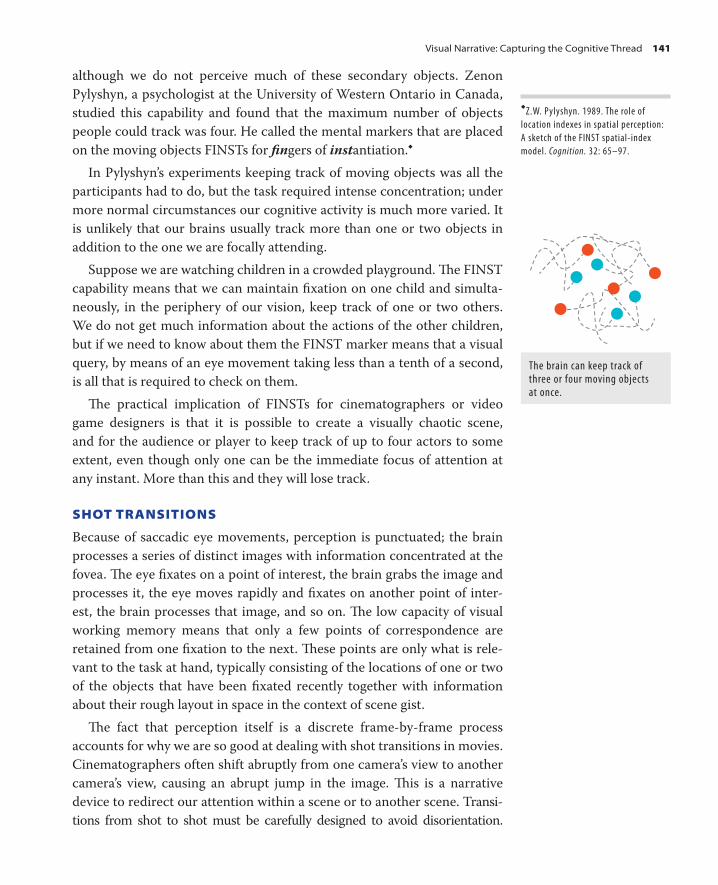
although we do not perceive much of these secondary objects. Zenon
Pylyshyn, a psychologist at the University of Western Ontario in Canada,
studied this capability and found that the maximum number of objects
people could track was four. He called the mental markers that are placed
on the moving objects FINSTs for fi n gers of inst antiation. �
In Pylyshyn ’ s experiments keeping track of moving objects was all the
participants had to do, but the task required intense concentration; under
more normal circumstances our cognitive activity is much more varied. It
is unlikely that our brains usually track more than one or two objects in
addition to the one we are focally attending.
Suppose we are watching children in a crowded playground. Th e FINST
capability means that we can maintain fi xation on one child and simulta-
neously, in the periphery of our vision, keep track of one or two others.
We do not get much information about the actions of the other children,
but if we need to know about them the FINST marker means that a visual
query, by means of an eye movement taking less than a tenth of a second,
is all that is required to check on them.
Th e practical implication of FINSTs for cinematographers or video
game designers is that it is possible to create a visually chaotic scene,
and for the audience or player to keep track of up to four actors to some
extent, even though only one can be the immediate focus of attention at
any instant. More than this and they will lose track.
SHOT TRANSITIONS
Because of saccadic eye movements, perception is punctuated; the brain
processes a series of distinct images with information concentrated at the
fovea. Th e eye fi xates on a point of interest, the brain grabs the image and
processes it, the eye moves rapidly and fi xates on another point of inter-
est, the brain processes that image, and so on. Th e low capacity of visual
working memory means that only a few points of correspondence are
retained from one fi xation to the next. Th ese points are only what is rele-
vant to the task at hand, typically consisting of the locations of one or two
of the objects that have been fi xated recently together with information
about their rough layout in space in the context of scene gist.
Th e fact that perception itself is a discrete frame-by-frame process
accounts for why we are so good at dealing with shot transitions in movies.
Cinematographers often shift abruptly from one camera ’ s view to another
camera ’ s view, causing an abrupt jump in the image. Th is is a narrative
device to redirect our attention within a scene or to another scene. Transi-
tions from shot to shot must be carefully designed to avoid disorientation.
�
Z.W. Pylyshyn. 1989. The role of
location indexes in spatial perception:
A sketch of the FINST spatial-index
model. Cognition. 32: 65–97.
The brain can keep track of three or four moving objects at once.
Visual Narrative: Capturing the Cognitive Thread 141
CH07-P370896.indd 141CH07-P370896.indd 141 1/24/2008 4:34:54 PM1/24/2008 4:34:54 PM

142
Th e visual continuity of ideas can be as useful and eff ective as the verbal
continuity of ideas. One common technique is the establishing shot, fol-
lowed by the focus shot. For example, from a distance we see a character
on the street, talking to another person. Th en we switch to a closer image
of the two people and hear their dialogue. Th e fi rst establishing shot pro-
vides gist, and the layout of objects that will later be the target of several
focal shots. Manuals for cinematographers such as the Katz book provide
detailed catalogues of various shot transitions. Th ese can all be regarded
as devices for manipulating the cognitive thread of the audience. If shot
transitions are done well, most members of the audience will look at the
same objects in the same sequence.
CARTOONS AND NARRATIVE DIAGRAMS Strip cartoons are a form of visual narrative that have much in common
with movies. Th ey substitute printed words for spoken words, and they
substitute a series of still images for moving pictures. Like movie shot
transitions, the frames of a cartoon strip rely on the brain ’ s ability to make
sense of a series of discrete images. Although there are enormous dif-
ferences in the visual style of a cartoon strip compared to a Hollywood
movie, it is remarkable how similar they are cognitively.
Th e lack of real motion in a cartoon strip frame is compensated for by
the use of action lines. Th ese are graphical strokes that show movement
pathways. In one respect action lines are arbitrary symbols; real objects do
not have lines trailing them when they move. In another respect, they are
not arbitrary because they explicitly show the recent history of an object,
and by extrapolation, the immediate future.
Short-term prediction is one of the most important functions of the
brain. In a sense, the brain is constantly making predictions about the
state of the world that will follow from actions such as eye or hand move-
ments. When the state of the world is not as expected, neural alarm bells
go off or, in the words of computer science, exceptions are triggered. � Th is
short-term prediction can be thought of in terms of pattern processing.
Th e patterns that are picked up at various levels of the visual system have
a temporal dimension as well as a spatial dimension. Once a temporal pat-
tern is detected by a set of neurons the abrupt cessation of that pattern will
trigger an exception. For example, one of the most basic temporal patterns
is the assumption of object persistence discussed in the previous chapter.
When an object marked by a FINST disappears, an exception is triggered
and a shift of attention will likely ensue. It is remarkable that the simple
forms of cartoon action lines can capture and express this basic function;
�
In his book, On Intelligence (Time
Books, 2004 ) , Jeff Hawkins argues that
prediction is a fundamental operation
found universally in brain structures.
When temporal patterns fail to play
out, special exception signals are
triggered to be handled by higher level
processing units.
CH07-P370896.indd 142CH07-P370896.indd 142 1/24/2008 4:34:54 PM1/24/2008 4:34:54 PM

the ball seen in the static illustrations shown opposite is projected forwards
in time, like a ball that we see in the real world. In a subsequent frame we
would expect these moving objects to continue their motion paths.
Another form of narrative can be found in assembly diagrams. Certain
purchases like shelving and playground toys often come disassembled.
Assembly instructions have the classic form of a narrative in that a prob-
lem is posed (assembling something), elaborated (the detailed steps), and
hopefully resolved (the fully assembled object).
A group of researchers at Stanford University led by Barbara Tversky
studied the cognitive process involved in following assembly instructions. �
Th ey measured how successful people were at assembling furniture using a
variety of diagrammatic instruction styles. As the result of a series of such
studies, they developed a set of cognitive principles for assembly instruc-
tions together with exemplary sequences of diagrams. Th e main principles
were as follows.
• A clear sequence of operations should be evident to maintain the
narrative sequence. Th is might be accomplished with a cartoon-like
series of frames, each showing a major step in the assembly.
• Components should be clearly visible and identifi able in the
diagrams. Th is is largely a matter of clear illustration. It is important
to choose a viewpoint from which all components are visible.
With more complex objects a transparent representation of some
components may help accomplish this goal.
• Th e spatial layout of components should be consistent from
one frame to the next. It is easier cognitively to maintain the
correspondence between parts in one diagram frame and the next if a
consistent view is used.
• Actions should be illustrated along with connections between
components. Diagrams that showed the actions involved in assembly,
rather than simply the three-dimensional layout of the parts, were
much more eff ective. Arrows were used to show the placement of
parts and dotted lines to show the addition of fasteners.
On the right is an example of a set of graphic instructions they produced
according to their principles. People did better with these than with the
manufacturer ’ s instructions.
One might think that the narrative assembly diagram is a somewhat
impoverished version of instructions that could be better presented using
a videotape showing someone assembling the furniture correctly. Th is is
not the case. Th e advantage of the narrative diagram is that it supports two
�
J. Heiser, D. Phan, D. Agrawala,
B. Tversky and P. Hanrahan. 2004.
Identification and Validation of
Cognitive Design Principles for
Automated Generation of Assembly
Instructions. Advance Visual Interfaces.
Cartoons and Narrative Diagrams 143
CH07-P370896.indd 143CH07-P370896.indd 143 1/24/2008 4:34:54 PM1/24/2008 4:34:54 PM

144
diff erent cognitive strategies. It supports the strategy of narrative, where the
audience is taken through a series of cognitive steps in a particular order. It
also supports a freer information-gathering exploratory strategy, where the
person using the diagram constructs and tests hypotheses about which part
is which and how they fi t together. With this strategy the diagram user may
look at parts of the diagram at any time and in any order. A video presenta-
tion is less eff ective in supporting information gathering because navigating
through time in a video sequence is much more diffi cult than simply look-
ing at diff erent parts of a diagram sequence. Th e multiframe pictorial narra-
tive is an important form because it supports both cognitive styles.
SINGLEFRAME NARRATIVES
Some single-frame diagrams are designed to perform a narrative function;
they lead the interpreter through a series of cognitive steps in a particular
order. One example is given below in the form a poster designed by R.G.
Franklin and R.J.W. Turner (Reproduced with permission of the Minister
of Public Works and Government Services Canada, 2007 and courtesy of
CH07-P370896.indd 144CH07-P370896.indd 144 1/24/2008 4:34:56 PM1/24/2008 4:34:56 PM
Natural Resources Canada, Geological Survey of Canada. http://geoscape.
nrcan.gc.cal). Its goals are to educate the public on the way water is used
in a modern house and to encourage conservation.
Th e narrative thread in this diagram is less demanding than in the multi-
frame cartoon strip; nevertheless, the intention that the ideas be explored in
a particular order is expressed by the sequence of arrows connecting the dif-
ferent major components.
CONCLUSION We began this chapter by discussing the fundamental diff erences between
visual and linguistic forms of expression. Linguistic forms of expression are
characterized by the use of a rich set of socially invented arbitrary symbols
as well as a form of logic exemplifi ed by the “ ifs, ” “ ands, ” and “ buts ” of natu-
ral language. Th e grammar of visual representation is quite diff erent having
to do with pattern relationships such as “ connected to, ” “ inside, ” “ outside, ”
or “ part of. ” Th is means that certain kinds of logic are best left to verbal or
written language.
Narrative, however, can be carried either through language or purely
visual techniques or both. Th is is because narrative is about leading the
attention of an audience and this can be achieved through either modal-
ity, although what can be expressed within a narrative is very diff erent
depending on which one is used. Language can convey complex logi-
cal relationships between abstract ideas and support conditional actions.
Visual media can support the perception of almost instantaneous scene
gist, rapid explorations of spatial structure and relationships between
objects, as well as emotions and motivations. Both can maintain and hold
the thread of audience attention, which is the essence of narrative.
One of the fi rst choices to be made when designing a visual communi-
cation is the desired strength of the narrative form. Movies and animated
cartoons are the strongest visual narrative forms because they exert the
most control over serial attention to visual objects and actions. Graphic
cartoons can also provide narrative but exert an intermediate-level control
over the cognitive thread; cartoon frames are intended to be perceived in
a particular order but allow for random access. Diagrams of various kinds
as well as pictures and photographs are capable of conveying some sense
of narrative, although this is less than movies and cartoon strips. Usually
the viewer must actively discover the narrative in a diagram of still images,
unlike the inescapable narrative train of a movie.
Conclusion 145
CH07-P370896.indd 145CH07-P370896.indd 145 1/24/2008 4:35:03 PM1/24/2008 4:35:03 PM

147
Creative Meta-seeing
When Michelangelo planned the frescoes for the Sistine Chapel ceiling
he did not do it in his head or on the plaster. Instead the initial phases of
creative work were done through the medium of thousands of sketches.
Th ese ranged from the highly speculative initial sketches to the fi nished
paper designs that his assistants pricked through with black charcoal
dust to transfer them to the still wet fresco plaster. Studies of how artists
and designers work suggest that although the germ of an idea may often
comes in a reverie as a purely cognitive act, the major work of creative
design is done through a kind of dialogue with some rapid production
medium. Sketches have this function for the visual artist; rough clay or wax
maquettes have the same function for the sculptor. Sketching is not con-
fi ned to artists. Hastily drawn diagrams allow the engineer and scientist to
‘ rough out ’ ideas; computer programmers sketch out the structure of com-
puter programs. Many people, when they wish to organize their ideas, use
pencil and paper to literally draw the links between labeled scribbles stand-
ing for abstract concepts.
CH08-P370896.indd 147CH08-P370896.indd 147 1/24/2008 6:25:46 PM1/24/2008 6:25:46 PM

Th is chapter is about the psychology of constructive visual thinking in
the service of design. In addressing this subject we will encounter a num-
ber of fundamental questions. What is the diff erence between seeing and
imagining? What is the diff erence between the visual thinking that occurs
when we are making a sandwich, the visual thinking involved when we are
reading a map, and the visual thinking we do when we are designing an
advertising poster, a painting, or a web site?
Although creative visual thinking can be almost infi nitely varied, studies
of designers, artists, and scientists have identifi ed some common elements
no matter what the tasks. We begin with a generalized view of the steps
involved in the stages of the creative process.
Step 1—The visual concept is formed: Depending on the application, a graphic idea
may be very free and imaginative or very stereotyped. An art director doing design for an advertising firm
may be open to almost any new visual concept, so long as it can be somehow linked to the product and
yield a positive association. Conversely, an architect designing an apartment building on a fixed budget is
likely to have his visual imagination constrained to a small set of conventional alternatives. In either case
the initial concept may be quite abstract and not particularly graphical. A “ three-story, L-shaped building
with 12 units ” might be sufficient in the case of the architects.
Step 2—Externalization: A loose scribble is drawn on paper to externalize the concept and
provide a starting point for design refinement.
Step 3—The constructive critique: The scribble is visually critiqued; some elements are
visually tested. The designer performs a kind of informal cognitive task analysis, executing a series of visual
queries to determine if the design meets requirements. As part of the process, new meanings may be bound
with the external imagery and potential additions imagined.
Step 4—Consolidation and extension: The original scribble is modified. Faint existing lines
may be modified or strengthened, consolidating the aspect of the design they represent. New lines may be
added. Other lines may be erased or may simply recede as other visual elements become stronger.
MENTAL IMAGERY From the 1980s, two main theories of mental imagery have dominated.
One, theory, championed by Zenon Pylyshyn, holds that mental imagery
is purely symbolic and non spatial. � Spatial ideas are held as logical prop-
ositions such as “ the cup is on the table ” or “ the picture is to the left of
the door. ” According to this view there is no spatial representation in the
brain in the sense of patterns of neural activation having some spatial cor-
respondence to the arrangement of the objects in space.
Th e second view, championed by Stephen Kosslyn, holds that mental
imagery is constructed using the same neurological apparatus responsible
for normal seeing. � Th ese phantom images are constructed in the spatial
neural maps that represent the visual fi eld in various areas of the visual
� Z. Pylyshyn. 1973. What the mind ’ s
eye tells the mind ’ s brain: A critique of
mental imagery. Psychological Bulletin.
80: 1–25.
� S. Kosslyn and J.R. Pomeranz. 1977.
Imagery, propositions, and the form
of internal representations. Cognitive
Psychology. 9: 52–76 .
148
CH08-P370896.indd 148CH08-P370896.indd 148 1/24/2008 6:25:47 PM1/24/2008 6:25:47 PM

First concept scribble
Imagined additions
Needs a base!!
�
Design is refined
They need an opera house.And they have an amazing site onthe water.
Let's see if they will go for a really wild idea.
Critique
Sails
Shells
Will they laugh?How much will it cost?Where's the entrance?
cortex, forming an internal sketch that is processed by higher levels, much
as external imagery is processed.
More recently a third view has emerged based on the idea that mental
images are mental activities. Th is view has been set out clearly by a philos-
opher, N.J.T. Th omas of California State University. Th is is part of the revo-
lution in thinking about perception that is sweeping cognitive science, and
which inspired the creation of this book. According to this account, visual
imagery is based on the same cognitive activities as normal seeing, hence
it is sometimes called activity theory. �
Normal seeing is a constructive, task-oriented process whereby the brain
searches the environment and extracts information as needed for the task
� N.J.T. Thomas. 1999. Are theories of
imagery theori es of imagination? An
active perception approach to conscious
mental content. Cognitive Science. 23:
207–245.
Mental Imagery 149
CH08-P370896.indd 149CH08-P370896.indd 149 1/24/2008 6:25:47 PM1/24/2008 6:25:47 PM
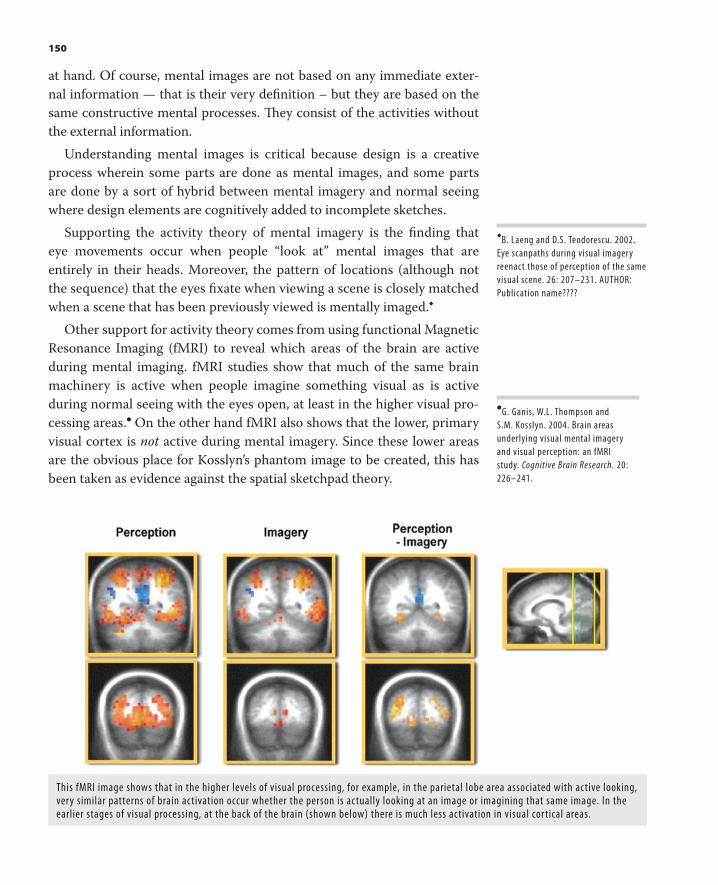
at hand. Of course, mental images are not based on any immediate exter-
nal information — that is their very defi nition – but they are based on the
same constructive mental processes. Th ey consist of the activities without
the external information.
Understanding mental images is critical because design is a creative
process wherein some parts are done as mental images, and some parts
are done by a sort of hybrid between mental imagery and normal seeing
where design elements are cognitively added to incomplete sketches.
Supporting the activity theory of mental imagery is the fi nding that
eye movements occur when people “ look at ” mental images that are
entirely in their heads. Moreover, the pattern of locations (although not
the sequence) that the eyes fi xate when viewing a scene is closely matched
when a scene that has been previously viewed is mentally imaged. �
Other support for activity theory comes from using functional Magnetic
Resonance Imaging (fMRI) to reveal which areas of the brain are active
during mental imaging. fMRI studies show that much of the same brain
machinery is active when people imagine something visual as is active
during normal seeing with the eyes open, at least in the higher visual pro-
cessing areas. � On the other hand fMRI also shows that the lower, primary
visual cortex is not active during mental imagery. Since these lower areas
are the obvious place for Kosslyn ’ s phantom image to be created, this has
been taken as evidence against the spatial sketchpad theory.
� B. Laeng and D.S. Teodorescu. 2002.
Eye scanpaths during visual imagery
reenact those of perception of the same
visual scene. 26: 207–231. AUTHOR:
Publication name????
� G. Ganis, W.L. Thompson and
S.M. Kosslyn. 2004. Brain areas
underlying visual mental imagery
and visual perception: an fMRI
study. Cognitive Brain Research. 20:
226–241.
This fMRI image shows that in the higher levels of visual processing, for example, in the parietal lobe area associated with active looking, very similar patterns of brain activation occur whether the person is actually looking at an image or imagining that same image. In the earlier stages of visual processing, at the back of the brain (shown below) there is much less activation in visual cortical areas.
150
CH08-P370896.indd 150CH08-P370896.indd 150 1/24/2008 6:25:48 PM1/24/2008 6:25:48 PM
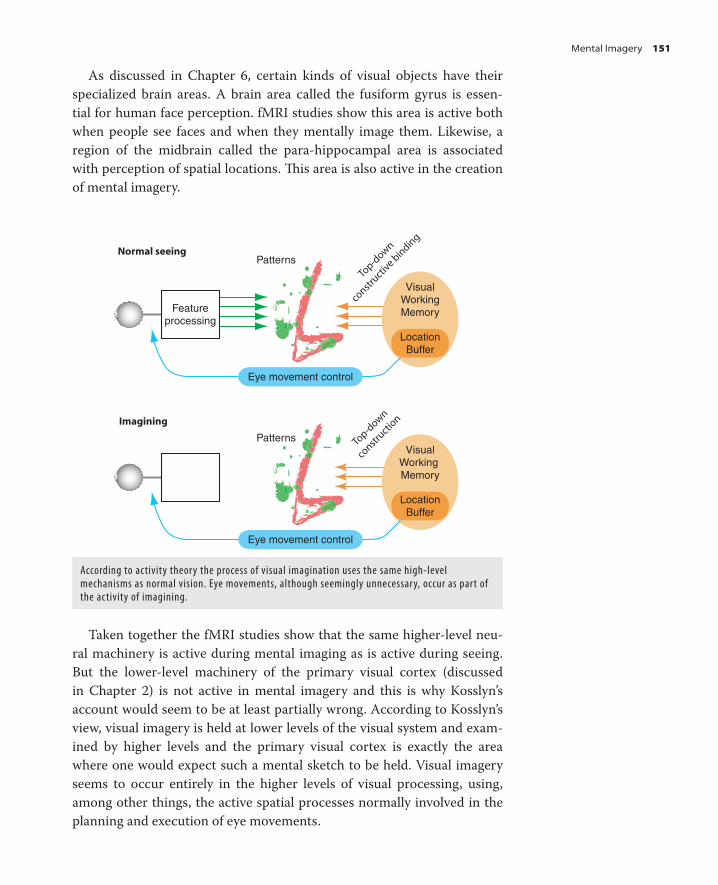
As discussed in Chapter 6, certain kinds of visual objects have their
specialized brain areas. A brain area called the fusiform gyrus is essen-
tial for human face perception. fMRI studies show this area is active both
when people see faces and when they mentally image them. Likewise, a
region of the midbrain called the para-hippocampal area is associated
with perception of spatial locations. Th is area is also active in the creation
of mental imagery.
According to activity theory the process of visual imagination uses the same high-level mechanisms as normal vision. Eye movements, although seemingly unnecessary, occur as part of the activity of imagining.
Patterns
VisualWorkingMemory
LocationBuffer
PatternsVisual
Working Memory
LocationBuffer
Normal seeing
Imagining
Featureprocessing
Top-d
own
constr
uctive b
indin
g
Top-d
own
constr
uction
Eye movement control
Eye movement control
Taken together the fMRI studies show that the same higher-level neu-
ral machinery is active during mental imaging as is active during seeing.
But the lower-level machinery of the primary visual cortex (discussed
in Chapter 2) is not active in mental imagery and this is why Kosslyn ’ s
account would seem to be at least partially wrong. According to Kosslyn ’ s
view, visual imagery is held at lower levels of the visual system and exam-
ined by higher levels and the primary visual cortex is exactly the area
where one would expect such a mental sketch to be held. Visual imagery
seems to occur entirely in the higher levels of visual processing, using,
among other things, the active spatial processes normally involved in the
planning and execution of eye movements.
Mental Imagery 151
CH08-P370896.indd 151CH08-P370896.indd 151 1/24/2008 6:25:49 PM1/24/2008 6:25:49 PM

Mental imagery can therefore be thought of as an internalized active pro-
cess; much as our inner dialogue is internalized speech, visual imagery is
based on the internalized activities of seeing. Just as internalized speech can
be used to plan future actions and interpret past ones in an active process,
so internalized seeing can be used to plan and interpret as part of the design
process.
However, there is a key diff erence: everyone uses internalized speech
as a thinking tool but the constructive internalization of mental imagery
is a skill that is more specialized. Experienced designers will internalize
the dialogue with paper, others who do not use sketching as a design tool
will not.
Mostly, though, the process of design combines some of the cognitive
activities of normal seeing with the activities of visual imagination. Th e
particular unique process of design is a kind of constructive perception.
Th is leads us to a critical cognitive tool of the designer, the line sketch.
1
4
2 3
7
6
5 8
9
THE MAGIC OF THE SCRIBBLE Lines are capable of representing many diff erent things as the fi gure illus-
trates. � How can this chameleon quality be explained? Th e answer lies
in the critical importance of edges in visual processing. As discussed in
Chapter 3, a major function of early and middle stage visual processing is
the extraction of continuous contours. An object may be separated from
its background in many diff erent ways including luminance changes at its
silhouette, color diff erences, texture boundaries, and even motion bound-
aries. A generalized contour extraction mechanism in the pattern process-
ing stage of perception allows us to discern an object from many kinds
of visual discontinuities. Lines on paper provide a strong signal to this
Lines representing:
1) A thin wire 2) A surface color boundary 3) An aperture 4) A silhouette contour for a
rounded surface 5) A silhouette of a sharp edge 6) An internal contour 7) A crack between two
abutting objects 8) An edge where two planes
meet 9) A material boundary
�
An extensive discussion of the
expressive power of lines can be
found in John M. Kennedy ’ s book The
Psychology of Picture Perception, Jossey
Bass, 1974. Kennedy was my PhD thesis
advisor.
152
CH08-P370896.indd 152CH08-P370896.indd 152 1/24/2008 6:25:50 PM1/24/2008 6:25:50 PM

generalized contour mechanism with the consequence that something as
abstract as a circle on paper can have fi ve diff erent meanings.
Th e Italian psychologist Manfredo Masseroni devised the follow-
ing exercise for the reader to understand directly how the magic of lines
can be used as part of a creative design process. � Make a simple scribble
by moving a pen around in a large irregular looping pattern. Don ’ t think
about representing anything while you do it. You should end up with a few
scribbles like the ones on the next page. To transform your meaningless
scribbles into birds just add a small circle � and a � shape to some loop of
the scribble. Magically, a bird will appear and diff erent parts of the scrib-
ble will suddenly become head, wings, tail, and body. What is remarkable
about this exercise is that almost any scribble can become a bird.
Th e point of this exercise is twofold. First, it emphasizes the construc-
tive power of seeing. Simple looping lines become wings and bodies.
Second, and more important, it illustrates an important creative design
technique that many artists and designers use and that, as we shall see,
points at the essence of the way sketches function as creative tools.
Coin Ball Ring Hole Pluggedhole
Coin Ball Ring Hole Pluggedhole
Five different objects with the same visual representation.
In this cartoon, Saul Steinberg exploits the chameleon quality of lines to represent many kinds and properties of objects. He also uses line quality as a way to express the whimsical chain of a child ’ s monologue and the harsh abstract logic of the adult. (S. Steinberg, Untitled, 1959. Ink on paper. First published in The New Yorker, March 14, 1959. © The Saul Steinberg Foundation/Artists Rights Society (ARS), New York.)
The Magic of the Scribble 153
�
M. Massironi. 2002. The Psychology of
Graphics Images. Lawrence Erlbaum.
The above is a side box for Page 9.
CH08-P370896.indd 153CH08-P370896.indd 153 1/24/2008 6:25:50 PM1/24/2008 6:25:50 PM

Alternatively, by adding slightly diff erent features you should be able to
create people or other animals.
Th is mode of drawing can be used as a kind of visual brainstorming. You
will undoubtedly come up with designs that are diff erent from anything you
would have deliberately produced had you proceeded more methodologi-
cally. And you may well fi nd out that the results are livelier and visually
more interesting. Th e deliberately “ random ” scribble is often used by art-
ists and designers as a way of liberating their creative process from stereo-
typed visual thinking. Th e perceptual mechanisms are exquisitely tuned to
fi nd meaning often from slender evidence, and this is why meaning is so
readily found in meaningless scribbles.
Random irregular loop scribbles.
The same scribbles with only minimal additions become fanciful birds!
154
CH08-P370896.indd 154CH08-P370896.indd 154 1/24/2008 6:25:51 PM1/24/2008 6:25:51 PM
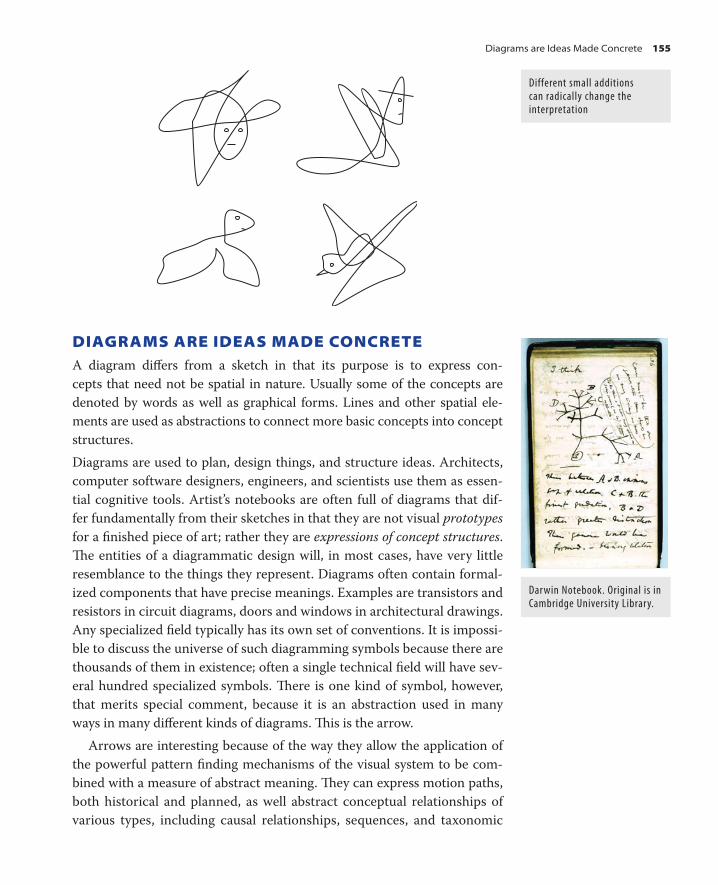
DIAGRAMS ARE IDEAS MADE CONCRETE A diagram diff ers from a sketch in that its purpose is to express con-
cepts that need not be spatial in nature. Usually some of the concepts are
denoted by words as well as graphical forms. Lines and other spatial ele-
ments are used as abstractions to connect more basic concepts into concept
structures.
Diagrams are used to plan, design things, and structure ideas. Architects,
computer software designers, engineers, and scientists use them as essen-
tial cognitive tools. Artist ’ s notebooks are often full of diagrams that dif-
fer fundamentally from their sketches in that they are not visual prototypes
for a fi nished piece of art; rather they are expressions of concept structures .
Th e entities of a diagrammatic design will, in most cases, have very little
resemblance to the things they represent. Diagrams often contain formal-
ized components that have precise meanings. Examples are transistors and
resistors in circuit diagrams, doors and windows in architectural drawings.
Any specialized fi eld typically has its own set of conventions. It is impossi-
ble to discuss the universe of such diagramming symbols because there are
thousands of them in existence; often a single technical fi eld will have sev-
eral hundred specialized symbols. Th ere is one kind of symbol, however,
that merits special comment, because it is an abstraction used in many
ways in many diff erent kinds of diagrams. Th is is the arrow.
Arrows are interesting because of the way they allow the application of
the powerful pattern fi nding mechanisms of the visual system to be com-
bined with a measure of abstract meaning. Th ey can express motion paths,
both historical and planned, as well abstract conceptual relationships of
various types, including causal relationships, sequences, and taxonomic
Different small additions can radically change the interpretation
Diagrams are Ideas Made Concrete 155
Darwin Notebook. Original is in Cambridge University Library.
CH08-P370896.indd 155CH08-P370896.indd 155 1/24/2008 6:25:52 PM1/24/2008 6:25:52 PM

A B C
Sequence: A then B then C
Abstract "is a"relationships
mammal
chimpanzeehuman
mouse beaver
rodent primate
Actionpath
Motion pattern
Wind direction in a cyclone
hierarchies. Th ey can also simply direct attention to a particular feature of
a diagram or photograph. Th e arrowhead has the purely symbolic function
of showing directionality either in an abstract sense (the phrase “ a mouse
is a rodent ” has a directionality in the sense that the converse is not true)
or in the concrete sense of a direction of motion. In showing motion, in
which the shaft of the arrow can be either curved or shows a motion path,
the arrowhead is purely symbolic and shows which way along the path the
motion is headed. In either case this hybrid of a line pattern with a direc-
tional arrowhead can be rapidly scribbled, supporting the tight cognitive
loop that is the essence of visual thinking through diagramming.
REQUIREMENTS AND EARLY DESIGN Having considered the details of how lines function in visual thinking it is
necessary to return to the larger design process wherein the workload is
distributed between the brain and visual tools.
Th e fi rst part of any design process is an understanding of the requirements
of the design. In some disciplines, such as engineering, this stage is explicit
and well defi ned. In less constrained disciplines, a designer must still establish
A few of the abstractions are expressible through arrows.
156
In this design diagram for doors, architect Eva Jiricna uses arrows in multiple ways including the motion path of a door, labeling of parts connecting verbally expressed ideas to parts of the graphic, and connecting different parts of the compound diagram. (sketches by Eva Jiricna.)
CH08-P370896.indd 156CH08-P370896.indd 156 1/24/2008 6:25:53 PM1/24/2008 6:25:53 PM
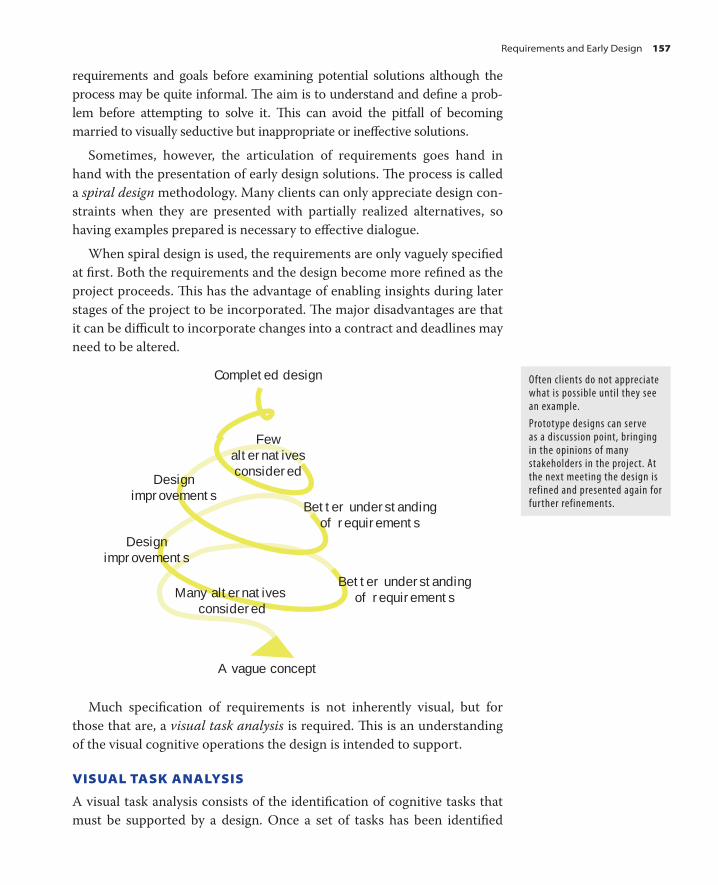
requirements and goals before examining potential solutions although the
process may be quite informal. Th e aim is to understand and defi ne a prob-
lem before attempting to solve it. Th is can avoid the pitfall of becoming
married to visually seductive but inappropriate or ineff ective solutions.
Sometimes, however, the articulation of requirements goes hand in
hand with the presentation of early design solutions. Th e process is called
a spiral design methodology. Many clients can only appreciate design con-
straints when they are presented with partially realized alternatives, so
having examples prepared is necessary to eff ective dialogue.
When spiral design is used, the requirements are only vaguely specifi ed
at fi rst. Both the requirements and the design become more refi ned as the
project proceeds. Th is has the advantage of enabling insights during later
stages of the project to be incorporated. Th e major disadvantages are that
it can be diffi cult to incorporate changes into a contract and deadlines may
need to be altered.
A vague concept
Better understandingof requirements
Designimprovements
Completed design
Designimprovements
Better understandingof requirements
Many alternatives considered
Fewalternativesconsidered
Much specifi cation of requirements is not inherently visual, but for
those that are, a visual task analysis is required. Th is is an understanding
of the visual cognitive operations the design is intended to support.
VISUAL TASK ANALYSIS
A visual task analysis consists of the identifi cation of cognitive tasks that
must be supported by a design. Once a set of tasks has been identifi ed
Often clients do not appreciate what is possible until they see an example.
Prototype designs can serve as a discussion point, bringing in the opinions of many stakeholders in the project. At the next meeting the design is refined and presented again for further refinements.
Requirements and Early Design 157
CH08-P370896.indd 157CH08-P370896.indd 157 1/24/2008 6:25:54 PM1/24/2008 6:25:54 PM
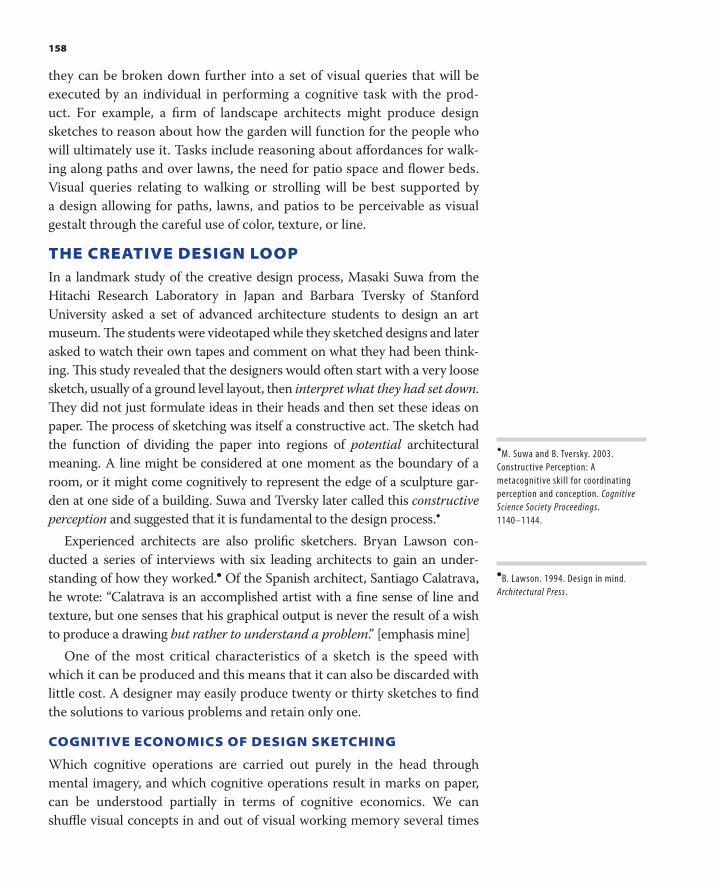
they can be broken down further into a set of visual queries that will be
executed by an individual in performing a cognitive task with the prod-
uct. For example, a fi rm of landscape architects might produce design
sketches to reason about how the garden will function for the people who
will ultimately use it. Tasks include reasoning about aff ordances for walk-
ing along paths and over lawns, the need for patio space and fl ower beds.
Visual queries relating to walking or strolling will be best supported by
a design allowing for paths, lawns, and patios to be perceivable as visual
gestalt through the careful use of color, texture, or line.
THE CREATIVE DESIGN LOOP In a landmark study of the creative design process, Masaki Suwa from the
Hitachi Research Laboratory in Japan and Barbara Tversky of Stanford
University asked a set of advanced architecture students to design an art
museum. Th e students were videotaped while they sketched designs and later
asked to watch their own tapes and comment on what they had been think-
ing. Th is study revealed that the designers would often start with a very loose
sketch, usually of a ground level layout, then interpret what they had set down .
Th ey did not just formulate ideas in their heads and then set these ideas on
paper. Th e process of sketching was itself a constructive act. Th e sketch had
the function of dividing the paper into regions of potential architectural
meaning. A line might be considered at one moment as the boundary of a
room, or it might come cognitively to represent the edge of a sculpture gar-
den at one side of a building. Suwa and Tversky later called this constructive
perception and suggested that it is fundamental to the design process. �
Experienced architects are also prolifi c sketchers. Bryan Lawson con-
ducted a series of interviews with six leading architects to gain an under-
standing of how they worked. � Of the Spanish architect, Santiago Calatrava,
he wrote: “ Calatrava is an accomplished artist with a fi ne sense of line and
texture, but one senses that his graphical output is never the result of a wish
to produce a drawing but rather to understand a problem . ” [emphasis mine]
One of the most critical characteristics of a sketch is the speed with
which it can be produced and this means that it can also be discarded with
little cost. A designer may easily produce twenty or thirty sketches to fi nd
the solutions to various problems and retain only one.
COGNITIVE ECONOMICS OF DESIGN SKETCHING
Which cognitive operations are carried out purely in the head through
mental imagery, and which cognitive operations result in marks on paper,
can be understood partially in terms of cognitive economics. We can
shuffl e visual concepts in and out of visual working memory several times
� M. Suwa and B. Tversky. 2003.
Constructive Perception: A
metacognitive skill for coordinating
perception and conception. Cognitive
Science Society Proceedings.
1140–1144.
� B. Lawson. 1994. Design in mind.
Architectural Press .
158
CH08-P370896.indd 158CH08-P370896.indd 158 1/24/2008 6:25:54 PM1/24/2008 6:25:54 PM

A few sample sketches from Calatrava ’ s notebooks show trees, the human form, and tradition architectural forms, all being used as sources of inspiration for the design of the roof truss system of a modern cathedral. Each of the examples explores a different idea. In some a metaphorical comparison of forms (the male figure and the tree) is the primary focus. Others are explorations of abstract forms that can meet the structural requirements of a building. (sketches by Santiago Calatrava.)
a second. Adding a mark to a sketch takes longer, a second or two to pre-
serve an idea that would otherwise be lost. Visual working memory is
the most fl exible high-speed sketchpad, but has very limited capacity
and is very impermanent. Rough sketches on paper have less fl exibility,
but they also support greater complexity and can be kept or rapidly dis-
carded. Permanent detailed designs have the least fl exibility, cost a lot to
produce, but can be very elaborate. As the design process progresses the
Visually scan and constructively interpret the scribble
A vague concept
Mentally project additions to the scribble
Add marksto extend or consolidate
design
A loose scribble on paper
The Creative Design Loop 159
CH08-P370896.indd 159CH08-P370896.indd 159 1/24/2008 6:25:54 PM1/24/2008 6:25:54 PM

kinds of design artifacts that are produced may change from many low-
cost sketches to a few high-cost detailed and fi nished drawings.
It is known from human memory research that recognition is vastly
easier than recall. In other words, we can recognize that we have seen
something before far more easily than we can reconstruct a memory. It
is similarly true that identifying an eff ective design is vastly easier than
creation of that same design. In a sense this is not surprising; it takes but
a few seconds to appreciate, at least superfi cially, that one is in the pres-
ence of an interesting and visually exciting design. But this suggests that
it is useful to have a design production method that can produce lots of
designs at least semi-automatically. Th en our job is to select from them,
equally rapidly.
THE PERCEPTUAL CRITIQUE
As the designer quickly creates a conceptual design sketch an ongoing
perceptual critique is occurring. Th is can be thought of as a form of meta-
seeing in that it is critical and analytic in a way that goes beyond the nor-
mal process of visual thinking associated with everyday tasks. It involves
the interpretation and visual analysis of the marks on the paper that have
just been put down.
Th ere are two kinds of preliminary design artifacts that we have been
considering and each involves diff erent forms of meta-seeing. Th e fi rst,
the concept diagram, is about design concepts and usually has little in
common with the appearance of any physical object. An example of this
would be Darwin ’ s sketch of the evolutionary tree. Th e second is the proto-
type design which is a rough version of a fi nal product. An example of this
would be a rough sketch of a poster or a web page. Many of the most inter-
esting diagrams are combinations of the two. For example, a landscape
architect will create sketches that have a rough spatial correspondence
to where fl ower beds and lawns will appear in a fi nished garden. Many
parts of the sketch and the cognitive operations it supports will be highly
abstract and conceptual (for example, arrows showing strolling routes).
Designs are tested by means of functional visual queries. For example,
a visual query can establish the distance between design elements and
thereby discover if an element representing an herb garden is an appro-
priate distance from an element representing the house. Similar visual
queries might be made regarding the area of the lawn, the location of
pathways, and the shapes and distributions of fl owerbeds. In each case,
the corresponding elements are brought into visual working memory, and
tested in some way, by means of judgment of distance, area, or shape.
160
CH08-P370896.indd 160CH08-P370896.indd 160 1/24/2008 6:25:56 PM1/24/2008 6:25:56 PM

Th e graphical marks that represent a rose garden in one instant may be
reconsidered in the next as representing a space for an herb garden. Th e
cognitive operation is a change in the bindings between visual working
memory objects and verbal working memory objects.
Designing a garden
This might bea rose garden?
Or maybe a rose garden
And critiqued
Different uses are considered
Or maybea herb garden?
Or maybe a rose gardenWould it be too
far from the house?
A different graphical object is brought into visual working memory as attention shifts to the relationship between the
"herb garden" rectangle and the rectangle representing the house.
A part of the design is brought into visual working
memory
Purely cognitive visual imagery can be added to the visual working
memory representation of parts of the design. A paved path might be
imagined as part of the design. In this case part of what is held in visual
working memory corresponds to marks on the paper, whereas the addi-
tions are pure mental images. Th e very limited capacity of visual working
memory requires that imagined additions are simple. In order to extend
the design in an elaborate way, the imagined additions must be added to
the scribble. However, because mental additions have a far lower cognitive
The Creative Design Loop 161
CH08-P370896.indd 161CH08-P370896.indd 161 1/24/2008 6:25:56 PM1/24/2008 6:25:56 PM
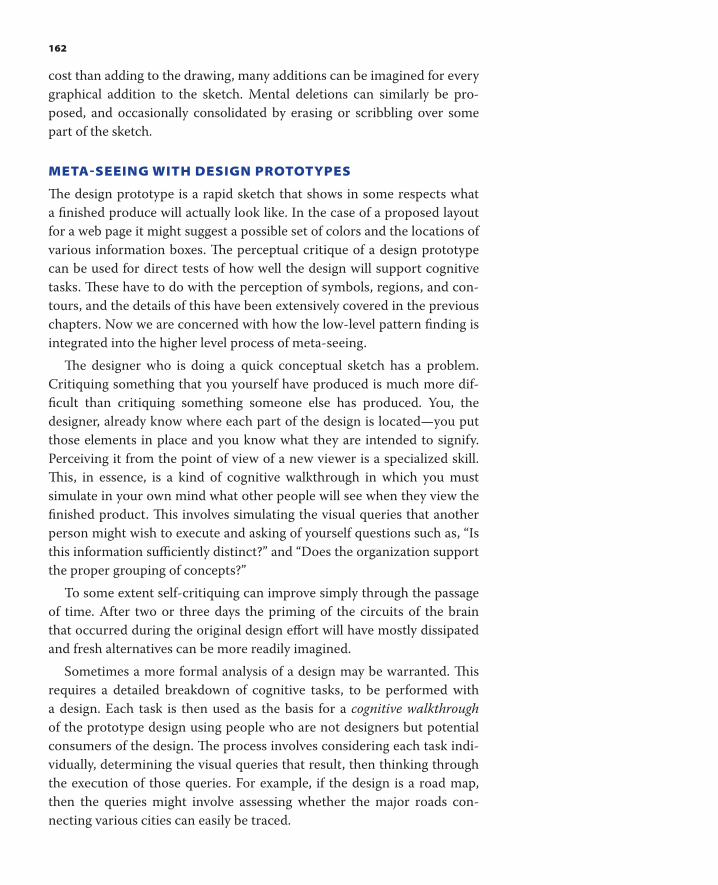
cost than adding to the drawing, many additions can be imagined for every
graphical addition to the sketch. Mental deletions can similarly be pro-
posed, and occasionally consolidated by erasing or scribbling over some
part of the sketch.
METASEEING WITH DESIGN PROTOTYPES
Th e design prototype is a rapid sketch that shows in some respects what
a fi nished produce will actually look like. In the case of a proposed layout
for a web page it might suggest a possible set of colors and the locations of
various information boxes. Th e perceptual critique of a design prototype
can be used for direct tests of how well the design will support cognitive
tasks. Th ese have to do with the perception of symbols, regions, and con-
tours, and the details of this have been extensively covered in the previous
chapters. Now we are concerned with how the low-level pattern fi nding is
integrated into the higher level process of meta-seeing.
Th e designer who is doing a quick conceptual sketch has a problem.
Critiquing something that you yourself have produced is much more dif-
fi cult than critiquing something someone else has produced. You, the
designer, already know where each part of the design is located—you put
those elements in place and you know what they are intended to signify.
Perceiving it from the point of view of a new viewer is a specialized skill.
Th is, in essence, is a kind of cognitive walkthrough in which you must
simulate in your own mind what other people will see when they view the
fi nished product. Th is involves simulating the visual queries that another
person might wish to execute and asking of yourself questions such as, “ Is
this information suffi ciently distinct? ” and “ Does the organization support
the proper grouping of concepts? ”
To some extent self-critiquing can improve simply through the passage
of time. After two or three days the priming of the circuits of the brain
that occurred during the original design eff ort will have mostly dissipated
and fresh alternatives can be more readily imagined.
Sometimes a more formal analysis of a design may be warranted. Th is
requires a detailed breakdown of cognitive tasks, to be performed with
a design. Each task is then used as the basis for a cognitive walkthrough
of the prototype design using people who are not designers but potential
consumers of the design. Th e process involves considering each task indi-
vidually, determining the visual queries that result, then thinking through
the execution of those queries. For example, if the design is a road map,
then the queries might involve assessing whether the major roads con-
necting various cities can easily be traced.
162
CH08-P370896.indd 162CH08-P370896.indd 162 1/24/2008 6:25:56 PM1/24/2008 6:25:56 PM

Doing cognitive walkthroughs with other participants has a very high
cost of time and eff ort. Th e combined amount of cognitive work is high
and typically only justifi ed for more fi nished designs. Many early design
sketches may not be good solutions and must be rejected. Th e principle
of cognitive economy dictates that designers must develop visual skills
that help them to assess designs at an early stage without involving other
participants. �
VISUAL SKILL DEVELOPMENT Many designers are not aware of their critical analytic processes, anymore
than we are aware of the skills we have when buttering a piece of bread. It
is so long since we fi rst learned to do it that we have completely forgotten
that stage at which the task required intense concentration. Th is is why
the expert is often intolerant of the novice. He simply does not understand
how an apparently obvious design fl aw can be overlooked. But the ability
to do a visual critique is an acquired skill.
All skilled behavior proceeds from the eff ortful to the automatic. For
example, at the early stages of learning to type it is necessary to conduct a
visual search for every key, and this consumes so much visual, procedural,
and motor capacity that nothing is left over for composing a paragraph.
At the expert level the fi nger movement sequences for whole words have
become automatic and composing on the keyboard seems completely nat-
ural. Very little high-level cognitive involvement is needed and so visual
and verbal working memory are free to deal with the task of composing
the content of what is to be written.
Th e progression from high-level eff ortful cognition to low-level auto-
matic processing has been directly observed in the brain by Russel
Poldrack and a team at the University of California who used fMRI to study
the development of a visual skill. � For a task, they had subjects read mirror-
reversed text, which is an early-stage skill for most people. Th ey found that
parts of the brain involved in the task were from the temporal lobe areas of
the brain associated with conscious eff ortful visual attention. In contrast,
reading normal text, which is a highly automated learned skill, only caused
brain activity in lower-level pattern recognition areas of the cortex.
It takes time to convert the hesitant eff ortful execution of tasks into
something that is done automatically in the brain but it is not simply prac-
tice time that that counts. A number of studies show that sleep is critical
to the process. Skills only become more automatic if there is a period of
sleep between the episodes where the skill is practiced. Th is has shown to
be the case for many diff erent tasks: for texture discriminations that might
�
For a full of account of the cognitive
walkthrough methodology see
C. Wharton, J. Reiman, C. Lewis
and P. Polson. 1994. The Cognitive
Walkthrough Method: A Practitioner ’ s
Guide. New York: Wiley.
� R.A. Poldrack, J.E. Desmond, G.H.
Glover and J.D.D. Gabrieli, 1998. The
neural basis of visual skill learning: and
fMRI study of mirror reading. Cerebral
Cortex. 8(1): 1–10.
Visual Skill Development 163
CH08-P370896.indd 163CH08-P370896.indd 163 1/24/2008 6:25:56 PM1/24/2008 6:25:56 PM

164
be important in judging the quality of cloth, in typing letter sequences, and
in tasks, like riding a bicycle, that require physical dexterity. Th us, we may
practice a task for hours and gain little benefi t; but if we practice for only
half an hour, then wait a day, some measure of automaticity will be gained.
It is not enough that we simply go through the motions in learning
visual analytic skills. Whatever is to be learned must be the focus of atten-
tion. A couch potato may watch television soap operas for hours every day
over years but learn nothing about the skills of fi lm directing. However, a
director will see, and interpret the value of , lighting, camera angles, and
shot sequences. Th e important skills for the designer are interpreting and
constructive criticism. It is not enough to look at many visual designs;
each must be subjected to a visual critique for these skills to develop. Th is
book is intended to provide perceptually based design rules that form one
basis for critical assessment.
CONCLUSION Th e skill of thinking through sketching has nothing to do with ability to draw
in the conventional sense of drawing a portrait or a landscape. Almost any
scribble will do. Th e power of sketching in the service of design comes from
the visual interpretive skills of the scribbler. Prototype design sketches allow
for preliminary design ideas to be critiqued, both by the creator and by oth-
ers. A concept sketch diff ers from a prototype sketch in that it is a method
for constructing, organizing, and critiquing ideas. It provides abstract repre-
sentations of ideas and idea structures. Most sketches are hybrids of proto-
type and concept sketches, partly appearance and partly ideas.
Th e power of sketching as a thinking tool comes from a combination
of four things. Th e fi rst is the fact that a line can represent many things
because of the fl exible interpretive pattern-fi nding capability of the visual
system. Th e second has to do with the way sketches can be done quickly
and just as easily discarded. Starting over is always an option. Th e third is
the critical cognitive skill of interpreting lines in diff erent ways. Part of this
skill is the ability to project new ideas onto a partially completed scribble.
Part of it is the ability to critique the various interpretations by subjecting
them to functional visual queries. Th e fourth is the ability to mentally image
new additions to a design. Despite the fact that no signifi cant drawing skill is
needed, thinking with sketches is not easy. Th e skill to visually analyze either
prototype designs or idea structures is hard won and it is what diff erentiates
the expert from the novice designer. A whole lifetime ’ s experience enriches a
scribble and transforms it from a few meaningless marks to a thinking tool.
CH08-P370896.indd 164CH08-P370896.indd 164 1/24/2008 6:25:56 PM1/24/2008 6:25:56 PM

165
The Dance of Meaning
Meaning is what the brain performs in a dance with the external environ-
ment. In this dance tokens of meaning are spun off into electronic and
social media and tokens of meaning are likewise picked up. New mean-
ing is constructed when patterns already stored within the brain are com-
bined with patterns constructed from external information. Increasingly,
new meaning is also constructed by inanimate computers that do at least
partial analysis, and synthesis of patterns and tokens of meaning, then
present the results using a visual display.
In this book, the dance partners are considered to be individual people
interacting with visual displays. In reality the dance is far more intricate
and elaborate; there is a constant stream of new meaning being devel-
oped by people interacting with one another. Visual thinking is but a small
part of the dance. Nevertheless, because of the special power of the visual
system as a pattern-fi nding engine, visual thinking has an increasingly
important role. Th is book itself is part of the dance, as is everything that is
designed to be accessed visually.
CH09-P370896.indd 165CH09-P370896.indd 165 1/23/2008 7:04:07 PM1/23/2008 7:04:07 PM

One of the main themes we have explored in this book is that at every
level of description visual thinking can be thought of as active processes
operating through the neural machinery of the brain as well as through
the external world. Th e purpose of this chapter is to review and summa-
rize what we have covered so far and then discuss some of the broader
implications of how the theory of perception applies to design.
REVIEW Th e following few pages give a twelve-point summary of the basic machinery
and the major processes involved in visual thinking. With the twelfth point
we shall segue into observations that go beyond what has been said before.
1. Th e eye has a small high-resolution area of photoreceptors called the
fovea. We see far more detail in the fovea than off to the side and we
sample the world by making rapid eye movements from point to point.
Eye movements rotate the eyeball so that imagery from diff erent parts
of the visual world falls on the fovea to be analyzed by the brain.
2. Our brains construct visual queries to pick up what is important to
support what we are doing cognitively at a given instant. Queries
trigger rapid eye movements to enable us to pick up information that
answers the query.
How affluent?
What are their ages?
“Unexpected Returns” by Ilya Repin, taken from A. Yarbus, 1967. Eye movements during perception of complex objects. L.A. Riggs, ed., Eye Movements and Vision, Plenum Press. NY. Chapter VII, 171–196.
166
CH09-P370896.indd 166CH09-P370896.indd 166 1/23/2008 7:04:08 PM1/23/2008 7:04:08 PM

On page 166 is a picture by the Russian realist painter Ilya Repin, titled,
“ Th ey did not expect him. ” To the right, shown in red, are eye movement
traces from one person asked to perform diff erent analytic tasks. When
asked about the material well-being of the family, the eye movements fi x-
ate on clothes, pictures on the walls, and other furnishings (top). When
asked about the ages of the family members, the eye movements fi xate on
faces almost exclusively (bottom).
Th ese records were made by the Russian psychologist Alfred Yarbus,
who in 1967 used a mirror attached by means of a suction cup to his sub-
jects ’ eyeballs to refl ect light onto photographic paper and thereby record
eye movements.
3. Th e fi rst stage of cortical visual processing is a local feature
analysis done simultaneously for every part of the visual fi eld. Th e
orientation, size, color, and motion of each part of the image falling
on the retina is determined all at once by feature-selective neurons.
Smaller scale features are only analyzed in the fovea at the center of
vision. All other visual processing is based on the initial division of
the visual world into features.
Eye movementplanner
Feature processingCognitive task
demands
Understanding feature-level processing tells us what will stand out
and be easy to fi nd in a visual image. In the image above, the green bars
are distinct in terms of several feature dimensions: color, orientation,
curvature, and sharpness. We can easily execute eye movements to
fi nd the green bars because orientation, color, and curvature are all
fea-ture properties that are processed at an early stage, and early stage
properties are the ones that can be used by the brain in directing eye
movements.
Review 167
CH09-P370896.indd 167CH09-P370896.indd 167 1/23/2008 7:04:17 PM1/23/2008 7:04:17 PM

A simple motion pattern can also be thought of as a feature. Something
that moves in a fi eld of mostly static things is especially distinctive and
easy to fi nd.
4. Th ere are two major processing pathways called the where and what
pathways.
Th e where pathway has connections to various regions in the
parietal lobe responsible for visually guided actions, such as eye-
movements, walking, and reaching to grasp objects.
Th e what pathway is responsible for identifying objects through a
series of stages in which increasingly complex patterns are processed,
each stage building on the previous one.
Between the low-level feature analysis and high-level object recogni-
tion is an intermediate pattern-fi nding stage. Th is divides visual space
into regions bounded by a contour and containing similar textures, colors,
or moving features. In V4 more complex compound shapes are identi-
fi ed from patterns of features. In the IT cortex neurons respond to spe-
cifi c meaningful patterns such as faces, hands, letters of the alphabet, and
automobiles.
loyalDOG
friendly
petfurry
Muscle actionsequences setup
to pet the dog
Pre-frontal Cortex
Visual pattern
informationrelating to dogs
Verbal concept information relatingto dogs.
5. Various kinds of information are combined in a temporary nexus of
meaning. Th is information can include visual pattern information,
language-based concepts, and action patterns. Th is nexus is short
lived and is what makes up the contents of the working memories.
Where pathwayAct
ion
Contro
l
V1
Obje
ct
Iden
tifica
tion What pathway
V2V4IT
168
CH09-P370896.indd 168CH09-P370896.indd 168 1/23/2008 7:04:18 PM1/23/2008 7:04:18 PM

From one to three meaningful nexuses can be formed every time we
fi xate on part of a scene. Some of these may be held from one eye
fi xation to the next, depending on their relevance to the thought
process. Th is three-object visual working memory limit is a basic
bottleneck in visual thinking.
6. Language processing is done through specialized centers in the left
temporal lobe. Language understanding and production systems are
specialized for a kind of informal logic exemplifi ed by the “ ifs, ” “ ands, ”
and “ buts ” of everyday speech. Th is is very diff erent from the visual
logic of pattern and spatial arrangements.
7. Th e natural way of linking spoken words and images is through diexis
(pointing). People point at objects just prior to, or during, related
verbal statements, enabling the audience to connect the visual and
verbal information into a visual working memory nexus.
8. One way that visual displays support cognition is by providing aids
to memory. Small images, symbols, and patterns can provide proxies
for concepts. When these proxies are fi xated, the corresponding
concepts become activated in the brain. Th is kind of visually
triggered activation can often be much faster than retrieval of the
same concept from internal long-term memory without such aids.
When an external concept proxy is available, access to it is made
by means of eye movements which typically take approximately
one-tenth of a second. Once the proxy is fi xated, a corresponding
concept is activated within less than two-tenths of a second. It is
possible to place upwards of thirty concept proxies in the form of
images, symbols, or patterns on a screen providing a very quickly
accessible concept buff er. Compare this to the fact that we can hold
only approximately three concept chunks in visual or verbal working
memory at a time. Th ere is a major limitation to this use of external
proxies—it only works when there are learned associations between
the visual symbols, images, or patterns and particular concepts.
How did the information get from Mark to Briana?
Jasmine
Fred
JustinBriana
MarkMolly
We just needto see the pattern
of links
Jasmine
Fred
JustinBriana
MarkMolly
Review 169
CH09-P370896.indd 169CH09-P370896.indd 169 1/23/2008 7:04:21 PM1/23/2008 7:04:21 PM
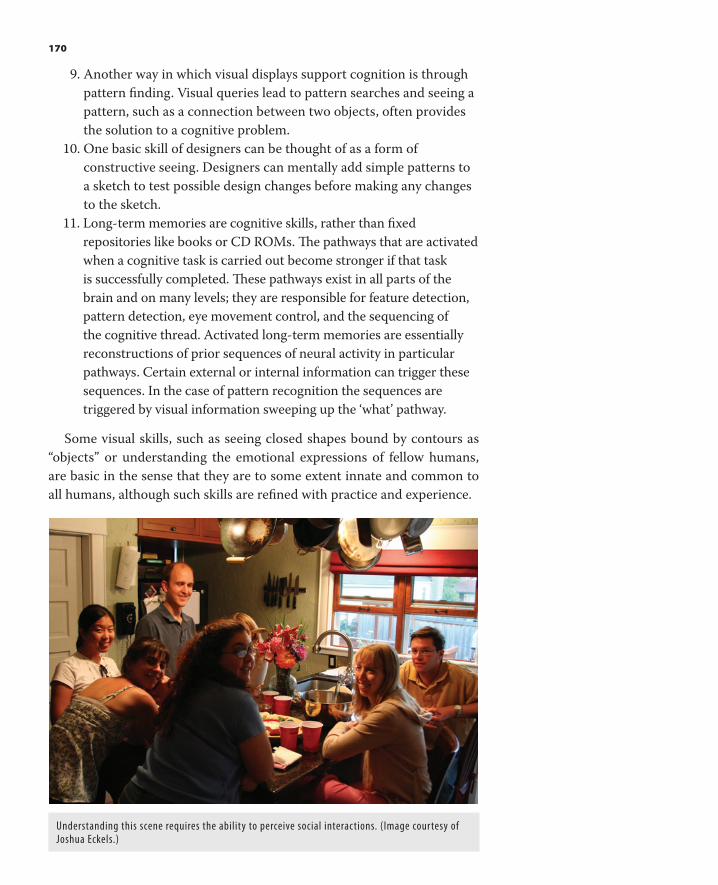
9. Another way in which visual displays support cognition is through
pattern fi nding. Visual queries lead to pattern searches and seeing a
pattern, such as a connection between two objects, often provides
the solution to a cognitive problem.
10. One basic skill of designers can be thought of as a form of
constructive seeing. Designers can mentally add simple patterns to
a sketch to test possible design changes before making any changes
to the sketch.
11. Long-term memories are cognitive skills, rather than fi xed
repositories like books or CD ROMs. Th e pathways that are activated
when a cognitive task is carried out become stronger if that task
is successfully completed. Th ese pathways exist in all parts of the
brain and on many levels; they are responsible for feature detection,
pattern detection, eye movement control, and the sequencing of
the cognitive thread. Activated long-term memories are essentially
reconstructions of prior sequences of neural activity in particular
pathways. Certain external or internal information can trigger these
sequences. In the case of pattern recognition the sequences are
triggered by visual information sweeping up the ‘ what ’ pathway.
Some visual skills, such as seeing closed shapes bound by contours as
“ objects ” or understanding the emotional expressions of fellow humans,
are basic in the sense that they are to some extent innate and common to
all humans, although such skills are refi ned with practice and experience.
Understanding this scene requires the ability to perceive social interactions. (Image courtesy of Joshua Eckels.)
170
CH09-P370896.indd 170CH09-P370896.indd 170 1/23/2008 7:04:24 PM1/23/2008 7:04:24 PM

Other perceptual tasks, such as reading a contour map, understanding a cubist painting and interpreting an X-ray image, require specialized pattern recognition skills. These higher-level skills are much easier to acquire if they build on more basic skills, which means that an artist cannot be too radical and still expect to be widely understood.
12. How does the mind control itself ? In a sense, it doesn ’ t — there
is no control center of the mind. Intelligence emerges from the
activities of diff erent parts of the brain and the information that
passes back and forth internally, as well as activities involving the
external world via vision and touch and other senses. Although
the prefrontal cortex appears to be the part of the brain exerting
the highest level of control over cognitive processes, it would be a
mistake to think of it as “ smart. ” Th e brain is made up of fi fty or so
specialized regions, none of which on its own can be thought of as
intelligent. Examples are the regions V1, V2, V4, and the IT cortex.
Patterns of neural activation beget other patterns of activation as
one patterned cascade of fi ring naturally triggers other diff erent
cascades of activation in a kind of chain reaction of neural activity.
Th e chain reaction of cognition, one pattern of activation leading to
the next, is what we have been calling the cognitive thread.
Visual thinking is based on a hierarchy of skills. Sophisticated cogni-
tive skills build on simpler ones. We cannot begin to play chess until we
can identify the pieces. We will not become expert until we have learned
patterns involving whole confi gurations relating to strategic advantage or
danger. As we get skilled at a particular task, like chopping onions, the
operation eventually becomes semi-automatic. Th is frees up our higher-
level control processes to deal with higher level problems, such as how to
deal with an extra person coming to dinner. Th e process whereby cogni-
tive activities become automated is absolutely critical in the development
of expertise because of the fundamental limitations of visual and verbal
working memory capacities. If a set of muscle movements involved in
drawing a circle on paper becomes automated, then the designer has free
capacity to deal with arrangements of circles.
Review 171
CH09-P370896.indd 171CH09-P370896.indd 171 1/23/2008 7:04:28 PM1/23/2008 7:04:28 PM
Patterns of neural activation are not static confi gurations, but
sequences of fi ring. At the highest levels, involving the pre-frontal cor-
tex at the front of the brain and the hippocampus in the middle, these
sequences can represent action plans. Th is, too, is hierarchical. Complex
tasks, like cooking a meal, involve high-level plans that have the end goal
of getting food on the table, together with mid level plans, like peeling and
mashing potatoes, as well as with low level plans that are semi-automatic,
such as reaching for and grasping a potato.
A cognitive tool can be a map or a movie poster, but increasingly cogni-
tive tools are interactive and computer based. Th is means that every visual
object shown on the screen can be informative in its own right, as well as
be a link, through a mouse click, to more information. We may also be
able to manipulate that information object with our computer mouse, to
literally organize our ideas.
Th e sum of the cognitive processing that occurs in problem solving
is moving inexorably from being mostly in the head, as it was millennia
ago before writing and paper, to being a collaborative process that occurs
partly in the heads of individuals and partly in computer-based cognitive
tools. Computer-based cognitive tools are developing with great speed in
human society, far faster than the human brain can evolve. Any routine
cognitive task that can be precisely described can be programmed and
executed on a computer, or on millions of computers. Th is is like the auto-
mation of a skill that occurs in the brain of an individual, except that the
computer is much faster and less fl exible.
IMPLICATIONS Th e active vision model has four broad implications for design.
1. To support the pattern-fi nding capability of the brain; that is, to turn
information structures into patterns.
2. To optimize the cognitive process as a nested set of activities.
3. To take the economics of cognition into account, considering the
cost of learning new tools and ways of seeing.
4. To think about attention at many levels and design for the cognitive
thread.
DESIGN TO SUPPORT PATTERN FINDING Properly exploiting the brain ’ s ability to rapidly and fl exibly discover visual
patterns can provide a huge payoff in design. Th e following example, from
172
CH09-P370896.indd 172CH09-P370896.indd 172 1/23/2008 7:04:34 PM1/23/2008 7:04:34 PM

my own work, illustrates this. Over the past few years I have been fortu-
nate to be involved in a project to discover the underwater behavior of
humpback whales. Th e data was captured by a tag attached to a whale
with suction cups. When the tag cane off it fl oated to the surface and was
retrieved. Each tag provided several hours of data on the position and ori-
entation of the whale as it foraged for food at various depths in the ocean.
Th is gave us an unprecedented opportunity to see how humpback whales
behave when they are out of sight underwater.
Our fi rst attempt to provide an analysis tool was to create a program
that allowed ethologists to replay a moving three-dimensional model of
the whale at any desired rate. � Th ey were initially thrilled because for the
fi rst time they could see the whale ’ s underwater behavior. Some fascinat-
ing and previously unknown behavioral patterns were identifi ed by look-
ing at these replays. Nevertheless, although the visualization tool did its
job, analysis was extremely time consuming. It took many hours of watch-
ing to interpret an hour ’ s worth of data.
Using this replay tool, the visual thinking process can be roughly sum-
marized as follows. Th e whale movements were replayed by an ethologist
looking for stereotyped temporal sequences of movements . When some-
thing promising was observed the analyst had to remember it in order to
identify similar behaviors occurring elsewhere in a record. Th e ethologist
continued to review the replay looking for novel characteristic movement
patterns.
Although this method worked, identifying a pattern might take three or
four times as long as it took to gather the data in the fi rst place. An eight-
hour record from the tag could take days of observation to interpret. If
we consider the problem in cognitive terms the reason becomes clear. We
can remember at most only a half dozen temporal patterns in an hour of
video, and these may not be the important or stereotyped ones. Further,
GeoZu4D software allows for the underwater behavior of a humpback whale to be played back along with any sounds recorded from a tag attached to the whale by means of suction cups.
� This work is described in C. Ware,
R. Arsenault, M. Plumlee and D. Wiley.
2006. Visualizing the underwater
behavior of humpback whales. IEEE
Computer Graphics & Applications,
July/August issue. 14–18.
Design to Support Pattern Finding 173
CH09-P370896.indd 173CH09-P370896.indd 173 1/23/2008 7:04:34 PM1/23/2008 7:04:34 PM
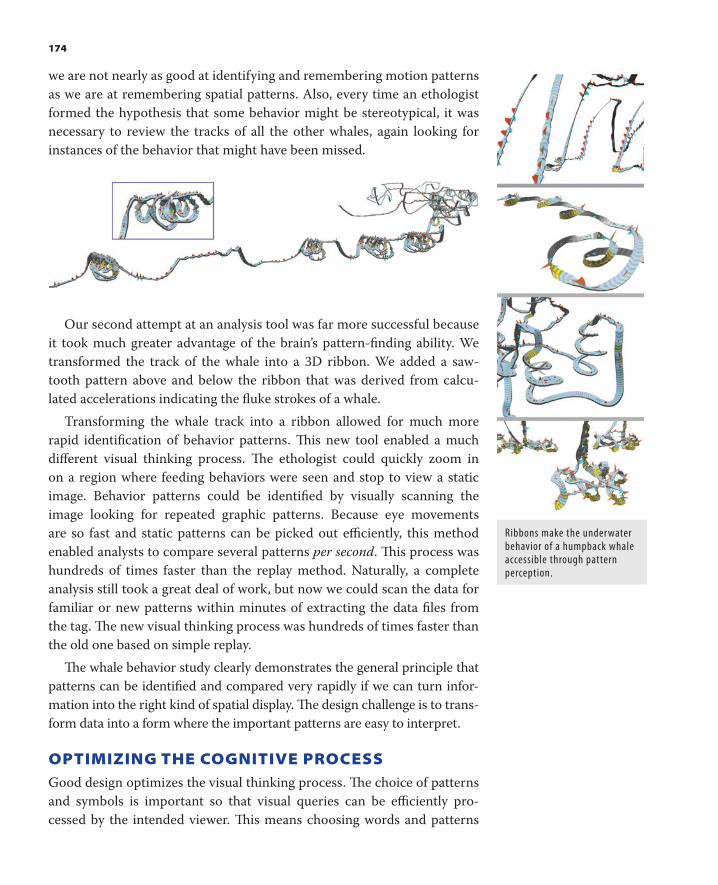
we are not nearly as good at identifying and remembering motion patterns
as we are at remembering spatial patterns. Also, every time an ethologist
formed the hypothesis that some behavior might be stereotypical, it was
necessary to review the tracks of all the other whales, again looking for
instances of the behavior that might have been missed.
Our second attempt at an analysis tool was far more successful because
it took much greater advantage of the brain ’ s pattern-fi nding ability. We
transformed the track of the whale into a 3D ribbon. We added a saw-
tooth pattern above and below the ribbon that was derived from calcu-
lated accelerations indicating the fl uke strokes of a whale.
Transforming the whale track into a ribbon allowed for much more
rapid identifi cation of behavior patterns. Th is new tool enabled a much
diff erent visual thinking process. Th e ethologist could quickly zoom in
on a region where feeding behaviors were seen and stop to view a static
image. Behavior patterns could be identifi ed by visually scanning the
image looking for repeated graphic patterns. Because eye movements
are so fast and static patterns can be picked out effi ciently, this method
enabled analysts to compare several patterns per second . Th is process was
hundreds of times faster than the replay method. Naturally, a complete
analysis still took a great deal of work, but now we could scan the data for
familiar or new patterns within minutes of extracting the data fi les from
the tag. Th e new visual thinking process was hundreds of times faster than
the old one based on simple replay.
Th e whale behavior study clearly demonstrates the general principle that
patterns can be identifi ed and compared very rapidly if we can turn infor-
mation into the right kind of spatial display. Th e design challenge is to trans-
form data into a form where the important patterns are easy to interpret.
OPTIMIZING THE COGNITIVE PROCESS Good design optimizes the visual thinking process. Th e choice of patterns
and symbols is important so that visual queries can be effi ciently pro-
cessed by the intended viewer. Th is means choosing words and patterns
Ribbons make the underwater behavior of a humpback whale accessible through pattern perception.
174
CH09-P370896.indd 174CH09-P370896.indd 174 1/23/2008 7:04:35 PM1/23/2008 7:04:35 PM

each to their best advantage. When designing the visual interface to an
interactive computer program we must also decide how the visual infor-
mation should change in response to every mouse click.
Extraordinarily powerful thinking tools can be made when a visual
interface is added to a computer program. Th ese are often highly spe-
cialized—for example, for stock market trading or engineering design.
Th eir power comes from the fact that computer programs are cognitive
processes that have been standardized and translated into machine exe-
cutable form. Th ey offl oad cognitive tasks to machines, just as mechani-
cal devices, like road construction equipment, offl oad muscle work to
machines. Once offl oaded, standardized cognitive tasks can be done
blindingly fast and with little or no attention. Computer programs do
not usually directly substitute for visual thinking, although they are get-
ting better at that too; instead they take over tasks carried out by humans
using the language processing parts of the brain, such as sophisticated
numerical calculations. A visual interface is sometimes the most eff ective
way for a user to get the high volume of computer-digested information
that results. For example, systems used by business executives condense
large amounts of information about sales, manufacturing, and transporta-
tion into a graphical form that can be quickly interpreted for planning and
day-to-day decision making.
It is useful to think of the human and the computer together as a single
cognitive entity, with the computer functioning as a kind of cognitive co-
processor to the human brain. � Low-bandwidth information is transmit-
ted from the human to the computer via the mouse and keyboard, while
high-bandwidth information is transmitted back from the computer to the
human for fl exible pattern discovery via the graphic interface. Each part of
the system is doing what it does best. Th e computer can pre-process vast
amounts of information. Th e human can do rapid pattern analysis and
fl exible decision making.
Co
mp
ute
rA
na
lysi
s High bandwidth visual informationvia display
Visual pattern analysis and flexible decision making
Low bandwidth instructionsvia mouse and keyboard
�
The term ‘ cognitive co-processor ’
comes from a paper from Stuart Card ’ s
famous user interface research lab at
Xerox Palo Alto Research Center (PARC)
although I am using it in a somewhat
differrent sense here. Robertson,
S. Card and J. Mackinlay. 1989. The
cognitive co-processor for interactive
user interfaces. Proceedings of the ACM
UIST Conference. 10–18.
Optimizing the Cognitive Process 175
CH09-P370896.indd 175CH09-P370896.indd 175 1/23/2008 7:04:38 PM1/23/2008 7:04:38 PM

Peter Pirolli and Stuart Card developed a theory of information access
to help with the design of interfaces to cognitive tools. Th ey began with
the foraging theory developed by ethologists to account for animal behav-
ior in the wild. Most wild animals spend the bulk of their time in a highly
optimized search for food. To survive they must balance the energy
expended in fi nding and consuming food—just eating and digesting has
a high cost for grazing animals—with the energy and nutrients obtained.
Th ey found that people forage for information on the Internet much as
animals forage for food; they are constantly making decisions about what
information scent (another term from Stuart Card ’ s Infl uential laboratory)
to follow, and they try to minimize how much work they must do, offl oad-
ing tasks onto the computer wherever possible. �
Th e ideal cognitive loop involving a computer is to have it give you
exactly the information you need when you need it. Th is means having
only the most relevant information on screen at a given instant. It also
means minimizing the cost of getting more information that is related to
something already discovered. Th is is sometimes called drilling down .
It might be thought that an eye tracker would provide the ideal method
for drilling down, since eye movements are the natural way of getting
objects into visual working memory. Eye tracking technology can deter-
mine the point of gaze within about one centimeter for an object at arm ’ s
length. If the computer could have information about what we are look-
ing at on a display, it might summon up related information without being
explicitly asked.
Th ere are two problems with this idea. First, tracking eye movements
cheaply and reliably has proven to be technically very diffi cult. Eye track-
ers required careful and repeated calibration for each user. Second, when
we make eye movements we do not fi xate exactly; we usually pick up
information in an area of about one centimeter around the fovea at nor-
mal computer screen viewing distances and this area can contain several
informative objects. Th is means the computer can only ‘ know ’ that we
might be interested in any of several things. Showing information related
to all of them would be more of a hindrance than a help.
Th e quickest and most practical method for drilling down is the mouse-
over hover query . Imagine that by moving the mouse over a part of a dia-
gram all the other on-screen information relating to the thing the mouse is
moving over becomes highlighted and the relevant text enhanced so that it
can be easily read. Th is is exactly what was done by Tamara Munzner and
a team at Stanford University in their experimental Constellation system
seen on the next page. � Th eir application was a kind of network diagram
�
P. Pirolli and S. Card. 1999.
Information foraging. Psychological
Review. 106: 643–675.
�
T. Munzner, F. Guimbretiere and
G. Robertson. 1999. Constellation: A
visualization tool for linguistic queries
from MindNet. Proceedings of IEEE
InfoVis. Conference , San Francisco.
132–135.
176
CH09-P370896.indd 176CH09-P370896.indd 176 1/23/2008 7:04:38 PM1/23/2008 7:04:38 PM

showing the relationships between words. Th e diagram was far too com-
plex to be shown on a screen in any normal way, but by making it inter-
active hundreds of data objects could be made usable. Compare this to a
typical network diagram, in which only between ten and thirty nodes are
represented, and the advantage becomes clear. Th is kind of mouse-over
clickless hover query is the next best thing to moving the eyes around an
information space. Clickless hover queries can be made only about once
a second, slow compared to three per second mouse movements, but this
still leads to a very rapid interaction where the computer display seems
like part of the thinking process, rather than something to be consulted.
Constellation was a single example of an experimental user interface,
but it provides a more general lesson. Th e ideal computer system that sup-
ports visual thinking should be extremely responsive, presenting relevant
information just at the moment it is needed. Th is is not easy to achieve,
but something for which to strive.
It should be noted that the most common application of hover que-
ries is in so-called “ tool-tips. ” Th ese are the presentation of additional
information about a menu item or icon when the mouse is placed over it.
Generally these are implemented so that a delay of a second or two occurs
between the query and the information display. Th is is probably appropri-
ate for tool-tips because we do not want such information to be constantly
popping up, but it would not be appropriate for more tightly coupled
human-computer systems. Such a long delay would do serious damage to
the effi ciency of the cognitive loop that is supported by Constellation.
LEARNING AND THE ECONOMICS OF COGNITION Many of the visual problems we solve in life seem completely mundane:
walking across a room, preparing a salad, looking for a road sign. Th ey
are mundane only because we have done them so often that we no lon-
ger consider them as requiring thinking at all. When we are born we have
little visual skill except the basic minimum needed to identify that some-
thing is an “ object ” and a special propensity to fi xate on human faces.
Newborns do, however, have the neural architecture that allows the capa-
bilities to develop. � Everything else is a learned skill and these skills make
up who we are. Our visual skills vary from the universal, like the ability to
reach for and grasp an object, to the very specialized, like determining the
sex of chicks, a very diffi cult visual pattern matching task that can only be
done by highly trained experts.
All cognitive activity starts off being diffi cult and demanding atten-
tion. As we develop skills the neural pathways involved in performing the
�One of the most important fixed
architectural cognitive capacities is
the three-item limit in visual working
memory. Even this is somewhat
mutable. A recent study showed that
video game players can enhance their
visual working memory capacities from
three to four items. But we do not find
people with a working capacity of ten
items.
See C.S. Green and D. Bavelier. 2003.
Action video game modifies visual
selective attention. Nature. 423:
534–537.
Learning and the Economics of Cognition 177
CH09-P370896.indd 177CH09-P370896.indd 177 1/23/2008 7:04:39 PM1/23/2008 7:04:39 PM

task are strengthened. Th ese neural pathways carry particular patterns of
activation, and strengthening them increases the effi ciency of sequences
of neural fi ring (the cognitive activities). Th e cognitive process becomes
more and more automatic and demands less and less high-level attention.
Th e beginning typist must use all his cognitive resources just to fi nd the
letters on the keyboard; the expert pays no attention to the keys. Th e use
of drawing tools by an engineer or graphic designer is the same.
Sometimes we have a choice between doing something in an old, famil-
iar way, or in a new way that may be better in the long run. An exam-
ple is using a new computer-based graphic design package, which is very
complex, having hundreds of hard-to-fi nd options. It may take months to
become profi cient. In such cases we do a kind of cognitive cost-benefi t
analysis weighing the considerable cost in time and eff ort and lost produc-
tivity against the benefi t of future gains in productivity or quality of work.
Th e professional will always go for tools that give the best results even
though they may be the hardest to learn because there is a long-term pay-
off . For the casual user sophisticated tools are often not worth the eff ort.
Th is kind of decision making can be thought of as cognitive economics.
Its goal is the optimization of cognitive output.
A designer is often faced with a dilemma that can be considered in
terms of cognitive economics. How radical should one make the design?
Making radically new designs is more interesting for the designer and
leads to kudos from other designers. But radical designs, being novel, take
more eff ort on the part of the consumer. Th e user must learn the new
design conventions and how they can be used. It is usually not worth try-
ing to redesign something that is deeply entrenched, such as the set of
international road signs because the cognitive costs, distributed over mil-
lions of people, are high. In other areas, innovation can have a huge payoff .
Th e idea of an economics of cognition can be fruitfully applied at many
cognitive scales. In addition to helping us to understand how people make
decisions about tool use, it can be used to explain the moment-to-moment
prioritization of cognitive operations, and it can even be applied at the
level of individual neurons. Sophie Deneve of the Institute des Sciences
Cogitives in Bron, France, has developed the theory that individual neu-
rons can be considered as Bayesian operators, “ accumulating evidence
about the external world or the body, and communicating to other neu-
rons their certainties about these events. ” It her persuasive view each neu-
ron is a little machine for turning prior experience into future action. �
Th ere are limits, however, to how far we can take the analogy between
economic productivity and cognitive productivity. Economics has money
� In 1763 the Reverend Thomas Bayes
came up with a statistical method for
optimally combining prior evidence
with new evidence in predicting events.
For an application of Bayes ’ theorem to
describe neural activity, see S. Deneve,
Bayesian Inference in Spiking Neurons.
Published in Advances in Neural
Information Processing Systems. Vol.
17. MIT Press, 1609–1616.
178
CH09-P370896.indd 178CH09-P370896.indd 178 1/23/2008 7:04:42 PM1/23/2008 7:04:42 PM
as a unifying measure of value. Cognitive processes can be valuable in many
diff erent ways and there is potentially no limit on the value of an idea.
ATTENTION AND THE COGNITIVE THREAD A revolution is taking place in the science of human perception and atten-
tion is its core concept. In some ways attention is a grab bag of an idea,
operating diff erently in diff erent parts of the brain. At the early stage of
visual processing, attention biases the patterns which will be constructed
from raw imagery. Diff erent aspects of the visual images are enhanced or
suppressed according to the top-down demands of the cognitive thread.
An art critic ’ s visual cortex at one moment may be tuned to the fi ne tex-
ture of brush strokes, at another to the large-scale composition of a paint-
ing, and at yet another to the color contrasts. Attention is also the very
essence of eye movement control because looking is a prerequisite for
attending. When we wish to attend to something, we point our eyeballs at
it so that the next little bit of the world we are most interested in falls on
the fovea. Th e planning of eye movements is therefore the planning of the
focus of attention, and the sequence of eye fi xations is intimately tied to
the thread of visual thinking.
Visual working memory is a process that is pure attention. It is a
momentary binding together of visual features and patterns that seem most
relevant to the cognitive thread. Th ese constructions are short lived, most
lasting only a tenth of a second, or less than the duration of a single fi xa-
tion. A few persist through a series of successive fi xations, being recon-
nected to the appropriate parts of the visual image after each one. Some
visual working memory constructions are purely imaginary and not based
on external imagery. When an artist is contemplating a stroke of a pen, or
an engineer is contemplating the alteration of a design, mentally imaged
potential marks on the paper can be combined with information from the
existing sketch. Th e combination of imaginary with the real is what makes
visual thinking such a marvel and is a key part of the internal-external
dance of cognition.
Th ere is a basic cycle of attention. Between one and three times a sec-
ond our brains query the visual environment, activate an eye movement to
pick up more information, process it, and re-query. Th e information picked
up becomes the content of visual working memory. Th is cycle provides
the basic low-level temporal structure of the cognitive thread. At a higher
level the cognitive thread can have a wide variety of forms. Sometimes
the cognitive thread is largely governed by external information coming
through the senses. In the case of a movie the cinematographer, directors,
Attention and the Cognitive Thread 179
CH09-P370896.indd 179CH09-P370896.indd 179 1/23/2008 7:04:42 PM1/23/2008 7:04:42 PM
and actors can, to a large extent, control the cognitive thread of the audi-
ence. Th is is not to deny each person in an audience their own thoughts
and opinions about what they are seeing, but they will look at the same
images, and even the same parts of those images in the same order. Th e
objects constructed in a hundred visual and verbal working memories will
be similar and occur in the same order.
Most of the time our visual cognitive thread is occupied with mundane
things, like fi nding the path in front of us, picking up an object or watch-
ing someone ’ s face as they talk to integrate information from their facial
expression with what they are saying. Th ese tasks are highly learned and
so most of the time we are not aware of doing them; nevertheless, they do
take up our attentional capacity.
Sometimes the cognitive thread is up for grabs. Someone walking,
bored, along a fl at, unobstructed sidewalk only requires a small amount of
visual attention to keep to the path and the rest of his attentional capacity
is a kind of free resource. Such a person is likely to give a second glance to
anything that is even slightly novel, especially if it is moving.
Th ere is also the visual thinking process that occurs when someone
reasons with a graphic design as an external aid. A map reader is carrying
out a very goal directed query loop that involves both the rough logic of
the language processing system together with the pattern-fi nding capabil-
ity of the visual system.
To add to the diversity of attention, the cognitive thread shifts back
and forth between visual processing and language-processing modali-
ties. Sometimes it is primarily visual, or visual and motor, as when we are
doing something like tracing out a line with a pen. Sometimes it is driven
by the language modules of the brain. We cannot do more than one visual
task at a time, and we cannot do more than one verbal task at a time. But
we can carry out a verbal task, such as talking on a cell phone, and another
visual motor task, like folding laundry, at the same time, if one of them
is a highly learned skill. Th e separation is not perfect and people driving
while talking on phones are undoubtedly more dangerous, but these are
examples of real multi-tasking using visual and verbal channels to semi-
independently carry out two cognitive tasks at once. Nevertheless, it is
when visual and language modalities are combined that the brain is most
eff ective. A well-designed presentation, for example, will use words and
graphics, each to convey diff erent kinds of information and the two kinds
of information will be linked using pointing or simple proximity in space
and time.
180
CH09-P370896.indd 180CH09-P370896.indd 180 1/23/2008 7:04:42 PM1/23/2008 7:04:42 PM
WHAT ’ S NEXT? Th e science of human perception is continuing to advance and the
account of visual thinking given in this book will, to some extent, be obso-
lete before it hits the bookstores. As research moves forward, our increas-
ing knowledge of the human brain and perception will lead us in new and
exciting directions. I believe, however, that the broad picture of how visual
thinking works is essentially correct and will stand the test of time. Th ere
is a feeling among vision scientists that the secrets of the brain are at last
becoming unlocked and that the outlines of lasting theories are beginning
to emerge.
One way forward for the science and art of design is for computers
to get in on the act. Already programs such as John Anderson ’ s ACT-R
can simulate the activities of the human brain as it carries out cognitive
tasks. � Th ese simulations incorporate ideas of attention and visual work-
ing memory, although they lack more subtle concepts such as novelty and
emotional content. Nevertheless, these programs are being used to test
computer interface designs for information systems. A virtual human with
an ACT-R brain can be used to test a particular computer interface design
that includes, to a limited extent, its graphic design. Th e design can be
changed depending on its results and the program run again to see if the
new design leads to more effi cient cognition. Because computers are fast,
many more interface designs can be tested faster than using real humans
for the tests, and computers can be used to automatically make design
alterations ultimately eliminating the human designer.
Of course, we do not have to go the ACT-R route. Th e science of per-
ception can and should enrich the craft of design, not take it over. As
someone who loves both the science of perception and the art of design,
I believe that they should not be antagonistic; instead the two disciplines
should learn from and mutually support one another.
Ultimately the science of perception must take design into account
because the designed world is changing people ’ s thinking patterns. Real
world cognition increasingly involves computer-based cognitive tools that
are designed to support one mode of thinking or another. Th is cognitive
support environment is developing and evolving from year to year in a
process that is happening much faster than evolution. Designed tools can
change how people think.
Th e human brain evolved in a world made up of natural objects: plants,
rocks, earth, sky, other humans, and animals. None of these were explic-
itly designed by early humans, although like other animals humans have
�
J.R. Anderson. 1996. ACT: A simple
theory of complex cognition. American
Psychologist. 51: 355–365.
What’s Next? 181
CH09-P370896.indd 181CH09-P370896.indd 181 1/23/2008 7:04:42 PM1/23/2008 7:04:42 PM

182
always shaped their environments. Most people now live in cities where
almost everything has been designed. Our visual thinking skills are shaped
by how we interact with this world of designed objects from the moment
we fi rst open our eyes. Objects in our modern environment incorporate
computer programs, and some of them are explicitly designed as cognitive
tools. At work or at play, many of us are in front of computer screens for a
signifi cant percentage of our lives. For many people the manipulation of a
mouse or video game controller is as skilled and entrenched as any basic
life skill. Many modern teenagers are more skilled at navigating three-
dimensional virtual worlds with a game controller than they are at run-
ning over rough real-world terrain. Visual design must take into account
both the relatively fi xed capacities of the human brain as well as the evolv-
ing skill sets of people who use sophisticated and powerful cognitive tools.
Interactive design is becoming ever more important as the loop coupling
humans and computers tightens. Th e visual system will always be the
highest bandwidth sense by far, and making full use of its fl exible pattern-
fi nding capabilities can provide great benefi ts.
CH09-P370896.indd 182CH09-P370896.indd 182 1/23/2008 7:04:42 PM1/23/2008 7:04:42 PM

183
Index
A
Abstractions, and diagrams , 155–156
Action maps, in parietal lobe , 101
Active vision model, and design , 172
Actors, change detection experiment , 1–2
ACT-R software, function , 181
Advertisements
images as symbols , 124
as visualizations , 20
and visual novelty , 122
American Sign Language (ASL) , 130
Anderson, John R. , 181
Apprehendability
defi nition , 55
multi-chunk pattern queries , 56
Architects
and diagrams , 155
as sketchers , 158
Arrows, in diagrams , 155–156
Artifi cial interactive spaces
information access design , 103
naive physics of perception , 102
Artists, and diagrams , 155
ASL , see American Sign Language (ASL)
Attention
basic cycle , 179–180
and color-opponent channels , 73–74
and early processing , 179
and eye movements , 9
and graphic design , 3
and mundane tasks , 180
in pop out experiments , 28–29
and seeing , 3
street signs , 35
and top-down processes , 12
in two-dimensional space , 52–53
visual vs. language processing , 180
in visual narrative , 140–141
and working memory , 115–116, 179
Away dimension, in 2.5D space , 44–45
Axonometric projection, defi nition , 92
B
Ballard, Dana , 13
Bayes, Th omas , 178
Bayesian operators, neurons as , 178
Baynton, Douglas , 130
Beach scenes, perception , 112–113
IDX-P370896.indd 183IDX-P370896.indd 183 1/24/2008 5:55:14 PM1/24/2008 5:55:14 PM

184
Beck, Harry , 15–16
Bell, Alexander Graham , 130
Biased competition model
defi nition , 119
in eye movement planning , 26–27
Biederman, Irving , 110
Binding problem, two-dimensional space , 46–49
Biomotion perception, patterns , 54
Black-white channel
and color-opponent theory , 84–85
and maps , 82
in opponent process theory , 68
Blakeslee, Sandra , 11
Blind spot, and visual fi eld , 8
Bolt, Richard , 135
Bottom-up processes
defi nition , 8, 9
feature processing stage , 10
objects , 10–11
pattern construction , 10
patterns , 12
visual working memory , 11
Brain
and attention , 9
components , 24
and computer co-processing , 175
distributed cognition , 19–20
evolution , 181–182
and eye function , 5
in eye movement sequence , 14
and mental imagery , 151
nested loop operation , 17–19
neuron-based processing clock , 3
object identifi cation , 111–112
pattern-testing loop , 40
seeing and cognition , 2
self-control , 171
and sign languages , 130
and stereoscopic depth , 94
as thinking component , 166
and visual fi eld , 8
Brain pixels
and detection fi eld , 37–38
and 2.5D space , 44
form and function , 5, 7
and information transfer , 10
Brainstorming, via scribbling , 154
Brightness, color-opponent channels , 72
British Sign Language (BSL) , 130
Broca ’ s area, and verbal working memory , 115
BSL , see British Sign Language (BSL)
Business process design, example , 98
C
Calatrava, Santiago , 158, 159
Card, Stuart , 175–176
Cartoon strips
defi nition , 142
and short-term prediction , 142
as strong narratives , 145
Cash, Johnny , 124
Cast shadows, defi nition , 92
Change detection experiment , 1–2
Channels
black-white channel , 68, 82, 84–85
color-opponent channels , 68–74, 78–80, 84–85
feature channels , 31, 33
red-green channel , 68, 70, 71, 84–85
in two-dimensional space , 52–53
yellow-blue channel , 68, 70, 84–85
Children, and computer interaction , 103
Chromatic color, in color-opponent channels , 73
Cinematographers
framing , 139–140
shot transitions , 141–142
Clarity
and color design , 85
in graphic design , 35
A Clockwork Orange , 107
Coca Cola, images as symbols , 124
Cognitive aff ordances
artifi cial interactive spaces , 102–103
concept developments , 99
defi nition , 99
example , 100
and space traversal , 104
and where pathway , 100–102
Cognitive cost, and space traversal , 103–105
Cognitive economics
design sketching , 158–160
IDX-P370896.indd 184IDX-P370896.indd 184 1/24/2008 5:55:16 PM1/24/2008 5:55:16 PM

Index 185
and visual learning , 177–179
Cognitive process
brain and computer , 175
optimization , 174–177
and working memory , 115–116
Cognitive resources
computer-based , 172
and seeing , 2
Cognitive tasks
and graphic design , 14–15
imagery and desire , 126
Cognitive thread, in visual narrative , 138–139
Cognitive walk-through, design prototypes , 162–163
Cohen, Jonathan , 116
Colby, C. L. , 14
Color
and pop-out eff ects , 30, 31, 32
semantics , 84
on shaded surfaces , 83
Color appearance, and color-opponent channels , 74
Color blindness, in color-opponent channels , 73
Color coding
basic considerations , 77
color sequences , 80–83
large and small areas , 77–78
Color design
and clarity , 85
showing detail , 75–76
Color-opponent channels
basic considerations , 68–69, 84–85
chromatic color , 73
color appearance , 74
color and attention , 73–74
color blindness , 73
color segmentation , 72–73
color solids , 74
contrast , 69–70
emphasis and highlighting , 78–80
luminance, lightness, brightness , 72
luminance nonlinearity , 72
luminance and saturation , 72
motion , 70
saturation , 72
shape-from-shading , 70–71
spatial detail , 70
stereoscopic depth , 70
unique hues , 70
Color processing, basic machinery , 66–68
Color segmentation, color-opponent channels , 72–73
Color sequences, in color coding , 80–83
Color solids, and color-opponent channels , 74
Color vision
basic processing machinery , 66–68
channel properties , 69–72
opponent process theory , 68–69
overview , 65–66
Commerce, visualization applications , 20
Computer interfaces
and brain co-processing , 175
and children , 103
as cognitive tools , 172
design , 36
and space traversal , 104
thinking tools , 175
Computer software
ACT-R , 181
design diagrams , 155
GeoZu4D , 173
graphical vs. written programming , 132
interface additions , 175
learning , 178
nested processes , 18–19
Photoshop, and visual novelty , 123
and visual novelty , 123
Computer systems
parallel computing , 26
and visual working memory , 11
Concept diagram, examples , 160
Cone receptors
in color processing , 66–67
and color space , 74
in eye , 5
Connor, Charles , 53
Conscious awareness, and visual world , 3
Consciousness experience, change detection
experiment , 2
Consequences, and long-term memory , 117–118
Consistency, in graphic design , 35
Consolidation, in creative process , 148
Constellation system, characteristics , 176–177
IDX-P370896.indd 185IDX-P370896.indd 185 1/24/2008 5:55:16 PM1/24/2008 5:55:16 PM

186
Constructive critique, in creative process , 148
Constructive perception
in creative design , 158
and visual imagination , 152
Contour extraction mechanism
in pattern processing , 49
in scribbles , 152–153
Contours
in binding problem , 46–49
generalized contour , 49–50
and pattern for design , 58
Contrast
in color-opponent channels , 69–70
degree , 93
in texture , 50
and visual distinctness , 29
Copycat cells, defi nition , 137
Cornea, form and function , 7
Crames, Christy , 80
Creative design
cognitive economics of sketching , 158–160
perceptual critique , 160–162
prototypes , 162–163
Creative process
and mental imagery , 150
scribble exercise , 153
steps , 148
D
Data analysis
and color coding , 81
and three dimensions , 97
Deictic gestures, defi nition , 135–136
Dendrites, and binding , 47
Deneve, Sophie , 178
Depth cues
components , 91–93
defi nition , 89–90
in 2.5D space , 45
stereoscopic depth , 70, 100
stereoscopic depth perception , 94–95
structure from motion , 95
and 2.5 design , 95–97
types , 90
Depth of focus, defi nition , 93
Depth perception, and physical world , 89
Design process
computer applications , 106
early requirements , 156–157
for information access , 103
object identifi cation , 121
Desire, and imagery , 125–126
Detail
in color design , 75–76
in color-opponent channels , 70
via fovea , 5–6
sensitivity to , 36
and 2.5 design , 96
and visual novelty , 123
Detection fi eld
and brain pixels , 37–38
defi nition , 38
scanning strategy , 38
Diagrams
and abstract meaning , 155–156
defi nition , 155
examples , 155
in visual designs , 131
Diexis, for word and image linking , 135–136
Digital camera, eye as , 5
Dimensions
away dimension , 44–45
sideways dimensions , 44–45, 89
three-dimensional space , 97–99, 102, 110
towards-away dimension , 89, 90
2.5 dimensions , 44–45
up dimension , 89
Direction, in pattern perception , 57–58
Distributed cognition, in visual queries , 19–20
Drilling down
defi nition , 176
hover query , 176–177
Drive, and cognitive cost , 104
Duhamel, J. R. , 14
E
Eames, Charles , 105
Eames, Ray , 105
Echoic loop, in verbal working memory , 115
Edge detector neurons
IDX-P370896.indd 186IDX-P370896.indd 186 1/24/2008 5:55:16 PM1/24/2008 5:55:16 PM

Index 187
and binding problem , 47
function , 48
Egocentric space, dimensions , 89
Ekman, Paul , 137
Emergence, into visual fi eld , 36
Emotion, in scenes and objects , 124–125
Emphasis, in color-opponent channels , 78–80
Enfants sauvage, defi nition , 130
Engineering
design requirements , 156–157
and diagrams , 155
Environment
scanning strategies , 38–39
and visual distinctness , 29
Error-checking, in map planning , 17
Establishing shot, in visual narrative , 142
Experiments, change detection , 1–2
Explicit memory, defi nition , 117
Extension, in creative process , 148
External consequences, and long-term memory , 117
Externalization, in creative process , 148
Eye
in brain model , 24
as digital cameras , 5
form and function , 7
muscle function , 7
as thinking component , 166
Eye movements
and cognitive cost , 104
control loop , 39–40
and faces , 32
for information retrieval , 87–88
and mental imagery , 150, 151
nested loops , 18
and perception , 20–21
planning , 26–27
in seeing and cognition , 3
sequence , 13–14
and shot transitions , 141
and thinking in action , 121
tracking , 176
and 2.5D space , 45
and visual attention , 9
and where pathway , 102
Eye muscles, function , 7
F
Face recognition, and viewpoint , 108–109
Faces, and pop-out eff ects , 32
Facial expressions, and attention , 9
Faigin, Gary , 138
Feature analysis
in binding problem , 46–49
low-level machinery , 25, 168
and pop-out eff ects , 31
as thinking component , 167
Feature channels
in design , 33
and pop-out eff ects , 31
Feature detectors, and pattern perception , 56
Feature processing, bottom-up processes , 10
Features, and attention , 9
Field of information, consciousness , 3
Findlay, John , 14
Fingers of instantiation (FINSTS)
and cartoon strips , 142–143
in visual narrative , 140–141
FINSTS , see Fingers of instantiation (FINSTS)
Fixation, and thinking in action , 120–121
Flach, Tim , 123
Flowchart, as visual language , 132–133
Fly, and cognitive cost , 104
fMRI , see Functional magnetic resonance imaging
(fMRI)
Foraging theory, defi nition , 176
Fovea
brain pixels , 5
rapid eye movements , 7
visual detail , 5–6
Framing, in visual narrative , 139–140
Franklin, R. G. , 144
Fruit eaters, color vision , 65–66
Functional magnetic resonance imaging (fMRI)
mental imagery studies , 150–151
visual skill studies , 163
G
Ganis, Georgio , 150
Generalized contour mechanism,
characteristics , 49–50
Generalized views, and face recognition , 109
IDX-P370896.indd 187IDX-P370896.indd 187 1/24/2008 5:55:16 PM1/24/2008 5:55:16 PM

188
Geon theory, defi nition , 110–111
GeoZu4D software, and whale movements , 173
Gestalt, defi nition , 10
Gestures
deictic gestures , 135–136
in presentations , 137
Gibson, James , 99
Gilchrist, Ian , 14
Gist perception
defi nition , 112
embedded objects , 114
scenes , 113
and visual novelty , 122–123
Goldberg, M. E. , 14
Th e Graduate , 140
Grain size, in texture , 50
Grammar, in natural language , 132–133
Graphical artifacts, in pattern queries , 60–62
Graphic designs
and active vision model , 172
via attention and perception , 3
and cognitive process optimization , 174–175
colors , 33
computer interfaces , 36
consistency vs. clarity , 35
and constructive seeing , 170
and degree of contrast , 93
diffi culty in , 21
feature channels , 33
future research , 181–182
goals , 14–15
map example , 15–17
multiscale structures , 40–41
and pattern fi nding , 172–174
pattern for , 58–59
and semantic pattern mappings , 62
software package learning , 178
symbols , 34
tunability , 34
as visual and language hybrids , 134
Grass eaters, color vision , 65
H
Hand movements, and stereoscopic depth perception ,
94
Hard-to-discriminate textures, examples , 51
Hawkins, Jeff , 11, 142
Hayhoe, Mary , 13
Highlighting, in color-opponent channels , 78–80
Hillstrom, A. P. , 36
Hippocampus, and long-term memory , 117
Homunculus fallacy, defi nition , 47
Horizontal direction, in pattern perception , 57–58
Hover query, in drilling down , 176–177
Hubel, David , 25
Hues, in color-opponent channels , 70
Hyperlink, and cognitive cost , 105
I
Ideas, into diagrams , 155
Imagery
and desire , 125–126
mental , see Mental imagery
as symbols , 123–124
word linking , 135–136
Implicit memory, defi nition , 117
Impression, awake world view , 1
Inferotemporal cortex (IT)
and information reception , 109
and intermediate patterns , 53
and mind control , 171
and pattern learning , 55
and pattern processing , 46
and pattern recognition , 168
and patterns , 114
and scene perception , 113
and visual working memory , 118–119
and what channel , 108–109
Information access
and cognitive co-processing , 175
and cognitive cost , 105–106
and cognitive thread , 138
in depth cues , 89–90
effi cient design , 103
and eye movements , 87–88
foraging theory , 176
and long-term memory , 117
and structure from motion , 95
as thinking component , 168–169
for third dimension , 97–99
IDX-P370896.indd 188IDX-P370896.indd 188 1/24/2008 5:55:16 PM1/24/2008 5:55:16 PM
Index 189
and visual area , 4, 109
and working memory capacity , 126–127
Information processing
and multimodal connections , 108
visual representations , 133
Information scent, defi nition , 176
Interactive graphic display, Tubeguru ™ , 17
Interference, in two-dimensional space , 51
Intermediate patterns, characteristics , 53–54
Internal consequences, and long-term memory , 117
IT , see Inferotemporal cortex (IT)
J
Jiricna, Eva , 155
Just-in-time strategy, in eye movement sequence , 14
K
Kanwisher, Nancy , 49
Katz, Steven , 139
Kennedy, John M. , 152
Kitchens, aff ordances , 100
Known objects, referencing , 93
Kosslyn, Stephen M. , 148, 150, 151
Kourtzi, Zoe , 49
L
Laeng, Bruno , 150
Lakoff , George , 62
Language-based thinking, vs. visual thinking , 130–131
Language processing
and attention , 180
as thinking component , 169
Lateral geniculate nucleus
in brain model , 24
and visual area , 1, 25
Lateral interparietal area, function , 39
Lateral intraparietal lobe (LIP), and visual space , 101
Lateral occipital cortex (LOC)
and generalized contour , 49
in pattern processing , 46
Lawson, Bryan , 158
Learnability, in color coding , 77
Learned symbols, in sign language , 131
Lens, form and function , 7
Levin, Daniel , 1–2
Levy, Ellen , 119
Lightness, color-opponent channels , 72
Light receptors, in retina , 7
Linear perspective, defi nition , 92
Lines, and contour extraction mechanism , 152–153
LIP , see Lateral intraparietal lobe (LIP)
LOC , see Lateral occipital cortex (LOC)
Logic, in natural language , 132–133
Logical propositions, in mental imagery , 148
London Underground map, as design example , 15–17
Long-term memory
and consequences , 117–118
defi nition , 116
explicit and implicit , 117
and hippocampus , 117
and situated interactions , 116–117
as thinking component , 170
Long-term priming, defi nition , 118
Look-aheads, in eye movement sequence , 14
Loops, in visual searches , 39–40
Low-level feature analysis
machinery , 25–26
and pop-out eff ects , 31
Luminance
color-opponent channels , 72
and detail , 75–76
and highlighting , 79
and shading , 83
M
Mackinlay, Jock , 175
Magritte, Rene , 123
Maps
action , 101
cognitive plan , 16–17
color coding , 80–83
contour map reading , 171
graphic design implications , 15
and information retrieval , 88
London Underground map , 15–17
in parietal lobe , 101
pattern fi nding , 46
picture planes , 92
road map sample , 59
and thinking process , 180
water currents and temperature , 59
IDX-P370896.indd 189IDX-P370896.indd 189 1/24/2008 5:55:16 PM1/24/2008 5:55:16 PM

190
Masseroni, Manfredo , 153
Meaning
defi nition , 165
in scenes and objects , 124–125
Mediaeval cityscape, scene perception , 113
Medial intraparietal lobe (MIP), and visual space , 101
Memory
implicit and explicit , 117
long-term memory , 116–118, 170
spatial, for scenes , 109
as thinking component , 170
working memory , 3, 9, 11, 88, 114–116, 118–121,
126–127, 158–159, 161, 177, 179
Memory aids, as thinking component , 169
Mental activity, in mental imagery , 149–150
Mentalese, defi nition , 133
Mental imagery
and eye movements , 150
as internalized active process , 152
as mental activities , 149–150
as normal seeing , 148–149
as symbolic and non-spatial , 148
Meta-seeing
cognitive economics of sketching , 158–160
perceptual critique , 160–162
prototypes , 162–163
Michelangelo , 147
Michelson, Harold , 140
Miller, Earl , 116
MIPE , see Medial intraparietal lobe (MIP)
Mirror neurons
discovery and function , 137
example , 138
Models
active vision , 172
biased competition , 119
Monroe, Marilyn , 108
Motion
in color-opponent channels , 70
orienting response , 36
static details , 36
for visibility enhancement , 36
and visual pollution , 37
web design considerations , 36–37
Motor working memory, examples , 120–121
Mouse hover, and cognitive cost , 104
Mouse select, and cognitive cost , 104–105
Movements
and cognitive cost , 104
eye , see Eye movements
replay tool studies , 173–174
and stereoscopic depth perception , 94
Move and scan loop, in visual searches , 39
Movies, as strong narratives , 145
Multimodal connections, in information processing ,
108
Multiscale structure design, visual searches , 40–41
Munzner, Tamara , 176
N
Naive physics of perception, defi nition , 102
Narrative diagrams
advantages , 143–144
example , 143
main principles , 143
short-term predictions , 142–143
single-frame narratives , 144–145
Natural language, grammar and
logic , 132–133
Nested loops, brain operation , 17–19
Neural pathways
activation and strengthening , 177–178
mirror neurons , 137–138
Neuron-based processing clock, and eye
movement , 3
Neurons
as Bayesian operators , 178
and binding problem , 47
and feature analysis , 25–26
function , 48
mirror neurons , 137, 138
Node link diagrams, and pattern queries , 62
Non-pictorial depth cues
defi nition , 90
structure from motion , 95
Non-uniformity, in visual processing , 6
Normal seeing, in mental imagery , 148–150
Norman, Donald A. , 20
IDX-P370896.indd 190IDX-P370896.indd 190 1/24/2008 5:55:16 PM1/24/2008 5:55:16 PM
Index 191
Novelty
and advertising , 122
via computer software , 123
search for , 122
O
Objects
bottom-up processes , 10–11
and contour extraction mechanism ,
152–153
ease of identifi cation , 121
in eye movement sequence , 14
and gist perception , 114
identifi cation in inferotemporal cortex , 109
known, referencing , 93
meaning and emotion , 124–125
and stereoscopic depth perception , 94
structured objects , 110–112
and thinking in action , 120–121
and 2.5 design , 95
from visual images , 119
in visual and verbal working memory , 161
in Visual Working Memory , 9
and working memory , 126
Occlusion
defi nition , 91
and 2.5 design , 96
Offi ce space, aff ordances , 100
Oliva, Aude , 112–113
On Intelligence , 11, 142
Optic chiasm, in brain model , 24
Optic nerve
and attention , 9
in brain model , 24
form and function , 7
and visual fi eld , 8
Optic radiations, in brain model , 24
Optic tract, in brain model , 24
O ’ Regan, Kevin , 1
Orientation, in texture , 50
Orienting response, to motion , 36
Overlapping regions
and pattern for design , 58
in two-dimensional space , 52
P
Para-hippocampal area, in mental imagery , 151
Parallel computing
defi nition , 26
pre-attentive eff ects , 28
Parallel projection, defi nition , 92
PARC , see Xerox Palo Alto Research Center (PARC)
Parietal lobe, visual space maps , 101
Pasupathy, Anitha , 53
Pattern-fi nding circuits
and design , 172–174
as thinking components , 170
tuning , 3
Pattern learning, and two-dimensional space , 54–55
Pattern perception
and graphic design , 3
horizontal and vertical direction , 57–58
and pop-out eff ects , 29
in scanning strategy , 38
and spatial layout , 56–57
Pattern processing
basic machinery , 46
binding problem , 46–49
and 2.5D space , 45
elementary systems , 24
generalized contour , 49
Patterns
and attention , 9
in bottom-up processes , 10, 12
and cognitive process optimization , 174–175
construction , 43
for design , 58–59
formation , 43
and generalized views , 109
intermediate patterns , 53–54
and long-term memory , 117
and object identifi cation , 121
and top-down processes , 13
in two-dimensional space , 52–53
in visual narrative , 139
Patterns of patterns, defi nition , 63
Pattern-testing loop
nested loops , 18
in visual searches , 40
IDX-P370896.indd 191IDX-P370896.indd 191 1/24/2008 5:55:17 PM1/24/2008 5:55:17 PM

192
Perception
as active process , 20–21
biomotion patterns , 54
constructive perception , 152, 158
depth, and physical world , 89
future research , 181
gist perception , 112–114, 122–123
and graphic design , 3
naive physics of perception , 102
pattern perception , 3, 29, 38, 56–58
scene perception , 112, 113, 124–125
and shot transitions , 141
structured objects , 110–111
Perceptual critique, in preliminary design , 160
Perceptual facilitation, defi nition , 118
Perspective, defi nition , 92
Photoshop, and visual novelty , 123
Pictorial depth cues, defi nition , 90
Picture plane, defi nition , 92
Pirolli, Peter , 176
Plato , 110
Pointing
in presentations , 136–137
as thinking component , 169
Poldrack, Russel A. , 163
Pop-out eff ects
attention , 28–29
basic channels , 41–42
environment , 29
examples , 27–28
feature channels , 31
patterns , 29–30
tunable properties , 29
and visual conjuctive search , 31
and visual learning , 32–33
Potter, Mary , 119
PowerPoint slides
function and design , 136–137
and luminance contrast , 79
Pre-attentive eff ects, in pop out experiment , 28
Prefrontal cortex, and working memory , 116
Presentations, and pointing , 136–137
Primary visual cortex
in brain model , 24
in feature analysis , 25
texture regions , 50
Priming
defi nition , 118
and top-down processes , 12
Problem-solving systems
nested loops , 18
Tubeguru ™ , 17
Prototype design
defi nition , 160
in meta-seeing , 162–163
and sketching , 164
Proxies, as thinking component , 169
Puzzles, as novelties , 123
Pylyshyn, Zenon W. , 141, 148
Q
Question and answer patterns, in visual narrative , 139
R
Radial coordinates, in visual space , 44
Random letters, visual queries , 24–25
Rapid eye movements, and fovea , 7
Rays, in 2.5D space , 44
Real world experiments, change detection , 1–2
Recognition, faces, and viewpoint , 108–109
Red-green channel
chromatic contrast , 70
and color-opponent theory , 84–85
in opponent process theory , 68
shape-from-shading , 71
Relationship, and pattern for design , 58–59
Rensink, Ronald A. , 114
Repin, Ilya , 167
Replay tool, early work , 173
Retina
and binding problem , 47
and color-opponent theory , 84–85
and color space , 74
form and function , 7
and visual area , 1, 25
and visual fi eld , 8
Ribbons, and replay analysis tool , 174
Ring of Fire , 124
IDX-P370896.indd 192IDX-P370896.indd 192 1/24/2008 5:55:17 PM1/24/2008 5:55:17 PM

Index 193
Rizzolati, Giacomo , 137
Rods, in color processing , 66
S
Saturation
in color-opponent channels , 72
and highlighting , 79
Scatter plots, visual query example , 33
Scene perception
examples , 113
meaning and emotion , 124–125
rapid characterization , 112
Science
design diagrams , 155
visualization applications , 20
Scribbles
as brainstorming , 154
contours and lines , 152–153
in creative process , 153
Seeing
and cognition , 2
with design prototypes , 162–163
in mental imagery , 148–150
process and apparatus , 5–7
as thinking component , 170
and visual novelty , 123
Selective tuning, in two-dimensional space , 51
Semantic pattern mappings, spatial metaphors ,
62–63
Serial processing, and two-dimensional space , 55
Shaded surfaces, color , 83
Shading, defi nition , 93
Shape-from-shading, in color-opponent channels ,
70–71
Sharpening, in color-opponent channels , 72
Short-term prediction, in narratives , 142–143
Short transitions, in visual narrative , 141–142
Sideways dimensions
in egocentric space , 89
in 2.5D space , 44–45
Sign languages
brain subsystems , 130
defi nition , 130
development , 130
grammar and logic , 132–133
history , 130
learned symbols , 131
as visual language , 129–130
Simons, Daniel , 1–2
Sistine Chapel , 147
Situated interactions, defi nition , 116–117
Size gradients, in perspective , 92
Sketching
by architects , 158
and cognitive economics , 158–160
and prototype design , 164
Social dynamics, during video conferencing , 89
Sound cues, during video conferencing , 89
Space
artifi cial interactive spaces , 102, 103
binding problem , 46–49
egocentric space dimensions , 89
generalized contour , 49–50
horizontal and vertical direction , 57–58
interference and selective tuning , 51
intermediate patterns , 53–54
maps in parietal lobe , 101
mental manipulation , 110
and non-spatial data , 97–99
offi ce space aff ordances , 100
pattern for design , 58–59
and pattern learning , 54–55
pattern-processing machinery , 46
pattern queries with common graphical artifacts ,
60–62
patterns , 43
patterns, channels, attention , 52–53
radial coordinates , 44
semantic pattern mappings , 62–64
serial processing , 55
spatial layout , 56–57
and structured objects , 111–112
structuring and patterns , 43
texture regions , 50–51
traversal vs. cognitive cost , 103–105
2.5D space , 44–45
uniform color example , 74
and where pathway , 102
IDX-P370896.indd 193IDX-P370896.indd 193 1/24/2008 5:55:17 PM1/24/2008 5:55:17 PM

194
Spatial detail
in color-opponent channels , 70
and 2.5 design , 96
Spatial ideas, as logical propositions , 148
Spatial layout, and pattern perception , 56–57
Spatial memory, for scenes , 109
Spatial metaphors, and semantic pattern
mappings , 62–63
Spelke, Elizabeth , 102
Spiral design, defi nition , 157
Static detail, sensitivity to , 36
Steinberg, Saul , 153
Stereoscopic depth
and aff ordances , 100
in color-opponent channels , 70
defi nition , 94
precision , 94
and structure from motion , 95
Stereo technology, history , 94
Storyboards, in visual narrative , 140
Street signs, attention competition , 35
Structured objects
perception , 110–111
and two-dimensional patterns , 111–112
Structure from motion, defi nition , 95
Surfaces
in color-opponent channels , 73
shaded, color , 83
Suwa, Masaki , 158
Symbols
and cognitive process optimization , 174–175
design considerations , 34–35
images as , 123–124
learned , 131
T
Tasks, and attention , 180
Teodorescu, D. S. , 150
Text
emphasis , 79–80
and luminance , 76
and 2.5 design , 96
Texture gradients, in perspective , 92
Texture regions, primary factors , 50–51
Th atcher Illusion, defi nition , 108
Th inking in action, working memory example , 120–121
Th omas, N. J. T. , 149
Th ompson, W. L. , 150
Th ree-dimensional space
mental manipulation , 110
and non-spatial data , 97–99
and where pathway , 102
Top-down processes
attention , 12
defi nition , 8, 9
patterns , 13
Torralba, Antonio , 112, 114
Towards-away dimension
in egocentric space , 89
information content , 90
Train, and cognitive cost , 104
Triesman, Anne , 27–29
Tubeguru ™ , 17
Tunable properties
defi nition , 29
design considerations , 34
faces , 32
Tuning, in two-dimensional space , 51
Turner, R. J. W. , 144
Tversky, Barbara , 143, 158
Two-dimensional space
binding problem , 46–49
generalized contour , 49–50
horizontal and vertical direction , 57–58
interference and selective tuning , 51
intermediate patterns , 53–54
pattern for design , 58–59
and pattern learning , 54–55
pattern-processing machinery , 46
pattern queries with common graphical
artifacts , 60–62
patterns, channels, attention , 52–53
semantic pattern mappings , 62–64
serial processing , 55
spatial layout , 56–57
and structured objects , 111–112
structuring and patterns , 43
texture regions , 50–51
2.5 design
aff ordances , 99–100
IDX-P370896.indd 194IDX-P370896.indd 194 1/24/2008 5:55:17 PM1/24/2008 5:55:17 PM

Index 195
defi nition , 95
and depth cues , 106
and three-dimensional information , 97–98
2.5 dimensions, components , 44–45
U
Uniform color space, example , 74
Unique hues, in color-opponent channels , 70
Unlearned patterns, and apprehendable chunk , 55
Up dimension, in egocentric space , 89
Up-down dimensions, in 2.5D space , 44–45
V
V1 , see Visual area 1 (V1)
V2 , see Visual area 2 (V2)
V3 , see Visual area 3 (V3)
V4 , see Visual area 4 (V4)
Verbal working memory
function , 115
thinking in action example , 120–121
vs. visual working memory , 127, 161
Vertical direction, in pattern perception , 57–58
Video conferencing, and social dynamics , 89
Video games, and naive physics of perception , 102
Viewpoint
and face recognition , 108–109
from patterns , 109
Vision, at visual fi eld , 5–6
Visual area 1 (V1)
and color opponent process theory , 68
in feature analysis , 25
function , 7
and intermediate patterns , 53
and mind control , 171
and pattern learning , 54
and pattern processing , 46
and semantic pattern mapping , 63
and texture , 51
and visual conjuctive search , 31
and visual working memory , 118
where pathway , 100–101
Visual area 2 (V2)
in feature analysis , 25
and generalized contour , 49
and intermediate patterns , 53
and mind control , 171
and pattern learning , 54
and texture , 51
and visual working memory , 118
where pathway , 100–101
Visual area 3 (V3)
defi nition , 26
and generalized contour , 49
Visual area 4 (V4)
complex compound shape identifi cation , 168
and information reception , 109
and intermediate patterns , 53
and long-term memory , 116
and mind control , 171
and pattern learning , 54–55
and pattern perception , 57
and visual working memory , 118
Visual concept, in creative process , 148
Visual conjuctive search, defi nition , 31
Visual cortex
and feature distinctness , 30
fi rst stage processing , 167
Visual cues, during video conferencing , 89
Visual designs, and learned symbols , 131
Visual detail, via fovea , 5–6
Visual distinctness
in color coding , 77
feature properties , 30
pop-out eff ects , 29
in queries , 24
Visual fi eld
emergence into , 36
in eye movement sequence , 14
hole in , 8
vision at , 5–6
Visualization, defi nition , 20
Visual languages, vs. written modes , 133–135
Visual learning
and cognition economics , 177–179
and pop-out eff ects , 32–33
Visual narrative
cognitive thread , 138–139
FINSTS and divided attention , 140–141
framing , 139–140
question and answer patterns , 139
IDX-P370896.indd 195IDX-P370896.indd 195 1/24/2008 5:55:17 PM1/24/2008 5:55:17 PM

196
Visual narrative ( Contd. )
shot transitions , 141–142
visual vs. written , 145
Visual pattern queries
and apprehendable chunk , 55
with common graphical artifacts , 60–62
multi-chunk queries , 56
Visual pollution, and motion , 37
Visual processing
and attention , 180
non-uniformity , 6
Visual queries
attention , 3
awake impressions , 1
bottom-up processes , 10–12
during casual tasks , 4
and color semantics , 84
conscious awareness , 3
designs as , 160–161
distinct objects , 24
distributed cognition , 19–20
and graphic design , 3–4, 14–17, 21
hover query , 176–177
as information shorthand , 21
nested loops , 17–19
perception , 8–10
random letters , 24–25
scatter plot example , 33
seeing and cognition , 2
seeing process and apparatus , 5–7
top-down processes , 12–14
Visual searches
basic pop-out properties , 41–42
in color coding , 77
detection fi eld , 37–39
multiscale structure design , 40–41
process , 39–40
strategies and skills , 37
Visual signals, processing , 7
Visual skills, development , 163–164
Visual space
maps in parietal lobe , 101
patterns , 43
radial coordinates , 44
traversal vs. cognitive cost , 103–105
2.5D space , 44–45
Visual task analysis, example , 157–158
Visual thinking components
brain , 166
constructive seeing , 170
eye , 166
fi rst stage cortical processing , 167
hierarchy of skills , 171
information , 168–169
language processing , 169
long term memories , 170
memory aids , 169
mind control center , 171
pattern fi nding , 170
pointing , 169
where and what pathways , 168
Visual working memory
bottom-up processes , 11
and objects , 9
specifi cations , 177
vs. verbal working memory , 127, 161
and visual objects , 126
Visual world, while awake , 1
W
Walk, and cognitive cost , 104
Walk the Line , 124
Web designers, motion considerations , 36–37
Web pages, and pattern queries , 61
Weisel, Torsten , 25
Whale movements, replay tool studies , 173–174
What pathways
defi nition , 26
in eye movement planning , 27
and inferotemporal cortex , 108–109
and intermediate patterns , 53
and pattern processing , 46
as thinking components , 168
and visual conjuctive search , 31
and visual working memory , 118
Where pathways
in brain , 100–101
defi nition , 26
IDX-P370896.indd 196IDX-P370896.indd 196 1/24/2008 5:55:17 PM1/24/2008 5:55:17 PM

Index 197
in eye movement planning , 27
and eye movements , 102
and scanning strategies , 39
as thinking components , 168
unconscious functions , 101–102
Wilhelmson, Robert B. , 92
Williams, David , 66
Words, image linking , 135–136
Workbenches, aff ordances , 100
Working memory
accessing , 118–120
and attention , 3, 115–116, 179
bottom-up processes , 11
capacity , 126–127
and cognitive process , 115–116
defi nition , 114–115
and design sketching , 158–159
function , 115
and information retrieval , 88
motor examples , 120–121
and objects , 9
specifi cations , 177
thinking in action example , 120–121
verbal vs. visual , 127, 161
and visual objects , 126
Written languages, vs. visual languages , 133–135
X
Xerox Palo Alto Research Center (PARC) , 175
XPLANE , 98
Y
Yantis, S. , 36
Yarbus, Alfred , 167
Yellow-blue channel
chromatic contrast , 70
and color-opponent theory , 84–85
in opponent process theory , 68
Z
Zero, in data analysis , 81
Zooming, and cognitive cost , 104–105
IDX-P370896.indd 197IDX-P370896.indd 197 1/24/2008 5:55:17 PM1/24/2008 5:55:17 PM