Embed Size (px)
Citation preview

Evacuation of UNL Memorial Stadium
Sunil Gyawali&
Adrian Lara

Introductrivia
• Population of Omaha? • Population of Lincoln?• Population of Bellevue? • Capacity of UNL Memorial Stadium?
408,958
258,37950,137
91,000
It is true that Memorial Stadium is the 3rd most crowded city in Nebraska! …. How long does it take to evacuate?

Problem and assumptions
• Problem: Time to evacuate the fans from Memorial Stadium at full capacity?
• Assumptions:• The stadium is full• Leave stadium=Out of the system

Objectives
• To model the UNL Memorial Stadium as a queueing system
• To compare the observed results with other simulation processes
• To discuss if the simulation times obtained are compliant with current evacuation regulation

Data collection and assumptions (1)
Assumed capacity: 91,000 fans
148 blocks in total
91,000 fans
=> 615 fans per block
33 blocks, 7 gates
33 * 615 = 20295 fans
20295/7 = 2900 fans per gate

Data collection and assumptions (2)
Side #Blocks Estimated #fans Gates Estimated population per gate
South 31 19065 4 4767
North 33 20295 5 4059
East 33 20295 7 2900
West 51 31365 4 7842
Table 1: Estimated population per gate.

Data collection and assumptions (3)
GATES: 11,12,14,15,16
GATES: 24,1,2,3
GATES: 4,6,8,10GATES:17,18,19,
20,21,22,23
Population = 4059/Gates
Pop
ula
tion
=29
00/G
ates
=
Population = 4767/Gates
Pop
ula
tion
= 7
842/
Gat
es
The big picture of how our queues look like
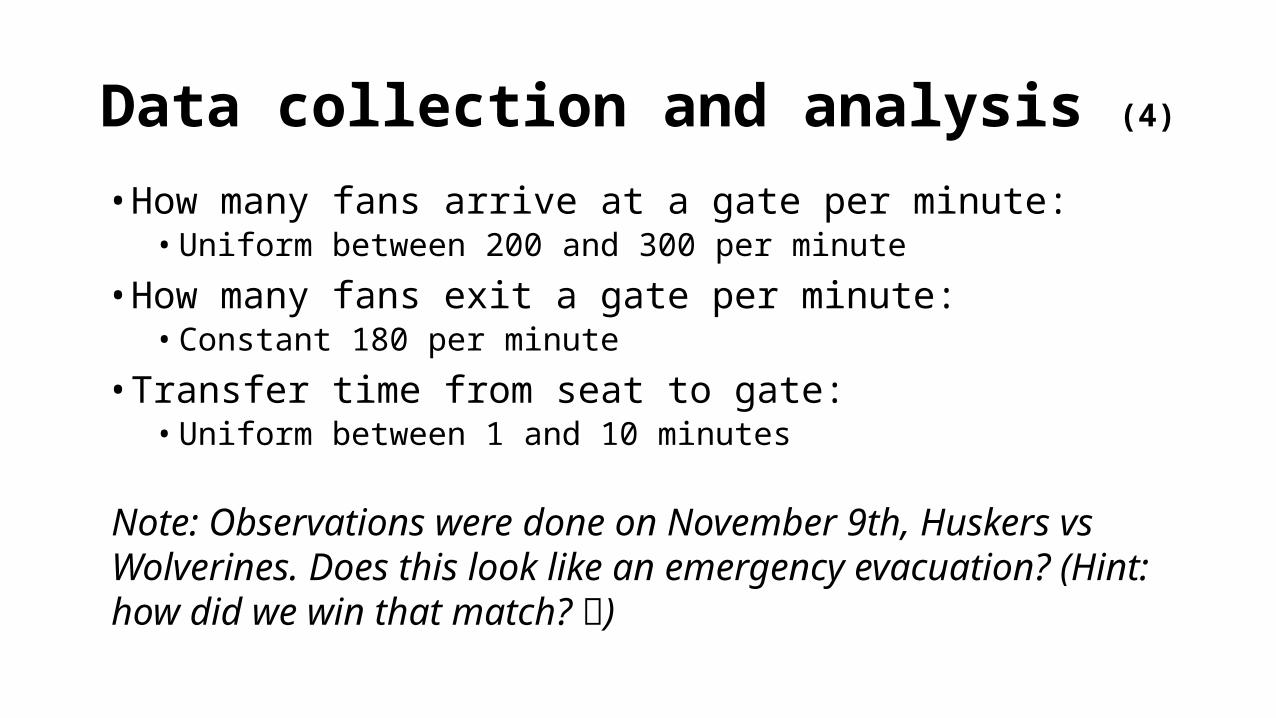
Data collection and analysis (4)
• How many fans arrive at a gate per minute: • Uniform between 200 and 300 per minute
• How many fans exit a gate per minute:• Constant 180 per minute
• Transfer time from seat to gate:• Uniform between 1 and 10 minutes
Note: Observations were done on November 9th, Huskers vs Wolverines. Does this look like an emergency evacuation? (Hint: how did we win that match? )
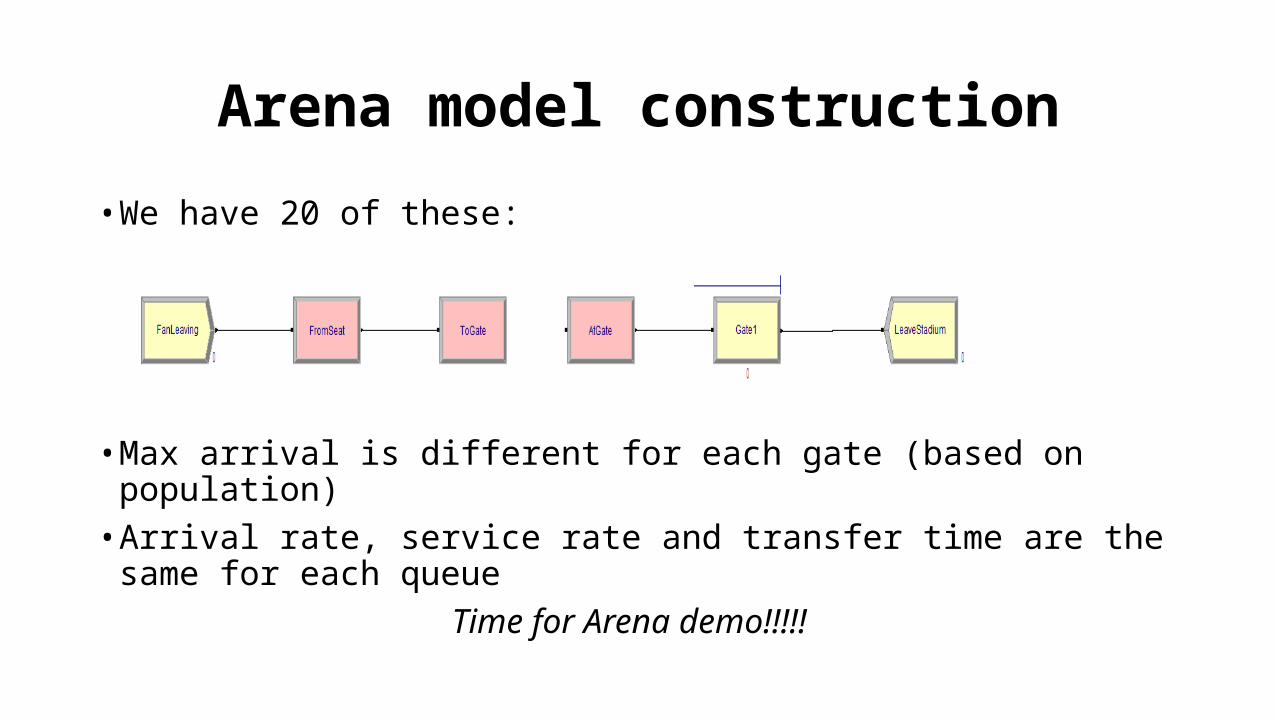
Arena model construction
• We have 20 of these:
• Max arrival is different for each gate (based on population)• Arrival rate, service rate and transfer time are the same for each
queueTime for Arena demo!!!!!

Screenshot of simulation model

Results
Sides Total Population Numer of gates Number of servers Arrival rate Service rate Simulation time (minutes)
South 4767 4 6 Uniform (0.2,0.3) seconds Constant (2 s) 30.883West 7842 4 6 Uniform (0.2,0.3) seconds Constant (2 s) 47.967North 4059 5 6 Uniform (0.2,0.3) seconds Constant (2 s) 26.950East 2900 7 6 Uniform (0.2,0.3) seconds Constant (2 s) 21.850
Simulation of each side of the stadium
Complete simulation
Gate Total Poulation Number of gates Number of servers Arrival rate Service rate per server Simulation time (minutes)
All 91031 20 20*6 Uniform (0.01.0.015) seconds Constant (2 s) 48.4
Evacuation Time
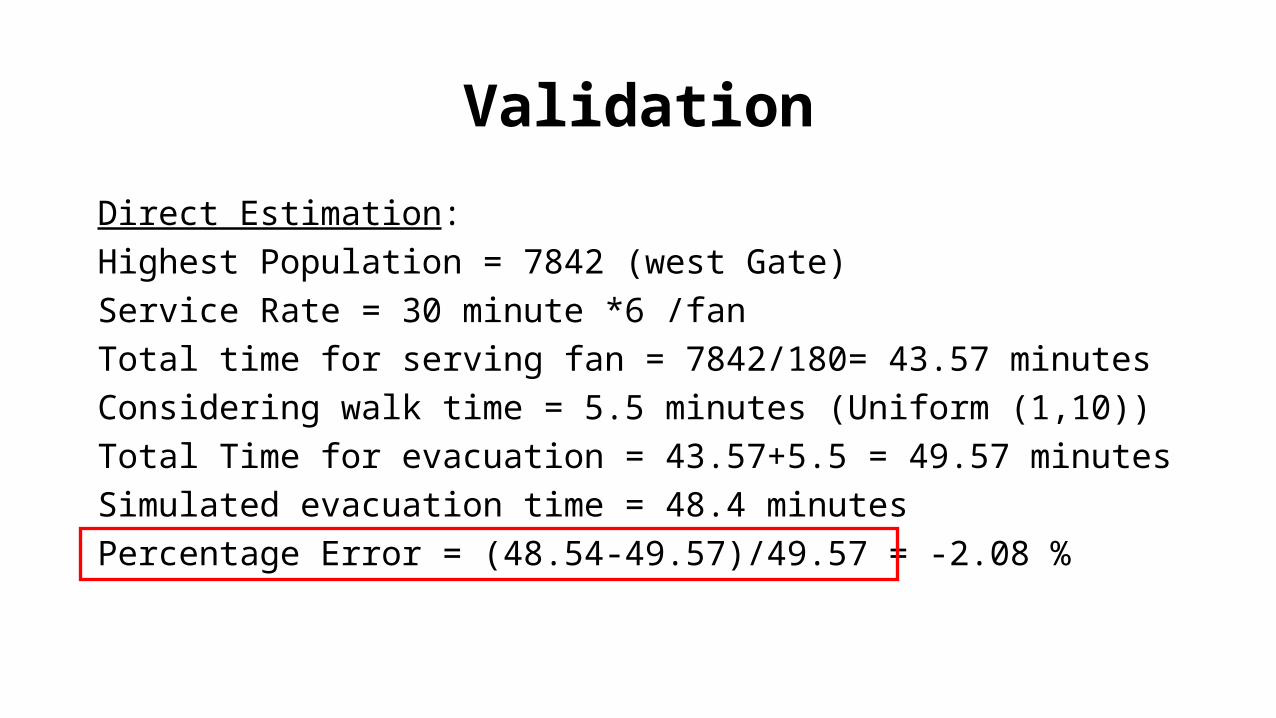
Validation
Direct Estimation:Highest Population = 7842 (west Gate) Service Rate = 30 minute *6 /fanTotal time for serving fan = 7842/180= 43.57 minutesConsidering walk time = 5.5 minutes (Uniform (1,10))Total Time for evacuation = 43.57+5.5 = 49.57 minutesSimulated evacuation time = 48.4 minutesPercentage Error = (48.54-49.57)/49.57 = -2.08 %

Conclusions
• We found that:• The evacuation time obtained from the simulation is 48 minute and 25
second• The simulation result matches the estimation.
• Accomplishment of objectives:• To model the UNL Memorial Stadium as a queueing system: Done!• To compare the observed results with other simulation processes: Next week!• To discuss if the simulation times obtained are compliant with current
evacuation regulation: Next week!

Thank you!