Embed Size (px)
Citation preview

OIL ECONOMICS: Demand fears, oversupply weigh on prices
18 April 2018
RESEARCH &
KNOWLEDGE MANAGEMENT

3
Oil Economics
KEY HIGHLIGHTS
Global oil prices registered the biggest gains in almost four months last
week, encouraged by data showing an unexpected drop in the US
crude stockpiles and a decline in the number of active rigs in the
country.
WTI for May delivery surged USD1.81 or 4.5% on the day to settle at
USD42.17 per barrel on the New York Mercantile Exchange on 12 April
2016, the highest closing since 25 November 2015.
Brent for June settlement rose by USD1.86 or 4.3% to end the session
at USD44.69 a barrel on the London-based ICE Futures Europe
exchange on 12 April 2016.
The US dollar weakness in recent weeks has also provided some relief
rally to the oil markets. A weaker dollar makes dollar-traded oil less
costly to buyers using foreign currencies.
There was no agreement resulted from the Doha meeting yesterday
as Saudi Arabia insisted that all OPEC members participate in the
output freeze. Iran was not present during the meeting. This is not a
surprising move from Iran as the country had earlier indicated its plan
to increase output to pre-sanction levels. Expect oil prices to be volatile
this week as investors profit-take.
On the demand side, global economic growth has been lacklustre. The
IMF cut its forecast for global economic growth for the fourth time in a
year, to 3.2% for 2016 (vs. 3.4%) and 3.5% for 2017 (vs. 3.6%).
Brent crude is expected to average at USD40.78 per barrel in 2016,
while WTI is anticipated to average at USD39.50 per barrel.
Global Oil Price Trends (2014-15 April 2016)
Source: Bloomberg, Samruk-Kazyna
0
20
40
60
80
100
14
15
16
USD
pb
WTI May Brent June
CONTENTS
Market Overview
Oil Oversupply
Global Growth Fears
Weigh on Oil Prices
EIA Lowers Oil
Demand Forecasts for
2016-2017
Impact of Lower Oil
Prices on Kazakhstan
Oil Price Outlook
2
5
9
10
13
14
REFER TO DISCLAIMER & DISCLOSURES AT THE END OF THIS PUBLICATION

4
Market overview
Global oil prices registered the biggest gains in almost four months last week, encouraged by data
showing an unexpected drop in the US crude stockpiles and a decline in the number of active rigs
in the country. The US dollar weakness in recent weeks also provided some support to the oil markets.
Market players were hopeful running up to the meeting discussion at Doha on 17 April 2016, among the
world’s key oil producers on maintaining oil output at current levels in an attempt to restore oil prices.
WTI for May delivery surged USD1.81 or 4.5% on the day to settle at USD42.17 per barrel on the New York
Mercantile Exchange on 12 April 2016, the highest closing since 25 November 2015. The contract
rebounded by 37.1% from a record low of USD30.76 witnessed on 11 February 2016. Futures however
corrected by USD1.14 or 2.8% to close at USD40.36 on 15 April 2016. Total volume traded was 19% below
the 100-day average. Year-to-date, WTI for May delivery recorded a marginal increase of 0.95%.
Meanwhile, Brent for June settlement rose by USD1.86 or 4.3% to end the session at USD44.69 a barrel
on the London-based ICE Futures Europe exchange on 12 April 2016. The contract has made a comeback
of 48.3% from a low of USD30.14 on 20 January 2016. It however corrected by 74 cents or 1.7% to
USD43.10 on 15 April 2016. Year-to-date, Brent for June settlement increased by 6.2%. The European
crude closed at 39 cents premium to WTI for June settlement on 15 April 2016, down from USD1.19
registered on 12 April 2016 (which was the most since 9 December 2015).
WTI Crude Oil Price Movement
(2014-15 April 2016)
Brent Crude Oil Price Movement
(2014-15 April 2016)
Source: Bloomberg
According to an earlier report from the Energy Information Administration (EIA), the US’s crude production
fell by 14,000 barrels per day to 9.01 million for the week ended 1 April 2016, the lowest since November
2014. It was the 10th time in the past 11 weeks that the US crude output fell. Concurrently, the US crude
stockpiles declined by 4.937 million or 0.92% through 1 April 2016 compared to the previous week (where
an increase of 2.299 million or 0.43% was observed). Similarly, the number of active rigs targeting crude in
the country fell for the 15th time in 16 weeks, dropping by 8 to 354 for the week ended 1 April 2016. Drillers
have idled more than 180 machines this year (source: Baker Hughes website), as global oil demand slows
and lackluster oil prices do not justify the high production costs. Oil prices have retreated slightly today on
expectations that the API report will show an increase of US crude inventories by 6.2 million barrels for the
week through 8 April 2016.

5
Oil Economics
World Oil Supply, million barrels per day
(2014-2017f)
World Oil Demand, million barrels per day
(2014-2017f)
Source: EIA, Samruk-Kazyna
The US dollar weakness in recent weeks has also provided some relief rally to the oil markets. A
weaker dollar makes dollar-traded oil less costly to buyers using foreign currencies. The Bloomberg Dollar
Spot Index, a gauge that tracks the performance of the dollar against a basket of 10 leading global
currencies, was hovering at this year’s low of 1,171.92 points on 12 April 2016, before edging higher to
1,178.78 points on 15 April 2016. The index has lost 4.4% year-to-date, trending lower from this year’s high
of 1,253.10 points on 22 January 2016.
Bloomberg Dollar Index (2014-15 April 2016)
Source: Bloomberg
During the FOMC meeting in March, the US central bank has signalled its intent to keep monetary policy
accommodative, with the Fed Chair citing that it is appropriate to “proceed cautiously” in raising interest
rates. The Fed highlighted slowing growth in China and the outlook for commodity prices as potential risks
to the global growth. This message sends a strong indication to the market that another interest rate hike
in the US over the next few months is unlikely.
37,24 38,18 39,25 40,02
56,06 57,55 57,19 56,68
0
20
40
60
80
100
2014 2015 2016f 2017f
OPEC Non-OPEC
45,73 46,33 46,45 46,56
46,64 47,34 48,39 49,5
0
20
40
60
80
100
2014 2015 2016f 2017f
OECD Non-OECD

6
The Fed’s dovish comments on future rate expectations sent global equities and fixed income soaring, as
investors search for higher-yielding investments. In the US, equities rose for the sixth time in eight weeks
for the week ended 1 April 2016. The S&P 500 Index rose 1.6% on the week to close at 2,080.73 points on
15 April 2016, after touching this year’s high of 2,082.78 points the previous day. The benchmark index has
gained 13.8% year-to-date, after falling to an almost two-year low on 11 February 2016. Similarly on the
fixed income market, Treasuries rose higher tracing the gains in equities while the dollar fell as market
players pared speculation for the timing of the next rate hike. The 10-year benchmark Treasury yield
narrowed by 51.8bps year-to-date to close at 1.7518% on 15 April 2016. Meanwhile, the 2-year note yield,
the most sensitive to monetary policy stance, narrowed by 31.4bps year-to-date to close at 0.7335% on 15
April 2016.
The Fed’s cautious stance on monetary policy has pushed back investors’ expectations on future rate hikes,
and hence causing the dollar to weaken in the past few weeks. Fed fund futures is now expecting a 30%
chance of an interest rate hike in June 2016, up from 24%. Meanwhile, the September meeting carries a
higher probability of 53%, up from 41%. Market players now expect two more rate hikes for the rest of 2016
(in 2H 2016), down from earlier expectations of four rate hikes for full year 2016. In addition, the International
Monetary Fund (IMF) in its statement last week support negative policy rates by some central banks given
the significant risks it sees to the outlook for growth and inflation. The multilateral organisation is expected
to revise downward the outlook on global growth in its upcoming annual economic outlook report.
USD vs. Key Currencies Performance, as at 15 April 2016, % Change
Source: Bloomberg, Samruk-Kazyna
-12 -10 -8 -6 -4 -2 0 2 4 6 8
AUD
BRL
CAD
CHF
CNY
EUR
GBP
JPY
KRW
MXN
7
Oil Economics
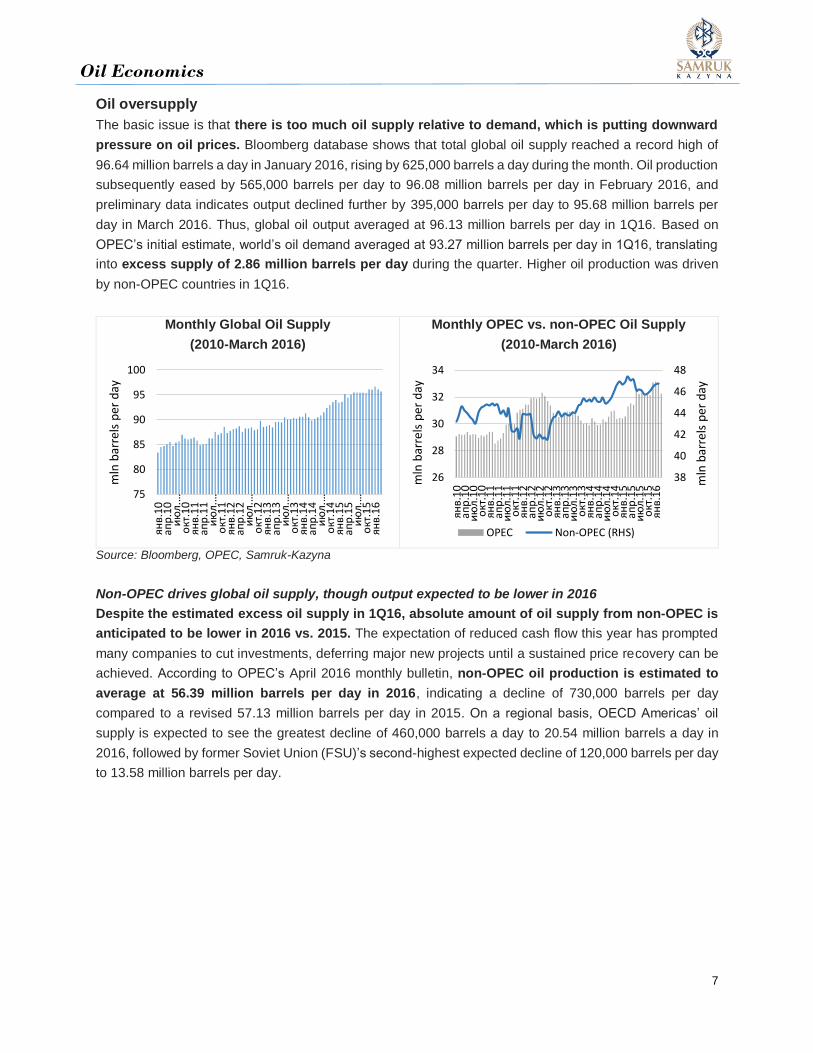
Oil oversupply
The basic issue is that there is too much oil supply relative to demand, which is putting downward
pressure on oil prices. Bloomberg database shows that total global oil supply reached a record high of
96.64 million barrels a day in January 2016, rising by 625,000 barrels a day during the month. Oil production
subsequently eased by 565,000 barrels per day to 96.08 million barrels per day in February 2016, and
preliminary data indicates output declined further by 395,000 barrels per day to 95.68 million barrels per
day in March 2016. Thus, global oil output averaged at 96.13 million barrels per day in 1Q16. Based on
OPEC’s initial estimate, world’s oil demand averaged at 93.27 million barrels per day in 1Q16, translating
into excess supply of 2.86 million barrels per day during the quarter. Higher oil production was driven
by non-OPEC countries in 1Q16.
Monthly Global Oil Supply
(2010-March 2016)
Monthly OPEC vs. non-OPEC Oil Supply
(2010-March 2016)
Source: Bloomberg, OPEC, Samruk-Kazyna
Non-OPEC drives global oil supply, though output expected to be lower in 2016
Despite the estimated excess oil supply in 1Q16, absolute amount of oil supply from non-OPEC is
anticipated to be lower in 2016 vs. 2015. The expectation of reduced cash flow this year has prompted
many companies to cut investments, deferring major new projects until a sustained price recovery can be
achieved. According to OPEC’s April 2016 monthly bulletin, non-OPEC oil production is estimated to
average at 56.39 million barrels per day in 2016, indicating a decline of 730,000 barrels per day
compared to a revised 57.13 million barrels per day in 2015. On a regional basis, OECD Americas’ oil
supply is expected to see the greatest decline of 460,000 barrels a day to 20.54 million barrels a day in
2016, followed by former Soviet Union (FSU)’s second-highest expected decline of 120,000 barrels per day
to 13.58 million barrels per day.
75
80
85
90
95
100
янв.10
апр.10
июл.…
окт.10
янв.11
апр.11
июл.…
окт.11
янв.12
апр.12
июл.…
окт.12
янв.13
апр.13
июл.…
окт.13
янв.14
апр.14
июл.…
окт.14
янв.15
апр.15
июл.…
окт.15
янв.16
mln
bar
rels
per
day
38
40
42
44
46
48
26
28
30
32
34
янв.10
апр.10
июл.10
окт.10
янв.11
апр.11
июл.11
окт.11
янв.12
апр.12
июл.12
окт.12
янв.13
апр.13
июл.13
окт.13
янв.14
апр.14
июл.14
окт.14
янв.15
апр.15
июл.15
окт.15
янв.16 m
ln b
arre
ls p
er d
ay
mln
bar
rels
per
day
OPEC Non-OPEC (RHS)

8
Non-OPEC Oil Supply (2015-2016f), million barrels per day
Non-OPEC 2015 1Q16 2Q16 3Q16 4Q16 2016f 16/15
chg
Americas 21.01 20.88 20.35 20.39 20.54 20.54 -0.46
of which US 13.99 13.75 13.49 13.42 13.56 13.56 -0.43
Europe 3.75 3.81 3.62 3.55 3.68 3.66 -0.09
Asia Pacific 0.46 0.46 0.46 0.46 0.44 0.45 -0.01
Total OECD 25.22 25.15 24.43 24.40 24.67 24.66 -0.56
Other Asia 2.70 2.70 2.71 2.75 2.78 2.73 0.03
Latin America 5.18 5.08 5.17 5.21 5.32 5.20 0.01
Middle East 1.27 1.27 1.25 1.24 1.24 1.25 -0.02
Africa 2.37 2.35 2.36 2.34 2.33 2.34 -0.03
Total DCs 11.53 11.40 11.49 11.54 11.66 11.52 0.00
FSU 13.70 13.88 13.53 13.42 13.49 13.58 -0.12
of which Russia 10.85 11.02 10.80 10.72 10.77 10.83 -0.02
Other Europe 0.13 0.13 0.13 0.13 0.13 0.13 0.00
China 4.37 4.30 4.29 4.28 4.33 4.30 -0.07
Total “other
regions”
18.20 18.31 17.95 17.84 17.95 18.01 -0.19
Total non-OPEC
production
54.94 54.86 53.87 53.78 54.28 54.20 -0.75
Processing gains 2.19 2.20 2.20 2.20 2.20 2.20 0.01
Total non-OPEC
supply
57.13 57.06 56.07 55.98 56.48 56.39 -0.73
Source: OPEC Monthly Bulletin April 2016
According to OPEC, oil production in OECD Americas is anticipated to be lower in 2016 due to the high
break-even production costs in most areas of the US, Canada and Mexico. The US’ oil output is projected
to fall by 430,000 barrels per day to 13.56 million barrels per day in 2016, attributable mainly from a
drop in tight crude production in different regions within the country. Further, the planned capex of several
key operators in North America were reported to halve in 2016 compared to 2015. As mentioned earlier,
the latest survey by Baker Hughes showed that the number of active US oil rigs fell by 8 to 354 for the week
ended 1 April 2016, the 15th decline in 16 weeks. Compared to a year ago, it fell by 406 or 55%.
Note that US industry has been transformed by the shale revolution, with advances in the techniques of
hydraulic fracturing and horizontal drilling enabling the exploitation of oilfields, particularly in Texas and
North Dakota, which were once considered uncommercial.
9
Oil Economics
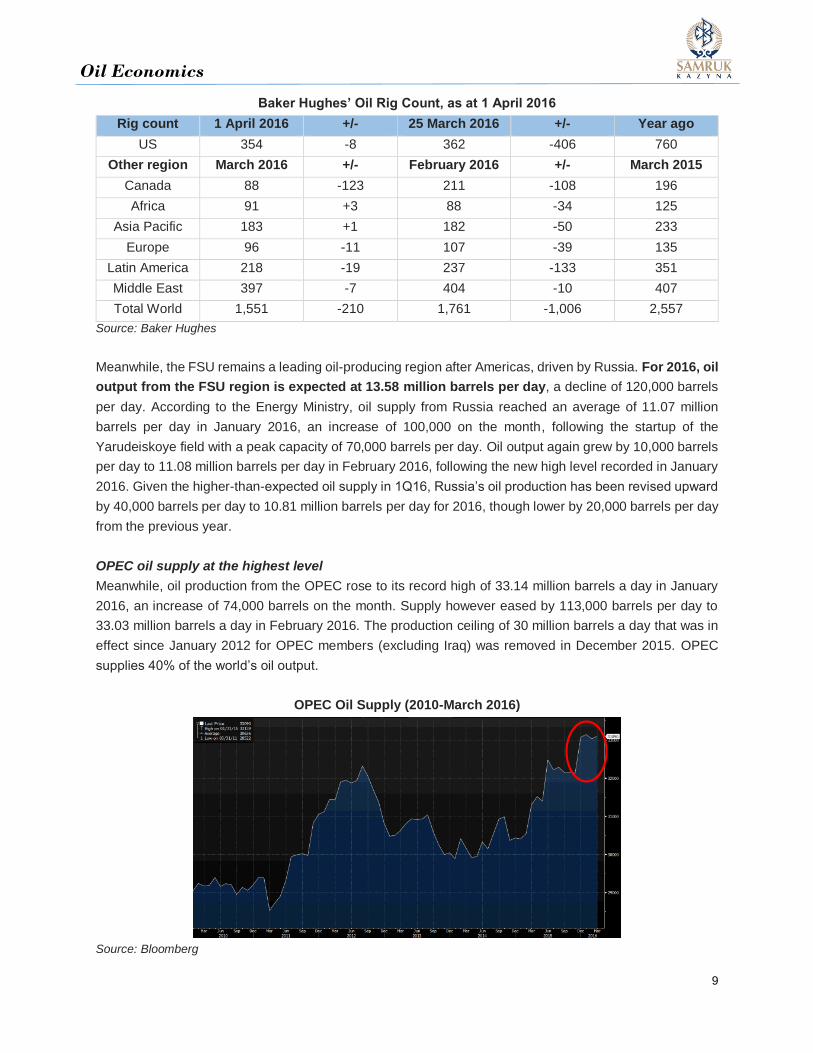
Baker Hughes’ Oil Rig Count, as at 1 April 2016
Rig count 1 April 2016 +/- 25 March 2016 +/- Year ago
US 354 -8 362 -406 760
Other region March 2016 +/- February 2016 +/- March 2015
Canada 88 -123 211 -108 196
Africa 91 +3 88 -34 125
Asia Pacific 183 +1 182 -50 233
Europe 96 -11 107 -39 135
Latin America 218 -19 237 -133 351
Middle East 397 -7 404 -10 407
Total World 1,551 -210 1,761 -1,006 2,557
Source: Baker Hughes
Meanwhile, the FSU remains a leading oil-producing region after Americas, driven by Russia. For 2016, oil
output from the FSU region is expected at 13.58 million barrels per day, a decline of 120,000 barrels
per day. According to the Energy Ministry, oil supply from Russia reached an average of 11.07 million
barrels per day in January 2016, an increase of 100,000 on the month, following the startup of the
Yarudeiskoye field with a peak capacity of 70,000 barrels per day. Oil output again grew by 10,000 barrels
per day to 11.08 million barrels per day in February 2016, following the new high level recorded in January
2016. Given the higher-than-expected oil supply in 1Q16, Russia’s oil production has been revised upward
by 40,000 barrels per day to 10.81 million barrels per day for 2016, though lower by 20,000 barrels per day
from the previous year.
OPEC oil supply at the highest level
Meanwhile, oil production from the OPEC rose to its record high of 33.14 million barrels a day in January
2016, an increase of 74,000 barrels on the month. Supply however eased by 113,000 barrels per day to
33.03 million barrels a day in February 2016. The production ceiling of 30 million barrels a day that was in
effect since January 2012 for OPEC members (excluding Iraq) was removed in December 2015. OPEC
supplies 40% of the world’s oil output.
OPEC Oil Supply (2010-March 2016)
Source: Bloomberg

10
According to Bloomberg database, oil production from the OPEC members increased by 64,000
barrels a day to 33.09 million barrels a day in March 2016 from February 2016. (This was higher than
OPEC’s preliminary data of 32.25 million barrels per day). The March increase was led by higher supply
from Iraq and Iran. Being OPEC’s second biggest oil producer, Iraq raised output to 4.55 million barrels
per day in March 2016 from 4.46 million barrels per day in February 2016. This followed a then-record oil
production of 4.43 million barrels per day in January 2016. Meanwhile, Iran increased output to 3.2 million
barrels per day during the month from 3.2 million barrels per day from the previous month.
The OPEC and other major oil producers met in Doha on 17 April 2016 to decide on a possible freeze in
crude output in an attempt to restore prices. However, an agreement among oil producers fell apart as
Saudi Arabia requested that all OPEC members participate in the output freeze, including Iran, which
was absent from the meeting. According to several OPEC members that if Iran agrees to join the output
freeze at the next OPEC meeting on 2 June 2016, discussion with non-OPEC producers could resume.
Even if key oil producers agree to freeze output around current levels, it might do little to address
the current supply glut as output is beyond consumption and close to record levels.
In general, OPEC members would be reluctant to cut output despite falling oil prices as they are engaged
in a competition for market shares in Asia and Europe, more so after the lifting of the Iran sanctions. In
January 2016, Saudi Arabia sharply cut the prices it charges for crude oil in Europe, and the move was
seen by the market as a way to compete with Iran’s return to the oil markets in Europe. Italy and Spain
purchased 13% and 16% of their oil imports from Iran before the sanctions in 2012, and Iran’s market share
was subsequently replaced by Saudi Arabia and other oil producing countries. Iran has indicated that it
would continue to increase production and exports to regain market share that it obtained before the
imposition of sanctions, particularly in Europe (source: Oil Minister Bijan Zanganeh), which could threaten
the prospect of an effective agreement at the Doha meeting.
Statistical Summary of OPEC Oil Production (as at March 2016)
Source: Bloomberg’s estimate

11
Oil Economics
Global growth uncertainties weigh on oil prices
On the demand side, global economic growth has been lacklustre, with spillover from China’s economic
slowdown and rebalancing, the impact of low commodity prices and growing strains in emerging markets
that are reliant on commodity exports (Brazil, Russia), a related slowdown in trade and investment, as well
as the persistent economic weakness in Japan, Europe and the US especially in 4Q15. Overall, these are
consistent with a subdued outlook for the world economy in 2016, with heightened downside risks stemming
from geopolitical and political risks – indicating a weaker growth in global oil demand is on the card.
Premised on the above factors, on 12 April 2016, the IMF cut its forecast for global economic growth
for the fourth time in a year. Global GDP growth is now expected at 3.2% for 2016, down from
January’s projection of 3.4%. For 2017, the IMF expects the global economy to grow by 3.5%, down by
0.1% from January’s estimate.
IMF’s Global GDP Growth Projections (2016f-2017f), %
Region/ country 2015 Current projections Change from January
2016’s projections
2016f 2017f 2016f 2017f
World output 3.1 3.2 3.5 -0.2 -0.1
US 2.4 2.4 2.5 -0.2 -0.1
Euro area 1.6 1.5 1.6 -0.2 -0.1
Japan 0.5 0.5 -0.1 -0.5 -0.4
UK 2.2 1.9 2.2 -0.3 0.0
Russia -3.7 -1.8 0.8 -0.8 -0.2
China 6.9 6.5 6.2 0.2 0.2
Source: IMF World Economic Outlook April 2016
The US, being one of the relatively bright spots in the global economy, saw its 2016 growth forecast
downgraded to 2.4% vs. earlier projection of 2.6%. The IMF expects an increased drag on US exports,
stemming from a stronger dollar and slower growth in trading partners, while low oil prices would limit
energy investment. In 2017, US’ GDP growth was revised down to 2.5% vs. earlier estimate of 2.6%
In Europe, economic recovery is anticipated to be modest in 2016-2017, as weaker external environment
outweighs the positive effects of lower energy prices and supportive financial conditions. Output in Europe
is expected to grow by 1.5% in 2016, down from an earlier estimate of 1.7%, while 2017’s growth is
projected at 1.6% (vs. an earlier estimate of 1.7%). Following this, the IMF marked down prospects of the
three largest economies in the euro zone, Germany, France and Italy.
Similarly in Asia, Japan’s GDP growth was revised downward by half to 0.5% in 2016. A stronger yen
and weaker demand from emerging markets are expected to limit activity during the year. Nevertheless,
supporting private consumption will be lower energy prices, fiscal measures through supplementary budget
as well as the central bank’s quantitative and qualitative easing measures. Japan’s GDP is expected to turn
-0.1% in 2017 as the scheduled increase in the consumption tax rate takes effect. Economic activity in other
developed Asian countries closely-tied to China, such as Singapore, Hong Kong, South Korea and Taiwan
are projected to soften this year as domestic demand remains subdued and recovery in exports was
moderate.

12
Growth outlook varies across major emerging market economies. In Latin America, Brazil is expected
to sink into a deeper economic recession, with GDP growth projected to contract by 3.8% in 2016 vs. earlier
estimate of -3.5%. In Russia, the IMF projects growth of -1.8% in 2016 vs. earlier forecast of
-1.0%, as international sanctions compound the effect of lower oil prices. Russia’s growth is expected to
turn positive at 0.8% in 2017. Conditions are expected to remain weak in most Commonwealth Independent
States economies, affected by spillovers from Russia as well as the negative impact of lower oil prices on
oil exporting countries. In contrast, the IMF lifted China’s growth forecast slightly higher to 6.5% in 2016,
and 6.2% in 2017, partly due to previously announced policy stimulus moves. Domestic demand was
resilient, supported by consumption. Robust growth in the services sector also offset recent weakness in
manufacturing activity. The IMF however highlighted that it is reducing longer-term growth forecasts on
China as the country’s shift away from investment-led growth will weigh down on global trade.
On top of emerging market slowdown, geopolitical risks are also weighing on global growth. Economic
activity in sub-Saharan Africa and the Middle East also fell short of expectations, mainly attributable to the
drop in oil and other commodity prices, and geopolitical and domestic strife in a few countries. Output
contractions in three countries – Ukraine, Libya and Yemen, which accounted for approximately 0.5%-point
of global GDP in 2013, subtracted 0.1%-point from global output in 2014-2015.
The IMF estimated in a scenario that if the risk premiums escalated in a number of oil exporters with
lower net external assets, by 100bps in 2016 and 2017, this could result in a further reduction to
global GDP growth projection of approximately 0.25%, concentrating mainly in emerging market
economies. The IMF assumes an average oil price of USD35 per barrel in 2016 and USD41 per barrel in
2017 in its baseline economic forecasts.
EIA lowers oil demand forecasts for 2016-2017
In its March 2016 outlook report, the EIA trimmed its forecast of world’s oil demand growth for 2016
and 2017 by 100,000 barrels per day and 200,000 barrels per day respectively, compared to earlier
estimates on the back of lower expected GDP growth for the global economy. The EIA estimates that global
oil consumption to grow by 1.1 million barrels per day to 94.8 million barrels per day in 2016, and
by 1.2 million barrels per day to 96.06 million barrels per day in 2017.
Breakdown of World Liquid Consumption,
million barrels per day (2015-2017f)
Growth in World Liquid Consumption,
million barrels per day (2016f-2017f)
Source: EIA, Samruk-Kazyna
0
20
40
60
80
100
2015 2016f 2017f
US Europe Japan
Other OECD China Non-OECD Asia
-0,15
0,35
0,85
1,35
2016f 2017f
US Europe Japan
Other OECD China Non-OECD Asia

13
Oil Economics
Oil consumption of non-OECD is projected to grow by 1 million barrels per day to 48.39 million
barrels per day in 2016, and by 1.1 million barrels per day to 49.50 million barrels per day in 2017,
accounting for nearly all forecast global consumption growth during that period. China is the leading
contributor to projected global consumption growth from non-OECD, with consumption expected to
increase by 320,000 barrels per day and 300,000 barrels per day in 2016 and 2017 respectively, to 11.50
million barrels per day and 11.80 million barrels per day, respectively. However, China’s ongoing economic
rebalancing poses a downside risk to the oil consumption projections. Other non-OECD oil growth drivers
include the Middle East, Africa and Eurasia (excluding Russia).
Meanwhile, the EIA expects a 100,000 barrels per day increase in OECD oil consumption for both 2016
and 2017, to 46.45 million barrels per day and 46.56 million barrels per day, respectively, dominated by the
US. The US oil consumption is projected to be higher by 100,000 barrels per day to 19.48 million
barrels per day in 2016, and by 200,000 barrels per day to 19.64 million barrels per day in 2017. In
contrast, oil consumption in Japan is anticipated to decline by 100,000 barrels per day in both 2016
and 2017, to 4.11 million barrels per day and 4.03 million barrels per day respectively. Similarly in Europe,
oil consumption is expected to decline marginally by 40,000 barrels per day to 13.68 million barrels per
day in 2016 and by 50,000 barrels per day to 13.63 million barrels per day in 2017.
On oil supply, the EIA expects non-OPEC production to decline by 400,000 barrels per day to 57.19
million barrels per day in 2016, the first decline since 2008, driven by the US. Non-OPEC oil production
is expected to fall further by 500,000 barrels per day to 56.68 million barrels per day in 2017. Oil
production in the US is defined by high decline rates and relatively short investment horizons, making the
country among the most sensitive to global oil price changes. Therefore, oil production from the US is
projected to fall by 530,000 barrels per day to 14.51milion barrels per day in 2016 and 180,000 barrels per
day to 14.33 million barrels per day in 2017.
In contrast, other non-OPEC (excluding US) oil production is anticipated to increase by 200,000 barrels per
day in 2016, followed by a decline of 300,000 barrels per day in 2017. This is because oil production of
non-OPEC outside of the US is relatively resilient as investments were committed during high oil prices.
According to the EIA, although oil companies have reduced investments, most of the cuts have been in
capital budgets that largely affect production levels after 2017. Oil production from non-OPEC outside of
the US will be driven by Russia and Canada:
Russia – oil production has exceeded expectations in 4Q15, and is anticipated to increase by
200,000 barrels per day to 11.17 million barrels per day in 2016, before declining 100,000 barrels
per day to 11.04 million barrels per day in 2017. Depreciation of the ruble vs. the dollar have
cushioned the country’s impact to low oil prices, as production costs are denominated in the local
currency.
Canada – production is projected to increase by 200,000 barrels per day in both 2016 and 2017,
to 4.64 million barrels a day and 4.8 million barrels a day respectively. Oil producers have
commissioned the Imperial Oil and Cenovus projects before the sharp decline in oil prices that are
expected to come online by end-2016.

14
Meanwhile, OPEC crude oil production is expected to increase by 700,000 barrels a day to 39.25
million barrels per day in 2016, and 400,000 barrels a day to 40.02 million barrels per day in 2017,
with production growth to be driven mainly by Iran. EIA’s estimates of OPEC oil output in 2016-2017 do not
include the possibility of a collaborative production cut among members and non-members, as market
players continue to the strategy of maintaining market shares.
World Oil Supply, million barrels per day
(2014-2017f)
World Oil Demand, million barrels per day
(2014-2017f)
Source: EIA, Samruk-Kazyna
Combining EIA’s estimates of oil production from both OPEC and non-OPEC producers, output is expected
to increase by 700,000 barrels per day to 96.44 million barrels a day in 2016, and by 260,000 barrels per
day to 96.70 million barrels a day in 2017. Based on these estimates for global oil demand and supply, they
translate into excess oil supply of 1.59 million barrels per day in 2016, easing to 640,000 barrels per
day in 2017 – putting downward pressure on global oil prices especially in 2016.
EIA’s World Oil Supply & Demand (2015-2017f), million barrels per day
Supply & consumption 2015 2016f 2017f
Non-OPEC production 57.55 57.19 56.68
OPEC production 38.18 39.25 40.02
Total world production 95.74 96.44 96.70
Total OPEC surplus oil production capacity 1.62 1.79 1.55
OECD consumption 46.33 46.45 46.56
Non-OECD consumption 47.34 48.39 49.50
Total world consumption 93.70 94.85 96.06
Estimated excess oil supply 2.0 1.59 0.64
Source: EIA
37,24 38,18 39,25 40,02
56,06 57,55 57,19 56,68
0
20
40
60
80
100
2014 2015 2016f 2017f
OPEC Non-OPEC
45,73 46,33 46,45 46,56
46,64 47,34 48,39 49,5
0
20
40
60
80
100
2014 2015 2016f 2017f
OECD Non-OECD
15
Oil Economics
Impact of lower oil prices on Kazakhstan
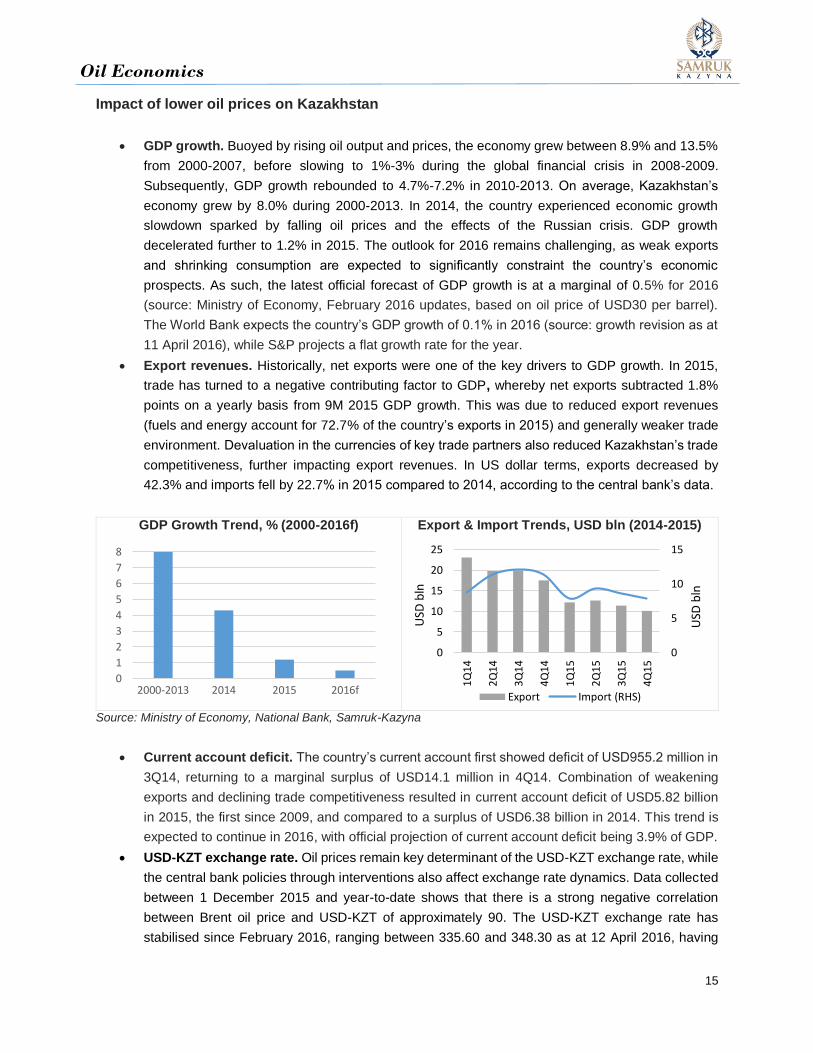
GDP growth. Buoyed by rising oil output and prices, the economy grew between 8.9% and 13.5%
from 2000-2007, before slowing to 1%-3% during the global financial crisis in 2008-2009.
Subsequently, GDP growth rebounded to 4.7%-7.2% in 2010-2013. On average, Kazakhstan’s
economy grew by 8.0% during 2000-2013. In 2014, the country experienced economic growth
slowdown sparked by falling oil prices and the effects of the Russian crisis. GDP growth
decelerated further to 1.2% in 2015. The outlook for 2016 remains challenging, as weak exports
and shrinking consumption are expected to significantly constraint the country’s economic
prospects. As such, the latest official forecast of GDP growth is at a marginal of 0.5% for 2016
(source: Ministry of Economy, February 2016 updates, based on oil price of USD30 per barrel).
The World Bank expects the country’s GDP growth of 0.1% in 2016 (source: growth revision as at
11 April 2016), while S&P projects a flat growth rate for the year.
Export revenues. Historically, net exports were one of the key drivers to GDP growth. In 2015,
trade has turned to a negative contributing factor to GDP, whereby net exports subtracted 1.8%
points on a yearly basis from 9M 2015 GDP growth. This was due to reduced export revenues
(fuels and energy account for 72.7% of the country’s exports in 2015) and generally weaker trade
environment. Devaluation in the currencies of key trade partners also reduced Kazakhstan’s trade
competitiveness, further impacting export revenues. In US dollar terms, exports decreased by
42.3% and imports fell by 22.7% in 2015 compared to 2014, according to the central bank’s data.
GDP Growth Trend, % (2000-2016f)
Export & Import Trends, USD bln (2014-2015)
Source: Ministry of Economy, National Bank, Samruk-Kazyna
Current account deficit. The country’s current account first showed deficit of USD955.2 million in
3Q14, returning to a marginal surplus of USD14.1 million in 4Q14. Combination of weakening
exports and declining trade competitiveness resulted in current account deficit of USD5.82 billion
in 2015, the first since 2009, and compared to a surplus of USD6.38 billion in 2014. This trend is
expected to continue in 2016, with official projection of current account deficit being 3.9% of GDP.
USD-KZT exchange rate. Oil prices remain key determinant of the USD-KZT exchange rate, while
the central bank policies through interventions also affect exchange rate dynamics. Data collected
between 1 December 2015 and year-to-date shows that there is a strong negative correlation
between Brent oil price and USD-KZT of approximately 90. The USD-KZT exchange rate has
stabilised since February 2016, ranging between 335.60 and 348.30 as at 12 April 2016, having
0
1
2
3
4
5
6
7
8
2000-2013 2014 2015 2016f
0
5
10
15
0
5
10
15
20
25
1Q
14
2Q
14
3Q
14
4Q
14
1Q
15
2Q
15
3Q
15
4Q
15
USD
bln
USD
bln
Export Import (RHS)

16
rebounded by 12.9% after touching a record of 385.25 on 21 January 2016. The tenge has
strengthened gradually in the past 2-3 months, underpinned by slight recovery in global oil prices,
and to some extent, monetary policy expectations in the US. The USD-KZT averaged at 354.12
year-to-date, as at 12 April 2016.
Current Account Balance, USD mln
(2014-2015)
USD-KZT Trends (2015-2016YTD)
Source: Ministry of Economy, National Bank, Bloomberg, Samruk-Kazyna
Oil price outlook
Brent crude for June delivery last traded at USD43.10 per barrel on 15 April 2016. It has rebounded 43.0%
from this year’s low of USD30.14 per barrel on 20 January 2016. Year-to-date, it has averaged at USD37.52
per barrel, with a gain of 6.2%. Meanwhile, WTI for May delivery closed at USD40.36 per barrel on 15 April
2016, with year-to-date gain of 0.95% and price average of USD36.51.
Oil prices had rallied partly on expectations that a deal would be achieved among key producers in freezing
production during the Doha meeting. With no deal achieved, market sentiment would to be impacted with
the likelihood of market rebalancing being pushed back to a later period. Oil prices are expected to be
volatile in the near-term. As of 18 April 2016 9:00AM Kazakhstan time, WTI for May delivery fell USD1.99
or 4.9% to USD38.37 per barrel. Meanwhile, Brent for June settlement dropped USD2.04 or 4.7% to
USD41.06 per barrel. As such, Brent crude is expected to average at USD40.78 per barrel in 2016,
while WTI is anticipated to average at USD39.50 per barrel.
Market leads moving forward include - (1) global growth outlook (and demand for oil), (2) global oil supply
(and crude stockpiles), and (3) expectations of the US monetary policy stance and the dollar strength.
Oil Price Projections (2016f-2017f), USD per barrel
Price 1Q16 Average YTD 2Q16 3Q16 4Q16 2016f 2017f
Brent 40.33 37.52 38.88 43.00 46.50 40.78 54.50
WTI 38.34 36.51 37.00 42.00 46.00 39.50 52.15
IMF - - - - - 35.00 41.00
Source: Bloomberg, market consensus, IMF
Projections based on data as at 15 April 2016
-3 000
-1 000
1 000
3 000
5 000
7 000
1Q
14
2Q
14
3Q
14
4Q
14
1Q
15
2Q
15
3Q
15
4Q
15
0
20
40
60
80
0
100
200
300
400
500
A J O J A
USD
pb
USD
-KZT
USD-KZT Brent (RHS)

17
Oil Economics
Disclaimer & Disclosures
The Research and Knowledge Management Department Strategy and Portfolio Investment Block of JSC
“Samruk-Kazyna” (hereinafter referred to as “the Research Team”) is responsible for the analysis of this
report. The Research Team certifies that all views expressed in this Research report (hereinafter referred
to as “Report”) reflect the Research Team’s personal views.
The Report is based on the information taken from the sources which the Research Team considers reliable
and takes every care and precaution to ensure that information related to the Report published on the
corporate website of JSC “Samruk-Kazyna” is accurate and regularly updated, but neither the Research
Team nor JSC “Samruk-Kazyna” make no guarantee, warranty of any kind, express or implied, or make no
representation as to the accuracy or completeness of the information contained in the Report or otherwise,
and it should not be relied on as such. The Research Team may change the information contained in this
Research at any time without notice.
Neither the Research Team nor JSC “Samruk-Kazyna” or any of its officers, employees shall be liable for
any losses or damage that may result from use of the information contained in the Report as a consequence
of any inaccuracies in, errors or omissions, if any, from the information which the Report may contain or
otherwise arising from the use and/or further communication, disclosure, or other publication of the
information contained in the Report.
This Report is solely intended for general informational purposes and is provided for internal distribution
within JSC “Samruk-Kazyna”. This Report is not in any sense a solicitation or offer of the purchase or sale
of securities or any assets in any jurisdiction.
No part of this material may be copied or duplicated in any form by any means or redistributed without any
prior written consent of JSC “Samruk-Kazyna”. Additional information is available upon request.

18
___________________________________________________________________
___________________________________________________________________
___________________________________________________________________
___________________________________________________________________
___________________________________________________________________
___________________________________________________________________
___________________________________________________________________
___________________________________________________________________
___________________________________________________________________
___________________________________________________________________
___________________________________________________________________
___________________________________________________________________
___________________________________________________________________
___________________________________________________________________
___________________________________________________________________
___________________________________________________________________
___________________________________________________________________
___________________________________________________________________
___________________________________________________________________
___________________________________________________________________
___________________________________________________________________
___________________________________________________________________
___________________________________________________________________
___________________________________________________________________
___________________________________________________________________
___________________________________________________________________
___________________________________________________________________
___________________________________________________________________