Embed Size (px)
Citation preview

Mapping urban data
Andrey Karmatsky
@urbicadesign
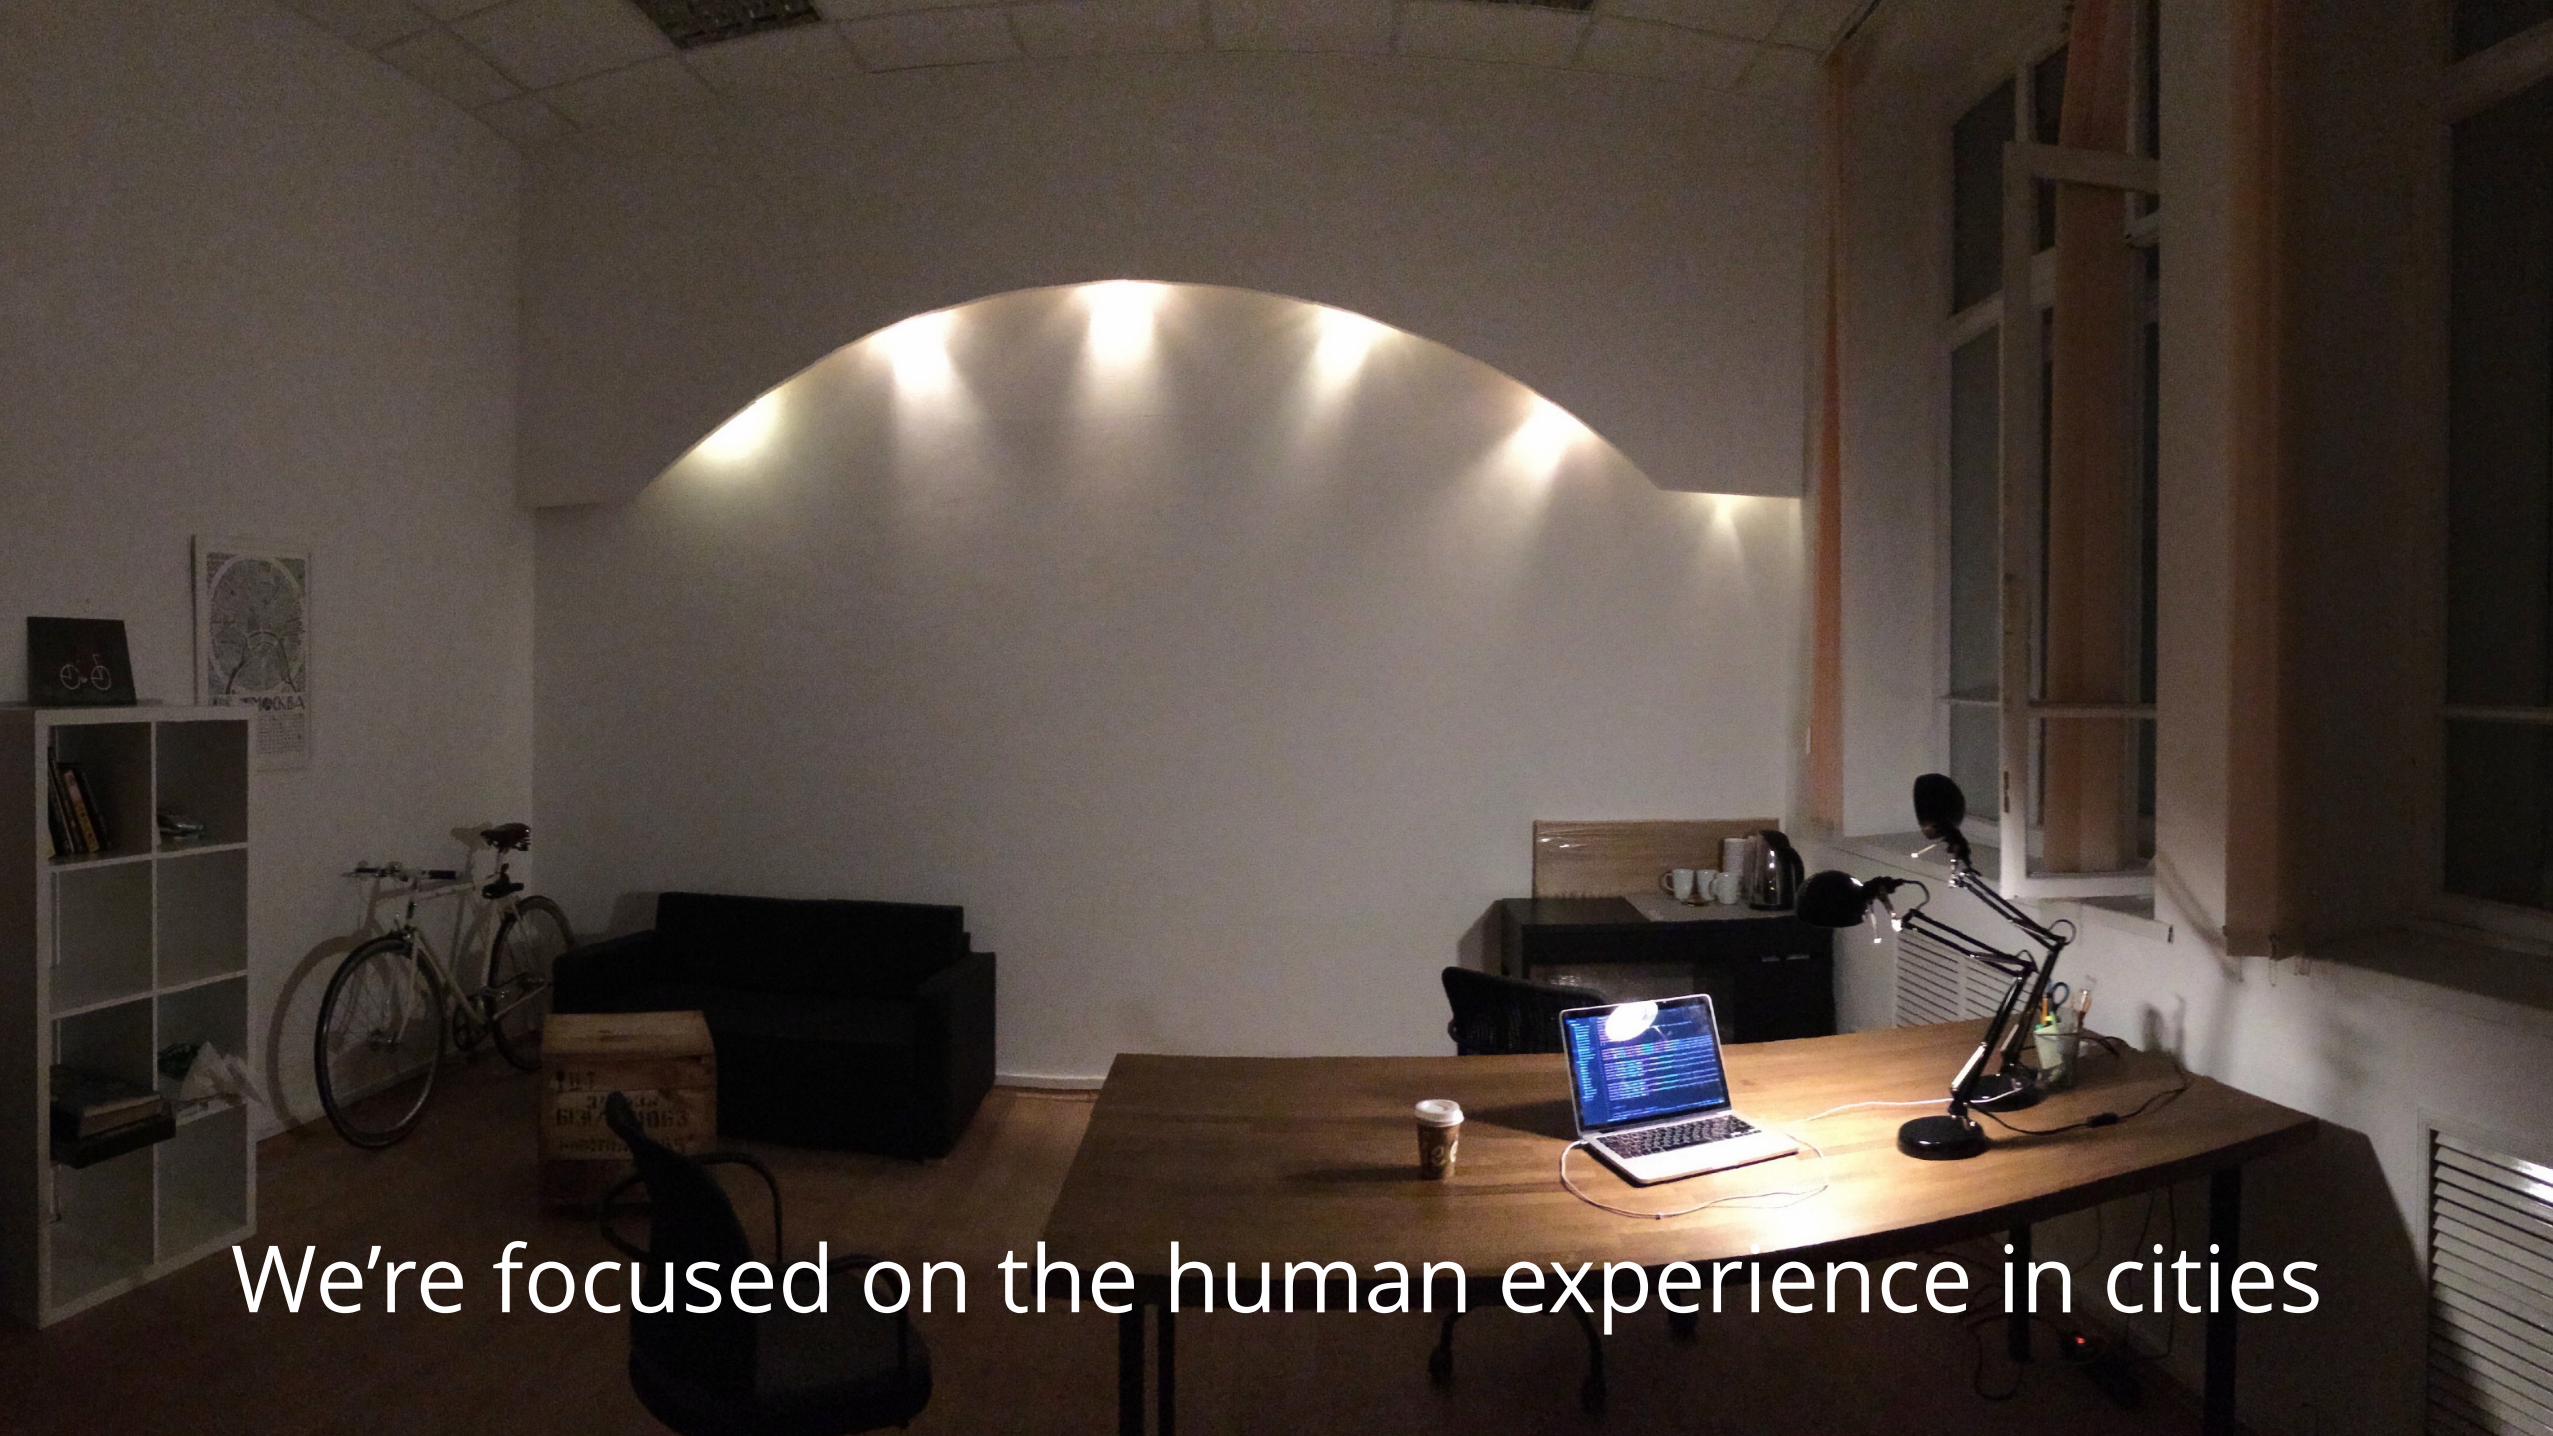
We’re focused on the human experience in cities

HillsHeights in Moscow

GгуыеЬ
SRTM3 data


< 0.50.5 – 3.0> 3.0calculating angles for roads

< 0.50.5 – 3.0> 3.0calculating angles for roads

elevations data visualisation

MAPS.MEWorld map design

comparison stage

Identifying a problem

Old style
Two-step map style implementation
Transitional style New style

Old style New style

Old style New style

Old style New style

Subway map icons uses their local insignia

BikesUrban data analysis for Department of Transport


playing with the data

docking stations density grid

Sudoku game

…

Hmm!!

Rent fares by days of week

There is no GPS-data, calculating paths by OSRM

We have analyzed the performance statistics of the city bicycle rental in 2015 for the Department of Transport of Moscow. Data on 812 000 rides at 300 rental stations were studied and analyzed taking into account each ride direction and thematic segments.

We identified of usage bicycles in various districts of the city, and analyze how a day of the week, time of the day and the weather conditions affect the rental for different categories of riders.

We developed interactive data exploration tool which makes huge amount of data clear and understandable for various kinds of users.

For example, this statistics shows the stations with an uneven ratio of arrivals/departures and will help to optimize the routes of vehicles relocation of bicycles.

Source data: github.com/urbica/velodata
Interactive data visualisation: urbica.co/bikes

Walking StreetsUrban environment research

Facebook friends survey: What makes street walkable?

First prototype with fake data

Walking Streets it is an independent research of pedestrian conditions in the center of Moscow. The width of sidewalks, accessibility to venues, underpasses, street noise pollution and interesting places have investigated.

Data collection. 93 km of sidewalks in the center of Moscow have measured.

Sidewalks map
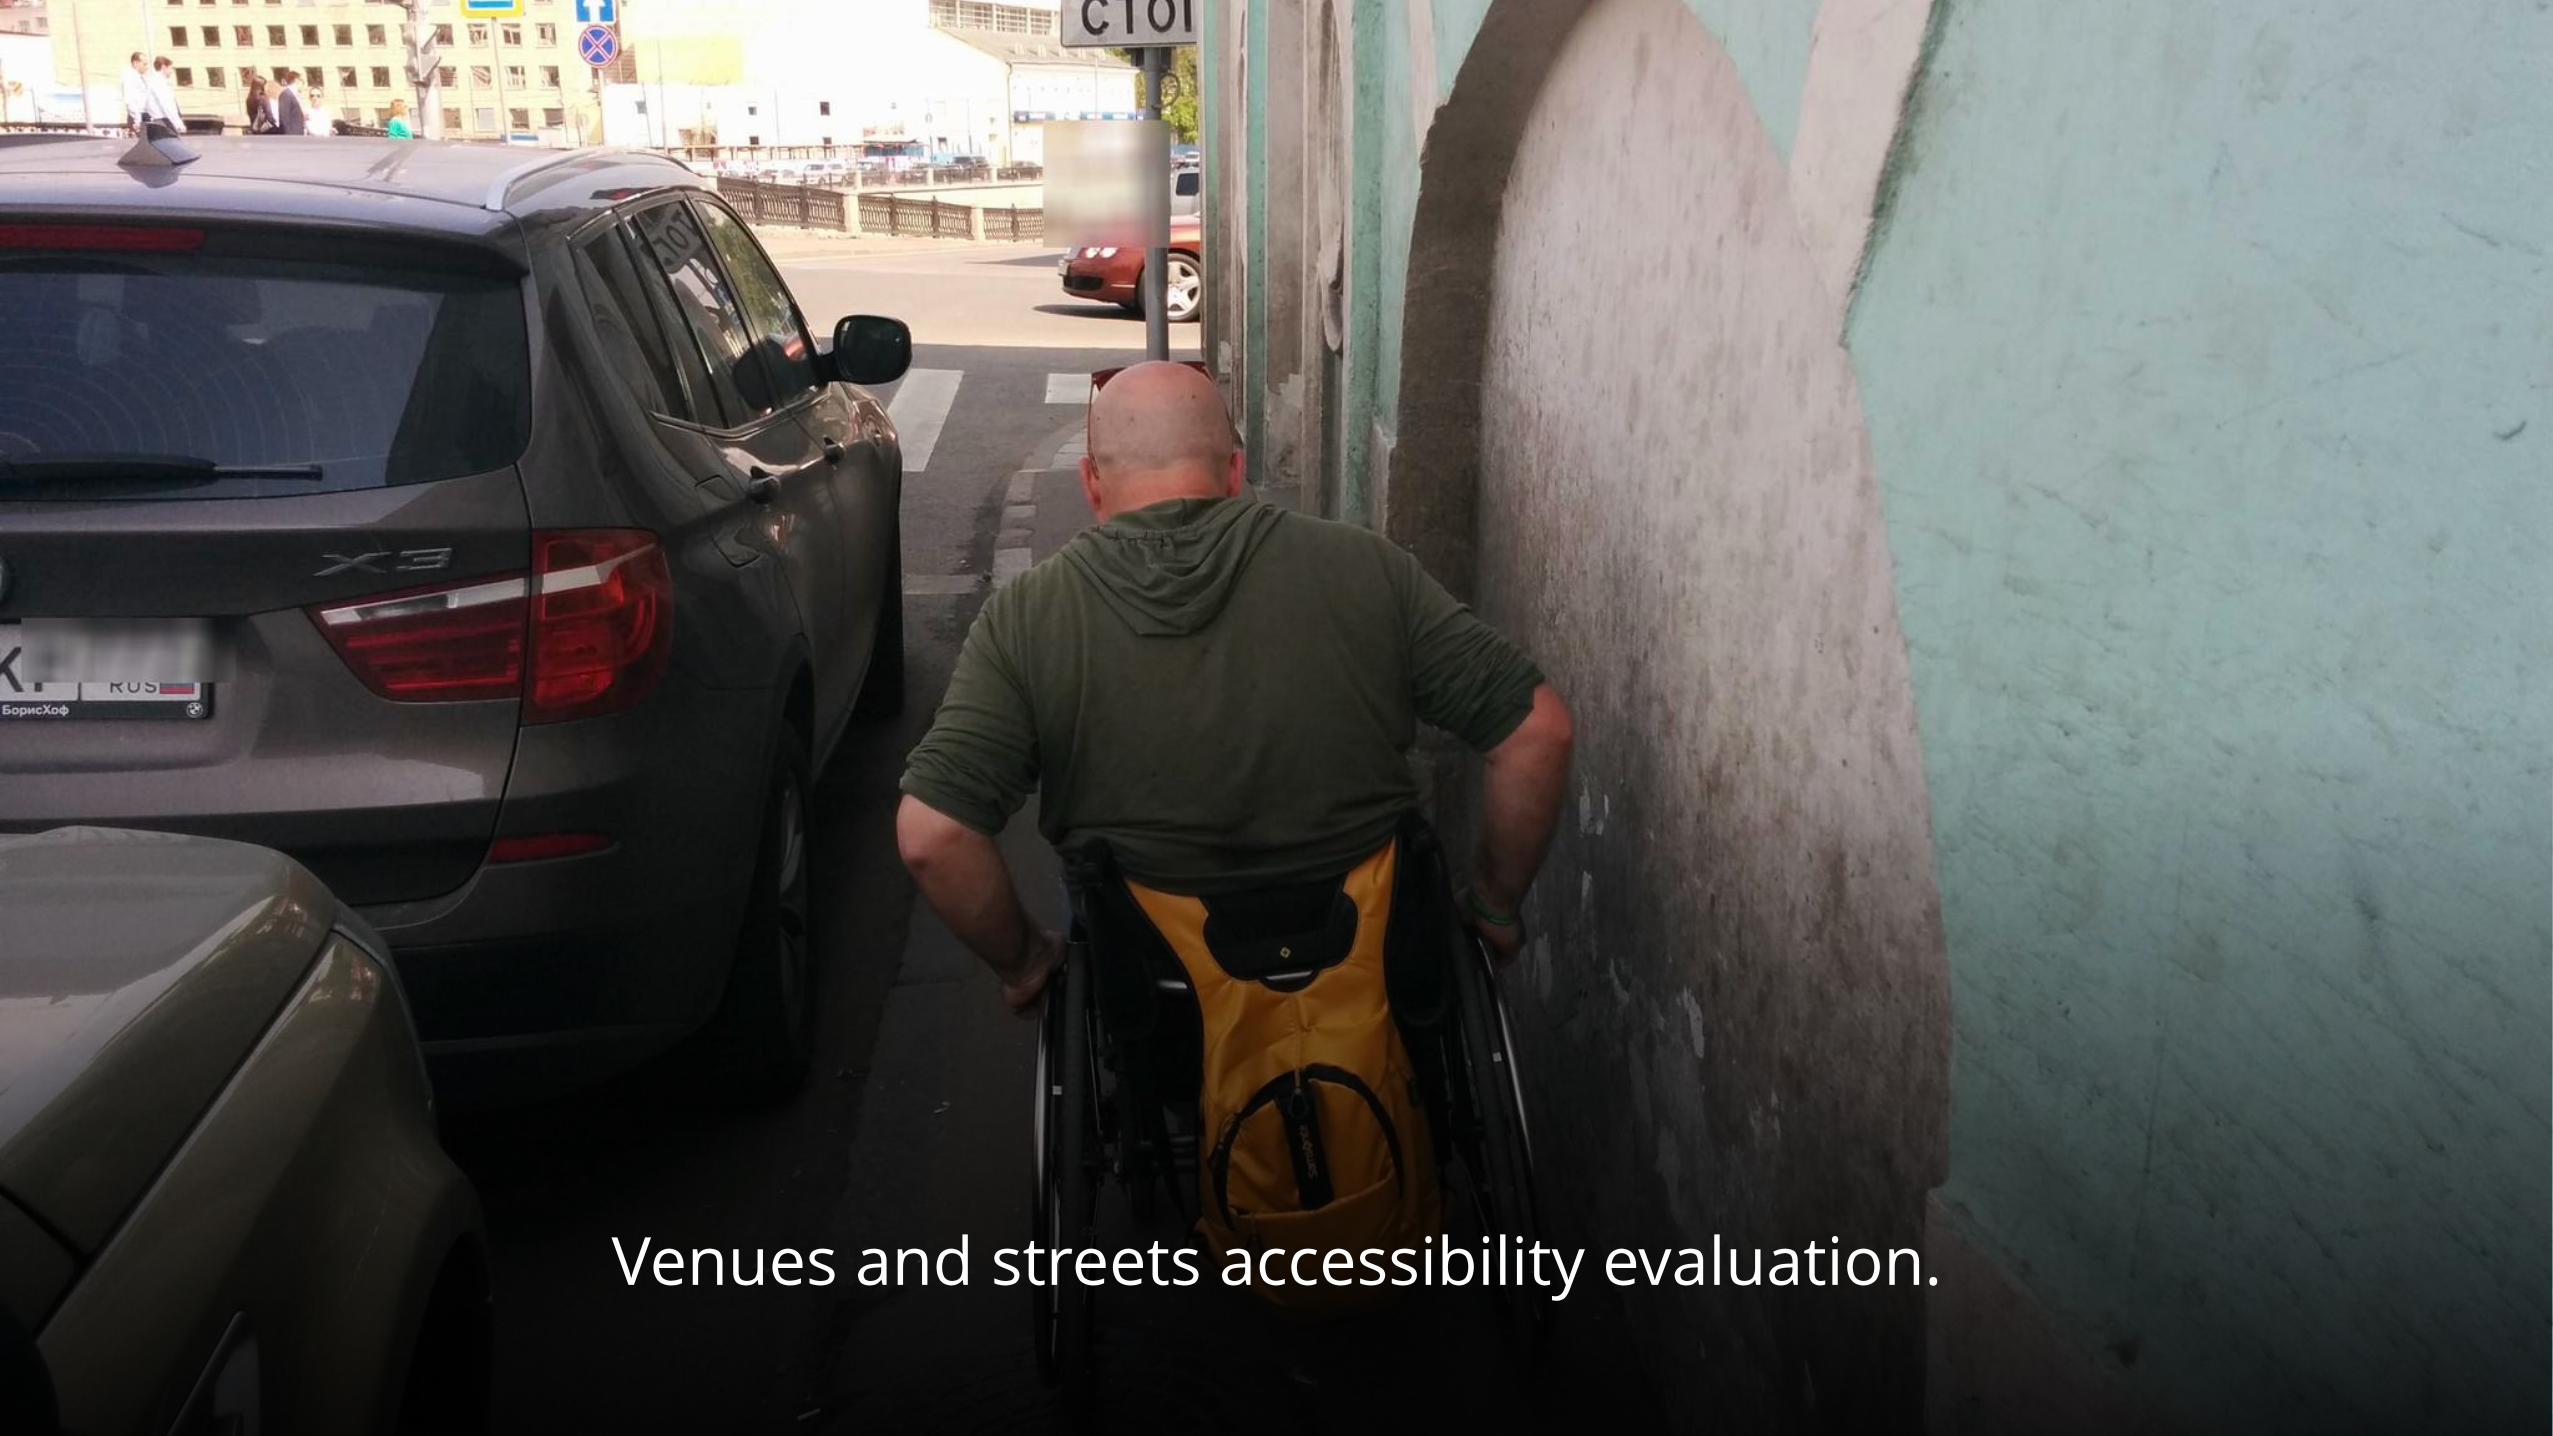
Venues and streets accessibility evaluation.

Accessibility map

During the research we collected a dataset of city noise levels in the special Instagram account (via InstaDecibel app).

Noise map of the center of Moscow


June 2015
State of data at the start

November 2015
Current state of the data

Meet Vika. She is a volunteer. Vika helped us to gather a lot of sidewalks data during her summer evening walks.

Further plans
• Parametric routing
• New data layers
• New cities

StudyLearn and map

In addition to projects we’re teaching how to visualize geodata. Cartography, data representation principles, tools and coding skills.

Student’s work (Vladimir Osokin)

Student’s work (Alexey Larchenkov)