Embed Size (px)
Citation preview
Nov
Oct
May OctJul Dec
Jan Feb
Apr NovJun Sep
MarAug
Jan Feb Mar Apr May Jun Jul Aug Sep Oct Nov Dec0%
140%
120%
100%
80%
60%
40%
20%
0
60
50
40
30
20
10
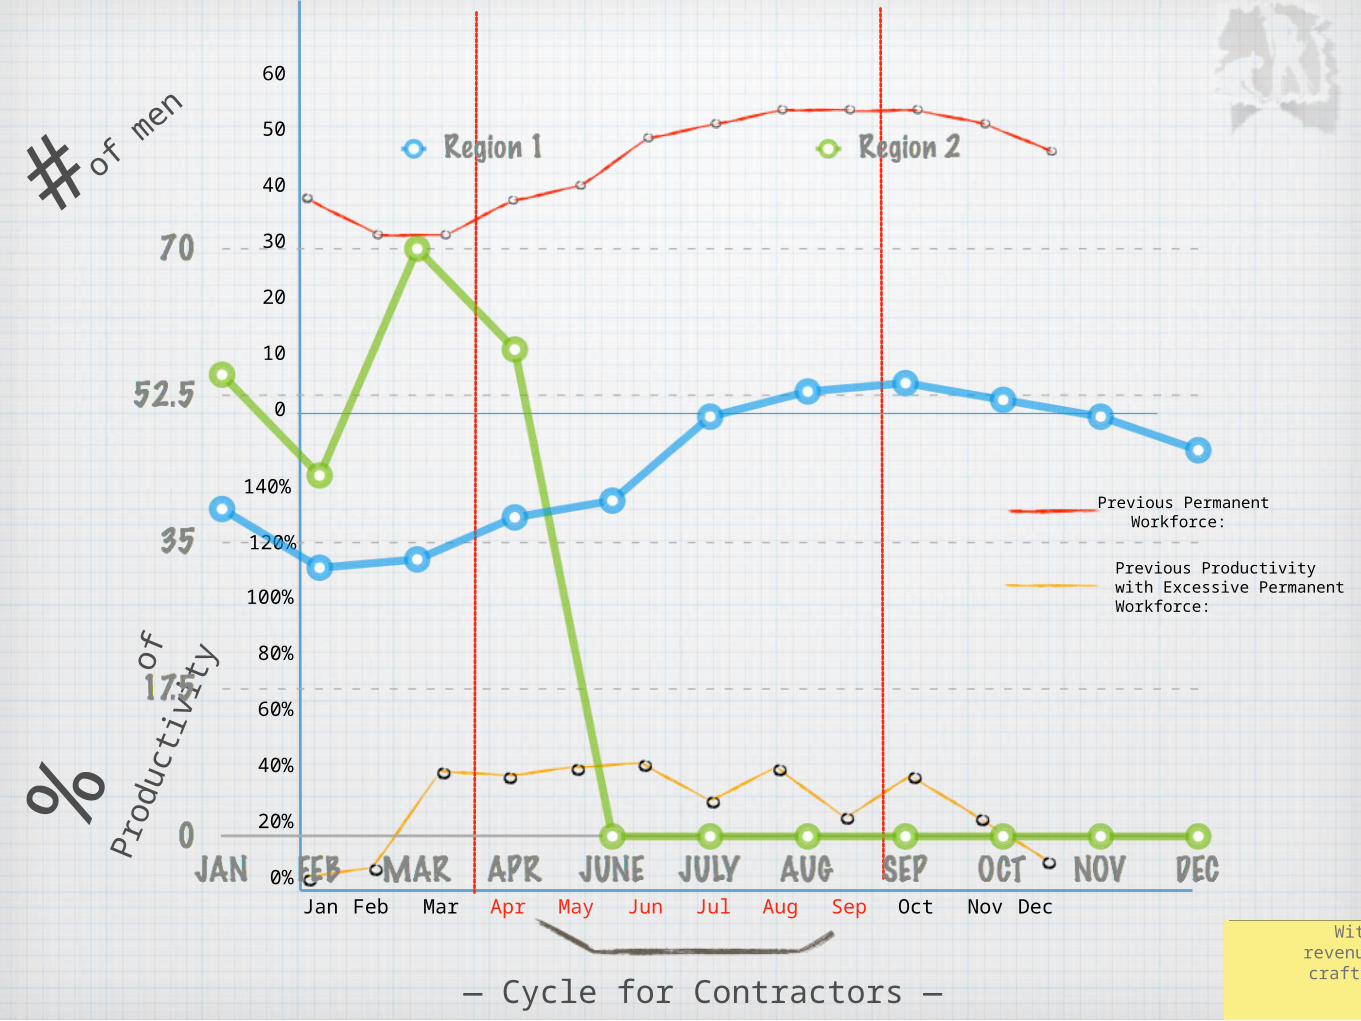
Previous Permanent Workforce:
Previous Productivity with Excessive Permanent Workforce:
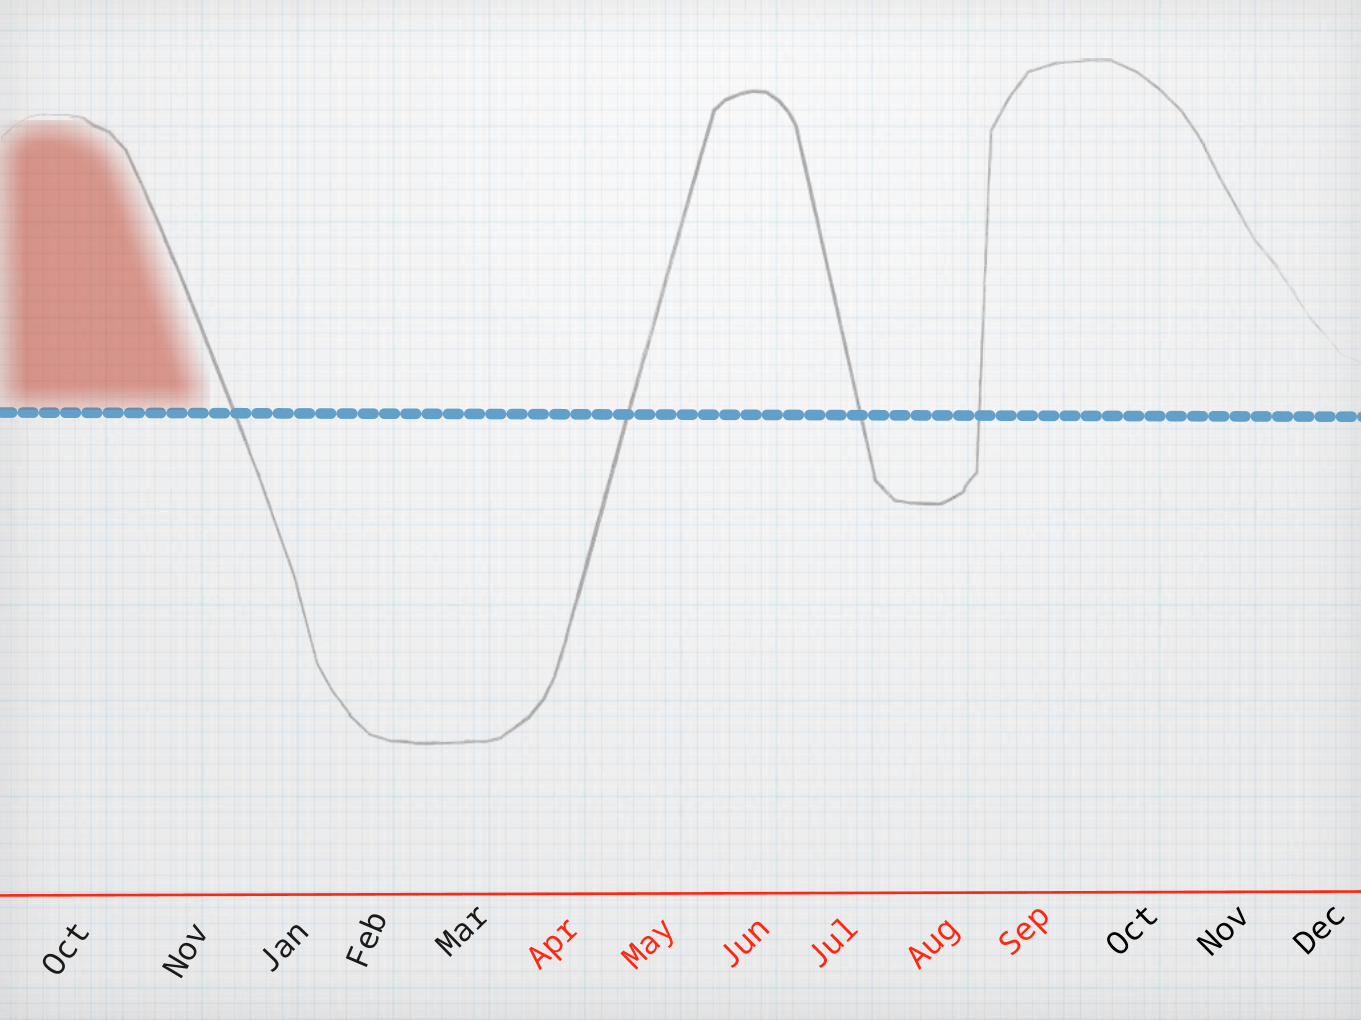
— Cycle for Contractors —
% of
Pro
duct
ivity
#of
men
With an Average of 44 workers per month @ an average revenue rate of $15,000 per worker, per month… and with 10 craftsmen working, he
needed to bill out $150,000. If he had 20 working, he needed $300,000 and so on.
If he was only able to bill out $75,000 for those 10 craftsmen a month, his workforce would be just 50% productive.
Taking his sales each month, divided by the number of craftsmen he had woking that month, gives us his sales per worker—if it was
$15,000 or greater, the workforce was 100% or more productive.
Example: If he had 10 workers and monthly sales were $160,000, his productivity would be 107%. If sales were $130,000 for the month, his
productivity would be 87%.Even as the workload fluctuates up & down, construction managers
must make forecasting decisions...often they may result in a contractor being overstaffed. This hold-over occurs as management believes, as
work picks up, quality craftworkers will simply not be available.
The effect is companies paying between 16% and 45% in unnecessary labor costs pulled directly out of profit. Even holding on to one
employee who can’t be kept productively working greatly impacts profit margins.
Construction managers in the “hire / de-hire” mode—staffing up full-time workers as work increases and laying off as it decreases—are driving up unemployment costs for several years out. Also, they’re amplifying their Workers’ Comp exposure and potential increase in
premiums based on the fact that claims of all levels typically inflate as the economy declines or struggles.
Previously, this contractor averaged $10,106 per month per worker. By taking our recommendation to reduce his core workforce to 22 from his annual average 44 — supplementing them with our variable craftsmen as sales required — his average monthly sales per worker went up to $13,474. Essentially, he experienced a 33% increase in revenues per worker per month, and an overall productivity increase of 23.96% by
resizing / restructuring his staffing plan


Jan Feb Mar Apr May Jun Jul Aug Sep Oct Nov Dec0%
140%
120%
100%
80%
60%
40%
20%
0
60
50
40
30
20
10
— Cycle for Contractors —
% of
Pro
duct
ivity
#of
menAverage
Fluctuating Workload
Over / Under staffing
Occurs
With an Average of 44 workers per month @ an average revenue rate of $15,000 per worker, per month… and with 10 craftsmen working, he
needed to bill out $150,000. If he had 20 working, he needed $300,000 and so on.
If he was only able to bill out $75,000 for those 10 craftsmen a month, his workforce would be just 50% productive.
Taking his sales each month, divided by the number of craftsmen he had woking that month, gives us his sales per worker—if it was
$15,000 or greater, the workforce was 100% or more productive.
Example: If he had 10 workers and monthly sales were $160,000, his productivity would be 107%. If sales were $130,000 for the month, his
productivity would be 87%.Even as the workload fluctuates up & down, construction managers
must make forecasting decisions...often they may result in a contractor being overstaffed. This hold-over occurs as management believes, as
work picks up, quality craftworkers will simply not be available.
The effect is companies paying between 16% and 45% in unnecessary labor costs pulled directly out of profit. Even holding on to one
employee who can’t be kept productively working greatly impacts profit margins.
Construction managers in the “hire / de-hire” mode—staffing up full-time workers as work increases and laying off as it decreases—are driving up unemployment costs for several years out. Also, they’re amplifying their Workers’ Comp exposure and potential increase in
premiums based on the fact that claims of all levels typically inflate as the economy declines or struggles.
Previously, this contractor averaged $10,106 per month per worker. By taking our recommendation to reduce his core workforce to 22 from his annual average 44 — supplementing them with our variable craftsmen as sales required — his average monthly sales per worker went up to $13,474. Essentially, he experienced a 33% increase in revenues per worker per month, and an overall productivity increase of 23.96% by
resizing / restructuring his staffing plan

Jan Feb Mar Apr May Jun Jul Aug Sep Oct Nov Dec0%
140%
120%
100%
80%
60%
40%
20%
0
60
50
40
30
20
10
— Cycle for Contractors —
% of
Pro
duct
ivity
#of
men
With an Average of 44 workers per month @ an average revenue rate of $15,000 per worker, per month… and with 10 craftsmen working, he
needed to bill out $150,000. If he had 20 working, he needed $300,000 and so on.
If he was only able to bill out $75,000 for those 10 craftsmen a month, his workforce would be just 50% productive.
Taking his sales each month, divided by the number of craftsmen he had woking that month, gives us his sales per worker—if it was
$15,000 or greater, the workforce was 100% or more productive.
Example: If he had 10 workers and monthly sales were $160,000, his productivity would be 107%. If sales were $130,000 for the month, his
productivity would be 87%.Even as the workload fluctuates up & down, construction managers
must make forecasting decisions...often they may result in a contractor being overstaffed. This hold-over occurs as management believes, as
work picks up, quality craftworkers will simply not be available.
The effect is companies paying between 16% and 45% in unnecessary labor costs pulled directly out of profit. Even holding on to one
employee who can’t be kept productively working greatly impacts profit margins.
Construction managers in the “hire / de-hire” mode—staffing up full-time workers as work increases and laying off as it decreases—are driving up unemployment costs for several years out. Also, they’re amplifying their Workers’ Comp exposure and potential increase in
premiums based on the fact that claims of all levels typically inflate as the economy declines or struggles.
Previously, this contractor averaged $10,106 per month per worker. By taking our recommendation to reduce his core workforce to 22 from his annual average 44 — supplementing them with our variable craftsmen as sales required — his average monthly sales per worker went up to $13,474. Essentially, he experienced a 33% increase in revenues per worker per month, and an overall productivity increase of 23.96% by
resizing / restructuring his staffing plan

Jan Feb Mar Apr May Jun Jul Aug Sep Oct Nov Dec0%
140%
120%
100%
80%
60%
40%
20%
0
60
50
40
30
20
10
— Cycle for Contractors —
Right-Sized Workforce
Productivity
Savings
Negative Impact
Negative Impact%
of P
rodu
ctivi
ty#of
men
With an Average of 44 workers per month @ an average revenue rate of $15,000 per worker, per month… and with 10 craftsmen working, he
needed to bill out $150,000. If he had 20 working, he needed $300,000 and so on.
If he was only able to bill out $75,000 for those 10 craftsmen a month, his workforce would be just 50% productive.
Taking his sales each month, divided by the number of craftsmen he had woking that month, gives us his sales per worker—if it was
$15,000 or greater, the workforce was 100% or more productive.
Example: If he had 10 workers and monthly sales were $160,000, his productivity would be 107%. If sales were $130,000 for the month, his
productivity would be 87%.Even as the workload fluctuates up & down, construction managers
must make forecasting decisions...often they may result in a contractor being overstaffed. This hold-over occurs as management believes, as
work picks up, quality craftworkers will simply not be available.
The effect is companies paying between 16% and 45% in unnecessary labor costs pulled directly out of profit. Even holding on to one
employee who can’t be kept productively working greatly impacts profit margins.
Construction managers in the “hire / de-hire” mode—staffing up full-time workers as work increases and laying off as it decreases—are driving up unemployment costs for several years out. Also, they’re amplifying their Workers’ Comp exposure and potential increase in
premiums based on the fact that claims of all levels typically inflate as the economy declines or struggles.
Previously, this contractor averaged $10,106 per month per worker. By taking our recommendation to reduce his core workforce to 22 from his annual average 44 — supplementing them with our variable craftsmen as sales required — his average monthly sales per worker went up to $13,474. Essentially, he experienced a 33% increase in revenues per worker per month, and an overall productivity increase of 23.96% by
resizing / restructuring his staffing plan

Jan Feb Mar Apr May Jun Jul Aug Sep Oct Nov Dec0%
140%
120%
100%
80%
60%
40%
20%
0
60
50
40
30
20
10
— Cycle for Contractors —
% of
Pro
duct
ivity
#of
men
With an Average of 44 workers per month @ an average revenue rate of $15,000 per worker, per month… and with 10 craftsmen working, he
needed to bill out $150,000. If he had 20 working, he needed $300,000 and so on.
If he was only able to bill out $75,000 for those 10 craftsmen a month, his workforce would be just 50% productive.
Taking his sales each month, divided by the number of craftsmen he had woking that month, gives us his sales per worker—if it was
$15,000 or greater, the workforce was 100% or more productive.
Example: If he had 10 workers and monthly sales were $160,000, his productivity would be 107%. If sales were $130,000 for the month, his
productivity would be 87%.Even as the workload fluctuates up & down, construction managers
must make forecasting decisions...often they may result in a contractor being overstaffed. This hold-over occurs as management believes, as
work picks up, quality craftworkers will simply not be available.
The effect is companies paying between 16% and 45% in unnecessary labor costs pulled directly out of profit. Even holding on to one
employee who can’t be kept productively working greatly impacts profit margins.
Construction managers in the “hire / de-hire” mode—staffing up full-time workers as work increases and laying off as it decreases—are driving up unemployment costs for several years out. Also, they’re amplifying their Workers’ Comp exposure and potential increase in
premiums based on the fact that claims of all levels typically inflate as the economy declines or struggles.
Previously, this contractor averaged $10,106 per month per worker. By taking our recommendation to reduce his core workforce to 22 from his annual average 44 — supplementing them with our variable craftsmen as sales required — his average monthly sales per worker went up to $13,474. Essentially, he experienced a 33% increase in revenues per worker per month, and an overall productivity increase of 23.96% by
resizing / restructuring his staffing plan

Jan Feb Mar Apr May Jun Jul Aug Sep Oct Nov Dec0%
140%
120%
100%
80%
60%
40%
20%
0
60
50
40
30
20
10
Previous Permanent Workforce:
Previous Productivity with Excessive Permanent Workforce:
— Cycle for Contractors —
Right-Sized Workforce
Reduced Permanent Workforce
Supplemental Workforce
Productivity
Savings
Negative Impact
Negative Impact%
of P
rodu
ctivi
ty#of
men
With an Average of 44 workers per month @ an average revenue rate of $15,000 per worker, per month… and with 10 craftsmen working, he
needed to bill out $150,000. If he had 20 working, he needed $300,000 and so on.
If he was only able to bill out $75,000 for those 10 craftsmen a month, his workforce would be just 50% productive.
Taking his sales each month, divided by the number of craftsmen he had woking that month, gives us his sales per worker—if it was
$15,000 or greater, the workforce was 100% or more productive.
Example: If he had 10 workers and monthly sales were $160,000, his productivity would be 107%. If sales were $130,000 for the month, his
productivity would be 87%.Even as the workload fluctuates up & down, construction managers
must make forecasting decisions...often they may result in a contractor being overstaffed. This hold-over occurs as management believes, as
work picks up, quality craftworkers will simply not be available.
The effect is companies paying between 16% and 45% in unnecessary labor costs pulled directly out of profit. Even holding on to one
employee who can’t be kept productively working greatly impacts profit margins.
Construction managers in the “hire / de-hire” mode—staffing up full-time workers as work increases and laying off as it decreases—are driving up unemployment costs for several years out. Also, they’re amplifying their Workers’ Comp exposure and potential increase in
premiums based on the fact that claims of all levels typically inflate as the economy declines or struggles.
Previously, this contractor averaged $10,106 per month per worker. By taking our recommendation to reduce his core workforce to 22 from his annual average 44 — supplementing them with our variable craftsmen as sales required — his average monthly sales per worker went up to $13,474. Essentially, he experienced a 33% increase in revenues per worker per month, and an overall productivity increase of 23.96% by
resizing / restructuring his staffing plan